autonomous vehicles to evolve to a new urban experience
TRANSCRIPT

D8.3 First Iteration Economic Impact
Unrestricted
Autonomous Vehicles to Evolve to a New Urban Experience
This project has received funding from the European Union’s Horizon 2020
research and innovation programme under grant agreement No 769033
DELIVERABLE
D8.3 First Iteration Economic impact
Ref. Ares(2020)2228205 - 24/04/2020

D8.3 First Iteration Economic Impact
Unrestricted
Disclaimer This document reflects only the author’s view and the European Commission is not responsible for any
use that may be made of the information it contains.
Document Information Grant Agreement Number 769033
Full Title Autonomous Vehicles to Evolve to a New Urban Experience
Acronym AVENUE
Deliverable D8.3 First Iteration Economic impact
Due Date 31.08.2019
Work Package WP8
Lead Partner HS PF
Authors Antonialli, Fabio ; Attias Danièle, Fournier, Guy; Mathé, Linda; Mira Bonnardel, Sylvie; Nemoto, Eliane; Thalhofer, Michael
Dissemination Level Public
Document History Version Date Author Description of change
V1.0 31.07.2019 Eliane Nemoto Outline report/Index
V1.1 31.07.2019 Michael Thalhofer Draft Version
V1.6 06.08.2019 Eliane Nemoto Corrections
V1.7 06.08.2019 Guy Fournier Chapter 2
V1.8 08.08.2019 Eliane Nemoto Partial draft version for revision
V1.9 26.08.2019 Fabio Antonialli Texts insertion on chapter 3
V1.10 26.08.2019 Sylvie Mira Bonnardel Revision chapter 3
V1.11 28.08.2019 Fabio Antonialli Revision chapter 3 and text insertion on conclusion
V.2 30.08.2019 Eliane Nemoto Avenue template adaptation
V2.1 10.10.2019 Sylvie Mira Bonnardel Review and text synthesis
V2.2 11.10.2019 Danielle Attias Review
V3.0 13.10.2019 Fabio Antonialli Final adjustments
V3.0 13.04.2020 European Commission Review
V3.1 21.04.2020 Fabio Antonialli Corrections
V3.2 22.04.2020 Michael Thalhofer Corrections
V3.3 22.04.2020 Eliane Nemoto Corrections
V3.4 23.04.2020 Guy Fournier Review

D8.3 First Iteration Economic Impact
3
Table of Content Disclaimer ...................................................................................................................................................... 2
Document Information ................................................................................................................................. 2
Document History ......................................................................................................................................... 2
List of Figures ................................................................................................................................................ 4
Acronyms ...................................................................................................................................................... 6
Executive Summary ....................................................................................................................................... 7
1. Introduction ........................................................................................................................................... 8
1.1 On-demand Mobility ........................................................................................................................... 8
1.2 Autonomous Vehicles .......................................................................................................................... 8
1.2.1 Autonomous vehicle operation overview .................................................................................................... 9
1.2.2 Autonomous vehicle capabilities in AVENUE ............................................................................................. 10
1.3 Preamble ........................................................................................................................................... 10
2 Analysis of macro trends .......................................................................................................................... 11
2.1 Methodology ..................................................................................................................................... 11
2.2 Main evolution factors for ASCT ....................................................................................................... 13
2.3 Vision Statements & Scenarios .......................................................................................................... 20
2.4 Passenger Use Cases ......................................................................................................................... 31
2.5 Hunting Fields .................................................................................................................................... 33
2.6 Business Opportunities ..................................................................................................................... 40
2.7 Business Use Cases ............................................................................................................................ 42
Obstacles & Risks ................................................................................................................................................ 45
Success Factors ................................................................................................................................................... 45
Stakeholder Analysis ........................................................................................................................................... 46
Business Use Case Canvas & Business Planning Outlook.................................................................................... 47
3 TCO Calculator .......................................................................................................................................... 49
3.1 Macro-data calculator ....................................................................................................................... 49
3.1.1 Methodology ............................................................................................................................................. 49
3.1.2 The calculator ............................................................................................................................................ 50
3.2 Micro-data calculator ........................................................................................................................ 51
3.2.1 Methodology ............................................................................................................................................. 52
3.2.2 CAPEX and OPEX calculation tool .............................................................................................................. 53
4 Conclusion and Research agenda ............................................................................................................. 56
References................................................................................................................................................... 57
APPENDIX .................................................................................................................................................... 59
D8.3 First Iteration Economic Impact
4
List of Figures Figure 1: Gartner Hype Cycle for Connected Vehicles ................................................................... 12
Figure 2: ‘Future of AVENUE 2030’ – Future Mobility Trend Cluster ............................................ 12
Figure 3: Future Mobility Trend Cluster for ASCTs ........................................................................ 13
Figure 4: ‘Future of AVENUE 2030’ – zoom on People Mass Transportation ............................... 13
Figure 5: Future Mobility Trend Cluster for ASCTs trend radar ..................................................... 14
Figure 6: General Characterization of Trend Radar Segments ...................................................... 14
Figure 7: The ASCTs Trend Radar ................................................................................................... 15
Figure 8: The ASCTs Trend Radar ................................................................................................... 16
Figure 9: Clustering of most relevant mobility trends for ASCTs .................................................. 17
Figure 10: Mobility trend radar for ASCTs ..................................................................................... 17
Figure 11: Mobility Trend Matrix for ASCTs .................................................................................. 18
Figure 12: Mobility Trend Matrix for ASCTs .................................................................................. 19
Figure 13 - Derivation of Vision Statements for AVENUE 2030 ..................................................... 20
Figure 14: General Scenario Design Systematics ........................................................................... 21
Figure 15: From Future Trend Radar to Future Scenarios ............................................................. 22
Figure 16: Alternative generic Methods for Scenario Definition .................................................. 22
Figure 17: Identification of possible bi- or multipolar (contradictory) .......................................... 23
Figure 18: Prioritization and Selection of contradictory Dimensions for Scenario Definition ...... 24
Figure 19: Relevant contradictory dimensions for scenario definition ......................................... 25
Figure 20: Selected Scenario Model for defining 4 Future Scenarios ........................................... 25
Figure 21: Characterization of selected Future Scenarios ............................................................. 26
Figure 22: Characterization of Scenario S1: AVENUE Country-Callbus ......................................... 27
Figure 23: Characterization of Scenario S2: AVENUE City-Callbus ................................................ 28
Figure 24: Characterization of Scenario S3: AVENUE Country-Line .............................................. 29
Figure 25: Characterization of Scenario S4: AVENUE City-Line ..................................................... 30
Figure 26: Examples for Passenger Personas from Keolis ............................................................. 31
Figure 27: Classification of passenger groups ............................................................................... 32
Figure 28: Characterization table of passenger groups ................................................................. 33
Figure 29: Inspiration Source for Business Opportunities - the AVENUE overall architecture ..... 34
D8.3 First Iteration Economic Impact
5
Figure 30: Identification of Business Opportunities & Clustering of Hunting Fields ..................... 35
Figure 31: Structured Representation of Business Opportunities & Hunting Fields (1/2) ............ 36
Figure 32: Structured Representation of Business Opportunities & Hunting Fields (2/2) ............ 36
Figure 33: Assignment of Hunting Fields to Scenario Use Cases – Identification of most attractive
Business Opportunity Clusters across Scenario Use Cases............................................................ 37
Figure 34: Description of Hunting Field – Passenger Services ....................................................... 38
Figure 35: Description of Hunting Field – Infrastructure Management ........................................ 38
Figure 36: Description of Hunting Field – System Operations ...................................................... 39
Figure 37: Description of Hunting Field – ASCTs ........................................................................... 39
Figure 38: Description of Hunting Field – Municipalities & Commercial Bus Operators .............. 40
Figure 39: Assignment of Hunting Fields to Scenario Use Cases – Identification of most attractive
Business Opportunity Clusters across Scenario Use Cases............................................................ 40
Figure 40: Description of Business Opportunity Cluster – City Line for tourists / Passenger
Services .......................................................................................................................................... 41
Figure 41: Description of Business Opportunity Cluster – Leisure / system operations ............... 41
Figure 42: AVENUE Conceptional Architecture (from H2020 Proposal) as inspiration for Business
Ecosystem ...................................................................................................................................... 42
Figure 43: AVENUE System Partners within AVENUE Business Ecosystem ................................... 43
Figure 44: Two stages of AVENUE Business Focuses ..................................................................... 44
Figure 45: General AVENUE Business Actors & Offerings ............................................................. 44
Figure 46: The AVENUE Business type options .............................................................................. 45
Figure 47: General AVENUE Obstacles & Risks as basis for deriving business strategies ............. 45
Figure 48: General AVENUE Success Factors as basis for deriving business strategies ................ 46
Figure 49: Analysis of Business relevant Stakeholders .................................................................. 47
Figure 50: Business use case canvas .............................................................................................. 48
Figure 51: Outlook on further research activities (next deliverable) ............................................ 48
Figure 52: ICC calculator spreadsheets .......................................................................................... 53
Figure 53: Hypotheses and calculation data spreadsheet ............................................................. 54
Figure 54: Example of the spreadsheet for costs and gains for the transport operator (still under
development) ................................................................................................................................. 55
Figure 55: Micro costs calculator final balance of costs and gains ............................................... 56

D8.3 First Iteration Economic Impact
6
Acronyms ADS Automated Driving Systems
AI Artificial Intelligence
API Application Protocol Interface
ASCT Autonomous Shuttle for Collective Transport
AV Autonomous Vehicle
BMM Business Modelling Manager
CAV Connected and Autonomous Vehicles
CB Consortium Body
CERN European Organization for Nuclear Research
D7.1 Deliverable 7.1
DC Demonstration Coordinator
DI The department of infrastructure
DMP Data Management Plan
DSES Department of Security and Economy Traffic Police
DTU test track
Technical University of Denmark test track
EAB External Advisory Board
EC European Commission
EC European Commission
ECSEL Electronic Components and Systems for European Leadership
EM Exploitation Manager
EU European Union
EUCAD European Conference on Connected and Automated Driving
F2F Face to face meeting
FEDRO Federal Roads Office
FEDRO (Swiss) Federal Roads Office
FOT (Swiss) Federal Office of Transport
GDPR General Data Protection Regulation
GIMS Geneva International Motor Show GNSS Global Navigation Satellite System
HARA Hazard Analysis and Risk Assessment
IPR Intellectual Property Rights
IT Information Technology
ITU International Telecommunications Union
LA Leading Author
MEM Monitoring and Evaluation Manager
OCT General Transport Directorate of the Canton of Geneva
ODD Operational Domain Design
OEDR Object And Event Detection And Response
OFCOM Federal Office of Communications
PC Project Coordinator
PEB Project Executive Board
PGA Project General Assembly
PRM Persons with Reduced Mobility
PSA Group PSA (PSA Peugeot Citroën)
PTO Public Transportation Operator
PTO Public Transport Operator
PTS Public Transportation Services
QRM Quality and Risk Manager
QRMB Quality and Risk Management Board
RN Risk Number
SA Scientific Advisor
SAE Level Society of Automotive Engineers Level (Vehicle Autonomy Level)
SAN Cantonal Vehicle Service
SDK Software Development Kit
SMB Site Management Board
SoA State of the Art
SOTIF Safety Of The Intended Functionality
SWOT Strengths, Weaknesses, Opportunities, and Threats.
TCO Total-Cost-of-Ownership
TM Technical Manager
UITP Union Internationale des Transports Publics
WP Work Package
WPL
Work Package Leader

D8.3 First Iteration Economic Impact
Unrestricted
Executive Summary The AVENUE project aims to design and carry out full scale demonstrations of urban transport automation by deploying fleets of autonomous mini-buses in European cities. Within the project, the Work Package 8 (WP8) aims to evaluate the environmental, economic and social implications of implemented urban and suburban autonomous full-scale demonstrators. Subsequently, the sustainability of urban road transport automation can be assessed.
This deliverable 8.3 Economic impact evaluation, describes the overall economic studies and analysis targeting a successful implementation of businesses for autonomous vehicles for collective urban transport, as well as, it sheds light on the potential economic benefits and impacts of the urban automated vehicle fleets in cities.
We first provide the theoretical a conceptual basis for the Economic Impact Evalation, and then we present the methodology upon which the Total-Cost-of-Ownership (TCO) calculator is defined. For the TCO calculations we take into account both macro and micro economic data. For the macro economic data we consider the general benefits for the society, while for the micro et take into account the operational costs that will be used for the operator business plans.

D8.3 First Iteration Economic Impact
8
1. Introduction AVENUE aims to design and carry out full-scale demonstrations of urban transport automation by
deploying, for the first time worldwide, fleets of autonomous minibuses in low to medium demand areas
of 4 European demonstrator cities (Geneva, Lyon, Copenhagen and Luxembourg) and 2 to 3 replicator
cities. The AVENUE vision for future public transport in urban and suburban areas, is that autonomous
vehicles will ensure safe, rapid, economic, sustainable and personalised transport of passengers.
AVENUE introduces disruptive public transportation paradigms on the basis of on-demand, door-to-door
services, aiming to set up a new model of public transportation, by revisiting the offered public
transportation services, and aiming to suppress prescheduled fixed bus itineraries.
Vehicle services that substantially enhance the passenger experience as well as the overall quality and
value of the service will be introduced, also targeting elderly people, people with disabilities and
vulnerable users. Road behaviour, security of the autonomous vehicles and passengers’ safety are
central points of the AVENUE project.
At the end of the AVENUE project four year period the mission is to have demonstrated that
autonomous vehicles will become the future solution for public transport. The AVENUE project will
demonstrate the economic, environmental and social potential of autonomous vehicles for both
companies and public commuters while assessing the vehicle road behaviour safety.
1.1 On-demand Mobility Public transportation is a key element of a region's economic development and the quality of life of its
citizens.
Governments around the world are defining strategies for the development of efficient public transport
based on different criteria of importance to their regions, such as topography, citizens' needs, social and
economic barriers, environmental concerns and historical development. However, new technologies,
modes of transport and services are appearing, which seem very promising to the support of regional
strategies for the development of public transport.
On-demand transport is a public transport service that only works when a reservation has been
recorded and will be a relevant solution where the demand for transport is diffuse and regular transport
is inefficient.
On-demand transport differs from other public transport services in that vehicles do not follow a fixed
route and do not use a predefined timetable. Unlike taxis, on-demand public transport is usually also not
individual. An operator or an automated system takes care of the booking, planning and organization.
It is recognized that the use and integration of on-demand autonomous vehicles has the potential to
significantly improve services and provide solutions to many of the problems encountered today in the
development of sustainable and efficient public transport.
1.2 Autonomous Vehicles A self-driving car, referred in the AVENUE project as an Autonomous Vehicle (AV) is a vehicle that is
capable of sensing its environment and moving safely with no human input. The choice of Autonomous
vs Automated was made in AVENUE since, in the current literature, most of the vehicle concepts have a
person in the driver's seat, utilize a communication connection to the Cloud or other vehicles, and do

D8.3 First Iteration Economic Impact
9
not independently select either destinations or routes for reaching them, thus being “automated”. The
automated vehicles are considered to provide assistance (at various levels) to the driver. In AVENUE
there will be no driver (so no assistance will be needed), while the route and destinations will be defined
autonomously (by the fleet management system). The target is to reach a system comprising of vehicles
and services that independently select and optimize their destination and routes, based on the
passenger demands.
In relation to the SAE levels, the AVENUE project will operate SAE Level 4 vehicles.
©2020 SAE International
1.2.1 Autonomous vehicle operation overview We distinguish in AVENUE two levels of control of the AV: micro-navigation and macro-navigation. Micro
navigation is fully integrated in the vehicle and implements the road behaviour of the vehicle, while
macro-navigation is controlled by the operator running the vehicle and defines the destination and path
of the vehicle, as defined the higher view of the overall fleet management.
For micro-navigation Autonomous Vehicles combine a variety of sensors to perceive their surroundings,
such as 3D video, LIDAR, sonar, GNSS, odometry and other types sensors. Control software and systems,
integrated in the vehicle, fusion and interpret the sensor information to identify the current position of
the vehicle, detecting obstacles in the surround environment, and choosing the most appropriate
reaction of the vehicle, ranging from stopping to bypassing the obstacle, reducing its speed, making a
turn etc.

D8.3 First Iteration Economic Impact
10
For the Macro-navigation, that is the destination to reach, the Autonomous Vehicle receives the
information from either the in-vehicle operator (in the current configuration with a fixed path route), or
from the remote control service via a dedicated 4/5G communication channel, for a fleet-managed
operation. The fleet management system takes into account all available vehicles in the services area,
the passenger request, the operator policies, the street conditions (closed streets) and send route and
stop information to the vehicle (route to follow and destination to reach).
1.2.2 Autonomous vehicle capabilities in AVENUE The autonomous vehicles employed in AVENUE fully and autonomously manage the above defined,
micro-navigation and road behaviour, in an open street environment. The vehicles are autonomously
capable to recognise obstacles (and identify some of them), identify moving and stationary objects, and
autonomously decide to bypass them or wait behind them, based on the defined policies. For example
with small changes in its route the AVENUE shuttle is able to bypass a parked car, while it will slow down
and follow behind a slowly moving car. The AVENUE vehicles are able to handle different complex road
situations, like entering and exiting round-about in the presence of other fast running cars, stop in zebra
crossings, communicate with infrastructure via V2X interfaces (ex. red light control).
The shuttles used in the AVENUE project technically can achieve speeds of more than 60Km/h. However
this speed cannot be used in the project demonstrators for several reasons, ranging from regulatory to
safety. Under current regulations the maximum authorised speed is 25 or 30 Km/h (depending on the
site). In the current demonstrators the speed does not exceed 23 Km/h, with an operational speed of 14
to 18 Km/h. Another, more important reason for limiting the vehicle speed is safety for passengers and
pedestrians. Due to the fact that the current LIDAR has a range of 100m and the obstacle identification is
done for objects no further than 40 meters, and considering that the vehicle must safely stop in case of
an obstacle on the road (which will be “seen” at less than 40 meters distance) we cannot guarantee a
safe braking if the speed is more than 25 Km/h. Note that technically the vehicle can make harsh break
and stop with 40 meters in high speeds (40 -50 Km/h) but then the break would too harsh putting in risk
the vehicle passengers. The project is working in finding an optimal point between passenger and
pedestrian safety.
1.3 Preamble
Regarding the definition and successful implementation of businesses with autonomous electric
vehicles, it is necessary to conduct the analysis & planning of essential modules of a business design
concept. Therefore, detailed status quo and prospective analysis will help to propose future scenarios as
well as business model innovation by M48.
The economic analysis of the used autonomous electric vehicles will thus focus first on business viability.
Therefore, a comparison of the demonstrators will be conducted via a Total-Cost-of-Ownership (TCO)
calculation taking into account internal cost of autonomous programs (CaPex and OpEx for transport
operator, municipality and users) as well as externalities (cost of pollution, noise, time, …). On the other
side, savings through mobility on demand - this means when citizens use the shuttle only when they
need it - will be estimated.
The task 8.3 aims at identifying direct and indirect costs and savings as well as cost drivers and hidden
costs (e.g. cleaning costs or vandalism in vehicles without drivers) can be clearly identified and evaluated

D8.3 First Iteration Economic Impact
11
as a basis for the development of a business plan to evaluate the economic viability of autonomous
vehicles as a part of an integrated public transport system.
The economic benefits of the urban automated vehicle fleets for users and potential users will be
evaluated. The possible improvements of journey time and the possible substitution of traditional
individual transport modes like cars will be analysed.
The economic effects on cities will be assessed and compared with other cities in Europe and the rest of
the world (e.g. C40 cities): possible adaptation and investments in infrastructure like charging stations,
software and other costs; free up of parking space through substitution of private cars; possible need of
special lines; extension of transport services to narrow roads or urban areas with week infrastructure,
possible growing attractiveness of suburban areas; possible job effects through evaluation of job cuts
(e.g. drivers) and job creation (e.g. operator) etc.
The evaluation of economic impact is supported with four parallel tasks which are presented in the
following 3 sections of the document:
1. Analysis of macro trends that may impact the deployment of autonomous vehicle for collective
transport in order to identify business opportunities.
2. Design of a macro-data calculator in order to investigate and simulate the potential effects and
external costs reduction by deploying autonomous vehicle fleets in cities. The methodology will
be described more in detail in chapter 3.
3. Based on the Total Cost of Ownership methodology (TCO), a dimensioning tool will also be
proposed in order to help decision makers to calculate the ideal fleet size for the deployments as
well as to the CAPEX and OPEX of the operations as well as the local externalities, integrating all
these results and providing answers and future scenarios for transport operators, users as well
as the collectivity. The methodology will be described more in detail in chapter 3.
2 Analysis of macro trends
2.1 Methodology
Future trends can be defined by various attributes of knowledge as well as change. Hereby it is
important to remark that trends (in the narrow sense) are defined as an extrapolation from the present
to the future. Other future elements are constants/paradigms (unchanged facts), news (speculations),
contradictions (sound opinions or suppositions of alternatives), uncertainties (supposition of unfocused
changes), and chaos/wildcards (creative, unconventional speculations). In the following the term ‘trends’
will be used in the wider sense comprising all types of future elements in accordance with the colloquial
usage (e.g. trend radar).
Regarding the future of ASCTs there is a Gartner hype cycle representation (see figure 1) showing the
recent/current positions of technologies for autonomous driving as well as electric vehicles and
infrastructure, autonomous driving, connected vehicles and charging infrastructure and other relevant
modules for an ASCT-system. This shows that most of the modules for connected vehicles are still in the
phase of disillusionment and only slowly ramping up the slope of enlightenment.

D8.3 First Iteration Economic Impact
12
Figure 1: Gartner Hype Cycle for Connected Vehicles1
Four main source categories for future trends are identified (see figure 2):
1. People mass transportation
2. Urban & suburban/ rural transportation areas
3. Autonomous electrical transport
4. General relevant future developments
Figure 2: ‘Future of AVENUE 2030’ – Future Mobility Trend Cluster
1 Ramsey, Mike. (2018-08-14). Retrieved 2019-08-02, from
https://www.forbes.com/sites/enroute/2018/08/14/autonomous-vehicles-fall-into-the-trough-of-
disillusionment-but-thats-good/#2d6c7bb27b5a
D8.3 First Iteration Economic Impact
13
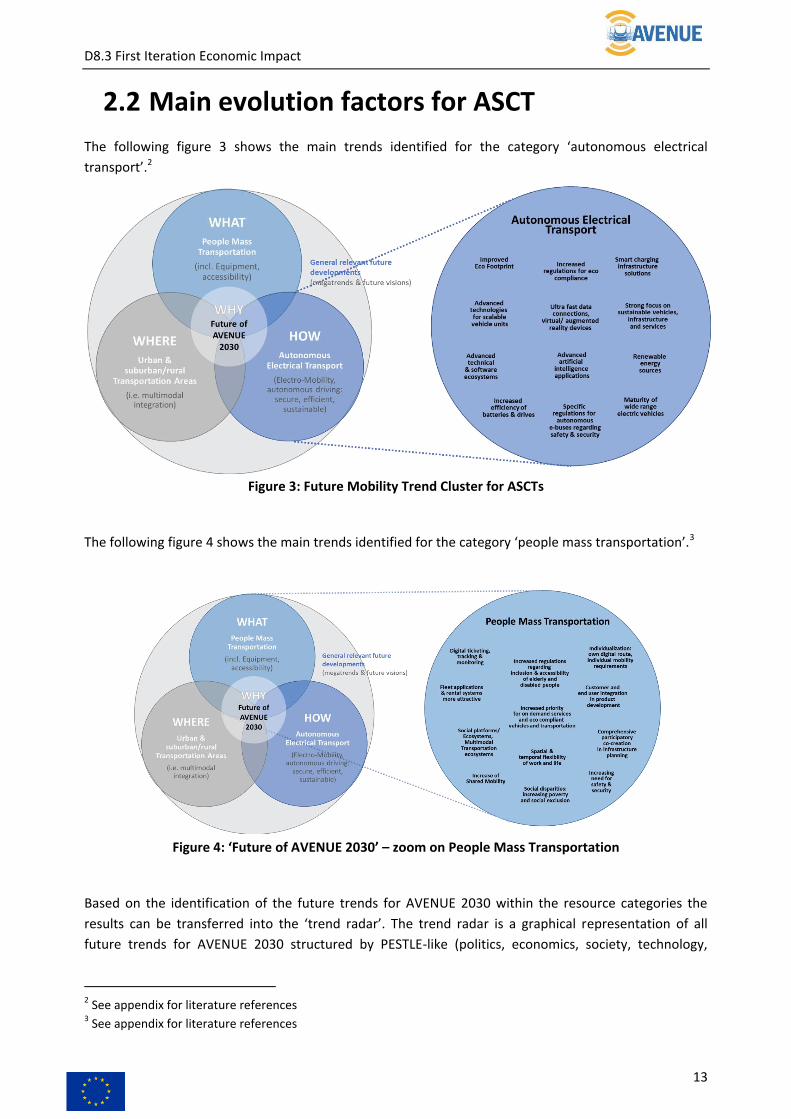
2.2 Main evolution factors for ASCT
The following figure 3 shows the main trends identified for the category ‘autonomous electrical
transport’.2
Figure 3: Future Mobility Trend Cluster for ASCTs
The following figure 4 shows the main trends identified for the category ‘people mass transportation’.3
Figure 4: ‘Future of AVENUE 2030’ – zoom on People Mass Transportation
Based on the identification of the future trends for AVENUE 2030 within the resource categories the
results can be transferred into the ‘trend radar’. The trend radar is a graphical representation of all
future trends for AVENUE 2030 structured by PESTLE-like (politics, economics, society, technology,
2 See appendix for literature references 3 See appendix for literature references

D8.3 First Iteration Economic Impact
14
legislation, ecology/environment) segments on the one hand and concentric circles (high, medium, low)
representing the impact/ relevance on the future of AVENUE 2030. (see figure 5)
Figure 5: Future Mobility Trend Cluster for ASCTs trend radar
The characterization of the trend radar segments are displayed in figure 6 below.
Figure 6: General Characterization of Trend Radar Segments
This methodology and characterizations allow the transfer of identified trends from the source
categories into a trend radar representation as shown in figure 7 and 8.

D8.3 First Iteration Economic Impact
15
Figure 7: The ASCTs Trend Radar4
4 See appendix for literature references

D8.3 First Iteration Economic Impact
16
Figure 8: The ASCTs Trend Radar5
The trends of each trend radar segment and across have been condensed/ clustered into higher level
macro-trends as basis for subsequent derivation of a future vision for AVENUE 2030. (see figure 9)
5 See appendix for literature references

D8.3 First Iteration Economic Impact
17
Figure 9: Clustering of most relevant mobility trends for ASCTs
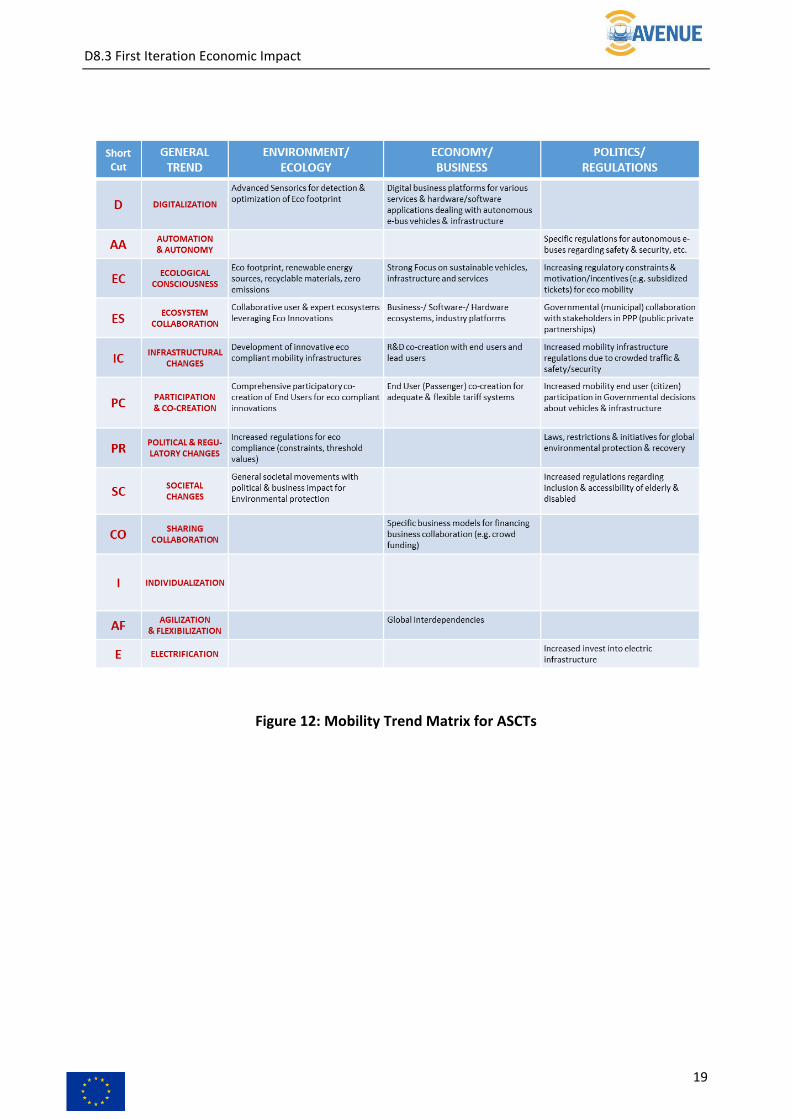
The radar cab be developed in the following matrix representing an overview of all trends from the
trend radar segments which are clustered into the respective macro-trend – vice versa it can be
identified which macro-trend has an impact on the respective trend radar segment as shown in figures
10 and 11.
Figure 10: Mobility trend radar for ASCTs

D8.3 First Iteration Economic Impact
18
Figure 11: Mobility Trend Matrix for ASCTs
D8.3 First Iteration Economic Impact
19
Figure 12: Mobility Trend Matrix for ASCTs

D8.3 First Iteration Economic Impact
20
2.3 Vision Statements & Scenarios
The main goal of the trend radar analysis is the identification of vision for ASCTs. Therefore, it is
necessary to identify motivating vision statements, which are not too far in the future to be
demotivation for realisation and at the same time not too close to the present to be achieved easily. In
this sense the vision and its statements should create a creative tension for motivation. (see figure 13)
D … provides digital twins / platforms / applications / services & businesses
AA … provides autonomous vehicles and automated infrastructures (e.g. charging)
EC … strictly emphasizes on renewable energies and construction materials as well as zero
emission technologies
ES … is an integral & profitable module of suburban/ rural and urban multimodal mobility
networks supporting technical, social and business ecosystems
CO … provides solutions for ‘blurring‘ urban & suburban/ rural transportation infrastructures
as well as power charging infrastructures
PC … enables the participatory co-creation & evolution of all relevant stakeholders (i.e.
customers/end-users) during innovation/ R&D/ operation in planning/ decisions &
implementation of the solution (i.e. features & user interfaces/ experience)
PR … anticipates political directions & regulations regarding the upcoming transportation
system / technologies and related safety & security aspects
SC … adapts societal changes like accessibility for aging society, disabled & immobile people
and other special mobility requests
I … supports individual behavior of passengers (anytime/ anywhere/ anybody) as well as
individual transportation requests/ services
AF … supports agile & flexible offering solutions & businesses for any demand
SC … covers the demand for collaboration at shared transportation
E … enables electrically powered minibus vehicles and infrastructures
The vision of future for ASCT, which results from the above-mentioned vision statements, aims the
general goal to be the No. 1 provider of trendsetting autonomous e-minibus solutions, …
designing individualized, comprehensive, scalable, fully automated & digitized concepts (vehicles, infrastructure, services) in close co-creation with all relevant stakeholders
for any people transportation purposes & applications (passenger types, use cases)
with maximum sustainability footprint (ecological, social and economic)
providing maximum value to all stakeholders (WIN-WIN, especially passengers)
enabling technological & business innovations of a multimodal transportation system
filling a critical gap of an exponentially growing ecosystem of transportation partners.
Figure 13 - Derivation of Vision Statements for AVENUE 2030

D8.3 First Iteration Economic Impact
21
Future scenarios are virtual/fictitious representations of future ecosystems including all relevant
actors/stakeholders, activities/relations, constraints and other relevant impact factors. Within future
scenarios potential future passenger use cases can be identified.
Future (business) hunting fields represent thematic areas of promising business activities (action fields/
business search fields/ innovation fields) wherein concrete business opportunities or business use cases
can be identified.
From a systematic point of view, it is useful to primarily regard the higher granularity level of identifying
future scenarios and deriving future hunting fields here from. In a second step concrete passenger use
cases can be derived and selected from the future scenarios and equally concrete business
opportunities/ business use cases can be derived and selected from hunting fields on the one hand and
passenger use cases on the other hand. (see figure 14)
Figure 14: General Scenario Design Systematics
A pragmatic methodology for deriving future scenarios can be provided by the identification of bi- or
multipolar/contradictory/alternative future elements (trends in a wider sense). These will be positioned
within the ‘Wilson matrix’ by their degree of uncertainty as well as the degree of (strategic) importance.
Those bipolar trends with a high degree of uncertainty and importance are candidates for dimensions of
a future scenario matrix. (see figure 15)

D8.3 First Iteration Economic Impact
22
Figure 15: From Future Trend Radar to Future Scenarios
An alternative method to the two-dimensional matrix representation for defining future scenarios in a
suitable (deterministic) way, could also be to arrange more bipolar dimensions within a ‘spider net’-
representation, and identify multiple future scenarios (scenario profiles) in a more open way. For the
reason of identifying only a limited number of significant and determined (by dimensions) future
scenarios, it is useful to select the matrix method for the further procedure. (see figure 16)
Figure 16: Alternative generic Methods for Scenario Definition
The following possible contradictory (bi-/tripolar) dimensions (blue boxes; D-x) for scenario definition
has been identified and attributes (green boxes) have been defined. (see figure 17).

D8.3 First Iteration Economic Impact
23
Figure 17: Identification of possible bi- or multipolar (contradictory)
Dimensions (criteria & attributes) for Scenario Definition
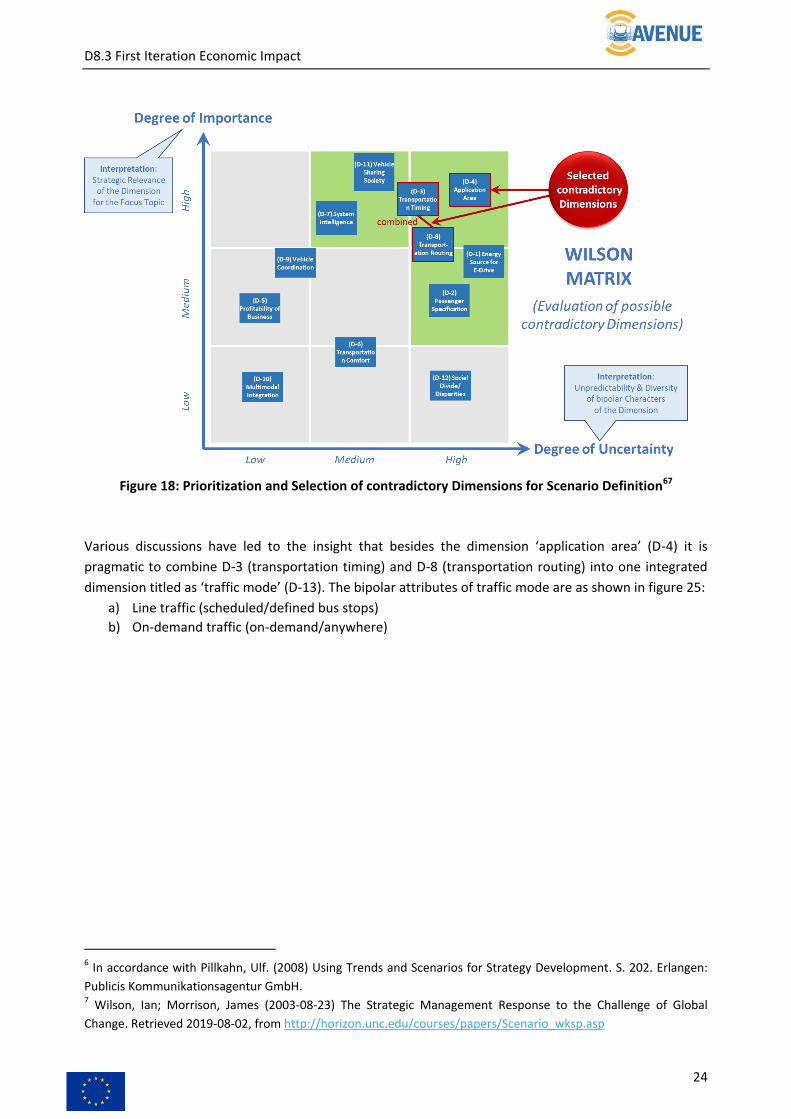
According to the methodology described before the dimensions have been positioned within the ‘Wilson matrix’. Alternative two-dimensional matrix combinations from the dimensions have been tested towards meaningful and reasonable characterizations of future scenarios for AVENUE. Among these dimension candidates the selected dimensions are: D-4 (application area); D-8 (transportation routing) and D-3 (transportation timing) as shown in figure 18.
D8.3 First Iteration Economic Impact
24
Figure 18: Prioritization and Selection of contradictory Dimensions for Scenario Definition67
Various discussions have led to the insight that besides the dimension ‘application area’ (D-4) it is
pragmatic to combine D-3 (transportation timing) and D-8 (transportation routing) into one integrated
dimension titled as ‘traffic mode’ (D-13). The bipolar attributes of traffic mode are as shown in figure 25:
a) Line traffic (scheduled/defined bus stops)
b) On-demand traffic (on-demand/anywhere)
6 In accordance with Pillkahn, Ulf. (2008) Using Trends and Scenarios for Strategy Development. S. 202. Erlangen:
Publicis Kommunikationsagentur GmbH. 7 Wilson, Ian; Morrison, James (2003-08-23) The Strategic Management Response to the Challenge of Global
Change. Retrieved 2019-08-02, from http://horizon.unc.edu/courses/papers/Scenario_wksp.asp

D8.3 First Iteration Economic Impact
25
Figure 19: Relevant contradictory dimensions for scenario definition
These two dimensions (D-8, D-13) spread out the final future scenario matrix, which will be utilized
further on. For each scenario concise titles have been identified. (see figure 20)
Figure 20: Selected Scenario Model for defining 4 Future Scenarios
The following examples and descriptions can be assigned to the different future scenarios above.
(see figure 21)

D8.3 First Iteration Economic Impact
26
Figure 21: Characterization of selected Future Scenarios
These archetypical scenarios can be discussed and characterized in more detail and scenario charters
have been elaborated (see figures 22-25).

D8.3 First Iteration Economic Impact
27
Figure 22: Characterization of Scenario S1: AVENUE Country-Callbus
D8.3 First Iteration Economic Impact
28
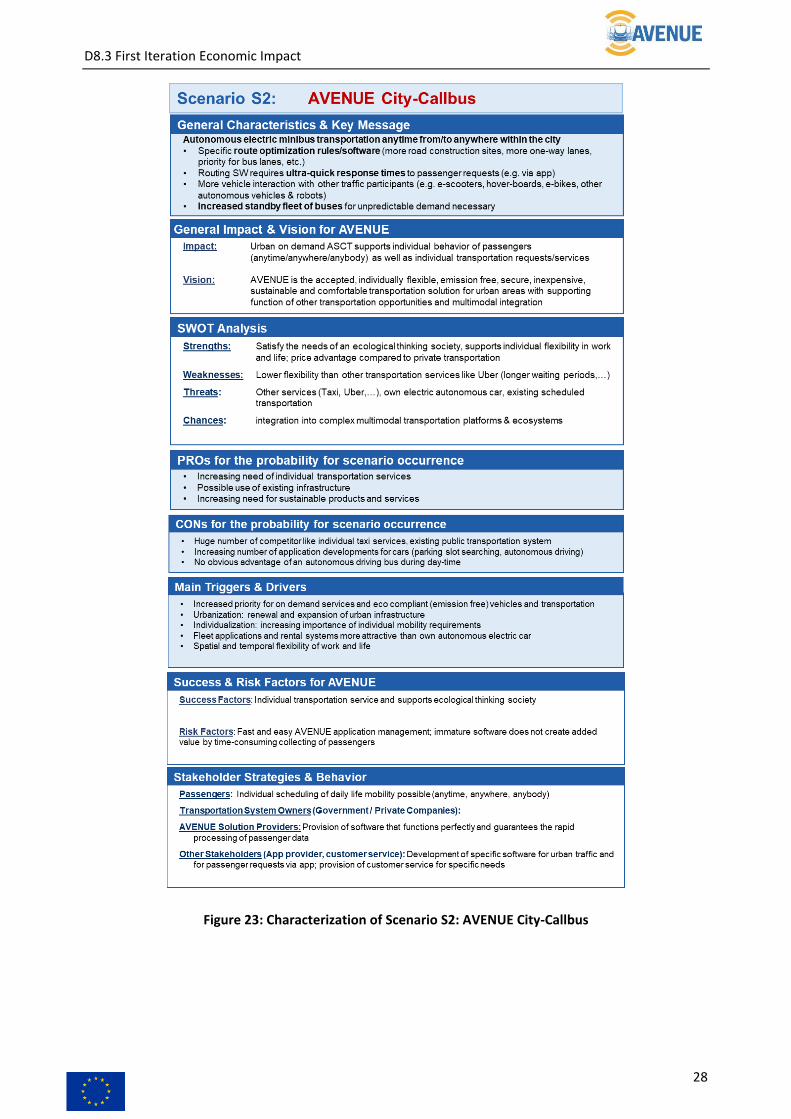
Figure 23: Characterization of Scenario S2: AVENUE City-Callbus

D8.3 First Iteration Economic Impact
29
Figure 24: Characterization of Scenario S3: AVENUE Country-Line

D8.3 First Iteration Economic Impact
30
Figure 25: Characterization of Scenario S4: AVENUE City-Line

D8.3 First Iteration Economic Impact
31
The previously characterized archetypical scenarios represent alternative AVENUE application situations
which can be applied either singularly or as a combination in real world situations like the AVENUE 6 Use
Case Pilot Locations in Geneva (Belle Idee, Merin), Lyon, Kopenhagen and Luxembourg (Contern,
Pfaffenhofen). The construction and discussion of basic generic scenarios as conditions for the Passenger
Use Cases - identified in the next chapter - are precondition for the further development of future
attractive Business Hunting Fields including promising Business Opportunities for AVENUE.
This systematical top down approach for AVENUE (from general trends via archetypical scenarios to the
portfolio of potential attractive business hunting fields and opportunities) is the basis for the practical
application at the AVENUE pilot Use Cases mentioned above. These elaborations – to be conducted in
the next deliverable - include the detailed analysis of the systemic and economic situation of the
AVENUE Pilot Use Case sites (e.g. vehicles, passengers, infrastructure, transportation demand &
constraints, competition, B2B customers, etc.) and their ecosystem, the matching of the situation with
the archetypical scenarios and the definition of individual business strategies and business models using
the preidentified set of business opportunities for AVENUE.
2.4 Passenger Use Cases
For a first discussion basis the following personas identified by the AVENUE partner Keolis have been
analysed in order to define relatively disjunct passenger groups reasonable for ASCTs. (see figure 26)
Figure 26: Examples for Passenger Personas from Keolis8
8 Keolis (2018) Keolis autonomous shuttles offer. Retrieved 2019-08-02 from
https://www.keolis.com/sites/default/files/atoms/files/nav_autonomes_2017_uk_vdef_0.pdf

D8.3 First Iteration Economic Impact
32
Based on these preliminary considerations the following segmentation model has been defined to
characterize the passenger groups relevant for AVENUE. For this model two dimensions were chosen
(see figure 27):
Transportation priority: mandatory for daily mobility and conduction of life and work
Transportation needs: special or standard vehicle equipment and configuration of
vehicles/services/infrastructure is required for mobility
Figure 27: Classification of passenger groups
In an alternative spider-diagram representation two further dimensions can be added and passenger
group profiles can be extended:
1. Time of transportation: defined/predictable or undefined/unpredictable time of mobility
demand
2. Modal integration of transportation: unimodal or multimodally integrated form of
transportation from starting point to destination
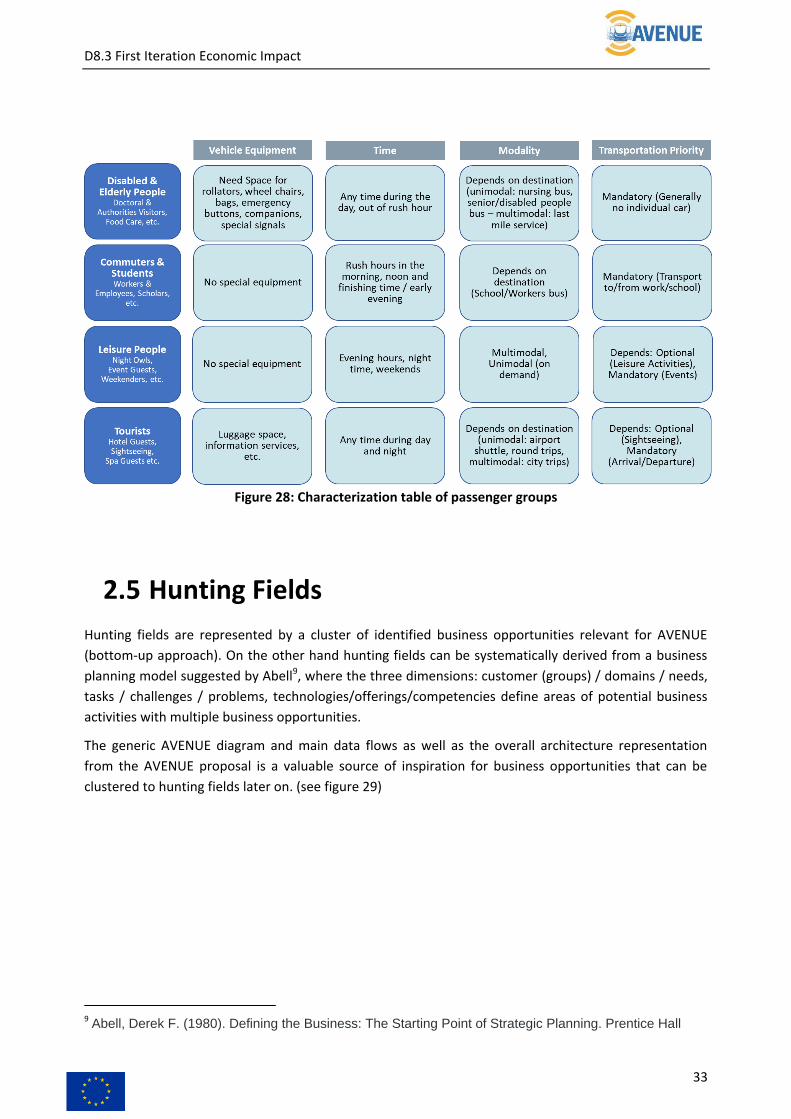
Referring to figure 27 the defined passenger groups can be characterized in detail by these four
dimensions (see figure 28).
D8.3 First Iteration Economic Impact
33
Figure 28: Characterization table of passenger groups
2.5 Hunting Fields
Hunting fields are represented by a cluster of identified business opportunities relevant for AVENUE
(bottom-up approach). On the other hand hunting fields can be systematically derived from a business
planning model suggested by Abell9, where the three dimensions: customer (groups) / domains / needs,
tasks / challenges / problems, technologies/offerings/competencies define areas of potential business
activities with multiple business opportunities.
The generic AVENUE diagram and main data flows as well as the overall architecture representation
from the AVENUE proposal is a valuable source of inspiration for business opportunities that can be
clustered to hunting fields later on. (see figure 29)
9 Abell, Derek F. (1980). Defining the Business: The Starting Point of Strategic Planning. Prentice Hall

D8.3 First Iteration Economic Impact
34
Figure 29: Inspiration Source for Business Opportunities - the AVENUE overall architecture10
These elaborations are the basis for a preliminary big picture of a collection of business opportunities
(blue bubbles) which have been clustered thematically in a suitable way to hunting fields (green
bubbles) according to the three-dimensional matrix representation (see figure 30).
10 H2020 AVENUE Project Proposal (07-2017) Autonomous Vehicles to evolve to a New Urban Experience. S.14

D8.3 First Iteration Economic Impact
35
Figure 30: Identification of Business Opportunities & Clustering of Hunting Fields

D8.3 First Iteration Economic Impact
36
In a more structured representation these hunting fields and business opportunities are displayed
below. Among these identified business opportunities, the following selection seems to be promising for
future profitable businesses. (see figures 31 and 32)
Figure 31: Structured Representation of Business Opportunities & Hunting Fields (1/2)
Figure 32: Structured Representation of Business Opportunities & Hunting Fields (2/2)
The subsequent business planning models and pragmatic elaborations were precondition for further
methodology of complexity reduction which is necessary to focus on only a few business opportunities
which can be strategically planned and tested in the future.

D8.3 First Iteration Economic Impact
37
In this sense the selected hunting fields and the herein selected business opportunities can be
characterized with regard to the passenger use cases (see figure 33).
Figure 33: Assignment of Hunting Fields to Scenario Use Cases – Identification of most attractive
Business Opportunity Clusters across Scenario Use Cases
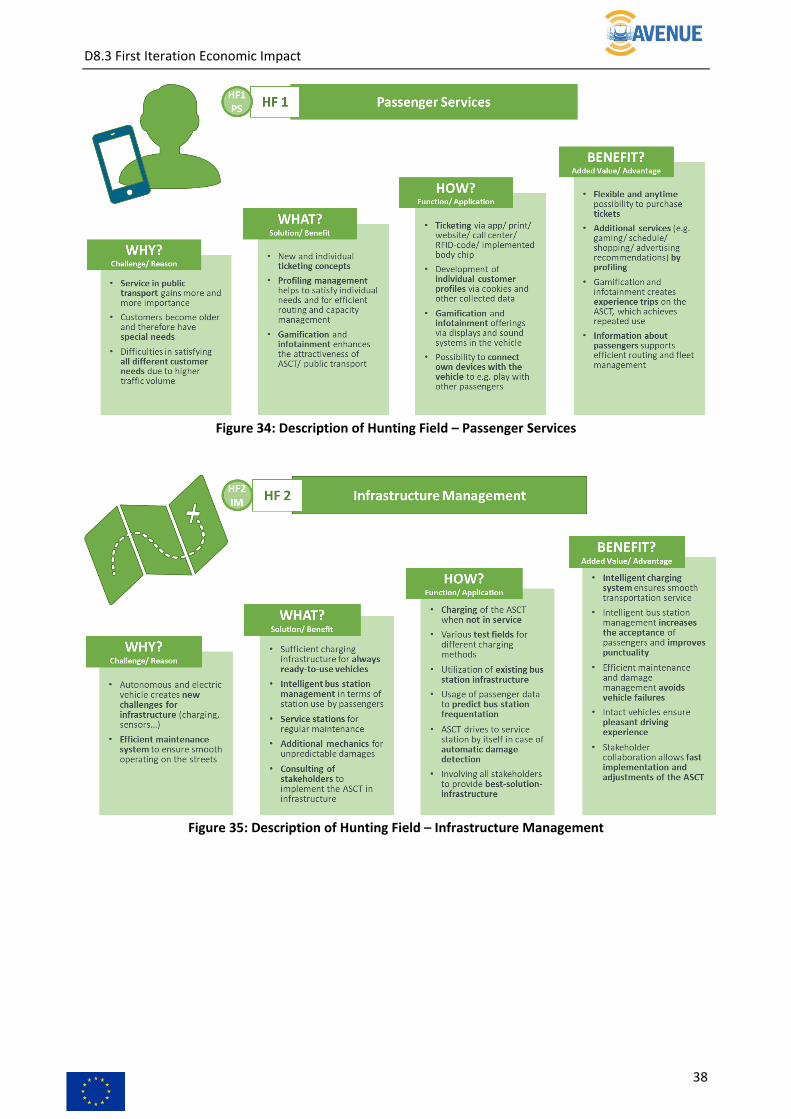
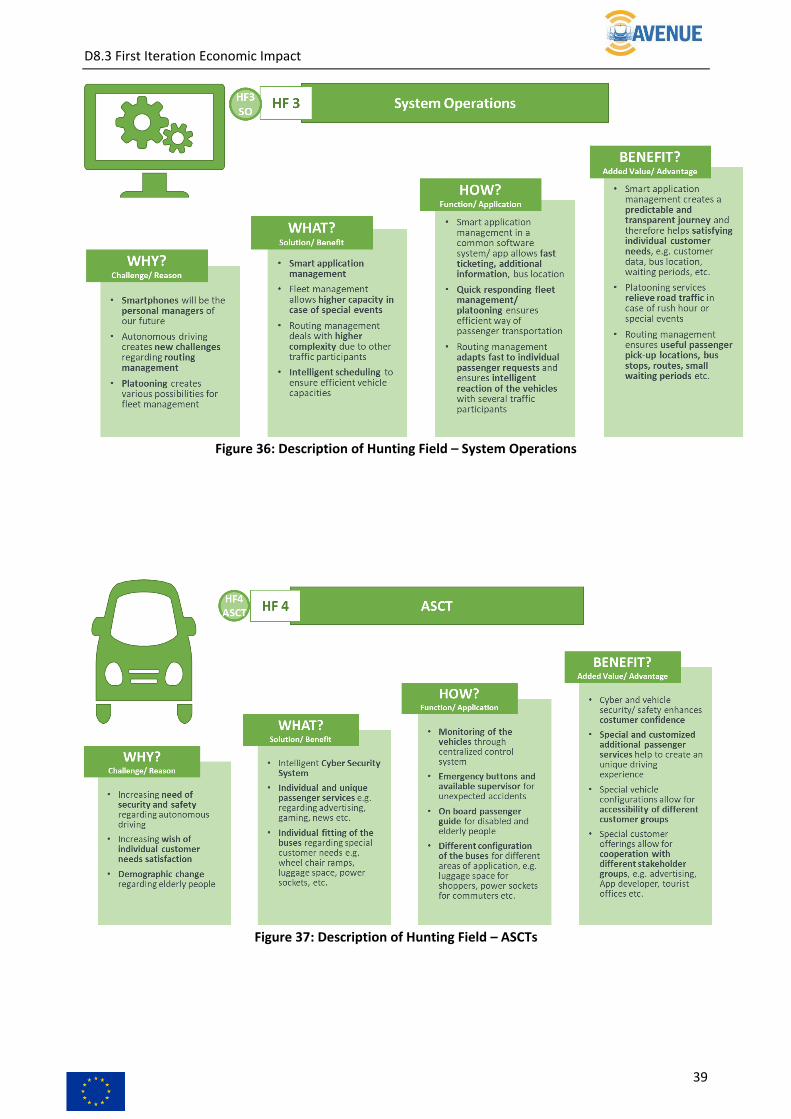
The different hunting fields (HF1 – HF5) from the table above will be described more precisely in the
following figures 34 - 38. These characterizations are built up by the following question modules:
a) Why: what are the challenges or reasons that justify this as a significant hunting field
b) What: what are the solutions and benefits that can cover these challenges
c) How: how are these solutions built up (functions/applications)
d) Benefit: what are the added values or advantages that the solution provides to the customers
and passengers
D8.3 First Iteration Economic Impact
38
Figure 34: Description of Hunting Field – Passenger Services
Figure 35: Description of Hunting Field – Infrastructure Management
D8.3 First Iteration Economic Impact
39
Figure 36: Description of Hunting Field – System Operations
Figure 37: Description of Hunting Field – ASCTs

D8.3 First Iteration Economic Impact
40
Figure 38: Description of Hunting Field – Municipalities & Commercial Bus Operators
2.6 Business Opportunities
In the following figure 39 the selected business opportunities (blue bubbles; BO1-BO5) can be
characterized with regard to the passenger use cases identified in figure 33.
Figure 39: Assignment of Hunting Fields to Scenario Use Cases – Identification of most attractive
Business Opportunity Clusters across Scenario Use Cases

D8.3 First Iteration Economic Impact
41
Among the different business opportunity clusters from the figure above we describe two BOs more
precisely in the following figures. These characterizations are built up by the following question
modules:
a) Why: what are the challenges or reasons that justify this as a significant business opportunity cluster
b) What: what are the solutions and benefits that can cover these challenges
c) How: how are these solutions built up (functions/applications)
d) Benefit: what are the added values or advantages that the solution provides to the customers and
passengers
Figure 40: Description of Business Opportunity Cluster – City Line for tourists / Passenger Services
Figure 41: Description of Business Opportunity Cluster – Leisure / system operations
D8.3 First Iteration Economic Impact
42
2.7 Business Use Cases
Business use cases are graphical or verbal representations of business workflows related to a dedicated
business opportunity and embedded within a business ecosystem. There are pictures for status-quo
business use cases and future business use cases. The clarification or planning of business use cases is
precondition for deriving business strategies and business models. The following modules and aspects of
business use cases are essential for further business planning.
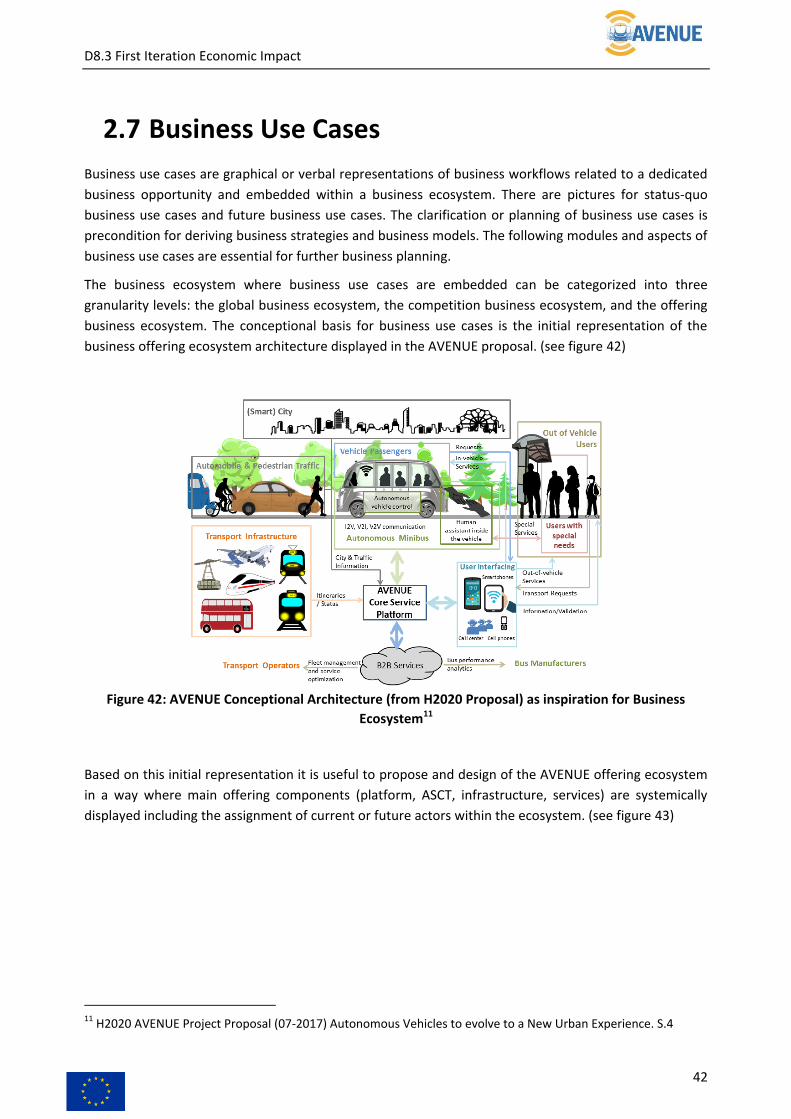
The business ecosystem where business use cases are embedded can be categorized into three
granularity levels: the global business ecosystem, the competition business ecosystem, and the offering
business ecosystem. The conceptional basis for business use cases is the initial representation of the
business offering ecosystem architecture displayed in the AVENUE proposal. (see figure 42)
Figure 42: AVENUE Conceptional Architecture (from H2020 Proposal) as inspiration for Business
Ecosystem11
Based on this initial representation it is useful to propose and design of the AVENUE offering ecosystem
in a way where main offering components (platform, ASCT, infrastructure, services) are systemically
displayed including the assignment of current or future actors within the ecosystem. (see figure 43)
11 H2020 AVENUE Project Proposal (07-2017) Autonomous Vehicles to evolve to a New Urban Experience. S.4

D8.3 First Iteration Economic Impact
43
The central challenge of an offering business ecosystem is to answer the questions:
which components (e.g. offerings, features, etc.) should be included into a platform provided by
AVENUE
which components should be offered to the customer as optional offerings by AVENUE
which components should be offered to the customer or provided (supplied/subcontracted) to
AVENUE by external core partners (close cooperation with bilateral contracts)
which components should be offered to the customer by external peer partners (loose cooperation
by registering on the AVENUE platform).
Figure 43: AVENUE System Partners within AVENUE Business Ecosystem
From a general and high-level point of view AVENUE business use cases have to regard to different
stages/ focuses of the business system:
1. Main focus are the business opportunities and business models regarding the relationship
between the AVENUE business champions and the AVENUE business customers and operational
users
2. Extended focus are the business opportunities and business models regarding the relationship
between the AVENUE business customers and the AVENUE end users (passengers)
Both focuses have to be regarded and integrated into the definition of business use cases. (see figure 44)

D8.3 First Iteration Economic Impact
44
Figure 44: Two stages of AVENUE Business Focuses
Whereas business opportunities and business models are planned to provide the AVENUE offerings to
the AVENUE business customers and end users (forward approach), the requirements from the end
users and business customers have to be elicited equally from those two systemic stage partners. (see
figure 45)
Figure 45: General AVENUE Business Actors & Offerings
From a generic point of view on the AVENUE business value chain there are three general business type
options relevant for the AVENUE providers (business champions):
1. A2G business (between AVENUE providers and government – business customers are e.g.
municipalities, public transportation companies or their private subcontracted companies)

D8.3 First Iteration Economic Impact
45
2. A2S business (between AVENUE providers and AVENUE solution providers – business customers
are e.g. private solution integrators or private operating companies)
3. A2O business (between AVENUE solution providers and AVENUE operators – business customers
are e.g. value-added or product-related service providers, software providers)
Currently it is not intended for AVENUE providers to enter a direct business with AVENUE passengers.
(see figure 33)
Figure 46: The AVENUE Business type options
Obstacles & Risks
Complementary to the identification of business success factors it is equally important for the design of
business use cases to have detailed information about general obstacles and risks for AVENUE. (see
figure 47).
Figure 47: General AVENUE Obstacles & Risks as basis for deriving business strategies
Success Factors
Important general information for designing business use cases for AVENUE is the knowledge about
general technical and business success factors. (see figure 48)

D8.3 First Iteration Economic Impact
46
Figure 48: General AVENUE Success Factors as basis for deriving business strategies12
Stakeholder Analysis
Important information for the design of business use cases (and later on business models) is the
identification and analysis of the business stakeholders and their according stakes (goal/interests, needs,
benefits). (see figure 49)
12 Bösch, Patrick; Becker, Felix et al. (2017) Cost-based analysis of autonomous mobility services. Retrieved 2019-08-07, from
https://www.sciencedirect.com/science/article/pii/S0967070X17300811?via%3Dihub

D8.3 First Iteration Economic Impact
47
Figure 49: Analysis of Business relevant Stakeholders
Business Use Case Canvas & Business Planning Outlook
The following canvas template will be used for describing business use cases based on business oppor-
tunities. This Business Use Case description as well as the according elaborations on business strategies,
business models and rough go-to-market concepts will be subject of further operational elaborations.

D8.3 First Iteration Economic Impact
48
Figure 50: Business use case canvas
As an outlook on further research activities for AVENUE the following sub work-packages are intended:
(see figure 51)
Figure 51: Outlook on further research activities (next deliverable)
An essential module within Business Models and Go-to-Market Concepts will be the ‘Cost Model’ as a
systemic representation of all strategic cost factors of a Business Model. This is supported by
quantitative calculations (see next chapter: TCO calculator) and are e.g. basis for profitability and
cost/benefit analyses.

D8.3 First Iteration Economic Impact
49
3 TCO Calculator A Total cost of ownership (TCO) approach will be deployed to design a tool giving a global economic
simulation of the impact of deployments with Autonomous Shuttles for Collective Transport. The TCO
calculator operates at 2 levels: level 1 integrates macro data (e.g.: global costs for the collectivity) and
level 2 integrates micro data (e.g.: local costs for the transport operator or local cost for the collectivity).
3.1 Macro-data calculator
In this section, a macro-data calculator will be proposed in order to investigate and simulate the
potential effects and external costs reduction by deploying shared autonomous electric vehicle fleets in
cities, taking into account the different future mobility scenarios designed.
The term external cost is defined by Markandya (1998) as "the costs arising from any human activity that
are not accounted for in the market system". For example, in the transport sector external costs are
related to traffic jam, air pollution, noise, GHG emissions and climate change impacts, and so on. The
external costs, are also known as externalities, and it refers to the economic concept of uncompensated
social or environmental effects (Eltis, 2014).
In 2018 the European Commission presented main findings on the external costs of EU transport. The
study pointed out the total external costs of transport estimated around € 1,000 billion annually, which
corresponds to almost 7% of EU 28 GDP (CIVITAS Initiative, 2019). The environmental costs, e.g. noise,
air pollution, well-to-tank and habitat damage, represent under one-half of total external costs, followed
by accidents (29%) and congestion (27%) (Polis, 2018).
The calculator here proposed aims to assess and compare the performance and effects of autonomous
electric vehicles in European cities as well as worldwide. As results, it intends to add new data and
findings addressing how this new technology can contribute to tackle the external costs of mobility in
urban areas.
3.1.1 Methodology
For this study, an analytical model has been developed to simulate the impacts of shared autonomous
electric vehicle fleets as an alternative to the individual mobility in cities.
Simulations will take into account the following elements: scenarios for adoption of autonomous
vehicles and fleet size, user acceptance, the energy consumption, emission of particulate matter,
nitrogen oxides, carbon footprint of different classes of vehicles, among others.
And the main effects on transport externalities will be estimated in order to tackle congestion,
accidents, parking cost and free up spaces.
The methodology for calculation has been based on three main references (see on references table):
Braun et al. (2019): to define potential mobility scenarios in cities with regards to autonomous vehicles;
Fournier et al. (2017): to calculate the performance and cost of Autonomous-Electric Vehicles;

D8.3 First Iteration Economic Impact
50
Fournier et al. (2017, 2018) and Roos and Siegmann (2018) for the sustainability impact and externalities calculation.
The calculator will be applied in the four AVENUE target cities: Copenhagen, Geneva, Lyon, Luxembourg.
3.1.2 The calculator
As a first step, the definition of the potential scenarios is an initial step to determine the impact of the
diffusion of autonomous shared vehicles in cites. These scenarios have to be defined among AVENUE
partners: ECP, Siemens, HSPF and Etat de Genève. The scenarios of the diffusion of the shuttles will
impact differently the cities, therefore, the following scenarios are currently discussed (see also Braun et
al. (2019)):
Business as usual scenarios (ICEV and individual mobility, basis scenario);
Business as usual scenario with EV (EV and individual mobility with AV);
Car sharing for individual mobility;
Car sharing and ride sharing, comprising car pooling and the shuttle ride sharing;
Car sharing, ride sharing and public transport (to be defined)
In addition, these scenarios should take into account the different modal splits and mobility goals in
each target city, as well as the diffusion of autonomous bus shuttles.
The calculator will also take into account the first results of the social surveys conducted in the cities in
the context of the ‘8.3 Social Impact’. Hence, the results from the Representative Surveys, User’ Surveys
and interview with Operators are a crucial source of information to consider the potential changes in
mobility behaviour and consequently determine the future modal share and scenarios in the
demonstrator cities. It is also important to acknowledge that the user’s acceptance and the user’s
willingness to incorporate autonomous vehicles (with or without human presence on board) in their
mobility routine will affect the diffusion levels and the scenarios for deployment. Therefore, the surveys
become an important gauge to estimate different impacts.
For instance, the following questions integrated in the Representative and User Survey:
What would you be willing to pay to use autonomous e-minibuses in general?
How important is it to you that there is a supervisor on board the autonomous e-minibus?
Imagine that autonomous e-minibuses were to become on demand, how willing would you be to reduce the use of your own car?
Such questions will feed the economic analysis and shape the mobility scenarios for deployment of
autonomous e-minibuses.
As a second step, in order to calculate the external costs and benefits of introducing shared autonomous
electric vehicle fleets in cities, the following externalities are currently discussed to be integrated in the
model:
Potential of vehicle savings (integrated in user costs evaluation)
Potential cost savings of accident prevention (in Euro, p.a.)
Potential cost savings of congestion avoidance (in Euro, p.a.)

D8.3 First Iteration Economic Impact
51
Potential cost savings of parking cost reduction (in Euro, p.a.)
Potential parking space savings in square meters (no cost evaluation)
Potential cost savings of reduced emissions (CO2e) (in Euro, p.a.)
Potential cost savings of reduced emissions (NOx) (in Euro, p.a.)
Potential cost savings of reduced emissions (PM) (in Euro, p.a.)
Potential increase of QALY (Quality-Adjusted Life Year)
3.2 Micro-data calculator
An evaluation tool of costs and gains for local level of where the service will be deployed is being
designed. The aim is to assist local decision makers (such as Municipalities, Public Transport Operators
and other interested stakeholders) on whether or not implement services with Autonomous Shuttles in
a given area by considering their overall cost structures and their local externalities (such as effects on
local congestion, pollution, accidents and noise).
Understanding and evaluating the macro-data calculations and its impacts for the overall scope of a
specific area is a fundamental and a pivotal part for the proper implementation of the business models
proposed by the AVENUE project, however, it is only part of the equation.
For the complete economic framework proposed in this deliverable, it is also fundamental to analyze the
cost and gain of the service, that is: micro costs and gains of the deployment in a specific area. In this
regard, the analysis should be able to identify the cost drivers, integrating investment costs (CaPex) as
well as functional costs (OpEx) for transport operators, users as well as the collectivity.
Based on the Total Cost of Ownership approach (TCO) direct and indirect costs, savings as well as cost
drivers and hidden costs will be clearly identified and evaluated as a basis for the development of a
business plan to evaluate the economic viability of autonomous vehicles as a part of an integrated public
transport system.
The TCO, "Total cost of ownership", has to be evaluated, integrating different figures; the evaluation
TCO takes into accounts the following concept that are to be estimated (none exhaustive list).
Investment Prospective Operating costs Business models
Asset
Asset Lifecycle
Ownership Life
Depreciable Life
Economic Life
Service Life
Obvious Cost
Hidden Cost
Cost Savings
Opportunity Cost
Resource Base Model
Activity Base Model
Cash Flow Estimates
Incremental Cash Flow
Finally, we will propose a simulation tool that will help to understand the total costs of deploying a
service with autonomous shuttles in a given area over its whole life-span.
D8.3 First Iteration Economic Impact
52
3.2.1 Methodology
A simulation tool is being designed to allow the overall dimensioning of the service to be deployed as
well as the creation of future scenarios. This tool will be comprised of three main separate but
complementary elements:
1) Dimensioning tool: this first element has the aim of assisting decision makers on identifying the
ideal fleet size for their envisioned service in a given area with a given population size.
The service area can be urban, peri-urban or rural where public transport is already existent (in
which case the autonomous shuttle would act as a complementary service) or in areas where the
autonomous shuttle will be offered as a completely new service. Furthermore, within those areas
the zoning could range from residential, commercial, industrial to mixed and therefore the number
of potential users may vary accordingly.
This fleet size dimensioning tool will give the option for decision makers to estimate the fleet size
based on demand (whether there is already an estimate on the number of passengers) or on supply
(where the new service will be created and demand is unknown) and it will take into account several
elements in the calculation, such as: the average route length, the average operational speed, the
average layover time, the shuttle’s capacity, the load factor, the shuttle’s battery range and
autonomy, the number of operating hours, the frequency of the service, the presence or not of a
human operator on board, the service access proximity (or granularity of service points), as well as,
data on the territory for the demand and supply sides.
The dimensioning calculation tool is currently being developed and validated by ECP along Keolis and
TPG and further details will be detailed in future deliverables.
2) Local externalities calculation tool: Once the service's operating environment and fleet size have
been defined, it is possible to move on to calculations of the local external impacts arising from the
deployment.
That is, the calculation of the local impact on the number of modal-shifts towards the service (the
rate of people who have stopped using other passive modes of transport - such as private vehicles -
to use the shuttle service). The shuttle’s impacts on levels of congestion, pollution, noise and
number of accidents.
The local externalities calculations tool is yet to be developed and validated, further details will be
given in future deliverables.
3) CAPEX and OPEX calculation tool: As for the calculation of local externalities, once the size of the
fleet and its service perimeter have been defined, it is possible to make a simulation of the total
costs for the execution of the service.
This simulation should entail the total of Capital Expenditures (CAPEX) as well as the total of annual
Operation Expenditures (OPEX) and, the possible sources of benefits (gains).
An in-depth qualitative analysis of all cost-sources as well as gain-sources is being developed with
the aim of serving as an “instruction manual” for decision makers on what costs and gain sources
they should consider for their own deployments. In parallel an excel document to address the
calculation of such costs and gains is also being developed and its preliminary version is further
detailed in the next subsection 3.2.2.
An expanded and complete version of the CAPEX and OPEX calculation tool will be detailed in future
deliverables.
D8.3 First Iteration Economic Impact
53
This simulation tool is being developed on a context-based approach. As a starting point, we take into
account the experimentations being carried out in the Lyon pilot-site. We are working alongside with
Keolis and gathering data and hypothesis from both the ongoing Confluence deployment as well as for
the yet-to-start Décines deployment (AVENUE project).
The methodology for calculation has been based on the following main references (see references table
for details):
Litman (2019) - Evaluating Public Transit Benefits and Costs: Best Practices Guidebook;
Litman (2019) – Autonomous Vehcile Impementation Predictions;
Ongel et al. (2019) – Economic Assessment of Autonomous Electric Microtransit Vehicles;
Bösh et al. (2018) - Cost-based analysis of autonomous mobility services;
Henderson et al. (2017) – Feasibility of Electric Autonomous Vehicles on Ohio State University
Campus;
Kalakuntla (2017) – Adopting autonomous bus to a transit agency: a cost-benefit analysis;
ANTP (2017) – Custo dos serviços de transporte público por ônibus: instruções práticas;
Quinet et al. (2013) - Évaluation socioéconomique des investissements publics.
Similarly, to the macro-data calculator, this simulation tool will be applied in the all four cities where the
AVENUE pilot project is being implemented. Starting in Lyon and being refined and improved with data
and hypothesis from the other three cities in collaboration with each city transport operator as well as
the other related AVENUE partners.
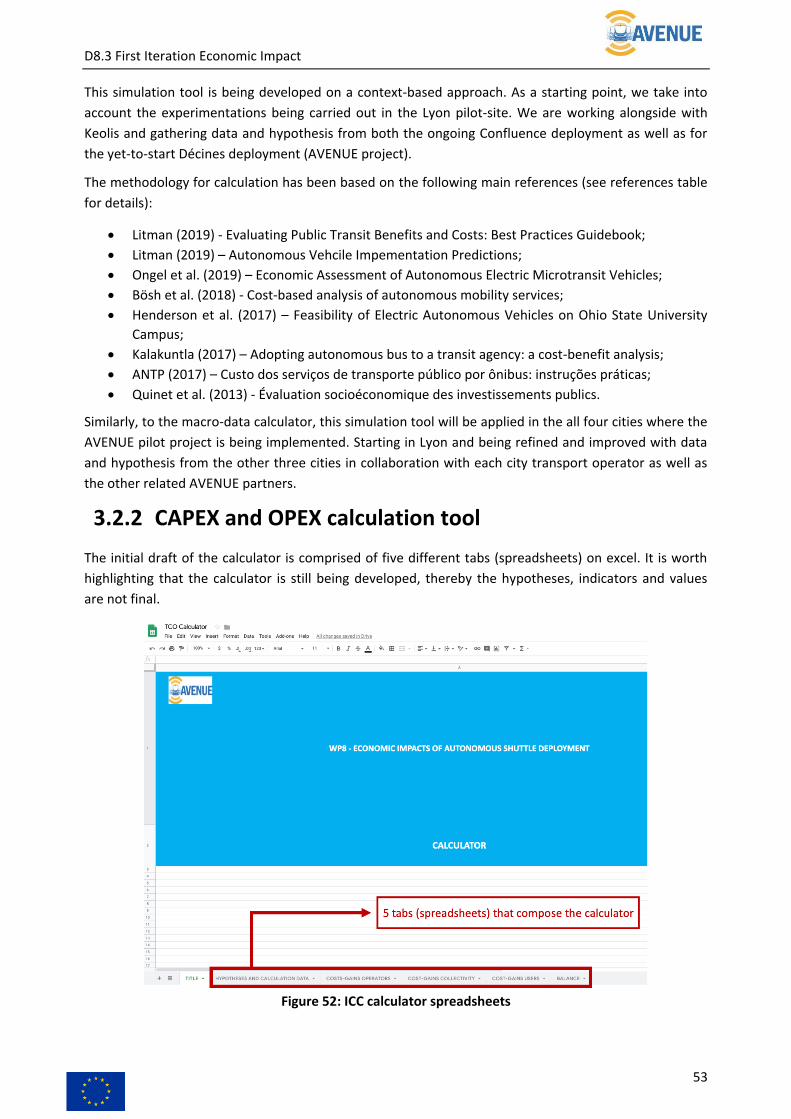
3.2.2 CAPEX and OPEX calculation tool
The initial draft of the calculator is comprised of five different tabs (spreadsheets) on excel. It is worth
highlighting that the calculator is still being developed, thereby the hypotheses, indicators and values
are not final.
Figure 52: ICC calculator spreadsheets

D8.3 First Iteration Economic Impact
54
The first spreadsheet – named as: hypotheses and calculation data – entails a set of hypothesis (not
exhaustive) about the possible transfer of uses to the shuttles, about the transfer of expenses and,
about financial valuation. For each proposed hypothesis, a possible mode of calculation as well as the
mode of valuation is also proposed. This spreadsheet aims to act as an introductory analytical lens to
foster and generate insights for the completion of the following tabs in the TCO calculator.
Figure 53: Hypotheses and calculation data spreadsheet
The following three spreadsheets are aimed at detailing the costs (CaPex - investments and, OpEx -
annual exploitation costs) and gains for each of the described stakeholder (operators, collectivity and
users). For each identified cost (and gain) a qualitative analysis is first made as a way to leverage possible
quantitative metrics for valuation.
All data will be quantified and valuated: for example, for the users’ data such as the feeling of comfort or
travel time reduction will be estimated in euros; for the city, for example, infrastructure costs, will also
be estimated in euros. This estimation will be based on official public ratios.
Several calculations of the sheets 2 to 4 are linked to the hypothesis and calculation modes inserted in
the sheet 1. Each user of the calculator has to adapt the hypothesis and evaluation modes to the specific
situation to be evaluated. Indeed, hypothesis and calculation data may widely vary between Lyon,
Geneva and any other site.

D8.3 First Iteration Economic Impact
55
Figure 54: Example of the spreadsheet for costs and gains for the transport operator (still under
development)
At this first step we do not take into account new gain resulting from new uses of the autonomous
shuttle such as goods delivery or transport of injured people or…; this will be taken into account
accordingly to the consolidation of uses scenarios as programmed at section 1.
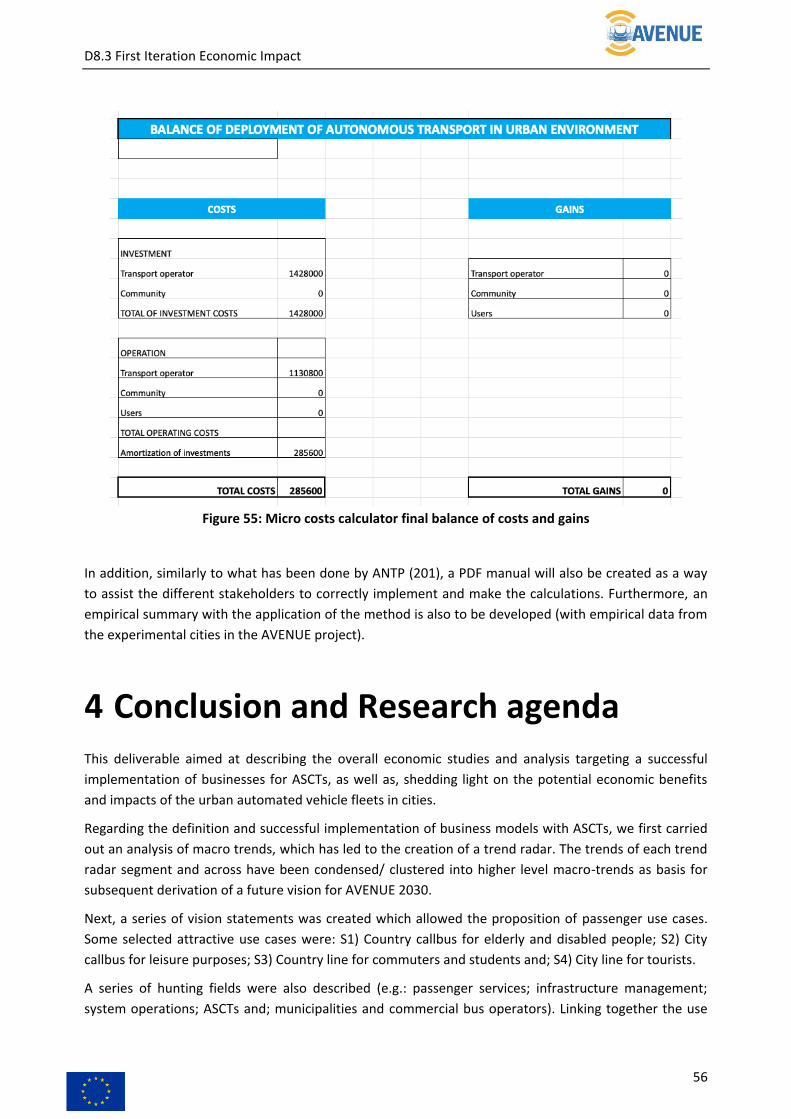
At last, the final spreadsheet of the ICC calculator brings the final balance of all costs and gains for the
transport operators, collectivity and users. Therefore, by analysing this particular spreadsheet, it is
possible to identify the main sources of costs and revenues for each stakeholder and from that, proceed
with the necessary adjustments and strategic decisions for the proper functioning of the proposed
business models (e.g., profit-oriented, subsidized, etc.).
D8.3 First Iteration Economic Impact
56
Figure 55: Micro costs calculator final balance of costs and gains
In addition, similarly to what has been done by ANTP (201), a PDF manual will also be created as a way
to assist the different stakeholders to correctly implement and make the calculations. Furthermore, an
empirical summary with the application of the method is also to be developed (with empirical data from
the experimental cities in the AVENUE project).
4 Conclusion and Research agenda This deliverable aimed at describing the overall economic studies and analysis targeting a successful
implementation of businesses for ASCTs, as well as, shedding light on the potential economic benefits
and impacts of the urban automated vehicle fleets in cities.
Regarding the definition and successful implementation of business models with ASCTs, we first carried
out an analysis of macro trends, which has led to the creation of a trend radar. The trends of each trend
radar segment and across have been condensed/ clustered into higher level macro-trends as basis for
subsequent derivation of a future vision for AVENUE 2030.
Next, a series of vision statements was created which allowed the proposition of passenger use cases.
Some selected attractive use cases were: S1) Country callbus for elderly and disabled people; S2) City
callbus for leisure purposes; S3) Country line for commuters and students and; S4) City line for tourists.
A series of hunting fields were also described (e.g.: passenger services; infrastructure management;
system operations; ASCTs and; municipalities and commercial bus operators). Linking together the use

D8.3 First Iteration Economic Impact
57
cases with the hunting fields have led to the identification of several business opportunities for the
AVENUE project, such as: BOC1) City line for tourists – passenger services; BOC2) Country line for
commuters/students – infrastructure management; BOC3) city call for leisure people – system
operations; BOC4) country call for elderly/disabled people – ASCT and; BOC5) country line for
commuters/students – municipalities/commercial bus operators.
An initial analysis of the success factors as well as an analysis of obstacles and risks was also carried out
as well as a stakeholder analysis and a competitor analysis by the following strategic parameters. As
future steps, a business use canvas template will be used for describing business use cases based on the
business opportunities. This will be subject of an AVENUE expert workshop to be conducted in the near
future.
Regarding the economic impacts, a simulation tool is being designed on both macro and micro level will
be applied in the four cities of the AVENUE project.
For a macro-data calculator, an analytical model is under development to simulate and investigate the
impacts of ASCTs fleets, as an alternative to the individual mobility in cities. Simulations will take into
account: scenarios for adoption of autonomous vehicles and fleet size, the energy consumption,
emission of particulate matter, nitrogen oxides, carbon footprint of different classes of vehicles as well
as other relevant externalities and potential cost savings.
For a micro-data calculator, the analysis is based on the Total Cost of Ownership (TCO) approach and is
aimed at identifying the savings (gains) and cost drivers, integrating investment costs as well as
functional costs for transport operators, users as well as the collectivity. In this sense a set of hypothesis
and indicators are being developed via context-based approach (starting with the Lyon Décines
deployment – being assisted by KEOLIS) as a way of better understanding and refining the variables to
be used in the valuation. Individual spreadsheets are being created for the valuation of costs and gains
for: 1) transport operators; 2) users (commuters) and, 3) collectivity. At last, a final spreadsheet brings
the final balance of all costs and gains for all stakeholders analysed. The tool will help simulate the global
economic impact of ASCT deployment at a local level and therefore be a decision making aid for local
policy makers to take their decision
Future research agenda will also include the refinement and application of the calculators in all four
cities of the AVENUE project as well as promoting a coherent integration with the identified business
models.
This deliverable presents the methodology and tools that are under development. Next deliverable will
present more quantitative results regarding as well scenarii as calculation tools.
References Abell, Derek F. (1980). Defining the Business: The Starting Point of Strategic Planning. Prentice Hall
Associação Nacional de Transportes Públicos – ANTP (2017). Custos dos serviços de transporte público
por ônibus: instruções práticas. [online]. http://files.antp.org.br/2017/8/21/2.-instrucoes-praticas--
final-impresso.pdf (accessed 26/08/2019).
Bösch, Patrick M., Becker, Felix, Becker, Henrik, Axhausen, Kay W. (2018). Cost-based analysis of
autonomous mobility services. Transport Policy, 64, 76-91.

D8.3 First Iteration Economic Impact
58
Braun, S., Schatzinger, S., Schaufler, C, Marenrutka, C., Fanderl, N. (2019). Autonomes Fahren im
Kontext der Stadt - AFKOS, Fraunhofer Institut für Arbeitswissenschaft und Organisation IAO.
CIVITAS Initiative (2019). European Commission shares first findings on the true costs of EU transport
[online] https://civitas.eu/news/european-commission-shares-first-findings-true-costs-eu-transport
(accessed 6.8.2019)
Eltis (2019). Costs: internal & external costs. [online] https://www.eltis.org/glossary/costs-internal-
external-costs (accessed 6.8.2019)
Fournier, G; Pfeiffer, C.; Baumann, M.J.; Wörner, R. (2017).Individual mobility by shared autonomous
electric vehicle fleets: Cost and CO2 comparison with internal combustion engine vehicles in
Berlin, Germany. International Conference on Engineering, Technology and Innovation. H2020 AVENUE Project Proposal (07-2017) Autonomous Vehicles to evolve to a New Urban Experience.
Henderson, H., Veder, A., Li, L., Johnson, M. (2017). Feasibility of electric autonomous vehicles on Ohio
State Univeristy Campus. [online].
https://kb.osu.edu/bitstream/handle/1811/81632/1/ENRAEDE4567_ElectricAutonomousVehicles_au
2017.pdf (accessed 26/08/2019).
Kalakuntla, S. P. (2017). Adopting Autonomous bus to a transit agency: a cost-benefit analysis. [online].
https://www.academia.edu/34636124/ADOPTING_AUTONOMOUS_BUS_TO_A_TRANSIT_AGENCY_A
_COST-BENEFIT_ANALYSIS (accessed 26/08/2019).
Keolis (2018) Keolis autonomous shuttles offer. Retrieved 2019-08-02 from
https://www.keolis.com/sites/default/files/atoms/files/nav_autonomes_2017_uk_vdef_0.pdf
Litman, Todd. (2019). Autonomous Vehicle Implementation Predictions: implications for transport
planning. [online]. https://www.vtpi.org/avip.pdf (acessed 36.8.2019).
Litman, Todd. (2019). Evaluating Public Transit Benefits and Costs: Best Practices Guidebook. [online].
https://www.vtpi.org/tranben.pdf (accessed 26.8.2019)
Markandya, A. (1998). Economics of Greenhouse Gas Limitations.The indirect costs and benefits of
greenhouse gas limitations. UNEP. [online]
https://unfccc.int/files/cooperation_and_support/capacity_building/application/pdf/unepindcost.pd
f (accessed 6.8.2019) Ongel, A., Loewer, E., Roemer, F., Sethuraman, G., Chang, F., Lienkamp, M. (2019). Economic Assessment
of Autonomous Electric Microtransit Vehicles. Sustainability, 11(648), 1-18, doi:10.3390/su11030648
Pillkahn, Ulf. (2008) Using Trends and Scenarios for Strategy Development. S. 119. Erlangen: Publicis
Kommunikationsagentur GmbH.
POLIS (2018). EC study on internalisation of external costs in transport. [online]
https://www.polisnetwork.eu/publicnews/1877/45/EC-study-on-internalisation-of-external-costs-in-
transport (accessed 5.8.2019) Quinet, Émile. (2013). Évaluation SocioÉconomique des Investissements Publics. [online].
https://www.strategie.gouv.fr/sites/strategie.gouv.fr/files/archives/CGSP_Evaluation_socioeconomiq
ue_170920131.pdf (accessed 26.8.2019)
Ramsey, Mike. (2018-08-14). Retrieved 2019-08-02, from
https://www.forbes.com/sites/enroute/2018/08/14/autonomous-vehicles-fall-into-the-trough-of-
disillusionment-but-thats-good/#2d6c7bb27b5a
Roos, M., Siegmann, M. (2018), Gesamtwirtschaftliche Kosteneinsparpotenziale durch das
automatisierte Fahren, In TATuP , Zeitschrift für Technikfolgenabschätzung in Theorie und Praxis,
27/2, pp. 27-30 [online] http://tatup.de/index.php/tatup/issue/view/6/ISSN%202199-9201%2027-2
(accessed 2.4.2019)

D8.3 First Iteration Economic Impact
59
APPENDIX