autofocus correction of excessive migration in sar
TRANSCRIPT

7/31/2019 Autofocus Correction of Excessive Migration in SAR
http://slidepdf.com/reader/full/autofocus-correction-of-excessive-migration-in-sar 1/28
- 1 -
SANDIA REPORT
SAND2004-4770Unlimited Release
Printed September 2004
Autofocus Correction of ExcessiveMigration in Synthetic ApertureRadar Images
Armin W. Doerry
Prepared by
Sandia National Laboratories
Albuquerque, New Mexico 87185 and Livermore, Cali fornia 94550
Sandia is a multiprogram laboratory operated by Sandia Corporation,
a Lockheed Martin Company, for the United States Department of Energy under Contract DE-AC04-94AL85000.
Approved for publ ic release; further dissemination unlimited.

7/31/2019 Autofocus Correction of Excessive Migration in SAR
http://slidepdf.com/reader/full/autofocus-correction-of-excessive-migration-in-sar 2/28
- 2 -
Issued by Sandia National Laboratories, operated for the United
States Department of Energy by Sandia Corporation.
This report was prepared as an account of work sponsored byan agency of the United States Government. Neither the United StatesGovernment, nor any agency thereof, nor any of their employees, nor any of their contractors, subcontractors, or their employees, make any warranty,express or implied, or assume any legal liability or responsibility for theaccuracy, completeness, or usefulness of any information, apparatus, product,or process disclosed, or represent that its use would not infringe privatelyowned rights. Reference herein to any specific commercial product, process,or service by trade name, trademark, manufacturer, or otherwise, does notnecessarily constitute or imply its endorsement, recommendation, or favoringby the United States Government, any agency thereof, or any of theircontractors or subcontractors. The views and opinions expressed herein donot necessarily state or reflect those of the United States Government, any
agency thereof, or any of their contractors.
Printed in the United States of America. This report has been reproduceddirectly from the best available copy.
Available to DOE and DOE contractors from
U.S. Department of EnergyOffice of Scientific and Technical InformationP.O. Box 62Oak Ridge, TN 37831
Telephone: (865)576-8401Facsimile: (865)576-5728
E-Mail: [email protected] Online ordering: http://www.doe.gov/bridge
Available to the public from
U.S. Department of CommerceNational Technical Information Service5285 Port Royal RdSpringfield, VA 22161
Telephone: (800)553-6847Facsimile: (703)605-6900E-Mail: [email protected]
Online order: http://www.ntis.gov/ordering.htm

7/31/2019 Autofocus Correction of Excessive Migration in SAR
http://slidepdf.com/reader/full/autofocus-correction-of-excessive-migration-in-sar 3/28
- 3 -
SAND2004-4770
Unlimited Release
Printed September 2004
Autofocus Correction of ExcessiveMigration in Synthetic Aperture
Radar Images
Armin W. DoerrySynthetic Aperture Radar Department
Sandia National Laboratories
PO Box 5800
Albuquerque, NM 87185-0519
ABSTRACT
When residual range migration due to either real or apparent motion errors exceeds the
range resolution, conventional autofocus algorithms fail. A new migration-correctionautofocus algorithm has been developed that estimates the migration and applies phase
and frequency corrections to properly focus the image.

7/31/2019 Autofocus Correction of Excessive Migration in SAR
http://slidepdf.com/reader/full/autofocus-correction-of-excessive-migration-in-sar 4/28
- 4 -
ACKNOWLEDGEMENTS
Some of the concepts described herein originated in discussions with Freddie Heardregarding anomalies observed in Sandia developed fielded systems. Aspects of several
concepts described herein were also used for data analysis by Freddie Heard and Tom
Cordaro, and perhaps others.
This work was funded by the US DOE Office of Nonproliferation & National Security(NNSA), Office of Research and Development, Proliferation Detection Program Office
(NA-22), under the Advanced Radar System (ARS) project.

7/31/2019 Autofocus Correction of Excessive Migration in SAR
http://slidepdf.com/reader/full/autofocus-correction-of-excessive-migration-in-sar 5/28
- 5 -
CONTENTS
ABSTRACT........................................................................................................................ 3
ACKNOWLEDGEMENTS................................................................................................ 4
CONTENTS........................................................................................................................ 5
FOREWORD...................................................................................................................... 6
1. Introduction & Background ...................................................................................... 7
2. Overview & Summary ............................................................................................ 12
3. Detailed Analysis .................................................................................................... 13
Technique 1: .................................................................................................................. 18
Technique 2: .................................................................................................................. 22
4. Conclusions............................................................................................................. 26
5. References............................................................................................................... 27
DISTRIBUTION............................................................................................................... 28

7/31/2019 Autofocus Correction of Excessive Migration in SAR
http://slidepdf.com/reader/full/autofocus-correction-of-excessive-migration-in-sar 6/28
- 6 -
FOREWORD
Sandia developed high-performance Synthetic Aperture Radar (SAR) systems push theenvelope of feasibility on a number of fronts, including fine resolution at long ranges.
Several years ago, fielded systems began occasionally exhibiting image quality problems
that were traced to apparent excessive residual migration. Low-frequency, long-apertureSandia test systems such as the Concealed Target SAR (CTSAR) exhibited the same
anomalies. Then future systems such as the Ka-band Ultra-High-Resolution SAR
(UHRSAR) were expected to do the same, and did. Even the Ku-band MiniSAR currently under development is expected to encounter excessive residual migration
depending on which inertial motion measurement sensor instruments are used. Finally,
the literature began reporting that even with perfect motion measurement, atmosphericanomalies would cause an apparent excessive migration in the data.
After determining the limitations of existing autofocus algorithms, new techniques wereexplored and developed to accommodate excessive residual migration. These have
proved effective in ground processing of images from fielded systems, CTSAR, and
UHRSAR. This report details these techniques.
7/31/2019 Autofocus Correction of Excessive Migration in SAR
http://slidepdf.com/reader/full/autofocus-correction-of-excessive-migration-in-sar 7/28
- 7 -
1. Introduction & Background
Synthetic Aperture Radar (SAR) forms images of a scene by sampling energy from a
scattered field along the radar’s flight path and coherently processing the data.
Coherence of the data set is facilitated by very accurately measuring the geometricrelationship between the desired target scene and the radar’s flight path, and accounting
for this in the data processing. This requires measuring the radar’s motion, or at least its
relative motion, very accurately and with fractional-wavelength precision over the course
of the synthetic aperture. Typically, an Inertial Measurement instrument is employed,and even this is often aided by Global Positioning Satellite navigation readings.
The raw SAR data is typically a two-dimensional array of complex data samples, with
one dimension representing samples from echoes of individual pulses (fast-time), and the
other dimension representing the pulse index number (slow-time). This collection istermed the phase history data. Since wideband modulation techniques, such as the Linear
Frequency Modulated (LFM) chirp waveform, are normally used for individual pulses,the data needs to be processed, or compressed, in the intra-pulse or range direction to
achieve the final desired range resolution. This is termed range-compression. The dataneeds further processing in the inter-pulse or azimuth direction to complete the image
formation process. This is termed azimuth compression.
During the course of a synthetic aperture, as the radar’s perspective towards a target
scene changes, ranges to some target locations change or migrate relative to other targetlocations. This migration is deterministic and is compensated within the image formation
process by algorithms such as the Polar Format Algorithm (PFA) developed by Walker.1
Relatively small motion measurement errors manifest themselves principally as phase
errors in the complex data samples, and if large enough become observable as a
smearing, blurring, or other degradation in the image. For most SAR systems, however,the nature and degree of blurring is nearly identical in different parts of the degraded
SAR image. This allows a measurement of the blurring function, and then a calculationof a suitable correction to be applied to the original data to compensate for the presumed
motion error. Further processing then may yield a well-focused image devoid of the
previously observable degradation. A number of algorithms exist to automatically focusthe degraded image. While some measure and compensate blurring, others seek to
optimize other measures, such as contrast ratio in the image. Collectively, these
processes are termed “autofocus” algorithms. A very popular autofocus algorithm is the
Phase Gradient Autofocus (PGA) algorithm described by Wahl, et. al.2
Very large relative motion measurement errors manifest themselves as an unexpectedadditional shifting or migration of target locations beyond the aforementioned
deterministic migration during the course of the synthetic aperture. Degradation in
images from data exhibiting errors of this magnitude are substantial, often rendering theimage useless. Application of conventional autofocus techniques are unable to properly
mitigate the image degradation. It is this problem that this report addresses.

7/31/2019 Autofocus Correction of Excessive Migration in SAR
http://slidepdf.com/reader/full/autofocus-correction-of-excessive-migration-in-sar 8/28
- 8 -
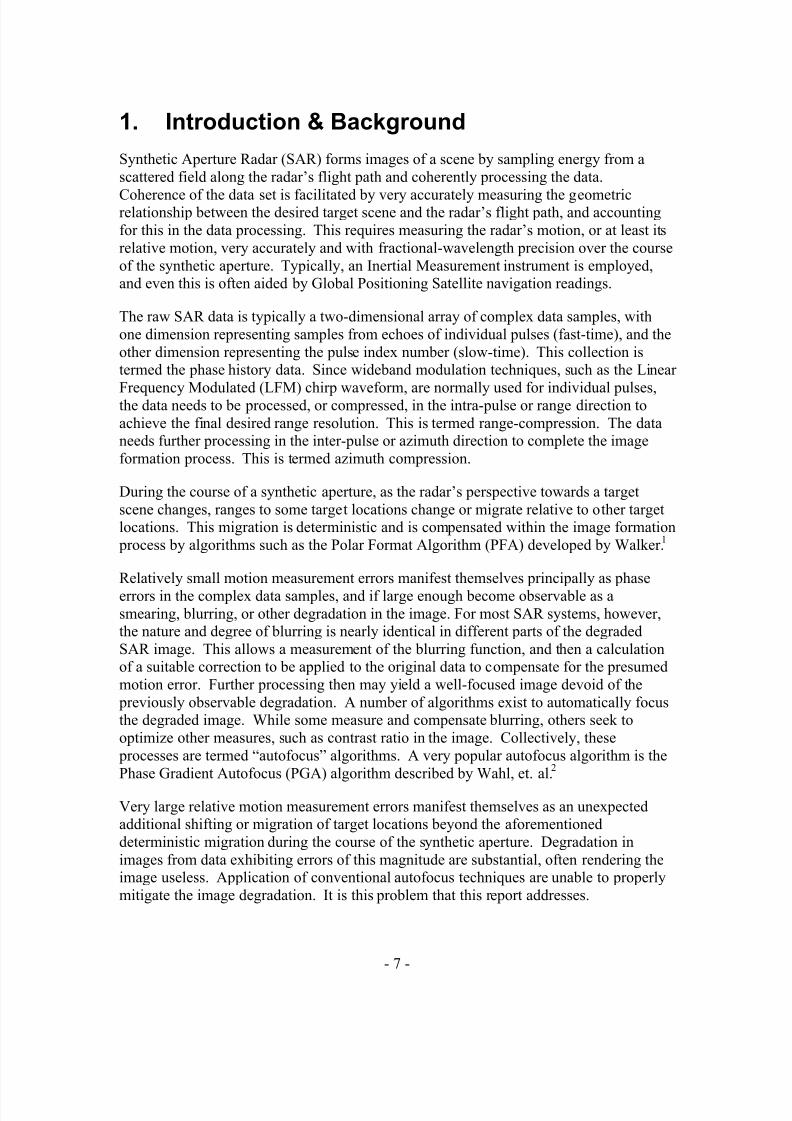
Figure 1 is a photograph of a SAR imaging test site used to evaluate image quality.
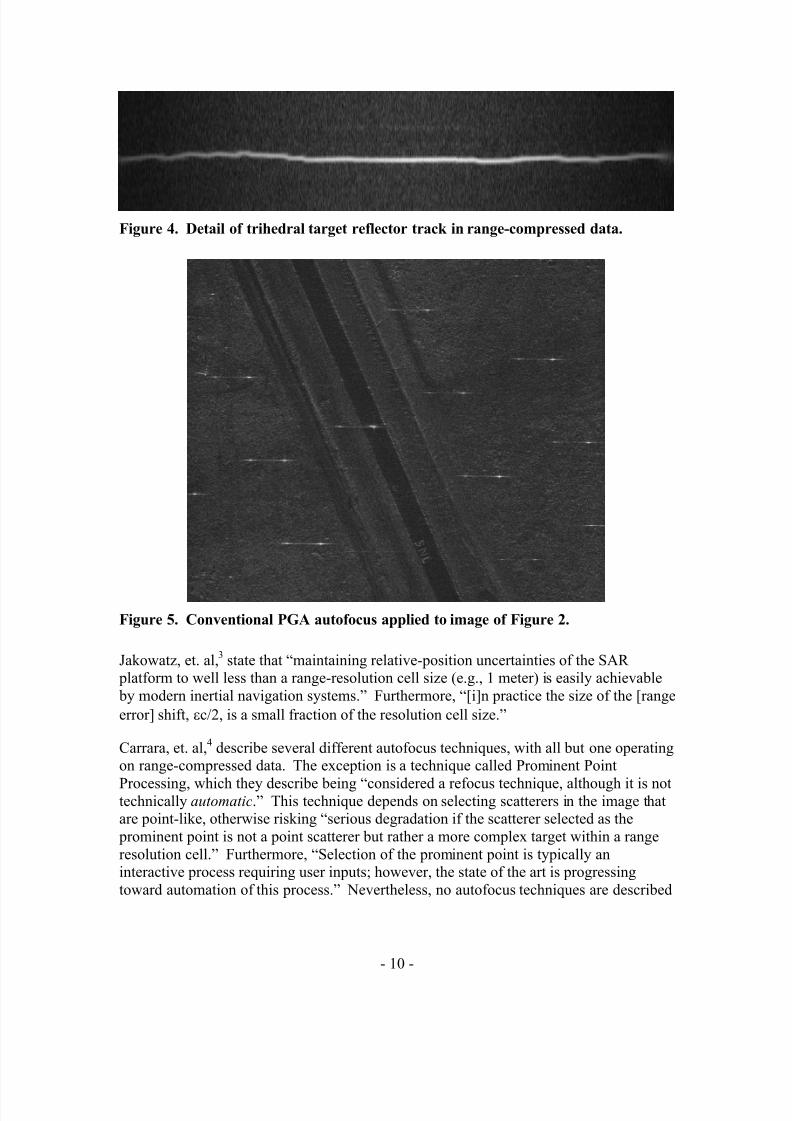
Figure 2 is a SAR image of the same scene created using PFA processing but without anyautofocus applied. The data set was collected at a 41 km range and offers a capability of
4-inch resolution, but this image exhibits severe smearing in the azimuth direction.
Figure 3 is a rendering of the range-compressed data, but with deterministic migration
compensated. Figure 4 details a single trihedral target reflector’s track in the range-compressed data. The departure of this track from a straight horizontal line illustrates
problematic excessive uncompensated residual migration. Figure 5 illustrates how a
conventional autofocus algorithm (PGA in this case) is unable to properly correct for this,and causes the “double-vision” effect.
A general presumption in the SAR community is that any motion measurement errors are
less than the range resolution of the radar. This infers that the track in Figure 4 is
contained within a single row of resolution cells (which it is not). This further allows theconventional practice of autofocus operations being adequately applied to fully range-
compressed images. Since autofocus typically requires iteratively processing the data
into an image, efficiency is gained by repeating only the azimuth compression, and not
the range compression operations. This presupposes that, for example, a radar with 2 cm
nominal wavelength and 30 cm range resolution will never see more than ( ) r ρ λ π 4 =
60π radians of phase error.
Figure 1. Photograph of SAR test and evaluation site.

7/31/2019 Autofocus Correction of Excessive Migration in SAR
http://slidepdf.com/reader/full/autofocus-correction-of-excessive-migration-in-sar 9/28
- 9 -
Figure 2. SAR image of test site using PFA processing but no autofocus.
Figure 3. Range-compressed data with deterministic migration corrected.
7/31/2019 Autofocus Correction of Excessive Migration in SAR
http://slidepdf.com/reader/full/autofocus-correction-of-excessive-migration-in-sar 10/28
- 10 -
Figure 4. Detail of trihedral target reflector track in range-compressed data.
Figure 5. Conventional PGA autofocus applied to image of Figure 2.
Jakowatz, et. al,3
state that “maintaining relative-position uncertainties of the SAR platform to well less than a range-resolution cell size (e.g., 1 meter) is easily achievable
by modern inertial navigation systems.” Furthermore, “[i]n practice the size of the [range
error] shift, εc/2, is a small fraction of the resolution cell size.”
Carrara, et. al,4
describe several different autofocus techniques, with all but one operatingon range-compressed data. The exception is a technique called Prominent Point
Processing, which they describe being “considered a refocus technique, although it is nottechnically automatic.” This technique depends on selecting scatterers in the image thatare point-like, otherwise risking “serious degradation if the scatterer selected as the
prominent point is not a point scatterer but rather a more complex target within a range
resolution cell.” Furthermore, “Selection of the prominent point is typically aninteractive process requiring user inputs; however, the state of the art is progressing
toward automation of this process.” Nevertheless, no autofocus techniques are described

7/31/2019 Autofocus Correction of Excessive Migration in SAR
http://slidepdf.com/reader/full/autofocus-correction-of-excessive-migration-in-sar 11/28
- 11 -
or discussed that mitigate excessive residual migration in general SAR images, especially
those without clear and distinct point-like target features.
In addition to motion measurement errors, longer ranges impart greater deleterious
atmospheric effects to the data, whereby electrical path lengths depart significantly fromthe physical path lengths. The electrical path length is related to the actual path length by
the ratio of the average wavelength to the nominal wavelength, and accounts for
atmospheric dielectric variations, refraction and other wave propagation phenomena.Since coherence depends on electrical path lengths, problematic errors similar to motion
measurement errors may be induced by perturbations in the atmosphere’s transmission
characteristics in spite of perhaps otherwise adequate motion measurements.
Denny & Scott5
claim that “the performance of future high-resolution SAR modes will be
limited by anomalous propagation effects, rather than by platform measurement errors or focusing algorithm limitations, or RF wavelength.” Their conclusion is based on the
assumption that uncompensated apparent (due to anomalous propagation ) range
variations equal to the range resolution is “the rule-of-thumb limit that can be achieved,using autofocus.”
While the presumption of apparent range errors being less than the radar’s range
resolution is often true, modern high-performance SARs do sometimes exceed this
criterion. The drive for finer resolutions, longer ranges, and less expensive (and less
accurate) motion measurement systems will increasingly cause situations where a target’secho return effectively exhibits a residual migration error exceeding one or more range
resolution cells during the course of the synthetic aperture. This would doom to failure
any autofocus scheme that presupposes otherwise, which includes autofocus schemes thatoperate only on fully range-compressed data.
While most autofocus algorithms apply a phase-correction to range-compressed data, themore accurate remedy is to apply a range-shift to the range-compressed data.
Burns & Cordaro6
correct deterministic range migration during the course of image
formation by a shifting operation that is implemented via multiplying the uncompressedrange vectors with a parameter dependent specific sinusoid. However residual migration
due to motion measurement errors is not addressed.
Carrera, et. al,4
do use a track of a prominent point’s peak location in the range
compressed image to “adjust the frequency of each pulse in the original signal history.”As previously stated, however, determining the amount of adjustment for their technique
depends on tracking a prominent point-like scatterer, thereby limiting its utility to SAR images with this characteristic.

7/31/2019 Autofocus Correction of Excessive Migration in SAR
http://slidepdf.com/reader/full/autofocus-correction-of-excessive-migration-in-sar 12/28
- 12 -
2. Overview & Summary
Two tasks are at hand.
The initial task is to properly measure the residual migration and phase error. This may be accomplished by either of two methods.
The first measurement method recognizes that a phase error function in the azimuth
direction cannot be ascertained from a fully range-compressed data set, since the error
energy is spread across several range resolution widths. Therefore it must occur under the constraint that for extracting the autofocus correction vector, the range resolution
must be coarse enough to encompass the phase error. Put another way, the phase error
must be measured on data that is not fully range compressed, i.e. radar data with
degraded range resolution. This can be done by using only part of each return echo, thatis, a portion of the fast-time vector. It can also be done by blurring the fully range-
compressed data in the range dimension. If range subapertures are used for imageformation, then perhaps a single range subaperture might be employed for phase-error measurement. Once an accurate phase error has been measured then the corresponding
migration effects can be calculated.
An alternate, or second measurement method determines the actual migration effects by
correlating range-compressed pulses with each other. This process of correlating range
profiles obviates the need for identifying and selecting a prominent scatterer, allowingimproved performance on SAR images not containing prominent points.
The final task begins once the migration effects have been adequately characterized. A
compensation must then be properly applied to the SAR data. The excessive range
migration must be mitigated, that is, excessive range shifts in range-compressed datamust be eliminated. The echo returns must be shifted back into proper position. Range
shifts in range-compressed data are achieved by multiplying the uncompressed data with
a fast-time-dependent phase shift, that is, a complex sinusoid that shifts frequency inaddition to phase in the manner of the Prominent Point Processing method.
Consequently, the data correction operation must occur prior to full range compression.Optimally, it is applied to the phase-history data prior to any range compression at all, but
might also be done in only partially range-compressed data when range subapertures are
employed.
7/31/2019 Autofocus Correction of Excessive Migration in SAR
http://slidepdf.com/reader/full/autofocus-correction-of-excessive-migration-in-sar 13/28
- 13 -
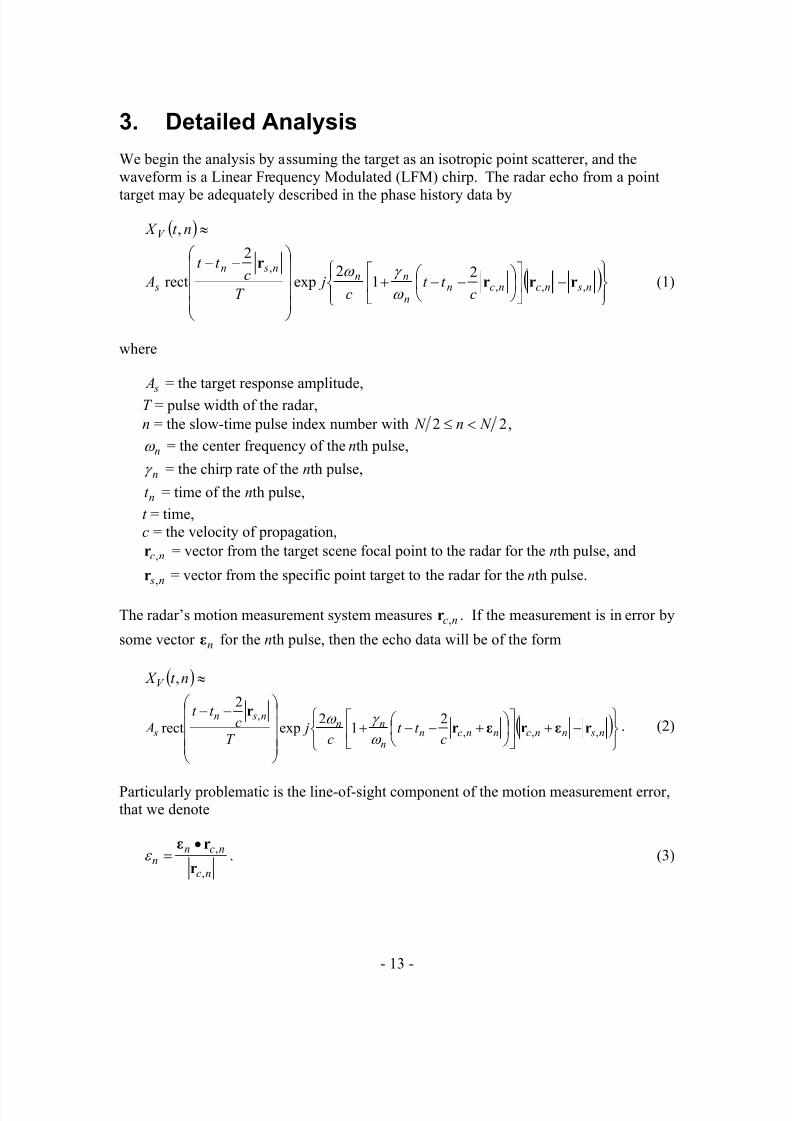
3. Detailed Analysis
We begin the analysis by assuming the target as an isotropic point scatterer, and the
waveform is a Linear Frequency Modulated (LFM) chirp. The radar echo from a point
target may be adequately described in the phase history data by
( ) ≈nt X V ,
( )
−
−−+
−−
n sncncnn
nnn sn
sc
t t c
jT
ct t
A ,,,
, 21
2exp
2
rect rrr
r
ω
γ ω (1)
where
s A = the target response amplitude,
T = pulse width of the radar,
n = the slow-time pulse index number with 22 N n N <≤ ,
nω = the center frequency of the nth pulse,
nγ = the chirp rate of the nth pulse,
nt = time of the nth pulse,
t = time,
c = the velocity of propagation,
nc,r = vector from the target scene focal point to the radar for the nth pulse, and
n s,r = vector from the specific point target to the radar for the nth pulse.
The radar’s motion measurement system measures nc,r . If the measurement is in error by
some vector nε for the nth pulse, then the echo data will be of the form
( ) ≈nt X V ,
( )
−+
+−−+
−−
n snncnncnn
nnn sn
sc
t t c
jT
ct t
A ,,,
, 21
2exp
2
rect rεrεr
r
ω
γ ω . (2)
Particularly problematic is the line-of-sight component of the motion measurement error,that we denote
nc
ncnn
,
,
r
rε •=ε . (3)
7/31/2019 Autofocus Correction of Excessive Migration in SAR
http://slidepdf.com/reader/full/autofocus-correction-of-excessive-migration-in-sar 14/28
- 14 -
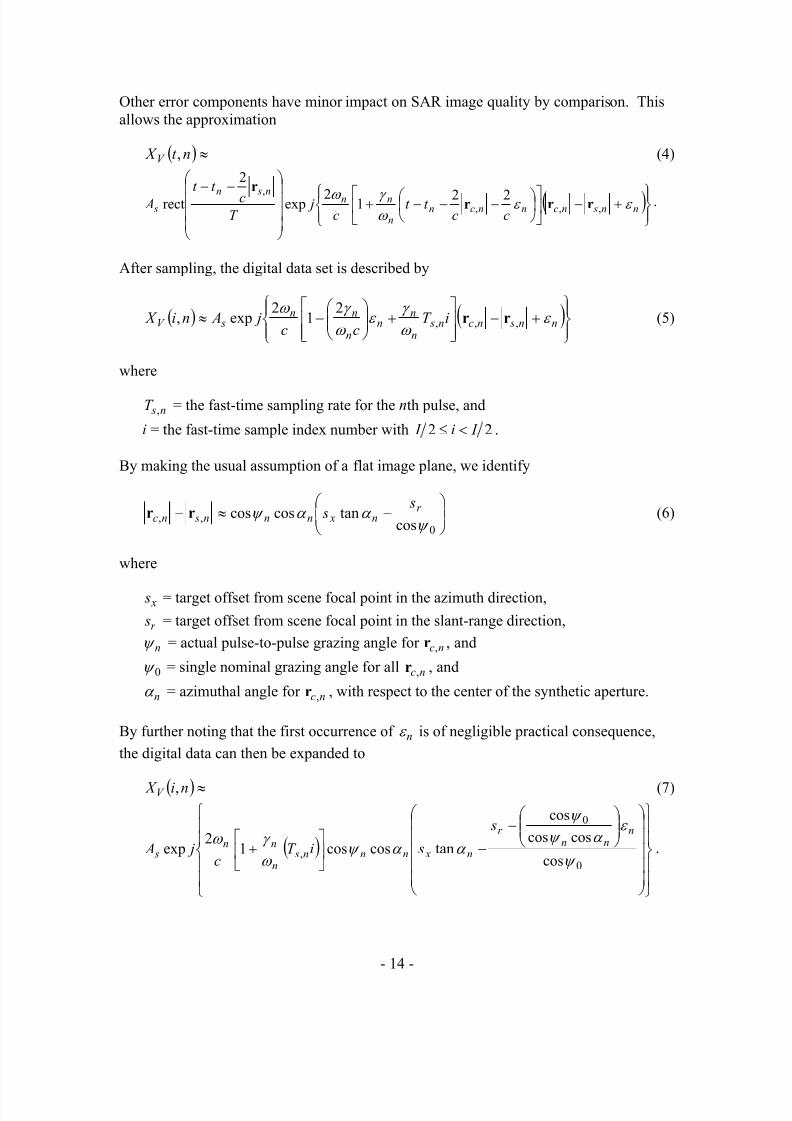
Other error components have minor impact on SAR image quality by comparison. This
allows the approximation
( ) ≈nt X V , (4)
( )
+−
−−−+
−−
nn sncnncnn
nnn sn s
cct t
c j
T c
t t
A ε ε ω γ ω
,,,, 2212exp
2
rect rrr
r
.
After sampling, the digital data set is described by
( ) ( )
+−
+
−≈ nn sncn s
n
nn
n
nn sV iT
cc j Ani X ε
ω
γ ε
ω
γ ω ,,,
21
2exp, rr (5)
where
n sT , = the fast-time sampling rate for the nth pulse, and
i = the fast-time sample index number with 22 I i I <≤ .
By making the usual assumption of a flat image plane, we identify
−≈−
0,,
costancoscos
ψ α α ψ r
n xnnn snc
s srr (6)
where
x s = target offset from scene focal point in the azimuth direction,
r s = target offset from scene focal point in the slant-range direction,
nψ = actual pulse-to-pulse grazing angle for nc,r , and
0ψ = single nominal grazing angle for all nc,r , and
nα = azimuthal angle for nc,r , with respect to the center of the synthetic aperture.
By further noting that the first occurrence of nε is of negligible practical consequence,
the digital data can then be expanded to
( ) ≈ni X V , (7)
( )
−
−
+
0
0
,cos
coscos
cos
tancoscos12
expψ
ε α ψ
ψ
α α ψ ω
γ ω n
nnr
n xnnn sn
nn s
s
siT c
j A .
7/31/2019 Autofocus Correction of Excessive Migration in SAR
http://slidepdf.com/reader/full/autofocus-correction-of-excessive-migration-in-sar 15/28
- 15 -
Deterministic migration is compensated by sampling/resampling the data onto a
rectangular grid prior to application of efficient Fast Fourier Transform techniques. Thismay be accomplished by familiar methods and effects
iT iT snnn sn ′= 00,0, coscoscos ψ γ α ψ γ , and (8)
( ) nd iT n snnn ′=′+ α ψ ω α ψ γ α ψ ω 0000,0 costancoscoscos (9)
where
α d = a nominal azimuth sampling frequency scale factor,
0ω = the nominal center frequency,
0γ = the nominal chirp rate,
0, sT = the nominal fast-time sampling rate,
i′ = the new fast-time sampling index with 22 I i I ′<′≤′ ,
n′ = the new slow-time sampling index with 22 N n N ′<′≤′ .
While this corrects for deterministic migration, it also impacts the nature of nε in the
‘corrected’ data. By defining nε as specifically a function of nα we can calculate its
dependence on the new indices as
( )
′
+
′==
iT
nd
snnnnn
0
0,0
00 cos
coscosatan
ω
γ
ψ
α ψ
ω
ω
α ε α ε ε . (10)
For typical resolutions where the range of nα is small, this approximates to
′
+
′≈
iT
nd
snnn
n
0
0,0
00 cos
coscos
ω
γ
ψ
α ψ
ω
ω
α ε ε . (11)
A byproduct of the sampling/resampling is typically thatnnn α ψ ψ ω ω coscoscos 00= .
The error then becomes
′
+
′≈
iT
nd
sn
0
0,01
ω
γ
α ε ε . (12)

7/31/2019 Autofocus Correction of Excessive Migration in SAR
http://slidepdf.com/reader/full/autofocus-correction-of-excessive-migration-in-sar 16/28
- 16 -
Data corrected for deterministic migration to facilitate image formation using for
example the Polar Format Algorithm yields
( ) ( ) ( )
′−−′′−−′≈′′ ′′′′ inr inr s
x sV sc
i sc
T nd s
c j Ani X ,
0,
0,00
0 22cos
2exp, ε
ω ε
γ α ψ
ω (13)
where the error term has been slightly modified and become
nnn
in ε α ψ
ψ ε
=′ ′′
coscos
cos 0, . (14)
As a practical matter, it is often adequate to assume
nin ε ε ≈′ ′′, . (15)
By recognizing that the achievable nominal resolutions of this data set are
I T
c
sr ′
=0,02
2
γ
π ρ = slant range resolution, and (16)
00 cos2
2
ψ α ω
π ρ
d N
ca ′
= = azimuth resolution, (17)
and ignoring a constant phase term, the data model may be rewritten as
( )
′+′
′−
′−′
′≈′′ ′′
′′in
r
inr
a
x sV i
s
I
n s
N
j Ani X ,
0
, 422exp, ε
λ
π
ρ
ε π
ρ
π (18)
where the nominal wavelength 00 2π λ c= .
A first order expansion of in ′′′ ,ε yields approximately
( )( )
iid
d
d
d nd i
id
d n
n
ninnin ′
′
+′≈′
′
′+′≈′ ′′
′′′α
α
α ε α ε
ε ε ε
,0,, (19)
or approximately
( )( )
( ) ind T
d
d nd
s
n
nin ′′
−′≈′ ′′ α
ω
γ
α
α ε α ε ε
0
0,0, . (20)
This allows the data model to be rewritten as

7/31/2019 Autofocus Correction of Excessive Migration in SAR
http://slidepdf.com/reader/full/autofocus-correction-of-excessive-migration-in-sar 17/28
- 17 -
( ) ≈′′ ni X V ,
( )( )
( )
′+′
−′
−′
′+′
′nd i
snd d
d nd
I n
s
N j A
r
r n
n
a
x s α ε
λ
π
ρ
α α
α ε α ε
π
ρ
π
0
422exp . (21)
Recall that the Discrete Fourier Transform (DFT) of a finite-length complex exponential
is given by
′
−Ω′
⇔′Ω ′ v I
I i j I
π
π
2
2csincexp (22)
where
v = the frequency index, and
( )( )
( ) I x j
I x
x x I ′−
′=′ π
π
π exp
sin
sincsinc .
Note that for small ( ) I x ′ this approaches
( )( )
( ) x
x I x I x
I x I π
π sin)sinc(csinc
small
′=′ →
′′ (23)
and has peak value at 0= x , and effective unit width, that is, the bulk of its energy falling
in the domain 2121 <<− x . Energy outside these limits is generally unusable in
addition to being undesirable.
Range compression on our data model entails performing a DFT over index i′ . This
yields
( ) ≈′nv X RC ,
( )( )
( )
′+′
′
−
−′
−′
′ nd n s
N jv
snd d
d nd
Aa
x
r
r n
n
I s α ε λ
π
ρ
π
ρ
α α
α ε α ε
0
42expcsinc . (24)
Although we developed this expression by range-compressing the resampled phase
history data, it should also be obvious that the same form for the data can be achieved by
beginning with an image and undoing the azimuth compression step. Furthermore,
resampled pseudo-phase history data can be generated by undoing the range compressionas well.
This expression has a peak response in range at the index value

7/31/2019 Autofocus Correction of Excessive Migration in SAR
http://slidepdf.com/reader/full/autofocus-correction-of-excessive-migration-in-sar 18/28
- 18 -
( )( )
−′
−′
=r
r n
n
peak
snd d
d nd
v ρ
α α
α ε α ε
(25)
with energy concentrated in a region of unit width around the peak. We note that this
strip is a function of n′ , that is, the peak location v peak depends on (migrates with) n′ .For a single index value v to harbor all the energy requires the constraint
( )( )
r n
n nd d
d nd ρ α
α
α ε α ε ≤′
−′ . (26)
This is the customary presumption for autofocus algorithms, as it allows the further
approximation
( ) ( )
′+′
′
−
−≈′ ′ nd n s
N jv
s Anv X
a
x
r
r I s RC α ε
λ
π
ρ
π
ρ 0
42expcsinc, (27)
where the original motion error manifests itself only as an azimuth phase error in the
range-compressed data, and furthermore is confined to a single range bin for any one
scatterer.
This report concerns itself with mitigating the effects of nε when we violate the
customary constraint in equation (26) and allow excessive migration.
The first step is to characterize the error, that is, finding nε or equivalent. The secondstep is to correct the pre-range-compressed data using this information, and then continue
image formation. We describe two techniques for finding nε and correcting the data.
Technique 1:
The essence of this technique is to measure a phase error, and calculate a correspondingrange-shift. Then phase and frequency corrections are applied to the data to correct both.
We begin this technique by noting that if equation (26) is satisfied, then we can find nε
in any number of proven manners that rely on a scatterer’s energy remaining in a single
range resolution cell. One technique with wide popularity is the robust aforementioned
Phase Gradient Autofocus algorithm.
The essence of this technique for finding nε observes that if equation (26) is violated, we
can process the data to a new coarser range resolution r ′ so that equation (26) is met
with the new resolution. Once done, then nε can be found from the new range
compressed (to the coarser resolution) data using existing techniques such as PGA.
7/31/2019 Autofocus Correction of Excessive Migration in SAR
http://slidepdf.com/reader/full/autofocus-correction-of-excessive-migration-in-sar 19/28
- 19 -
The coarser range-resolution may be accomplished by any of several means. For
example, the complex data can be filtered or blurred in the range dimension.Alternatively, a subset (in the fast-time dimension) of the phase history data set can be
used that limits resolution to the desired r ρ ′ . In any case, it becomes crucial to select a
r ′ large enough to accommodate any expected nε .
Once the motion error nε has been estimated, and by extension in ′′′ ,ε has been estimated,
the pre-range-compressed data can be corrected by multiplying the data in the manner
( ) ≈′′ ni X V ,corrected, ( )
′−′
′
′−′′ ′′
′′in
r
inV i
I jni X ,
0
, 42exp, ε
λ
π
ρ
ε π (28)
or approximately
( ) ≈′′ ni X V ,corrected,
( )
( )( )
( )
′−′
′
−′
′−′′ nd i
nd d
d nd
I jni X
r
n
n
V α ε λ
π
ρ
α α
α ε α ε
π
0
42exp, (29)
which yields the desired error-free model
( )
′
′−′
′≈′′ i
s
I n
s
N j Ani X
r
r
a
x sV
ρ
π
ρ
π 22exp,corrected, . (30)
Data corrected this way may be processed into an image in the usual manner, for example
with a two-dimensional Fourier transform.
Note that the data correction is both a fast-time frequency shift and a phase shift. While
typical autofocus algorithms are iterative for optimum performance, in practice thefrequency correction of a single iteration is often adequate, although phase correction
generally derives additional benefit from further iterations. Once residual migration
effects are contained within a range resolution cell, then conventional iterative autofocustechniques may be employed to “finish” the job.
A block diagram of this technique is given in Figure 6. The process begins with the phase history data. If significant deterministic migration exists, then it will first need to
be mitigated with resampling. For relatively coarse resolution images, resampling may
not be necessary. The phase history data is then formed into an image with a suitablycoarse range resolution. Many conventional autofocus algorithms require some
preliminary analysis of a completed (formed) image. The coarse-range-resolution image
is then input to a conventional autofocus algorithm such as PGA. The phase error

7/31/2019 Autofocus Correction of Excessive Migration in SAR
http://slidepdf.com/reader/full/autofocus-correction-of-excessive-migration-in-sar 20/28
- 20 -
function is extracted, and the motion error nε (or equivalent) is ascertained. Phase and
frequency corrections are then applied to the entire phase history data. Image formationis then performed to the resolution that the data allows. Finally, a conventional autofocus
algorithm such as PGA may be applied to the full-resolution image to further refine the
focus, should the image require this.
Results of this technique are illustrated in Figure 7.
We note that even if only a phase correction (and not the frequency correction) is applied
with the error found in this manner, the image often still exhibits a marked improvementover those with only conventional autofocus techniques applied. This is illustrated in
Figure 8 where the double-image degradation is corrected, although the trihedral
reflectors are not as well focused as in Figure 7.
SAR Image Formation
with coarse range
resolution
Conventional Autofocus
phase error extraction
Phase & Frequency
Correction
Resampling to
Rectangular Grid
SAR Image Formation
with full range resolution
Conventional Autofocus
on Range Compressed
Image
Phase History
Data Collection
Figure 6. Block diagram detailing processing steps for Technique 1.

7/31/2019 Autofocus Correction of Excessive Migration in SAR
http://slidepdf.com/reader/full/autofocus-correction-of-excessive-migration-in-sar 21/28
- 21 -
Figure 7. Results of autofocus using technique 1 applied to SAR image.
Figure 8. Suboptimal autofocus with only phase correction applied.
While we have discussed finding the quantity nε , it should be obvious that any quantity
proportional to nε would also suffice.

7/31/2019 Autofocus Correction of Excessive Migration in SAR
http://slidepdf.com/reader/full/autofocus-correction-of-excessive-migration-in-sar 22/28
- 22 -
If range subapertures are used for image formation, then perhaps a single range
subaperture might be employed for phase-error measurement.
Technique 2:
The essence of this technique is to measure a range shift directly in the range-compresseddata, and then compensate the phase history data with phase and frequency corrections.
This technique is reminiscent of the Prominent Point Processing (PPP), but withimportant and substantial differences. PPP requires selecting a point-like target to
“track” in the range-compressed data. This is inadequate for a general purpose autofocus
algorithm because prominent point-like targets may not exist in the field of view of the
radar. Instead, to overcome the shortcomings of PPP, we propose correlating the entirerange profile to establish a shift-gradient in the slow-time dimension.
Note that the range profile of a single point scatterer is given by
( )( )
−
−′
−′
≈ ′ v
snd d
d nd
Ar
r n
n
I s ρ
α α
α ε α ε
csinc profilerange . (31)
As the error varies on a pulse-to-pulse basis, so does the peak value position for index v.
We define the total apparent shift as
( )( )
nd d
d nd
n
n
n
′
−′≈′ α
α
α ε α ε ε
,apparent
. (32)
This is true for all scatterers at all ranges. In fact, as the peak varies on a pulse-to-pulse
basis, so does the entire range profile shift proportionately. The nature of SAR data isthat adjacent range profiles are very similar in shape, with the shape similarity
diminishing with larger separations in index n′ .
Comparing the profiles for different pulses n′ will reveal a shift in the profiles that can
only be dependent on changes in n′,apparentε . Consequently, by comparing adjacent
pulses for the entire data set, a gradient n′∆ ,apparentε is determined. By accumulating the
gradients n′∆ ,apparentε , the actual function n′,apparentε can be calculated to within aninconsequential constant bias.
In practice, the pulse-to-pulse error gradient n′∆ ,apparentε is very small, and difficult to
measure accurately. However, several enhancements to the basic procedure alleviate this
difficulty.
7/31/2019 Autofocus Correction of Excessive Migration in SAR
http://slidepdf.com/reader/full/autofocus-correction-of-excessive-migration-in-sar 23/28
- 23 -
First, the range profile can be interpolated to a much finer spacing by some factor osa to
allow measuring very small shifts in the correlation process. This interpolation can beimplemented by zero-padding the pre-range-compressed data set in the fast-time
dimension to some new length I aos ′ prior to the initial range compression, as is well
known in the art of digital signal processing.
Second, since the gradient n′∆ ,apparentε is in practice a relatively smooth function, it need
not necessarily be calculated between adjacent pulses. It is generally sufficient to
calculate an approximate gradient over a fairly large number of pulses, under the
presumption that if some pulse n′ is compared with some other pulse ( )0nn +′ , then the
shift between these pulses is amplified from the pulse-to-pulse gradient by a factor 0n .
That is, we presume that
0
,apparent,apparent,apparent
0
n
nnnn
′+′′
−≈∆
ε ε ε . (32)
A rule-of-thumb for selecting 0n based on minimum slope arguments for a quadratic
error might be
( )osa N n 220 ′≥ (33)
although values for 0n even as small as 1/10 the lower limit often work well in practice.
Once a gradient has been ascertained, an accumulation of the gradients yields an
approximation of the actual function n′,apparentε to within an inconsequential constant
bias. The n′,apparentε can be averaged to calculate a bias which can then be subtracted.
Since n′,apparentε is generally a smooth function, the estimate of n′,apparentε using this
technique can be smoothed to remove discontinuities and other unlikely anomaliesresulting from measurements of noisy data.
As before, in practice the frequency correction to the pre-range-compressed data needonly be adequate to align the range profiles to within a range resolution cell width. With
frequency corrections applied, additional and perhaps more accurate phase corrections
can be then calculated using conventional autofocus techniques in the usual manner.
A block diagram of the processing steps for this technique is given in Figure 9. As withthe first technique, the process begins with the phase history data. If significant
deterministic migration exists, then it will first need to be mitigated with resampling. For
relatively coarse resolution images, resampling may not be necessary. The data is then
range-compressed with some degree of oversampling. The resulting range profiles arethen correlated with some non-adjacent neighbor to enhance sensitivity to shift gradient.
The gradients are then accumulated and smoothed to estimate the residual migration.
This estimate is then used to correct the phase history data which then undergoes image

7/31/2019 Autofocus Correction of Excessive Migration in SAR
http://slidepdf.com/reader/full/autofocus-correction-of-excessive-migration-in-sar 24/28
- 24 -
formation in the usual manner. Subsequent conventional autofocus algorithms then may
be applied to further focus the image.
The results of this technique are illustrated in Figure 10.
Range compression
(oversampled)
Determine shift gradient
by Profile Correlation
Phase & Frequency
Correction
Resampling to
Rectangular Grid
SAR Image Formation
with full range resolution
Conventional Autofocus
on Range Compressed
Image
Accumulate gradient
and smooth to estimate
residual migration
Phase HistoryData Collection
Figure 9. Block diagram illustrating processing steps for technique 2.

7/31/2019 Autofocus Correction of Excessive Migration in SAR
http://slidepdf.com/reader/full/autofocus-correction-of-excessive-migration-in-sar 25/28
- 25 -
Figure 10. Results of autofocus using technique 2 applied to SAR image.
It should be noted that while the foregoing embodiments of migration correction
autofocus begin with phase history data, such data may not be available or convenient.
Undoing the azimuth and range compression operations on a complex image provides an
equivalent to resampled phase history data that will generally suffice for this purpose. Inthis manner, even an image that has had conventional autofocus algorithms applied to it
may be further corrected by this second technique.
Furthermore, techniques 1 and 2 may be combined and sequentially applied if proper
relationships are maintained between error phase and frequency.

7/31/2019 Autofocus Correction of Excessive Migration in SAR
http://slidepdf.com/reader/full/autofocus-correction-of-excessive-migration-in-sar 26/28
- 26 -
4. Conclusions
The following essential elements of this report are summarized.
• Excessive residual migration due to motion errors, or apparent motion errors due infact to atmospheric propagation phenomena, are not correctable with conventional
autofocus algorithms.
• Excessive migration errors require corrections to be applied before final range
compression.
• Excessive migration errors require both a frequency correction as well as a phase
correction to be applied before final range compression.
• Correcting excessive migration in polar-reformatted data requires correcting for both
the motion error and the azimuthal derivative of the motion error.
• Applying only a properly ascertained phase correction might improve the image, but
not to the greatest extent possible.
• Excessive migration can be determined by performing conventional autofocus stepson a reduced-range-resolution image, provided the reduced range-resolution is coarser
than the residual migration.
• Excessive migration can also be determined by correlating range profiles in range-
compressed data.
• Sensitivity to range profile shifts, and hence migration, can be enhanced byoversampling the range compressed data in the range dimension.
• Sensitivity to profile shifts, and hence migration, can also be enhanced by correlating
range profiles that are separated in the slow-time dimension.

7/31/2019 Autofocus Correction of Excessive Migration in SAR
http://slidepdf.com/reader/full/autofocus-correction-of-excessive-migration-in-sar 27/28
- 27 -
5. References
1
J. L. Walker, “Range-Doppler Imaging of Rotating Objects,” IEEE Trans. on Aerospaceand Electronic Systems, AES-16 (1), 23-52, (1980).
2D. E. Wahl, P. H. Eichel, D. C. Ghiglia, C. V. Jakowatz Jr., “Phase Gradient Autofocus
– A Robust Tool for High Resolution SAR Phase Correction”, IEEE Transactions on
Aerospace and Electronic Systems, Vol. 30, No. 3, pp.827-834, July, 1994.
3C. V. Jakowatz Jr., D. E. Wahl, P. H. Eichel, D. G. Ghiglia, P. A. Thompson, Spotlight-
Mode Synthetic Aperture Radar: A Signal Processing Approach, ISBN 0-7923-9677-4,Kluwer academic Publishers, 1996.
4W. G. Carrara, R. S. Goodman, R. M. Majewski, Spotlight Synthetic Aperture Radar
Signal Processing Algorithms, ISBN 0-89006-728-7, Artech House, Inc., 1995.
5M. Denny, I. Scott, “Anomalous Propagation Limitations to High-Resolution SAR
Performance”, Proceedings of the 2002 IEEE Radar Conference, Long Beach, CA, USA,
p. 249-254, 22-25 April 2002.
6Bryan L. Burns, J. Thomas Cordaro, “Imaging synthetic aperture radar”, US Patent
5,608,404, March 4, 1997.

7/31/2019 Autofocus Correction of Excessive Migration in SAR
http://slidepdf.com/reader/full/autofocus-correction-of-excessive-migration-in-sar 28/28
DISTRIBUTION
Unlimited Release
1 MS 0509 M. W. Callahan 23001 MS 0529 B. L. Remund 23401 MS 0529 B. L. Burns 2340
1 MS 0519 W. H. Hensley 2342
1 MS 0519 S. D. Bensonhaver 2342
1 MS 0519 T. P. Bielek 23421 MS 0519 A. W. Doerry 2342
1 MS 0519 D. Harmony 2342
1 MS 0519 J. A. Hollowell 2342
1 MS 0519 S. S. Kawka 23421 MS 0519 M. S. Murray 2342
1 MS 0519 B. G. Rush 2342
1 MS 0519 D. G. Thompson 23421 MS 0519 L. M. Wells 2344
1 MS 0519 D. L. Bickel 2344
1 MS 0519 J. T. Cordaro 2344
1 MS 0519 J. M. Delaurentis 2344
1 MS 0519 A. Martinez 23441 MS 0529 K. W. Sorensen 2345
1 MS 0529 D. F. Dubbert 2345
1 MS 0529 F. E. Heard 2345
1 MS 0529 G. R. Sloan 23451 MS 0519 S. M. Becker 2348
1 MS 0519 S. M. Devonshire 2348
1 MS 0519 P. A. Dudley 23481 MS 0519 M. W. Holzrichter 2348
1 MS 0519 G. D. Martin 2348
1 MS0519 D. M. Small 23481 MS 0519 A. D. Sweet 23481 MS 0519 M. E. Thompson 2348
1 MS 0519 B. L. Tise 2348
1 MS 0501 S. M. Kohler 2334
1 MS 0501 M. C. Dowdican 23381 MS 0501 T. J. Kim 2338
1 MS 1207 C. V. Jakowatz, Jr. 59371 MS 1207 N. E. Doren 5937
1 MS 1207 P. H. Eichel 5937
1 MS 1207 I. A. Erteza 5937
1 MS 1207 D. E. Wahl 5937
1 MS 0328 F. M. Dickey 2612
1 MS 9018 Central Technical Files 8945-1
2 MS 0899 Technical Library 96161 MS 0612 Review & Approval Desk 9612
for DOE/OSTI
1 Randy Bell DOE NNSA NA-22
1 Eric Sander DOE NNSA NA-22