auto injury claims the what, why and how of it all richard a. derrig opal consulting llc adam...
TRANSCRIPT

AGENDA
WHAT: The characteristics of current day
Auto Injury Coverges,1st and 3rd Party
Why: The Determinants of a Total
Compensation Settlement
How: The Negotiation System to Settle
3rd Party Injury Claims

Bodily Injury Claims per 100 Accidents
0%
10%
20%
30%40%
50%
60%
70%
80%
Fre
q R
atio
CA
MA
MI
NY
CW

Auto Injury Issues
• IRC Studies (1977+, latest 2002 CY)
• AIB Studies (1986+, latest 1996 AY)
• Medicals Dominate
• Injury & Treatment Types
• General Damages (Pain & Suffering)
• Claim Investigation
• Suspicion of Fraud and Build-Up

WHY
• Special (Claimed) and General Damages
• Economic and Non-Economic Damages
• Circumstances of The Claim
• Attorneys
• Fraud and Build-Up

BI Settlement Issues
• Investigation
• Suspicion of Fraud and Build-up
• Settlement Negotiation
• Low Impact Collision
• Passengers
• Bad Faith
• Evolution Over Time

Injury Type Changes
Inj 89 96
Fracture 14% 5%
Inpatient 7% 4%
Serious Visible 14% 2%
Prior Inj. 6% 27%
Source: AIB Final Report (2003)

Total Claimed Medical Charges by Type of Service
1996 BI Claims
Other1%
ER 10%
Inpatient17%
Ambulance2%
Outpatient70%
MO & MI 22%
PT & PO 14%
MD only 11%
CH & CO 23%

General Damages
• Special Damages are Claimant Economic Losses– Medical Bills– Wage Loss– Other Economic
• General Damages are Residual of Negotiated Settlement Less Specials– “Three Times Specials” is a Myth

Figure 8-31996 Settlement/Specials Ratio Distribution
0.00%
2.00%
4.00%
6.00%
8.00%
10.00%
12.00%
14.00%
16.00%
18.00%
20.00%
0 to 0.5 0.5 to 1 1 to 1.5 1.5 to 2 2 to 2.5 2.5 to 3 3 to 3.5 3.5 to 4 4 to 4.5 4.5 to 5 5 to 5.5 5.5 to 6 6 to 6.5 6.5 to 7 7 to 7.5 7.5 to 8 8 to 8.5 8.5 to 9 9 to 9.5 9.5 to 10 10 to 20 20 to 30
Settlement/Specials Ratio
% o
f C
laim
s
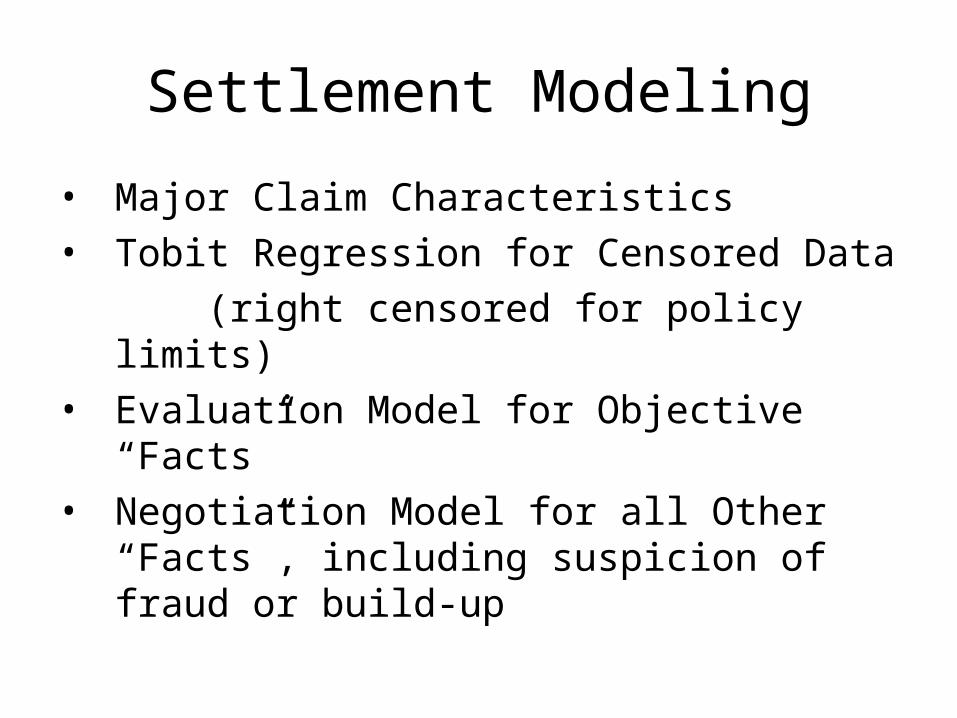
Settlement Modeling
• Major Claim Characteristics
• Tobit Regression for Censored Data
(right censored for policy limits)
• Evaluation Model for Objective “Facts”
• Negotiation Model for all Other “Facts”, including suspicion of fraud or build-up
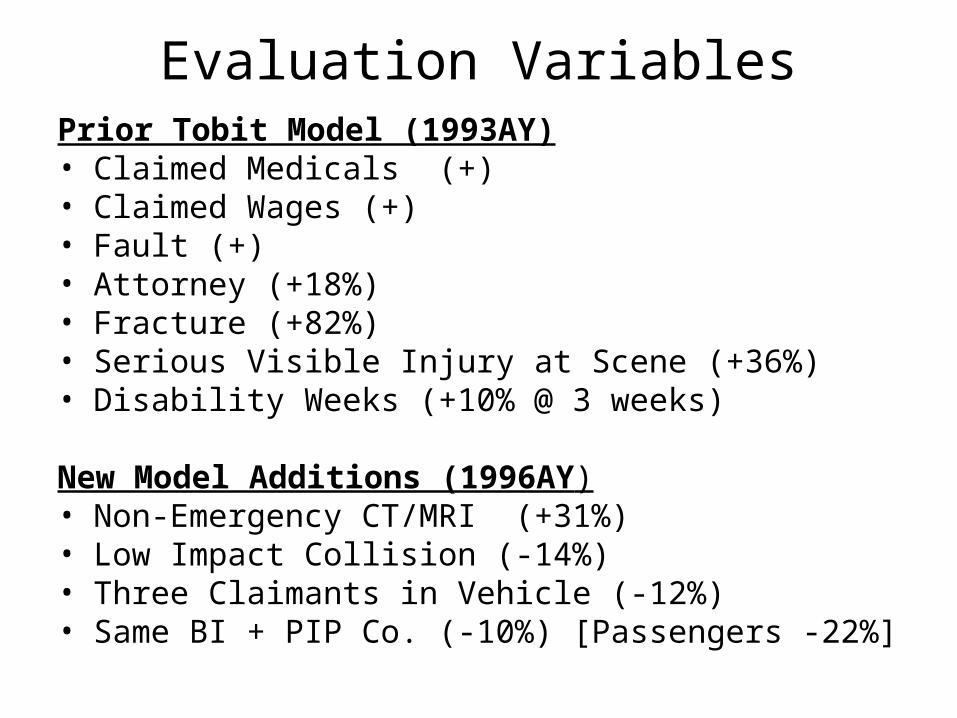
Evaluation VariablesPrior Tobit Model (1993AY)• Claimed Medicals (+)• Claimed Wages (+)• Fault (+)• Attorney (+18%)• Fracture (+82%)• Serious Visible Injury at Scene (+36%)• Disability Weeks (+10% @ 3 weeks)
New Model Additions (1996AY)• Non-Emergency CT/MRI (+31%)• Low Impact Collision (-14%)• Three Claimants in Vehicle (-12%)• Same BI + PIP Co. (-10%) [Passengers -22%]

Negotiation VariablesNew Model Additions (1996AY)
• Atty (1st) Demand Ratio to Specials (+8% @ 6 X Specials)• BI IME No Show (-30%) • BI IME Positive Outcome (-15%)• BI IME Not Requested (-14%)• BI Ten Point Suspicion Score (-12% @ 5.0 Average)• [1993 Build-up Variable (-10%)]• Unknown Disability (+53%)• [93A (Bad Faith) Letter Not Significant]• [In Suit Not Significant]• [SIU Referral (-6%) but Not Significant]• [EUO Not Significant]
Note: PIP IME No Show also significantly reduces BI + PIP by discouraging BI claim altogether (-3%).

Total Value of Negotiation Variables
Total Compensation Variables Avg. Claim/Factor
Evaluation Variables $13,948
Disability Unknown 1.05
1st Demand Ratio 1.09
BI IME No Show 0.99
BI IME Not Requested 0.90
BI IME Performed with Positive Outcome 0.97
Suspicion 0.87
Negotiation Variables 0.87
Total Compensation Model Payment $12,058
Actual Total Compensation $11,863
Actual BI Payment $8,551
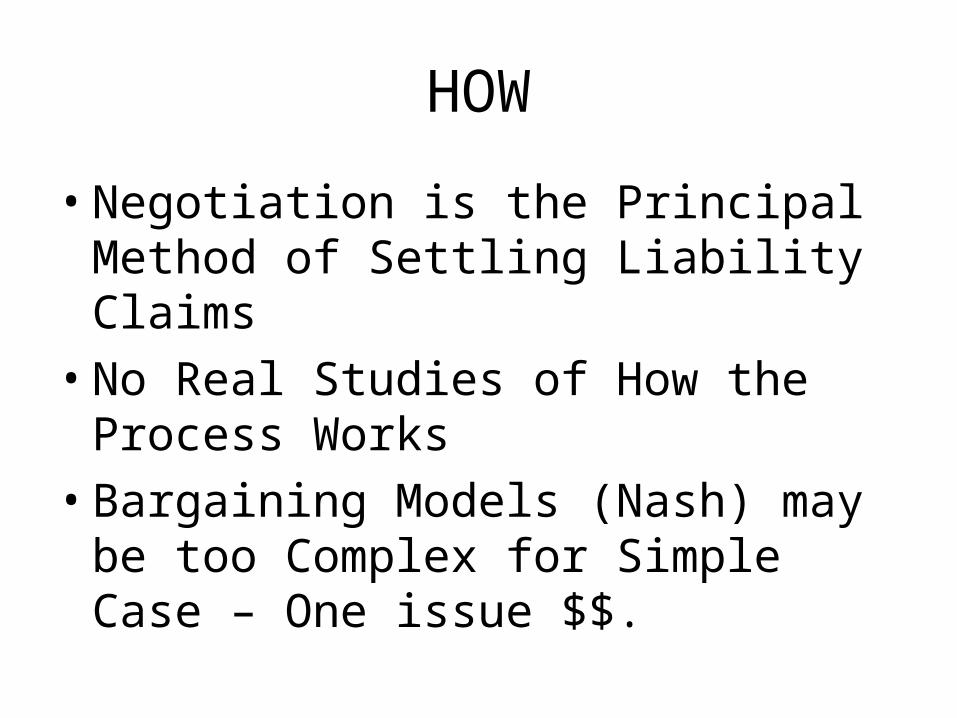
HOW
• Negotiation is the Principal Method of Settling Liability Claims
• No Real Studies of How the Process Works
• Bargaining Models (Nash) may be too Complex for Simple Case – One issue $$.
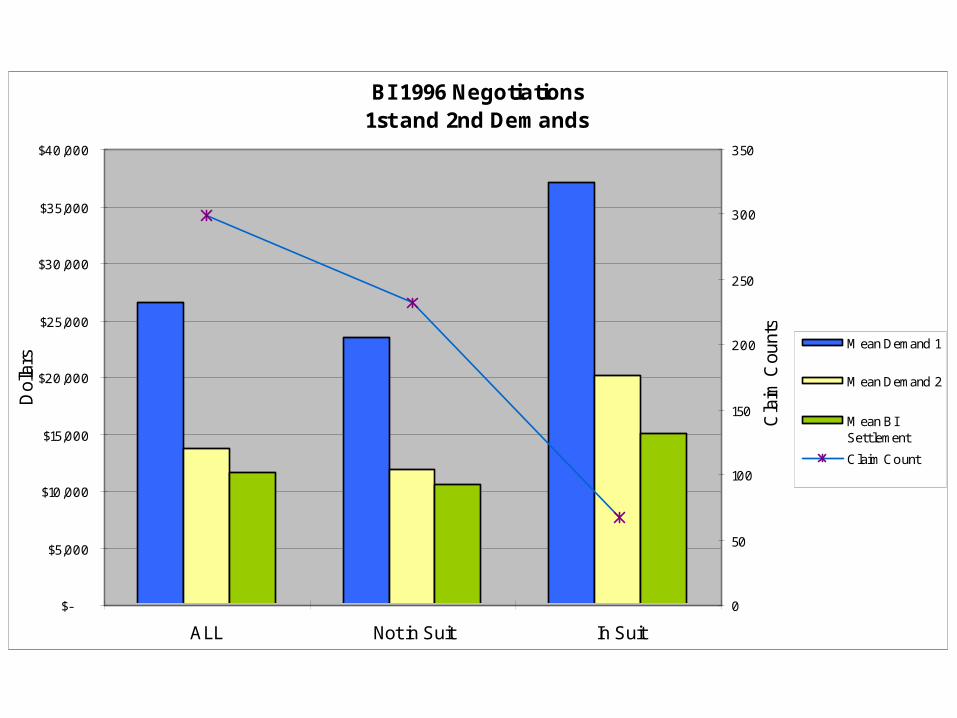
BI 1996 Negotiations1st and 2nd Demands
$-
$5,000
$10,000
$15,000
$20,000
$25,000
$30,000
$35,000
$40,000
ALL Not in Suit In Suit
Dol
lars
0
50
100
150
200
250
300
350
Cla
im C
ount
s
Mean Demand 1
Mean Demand 2
Mean BISettlement
Claim Count

CSE: First & Second Demand Ratio to BI Settlement Ratio
Limited to 2nd Demand > $0, (315 BI Claims)NO PIP payment in Demand & Settlement, Outlier removed 3860
y = 1.4088x + 0.3452
R2 = 0.5691
y = 2.6414x + 1.4777
R2 = 0.1953
0
2
4
6
8
10
12
14
16
18
20
0 2 4 6 8 10 12 14 16 18 20
BI Settlement Ratio
Fir
st &
Sec
on
d D
eman
d R
atio
First Demand
Second Demand
2nd Demand Ratio
1st Demand Ratio
BI Settlement Ratio 1:1

BI Negotiation Leverage Points
Adjuster Advantages
Adjuster has ability to go to trial
Company has the settlement funds
Attorney, provider, or claimant needs money
Adjuster knows history of prior settlements
Adjuster can delay settlement by investigation
Settlement authorization process in company
Initial Determination of Liability
Table 1
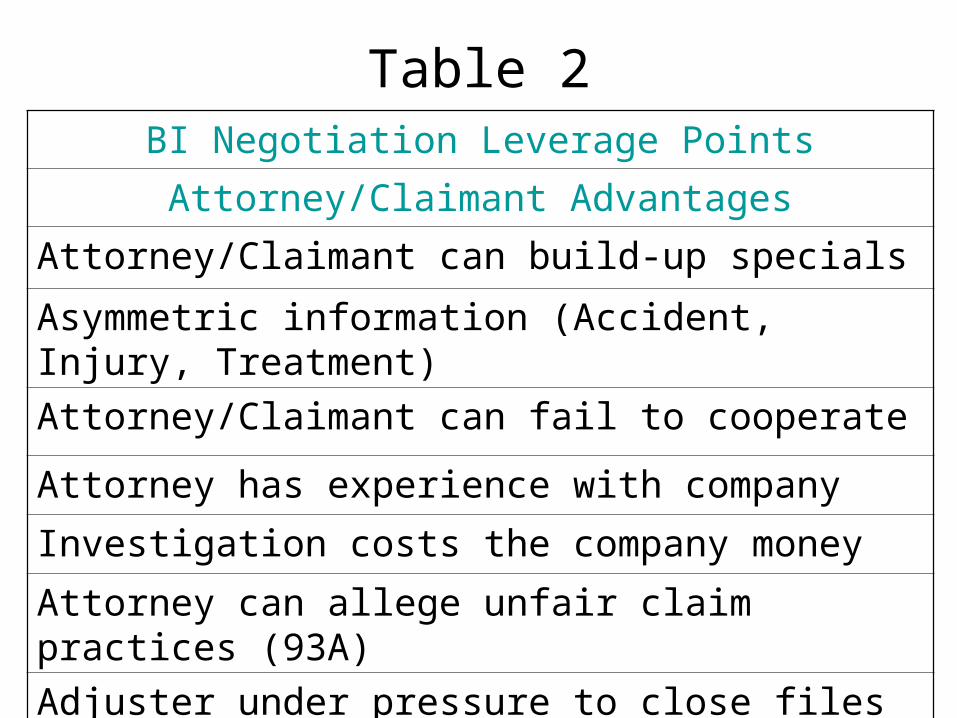
BI Negotiation Leverage Points
Attorney/Claimant Advantages
Attorney/Claimant can build-up specials
Asymmetric information (Accident, Injury, Treatment)
Attorney/Claimant can fail to cooperate
Attorney has experience with company
Investigation costs the company money
Attorney can allege unfair claim practices (93A)
Adjuster under pressure to close files
Table 2

Negotiated Settlements
• Specials may be Discounted or Ignored
• Medicals: Real or Built-up?
• Information from Investigation
• Independent Medical Exams (IMEs)
• Special Investigation (SIU)
• Suspicion of Fraud or Build-up

Settlement Ratios by Injury and Suspicion
Variable PIP Suspicion Score = Low (0-3)
PIP Suspicion Score = Mod to High (4-10)
PIP Suspicion Score = All
1996 (N-336) 1996 (N-216) 1996 (N-552)
Str/SP All Other Str/SP All Other Str/SP All Other
Settlement Settlement Settlement
81% 19% 94% 6% 86% 14%
Avg. Settlement/Specials Ratio
3.01 3.81 2.58 3.61 2.82 3.77
Median Settlement/Specials Ratio
2.69 2.89 2.40 2.57 2.55 2.89
HELP
• Anyone willing to study negotiation cooperatively can contribute confidential access to BI claim files.
• Text miners are standing by willing to extract non-identified data relevant to negotiations
• Experts are standing by to analyze the patterns in the data.

References• Derrig, R.A. [2004],The Settlement Negotiation Process for Automobile Bodily
Injury Liability Claims in the Presence of Suspicion of Fraud and Build-Up, Risk Theory Society, NY.
• Derrig, R.A. and H.I. Weisberg, [2004], Determinants of Total Compensation for Auto Bodily Injury Liability Under No-Fault: Investigation, Negotiation and the Suspicion of Fraud, Insurance and Risk Management, v 71 (4), pp.663-662.
• Derrig, R.A., H.I. Weisberg and Xiu Chen, [1994], Behavioral Factors and Lotteries Under No-Fault with a Monetary Threshold: A Study of Massachusetts Automobile Claims, Journal of Risk and Insurance, 61:2, 245-275.
• Ross, Lawrence H. [1980], Settled out of Court, (Chicago, III: Aldine).• Insurance Research Council [2004], Fraud and Build-Up in Auto Injury Claims.
Malvern, PA• Insurance Research Council [ 2003], Auto Injury Insurance Claims. Countrywide
Patterns in Treatment, Cost, and Compensation, Malvern PA• Abrahamse, A. and Stephen J. Carroll [1999], The Frequency of Excess Claims for
Automobile Personal Injuries, Automobile Insurance: Road Safety, New Drivers, Risks, Insurance Fraud and Regulation, Claire Laberge-Nadeau, and Georges Dionne, Eds., Kluwer Academic Publishers, 131-151.