authentication by mouse movement · authentication by mouse movements ... technology for...
TRANSCRIPT
Authentication by Mouse Movements
CS 297 Report
by
Shivani Hashia ([email protected])
Advisor: Dr.Chris Pollett
May 2004
Authentication by Mouse Movements By Shivani Hashia
Abstract Security systems help to protect machines or sensitive data from unauthorized users. The need for better and cheap security systems is growing with the growth in technologies. Various techniques have been proposed for fulfilling this purpose. One of the most widely used techniques is to have a password. They are easy and convenient to use. One of the main problems with passwords is that they are difficult to remember and easy to steal. In addition, with constant effort, they can be easily broken down. In this report, an alternate technique for authentication, biometrics is discussed. Biometrics has emerged as a great technology for authentication because of their uniqueness properties. In this report, how the movements or a mouse could be used as a biometric for authenticating a user is explained. The experiments that were performed in CS297 to verify if mouse movements could be used as a biometric are described. Three parameters were used for this purpose: speed, deviation from a straight line and the angle formed with the straight line. Along with these three parameters, pattern of the mouse motion is also used to check if the person using the machine is the same person as is authorized to use that machine. In addition to all this a brief overview of what will be done in CS298 is also given.
2
Table of Contents Introduction 5 Deliverable 1 7 Deliverable 2 9 Deliverable 3 11 Conclusion 18 Future work 18 Bibliography 20
3
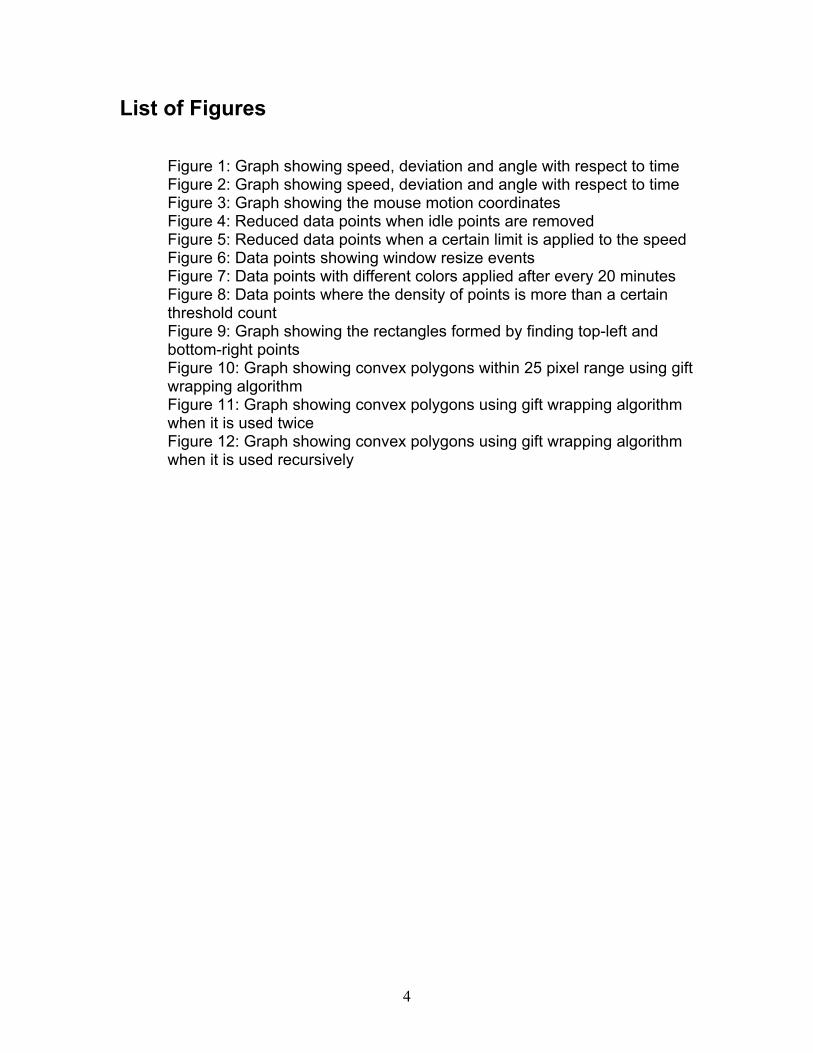
List of Figures Figure 1: Graph showing speed, deviation and angle with respect to time
Figure 2: Graph showing speed, deviation and angle with respect to time Figure 3: Graph showing the mouse motion coordinates Figure 4: Reduced data points when idle points are removed Figure 5: Reduced data points when a certain limit is applied to the speed Figure 6: Data points showing window resize events Figure 7: Data points with different colors applied after every 20 minutes Figure 8: Data points where the density of points is more than a certain threshold count Figure 9: Graph showing the rectangles formed by finding top-left and bottom-right points Figure 10: Graph showing convex polygons within 25 pixel range using gift wrapping algorithm Figure 11: Graph showing convex polygons using gift wrapping algorithm when it is used twice Figure 12: Graph showing convex polygons using gift wrapping algorithm when it is used recursively
4
Introduction Security systems help to protect machines or sensitive data from unauthorized users. The need for better and cheap security systems is growing with the growth of the Internet. Various techniques have been designed to make a secure system. One of these techniques is biometrics. Biometrics is the science and technology of measuring and statistically analyzing biological data. In information technology, biometrics refers to technologies for measuring and analyzing human body characteristics for various purposes including user authentication. It can help recognize individuals based on their physiological or biological characteristics. The use of biometrics can make it possible to overcome the security threats encountered with traditional security methods like passwords, which are easy to crack with constant effort. In addition, passwords are easy to forget and anyone can steal them if they are written on some paper. People usually use different passwords for different applications. Therefore, it becomes a hassle for them to remember each password. They choose some bad passwords, which can be easily guessed. All these problems can be solved by biometrics. It is not something you have to remember but something you have that no one else can steal. Some of the biometric methods include fingerprint, iris scan, palm print, facial recognition, and gait recognition etc. These features are usually unique for a person and cannot be stolen. Because of the demand for security, biometrics industry is growing very fast. According to International Biometric group, the total biometric revenue for 2003 was $719 million, which is expected to rise to about $4,639 million by 2008. [8] Research is now being done to verify the authenticity of users with the help of keyboard strokes and mouse signatures. Researchers at Technion-Israel Institute of Technology have built software, which can identify the authenticity of the users with their individual and distinct typing styles. Prof. Ran El-Yaniv of the institute says that this software is based on universal prediction algorithm, which gathers the statistics when the user types freely during experimental state and uses it to identify the typist. [5] Ross Everitt and Peter McOwan at Queen Mary University of London did other research where they used mouse signature as the biometric to verify the authenticity of the users. The software is divided into two stages that are based on neural networks. The first stage is used to verify the authenticity based on the keyboard dynamics and the password entered. Second stage is used to verify the authenticity with the help of already recorded signature patterns that are done with the mouse. [3] In our research, we are trying to use the mouse movement as the biometric. The mouse is not used for writing the signature but for verifying the authenticity by validating the mouse movements for that person. In the initial stage, various
5
mouse movement patterns are recorded for different users and then these recorded statistics are used to verify the users. Authentication by mouse movements tries to replace the traditional initial login password method. It uses mouse patterns created by the user as the identification method for that person. Movements of users are captured beforehand. The user is then asked to authenticate himself/herself by moving a mouse over few random buttons positioned on the screen. If his/her mouse movements match the already recorded mouse movement patterns, then the user is allowed to proceed. The pattern recognition is based on a Hidden Markov Model (HMM). The main advantage of using mouse as the biometric is that the method does not require any special hardware, so it is will be cheaper compared to some other biometrics like finger printing etc which require special devices/hardware. In this semester, research was done to find the parameters that are unique for different users. The parameters were then recorded and stored. Patterns of mouse clicks were studied by first recording the mouse motion in the background and then from this data, we tried to find the regions on the screen where the mouse hovers the most. Three major tasks were done during this semester. Explanation of each for the deliverables is given this report. In the next semester, we propose to design software that not only verifies the authenticity of the user during initial login but also keeps an eye on the movements of the user during the entire session. If during any point of time, it detects that the user’s movement patterns do not match the already recorded patterns, it logs the user out. The system is divided into two phases. Phase 1 will be the enrollment phase and phase 2 will be the verification phase. During enrollment, different users will be asked to move the mouse on a set of points on the screen. The mouse motion will be recorded and different parameters will be calculated. These parameters will be stored as a template file. Other than these parameters, pattern of mouse motion will also be recorded. This is done by running a program in the background that records every mouse motion coordinate for that user and stores them in a file. From this data, we can construct a state transition table, which is based on Hidden Markov Model. The table will be used to predict the motion of the mouse for a particular user. In the second phase of recognition, the user’s mouse movement is tracked and compared with the already recorded template for the user. If they match, the user is authenticated. In addition, if at any point of time, the motion of the mouse does not match the already recorded data, he is forced to log out.
6
Deliverable 1: To plot a graph of Speed and Time
Description: The idea of the task was to check if we could find a proper biometric which could authenticate a user by moving the mouse. The parameters that were used in this deliverable include variation in speed of different users while moving the mouse, deviation from the straight line between two points and the angle formed while the mouse is moving. After all these parameters are calculated, a graph is drawn which plots these parameters with respect to time.
In order to plot the graph, a program was written to record the mouse coordinates of the user. In the first week, an applet was created which had two buttons start and stop. On pressing start, timer was started. After every timeout period, the current position of the mouse was recorded and stored. These coordinates were then used to calculate speed.
In the second week, the program was slightly modified. Random motion of the mouse was restricted and the user was asked to move only on the points, which would appear on the canvas. The points were drawn with the help of random function with a constant seed. This was done so that every time the applet is run, the points are drawn on the same location and all the users follow the same path of motion. When the user reaches one point, the point is erased and a new point at some different location is drawn. This process continues until the user has followed all ten points or pressed stop button. After moving the mouse on all the points or pressing stop, a graph is shown which plots the parameters with respect to time.
The mouse coordinates are recorded every time the timer is triggered. There was also a drop-down box for selecting the time for the timer. We experimented with 10 ms, 50 ms and 100 ms. For 10 ms, it recorded many points that were very close to each other because the mouse hardly moves in 10 ms. For 100 ms, a number of data points were lost. 50 ms proved to be the perfect time for this experiment. It not only noted almost all the points but also the visibility of the graph was clear. For all the experiments, we used 50 ms as the time out period. The recorded coordinates were then used to find the various parameters, which could be used to find uniqueness in mouse motion.
After the coordinates were recorded, various parameters like speed, deviation and angle were calculated. We computed the speed between two consecutive points. Using the mouse coordinates that were recorded, the speed of the mouse motion is calculated by dividing the distance traveled between two points with the duration of the timer as the time interval between two consecutive points. A graph was then drawn that plotted speed on Y-axis and time on X-axis.
The second parameter we calculated was deviation. Deviation is the shortest distance from the user’s mouse coordinates to the straight line between the two
7
points, which were drawn on the applet and between which the user is moving. Deviation from a straight line between two points is calculated by finding the minimum distance of that point from the straight line drawn between the two-recorded points. Deviation gives us the path of motion between two points, which the user follows i.e., we will be able to figure out whether the user has a pattern of deviating a lot from the line or he closely follows a straight path.
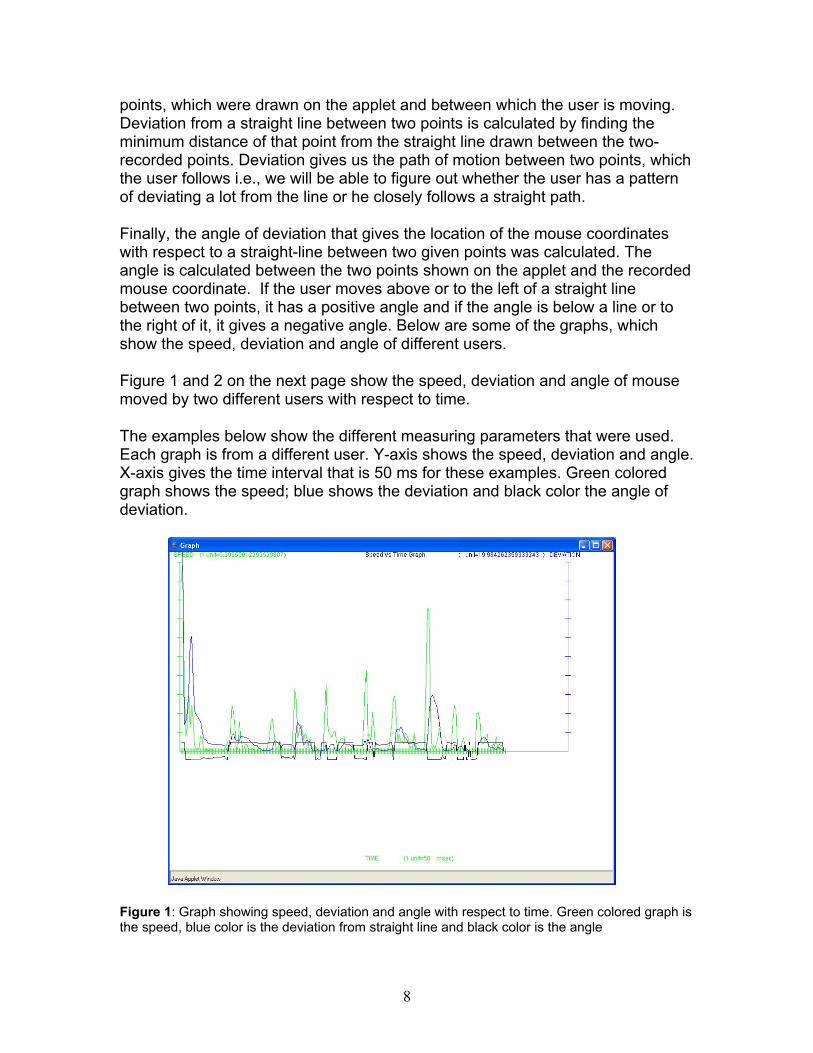
Finally, the angle of deviation that gives the location of the mouse coordinates with respect to a straight-line between two given points was calculated. The angle is calculated between the two points shown on the applet and the recorded mouse coordinate. If the user moves above or to the left of a straight line between two points, it has a positive angle and if the angle is below a line or to the right of it, it gives a negative angle. Below are some of the graphs, which show the speed, deviation and angle of different users.
Figure 1 and 2 on the next page show the speed, deviation and angle of mouse moved by two different users with respect to time.
The examples below show the different measuring parameters that were used. Each graph is from a different user. Y-axis shows the speed, deviation and angle. X-axis gives the time interval that is 50 ms for these examples. Green colored graph shows the speed; blue shows the deviation and black color the angle of deviation.
Figure 1: Graph showing speed, deviation and angle with respect to time. Green colored graph is the speed, blue color is the deviation from straight line and black color is the angle
8
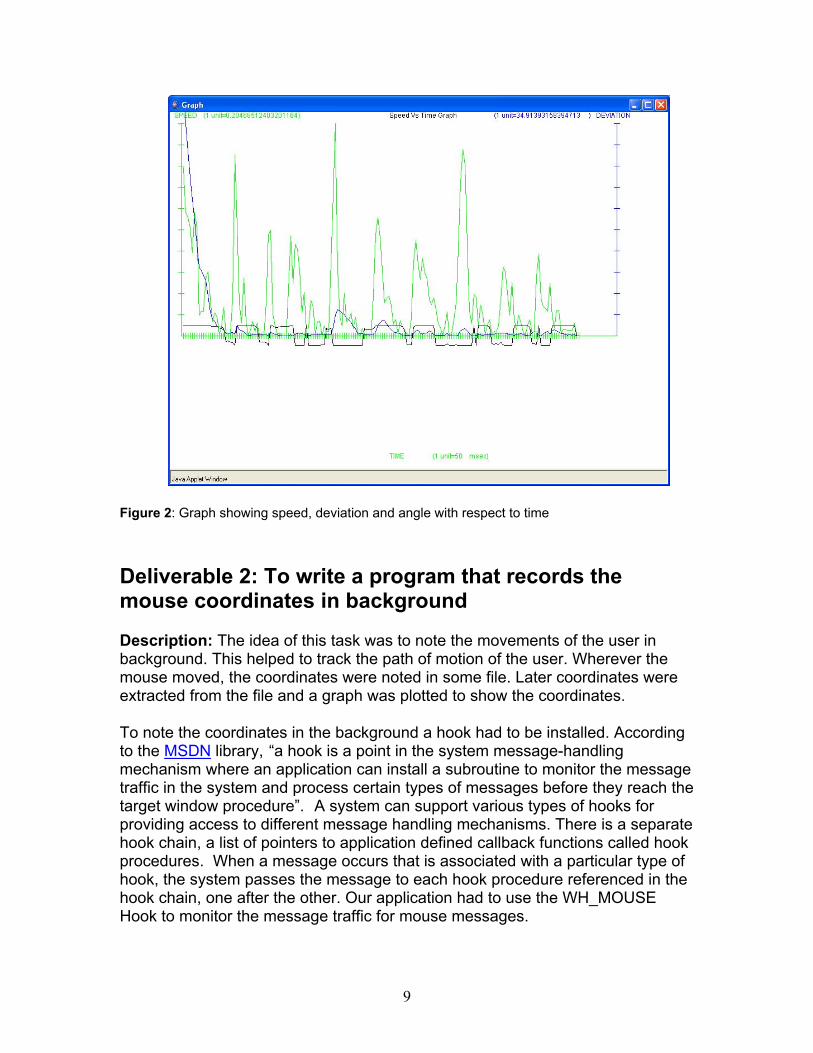
Figure 2: Graph showing speed, deviation and angle with respect to time
Deliverable 2: To write a program that records the mouse coordinates in background
Description: The idea of this task was to note the movements of the user in background. This helped to track the path of motion of the user. Wherever the mouse moved, the coordinates were noted in some file. Later coordinates were extracted from the file and a graph was plotted to show the coordinates.
To note the coordinates in the background a hook had to be installed. According to the MSDN library, “a hook is a point in the system message-handling mechanism where an application can install a subroutine to monitor the message traffic in the system and process certain types of messages before they reach the target window procedure”. A system can support various types of hooks for providing access to different message handling mechanisms. There is a separate hook chain, a list of pointers to application defined callback functions called hook procedures. When a message occurs that is associated with a particular type of hook, the system passes the message to each hook procedure referenced in the hook chain, one after the other. Our application had to use the WH_MOUSE Hook to monitor the message traffic for mouse messages.
9
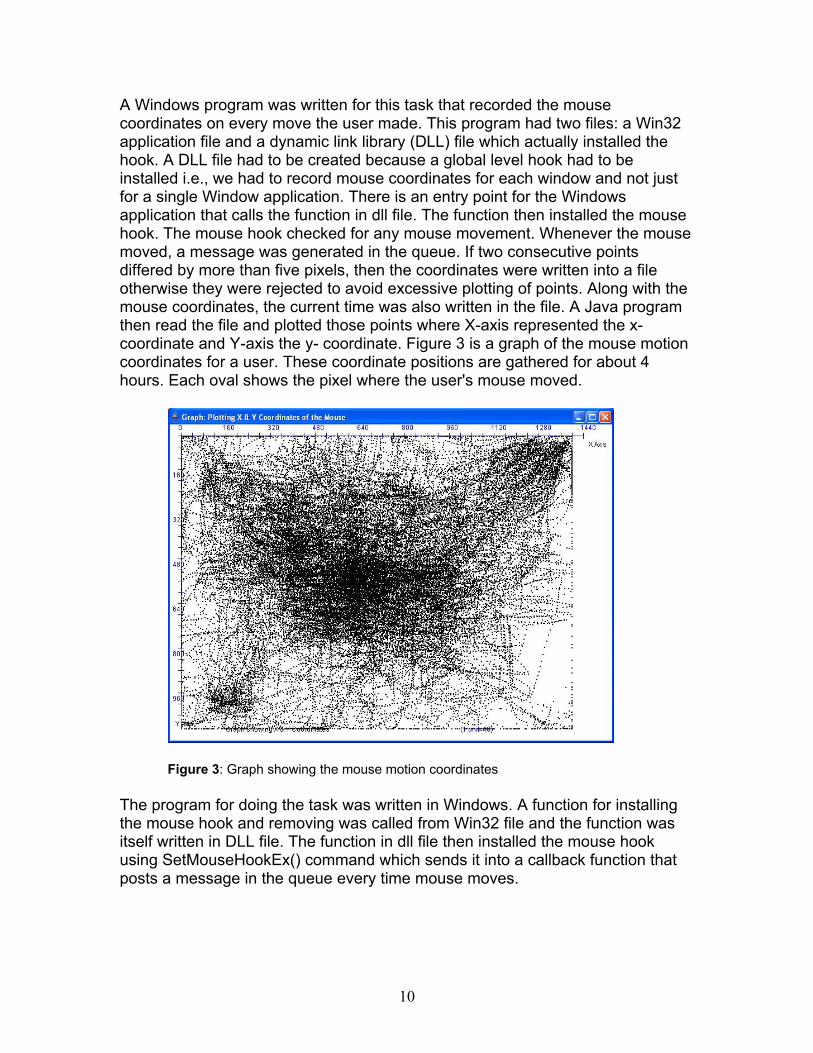
A Windows program was written for this task that recorded the mouse coordinates on every move the user made. This program had two files: a Win32 application file and a dynamic link library (DLL) file which actually installed the hook. A DLL file had to be created because a global level hook had to be installed i.e., we had to record mouse coordinates for each window and not just for a single Window application. There is an entry point for the Windows application that calls the function in dll file. The function then installed the mouse hook. The mouse hook checked for any mouse movement. Whenever the mouse moved, a message was generated in the queue. If two consecutive points differed by more than five pixels, then the coordinates were written into a file otherwise they were rejected to avoid excessive plotting of points. Along with the mouse coordinates, the current time was also written in the file. A Java program then read the file and plotted those points where X-axis represented the x-coordinate and Y-axis the y- coordinate. Figure 3 is a graph of the mouse motion coordinates for a user. These coordinate positions are gathered for about 4 hours. Each oval shows the pixel where the user's mouse moved.
Figure 3: Graph showing the mouse motion coordinates
The program for doing the task was written in Windows. A function for installing the mouse hook and removing was called from Win32 file and the function was itself written in DLL file. The function in dll file then installed the mouse hook using SetMouseHookEx() command which sends it into a callback function that posts a message in the queue every time mouse moves.
10
Deliverable 3: Isolate regions on the graph where mouse hovers the most
Description: The idea of this task was to separate the regions on the screen where the mouse hovers the most. For finding this, we first had to clean the data points we recorded in the Deliverable 2. A number of experiments were done for doing the clean up. These include:
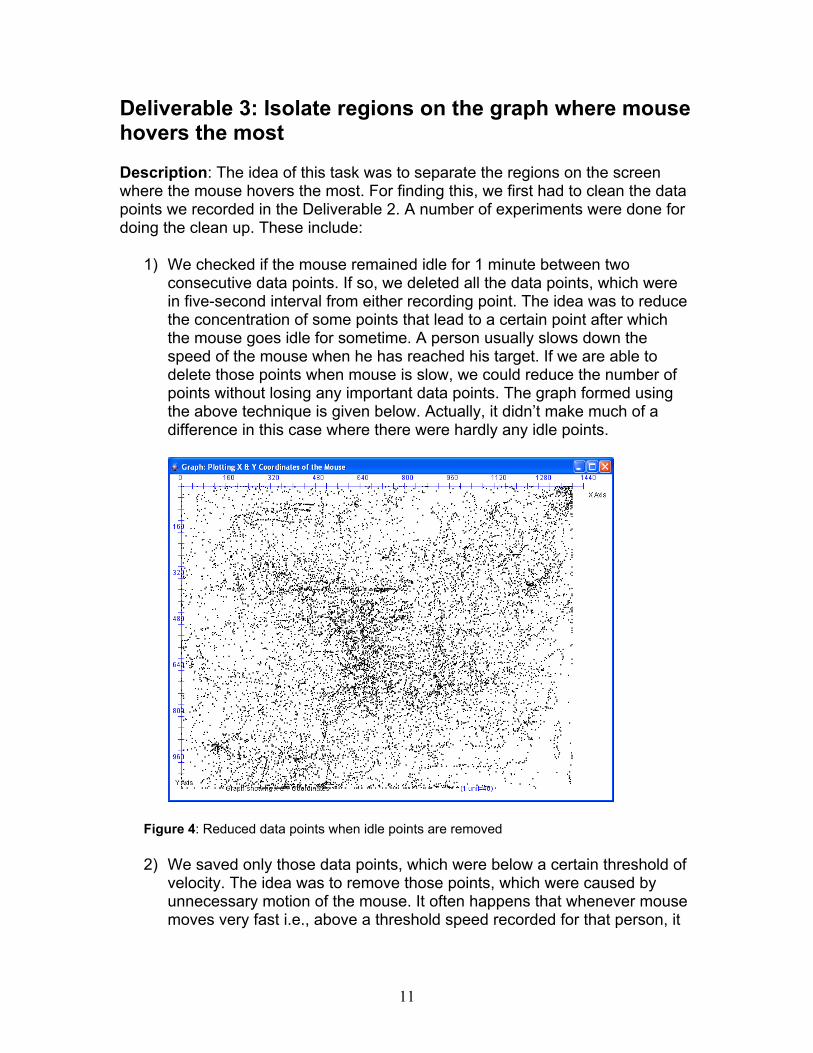
1) We checked if the mouse remained idle for 1 minute between two consecutive data points. If so, we deleted all the data points, which were in five-second interval from either recording point. The idea was to reduce the concentration of some points that lead to a certain point after which the mouse goes idle for sometime. A person usually slows down the speed of the mouse when he has reached his target. If we are able to delete those points when mouse is slow, we could reduce the number of points without losing any important data points. The graph formed using the above technique is given below. Actually, it didn’t make much of a difference in this case where there were hardly any idle points.
Figure 4: Reduced data points when idle points are removed
2) We saved only those data points, which were below a certain threshold of velocity. The idea was to remove those points, which were caused by unnecessary motion of the mouse. It often happens that whenever mouse moves very fast i.e., above a threshold speed recorded for that person, it
11
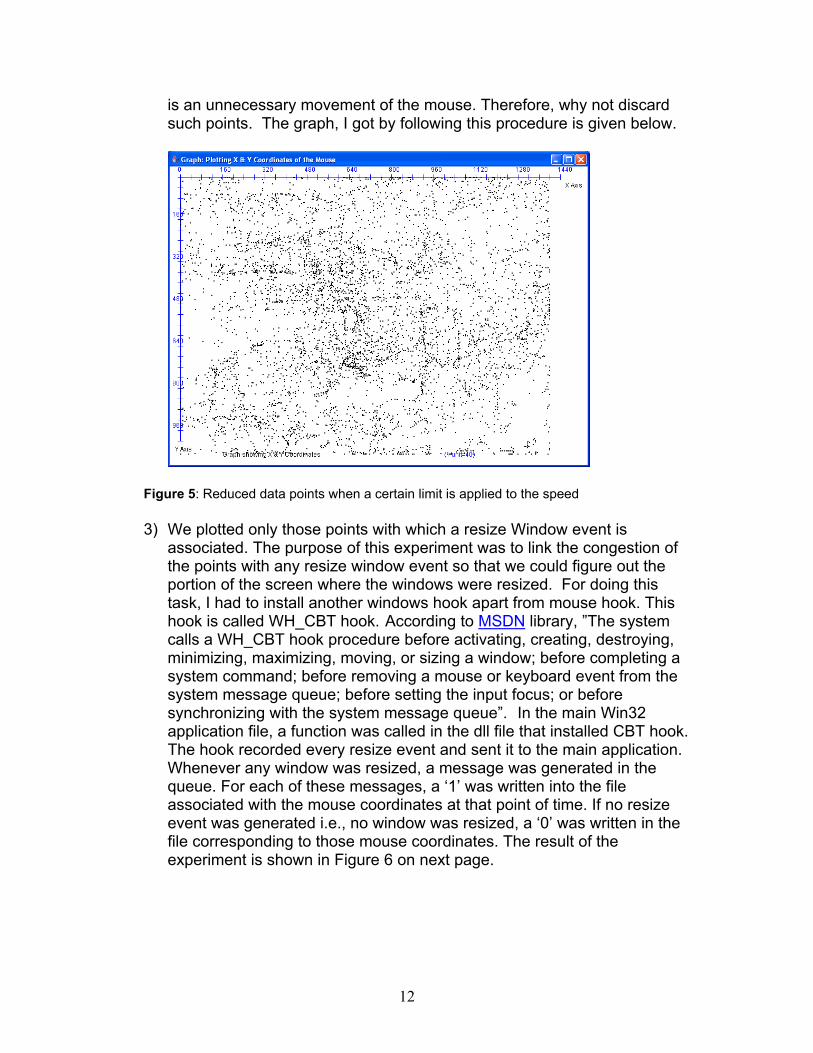
is an unnecessary movement of the mouse. Therefore, why not discard such points. The graph, I got by following this procedure is given below.
Figure 5: Reduced data points when a certain limit is applied to the speed
3) We plotted only those points with which a resize Window event is associated. The purpose of this experiment was to link the congestion of the points with any resize window event so that we could figure out the portion of the screen where the windows were resized. For doing this task, I had to install another windows hook apart from mouse hook. This hook is called WH_CBT hook. According to MSDN library, ”The system calls a WH_CBT hook procedure before activating, creating, destroying, minimizing, maximizing, moving, or sizing a window; before completing a system command; before removing a mouse or keyboard event from the system message queue; before setting the input focus; or before synchronizing with the system message queue”. In the main Win32 application file, a function was called in the dll file that installed CBT hook. The hook recorded every resize event and sent it to the main application. Whenever any window was resized, a message was generated in the queue. For each of these messages, a ‘1’ was written into the file associated with the mouse coordinates at that point of time. If no resize event was generated i.e., no window was resized, a ‘0’ was written in the file corresponding to those mouse coordinates. The result of the experiment is shown in Figure 6 on next page.
12
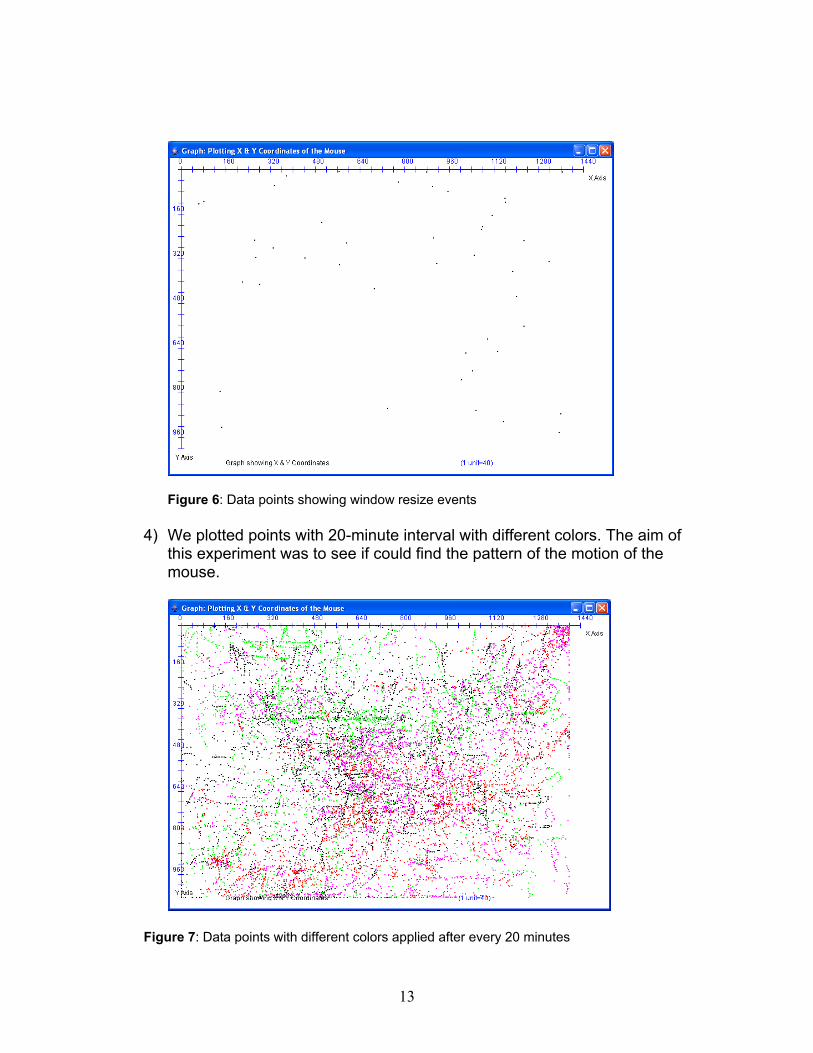
Figure 6: Data points showing window resize events
4) We plotted points with 20-minute interval with different colors. The aim of this experiment was to see if could find the pattern of the motion of the mouse.
Figure 7: Data points with different colors applied after every 20 minutes
13

5) We picked only those regions where the number of points was more than a certain threshold count. This was done by selecting a point and then checking if there were a certain number of points in the region around it. If so, we recorded those points otherwise they were discarded. The idea was to select only those regions where there was a dense blob, which implied that the mouse hovered around that region for more time. After cleaning the data, the graph looked like given in Figure 8.
Figure 8: Data points where the density of points is more than a certain threshold count
After observing all the graphs that were obtained by performing the above-mentioned procedures, we concluded that the last experiment, where only those points, which have a dense region around them, were selected, was the most effective for cleaning the data and removing any isolated points.
The next task after cleaning the data was to separate the dense regions. The screen coordinates, where the mouse moved, had to be divided into small dense regions and enclosed by a bounded figure. This was done to form small-enclosed figures, which would serve the purpose of transition states. Based on these states and the transition between them, a transition table will be formed in the next semester, which records all the transitions from one region to another. This table will then be used in the recognition phase to predict the motion of mouse for that user. A couple of algorithms were used for this purpose. In the first algorithm, we tried to find the top-left and bottom-right points and then drew a rectangle using those two points. Top-left points were chosen if there were more
14
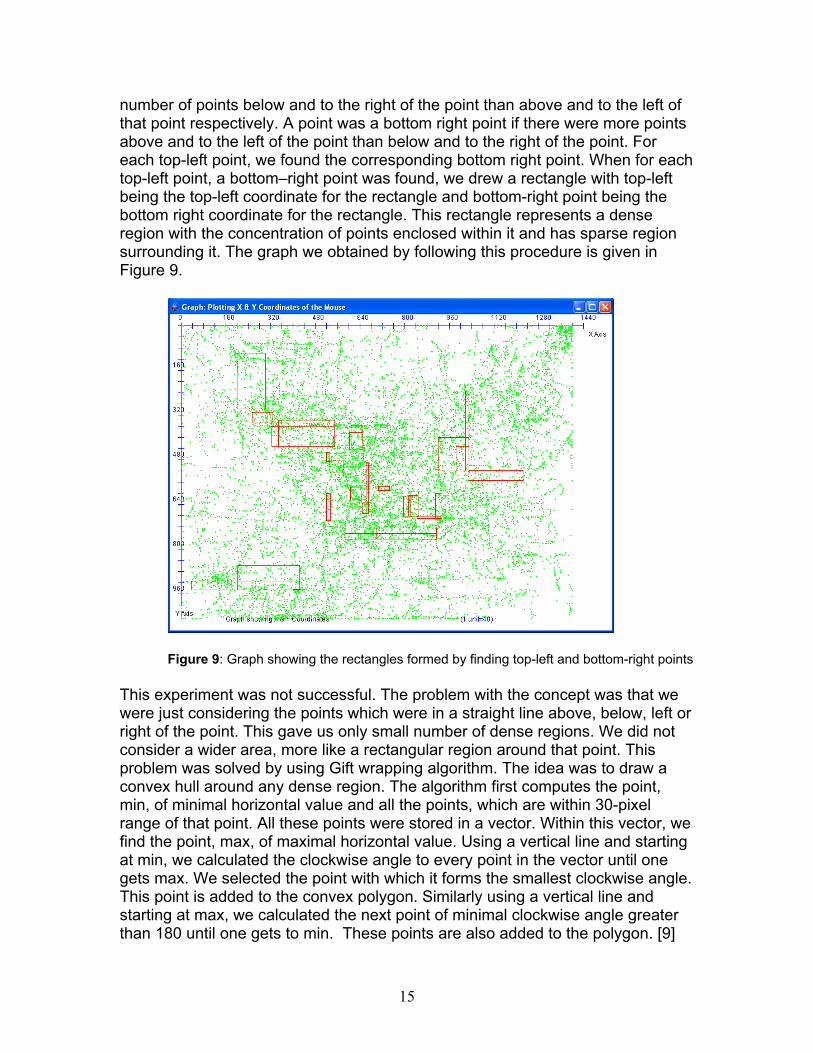
number of points below and to the right of the point than above and to the left of that point respectively. A point was a bottom right point if there were more points above and to the left of the point than below and to the right of the point. For each top-left point, we found the corresponding bottom right point. When for each top-left point, a bottom–right point was found, we drew a rectangle with top-left being the top-left coordinate for the rectangle and bottom-right point being the bottom right coordinate for the rectangle. This rectangle represents a dense region with the concentration of points enclosed within it and has sparse region surrounding it. The graph we obtained by following this procedure is given in Figure 9.
Figure 9: Graph showing the rectangles formed by finding top-left and bottom-right points
This experiment was not successful. The problem with the concept was that we were just considering the points which were in a straight line above, below, left or right of the point. This gave us only small number of dense regions. We did not consider a wider area, more like a rectangular region around that point. This problem was solved by using Gift wrapping algorithm. The idea was to draw a convex hull around any dense region. The algorithm first computes the point, min, of minimal horizontal value and all the points, which are within 30-pixel range of that point. All these points were stored in a vector. Within this vector, we find the point, max, of maximal horizontal value. Using a vertical line and starting at min, we calculated the clockwise angle to every point in the vector until one gets max. We selected the point with which it forms the smallest clockwise angle. This point is added to the convex polygon. Similarly using a vertical line and starting at max, we calculated the next point of minimal clockwise angle greater than 180 until one gets to min. These points are also added to the polygon. [9]
15
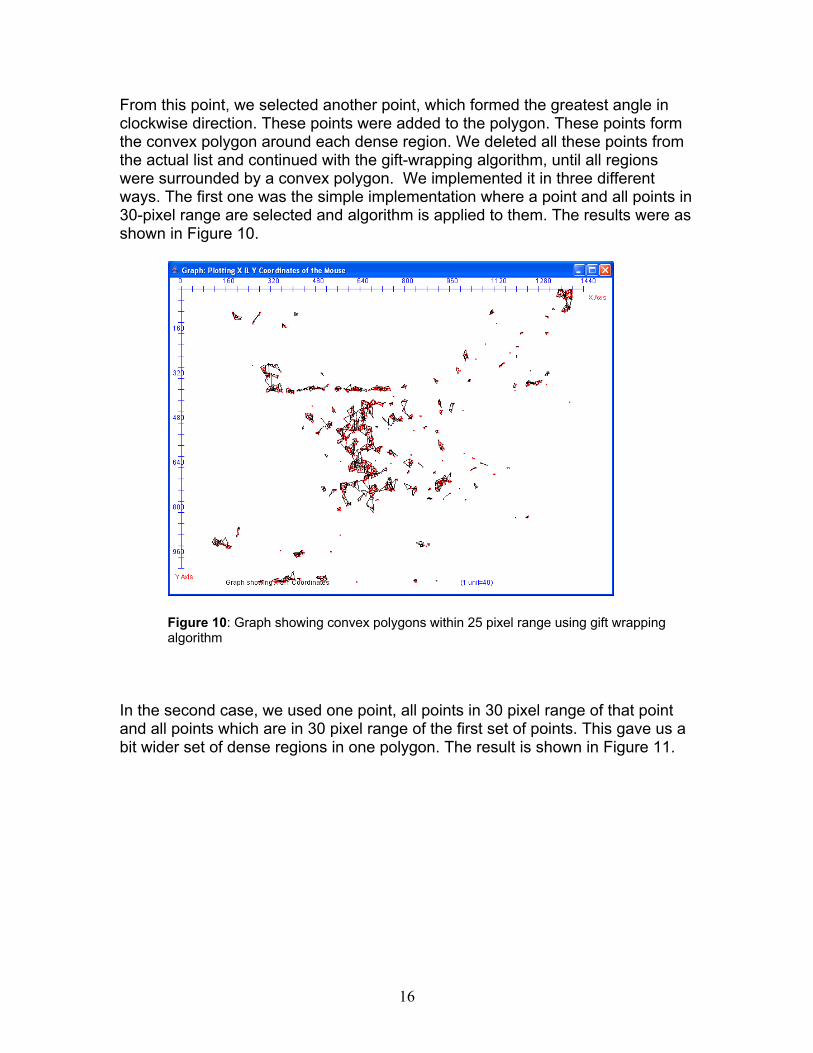
From this point, we selected another point, which formed the greatest angle in clockwise direction. These points were added to the polygon. These points form the convex polygon around each dense region. We deleted all these points from the actual list and continued with the gift-wrapping algorithm, until all regions were surrounded by a convex polygon. We implemented it in three different ways. The first one was the simple implementation where a point and all points in 30-pixel range are selected and algorithm is applied to them. The results were as shown in Figure 10.
Figure 10: Graph showing convex polygons within 25 pixel range using gift wrapping algorithm
In the second case, we used one point, all points in 30 pixel range of that point and all points which are in 30 pixel range of the first set of points. This gave us a bit wider set of dense regions in one polygon. The result is shown in Figure 11.
16
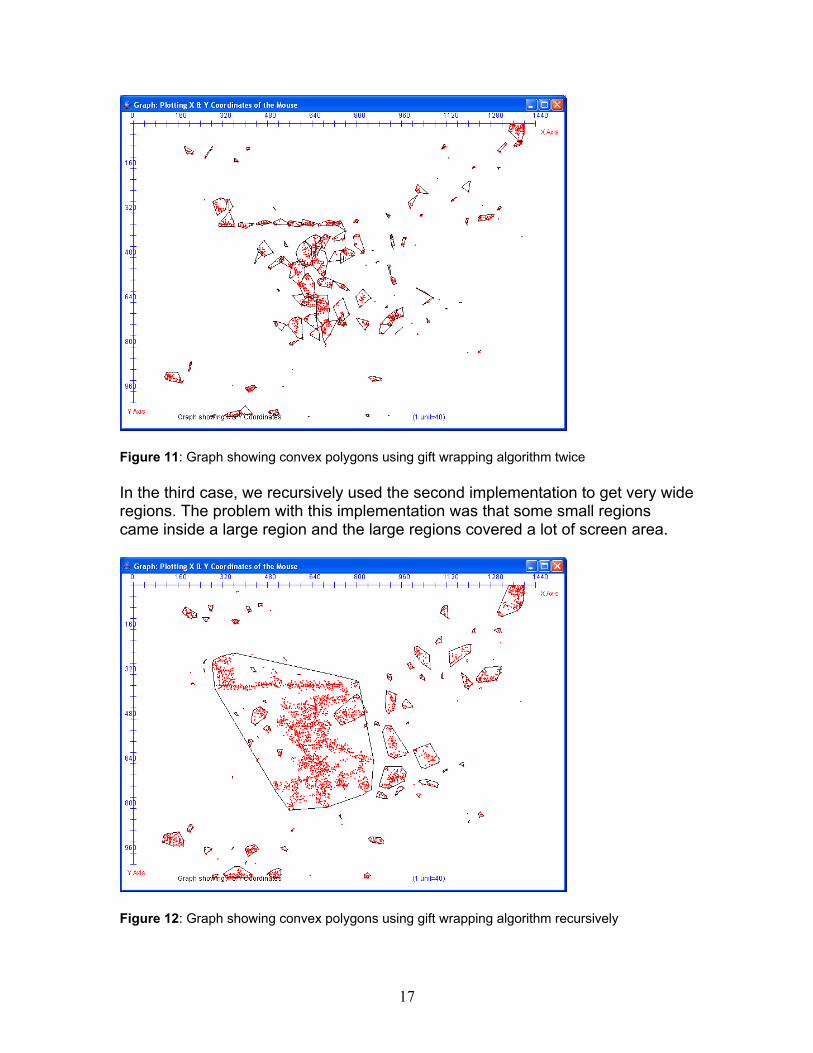
Figure 11: Graph showing convex polygons using gift wrapping algorithm twice
In the third case, we recursively used the second implementation to get very wide regions. The problem with this implementation was that some small regions came inside a large region and the large regions covered a lot of screen area.
Figure 12: Graph showing convex polygons using gift wrapping algorithm recursively
17
We selected the second implementation whose results looked the most promising and were very similar to we required.
Conclusion
After performing various experiments on mouse movement and studying the behavior pattern for different users, in this semester, we think authentication by mouse movements is possible by using the proper biometric. In deliverable 1, we used speed, deviation and angle as three measuring parameters. We collected data from ten different users and studied their mouse movement patterns. This gave us very promising results. We then proceeded to next task, which was to record the mouse coordinates in background. The task was very challenging because I had no knowledge of Windows programming and creating dll files. Most of the time was spent on searching on the Internet. Finally, I came across the hook concept. The program that I wrote for this task enabled us to capture all the mouse coordinates of any user. This helped us to study the mouse motion patterns of users visually and we got an idea where on the screen does the user move the most. The last deliverable took most of the time. We had to figure out how to clean the data points that we produced from the second deliverable. We performed about five experiments for this task. None of them gave any conclusive results. Then we decided to select only those points around which there is high concentration of points. This reduced a number of unnecessary points. The next task was to surround the dense regions with an enclosed figure so that we could separate different dense regions. The idea was to use these dense regions as separate states and build a transition table for them. Couple of experiments was done for this. After the results from these experiments, we decided to go with the gift wrapping algorithm. Thus, by the end of this semester, we are able to decide on the parameters for using the mouse movement as the biometric, record the mouse coordinates in background and divide those coordinates into different concentrated regions.
Future Work
The next task will be to make a state transition table based on the results of the Deliverable 3. We plan to find the probability of the transitions from one state to another. This data will be stored in a template file for that user. The software we propose to build in the next semester will have different ways of verifying the users authenticity. For the initial login, user will be asked to move the mouse on some defined points. The software will calculate the speed, angle and deviation of the mouse. It will compare this data with the already recorded threshold value of speed, angle and threshold for that user. If they match, he will be allowed to proceed. After that, there will be constant monitoring of his mouse movements. Based on the transition table built for that user and with the help of HMM, we will predict the next state of the users mouse before he has moved the mouse. If that state matches the predicted state, he will be allowed to continue. However, if at any point of time his speed, angle, deviation and state do not match the
18

parameters in the template file, he will be forced to log out. At present, we know neither the false acceptance rate nor the true rejection rate of this system. This will be calculated in next semester when the prepared software will be tested.
19
20
Bibliography
1) Statistical Language Learning. Eugene Charniak. MIT. 1993.
2) Circuit complexity and Neural Networks. Ian Parberry. MIT 1994
3) Java-Based Internet Biometric Authentication System. Ross A.J & Peter W. McOwan. IEEE Transactions on Pattern and Machine Intelligence. 25(9). Page 1166-1172. 2003.
4) Computational Geometry in C. Joseph O’Rourke. Cambridge University Press. 1998
5) Who types there? Communications of the ACM. 46(12) December 2003.
Web References:
6) http://www.whatis.com/
7) http://msdn.microsoft.com/library/default.asp?url=/library/en-us/winui/winui/windowsuserinterface/windowing/hooks/hookreference/hookfunctions/setwindowshookex.asp 8) International Biometric Group. “Biometrics Market and Industry Report 2004-2008”. http://www.biometricgroup.com/reports/public/market_report.html 9) http://www.cs.sjsu.edu/faculty/pollett/20.1.00w/hw3.html