authentication by mouse movements · authentication where smart card is used with a password. ......
TRANSCRIPT

AUTHENTICATION BY MOUSE MOVEMENTS
A writing project
Presented to
The Faculty of the Department of Computer Science
San Jose State University
In Partial Fulfillment
of the Requirements for the Degree
Master of Science
by
Shivani Hashia
December 2004

ABSTRACT
AUTHENTICATION BY MOUSE MOVEMENTS
by Shivani Hashia
Security systems help to protect machines or sensitive data from unauthorized
users. The need for better and cheap security systems is growing with the growth
in technologies and hacking skills of the people. Various techniques are on the
market that can provide some level of security. One of the most widely used
techniques is to enter a password. Passwords are easy and convenient to use
and do not require any special hardware. However, one of the main problems
with passwords is they are difficult to remember and easy to steal. In addition,
with constant effort, they can be guessed or cracked if not sensibly kept. In this
report, an alternate technique for authentication based on biometrics is explored.
Biometrics is the science and technology of measuring and statistically analyzing
biological data. It has emerged as a great technology for authentication because
of its unique properties. We have researched a biometric technique where we are
using mouse movements to authenticate users. In this report, how the
movements of a mouse could be used as a biometric for authenticating a user is
explained. The experiments, which were performed during this course work to
verify if mouse movements could be used as a biometric, are also described.
Experiments involving mouse movements as a form of passive authentication are
further elucidated.
2

Table of Contents
1) Introduction 5
2) Background and Related Work 10
3) Design and Implementation 14
3.1 Active authentication 14
3.2 Passive authentication 22
4) Experiments and Results 24
4.1 Active authentication 25
4.2 Passive authentication 37
5) Conclusion 53
Appendices
Appendix A: Bibliography 56
3

List of Tables and Figures
List of Tables
Table 1: Comparison of FAR and FRR results
Table 2: Comparison of FAR and FRR results
Table 3: FAR and FRR for method 11
Table 4: FAR and FRR for method 12
List of Figures
Figure 1: Flow of data for registration phase
Figure 2: Screen shot of login screen
Figure 3: Flow of data for verification phase
Figure 4: Graph showing speed, deviation and angle with respect to time
Figure 5: Graph showing speed, deviation and angle with respect to time
Figure 6: Graph showing the mouse motion coordinates
Figure 7: Reduced data points when idle points are removed
Figure 8: Reduced data points when a certain limit is applied to the speed
Figure 9: Data points showing window resize events
Figure 10: Data points with different colors applied after every 20 minutes
Figure 11: Data points where the density of points is more than a certain
threshold count
Figure 12: Graph showing the rectangles formed by finding top-left and bottom-
right points
Figure 13: Graph showing convex polygons within 25 pixels using gift wrapping
algorithm
Figure 14: Graph showing convex polygons using gift wrapping algorithm when it
is used twice
Figure 15: Graph showing convex polygons using gift wrapping algorithm when it
is used recursively
4

Chapter 1
Introduction
Security systems help to protect machines or sensitive data from unauthorized
users. In today’s world where we do every important task like banking, investing
and shopping etc via the Internet, the need for better and cheap security systems
is growing. The report describes one such security measure that we designed
during the course work to detect unauthorized users. We created a security
model, which could verify the authenticity of users based on their mouse
movements.
There may be different criterion for selecting the security of each system
depending upon cost, ease of use, confidentiality of information etc. Security
concern is more important for financial institutes like banks, credit card
companies etc. A survey, commissioned by EDS and the International
Association of Privacy Professionals (IAPP), and conducted by the Ponemon
Institute found about 61% of the consumers did not want to be forced to change
their passwords that are enforced by some companies to increase security. 66%
accepted that it was more difficult to tolerate the inconvenience of failed
authentication than being verified without proper authentication [12]. Peter Reid,
portfolio strategist for EDS Security and Privacy Services says “These findings
are a clear indication that consumers are not willing to spend time with
5

identification verification processes that serve to protect their personal
information and their identity," [12]
So it is really important that the authorization process be easy to use and
effective. The survey also showed that about 69% of the respondents were
willing to use biometrics technology out of which 88% accepted the biometric
technology because it was convenient to use and one didn’t have to remember
passwords. Biometrics is the science of identifying people with their physical or
biological characteristics.
There are three main techniques that have been designed to make secure
systems where unauthorized access is not allowed. They are passwords or PIN
(Personal Identification Number), cards like smart cards and biometrics. A
combination of the three can also be used.
Passwords are the simplest form of user authentication, which are used almost
everywhere, be it desktop, bank account or any other transaction that we do via
the Internet. We all know how passwords work. The main advantage of
passwords is that the process of authentication is very easy and cheap. The
main drawback is that it is a hassle to remember passwords when a person uses
different passwords for different applications. If the passwords are not formed
properly like without taking into consideration the kind of characters to be used
and the length of the password, a hacker can easily crack them. Passwords can
6

also be stolen if written down somewhere, which is quite possible since users
have to handle many passwords.
Smart card is the type of authentication based on what a user has in his
possession. They are credit card sized and a have a microchip embedded inside
that stores all the information related to that person. They can be based on
single-factor authentication where only the smart card is used or two-factor
authentication where smart card is used with a password. To read the
information on a smart card, we need to have a card reader. Smart cards are of
two types: contact smart cards, which require the card to be read by the reader
and the contact less smart cards, which need to be in close vicinity of the card
reader to get recognized. Because of the card reader, this technology is more
expensive than passwords. Moreover, smart cards can be stolen, so anyone who
has access to the smart card can steal your identity. [11]
In information technology, biometrics refers to technologies for measuring and
analyzing human body characteristics for various purposes including user
authentication. It can help recognize individuals based on their physiological or
biological characteristics. Some of the biometric methods include fingerprint, iris
scan, palm print, facial recognition, and gait recognition etc. These features are
usually unique for a person and cannot be stolen. The use of biometrics can
make it possible to overcome the security threats encountered with traditional
security methods like passwords and smart cards. It is not something you have to
7
remember or carry but something you have. Biometric works well only if it came
from a person at the time of verification and it matches the template biometric on
file [13]. There are usually two stages for biometrics. In the first stage, a person is
usually enrolled i.e., his features are extracted and a unique set is created for
that user which is stored on a template file for him. The next phase is the
verification where he actually tries to login. Here again a sample of his features is
taken, unique set created and compared with the template file of the user. If they
match, he is verified to be the authentic user. There may also be a training
phase, where a number of samples are taken from the same user to make the
verification more reliable. Fingerprint is one of the most common biometric
systems used for authentication in various places like immigration etc. Because
of the demand for security, biometrics industry is growing very fast. According to
International Biometric group, the total biometric revenue for 2003 was $719
million, which is expected to rise to about $4,639 million by 2008. [9]
Avoiding passwords and using the biometrics like iris-scan, fingerprinting has its
own drawbacks. They require a costly hardware for scanning the iris or finger.
Our aim was to design a method, which has the advantages of both passwords,
and other biometric methods. In this project, we decided to implement a security
system that could authenticate users based on their mouse movements.
Authentication by mouse movements provides the ease of passwords and
security of biometric methods, i.e., the use of any additional hardware isn’t
required and no one can steal the mouse movements of a person.
8

The report gives details of all the work that was done to implement the idea of
authenticating with mouse movements. It is divided into four chapters. Chapter 2
describes the background and work that has been done related to this biometric
identification. Chapter 3 gives the details of the design and implementation of the
software model. Chapter 4 explains all the experiments that were performed to
make a working model and their corresponding results. In the end the final
conclusion with future work that can be done in this project is given.
9

Chapter 2
Background and Related Work
Authentication is the process of validating that a person is who he claims to be.
As discussed above there are various methods designed which help in
authenticating users. Many working models have been made from various
techniques of biometrics like fingerprinting, voice recognition etc. The method of
authentication with mouse movements is however a novel idea, which to our
knowledge hasn’t been tried before though there are a couple of universities
doing research in this field.
Some of the biometric technologies in which extensive study has been done are
fingerprinting and hand geometry. Fingerprinting is made useful by studying the
patterns of ridges, furrows and minutiae points on the fingers. These patterns are
unique for every person. To recognize individuals based on the fingerprint, a
sample of his fingerprint is scanned and the patterns generated from that sample
are stored on the server. The next time when he is trying to verify, the sample of
his fingerprint is taken again; ridges, furrows etc studied and compared with the
recorded data points. If he is the same person, the data points will match and he
will be verified.
Hand Geometry has been in use for over 20 years now. It is based on the
information that the shape of hand is different from one person to another. The
10

hand is placed on a scanner and the image captured is stored. The user is
verified with the shape of his hand, length of fingers and knuckles, pattern of
veins in the hand etc.
Researchers at Technion-Israel Institute of Technology have built software,
which can identify the authenticity of the users with their individual and distinct
typing styles. Prof. Ran El-Yaniv of the institute says that this software is based
on universal prediction algorithm, which gathers the statistics when the user
types freely during experimental state and uses it to identify the typist. [5]
Ross Everitt and Peter McOwan at Queen Mary University of London did a
research where they used mouse signature as the biometric to verify the
authenticity of the users. It is based on the keyboard dynamics and the password
entered. The software is divided into three stages and is based on neural
networks. The first stage is used to for registering where the user is asked to
provide a signature sample about 40 times. Training is the second stage during
which forged samples of the signature are created by asking other users to
produce a copy of the signature. They are also stored on the server. In the last
stage, actual verification is done. User is asked to sign and salient features are
extracted from his sample and compared with the registered sample signature.
For the keyboard strokes, they used hold and latency times and for the online
signature they used distance and angle relationships. [3]
11
Hugo Gamboa et al from Portugal have designed a system that traps the
interaction of users with mouse and then used that information to verify users.
They have used statistical pattern recognition techniques to develop a
“sequential classifier that processes user interaction, according to which the user
identity is considered genuine if a predefined accuracy level is achieved, and the
user is classified as an impostor otherwise.” The system is divided into two parts:
the acquisition part where they feed all the data into files and the recognition part
where the data stored in templates are compared with the current user’s data to
verify user authenticity [6].
12
Chapter 3 Design and Implementation In our research, we are trying to use mouse movements as the biometric. The
mouse is not used for writing the signature but for verifying the authenticity by
validating the mouse movements for that person. Authentication by mouse
movements tries to replace the traditional initial login password method. It uses
mouse patterns created by the user during login as the identification method for
that person.
In the initial stage, various mouse movement patterns are recorded for different
users and then these recorded statistics are used to verify the users. The main
advantage of using mouse as the biometric is that the method does not require
you to remember anything like passwords and it requires no special hardware, so
it is cheaper compared to some other biometrics like finger printing etc which
require special devices/hardware.
There are two types of authentication methods that we implemented. First is the
active authentication and the second is the passive authentication.
3.1 Active authentication
Active authentication is the method that replaces passwords. The user is asked
his user name, and then instead of a password, he is presented with a login
13

screen. The user is given a set of dots on the login screen but only one dot
appears at a time on the screen. He has to follow his mouse towards these dots
as they appear on the screen. When the mouse reaches a dot, it will be erased
and the next dot appears at some other coordinate. He has to repeat the
procedure of following the dots with his mouse. This is how we get a sample of
his mouse movements when moving on the login screen. After he has followed
all the dots and no more dots appear, his data points (from the mouse
movements) will be compared to the template file already created during
registration phase. Following the ten dots with the mouse during the registration
phase creates the template file. If the patterns in both files match, he will be
allowed to login else he would be rejected.
In active authentication method we have three phases the enrollment phase, the
training phase and the verification phase. Enrollment phase is the process of
recording the user’s mouse movements on the ten dots, which appear on the
screen. The idea of training phase is to gather as much variation in user’s mouse
movements as much possible, which is done by recording his mouse movements
on those dots many times. Verification is the actual authentication process where
the user will either be authenticated or rejected.
3.1.1 Active authentication enrollment phase
In active authentication when the user is trying to logon onto a system, a login
screen with start and stop buttons appears. When the user presses start button,
14

he is shown the first dot. He has to move his mouse to the dot. When the mouse
reaches the dot, it disappears and the next dot at some other coordinate is
drawn. The user has to follow the dots as they appear on the screen. He is
shown ten dots with each dot appearing at different coordinates. The dots are
created using a random function with a constant seed (in java) keeping the
position of the dots fixed for every user. The user has to move the mouse on
those dots starting from dot number one to dot number ten. The idea is to check
how the user moves the mouse when he moves from one position on the screen
to another. Based on user’s mouse movements, the coordinates of the mouse
are recorded after every 50ms. Using the recorded coordinates, we calculate the
speed, deviation from a straight line and angle. Speed is calculated by dividing
distance by 50. Deviation is computed by finding the length of the perpendicular
from the point where the mouse is currently located (while moving) to the line
formed between two of the ten given points between which the mouse is moving.
Angle gives us the angle formed between the point where the mouse is currently
located, and the two points given by the two dots between which the mouse is
moving. Angle is further separated into positive angle (angle which lies between
0 to 180 degrees) and negative angle (angle which lies in the range 0>angle ≥ -
180 degrees. These parameters are stored in a file for that user. The user has to
move five times on the ten points to complete the registration. It is done to get as
much information about the user’s mouse movements as possible. Between each
pair of points, we find the average, standard deviation, minimum and maximum
of the four parameters speed, deviation, positive angle and negative angle. Thus,
15
there are sixteen parameters for a pair of points. There are one hundred and
forty four parameters (vectors) stored in the template file for nine pairs of points.
This procedure is repeated for all users who register. After finding all vectors for
a user, our next task was to normalize them. Normalization was necessary
because the variation in all four parameters was different. A small variation in
speed meant a lot more percentage change than a large increase or decrease in
angle or deviation because the speed didn’t vary much whereas angle and
deviation varied a lot. To normalize the vectors, we found the maximum and
minimum of all 4 vectors for all registered users. Difference between the
maximum and minimum value of a parameter gave the range for that parameter.
We multiplied each of the 144 vectors by 100 and divided by the range of the
corresponding parameter i.e., for all the parameters like average speed, standard
deviation of speed, etc that are derived from speed parameter, we multiply by
100 and divide by the range (maximum –minimum of speed for all registered
users) of the speed parameter. We stored all the normalized vectors in a file
Vector.txt. It contains 144 vectors of all users who register. The file will then be
used in training and verification phases. Enrollment phase is like mean of the
vectors and forms the base from which we compare the vectors in verification
phase. The flow of information in registration phase is shown in Figure 1.
16

Figure 1: Flow chart for registrati
Save
Create the vectors of 144 parameters
Create UsrReg.txt file (Stores all data points of user)
User Interface (login screen with 10 dots)
Screen shot of the login scre
As can be seen from the figu
recording. Dot 1 is also shown
Normalize the vectors
on phase
vectors in Vector.txt file
en created for the task is shown on the next page.
re it has two buttons for starting and stopping the
.
17

Figure 2: Screen shot of login screen
3.1.2 Active authentication training phase
During the training phase, the user is asked to move the mouse on the login
screen about 20 times. The user is asked to move in the same manner as in
enrollment phase with the exception that he can complete a round of following
the 10 dots after different intervals of time. This gives us all the variation in the
user’s training data. The 144 vectors that are discussed above are calculated for
each of the rounds during training session and recorded in a separate file. The
vectors obtained are normalized by dividing them by the range for the
corresponding parameter and multiplying by 100 like we did in the enrollment
phase. The vectors from training data of the user are compared with the
registered vectors calculated for him during the enrollment and the difference
18

between the corresponding vectors of the two files is calculated. We then add up
the corresponding individual difference of each vector and divide by 20 to get the
average difference from the registered vector. This is repeated for all the vectors.
We also find the standard deviation of difference of all vectors. Average and
standard deviation of the differences thus computed are stored along with the
user’s name in a file AvSd.txt. The file along with Vector.txt are used during
verification phase when the user actually tries to login. Training phase is like the
variance of vectors and stores all the variation in user’s movements.
3.1.3 Active authentication verification phase
Verification is the login phase where the user is authenticated or rejected. We
check if the user is the same person as he claims to be based on the files that we
created in enrollment and training phase for that user. When the user tries to
login after registering and training phases, each of his login vectors is subtracted
from the corresponding registered vector of all users. The differences obtained
are verified to check if they lie between average + 1.5*standard deviation and
average – 1.5*standard deviation of the difference for each vector for that user
which were calculated during training phase. If a parameter lies in that range of
average+ 1.5*standard deviation and average - 1.5*standard deviation, the
counter is incremented by 1. This procedure is repeated for all 144 vectors. In the
end we check the value of the counter. During testing, we also found the range
within which the user’s counter value would fall. If the counter had the highest
value for that particular user and also the value was within the user’s range, the
19

user is authenticated else he is rejected. If the user is accepted it means that the
difference of vectors was closest to the registered vectors for that user for the
maximum number of times. Figure 3 gives the flow of the verification procedure.
Store vecto
Create the ve
Figure 3: Flow of verification phase
Login Screen
Create UsrLog.txt file (Stores all data points of user)r in logVector.txt
ctor of 144 parameters
Compare logVector.txt with Vector.txt
Compute differences between all parameters of logVector.txt with the corresponding parameters in Vector.txt for each user
Check if the difference lies in the range of average +1.5*standard deviation and average -1.5*standard deviation of the difference asgiven by AvSd.txt file Authenticate the user if the count of the minimum difference of
differences is the highest and within range for that user
20
3.2 Passive authentication Passive authentication is the verification method that always keeps on working in
the background while the user is logged on. At any point of time, if the user’s
mouse motion around the screen does not match his recorded background
movements, he will be forced to logout. The idea is the same as active
authentication with the difference that there are no fixed dots on the screen.
Instead regions around the screen are treated like dots and a pattern for the
mouse movements around these regions during registration phase is recorded.
Similar method is followed for the verification phase where registered data points
are compared with the current mouse movements.
In passive authentication, we have two phases enrollment phase and verification
phase.
3.2.1 Passive authentication enrollment phase
During enrollment phase for passive authentication, we run the program that runs
in the background to record the mouse coordinates for 15 minutes. We separate
the coordinates into dense regions i.e., we draw a convex polygon around the
regions where we find there are more than 3 coordinates recorded within a 10-
pixel range. That gives us all the regions where the mouse moves most of the
time. We call them states. We then find the transitions from one state another.
We calculate the speed while moving from one state to another and also the
wavering in the mouse when the user is in the same state (angular velocity). We
21

then calculate the average speed, standard deviation of speed, average angular
velocity and standard deviation of angular velocity. We store the transition state,
count of how many times the user was in that state for those 15 minutes, average
speed and average angular velocity in a file which is used during verification
phase.
3.2.2 Passive authentication verification phase
During verification, we continuously keep recording the mouse coordinates in the
background. After every two minutes, we read the recorded coordinates, find the
speed and angular velocity when the mouse moves within the same state. We
ignore all the other coordinates. We compare the parameters of speed and
angular velocity with the parameters we found during registration phase. We
check if the speed and angular velocity for a transition state are within the range
of average+1.5*standard deviation to average-1.5*standard deviation of the
speed and angular velocity found in that transition state during registration. If
they lie between that range, we keep on doing the same process, but if at any
point of time, we find that the speed and angular velocity of the mouse within the
last ten states do not fall within the specified range, we pop up a dialog showing
that he is not the actual user. After every two minutes we keep refreshing the file
with new data points.
22
Chapter 4 Experiments and Results
A lot of experiments were done during the course work to get the system
working. The first set of experiments was aimed at finding the parameters, which
could relate a user with his mouse movements and could help in authenticating
him. These parameters had to be unique for every user to make the variation of
mouse movements between different users distinct. The next set of experiments
was done to find a way to make passive authentication working. We had to find a
way to record every mouse coordinate in the background. Third experiment
involved cleaning up the coordinates we got from the previous experiments. The
idea was to filter out the data coordinates to get a limited number of useful data
coordinates without the loss of any information. Another experiment was done to
find the dense regions on the screen where the mouse moved the most. This
would give us an idea about the position on the screen where the user spent
most of his time that would help in the passive authentication. The next
experiment involved finding a way to use the parameters we found in the first
experiment so that we could authenticate users based on their mouse
movements. All the experiments are explained in the sections below.
23

4.1 Active Authentication
4.1.1 To find mouse movement parameters that are unique for every user
The first experiment we did was to plot a graph of the parameters and time. The
idea of the task was to check if we could find a proper biometric which could
authenticate a user by moving the mouse. The parameters we could think of at
that time are variation in speed of different users while moving the mouse,
deviation from the straight line between two points and the angle formed while
the mouse is moving. Random motion of the mouse was restricted and the user
was asked to move only on the points, which would appear on the canvas. The
points were drawn with the help of random function with a constant seed. When
the user reaches one point, the point is erased and a new point at some different
location is drawn. This process continues until the user has followed all ten points
or pressed stop button. After moving the mouse on all the points or pressing
stop, a graph is shown which plots the parameters with respect to time. The
mouse coordinates are recorded every time the timer is triggered. There was
also a drop-down box for selecting the time for the timer. We experimented with
10 ms, 50 ms and 100 ms. For 10 ms, it recorded many points that were very
close to each other because a user could hardly move a mouse in 10 ms. For
100 ms, a number of data points were lost. 50 ms proved to be the perfect time
for this experiment. It not only noted almost all the points but also the visibility of
the graph was clear. For all the experiments, we used 50 ms as the time out
period. The recorded coordinates were then used to find the various parameters,
which could be used to find uniqueness in mouse motion. After all these
24

parameters were calculated, a graph was drawn which plotted these parameters
with respect to time. In order to plot the graph, a program was written to record
the mouse coordinates of the user. The application has two buttons start and
stop. On pressing start, timer was started. After every timeout period, the current
position of the mouse was recorded and stored. Using the mouse coordinates
that were recorded, the speed of the mouse motion was calculated by dividing
the distance traveled between two points with the duration of the timer as the
time interval between two consecutive points. A graph was then drawn that
plotted speed on Y-axis and time on X-axis. The second parameter we calculated
was deviation. Deviation is the shortest distance from the user’s mouse
coordinates to the straight line between the two points, which were drawn on the
canvas and between which the user is moving. Deviation from a straight line
between two points is calculated by finding the minimum distance of that point
from the straight line drawn between the two-recorded points. Deviation gives us
the path of motion between two points, which the user follows i.e., we will be able
to figure out whether the user has a pattern of deviating a lot from the line or he
closely follows a straight path. Finally, the angle of deviation that gives the
location of the mouse coordinates with respect to a straight-line between two
given points was calculated. The angle is calculated between the two points
shown on the canvas and the recorded mouse coordinate. If the user moves
above or to the left of a straight line between two points, it has a positive angle
and if the angle is below a line or to the right of it, it gives a negative angle.
25

Below are some of the graphs, which show the speed, deviation and angle of
different users.
The examples below show the different measuring parameters that were used.
Each graph is from a different user. Y-axis shows the speed, deviation and angle.
X-axis gives the time interval that is 50 ms for these examples. Green colored
graph shows the speed; blue shows the deviation and black color the angle of
deviation.
Figure 4: Graph showing speed, deviation and angle with respect to time. Green colored graph is the speed, blue color is the deviation from straight line and black color is the angle
26

Figure 5: Graph showing speed, deviation and angle with respect to time
Result: We took the samples from about 10 people. By looking at the graphs of
different people we found that some had a lot of variation in the speed or
deviation or angle. For some, the motion of mouse was very jittery when moving
from one point to another. We concluded that there was definitely some variation
in the movements of the mouse between different users. We concluded that we
could use the variation in the mouse movements to figure out who if the person
moving the mouse is really who he claims to be.
4.1.2 To find a way to use the parameters we got from the first experiment
so that we could authenticate users.
The idea of the experiment was to find how to use the four parameters (speed,
deviation, positive angle and negative angle) so that we could verify the
authenticity of users. Angle was separated into positive and negative angles to
27

avoid the possibility of averaging out the positive and negative values of the
angle. For four parameters we find average, standard deviation, maximum and
minimum between each pair of points i.e., from 1 to 2, 2 to 3 and so on. So
between a pair of points we found 16 parameters. We had 9 pairs of points,
which gave us 144 parameters for every user. From now on we will call them
vectors. Next task was to find a way to use these vectors so that we could
differentiate among users. The experiments done in this regard are explained in
the next few sub-sections.
4.1.2.1 Checking if the sum of square of differences is within a certain
threshold
We calculated the sum of the square of the differences of the vectors between
two users. We did this between each pair of users. We chose the smallest sum of
difference that existed between any two registered users. It gave us the lowest
difference of vectors between any two users i.e., the lowest difference by which
two users could differ in that particular set of users. We then calculated the
threshold by dividing the lowest sum of difference by 2. When any user tried to
login, we calculated the sum of differences of vectors between that user and all
registered users. For any registered user if the sum of differences was less than
the threshold, and that user was the one who tried to login, we would conclude
that the user was verified else he would be rejected.
28
Result: The method did not work as intended. Though the logic seemed to be
correct, not enough data points were below the threshold for us to make any
conclusion but most of the time it gave the lowest sum of the difference with the
actual user.
4.1.2.2 Calculating the lowest sum of differences for all users
The results from 4.5.1 showed that threshold was of no significance. So we
decided to skip threshold and just check the sum of difference and find with
which user it gave the lowest sum of differences. So we just computed the sum
of differences of the current user with all other registered users. If it showed the
lowest number with himself, he would be authenticated.
Result: It showed some promising results. It had a false acceptance rate (FAR)
of 40% and false rejection rate (FRR) of about 40%. The results gave some
encouragement to proceed with the strategy of checking the lowest sum of
difference, but we still needed some improvement.
4.1.2.3 Selecting specific parameters for each user
To reduce FRR and FAR we got from the above method; we decided to select
only a small number of parameters, which were closer to the user rather than use
all 144 parameters. The idea which prompted this change was that we thought
that may be because of some vectors, which showed lot of variation for the same
user, the sum of adding the differences for those variations changed the final
29

sum altogether. So we thought of selecting only a small of set of parameters
whose uniqueness was closer to that user than anyone else. We found the
unique set of parameters for each user by taking a sample of 20 mouse
movements of each user as described in the training set and comparing it with
the data points of the registered users. We then found the difference of each
parameter with the corresponding parameter for every user. If it gave the lowest
difference with the current user, we incremented the corresponding counter for
that parameter by one. We did this for all 20 sets of 144 parameters. We checked
for those parameters for which the counter gave a value of 10 or more which
meant that majority of the times, these parameters were closer to user’s own
registered parameters than anyone else’s. These were the parameters that were
unique for that person. During verification phase when a registered user tried to
login, we checked the user name and his unique parameters. We computed the
sum of the difference between the current user’s parameters and all the
registered users’ parameters for only the chosen parameters. If we got the lowest
sum of differences with the registered user name, we authenticated.
Result: The false rejection rate for the experiment was very promising about
10% but the false acceptance rate was very high about 90%.
4.1.2.4 Including rejection criterion in the above model
Next we thought of improving the model by reducing the false acceptance rate.
The condition for acceptance using the above method gave a FRR of only 10%.
30

In this method, we included the condition for rejection on top of the accepting
condition. We calculated the maximum and minimum sum of differences between
the user’s registered and training phase chosen parameters. During verification
phase, we would consider the user as authentic if the sum of difference of the
chosen parameters for that user with his registered parameters was the lowest
and also if the sum of the difference was in the range of maximum and minimum
sum of differences found after training phase. If sum of differences for that user
did not lie between the ranges of sum of differences calculated in training phase,
we would discard him as an intruder.
Result: There was a reduction in the false acceptance rate to 70% and increase
in the false rejection rate by 2%.
4.1.2.5 Using union of the specific parameters to get a common set of
parameters for all users
We then tried to use the chosen set parameters for each user in different ways
by making a common set out of the different set of parameters. We combined the
unique parameters to get a union of the sets of parameters for all users. We then
found the sum of the differences for those parameters for each user. The user
who gave the lowest sum of the difference was the verified user.
Result: It gave the false rejection rate of 50% and false acceptance rate of 47%.
31

4.1.2.6 Using intersection of the specific parameters to get a common set of
parameters for all users
We performed the method as above but instead used intersection of the chosen
sets of parameters.
Result: We got the false rejection rate of 57% and false acceptance rate of 57%.
Table 1 gives the FRR and FAR using techniques discussed in methods 4.5.1
through 4.5.6.
Experiment 1
All parameters
Experiment 2
Unique
parameters
Experiment 3
Unique
parameters
with rejection
Experiment 4
Union of
parameters
Experiment 5
Intersection
of
parameters
Experiment 6
Negative array
of parameters
FRR 65% 10% 12% 50% 57% 25%
FAR 23% 90% 70% 47% 57% 45%
Table1: FRR and FAR for methods 1 through 6
4.1.2.7 Using positive counter values
We also did a test where we used the unique parameters of each user but in a
different manner. For all the attempts a user did during training phase, we found
those parameters that were the closest to the users registered data. We also set
32

a counter for each parameter. Whenever any parameter was closest to user’s
registered parameter than any other user’s parameters, we would increment
counter by 1 else subtract counter by 1. We did this interchangeably between two
users i.e., first try was for user 1, second for user 2, third for user 1 and so on.
Thus we got an array of counters, which had positive value only for parameters
that were closest to the registered parameters for both users. When the user
tried to login we only compared those parameters, which had a positive counter.
If the sum of the differences was lowest for that user’s registered parameters, we
would treat the user as authentic.
Result: The results from this experiment showed the false rejection rate of 25%
and false acceptance rate of 45%.
4.1.2.8 Using lowest sum of the differences, counter values and range for
specific parameters
We changed the criterion for unique parameters for each user to find a better
way to distinguish people. We checked not only the lowest sum of difference but
also for how may of those individual parameters was the user closer to his
corresponding registered parameter. With the help of the training data for each
user, we calculated the differences between the corresponding parameters. We
then chose the maximum and minimum difference for each parameter and stored
them in a file. Next time when the user tried to login, we calculated the
differences and checked if the difference between the parameters was in
33

between the maximum and minimum difference value for that parameter. There
were two counters: yes counter and no counter, yes counter for incrementing
each time difference between the user’s current parameter was closest to his
registered parameter and the no counter was incremented each time, the
parameter was not the closest to the registered parameters. If the no counter
was more than 3, we rejected the user.
Result: After testing many times, we found that this method had a false rejection
rate of 26% and false acceptance rate of 30%.
4.1.2.9 Using lowest sum of the differences, counter values, average and
standard deviation for specific parameters
We made a slight change in the way we checked where the difference of
parameters should lie. Instead of using range of maximum and minimum
difference, we selected average and standard deviation. We found the difference
of each parameter of the training set with the corresponding registered
parameter. We repeated this for all 20 sets of training data. We calculated the
average and standard deviation of each parameter and stored in a file. After
calculating the difference between each user’s specific parameter, we checked if
that difference lies between average+ standard deviation to average- standard
deviation. We had to check the method with various numbers like average+-
2*standard deviation and average+-3*standard deviation. We came up with the
conclusion that average+-standard deviation was the perfect for this method.
34

Result: False rejection rate for this method was 90% and false acceptance rate
was 13%.
4.1.2.10 Using lowest sum of the differences, counter values, average and
standard deviation for all parameters
To avoid the process of calculating different sets of unique parameters for each
user, we thought of using the above method of average, standard deviation but
on all 144 vectors. Instead of checking for only a small set of parameters, we find
if difference of every parameter lies in the range of average + standard deviation
and average - standard deviation. This improved the figures for false acceptance
and rejection rates considerably.
Result: Testing with this method produced FRR of 10% and FAR of 9%.
Table 2 gives the figures for FRR and FAR for method 8, method 9 and method
10
For specific parameters
Av+3sd Av+2sd Range (Max-Min of differences)
For all parameters
Av+sd Av+2sd
FRR 40% 90% 0% 10% 10%
FAR 36% 13% 40% 9% 18%
Table 2: FRR and FAR for method 8, method 9 and method 10
35

4.1.2.11 Comparing each user’s data with his statistical model
For each of the attempts of training phase, we checked if the difference between
the registered vector and its corresponding training phase vector lies within the
range of average+1.5*standard deviation to average –1.5*standard deviation of
that user. If so, we incremented the yes counter. We thus found the range of yes
counters for that user. When the user tried to verify, we compared his verification
data points with registered data points and computed the yes counter for them.
To authenticate the person, we checked if it lies in the range of counters for that
user. If the condition was satisfied, he was authenticated.
Results: Here are the results we obtained by performing the above experiment.
We checked it for 1 registered user and for multiple registered users. As you can
see, if the number of users increases, FAR also increases. This happens when
the users have overlapping range of yes counters. If there are no overlapping
regions among users, then FAR will remain fixed.
1 user 3 users
FAR 20% 31.5%
FRR 0% 0%
Table 3: FAR and FRR for method 11
36

4.1.2.12 Using counter values, range of counter values, average and
standard deviation for all parameters
The flaw with method 10 was that if there is only one user registered, any person
can forge him since there is only one value and it has to be the highest for that
user. To solve this problem, we also included the range of counter values for that
user as explained in method 11. We found the counter values for each of the
attempts during training phase and thus computed the range of counters for that
user. During verification, we would compute the difference between registered
and verification data points and check if they lie between average+ 1.5 * standard
deviation to average-1.5*standard deviation. If so, we would increment the
counter value. In the end we would check if the counter value lies in the range for
that user and then we would check if it is the highest for that user compared with
the rest of the users.
Results: FAR decreases from 20% to 5% for single registered user and from
31.5% to 13.1% for 3 users. At the same time FRR increased from 0% to 20% for
1 user and 0% to 25 % for 3 users.
1 user 3 users
FAR 5% 13.1%
FRR 20% 25%
Table 4: FAR and FRR using method 12
From the information we gathered by performing the above explained
experiments, we concluded that the last method where we used all parameters
37

and checked if each parameter varied from the corresponding registered
parameter by only a range of average+ 1.5*standard deviation and average-
1.5*standard deviation and also was within the range of the user’s counter values
is the best method for authentication. If the number of such parameters was the
highest for the same user, he was authenticated.
4.2 Passive Authentication
4.2.1 To find a way to record mouse coordinates in the background
The experiment was done for the passive authentication. The idea of this task
was to note the movements of the user in background. This helped to track the
path of motion of the user. Wherever the mouse moved, the coordinates were
noted in some file. Later the coordinates were extracted from the file and a graph
was plotted to show the coordinates. To note the coordinates in the background
a hook had to be installed. According to the MSDN library, “a hook is a point in
the system message-handling mechanism where an application can install a
subroutine to monitor the message traffic in the system and process certain types
of messages before they reach the target window procedure.” [8] A system can
support various types of hooks for providing access to different message
handling mechanisms. There is a separate hook chain, a list of pointers to
application defined callback functions called hook procedures. “When a
message occurs that is associated with a particular type of hook, the system
passes the message to each hook procedure referenced in the hook chain, one
after the other”. Our application had to use the WH_MOUSE Hook to monitor the
38
message traffic for mouse messages. A Windows program was written for this
task that recorded the mouse coordinates on every move the user made. This
program had two files: a Win32 application file and a dynamic link library (DLL)
file which actually installed the hook. A DLL file had to be created because a
global level hook had to be installed i.e., we had to record mouse coordinates for
each window and not just for a single Window application. There is an entry point
for the Windows application that calls the function in DLL file. The function then
installed the mouse hook. The mouse hook checked for any mouse movements.
Whenever the mouse moved, a message was generated in the queue. If two
consecutive points differed by more than five pixels, then the coordinates were
written into a file otherwise they were rejected to avoid excessive plotting of
points. Along with the mouse coordinates, the current time was also written in the
file. A Java program then read the file and plotted those points where X-axis
represented the x-coordinate and Y-axis the y- coordinate. Figure 3 is a graph of
the coordinates where a user moved the mouse. These coordinate positions are
gathered for about 4 hours. Each oval shows the pixel where the user's mouse
moved.
39

Figure 6: Graph showing the mouse motion coordinates
The program for doing the task was written in Windows. A function for installing
the mouse hook and removing was called from Win32 file and the function was
itself written in DLL file. The function in DLL file then installed the mouse hook
using SetMouseHookEx () command which sends it into a callback function that
posts a message in the queue every time mouse moves.
Result: Through this experiment, we were able to get a list of all the coordinates
where the user mostly moves. The recorded motion is then compared with the
user’s current mouse movements to find if the pattern of his recorded motion
matches with his current movements.
4.2.2 To filter the data coordinates
The idea of this task was to separate the regions where the mouse moves
around most of the time. For finding it, we first had to clean the data points we
40

recorded by performing the experiment given in section 4.2. We had to reduce
the number of coordinates without losing any information about the possible path
of mouse movements. A number of experiments were done to filter the data
coordinates. Below is the list of tasks we did to achieve the purpose.
4.2.2.1 Delete coordinates just before and after mouse went idle
We checked if the mouse remained idle for 1 minute between two consecutive
data points. If so, we deleted all the data points, which were within five-second
interval before the first data point and five second interval after the second data
point. The idea was to reduce the concentration of those points that lead to a
certain point after which the mouse goes idle for sometime. A person usually
slows down the speed of the mouse when he has reached his target. If we are
able to delete those points when mouse is slow, we could reduce the number of
points without losing any important data points. The graph formed using the
above technique is given in Figure 7.
Figure 7: Reduced data points when idle points are removed
41

Result: As can be seen from Figure 4, the concentration of data points was not
reduced much. There were still a large number of data points and hardly a few of
them seemed to have been removed. Actually, it didn’t make much of a
difference in this case where there were only a few idle points.
4.2.2.2 Delete coordinates where the speed was above a threshold
We saved only those data points which were below a certain threshold of
velocity. The idea was to remove those points, which were caused by
unnecessary motion of the mouse. It often happens that whenever mouse moves
very fast i.e., above a threshold speed recorded for that person, it is an
unnecessary movement of the mouse. Therefore, we thought of discarding such
points, which did not give us any specific information about the user’s mouse
movements. These were random points. The graph plotted after implementing
the above-defined procedure is given in Figure 8.
Figure 8: Reduced data points when a certain limit is applied to the speed
42

Result: As can be seen from the graph, removing the data points that were
associated with frequency higher than a certain threshold did not make a
significant change in the concentration of points.
4.2.2.3 Find window resize events associated with the mouse movements
We plotted only those points for which resize Window events like maximize,
minimize, resize, move, create or destroy any window are associated. The
purpose of this experiment was to link the congestion of the points with any
resize window event so that we could figure out the part of the screen where the
windows were resized. For doing this task, I had to install another windows hook
apart from mouse hook. This hook is called WH_CBT hook. According to MSDN
library, ”The system calls a WH_CBT hook procedure before activating, creating,
destroying, minimizing, maximizing, moving, or sizing a window; before
completing a system command; before removing a mouse or keyboard event
from the system message queue; before setting the input focus; or before
synchronizing with the system message queue”. In the main Win32 application
file, a function was called in the DLL file that installed CBT hook. The hook
recorded every resize event and sent it to the main application. Whenever any
window was resized, a message was generated in the queue. For each of these
messages, a ‘1’ was written into the file associated with the mouse coordinates at
that point of time. If no resize event was generated i.e., no window was resized, a
43

‘0’ was written in the file corresponding to those mouse coordinates. The result of
the experiment is shown in Figure 9.
Figure 9: Data points showing window resize events
Result: As seen from Figure 9, the concentration of data points can only be
found along the boundaries of the screen with almost no concentration of points
in the center of the screen. The points on the right corner of the graph suggest
that the windows were either closed or minimized or maximized and those on the
right side suggest that the windows were resized. The points on the top-left side
suggest that new windows were opened with File->Open option which is on the
top-left side of the windows.
4.2.2.4 Plot coordinates with different colors after every 20 minutes
We plotted points with 20-minute interval with different colors. The aim of this
experiment was to see if could find the pattern of the motion of the mouse.
44

Figure 10: Data points with different colors applied after every 20 minutes
Result: The colors were spread everywhere around the graph, so we couldn’t
conclude anything.
4.2.2.5 Selecting points around which density of points was above a certain
number
We picked only those regions where the number of points was more than a
certain number. We did it by selecting a point and then checking if there were a
certain number of points in the region around it. If so, we recorded all those
points otherwise the main point was discarded. The idea was to select only those
regions where there was a dense blob, which implied that the mouse hovered
around that region for more time. We performed the experiment with different
number of data points around one point. We checked with 10,15,20,25 etc. After
cleaning the data, the graph looked like given in Figure 11.
45

Figure 11: Data points where the density of points is more than a certain threshold count
Result: If the background movements were captured for more than an hour, we
found that keeping those regions where density of points was more than 25
points was reasonable whereas if the movements were captured for 15- 20
minutes, keeping the criterion for recording points with the density of 5 or more
points gave us more promising results.
After observing all the graphs that were obtained by performing the experiments
given in section 4.3, we concluded that procedure given in section 4.3.5, where
only those points, which have a dense region around them, were selected, was
the most effective method for cleaning the data and removing any isolated points.
4.2.3 To find dense regions around the screen where the mouse moved
most of the time and to bind them with enclosed figures
46

The task after cleaning the data was to separate the dense regions. The screen
coordinates, where the mouse moved, had to be divided into small dense regions
and enclosed by a bounded figure. This was done to form small-enclosed figures,
which would serve the purpose of transition states. The transition states serve
the same purpose as the dots for passive authentication. A couple of algorithms
were used for this purpose.
4.2.3.1 To draw a rectangular region around dense regions
We found the top-left and bottom-right points and then drew a rectangle using
those two points. Top-left points were chosen if there were more number of
points below and to the right of the point than above and to the left of that point
respectively. A point was a bottom right point if there were more points above
and to the left of the point than below and to the right of the point. For each top-
left point, we found the corresponding bottom right point. When for each top-left
point, a bottom–right point was found; we drew a rectangle with top-left being the
top-left coordinate for the rectangle and bottom-right point being the bottom right
coordinate for the rectangle. This rectangle represents a dense region with the
concentration of points enclosed within it and has sparse region surrounding it.
The graph we obtained by following this procedure is given in Figure 12.
47

Figure 12: Graph showing the rectangles formed by finding top-left and bottom-right points
Result: The experiment was not successful. The problem with the concept was
that we were just considering the points which were in a straight line above,
below, left or right of the point. This gave us only small number of dense regions.
We did not consider a wider area, more like a rectangular region around that
point. This problem was solved by using Gift wrapping algorithm.
4.2.3.2 To draw convex hull around the dense regions based on gift
wrapping algorithm
The idea of gift wrapping algorithm is to draw a convex hull around any dense
region. The algorithm first computes the point, min, of minimal horizontal value
and all the points, which are within 30-pixel range of that point. All these points
were stored in a vector. Within this vector, we find the point, max, of maximal
horizontal value. Using a vertical line and starting at min, we calculated the
clockwise angle to every point in the vector until we got max. We selected the
point with which it forms the smallest clockwise angle. This point was added to
48

the convex polygon. Similarly using a vertical line and starting at max, we
calculated the next point of minimal clockwise angle greater than 180 until we got
to min. These points are also added to the polygon. [10] From this point, we
selected another point, which formed the greatest angle in clockwise direction.
These points were added to the polygon. These points form the convex polygon
around each dense region. We deleted all these points from the actual list and
continued with the gift-wrapping algorithm, until all regions were surrounded by a
convex polygon. We implemented it in three different ways. The methods are
explained below.
4.2.3.2.1 Using gift wrapping algorithm once
It was the simple implementation where a point and all points in 30-pixel range
are selected and a convex hull is drawn around these points. The results are
shown in Figure 13.
Figure 13: Graph showing convex polygons within 25 pixels using gift wrapping
algorithm
49
Result: As can be seen from Figure 13, there were a lot of small dense regions
formed out of which many polygons were overlapping on the other polygons. We
wanted to reduce the number of polygons, so we decided to follow
implementation 2.
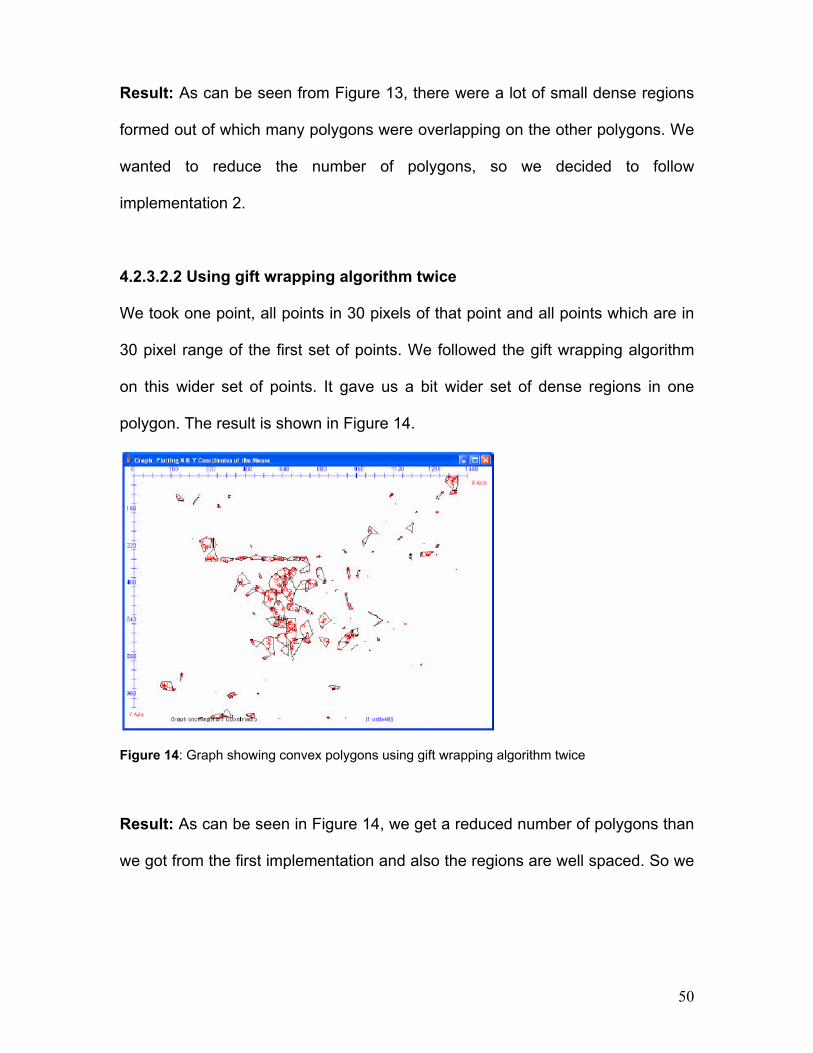
4.2.3.2.2 Using gift wrapping algorithm twice
We took one point, all points in 30 pixels of that point and all points which are in
30 pixel range of the first set of points. We followed the gift wrapping algorithm
on this wider set of points. It gave us a bit wider set of dense regions in one
polygon. The result is shown in Figure 14.
Figure 14: Graph showing convex polygons using gift wrapping algorithm twice
Result: As can be seen in Figure 14, we get a reduced number of polygons than
we got from the first implementation and also the regions are well spaced. So we
50

rejected implementation 1. We then wanted to find if we could further reduce the
number of polygons, so we tried implementation 3.
4.2.3.2.3 Using gift wrapping algorithm recursively
We recursively used the second implementation to get very wide regions. We
took first point and all the points, which were within 30-pixels distance from that
point. We then took these points and selected the points, which were within 30-
pixels distance of those points. We continued the procedure until we found no
pixels within 30 pixels of all the points covered so far. Figure 15 shows the
implementation 3.
Figure 15: Graph showing convex polygons using gift wrapping algorithm recursively
Result: The problem with this implementation was that some small regions came
inside a large region and the large regions covered a lot of screen area.
51

After implementing all the techniques, we concluded that the second
implementation of the gift wrapping algorithm gave the most promising results
and was relevant to our needs.
4.2.4 To find a method that could verify the authenticity of the user
continuously by working in the background
The idea was to find a method by which we could authenticate a person at all the
times while he is logged in. The program should work in the background all the
time and check if the person moving the mouse is the same person who logged
in. We recorded the movements for a user for 15 minutes. We then recorded the
movements again for 2 minutes for the same user. The idea was to see if the
user followed the same path every time he moved the mouse and with the same
speed. Earlier we thought we would compare the transitions from one state to
another during enrollment phase to the transitions done currently. But when we
looked at the data, we found that not many of the transitions that took place
during enrollment could be found during a different recording. But there were
transitions within the same state that could also be seen in the other recordings.
So, we decided to delete the coordinates where the mouse moved between
different states and only choose the coordinates where the transition was within
the same state. We calculated the speed for that transition and the angular
distribution of two mouse positions from the center of the convex hull. We
calculated the angle by finding the cosine inverse of the quotient of the dot
product of the two vectors from the center of hull and the length of the vectors.
52

For the points within a convex hull, we found the equation of the best-fit line by
using chi-squared minimization. We then calculated the distance of each point
within the hull from the best-fit line. The idea was to find how much does the user
deviate from the best-fit line. We recorded the average speed, average angular
distribution, standard deviation of speed, standard deviation of the angle and
standard deviation of distance. These parameters were recorded for the
enrollment phase. After login, the program for recording the mouse coordinates
keeps running in the background and we find the speed, angle and distance from
the best-fit line for each transition within the same state. We check from the
registered data if the speed, angle and distance from the best-fit line lie within the
average + standard deviation and average– standard deviation for that particular
parameter. If majority of parameters fall within the specified range, we keep that
user going on else we pop up a dialog box warning that he is not the user who
logged in.
Results: The results from the experiment were not encouraging. I believe that
the reason for that is the use of less number of parameters during passive
authentication. The model had an acceptance rate of almost 90%.
53
Chapter 5
Conclusion
Security plays a very important role in modern world where almost everything is
done with the computer. To make personal computers secure various software
models have been developed. In our project, we attempted to develop one such
model that hasn’t been tried before. We developed a model that can authenticate
a user with his mouse movements. The model does not require any additional
hardware. The model has two modes of operation, active authentication and
passive authentication.
Active authentication is the initial login where the user is presented with a screen
and he has to move the mouse towards the dots drawn on the screen. The
parameters that we used for active authentication are speed, deviation from
straight line between two points and the angle of deviation. We made 144 vectors
from these parameters and then used them to find uniqueness in user’s
movements. The results that we got from active authentication seemed very
promising. The false acceptance rate and false rejection rate of the model is 10%
each which means that the model can be used for user authentication with a
mouse.
Passive authentication keeps a tab on the user’s mouse movements in the
background and pops a dialog box when the movements are not in accordance
54

with the registered user’s mouse movements. The parameters we used for
passive authentication are speed, angular distribution with respect to the center
of the hull and distance from the best-fit line. We computed six vectors from
these parameters and used them to find the variance in user’s mouse
movements within same state. We were not successful in making a working
model for passive authentication. This may be due to the fact that we did not use
parameters that were relevant to get the results. We are hopeful that by adding
some more vectors, we will be able to define a model for passive authentication.
Future Work
The model can be further improved if we add some more parameters. The
increase in the number of parameters will help to reduce false acceptance rate
as well as false rejection rate. One more parameter that we could add is mouse
clicks. When the user reaches a dot on the login screen, we could ask him to
click when he thinks he reached the target dot instead of we deciding when to
make the dot disappear and the next dot appear. We could also note the
response time of the clicks. We can further improve the model by making a
proper user interface where the login screen we designed will replace the login
screen of the Windows and Windows would boot only if the user is able to
authenticate with his mouse movements.
55

Testing Requirements
Since our whole model is based on the accuracy of a mouse, we had to be
certain that we are getting the same type of data points for all users i.e., if there
was some hardware glitch, it would be for all the users and not one of them. To
avoid these problems, we always used the same processor, same mouse and
same mouse pad during testing. The processor always worked on battery power.
This was done to remove the differences in the data, which could come up due to
the hardware differences, which could have risen if we had used different
processors or mouse. Given below are the details of the system that we used
while performing all the above experiments:
Processor: Intel Mobile Operating System: Windows XP Professional
56

57
Appendices Appendix A: Bibliography 1) Statistical Language Learning. Eugene Charniak. MIT. 1993.
2) Circuit complexity and Neural Networks. Ian Parberry. MIT 1994
3) Java-Based Internet Biometric Authentication System. Ross A.J & Peter W.
McOwan. IEEE Transactions on Pattern and Machine Intelligence. 25(9). Page
1166-1172. 2003.
4) Computational Geometry in C. Joseph O’Rourke. Cambridge University Press.
1998
5) Who types there? Communications of the ACM. 46(12) December 2003.
6) An Identity Authentication System Based On Human Computer Interaction
Behavior. Hugo Gamboa & Ana Fred. Pattern Recognition in Information
Systems.2003
http://www.lx.it.pt/~afred/anawebit/articles/AFred_PRIS2003.pdf
Web References: 7) http://www.whatis.com/
8)http://msdn.microsoft.com/library/default.asp?url=/library/enus/winui/winui/wind
owsuserinterface/windowing/hooks/hookreference/hookfunctions/setwindowshoo
kex.asp
9) International Biometric Group. “Biometrics Market and Industry Report 2004-
2008”.
http://www.biometricgroup.com/reports/public/market_report.html
10)http://www.cs.sjsu.edu/faculty/pollett/20.1.00w/hw3.html
11)http://www.infopeople.org/howto/security/users/smart_cards.html
12)http://www.findbiometrics.com/Pages/feature%20articles/innovative-uses.html
13) http://www.schneier.com/crypto-gram-9808.html#biometrics