australiaʼs specialist fibre and network for personal … · hong kong san jose los angeles usa...
TRANSCRIPT
Annual Report 2019
AUSTRALIAʼS SPECIALIST FIBRE AND NETWORK SOLUTIONS PROVIDER
Vocus Group | A
nnual Rep
ort 2019
For
per
sona
l use
onl
y

ABOUT THIS REPORT
The Annual Report 2019 is a summary of Vocus operations, activities and financial position for the 12 month period to 30 June 2019. Vocus Group Limited is the parent company of the Vocus group of companies. In this report, unless otherwise stated, references to “Vocus”, “the Group”, “the Company”, “we”, “our” and “us” refer to Vocus Group Limited and its controlled entities. In this report, references to the financial year refer to the period 1 July to 30 June unless otherwise stated. All dollar figures are expressed in Australian dollars, unless otherwise stated.Our Corporate Governance Statement, detailing our compliance with the ASX Corporate Governance Council’s “Corporate Governance Principles & Recommendations – 3rd Edition” can be found online at our website via http://vocusgroup.com.au/about-us/corporate-governance/.
REPORT OBJECTIVESThis report meets our governance and compliance requirements and has been written to provide shareholders and interested parties with clear, easy to understand information on the Company and its performance in FY19.
ADDITIONAL INFORMATIONThis report can also be found online via http://vocusgroup.com.au/investors/company-performance/annual-reports/A full copy of our Sustainability Report, reviewing our environmental, social and economic impact, can be found online via http://vocusgroup.com.au/sustainability/sustainability-report/.
KEY DATESFinancial Year End – 30 June 2019Annual General Meeting – 29 October 2019The 2019 Annual General Meeting will be held at the Warrane Theatre at the Museum of Sydney. Please refer to our website for further detail and a webcast of the meeting: www.vocusgroup.com.au.
Cable for the Tiwi Islands on board the ile de Brehart
VOCUS GROUP Annual Report 2019
For
per
sona
l use
onl
y

CONTENTS
IFC About This Report
02 Key Highlights
04 Key Statistics
06 Business Units
08 Sustainability Priorities and Achievements
10 Chairman and CEO Report
12 Directors’ Report
18 Remuneration Report
35 Operating & Financial Review
48 Auditor’s Independence Declaration
49 Financial Statements
53 Notes to the Financial Statements
102 Directors' Declaration
103 Independent Auditor’s Report
108 ASX Additional Information
110 Corporate Directory
01
For
per
sona
l use
onl
y

Australia Singapore Cable generating strong sales
Modernisation program for legacy technology approved and underway
KEY HIGHLIGHTS 2019
Tier One Executive and Senior Leadership teamESTABLISHED
A year of significant change with turnaround foundations firmly ESTABLISHED
Implementing a digital operating model • Improving customer service experience• Reducing cost to serve
Coral Sea Cable survey, design and manufacture completed and laying commenced
Culture and values
RESET
VOCUS GROUP Annual Report 2019
02
For
per
sona
l use
onl
y

Systems availability targets exceeded
• Operating Support Systems (OSS)
• Business Support Systems (BSS)
• IT Systems138%INCREASE in employee netpromoter score
Vocus Network Services resilience targets exceeded
• IP Core Network• Edge network• Voice Network• Transmission Network
Dodo brand refreshed • Enhanced Dodo customer experience
Commander brand refreshed • Commander Centre channel
reinvigorated• New centres opened
MVNO agreement renegotiated with Optus• Improved mobile offers • Pathway to 5G and fixed wireless broadband
Enterprise and Retail products simplified• Making our services easier to buy and use • Improving customer service experience
Strong organisational clarityCLEAR VISION AND OPERATING STRUCTURE ESTABLISHED
03
For
per
sona
l use
onl
y

ALICE SPRINGS
TOWNSVILLE
DARWIN
PORT HEDLAND
PERTH
ADELAIDE
MELBOURNE
HOBART
WHANGAREI
AUCKLAND
TAURANGA
NAPIER
WELLINGTON
CHRISTCHURCH
DUNEDIN
NELSON
PALMERSTON NTH
NEW PLYMOUTH
HAMILTON
CHRISTMASISLAND
GERALDTON
SINGAPORE
JAKARTA
BRISBANE
NEWCASTLE
SYDNEY
CANBERRA
ASC
VOCUS NETWORK
RBBP FIBRE3RD PARTY
HAWAII
HONG KONG
SAN JOSE
LOS ANGELESUSA
OUR PEOPLEVocus strives to be the challenger customers deserve and our people are proud of every day.
OUR CORE ASSETS
North West Cable System connecting offshore oil and gas facilities
KEY STATISTICS
OUR NETWORKVocus is Australia’s specialist fibre and network solutions provider, connecting all mainland capitals with Asia. We are proud to have built a world class telecommunications infrastructure platform across Australia and New Zealand to support the rapid growth in demand for increasingly resilient, secure and reliable network connectivity.
Our Australian fibre network connects capital mainland cities with Auckland, stretching across the Tasman and connecting north and south islands of New Zealand and to the United States and Hong Kong. From Australia’s west coast, our Australia Singapore Cable connects to Indonesia and Singapore, extending the reach of our network and providing a secure southern route connecting South East Asia to North America via Australia.
15,020km OF INTER-CAPITAL NETWORK IN Australia
OVER 9,500km of metropolitan and regional fibre IN ALL MAJOR CENTRES
4,200 km OF INTER-CAPITAL NETWORK IN New Zealand
04
For
per
sona
l use
onl
y

ALICE SPRINGS
TOWNSVILLE
DARWIN
PORT HEDLAND
PERTH
ADELAIDE
MELBOURNE
HOBART
WHANGAREI
AUCKLAND
TAURANGA
NAPIER
WELLINGTON
CHRISTCHURCH
DUNEDIN
NELSON
PALMERSTON NTH
NEW PLYMOUTH
HAMILTON
CHRISTMASISLAND
GERALDTON
SINGAPORE
JAKARTA
BRISBANE
NEWCASTLE
SYDNEY
CANBERRA
ASC
VOCUS NETWORK
RBBP FIBRE3RD PARTY
HAWAII
HONG KONG
SAN JOSE
LOS ANGELESUSA
Our Values
One Team: we share common goals, trust each other and collaborate to deliver
Our People are the Difference: we build environments where our people thrive
More than 5,500 ON-NET BUILDINGS
Connectivity TO 17 MAJOR SPORTS STADIUMS
AUSTRALIA SINGAPORE CABLE gateway to Asia
Connectivity means more to us than fibre in the ground – our culture is connected to the way we do business, the way we work together and the results for our customers and shareholders.
Disruptive Thinking Every Day: we see and create opportunities, move fast and set our own course
Crazy About Customers: we let our customers know, through great service, products and experiences
05
For
per
sona
l use
onl
y
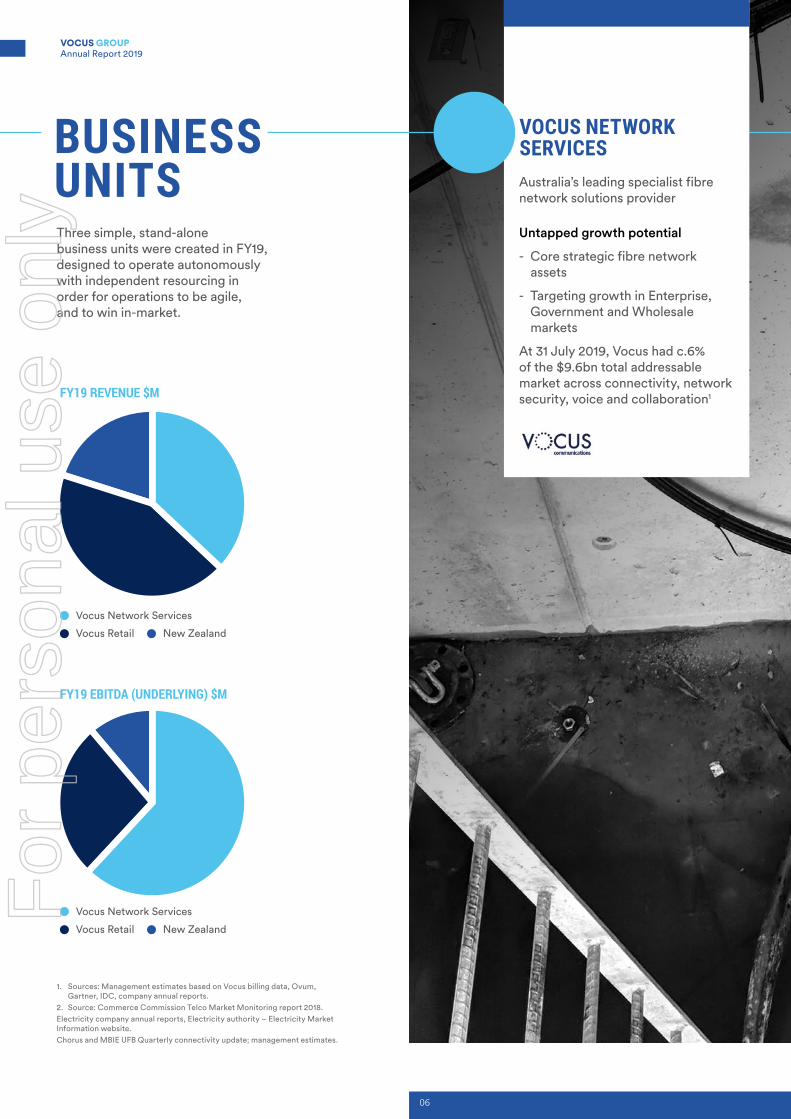
Three simple, stand-alone business units were created in FY19, designed to operate autonomously with independent resourcing in order for operations to be agile, and to win in-market.
BUSINESS UNITS
1. Sources: Management estimates based on Vocus billing data, Ovum, Gartner, IDC, company annual reports.
2. Source: Commerce Commission Telco Market Monitoring report 2018.Electricity company annual reports, Electricity authority – Electricity Market Information website.Chorus and MBIE UFB Quarterly connectivity update; management estimates.
VOCUS NETWORK SERVICESAustralia’s leading specialist fibre network solutions provider
Untapped growth potential
- Core strategic fibre network assets
- Targeting growth in Enterprise, Government and Wholesale markets
At 31 July 2019, Vocus had c.6% of the $9.6bn total addressable market across connectivity, network security, voice and collaboration1FY19 REVENUE $M
Vocus Network Services
Vocus Retail New Zealand
Vocus Network Services
Vocus Retail New Zealand
FY19 EBITDA (UNDERLYING) $M
06
VOCUS GROUP Annual Report 2019
For
per
sona
l use
onl
y

VOCUS RETAILReseller of broadband, mobile, voice and energy
Reset and Turnaround
- Multi-brand strategy across Business and Consumer
- Underserviced Business market
- Competitive Consumer market
- Structural headwinds in voice and broadband from introduction of NBN to be offset by growth in energy and mobile
At 31 July 2019, Vocus had less than 2% of the total addressable mobile market across Business and Consumer1
The simplest choice for household services – fixed, mobile and energy
“Simple, not stupid.”
For individuals on the go who always want to stay in touch.
“The most flexible internet you can get.”
The small business telco that disrupts, to give Australian small businesses better value at speed.
“Making business faster, faster.”
VOCUS NEW ZEALANDFull service offering of fibre connectivity, broadband, voice energy and mobile
Strong performer with strategic optionality
- Multi-brand strategy across Business and Consumer
- Sustained growth, driven through well-established brands
- Growth ambitions enabled
At 31 July 2019, Vocus had c.13% of the Ultra Fast Broadband (UFB) Services In Operation (consumer broadband market share)
At 31 July 2019, Vocus had c.5% of the Enterprise & Government market share
$5.4bn total addressable market across Business and Consumer2
Serving Enterprise, Government and Wholesale
Provider of IP Voice and small-medium business connectivity
Broadband, Power and Mobile for Kiwi families
Fibre leader, driving innovation in residential and small business
07
For
per
sona
l use
onl
y

SUSTAINABILITY PRIORITIES AND ACHIEVEMENTS
FY19 ACHIEVEMENTS FY20 PRIORITIES
Community In FY19, we met our stated goal of maintaining the high level of volunteering activity within our Team. Team dedication to volunteering was outstanding, and the coordination with Telco Together gave us this great outcome.
In FY20, we will make our volunteering activities more targeted to team interests, and through our Sustainability Committee we will empower our team to work in the areas where they want to effect positive change.
Suppliers During FY19 we have renegotiated and extended for a further 5 years our Mobile Virtual Network Operator agreement with Optus Wholesale.
Preparation for publication of first report under Modern Slavery Act.
Environment Calculated carbon emissions from motor vehicle fleet and air travel.
We have also for the first time published data about the altitude of our Cable Landing Stations, the assets most susceptible to the risk of rising sea levels.
Following a period of verification of data and trends, we intend to commence publishing carbon emissions from our data centres and offices in addition to the vehicle fleet and air travel.
We are targeting emissions reductions through a transition to more fuel efficient vehicles, reduction in avoidable air travel and consolidation of office and data centre locations.
Diversity We have met our commitment to improving the gender balance at the senior leadership level in FY19.
Reflecting the commitment made by our new management team to improve diversity amongst the senior ranks of our organisation, we increased the number of women on the Executive Leadership Team by 66% to three and increased the number of senior and other managers by 25% to 62.
Launched our Diversity Committee.
Our diversity committee has outlined a series of priorities for FY20, including:
Development of a Graduate Program to build diversity of thought
Review of our Diversity Policy to better support diversity across the business and facilitate diversity in our recruitment
Dedicated communication and awareness activities within the business to support our diverse team in and outside of the business, so we can show on the outside who we are on the inside
Team Defined and relaunched our Vocus values and embedded them within our team by running 90 values workshops with more than 1000 participants, brainstorming how the values apply to their teams.
Continued our investment in the Vocus Leadership Development programme, investing 2,400 hours in training future leaders.
Create a culture of reward and recognition through our internal program, Shine, as Our People Are the Difference.
Improve further on making Vocus an awesome place to work through our Benefits and Wellbeing programs.
Continue to strengthen the skills and capability of our team.
Customer We saw a 35% reduction across Dodo and iPrimus brands for Ombudsman Complaints per 10,000 Services In Operation (4.5 to 2.9, and a 55% reduction in respect of our Commander brand (from 9 to 4 per 10,000 Services In Operation).
We will continue our process of simplification, digitisation and modernisation to further improve our customer experience.
08
VOCUS GROUP Annual Report 2019
For
per
sona
l use
onl
y

FY19 ACHIEVEMENTS FY20 PRIORITIES
Community In FY19, we met our stated goal of maintaining the high level of volunteering activity within our Team. Team dedication to volunteering was outstanding, and the coordination with Telco Together gave us this great outcome.
In FY20, we will make our volunteering activities more targeted to team interests, and through our Sustainability Committee we will empower our team to work in the areas where they want to effect positive change.
Suppliers During FY19 we have renegotiated and extended for a further 5 years our Mobile Virtual Network Operator agreement with Optus Wholesale.
Preparation for publication of first report under Modern Slavery Act.
Environment Calculated carbon emissions from motor vehicle fleet and air travel.
We have also for the first time published data about the altitude of our Cable Landing Stations, the assets most susceptible to the risk of rising sea levels.
Following a period of verification of data and trends, we intend to commence publishing carbon emissions from our data centres and offices in addition to the vehicle fleet and air travel.
We are targeting emissions reductions through a transition to more fuel efficient vehicles, reduction in avoidable air travel and consolidation of office and data centre locations.
Diversity We have met our commitment to improving the gender balance at the senior leadership level in FY19.
Reflecting the commitment made by our new management team to improve diversity amongst the senior ranks of our organisation, we increased the number of women on the Executive Leadership Team by 66% to three and increased the number of senior and other managers by 25% to 62.
Launched our Diversity Committee.
Our diversity committee has outlined a series of priorities for FY20, including:
Development of a Graduate Program to build diversity of thought
Review of our Diversity Policy to better support diversity across the business and facilitate diversity in our recruitment
Dedicated communication and awareness activities within the business to support our diverse team in and outside of the business, so we can show on the outside who we are on the inside
Team Defined and relaunched our Vocus values and embedded them within our team by running 90 values workshops with more than 1000 participants, brainstorming how the values apply to their teams.
Continued our investment in the Vocus Leadership Development programme, investing 2,400 hours in training future leaders.
Create a culture of reward and recognition through our internal program, Shine, as Our People Are the Difference.
Improve further on making Vocus an awesome place to work through our Benefits and Wellbeing programs.
Continue to strengthen the skills and capability of our team.
Customer We saw a 35% reduction across Dodo and iPrimus brands for Ombudsman Complaints per 10,000 Services In Operation (4.5 to 2.9, and a 55% reduction in respect of our Commander brand (from 9 to 4 per 10,000 Services In Operation).
We will continue our process of simplification, digitisation and modernisation to further improve our customer experience.
09
For
per
sona
l use
onl
y
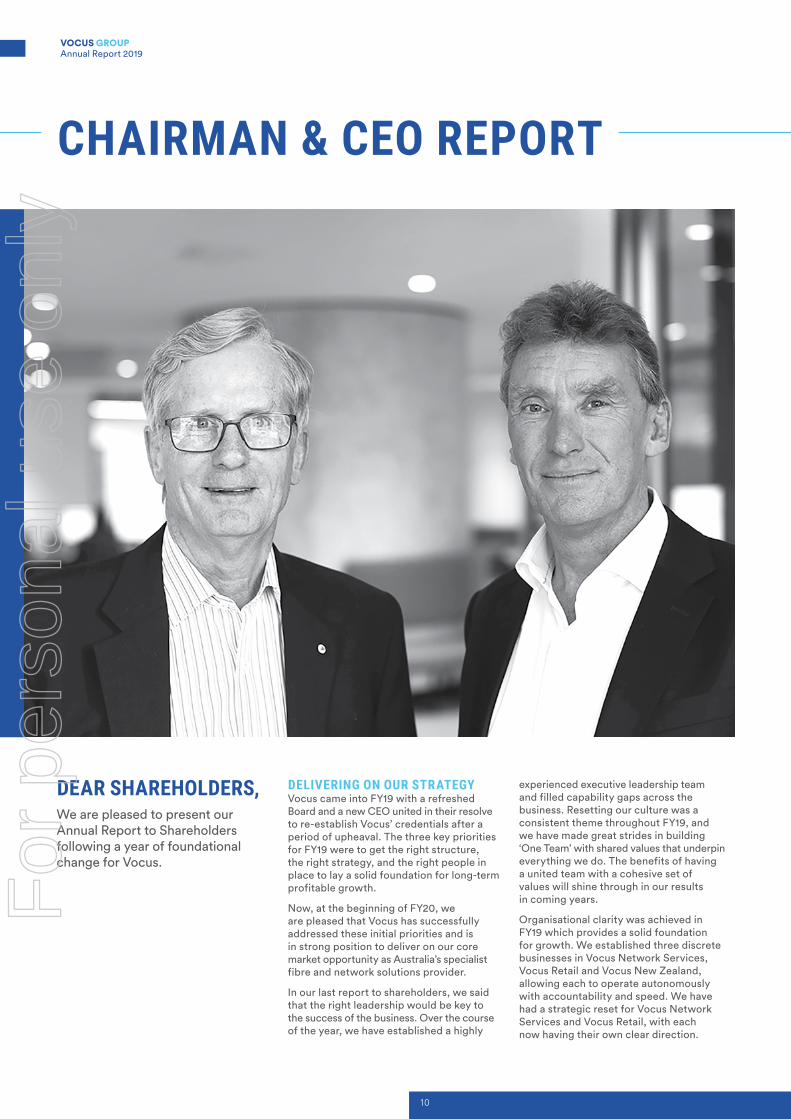
CHAIRMAN & CEO REPORT
DEAR SHAREHOLDERS,We are pleased to present our Annual Report to Shareholders following a year of foundational change for Vocus.
DELIVERING ON OUR STRATEGYVocus came into FY19 with a refreshed Board and a new CEO united in their resolve to re-establish Vocus’ credentials after a period of upheaval. The three key priorities for FY19 were to get the right structure, the right strategy, and the right people in place to lay a solid foundation for long-term profitable growth.
Now, at the beginning of FY20, we are pleased that Vocus has successfully addressed these initial priorities and is in strong position to deliver on our core market opportunity as Australia’s specialist fibre and network solutions provider.
In our last report to shareholders, we said that the right leadership would be key to the success of the business. Over the course of the year, we have established a highly
experienced executive leadership team and filled capability gaps across the business. Resetting our culture was a consistent theme throughout FY19, and we have made great strides in building ‘One Team’ with shared values that underpin everything we do. The benefits of having a united team with a cohesive set of values will shine through in our results in coming years.
Organisational clarity was achieved in FY19 which provides a solid foundation for growth. We established three discrete businesses in Vocus Network Services, Vocus Retail and Vocus New Zealand, allowing each to operate autonomously with accountability and speed. We have had a strategic reset for Vocus Network Services and Vocus Retail, with each now having their own clear direction.
10
VOCUS GROUP Annual Report 2019
For
per
sona
l use
onl
y

As outlined at our strategy update to investors in July, programs are in place to consolidate and modernise our networks and technology platforms, with significant cost reduction targets committed to in the coming years.
FY19 also provided clarity and progress on our strategic fibre build strategy. In line with our core market opportunity as Australia’s specialist fibre and network solutions provider, we will continue to invest in strategic opportunities to expand our fibre network and build associated annuity revenues.
In Vocus Retail, we continue to face strong headwinds from the transition to the NBN and the decline of legacy fixed voice revenues as we refocus the business on higher-margin mobile and energy products.
In our recent submission on an NBN pricing review, we noted that NBN’s wholesale pricing is not driven by market reality or consumer needs. Rather, NBN exploits its monopoly position to support its own financial requirements rather than the broadband needs of consumers.
NBN’s pricing has created a less competitive market for retail broadband and telephony services. Wholesale input costs on the NBN are now substantially higher than comparable ADSL services, and these wholesale costs will only increase over time as bandwidth demand increases usage-based charges.
The core problem with the NBN which has led to its flawed pricing model: the real market value of the NBN is far less than what it cost to build. Due to this failure to recognise the underlying market value of the NBN, we’re left in a situation where NBN’s decision-making is driven as a monopoly targeting financial returns, rather than consumer needs and market reality. Vocus will continue to speak up on behalf of our consumers to argue the case for change.
As many shareholders would be aware, Vocus was approached by both private equity and an Australian energy company in 2019. When such approaches occur, it is the responsibility of the Board to act in good faith for the interests of shareholders. In both cases Vocus was approached, at no point did we seek an offer for the company. While neither proceeded, the process drove us to sharpen our focus on the Vocus growth story and resulted in the company being in a stronger, more united position.
AUSTRALIA’S PREMIER SUBMARINE CABLE SPECIALISTSWe are proud to be the preeminent submarine cable specialist in Australia. Our 4,600km Australia Singapore Cable (ASC) became operational in September 2018, delivering strong sales and bringing additional traffic to our domestic network. The Coral Sea Cable system, a 4,700km cable system connecting Australia to the Solomon Islands and Papua New Guinea, is being built by Vocus on behalf of the Australian Government and is on track and on budget. Our Tiwi Islands cable in partnership with the Northern Territory Government is also progressing to schedule. No other Australian telco is constructing as much submarine cable infrastructure today, giving Vocus a competitive edge for future opportunities.
BUSINESS PERFORMANCEOur financial results in FY19 were as we had forecast. Group revenue was steady at $1.9 billion, with underlying earnings before interest, tax, depreciation and amortisation (EBITDA) down 2% to $360 million. Revenue growth in our Vocus Network Services business and strong demand on the Australia Singapore Cable were offset by a decline in Vocus Retail. Market conditions remain extremely competitive for our Retail business, but its digital transformation program, operating cost efficiencies and improved supplier resulted in EBITDA margins increasing by 1.8% to 19.1%.
New Zealand, which also faces extremely competitive conditions, continued its steady performance with revenues increasing 4.5% to $380 million and underlying EBITDA increasing 2.5% to $63 million. Consumer sales drove a greater proportion of growth in this business and bundling energy and mobile has diversified revenues while increasing customer longevity.
Our cash conversion was strong at 100% in FY19 and is expected to be in the range of 90-95% in FY20. Our financial performance is covered in detail in the Operating and Financial Review within the Directors Report, which we encourage you to read.
OUTLOOKWe have commenced FY20 with our plans and priorities clearly defined, and we are excited by the opportunity to deliver them. Sustainable, profitable revenue growth is our priority, supported by cost improvement opportunities.
We have provided guidance to the market for FY20 of underlying EBITDA in the range of $359-$379 million, with EBITDA growth in Vocus Network Services of $20-$30 million being offset by a similar decline in the Retail business. Looking further ahead to FY21, we expect EBITDA growth to accelerate in Vocus Network Services, while we expect the Retail business to stabilise during 2H FY21, before returning to growth in FY22. We expect New Zealand to deliver steady growth during this period.
To our team, we would like to extend our thanks for your continued hard work, positivity and flexibility during a period of significant change. To our Shareholders, we extend our thanks for your continued support and investment. We look forward to delivering long-term, sustainable growth.
Bob Mansfield, AO Non-Executive Chairman
Kevin Russell Group Managing Director/CEO
11
For
per
sona
l use
onl
y
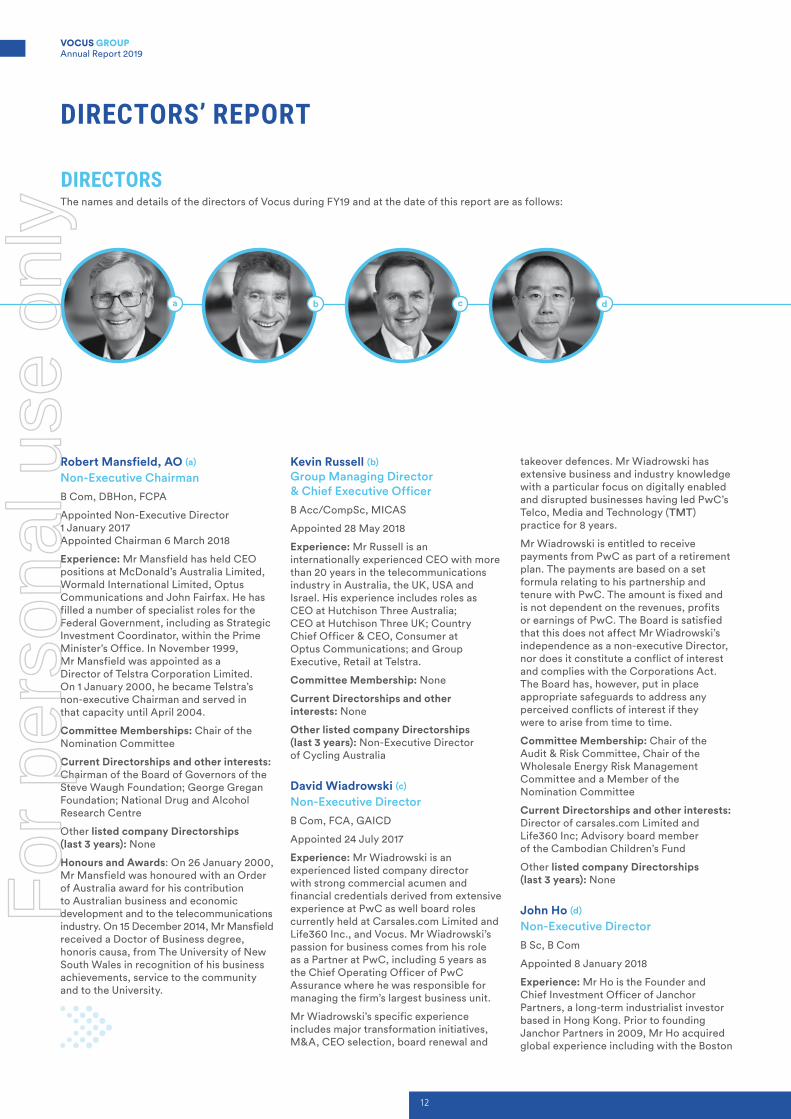
Robert Mansfield, AO (a) Non-Executive ChairmanB Com, DBHon, FCPA
Appointed Non-Executive Director 1 January 2017 Appointed Chairman 6 March 2018
Experience: Mr Mansfield has held CEO positions at McDonald’s Australia Limited, Wormald International Limited, Optus Communications and John Fairfax. He has filled a number of specialist roles for the Federal Government, including as Strategic Investment Coordinator, within the Prime Minister’s Office. In November 1999, Mr Mansfield was appointed as a Director of Telstra Corporation Limited. On 1 January 2000, he became Telstra’s non-executive Chairman and served in that capacity until April 2004.
Committee Memberships: Chair of the Nomination Committee
Current Directorships and other interests: Chairman of the Board of Governors of the Steve Waugh Foundation; George Gregan Foundation; National Drug and Alcohol Research Centre
Other listed company Directorships (last 3 years): None
Honours and Awards: On 26 January 2000, Mr Mansfield was honoured with an Order of Australia award for his contribution to Australian business and economic development and to the telecommunications industry. On 15 December 2014, Mr Mansfield received a Doctor of Business degree, honoris causa, from The University of New South Wales in recognition of his business achievements, service to the community and to the University.
Kevin Russell (b) Group Managing Director & Chief Executive OfficerB Acc/CompSc, MICAS
Appointed 28 May 2018
Experience: Mr Russell is an internationally experienced CEO with more than 20 years in the telecommunications industry in Australia, the UK, USA and Israel. His experience includes roles as CEO at Hutchison Three Australia; CEO at Hutchison Three UK; Country Chief Officer & CEO, Consumer at Optus Communications; and Group Executive, Retail at Telstra.
Committee Membership: None
Current Directorships and other interests: None
Other listed company Directorships (last 3 years): Non-Executive Director of Cycling Australia
David Wiadrowski (c) Non-Executive DirectorB Com, FCA, GAICD
Appointed 24 July 2017
Experience: Mr Wiadrowski is an experienced listed company director with strong commercial acumen and financial credentials derived from extensive experience at PwC as well board roles currently held at Carsales.com Limited and Life360 Inc., and Vocus. Mr Wiadrowski’s passion for business comes from his role as a Partner at PwC, including 5 years as the Chief Operating Officer of PwC Assurance where he was responsible for managing the firm’s largest business unit.
Mr Wiadrowski’s specific experience includes major transformation initiatives, M&A, CEO selection, board renewal and
takeover defences. Mr Wiadrowski has extensive business and industry knowledge with a particular focus on digitally enabled and disrupted businesses having led PwC’s Telco, Media and Technology (TMT) practice for 8 years.
Mr Wiadrowski is entitled to receive payments from PwC as part of a retirement plan. The payments are based on a set formula relating to his partnership and tenure with PwC. The amount is fixed and is not dependent on the revenues, profits or earnings of PwC. The Board is satisfied that this does not affect Mr Wiadrowski’s independence as a non-executive Director, nor does it constitute a conflict of interest and complies with the Corporations Act. The Board has, however, put in place appropriate safeguards to address any perceived conflicts of interest if they were to arise from time to time.
Committee Membership: Chair of the Audit & Risk Committee, Chair of the Wholesale Energy Risk Management Committee and a Member of the Nomination Committee
Current Directorships and other interests: Director of carsales.com Limited and Life360 Inc; Advisory board member of the Cambodian Children’s Fund
Other listed company Directorships (last 3 years): None
John Ho (d) Non-Executive DirectorB Sc, B Com
Appointed 8 January 2018
Experience: Mr Ho is the Founder and Chief Investment Officer of Janchor Partners, a long-term industrialist investor based in Hong Kong. Prior to founding Janchor Partners in 2009, Mr Ho acquired global experience including with the Boston
DIRECTORSThe names and details of the directors of Vocus during FY19 and at the date of this report are as follows:
DIRECTORS’ REPORT
dcba
12
VOCUS GROUP Annual Report 2019
For
per
sona
l use
onl
y

The Directors present their report, together with the Financial Report of Vocus Group Limited and its controlled entities (Vocus or the Company) for the financial year ended 30 June 2019 (‘FY19’) in compliance with the provisions of the Corporations Act 2001 (Corporations Act).
Consulting Group in Australia, Citadel Investment Group in the US and as Head of Asian Investing at The Children’s Investment Fund.
Committee Memberships: Member of the People & Remuneration and Nomination Committees
Current Directorships and other interests: Deputy Chairman of the Hong Kong Stock Exchange Listing Committee; Non-Executive Chairman of Bellamy’s Australia Limited and Non-Executive Director of Rokt (an e-commerce marketing company)
Other listed company Directorships (last 3 years): None
Julie Fahey (e) Non-Executive DirectorB AppSc
Appointed 2 February 2018
Experience: Ms Fahey has more than 30 years’ experience in technology and the management of large-scale transformation programs, including as National Managing Partner, Markets and National Lead Partner, Telecommunications, Media & Technology for KPMG. Ms Fahey’s executive career spanned a range of roles including Chief Information Officer of General Motors Holden (Australia) and Deputy Managing Director of SAP Australia.
Committee Memberships: Chair of the People & Remuneration Committee and Member of the Audit & Risk Committee
Current Directorships and other interests: Non-Executive Director with IRESS Ltd and Seek Ltd. She is also a Non-Executive Director of a small number of IT&T companies, and a not-for-profit organisation
Other listed company Directorships (last 3 years): None
Mark Callander (f) Executive DirectorBMS
Appointed 28 May 2018
Experience: Mr Callander has more than 20 years’ experience in the New Zealand telco market. After a period at Telecom New Zealand he joined CallPlus, where he became CEO in 2009. Mr Callander managed the CallPlus integration with M2 in 2015, and then the merge with Vocus the following year and is CEO of the Vocus New Zealand business.
Committee Membership: Standing invitee of the Audit & Risk Committee and the Wholesale Energy Risk Management Sub-Committee
Current Directorships and other interests: Board Member of the New Zealand Telecommunications Forum and Director of the Elevator Group
Other listed company Directorships (last 3 years): None
Matthew Hanning (g) Non-Executive DirectorLLB (Hons), B Ec, Masters of Applied Finance
Appointed 1 September 2018
Experience: Mr Hanning was previously a partner at Clayton Utz, a Managing Director at Morgan Stanley with senior management roles in both Australia and Hong Kong and a Group Managing Director at UBS with management responsibility for Asia Pacific investment banking. At UBS, Mr Hanning was a member of the Investment Bank Executive Committee which managed the activities of the Investment Bank globally. He was based in Hong Kong from 2005 to 2016. Mr Hanning left UBS in 2016 to return to Australia.
Committee Membership: Member of the Audit & Risk Committee
Current Directorships and other interests: Chairman of SAI Global Holdings II (Australia) Pty Ltd, Non-Executive Director of Clayton Utz and Senior Adviser to Baring Private Equity Asia
Other listed company Directorships (last 3 years): None
Bruce Akhurst (h) Non-Executive DirectorB Ec (Hons), LLB, FAICD
Appointed 1 September 2018
Experience: Mr Akhurst’s management experience spans decades in the telecommunications industry and includes roles as Group Managing Director of Telstra Media, Telstra Wholesale and Telstra Legal and Regulatory. Prior to joining Telstra, Mr Akhurst was Managing Partner at Mallesons Stephen Jaques (now King & Wood Mallesons). He is a former Chairman of Foxtel and former director of a number of Telstra subsidiary companies, including CSL and Telstra Clear.
Committee Membership: Member of the People & Remuneration Committee
Current Directorships and other Interests: Non-Executive Director of Tabcorp Holdings Ltd, Chairman of Peter MacCallum Cancer Foundation, Executive Chairman of Adstream Holdings Pty Ltd and Director of Paul Ramsay Holdings
Other listed company Directorships (last 3 years): None
e f g h
13
For
per
sona
l use
onl
y

DIRECTORS’ REPORT (CONTINUED)
Jon Brett Non-Executive DirectorAppointed Director of First Wine Fund on 29 August 1998 which was then acquired and renamed Vocus Communications Limited in 2010. Resigned 22 August 2018.
Rhoda Phillippo Non-Executive Director Appointed as Director 22 February 2016. Resigned 22 August 2018.
GENERAL COUNSEL & COMPANY SECRETARYAshe-lee Jegathesan General Counsel & Company SecretaryLLB (Hons), GAICD
Appointed 22 February 2016
Experience: Prior to being appointed General Counsel & Company Secretary of Vocus Group Limited, Ms Jegathesan held the corresponding role for M2 Group Limited from May 2014. Ms Jegathesan has more than 20 years’ experience as a practicing lawyer, both in private practice with leading law firms, and in-house particularly in the IT and Telecommunications sector with global companies such as Nortel Networks, 3D Networks, and lastly, Melbourne IT Ltd, where she held the position of General Counsel and Company Secretary.
As part of her role at Vocus, Ms Jegathesan also has executive oversight of the Regulatory Affairs and Risk functions, and up until September 2018, was also the executive accountable for the Group Human Resources Function.
Ms Jegathesan was the recipient of the Lawyers Weekly 2012 Women in Law ACLA In-House Award.
DIRECTORS’ SHAREHOLDINGS The following table sets out the details of each director’s relevant interest in the Company at the date of this report.
Shares
R Mansfield 78,500
K Russell –
D Wiadrowski 19,000
J Ho1 57,490,290
J Fahey –
M Callander 74,394
Bruce Akhurst 50,000
Matthew Hanning 500,000
1. John Ho is the founder and chief industrialist investor of Janchor Partners. Janchor Partners Pan-Asian Master Fund and Janchor Partners Opportunities Master Fund together own a 17.9% interest in Vocus (constituted by a relevant interest of 9.26% of Vocus’ voting shares and an economic interest through cash settled equity derivatives in a further 8.66%). Mr Ho holds more than 20% of the voting interests in Janchor Partners Pan-Asian Master Fund and Janchor Partners Opportunities Master Fund.
No director has (other than as stated below):
|| a relevant interest in the shares of any related body corporate of Vocus Group Limited; or
|| a relevant interest in debentures of Vocus; or
|| rights or options over shares in, or debentures of, Vocus (other than Kevin Russell and Mark Callander, details of which are set out in the Remuneration Report); or
|| rights under a contract that confer a right to call for or deliver shares in, or debentures of, Vocus.
14
VOCUS GROUP Annual Report 2019
For
per
sona
l use
onl
y

DIRECTORS’ MEETINGS The number of directors’ meetings, including meetings of each Board committee held during FY19 and the number of meetings attended by each director is as follows:
Directors Board MeetingAudit and
Risk Committee *People and Remuneration
CommitteeNomination Committee
Eligible to Attend Attended
Eligible to attend Attended
Eligible to Attend Attended
Eligible to Attend Attended
Robert Mansfield (Chair) 23 22 0 0 0 0 0 0
Kevin Russell 23 23 9* 2 3* 1 0 0
Jon Brett 3 3 2 2 0 0 0 0
Rhoda Phillippo 3 1 2 0 0 0 0 0
David Wiadrowski 23 21 9 9 0 0 0 0
John Ho 23 23 0 0 3 3 0 0
Julie Fahey 23 21 7 5 3 3 0 0
Mark Callander 23 22 0 0 0 0 0 0
Bruce Akhurst 20 17 0 0 3 3 0 0
Matthew Hanning 20 19 7 5 0 0 0 0
* Standing invitee, not member of relevant Committee.
PRINCIPAL ACTIVITYVocus Group Limited (ASX: VOC) is Australia’s specialist fibre and network solutions provider, connecting all mainland capitals with Asia. Regionally, Vocus has backhaul fibre connecting most regional centres in Australia. Vocus also operates an extensive and modern network in New Zealand, connecting the country’s capitals and most regional centres. In total, the Vocus terrestrial network is c.30,000 route-km of high performance, high availability fibre-optic cable supported by 4,600km of submarine cable connecting Singapore, Indonesia and Australia and 2,100km of submarine cable between Port Hedland and Darwin and connecting offshore oil and gas facilities in the Timor Sea. Vocus owns a portfolio of well-recognised brands catering to enterprise, government, wholesale, small business and residential customers across Australia and New Zealand.
REVIEW OF OPERATIONS AND RESULTSPlease refer to the Chairman and CEO Review and the Operating and Financial Review for further details relating to Vocus operations and results for FY19. The Operating and Financial Review includes information that Vocus shareholders would reasonably require to make an informed assessment of Vocus operations, financial position, business strategies and prospects for future financial years.
This Operating and Financial Review is to be read in conjunction with, and forms part of, the Directors’ Report.
SIGNIFICANT CHANGES IN STATE OF AFFAIRSThe following changes in the state of affairs of the Company occurred during the year:
Non-binding indicative proposals receivedVocus announced on 27 May 2019 that it had received a non-binding, indicative proposal from EQT Infrastructure (EQT) to acquire all of the shares in Vocus at a price of A$5.25 per share in cash, to be implemented by way of a scheme of arrangement. The Board decided to grant non-exclusive due diligence access to EQT to enable EQT to potentially put a formal binding proposal to Vocus. Vocus subsequently announced on 4 June 2019 that following an accelerated period of due diligence, EQT has decided not to proceed with the proposed transaction, and discussions with EQT have ceased.
15
For
per
sona
l use
onl
y

DIRECTORS’ REPORT (CONTINUED)
Vocus announced on 11 June 2019 that it had received a non-binding, indicative proposal from AGL Energy Limited (AGL) to acquire all of the shares in Vocus at a price of A$4.85 per share in cash, to be implemented by way of a scheme of arrangement. This follows a previous non-binding, indicative proposal received from AGL, which had been withdrawn by AGL due to previously being unable to agree due diligence terms with Vocus, as announced by AGL on 31 May 2019. The Board decided to grant exclusive due diligence access to AGL to enable AGL to potentially put forward a formal binding proposal. Vocus subsequently announced on 17 June 2019 that AGL had decided not to proceed with the proposed transaction, and discussions with AGL have ceased.
Class actionVocus announced on 29 April 2019 that it had been served with a class action proceeding filed in the Federal Court of Australia. The proceeding was filed by Slater & Gordon, on behalf of persons who acquired an interest in Vocus shares from 29 November 2016 to the close of trade on 2 May 2017. The Statement of Claim includes allegations of contraventions of the Corporations Act 2001 (Cth) in relation to misleading or deceptive conduct and continuous disclosure obligations in respect of Vocus’ FY17 earnings guidance. Vocus intends to strongly defend these claims.
SIGNIFICANT EVENTS AFTER BALANCE DATEOn 9 September 2019, Vocus announced the resignation of Ashe-lee Jegathesan as Company Secretary. Simon Lewin (Deputy General Counsel of Vocus) has been appointed to the role of Company Secretary, effective 25 September 2019.
Other than the event/s described elsewhere, no other significant events have occurred which would affect the Company’s future earnings, operations or state of affairs.
LIKELY FUTURE DEVELOPMENTS AND RESULTSThe Operating and Financial Review, which forms part of the Directors’ Report, outlines business prospects and strategies for future financial years in order to facilitate the informed decision making of shareholders.
ENVIRONMENTAL REGULATION AND PERFORMANCEVocus is not subject to any significant environment regulation under any law of the Commonwealth or of a State or Territory. Please refer to the Company’s website, www.vocusgroup.com.au, for a copy of the Sustainability Report.
1. Net Leverage Ratio is defined in the Syndicated Facility Agreement as Net Debt/LTM EBITDA.
CORPORATE GOVERNANCEOur Corporate Governance Statement, detailing our compliance with the ASX Corporate Governance Council’s “Corporate Governance Principles & Recommendations – 3rd Edition” can be found online at the Company’s website at http://vocusgroup.com.au/about-us/corporate-governance/. The Board believes that the Vocus corporate governance framework and policies comply with corporate governance best practice in Australia.
DIVIDENDS No dividends were recommended, declared or paid during FY19. As disclosed to the ASX on 25 June 2018, Vocus closed a new and increased syndicated debt facility with its lenders. The Syndicated Facility Agreement stipulates that dividends will not be paid until the Net Leverage Ratio1 is below 2.25x for two consecutive testing dates.
INDEMNITIES AND INSURANCEThe Vocus Constitution provides that to the extent permitted by law and except as may be prohibited by the Corporations Act, each director and secretary of Vocus (and its subsidiaries) is indemnified against any liability (other than for legal costs where the indemnity is limited to reasonable legal costs) incurred by that person in the performance of their role.
The current and former directors and secretary of Vocus, as well as the CFO and divisional Chief Executives are also party to a customary deed of access and indemnity.
During FY19, Vocus paid a premium in respect of a contract insuring the directors and officers of Vocus against any liability that may arise from the carrying out of their duties and responsibilities to the extent permitted by the Corporations Act. The contract of insurance prohibits disclosure of the nature of the liability and the amount of the deductible or premium.
AUDITOR INDEMNITYThe Company has not, during or since the financial year, indemnified or agreed to indemnify the auditor of the Company or any related entity against a liability incurred by the auditor. During the financial year, the Company has not paid a premium in respect of a contract to insure the auditor of the Company or any related entity.
PROCEEDINGS ON BEHALF OF THE COMPANYThere were no applications for leave under section 237 of the Corporations Act made in respect of Vocus.
16
VOCUS GROUP Annual Report 2019
For
per
sona
l use
onl
y

NON-AUDIT SERVICESThe amount paid or payable to the Company’s external Auditor, PriceWaterhouseCoopers (PwC), for non-audit services during the year was $287,255. Details of the amounts paid for non-audit services are set out in note 37 to the financial statements.
In accordance with written advice from the Audit Committee, the directors are satisfied that the provision of non-audit services by PwC is compatible with the general standards of independence for auditors imposed by the Corporations Act for the following reasons:
|| All non-audit services have been reviewed and approved by the Audit Committee to ensure that they do not impact the integrity and objectivity of the auditor; and
|| None of the services undermine the general principles relating to auditor independence as set out in APES 110 Code of Ethics for Professional Accountants issued by the Accounting Professionals and Ethical Standards Board, including reviewing or auditing the auditor’s own work, acting in a management or decision-making capacity for the Company, acting as advocate for the Company or jointly sharing economic risks and rewards.
AUDITOR’S INDEPENDENCE DECLARATIONThe auditor’s independence declaration is included on page 48 of this report.
ROUNDING OF AMOUNTSVocus is a company of the kind referred to in ASIC Corporations (Rounding in Financial/Directors’ Reports) Instrument 2016/191 dated 24 March 2016 (formerly ASIC Class Order 98/0100), and in accordance with that Instrument, amounts in the Directors’ Report and the financial report are rounded off to the nearest thousand dollars, unless otherwise indicated.
17
For
per
sona
l use
onl
y
INTRODUCTORY LETTER FROM JULIE FAHEY, CHAIR OF THE PEOPLE AND REMUNERATION COMMITTEEDear Shareholders,
On behalf of the Board, I am pleased to present our Remuneration Report for FY2019.
In FY2018, we appointed four new non-executive directors to the Vocus Board of Directors. These directors, making up four out of six of Vocus’ non-executive directors, stood for election at the 2018 AGM and were formally elected then, for a 3 year term. Kevin Russell, our new Group Managing Director & Chief Executive Officer, having commenced in his role in May 2018, focused heavily on building his new Executive and Senior Leadership team over the course of the year. The calibre of the leadership group Kevin has assembled is exceptional and I am more confident than ever that this leadership group is capable of creating sustainable long-term wealth for our shareholders.
In FY19 Vocus has:
|| delivered financial performance consistent with our guidance to the market
|| restructured the organisation into three distinct business units
|| rebuilt its leadership team with a remuneration structure aligned to the 3 year turnaround
|| launched the Australia Singapore Cable, and
|| started its network consolidation program
At our recent Investor Day, Kevin and his team outlined their strategic plan to drive long-term sustainable growth across all three business units. With that three-year strategic plan in place, the team is now focused on execution. Key to the successful execution of this strategy are the core Vocus Values of One Team, Disruptive Thinking, People are the Difference and Crazy about Customers. Throughout the year, the Executive Leadership team have been embedding these new values in the organisation, ensuring that the “how” of execution is a cornerstone to achieving our goals.
As outlined last year, we re-designed our approach to remuneration, to ensure that we were able to attract the high calibre talent we were seeking, and to align and focus that talent, on executing against the longer-term strategic plan of the company. The Vocus turnaround is not a short-term proposition, but is, as has been articulated by both Bob Mansfield, our Chairman, and Kevin, a 3 year program. We have therefore removed any short term incentives from our Executives’ variable remuneration, and implemented a long term incentive plan, with a single measure based on total shareholder return, which is fully aligned with shareholder interests. This structure will also change the focus away from individual performance to a focus on the collective overall growth of the organisation. We believe this approach is in the long-term best interests of Vocus and shareholders.
Finally, our Board and Executive Team are strongly committed to delivering on our strategy and creating sustainable long-term wealth for our shareholders.
This report details the remuneration outcomes achieved by our key management personnel (KMP) for the financial year to 30 June 2019. We invite your feedback on this report and our framework and thank you for your continued support.
Julie Fahey Chair, People and Remuneration Committee
REMUNERATION REPORT
18
VOCUS GROUP Annual Report 2019
For
per
sona
l use
onl
y

This report details the remuneration framework and outcomes for Vocus’ Key Management Personnel (KMP) for the year ended 30 June 2019 (FY19). The information in this Report has been prepared based on the requirements of the Corporations Act 2001 (Cth) (and Corporations Regulations 2001 (Cth)) and the applicable accounting standards.
The Remuneration Report is designed to provide shareholders with an understanding of Vocus’ remuneration philosophy and framework, and the link between the remuneration paid to KMP, and Vocus’ longer-term strategy and financial performance. Individual remuneration outcomes for Vocus’ KMP are also set out in this Remuneration Report.
KMP comprise members of Vocus’ Board of Directors and its Executives. The term “Executives” refers to the Group Managing Director & Chief Executive Officer (MD & CEO) and to those executives with authority and responsibility for planning, directing and controlling Vocus’ activities, directly or indirectly, as outlined below.
For FY19, the following were assessed to be KMP:
Non-Executive Directors:Robert Mansfield Non-Executive Chairman
David Wiadrowski Non-Executive Director (Chair, Audit & Risk Committee)
Julie Fahey Non-Executive Director (Chair, People & Remuneration Committee)
John Ho Non-Executive Director
Bruce Akhurst Non-Executive Director (appointed 1 September 2018)
Matthew Hanning Non-Executive Director (appointed 1 September 2018)
Former Non-Executive Directors:Jon Brett Non-Executive Director (retired 22 August 2018)
Rhoda Phillippo Non-Executive Director (retired 22 August 2018)
Executive Directors:
Kevin Russell Group Managing Director & Chief Executive Officer
Mark Callander Executive Director & Chief Executive, New Zealand and Wholesale
Executives:Mark Wratten Group Chief Financial Officer
Ellie Sweeney Chief Operating Officer (appointed 11 March 2019)
Andrew Wildblood Chief Executive, Enterprise and Government (appointed 21 January 2019)
Antony De Jong Chief Executive, Retail (appointed 1 September 2018)
Former Executives:Sandra de Castro Chief Executive, Consumer (ceased 7 November 2018)
Except as otherwise noted, all Directors and Executives have held their positions for the duration of FY19.
19
For
per
sona
l use
onl
y

REMUNERATION REPORT (CONTINUED)
REMUNERATION POLICY AND FRAMEWORKRelationship between remuneration and performance generallyExecutive remuneration is directly linked to Vocus’ earnings and shareholder wealth over the long term. A summary of the key metrics relating to Vocus earnings and shareholder wealth or Total Shareholder Returns (TSR) are set out below.
Earnings for FY19 and the previous four financial years
FY15 $’000
FY16 $’000
FY17 $’000
FY18 $’000
FY19 $’000
EBITDA 52,247 194,077 335,479 360,416 349,107
EBIT 33,563 116,469 141,914 130,808 105,750
Profit after income tax 19,850 64,091 (1,464,870) 61,045 34,009
TSR for FY19 and the previous four financial years
FY15 $’000
FY16 $’000
FY17 $’000
FY18 $’000
FY19 $’000
Share price at financial year end ($) 5.77 8.42 3.37 2.31 3.27
Total dividends declared* (cents/share) 7.30 17.50 6.0 0.0 0.0
Diluted earnings per share1 (cents/share) 19.08 18.60 (237.65) 9.79 5.40
Underlying diluted earnings per share2 (cents per share) 17.38 29.87 24.65 20.37 16.74
1. Includes special dividends.
2. The weighted average number of shares for 2015 and 2016 have been restated for the effect of the 1-for-8.9 rights issue completed in July 2016 in accordance with AASB 133 ‘Earnings per Share’.
Non-Executive Director Remuneration Policy and frameworkThe Non-Executive Director remuneration policy is designed to provide fair remuneration that is sufficient to attract and retain Non-Executive Directors with the appropriate level of experience, knowledge, skills and judgment to steward the Company’s success. The level of remuneration paid to Non-Executive Directors is regularly benchmarked, most recently in December 2018.
Non-Executive Director remuneration consists of base fees and fees for membership on board committees. Fees are inclusive of all superannuation and other contributions. Non-Executive Directors also receive reimbursement of expenses properly incurred while carrying out their director duties. Non-Executive Directors do not receive incentive or performance-based remuneration, nor are they entitled to retirement or termination benefits.
The Non-Executive Director annual aggregate fee pool was set at $1,700,000 at the 2016 AGM. Actual fees paid to Non-Executive Directors in FY19 totalled $1,079,402. The Board has determined that fees will not be increased for FY2020.
Board FeesAudit & Risk Committee1
People and Remuneration
Committee
Wholesale Energy Risk
Management Committee
Nominations Committee2
Chairman3 $375,000 – – –
Non-Executive Director $140,000 – – –
Committee Chair – $45,000 $30,000 $15,000 –
Committee Member – $22,500 $15,000 – –
1. The Audit Committee and Risk Committee were combined into a single Audit & Risk Committee in January 2018, prior to which the fees for each of these individual Committees were identical to the fees for the Remuneration Committee.
2. No additional fees are payable for service on this committee.
3. Fees include service on all committees.
20
VOCUS GROUP Annual Report 2019
For
per
sona
l use
onl
y

The Board also this year adopted a minimum shareholding guideline for Non-Executive Directors. Each Non-Executive Director must, within 3 years of being appointed, establish and maintain the minimum shareholding level value equal to one year’s base fees. The value is to be based on the number of shares held multiplied by the higher of the share price on the purchase date or on the last trading day of the relevant financial period, to ensure alignment of directors’ interests with those of shareholders. Non-executive directors will be eligible to participate in the Vocus Share Purchase Plan (salary sacrifice) to facilitate the building up of equity to the minimum shareholding level.
Executive Remuneration Policy and FrameworkThe Board is committed to developing and maintaining an executive remuneration policy that:
|| enables Vocus to attract and retain skilled executive leaders; and
|| is equitable and aligned with the long-term interests of Vocus and its shareholders; and
|| rewards the achievement of Vocus’ goals and longer-term strategic plan.
Vocus’ remuneration framework and policy, for the Group as a whole, is regularly considered by the People & Remuneration Committee to ensure that both the framework and policy remains aligned with Vocus’ business strategy and shareholders’ interests, as well as remaining consistent with market conditions and drivers.
FY19 Executive Remuneration In FY18, following a thorough review by the Board, Vocus’ executive remuneration policy and framework was re-designed to better:
|| Focus executives on achieving Vocus’ strategic turnaround and growth plan;
|| Support the leadership team’s pursuit of group-wide success, and group-wide goals;
|| Align executive remuneration outcomes with shareholder outcomes and long-term value creation;
|| Attract, motivate and retain the best executive talent; and
|| Increase simplicity and transparency of executive remuneration for all stakeholders.
A summary of the executive remuneration framework is as follows:
Remuneration mix Weighted heavily toward at-risk long-term incentives, aligned to long-term and sustainable shareholder value creation. See chart below.
Fixed remuneration Reflects individual skill and experience of individual executives, internal and external market comparators, and stakeholder and community expectations.
Long term incentives In the form of share options as follows:
|| A one-off grant of options for the period FY19-21 with no further grants until at least FY22;
|| Is 100% ‘at risk’, with a three-year performance period: 1 July 18 to 30 June 21;
|| Absolute total shareholder return (TSR) performance measure, with 50% vesting at 50% TSR, with a sliding scale to 100% vesting at 100% TSR; and
|| Staggered vesting at the end of the three-year performance period.
Short term incentives There is no short-term incentive component in the current executive remuneration framework.
Minimum shareholding guideline (new)
MD & CEO: 150% of fixed remuneration within 5 years.
All other executive KMP: 75% of fixed remuneration within 5 years.
Vested options (whether exercised or not) and unvested options (which are no longer subject to performance hurdles other than the passing of time) part will form part of an executive’s MSG.
21
For
per
sona
l use
onl
y

REMUNERATION REPORT (CONTINUED)
The Board believes that a requirement to acquire and maintain a significant shareholding is strongly aligned to, and supportive of, the intention of the new remuneration framework; accordingly, a minimum shareholding guideline was introduced to facilitate maintained alignment of executives with shareholders.
Remuneration Mix
0 20 40 60 80 100
Chief Executive, Retail
COO
Chief Executive, Enterprise
& Government
Chief Executive, NZ & Wholesale
Group CFO
Group CEO
Cash, salary & fees LTI*
28%
27%
23%
24%
28%
16%
72%
73%
77%
76%
72%
84%
* LTI value shown is based on 1/3 of the total grant made to each Executive (as the total grant was intended to reflect 3 year’s grants) and assumes 100% vesting (assuming all performance hurdles are met at the end of the performance period).
FY19 performanceThe removal of short term incentives ensures the following:
|| An executive team united to deliver long term growth for the Vocus Group and its shareholders;
|| The elimination of monetary incentives that can drive a focus on short term goal achievement at the expense of long term sustainable growth;
|| Maximising group result and not individual divisional results prioritized by all executives given short term incentives are typically heavily weighted to an individual’s contribution in one year period;
|| Executives are not being rewarded due to the actions taken in previous periods by past executives; and
|| That where necessary, executives’ key areas of focus and goals can be flexible and change during the year to accommodate opportunities that arise.
Having no short term incentive component in executive remuneration does not, however, mean that individual executives do not have annual goals or key performance indicators, against which each executive’s performance is measured and assessed. Achievement of the goals and key performance indicators is expected as part of an individual’s core performance of their role. These goals are ambitious and are aligned with milestones necessary for the successful achievement of Vocus’ long term growth ambitions. Goals at Vocus Group are reviewed regularly via check-in-conversations and are cascaded down into the business. Both quantitative and qualitative goals are documented for each executive, supporting Vocus’ philosophy that the “how” we achieve what we need to achieve is just as important for our success as the “what” we achieve. Specifically, our Executive Leadership team each have a series of goals which include the delivery of financial performance, as well as non-financial indicators focused on their leadership of the Vocus values and behaviours.
Retention Payments and Sign-on bonusesIn FY19, a small number of KMP received a one-off payment, either as a retention payment or a sign-on bonus. Details of these are set out in the relevant statutory table, together with an explanation of the purpose for the payment, and the method of calculation and criteria applied.
22
VOCUS GROUP Annual Report 2019
For
per
sona
l use
onl
y
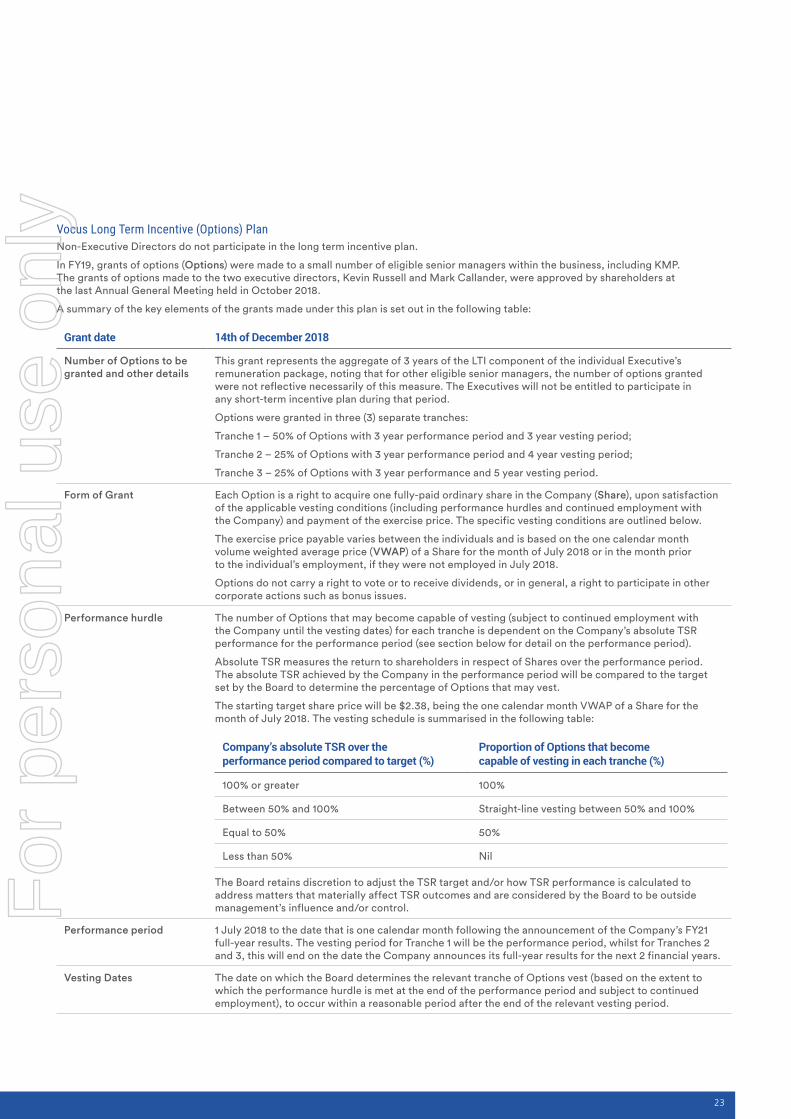
Vocus Long Term Incentive (Options) PlanNon-Executive Directors do not participate in the long term incentive plan.
In FY19, grants of options (Options) were made to a small number of eligible senior managers within the business, including KMP. The grants of options made to the two executive directors, Kevin Russell and Mark Callander, were approved by shareholders at the last Annual General Meeting held in October 2018.
A summary of the key elements of the grants made under this plan is set out in the following table:
Grant date 14th of December 2018
Number of Options to be granted and other details
This grant represents the aggregate of 3 years of the LTI component of the individual Executive’s remuneration package, noting that for other eligible senior managers, the number of options granted were not reflective necessarily of this measure. The Executives will not be entitled to participate in any short-term incentive plan during that period.
Options were granted in three (3) separate tranches:
Tranche 1 – 50% of Options with 3 year performance period and 3 year vesting period;
Tranche 2 – 25% of Options with 3 year performance period and 4 year vesting period;
Tranche 3 – 25% of Options with 3 year performance and 5 year vesting period.
Form of Grant Each Option is a right to acquire one fully-paid ordinary share in the Company (Share), upon satisfaction of the applicable vesting conditions (including performance hurdles and continued employment with the Company) and payment of the exercise price. The specific vesting conditions are outlined below.
The exercise price payable varies between the individuals and is based on the one calendar month volume weighted average price (VWAP) of a Share for the month of July 2018 or in the month prior to the individual’s employment, if they were not employed in July 2018.
Options do not carry a right to vote or to receive dividends, or in general, a right to participate in other corporate actions such as bonus issues.
Performance hurdle The number of Options that may become capable of vesting (subject to continued employment with the Company until the vesting dates) for each tranche is dependent on the Company’s absolute TSR performance for the performance period (see section below for detail on the performance period).
Absolute TSR measures the return to shareholders in respect of Shares over the performance period. The absolute TSR achieved by the Company in the performance period will be compared to the target set by the Board to determine the percentage of Options that may vest.
The starting target share price will be $2.38, being the one calendar month VWAP of a Share for the month of July 2018. The vesting schedule is summarised in the following table:
Company’s absolute TSR over the performance period compared to target (%)
Proportion of Options that become capable of vesting in each tranche (%)
100% or greater 100%
Between 50% and 100% Straight-line vesting between 50% and 100%
Equal to 50% 50%
Less than 50% Nil
The Board retains discretion to adjust the TSR target and/or how TSR performance is calculated to address matters that materially affect TSR outcomes and are considered by the Board to be outside management’s influence and/or control.
Performance period 1 July 2018 to the date that is one calendar month following the announcement of the Company’s FY21 full-year results. The vesting period for Tranche 1 will be the performance period, whilst for Tranches 2 and 3, this will end on the date the Company announces its full-year results for the next 2 financial years.
Vesting Dates The date on which the Board determines the relevant tranche of Options vest (based on the extent to which the performance hurdle is met at the end of the performance period and subject to continued employment), to occur within a reasonable period after the end of the relevant vesting period.
23
For
per
sona
l use
onl
y
REMUNERATION REPORT (CONTINUED)
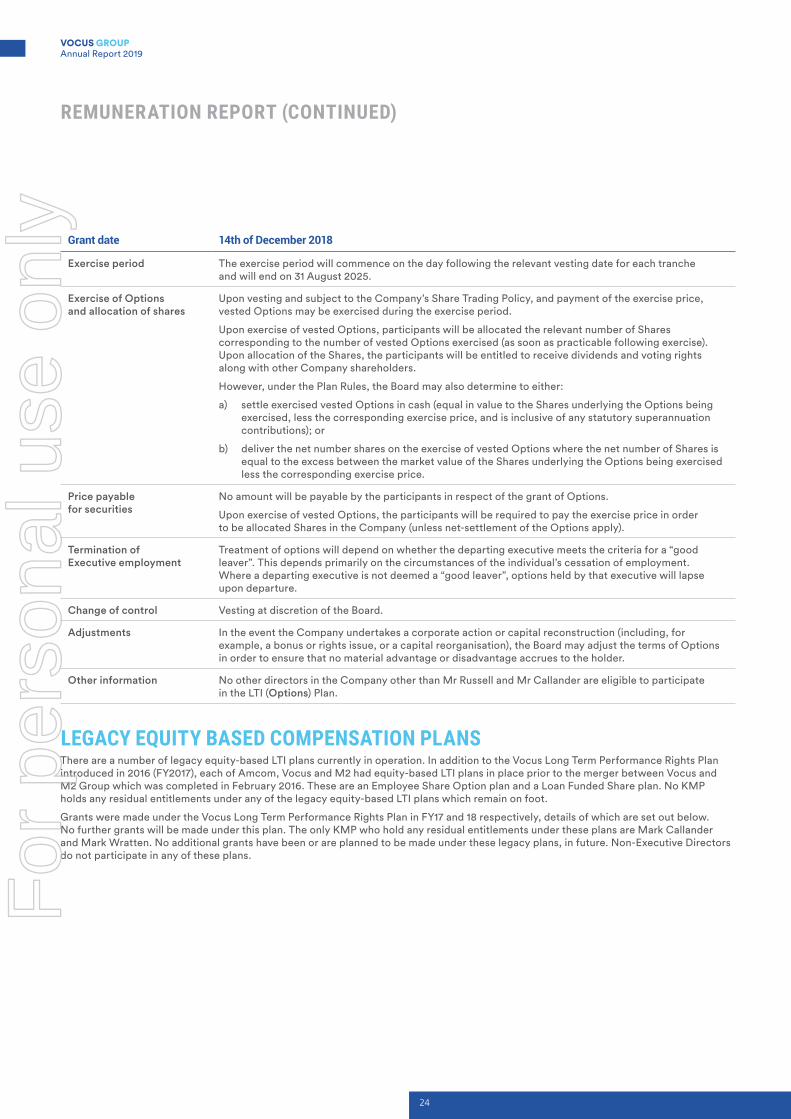
Grant date 14th of December 2018
Exercise period The exercise period will commence on the day following the relevant vesting date for each tranche and will end on 31 August 2025.
Exercise of Options and allocation of shares
Upon vesting and subject to the Company’s Share Trading Policy, and payment of the exercise price, vested Options may be exercised during the exercise period.
Upon exercise of vested Options, participants will be allocated the relevant number of Shares corresponding to the number of vested Options exercised (as soon as practicable following exercise). Upon allocation of the Shares, the participants will be entitled to receive dividends and voting rights along with other Company shareholders.
However, under the Plan Rules, the Board may also determine to either:
a) settle exercised vested Options in cash (equal in value to the Shares underlying the Options being exercised, less the corresponding exercise price, and is inclusive of any statutory superannuation contributions); or
b) deliver the net number shares on the exercise of vested Options where the net number of Shares is equal to the excess between the market value of the Shares underlying the Options being exercised less the corresponding exercise price.
Price payable for securities
No amount will be payable by the participants in respect of the grant of Options.
Upon exercise of vested Options, the participants will be required to pay the exercise price in order to be allocated Shares in the Company (unless net-settlement of the Options apply).
Termination of Executive employment
Treatment of options will depend on whether the departing executive meets the criteria for a “good leaver”. This depends primarily on the circumstances of the individual’s cessation of employment. Where a departing executive is not deemed a “good leaver”, options held by that executive will lapse upon departure.
Change of control Vesting at discretion of the Board.
Adjustments In the event the Company undertakes a corporate action or capital reconstruction (including, for example, a bonus or rights issue, or a capital reorganisation), the Board may adjust the terms of Options in order to ensure that no material advantage or disadvantage accrues to the holder.
Other information No other directors in the Company other than Mr Russell and Mr Callander are eligible to participate in the LTI (Options) Plan.
LEGACY EQUITY BASED COMPENSATION PLANSThere are a number of legacy equity-based LTI plans currently in operation. In addition to the Vocus Long Term Performance Rights Plan introduced in 2016 (FY2017), each of Amcom, Vocus and M2 had equity-based LTI plans in place prior to the merger between Vocus and M2 Group which was completed in February 2016. These are an Employee Share Option plan and a Loan Funded Share plan. No KMP holds any residual entitlements under any of the legacy equity-based LTI plans which remain on foot.
Grants were made under the Vocus Long Term Performance Rights Plan in FY17 and 18 respectively, details of which are set out below. No further grants will be made under this plan. The only KMP who hold any residual entitlements under these plans are Mark Callander and Mark Wratten. No additional grants have been or are planned to be made under these legacy plans, in future. Non-Executive Directors do not participate in any of these plans.
24
VOCUS GROUP Annual Report 2019
For
per
sona
l use
onl
y

A summary of the terms of the grants made to Executives in FY17 and FY18 respectively is set out in the following table:
Form of grant || Performance Rights to be settled in Vocus shares
|| Participants are not required to pay for the grant or exercise of Performance Rights
|| Each Performance Right entitles the holder to one ordinary share in Vocus if the applicable Vesting Conditions are met
|| Performance Rights do not carry any voting or dividend entitlements
Frequency of grant One grant each in FY17 and FY18 respectively.
Number of performance rights granted
Based on the LTI “at risk” component of an Executive’s total remuneration, measured on a face value basis, based on the VWAP of Vocus Shares traded on the ASX during both the 10-day and 20-day period around the date of release of the full year results for 2016 (August 2017).
Vesting Date Upon expiry of the Vesting Period and completion of the testing of the Vesting Conditions.
Vesting Period (or Performance Period)
3-year period from 1 July 2017 to 30 June 2020.
Vesting Conditions Vesting Conditions are achieving a predetermined level of compound annual growth in Vocus’ reported earnings per share (EPS) and achievement of transformation benefits during the Vesting Period. The ‘base point’ for measuring the rate of EPS growth is the underlying EPS disclosed in Vocus’ audited annual financial accounts for the financial year immediately preceding the year of grant. These measures will be disclosed after the performance period ends.
Expiry Date 2 years from Vesting Date. Performance Rights may be exercised at any time between the Vesting Date and the Expiry Date.
Terminated Executives
Treatment of performance rights will depend on whether the departing executive meets the criteria for a “good leaver”. This depends primarily on the circumstances of the individual’s cessation of employment. Where this is the case, the plan rules provide for the Board to be able to exercise its discretion in relation to the treatment of a pro-rated number of performance rights including the acceleration of vesting for these performance rights. Where a departing executive is not deemed a “good leaver”, performance rights held by that executive will lapse upon departure.
Change of control Vesting on pro-rata basis (for time) at discretion of the Board.
Face value per right (at grant date)
$2.48
This LTI plan will be treated as a legacy plan from FY19 following the introduction of the new LTI plan detailed earlier in this report.
Performance Rights on issue to KMP (under the above plan) as at 30 June 2019 are as follows:
Grant Date Vesting DateNumber of
Performance Rights Performance Measures
1 April 20171 1 July 2019 94,231The Rights are subject to EPS and Synergies Achievement vesting conditions, over a three-year performance period.
1 May 2018 1 July 2020 264,227The Rights are subject to EPS and other transformation target conditions, over a three-year performance period.
1. The vesting conditions will be tested and determined at the board meeting following the release of annual results in August 2019. The outcomes will be disclosed in next year’s Remuneration report.
25
For
per
sona
l use
onl
y

REMUNERATION REPORT (CONTINUED)
OTHER REQUIRED DISCLOSURESService agreementsRemuneration and other terms of employment for Executives are formalised in service agreements. Agreements with the Group MD & CEO and Executives (KMP) are contracts of service.
Key Term Group MD & CEO Other KMP Executives (KMP)
Duration of agreement: No fixed term No fixed term
Period of notice required to terminate agreement (by the relevant KMP):
Six months Three months
Period of notice required to terminate agreement (by Vocus):
Twelve months No more than three months (note termination payment applies)
Potential Termination benefits || In addition to notice, if termination occurs as a result of fundamental change, termination payment equal to 9 months’ Fixed Remuneration. No additional payments if Company terminates employment otherwise with notice.
|| Accelerated vesting of LTI on a pro-rated basis, at the Board’s discretion at the time.
|| Statutory leave entitlements.
|| In addition to any notice period, a termination payment of 6 months’ Fixed Remuneration.
|| Accelerated vesting of LTI on a pro-rated basis, at the Board’s discretion at the time.
|| Statutory leave entitlements.
LoansVocus has not made, guaranteed or secured, directly or indirectly, any loans in respect of KMP (or their close family members or controlled entities).
Other transactionsThere were no transactions of the kind contemplated in item 22 of Regulation 2M.3.03 of the Corporations Regulations during FY19.
26
VOCUS GROUP Annual Report 2019
For
per
sona
l use
onl
y

GOVERNANCEGovernance Responsibility for the oversight of remuneration at Vocus lies with the People & Remuneration Committee. Under its Charter, this Committee is responsible for monitoring and advising the Board on remuneration matters, including setting executive remuneration each year, which it does in line with the following objectives:
|| aligning the remuneration framework, structures and decisions with shareholder interests;
|| attracting and retaining the best talent to lead Vocus to success;
|| reinforcing a business culture of growth, innovation and agility;
|| managing people risks by encouraging prudent decision making; and
|| giving due consideration to the law and corporate governance principles.
Members of the People & Remuneration Committee also sit across other board committees, including the Audit & Risk Committee and the Nomination Committee. The People & Remuneration Committee seeks input from other committees as needed on matters of relevance to both committees, and also engages with and reports to the Board on a monthly basis on its activities.
The CommitteeThe Committee comprises three (3) Non-Executive Directors and was chaired at all times by an independent Non-Executive Director.
During FY19, the Committee was chaired by Julie Fahey.
John Ho and Bruce Akhurst were members of the Committee during FY18. Kevin Russell, as Group MD & CEO, and the Head of People & Culture are standing invitees to all Committee meetings. All other Directors were invited to attend all meetings if they wished to do so.
Use of remuneration advisorsUnder the provisions of the Committee’s Charter, the Committee may engage the assistance and advice from external remuneration advisors. To ensure that any recommendations made by remuneration consultants are provided without undue influence being exerted by Executives, external remuneration consultants deliver their advice directly to members of the Committee.
The Committee engaged Ernst & Young (EY) to provide support and advice in relation to the design and implementation of the FY19 long-term incentive plan. Under the terms of the engagement, EY did not provide remuneration recommendations as defined in Section 9B of the Corporations Act 2001.
Voting and comments made at Vocus’ 2018 Annual General Meeting (AGM) At the last AGM, 98.17% of the shareholders who voted, in person or by proxy, voted to adopt the remuneration report for the year ended 30 June 2018.
STATUTORY REMUNERATION DISCLOSURESThe following tables set out the statutory disclosures required under the Corporations Act 2001 (Cth), Corporations Regulations 2001 (Cth) and in accordance with the relevant Accounting Standards.
27
For
per
sona
l use
onl
y

REMUNERATION REPORT (CONTINUED)
REMUNERATION TABLESDetails of the remuneration of the Directors and other KMP (including comparative data for FY18) who held these positions during FY19 are set out in the following tables. The amounts shown are equal to the amount expensed in the company’s financial statements.
Directors
Short-term benefits
Post employment
benefitsLong-term
benefitsShare based
payments
Cash salary and fees
$
Bonus/commission
$
Non-monetary
$
Super-annuation
$
Employee leave
$
Equity-settled
$Total
$
2019
R Mansfield 350,000 – – 25,000 – – 375,000
D Wiadrowski1 181,636 – – 17,255 – – 198,891
J Fahey2 172,816 – – 16,418 – – 189,234
J Ho3 – – – – – – –
B Akhurst4 117,442 – – 11,157 – – 128,599
M Hanning4 123,124 – – 11,697 – – 134,821
J Brett5 23,157 – – 2,200 – – 25,357
R Phillippo5 27,500 – – – – – 27,500
2018
R Mansfield6 222,382 – – 21,126 – – 243,508
D Wiadrowski 159,763 – – 15,177 – – 174,940
J Fahey7 67,081 – – 6,373 – – 73,454
J Ho3 – – – – – – –
J Brett 168,406 – – 15,868 – – 184,274
R Phillippo 257,782 – – – – – 257,782
D Spence8 109,779 – – 10,429 – – 120,208
C Farrow9 138,421 – – – – – 138,421
V Bowen10 249,429 – – 23,696 – – 273,125
C Holman11 35,709 – – 3,392 – – 39,101
1. Reflects remuneration as a WERM Committee Member up to 22 August 2018 and commencement as WERM Chair on 23 August 2018.
2. Reflects remuneration as a Technology Committee Member up to 22 August 2018 and commencement as Audit & Risk Committee Member on 23 August 2018.
3. As notified to the ASX at the time of appointment, John Ho has waived his entitlement to receive fees relating to his role as a Non-Executive Director.
4. Reflects remuneration as a Non-Executive Director (1 September 2018 to 30 June 2019).
5. For the period 1 July 2018 to 22 August 2018 (retirement as a Non-Executive Director).
6. Reflects remuneration as a Non-Executive Director (1 July 2017 to 6 March 2018) and as Chairman (6 March 2018 to 30 June 2018).
7. Reflects remuneration as a Non-Executive Director (2 February 2018 to 30 June 2018).
8. For the period 1 July 2017 to 24 October 2017(retirement as a Non-Executive Director).
9. For the period 1 July 2017 to 05 March 2018(resigned as a Non-Executive Director).
10. For the period 1 July 2017 to 26 September 2017, Vaughan Bowen was an Executive Director, and from 11 October 2017 until 5 March 2018 (when Vaughan Bowen resigned as a director).
11. For the period 1 July 2017 to 13 November 2017(resigned as a Non-Executive Director).
28
VOCUS GROUP Annual Report 2019
For
per
sona
l use
onl
y

Executives The Actual remuneration table sets out the actual value of the remuneration received by the Executives during the year.
The figures in actual remuneration table are different from those shown in the Accounting Remuneration table which includes apportioned accounting value for all unvested LTI grant for the year (which remain subject to satisfaction of performance and service conditions and may not ultimately vest) and non-monetary benefits. The Actual Remuneration table excludes unvested LTI’s and non-monetary benefits.
Actual Remuneration
Short-term benefits
Post employment
benefitsLong-term
benefitsShare based
payments
Cash salary and fees
$
One-off payments
$
Non-monetary
$
Super-annuation
$
Employee leave
$
Equity-settled
$Total
$
2019
K Russell 1,075,000 – – 25,000 26,261 – 1,126,261
M Callander1 713,672 286,971 – 43,795 107,095 – 1,151,533
M Wratten 725,000 – – 25,000 18,910 – 768,910
A Wildblood2 265,934 324,230 – 10,989 19,111 – 620,264
A De Jong3 456,319 – – 20,742 41,322 – 518,383
E Sweeney4 184,492 – – 7,624 16,132 – 208,248
S de Castro5 709,834 – – 17,514 (7,099) – 720,249
2018
K Russell 97,459 – – 2,267 7,093 – 106,819
M Callander 548,296 219,318 – 16,564 11,399 – 795,577
M Wratten 737,500 332,500 – 25,000 51,243 – 1,146,243
M Simmons6 675,000 300,000 – 25,000 73,947 – 1,073,947
S de Castro7 262,225 120,000 – 11,401 7,099 – 400,725
G Horth8 1,671,706 – – 16,277 16,856 – 1,704,839
S Carter9 933,797 – – 19,849 (16,582) – 937,064
29
For
per
sona
l use
onl
y

REMUNERATION REPORT (CONTINUED)
The disclosures in the Accounting Remuneration table are calculated in accordance with the accounting standards and accordingly differ from the information presented in Actual Remuneration table.
Accounting Remuneration
Short-term benefits
Post employment
benefitsLong-term
benefitsShare based
payments
Cash salary and fees
$
One-off payments
$
Non-monetary
$
Super-annuation
$
Employee leave
$
Equity-settled
$Total
$
2019
K Russell 1,075,000 – 5,454 25,000 26,261 2,097,188 3,228,903
M Callander1 713,672 286,971 40,216 43,795 107,095 497,516 1,689,265
M Wratten 725,000 – 7,021 25,000 18,910 459,490 1,235,421
A Wildblood2 265,934 324,230 1,208 10,989 19,111 311,287 932,759
A De Jong3 456,319 – 3,266 20,742 41,322 559,250 1,080,899
E Sweeney4 184,492 – 362 7,624 16,132 183,584 392,194
S de Castro5 709,834 – 5,458 17,514 (7,099) – 725,707
2018
K Russell 97,459 – 511 2,267 7,093 – 107,330
M Callander1 548,296 219,318 31,220 16,564 11,399 93,977 920,774
M Wratten 737,500 332,500 10,080 25,000 51,243 77,238 1,233,561
M Simmons6 675,000 300,000 5,640 25,000 73,947 26,561 1,106,148
S de Castro7 262,224 120,000 3,743 11,401 7,099 18,399 422,868
G Horth8 1,671,706 – 25,152 16,277 16,856 59,405 1,789,396
S Carter9 933,797 – 6,517 19,849 (16,582) 36,219 979,800
1. Australia dollar equivalent shown of amounts paid in New Zealand dollars $746,074 (FY18 total NZ$900,018). Conversion rate used as at 30/6/19 0.95657. Retention bonus (tranche 1) awarded in recognition of the significant additional work undertaken in FY19 as a result of the strategic divestment process undertaken in respect of the NZ business, the additional workload supporting the Enterprise, Government and Wholesale businesses pending the arrival of the new Chief Executive. A second tranche, subject to a performance hurdle (namely, the achievement of NZD$59m EBITDA for the NZ business in FY19), will be paid in FY20.
2. For the period 21 January 2019 (date of commencement as Chief Executive, Enterprise & Government) until 30 June 2019. One-off payment received represents a sign-on bonus paid to Executive.
3. For the period 1 September 2018 (date of commencement as Chief Executive, Retail) until 30 June 2019.
4. For the period 11 March 2019 (date of commencement as Chief Operating Officer) until 30 June 2019.
5. Denotes remuneration up to cessation of role as KMP (7 November 2018) and includes termination benefits $583,400 (payment in lieu of notice, accrued leave entitlements and severance pay in accordance with individual contract entitlement).
6. Denotes remuneration as Chief Executive – Enterprise & Wholesale for the full year, as well as in the role of Interim Chief Executive Officer from 23/2/2018 until 30/6/2018. Ceased as KMP on 1 July 2018, with employment to formally end at the end of the termination period (January 2019).
7. For the period 15 January 2018 (date of commencement as Chief Executive, Consumer) until 30 June 2018.
8. Denotes remuneration up to cessation of role as KMP (23 February 2018) and includes termination entitlements of $971,775 (payment in lieu of notice, accrued leave entitlements and severance pay in accordance with individual contract entitlement).
9. Denotes remuneration up to cessation of role as KMP (23 February 2018) and includes termination entitlements of $477,272 (payment in lieu of notice, accrued leave entitlements and severance pay in accordance with individual contract entitlement).
30
VOCUS GROUP Annual Report 2019
For
per
sona
l use
onl
y

The following notes apply to both tables above unless otherwise specified:
|| Cash Salary and Fees do not include termination entitlements paid upon cessation of employment (including payment in lieu of notice, accrued leave entitlements and severance pay) in accordance with individual contract entitlement.
|| No short term compensated absences, short term cash profit sharing or other short-term employee benefits were paid and are not listed.
|| Other than superannuation benefits, no other post-employment benefits were provided.
|| No payments were made to any KMP before the KMP started to hold the position as KMP as part of the consideration for the person agreeing to hold the position.
|| The Accounting Remuneration table includes share-based payments accounting expense for both Options and Performance Rights.
STI Payments
Name1 YearMax potential
STI opportunitySTI awarded
(%)STI deferred
(%)STI forfeited
(%)Total Grant of STI
($)
M Wratten 2019 – – – – –
2018 $350,000 95% – 5% $332,500
M Callander 2019 – – – – –
2018 $300,0002 80% – 20% $240,000
M Simmons 2019 – – – – –
2018 $400,0003 75% – 25% $300,000
S de Castro 2019 – – – – –
2018 $150,0004 80% – 20% $120,000
G Horth 2019 – – – – –
2018 $600,000 – – – –
S Carter 2019 – – – – –
2018 $300,000 – – – –
1. Executives are not entitled to short-term incentives from FY19. Hence, no payments were made.
2. Max potential STI opportunity in NZD. Total grant of STI is in shown above in NZD based on an exchange rate of 0.91383 (AUD equivalent of $274,148).
3. This includes both Michael Simmons’ STI entitlement of $300,000 in his role as Chief Executive, Enterprise & Wholesale, plus an additional $100,000 STI entitlement relating to the role of Interim Group CEO for the period 28 February 2018 to 30 June 2018.
4. Pro-rated for the period 8 January 2018 to 30 June 2018 (full year entitlement is $300,000).
31
For
per
sona
l use
onl
y

REMUNERATION REPORT (CONTINUED)
Summary of LTI plans as at 30 June 2019 (Performance Rights)
Name Plan Performance Period
Fair Value per right at time
of issue
Total value of rights at time
of issue
Future financial years in which
grants may vest
M Wratten FY171 1/07/2016 – 1/07/2019 $3.99 $140,993 FY20
FY18 1/07/2017 – 1/07/2020 $2.48 $352,993 FY21
M Callander FY171 1/07/2016 – 1/07/2019 $3.99 $234,988 FY20
FY18 1/07/2017 – 1/07/2020 $2.48 $302,439 FY21
1. These rights have not satisfied the performance measures when tested following the end of the financial year, and therefore have lapsed.
The maximum value of outstanding Performance Rights is unable to be estimated. On exercise, each Performance Right entitles the KMP to one fully paid ordinary share in Vocus. The share price of Vocus at the time of exercise is not known. The minimum value of outstanding performance rights is nil.
Number and value of LTI Performance Rights granted, vested and exercised during FY19
NameBalance at
1 July 2018Rights
Granted
Disposals/ vesting/
exercise otherBalance at
30 June 2019
Total value of rights at time
of vesting
M Wratten 177,613 – – 177,613 –
M Callander 195,919 – (15,074)3 180,845 –
S de Castro 60,976 – 30,4881 N/A2 –
1. Lapsed following cessation of employment.
2. Ceased to be KMP on 7 November 2018.
3. Lapsed following testing of performance measures in August 2018.
32
VOCUS GROUP Annual Report 2019
For
per
sona
l use
onl
y

All Performance Rights which were granted prior to 1 July 2018 which vest are automatically converted into fully paid ordinary shares in Vocus and issued to the relevant participant at no cost. No further restrictions apply to those shares. Each Performance Right converts into one fully paid ordinary share in Vocus.
Summary of LTI plans as at 30 June 2019 (Options)
Name1 PlanExercise
Price Performance Period
No. Of options in
each tranche
Fair Value per option at time of issue
Total value of options at time of issue
Future financial years in
which grants may vest
K Russell FY19 $2.38 1/07/2018 – 1/07/2021 3,750,000 $0.99 $3,712,500 FY22
1/07/2018 – 1/07/2022 1,875,000 $1.01 $1,893,750 FY23
1/07/2018 – 1/07/2023 1,875,000 $1.03 $1,931,250 FY24
M Wratten FY19 $2.38 1/07/2018 – 1/07/2021 1,200,000 $0.99 $1,188,000 FY22
1/07/2018 – 1/07/2022 600,000 $1.01 $606,000 FY23
1/07/2018 – 1/07/2023 600,000 $1.03 $618,000 FY24
M Callander FY19 $2.38 1/07/2018 – 1/07/2021 1,350,000 $0.99 $1,336,500 FY22
1/07/2018 – 1/07/2022 675,000 $1.01 $681,750 FY23
1/07/2018 – 1/07/2023 675,000 $1.03 $695,250 FY24
A De Jong FY19 $2.38 1/07/2018 – 1/07/2021 1,000,000 $0.99 $990,000 FY22
1/07/2018 – 1/07/2022 500,000 $1.01 $505,000 FY23
1/07/2018 – 1/07/2023 500,000 $1.03 $515,000 FY24
1. Andrew Wildblood and Ellie Sweeney are entitled to the FY19 LTI plan which will be granted in FY20. This will be reported in the FY20 Remuneration Report.
Number and value of LTI Options granted, vested and exercised during FY19
Name1Balance at
1 July 2018 Options Granted
Disposals/vesting/
exercise otherBalance at
30 June 2019
Total value of options at time
of vesting
K Russell – 7,500,000 – 7,500,000
M Wratten – 2,400,000 – 2,400,000 –
M Callander – 2,700,000 – 2,700,000 –
Antony De Jong – 2,000,000 – 2,000,000 –
1. Andrew Wildblood and Ellie Sweeney are entitled to the FY19 LTI plan which will be granted in FY20. This will be reported in the FY20 Remuneration Report.
33
For
per
sona
l use
onl
y

REMUNERATION REPORT (CONTINUED)
KMP Shareholding The following table summarises the movements in the shareholdings of KMP (including their personally related entities) for FY19:
Balance at 1 July 2018
Received as part of
Remuneration AdditionsDisposals/
OtherBalance at
30 June 2019
Directors
R Mansfield 12,500 N/A 66,000 – 78,500
D Wiadrowski 4,265 N/A 14,735 – 19,000
J Ho1 57,490,290 N/A – – 57,490,290
J Fahey – N/A – – –
B Akhurst2 N/A N/A 50,000 – 50,000
M Hanning2 N/A N/A 500,000 – 500,000
K Russell – – – – –
M Callander 74,394 – – – 74,394
Former Directors
Jon Brett3 426,000 N/A – N/A N/A
Rhoda Phillippo3 9,500 N/A – N/A N/A
Executives
M Wratten 32,195 – 1,466 – 33,661
A Wildblood4 N/A – 5,338 – 5,338
A de Jong5 N/A – 30,000 – 30,000
E Sweeney6 N/A – – – –
Former Executives
S de Castro7 60,976 – – – N/A
1. John Ho is the founder and chief investment officer of Janchor Partners, which owns a 17.9% interest in Vocus (constituted by a relevant interest of 9.24% of Vocus’ voting shares and an economic interest through cash settled equity derivatives in a further 8.66%).
2. Appointed as a Non-Executive Director on 22 August 2018.
3. Ceased as Non-Executive Director on 22 August 2018.
4. Appointed to role on 21 January 2019.
5. Appointed to role on 1 September 2018.
6. Appointed to role on 11 March 2019.
7. Ceased to be KMP on 7 November 2018.
This concludes the remuneration report, which has been audited.
This directors’ report is signed in accordance with a resolution of the directors passed on 22 August 2019 pursuant to s.298(2) of the Corporations Act.
On behalf of the Directors
Robert Mansfield Non-Executive Chairman
22 August 2019
Sydney
34
VOCUS GROUP Annual Report 2019
For
per
sona
l use
onl
y

1. GROUP OPERATING PERFORMANCE
1.1 Overview of Operations Vocus Group Limited (ASX: VOC) (Vocus) is a specialist fibre and network solutions provider. The Company owns an extensive national infrastructure network of metro and back haul fibre, connecting capital cities and regional centres across Australia, New Zealand and into Asia. It is the second largest fibre network in Australia.
Vocus targets the enterprise, government, wholesale, small business and residential market segments through a portfolio of brands. Vocus offers both consumer and wholesale NBN services within Australia through all 121 NBN points of interconnect, as well as 100% coverage of the UFB network in New Zealand.
During the period ended 30 June 2019, Vocus reorganised its operating segments. Consequently, the operating segments have changed to present the previously separate Consumer and Business segments as a combined reportable segment called Retail, which more accurately reflects how the Group is currently managed. Comparative balances have been restated to reflect the updated reporting structure. The operating segments were also renamed during the financial year. The four operating segments are; Vocus Network Services (formerly Enterprise, Government & Wholesale), Retail (formerly Consumer and Business), New Zealand, and Infrastructure, Operations and Corporate (formerly Group Services).
Vocus Network Services (formerly Enterprise, Government & Wholesale Australia)Vocus Network Services operates under the Vocus Communications brand and provides telecommunications products and services to the enterprise and wholesale businesses, and all levels of Government, in the Australian market. Products and services include Networks and Connectivity, Cloud Platforms and Security, and Workplace Collaboration. Within the wholesale segment, Vocus provides high performance, high availability and highly scalable communications solutions which allow service providers to quickly and easily deploy new services for their own customer base. For further information on the financial performance of the division please refer to Section 2.1.
Retail (formerly Consumer and Business)Retail focuses on the price sensitive and value seeking segments of the consumer market and the small to medium business segment. It provides telecommunications products and services including broadband, voice and mobile services, as well as energy products. Within the Consumer business, the go to market brands are dodo™ and iPrimus™ with some small legacy brands from prior acquisitions also maintained. Commander™ is the go-to market brand for the small and medium business segment. For further information on the financial performance of the division please refer to Section 2.2.
New ZealandNew Zealand operates in all key segments of the market, including Business, Government, Wholesale and Consumer. In Business, Government and Wholesale the division’s key brand is Vocus Communications. The key Consumer brands are Slingshot and Orcon. The New Zealand business is run as a separate business to Australia and includes all New Zealand overhead and network related costs. For further information on the financial performance of the division please refer to Section 2.3.
1.2 Reported Earnings Overview
$m FY19 FY18$
change%
change
Statutory Revenue 1,892.3 1,884.7 7.6 0.4
Statutory EBITDA1 349.1 360.4 (11.3) (3.1)
Statutory EBIT2 105.8 130.8 (25.0) (19.2)
Statutory NPAT3 after minority interests 34.0 61.1 (27.1) (44.4)
1. EBITDA refers to earnings before net financing costs, tax, depreciation and amortisation.
2. EBIT refers to earnings before net financing costs and tax.
3. NPAT refers to net profit after tax.
OPERATING AND FINANCIAL REVIEW
35
For
per
sona
l use
onl
y

OPERATING AND FINANCIAL REVIEW (CONTINUED)
1.3 Reconciliation of Statutory to Underlying EarningsThe key significant item for the year ended 30 June 2019 relates to the amortisation of acquired customer intangibles, which is a similar amount for the year ended 30 June 2018.
FY19 $m EBITDA EBIT NPAT
Statutory Result 349.1 105.8 34.0
Significant Items
Gains/losses associated with foreign exchange & other (2.3) (2.3) (1.7)
Net loss on disposal of assets 1.4 1.4 1.1
Long term incentive 6.4 6.4 6.4
Amortisation of acquired customer intangibles from purchase price allocation – 61.9 43.4
Amortisation of acquired software intangibles from purchase price allocation – 26.4 18.5
Other significant items 5.5 5.5 3.8
Total Significant Items 11.0 99.3 71.5
Underlying Result 360.1 205.1 105.5
1.4 Revenue and Underlying EBITDA Earnings OverviewDiscussion of the factors driving revenue and EBITDA are contained in the commentary on divisional performance. Revenues and Underlying EBITDA for the financial year to June 2019 have been restated to accommodate changes in the reporting structure in FY19. Please refer to section 2.5 for details of the reallocated FY18 divisional numbers.
$m FY19 FY18$
change%
change
Revenue 1,892.3 1,884.7 7.6 0.4
Vocus Network Services 710.0 575.8 134.2 23.3
Retail 826.1 973.9 (147.8) (15.2)
New Zealand 356.2 335.1 21.2 6.3
Infrastructure, Operations and Corporate – – – –
Underlying EBITDA 360.1 366.7 (6.6) (1.8)
Underlying EBITDA Margin (%) 19.0% 19.5% N/A (50)bps
Vocus Network Services 362.1 344.7 17.4 5.0
Retail 159.9 171.2 (11.3) (6.6)
New Zealand1 59.0 56.6 2.4 4.2
Infrastructure, Operations and Corporate (220.9) (205.8) (15.1) 7.3
1. Amounts presented in section 2.3 are converted to NZD using the average FX rate of 1.07 in FY19 and 1.08 in FY18.
36
VOCUS GROUP Annual Report 2019
For
per
sona
l use
onl
y

1.5 Underlying NPAT Overview
$m FY19 FY18$
change%
change
Underlying EBITDA 360.1 366.7 (6.6) (1.8)
Underlying depreciation & amortisation (155.1) (141.3) (13.8) 9.8
Underlying depreciation (127.1) (117.1) (10.0) 8.5
Underlying amortisation (28.0) (24.2) (3.8) 15.7
Underlying EBIT 205.1 225.4 (20.3) (9.0)
Net financing costs (53.1) (41.0) (12.1) 29.5
Underlying Profit before tax 152.0 184.4 (32.4) (17.6)
Underlying tax expense (46.5) (56.8) 10.3 (18.1)
Underlying Net Profit after Tax 105.5 127.6 (22.1) (17.3)
Significant items before tax (99.3) (94.5) (4.8) 5.1
Significant items after tax (71.5) (66.5) (5.0) 7.5
Net Profit after Tax 34.0 61.1 (27.1) (44.4)
1.6 Depreciation, amortisation and financing costsUnderlying depreciation and amortisation of $155.1m, increased $13.8m on the prior period (+9.8%) driven by the Australia Singapore Cable being depreciated since entering commercial service in September 2018, as well as the increase in depreciation associated with recent capital expenditure spend levels.
Net finance costs increased by $12.1m on prior period to $53.1m, mainly due to increased level of net debt and higher interest rates under the new facility over the financial year to fund the ASC project.
1.7 Cashflow
$m FY19 FY18
Net cash from operating activities 296.8 252.5
Payments for property plant & equipment (133.1) (123.2)
Payments for intangible assets (36.2) (42.9)
Payments for projects under construction1 (139.4) (52.5)
Payments for purchase of business, net of cash acquired, acquisition and integration costs (12.8) (1.9)
Proceeds from disposal of investments 1.3 –
Investing cash flows (320.1) (220.5)
Net proceeds from borrowings 64.2 (10.1)
Repayment of finance leases and IRU liabilities (11.6) (14.1)
Financing cash flows2 52.6 (24.2)
Net movement in cash 29.3 7.8
1. Relates to payments for the Australia Singapore Cable.
2. Financing cash flows include proceeds from pro rata entitlement offer, dividends, change in borrowings and leases.
37
For
per
sona
l use
onl
y

OPERATING AND FINANCIAL REVIEW (CONTINUED)
Net cash from operating activities over the period was $296.8m, an increase of $44.3m from the prior period mainly driven by:
|| Improvements in underlying net working capital movements predominantly driven by upfront cash payments of $26.5m received during the year relating to long term contracts on the Australia Singapore Cable;
|| A reduction in net finance costs of $13.2m offset by an increase in income taxes paid of $4.6m mainly due to timing of payments;
1.7.1 Cash Conversion
$m FY19 FY18
Underlying EBITDA 360.1 366.7
Net cash from operating activities 296.8 252.5
Interest, finance costs and tax 62.4 71.0
Adjusted Operating Cashflow 359.2 323.5
Cash Conversion (%)1 100% 88%
1. Cash conversion % is calculated by dividing Adjusted Operating Cashflow by Underlying EBITDA.
1.7.2 Underlying EBITDA Reconciliation to Adjusted Operating Cashflow
$m FY19 FY18
Underlying EBITDA 360.1 366.7
Conversion 100% 88%
Underlying net working capital movements 15.4 (8.2)
Historic unwind
Deferred revenue unwind (11.5) (24.8)
Onerous provision unwind (4.9) (10.2)
Adjusted Operating Cashflow 359.2 323.5
Cash conversion has improved to 100%, from a comparable base of 88%. The key factors driving the improvement are:
|| Upfront cash of $26.5m received relating to a long term contract on the Australia Singapore Cable.
|| Historic deferred revenue bought to account was $11.5m, primarily relating to revenues recognised under the North West Cable System project and the run off of contracts acquired through the Amcom and Nextgen acquisitions.
|| The release of onerous provisions primarily relates to the un-wind of property leases and the Metronode contract assumed as part of the Nextgen acquisition.
1.8 Capital Expenditure
$m FY19 FY18
Growth 84.9 117.6
Sustaining 41.2 21.4
Improvement 43.2 27.1
Capital Expenditure (excluding ASC) 169.3 166.1
Australia Singapore Cable 139.4 52.5
Total Capital Expenditure 308.7 218.6
38
VOCUS GROUP Annual Report 2019
For
per
sona
l use
onl
y

Growth Capex over the period is linked to customer growth and new product development. 32% year on year reduction is a result of a reduction of investment in customer premise equipment (CPE).
Improvement capex – investment into platforms to generate productivity savings and improve efficiency includes spend on:
|| Retail turnaround
|| Network Operations Centre (NOC) consolidation
|| Vocus Network consolidation
All of the projects undertaken in FY19 have been part of Phase 1 of the initial integration (FY17 – FY19), with Phase 2 being the commencement of the Future State project in H1FY20, which will simplify and modernise our network.
1.9 Net Debt
$mAs at
30 June 2019As at
30 June 2018
AUD facility limit of A$1,170m and is drawn to: 989.0 915.0
New Zealand facility limit of NZ$150m and is drawn to: 105.2 110.1
Bank loans 1,094.2 1,025.1
Backhaul IRU liability 11.9 18.7
Lease liability 15.5 15.3
Borrowings per balance sheet 1,121.6 1,059.1
Cash (87.2) (57.9)
Net Debt 1,034.4 1,001.2
The change in Net Debt from the prior period comparative was driven by a number of factors including the funding of the ASC and changes in working capital balances.
The Group has a syndicated debt facility of AU$1,265 million and NZ$150 million. The facility provides the Group the flexibility required to execute its growth strategy over the coming years.
The maximum Net Leverage Ratio (NLR) for the facility is summarised below:
Testing Date
Maximum Net Leverage Ratio
(NLR)
30 June 2019 3.50x
31 December 2019 3.50x
30 June 2020 3.25x
31 December 2020 and thereafter 3.00x
The facility has a weighted average tenure of 3.0 years and the facility agreement stipulates that dividends will not be paid until the NLR is below 2.25x for two consecutive testing dates.
1.9.1 Financial Covenants
Financial Covenant1 30 June 2019
Net Leverage Ratio ≤3.50x (Net debt/LTM EBITDA) 2.87x
Interest Cover Ratio ≥5.0x (LTM EBITDA/LTM Net Interest Expense) 6.79x
Gearing ≤ 60% (Net Debt/(Net Debt + Equity) 30.4%
1. Bank methodology used to in the calculation of financial covenants.
39
For
per
sona
l use
onl
y

OPERATING AND FINANCIAL REVIEW (CONTINUED)
Vocus Group is compliant with its syndicated facility financial covenants as at 30 June 2019.
2. DIVISIONAL PERFORMANCE
2.1 Vocus Network ServicesThe Vocus Network Services division comprises the Enterprise, Government and Wholesale business segments. The go to brand in the market is predominantly Vocus Communications.
2.1.1 Earnings Summary – Vocus Network Services
$m FY19 FY18$
Change%
Change
Revenue 710.0 575.8 134.2 23
Recurring 590.3 564.0 26.3 5
Non-recurring 119.7 11.8 107.9 NM2
Product revenue 710.0 575.8 134.2 23
Data Networks 526.0 408.6 117.5 29
Voice 89.6 92.8 (3.1) (3)
NBN 52.0 28.1 23.9 85
Data Centre 31.3 34.1 (2.7) (8)
Other 11.0 12.3 (1.3) (11)
Underlying EBITDA (pre allocation) 362.1 344.7 17.4 5
EBITDA margin (%) 51.0% 59.9% n/a (8.9)
Allocated costs1
Infrastructure & Operations costs allocation (123.4)
Corporate costs allocation (35.9)
Underlying EBITDA (post allocation) 202.8
EBITDA margin (%) 28.6%
1. Allocation methodology outlined in section 2.4. Costs were not allocated in FY18.
2. Not meaningful.
Revenue increased by $134.2m on the prior comparative period to $710.0m, driven by:
|| Recurring revenues increased by 5%, driven by:
– Successful delivery of Australia Singapore Cable and conversion of sales demand; and
– Strong growth in wholesale NBN services; offset by
– Material one-off churn event due to the end of a legacy Nextgen contract; and
– Structural decline in fixed Voice revenue and substitution to mobile.
|| Non recurring project revenues from the Coral Sea cable build which is due to be completed by the end of calendar 2019.
Underlying EBITDA for the period increased 5% on the prior comparative period by $17.4m. The EBITDA margin is lower due to a change in revenue mix. Revenue generated from core recurring on-net services maintained the EBITDA margins as per previous periods. However, the margins on NBN wholesale products and the Coral Sea cable construction project attract lower margins. In addition, there has been further investment in sales and other key resources which has also impacted the EBITDA result.
40
VOCUS GROUP Annual Report 2019
For
per
sona
l use
onl
y

2.2 Retail (Formerly Consumer and Business)The Australian Retail business provides offerings to the consumer and small to medium business markets.
Consumer offerings include broadband data, voice, mobile telecommunications and Fetch TV marketed under the dodo™ and iPrimus™ brands. The division also markets gas and electricity services in selected states as either standalone or bundled with telecommunications services as part of the dodo™brand and maintains some small legacy brands from prior acquisitions.
In the small to medium business segment, Commander™ offers a range of communications solutions to Australian businesses, including broadband data, fixed voice and mobile services. Commander™ also offers electricity in selected states.
2.2.1 Earnings Summary
$m FY19 FY18$
Change%
Change
Revenue 826.1 973.9 (147.8) (15)
Legacy Products 241.6 389.8 (148.2) (38)
NBN 260.9 200.6 60.3 30
IP Voice 28.1 27.9 0.2 1
Mobile 55.5 58.1 (2.6) (4)
Energy 196.7 232.0 (35.3) (15)
Other 43.3 65.5 (22.2) (34)
Underlying EBITDA (pre allocation) 159.9 171.2 (11.3) (7)
EBITDA margin (%) 19.4% 17.6% n/a 1.8
Allocated costs1
Infrastructure & Operations costs allocation (42.0)
Corporate costs allocation (15.0)
Underlying EBITDA (post allocation) 102.9
EBITDA margin (%) 12.5%
1. Allocation methodology outlined in section 2.4. Costs were not allocated in FY18.
SIO’sAs at
30 June 2019As at
30 June 2018$
Change%
Change
Voice 215 297 (82) (28)
Copper 137 242 (105) (43)
NBN 365 308 57 19
Mobile 180 170 10 6
Energy 132 140 (8) (5)
41
For
per
sona
l use
onl
y

OPERATING AND FINANCIAL REVIEW (CONTINUED)
Metrics FY19 FY18
Copper ARPU $ 56.6 57.0
Copper AMPU $ 24.8 24.6
NBN ARPU $ 64.3 64.0
NBN AMPU $ 20.4 20.9
Net churn – Copper (%) (3.8) (2.8)
Net churn – NBN (%) (1.8) (1.6)
Whilst revenues have declined 15% the Retail business has been successful in reducing its cost base, driven by digitisation and reduction in offshore headcount, mitigating the impact on EBITDA.
|| Legacy products declined by $148.2m compared to the prior comparative period, mainly driven by:
– Voice revenue (PSTN phone lines) decline due to reduced services in operations (SIOs), NBN roll-out, line consolidation in Commander business and mobile substitution. This was partially offset by increases in IP Voice services.
– Broadband (ADSL copper services) decline due to migration from legacy broadband to NBN.
|| NBN revenue increased by $60.3m representing a 30% increase to prior year offsetting some of the losses in legacy services.
|| Mobile revenue has remained stable during the period. Mobile services increased by 6% compared to the prior comparative period, however this was offset by declining ARPU due to ceasing the sale of mobile handsets in November 2018 in conjunction with the launch of new lower priced SIM only product offerings.
|| Energy revenue reduced by $35.3m driven by a 5% decline in Energy customers and a drop in average customer energy usage.
|| Other revenue was lower due to discontinuation of both Pendo and Insurance product offerings in FY19 as well as reductions in other account fees and charges.
Underlying EBITDA for the period reduced by $11.3m as a result of loss in higher margin legacy products partially offset by lower margin NBN; however, as a percentage of revenue EBITDA increased by 1.8% on the prior comparative period due to tight SG&A and cost management.
2.3 New Zealand
2.3.1 Earnings Summary
NZD $m FY19 FY18$
Change%
Change
Revenue 379.8 363.5 16.3 5
Enterprise & Wholesale 181.1 180.0 1.1 1
Consumer 198.7 183.5 15.2 8
Underlying EBITDA 62.9 61.3 1.6 3
EBITDA margin % 16.6% 16.9% n/a (0.3)
SIO’sAs at
30 June 2019As at
30 June 2018$
Change%
Change
Broadband Consumer SIOs 203 194 9 5
Copper broadband (‘000) 92 122 (30) (25)
UFB (‘000) 111 72 39 54
SMB SIOs (‘000) 20 22 (2) (9)
Energy SIOs (‘000) 27 17 10 59
Mobile SIOs (‘000) 29 24 5 21
42
VOCUS GROUP Annual Report 2019
For
per
sona
l use
onl
y
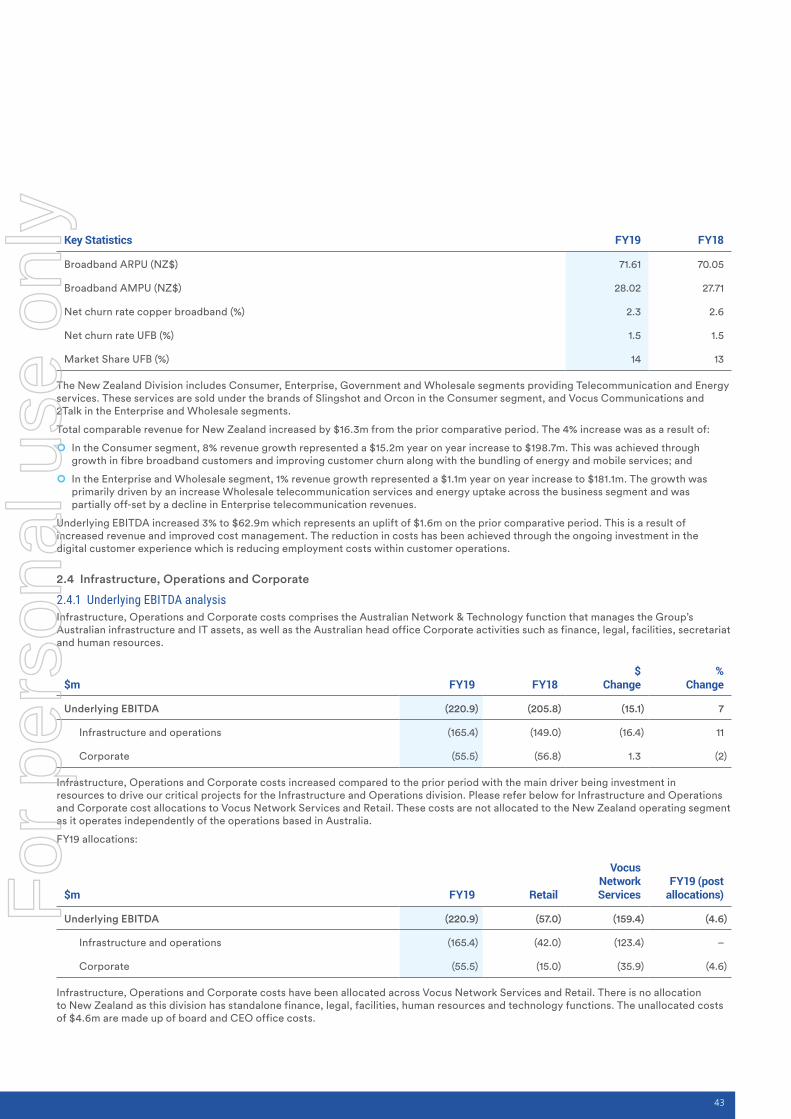
Key Statistics FY19 FY18
Broadband ARPU (NZ$) 71.61 70.05
Broadband AMPU (NZ$) 28.02 27.71
Net churn rate copper broadband (%) 2.3 2.6
Net churn rate UFB (%) 1.5 1.5
Market Share UFB (%) 14 13
The New Zealand Division includes Consumer, Enterprise, Government and Wholesale segments providing Telecommunication and Energy services. These services are sold under the brands of Slingshot and Orcon in the Consumer segment, and Vocus Communications and 2Talk in the Enterprise and Wholesale segments.
Total comparable revenue for New Zealand increased by $16.3m from the prior comparative period. The 4% increase was as a result of:
|| In the Consumer segment, 8% revenue growth represented a $15.2m year on year increase to $198.7m. This was achieved through growth in fibre broadband customers and improving customer churn along with the bundling of energy and mobile services; and
|| In the Enterprise and Wholesale segment, 1% revenue growth represented a $1.1m year on year increase to $181.1m. The growth was primarily driven by an increase Wholesale telecommunication services and energy uptake across the business segment and was partially off-set by a decline in Enterprise telecommunication revenues.
Underlying EBITDA increased 3% to $62.9m which represents an uplift of $1.6m on the prior comparative period. This is a result of increased revenue and improved cost management. The reduction in costs has been achieved through the ongoing investment in the digital customer experience which is reducing employment costs within customer operations.
2.4 Infrastructure, Operations and Corporate
2.4.1 Underlying EBITDA analysis Infrastructure, Operations and Corporate costs comprises the Australian Network & Technology function that manages the Group’s Australian infrastructure and IT assets, as well as the Australian head office Corporate activities such as finance, legal, facilities, secretariat and human resources.
$m FY19 FY18$
Change%
Change
Underlying EBITDA (220.9) (205.8) (15.1) 7
Infrastructure and operations (165.4) (149.0) (16.4) 11
Corporate (55.5) (56.8) 1.3 (2)
Infrastructure, Operations and Corporate costs increased compared to the prior period with the main driver being investment in resources to drive our critical projects for the Infrastructure and Operations division. Please refer below for Infrastructure and Operations and Corporate cost allocations to Vocus Network Services and Retail. These costs are not allocated to the New Zealand operating segment as it operates independently of the operations based in Australia.
FY19 allocations:
$m FY19 Retail
Vocus Network Services
FY19 (post allocations)
Underlying EBITDA (220.9) (57.0) (159.4) (4.6)
Infrastructure and operations (165.4) (42.0) (123.4) –
Corporate (55.5) (15.0) (35.9) (4.6)
Infrastructure, Operations and Corporate costs have been allocated across Vocus Network Services and Retail. There is no allocation to New Zealand as this division has standalone finance, legal, facilities, human resources and technology functions. The unallocated costs of $4.6m are made up of board and CEO office costs.
43
For
per
sona
l use
onl
y

OPERATING AND FINANCIAL REVIEW (CONTINUED)
The allocation of Infrastructure and Operations across Vocus Network Services and Retail has been determined by identifying directly attributable Retail costs and allocating a portion of residual indirect shared costs to the Retail division. Direct costs include the Retail specific operating support system (OSS) including maintenance and security and third party network costs. Indirect costs are made up of external vendors and internal labour. Further work is required to ascertain a complete network utilisation charge back from Vocus Network Services to Retail for the use of the Group’s network assets.
The allocation of Corporate costs across Vocus Network Services and Retail has been determined by specifically identifying costs associated with the Retail division ($15.0m), with the remainder allocated to Vocus Network Services ($35.9m). Retail costs comprise directly attributable office costs and warehouse costs, with legal, finance, and human resources support costs determined using an allocation methodology. Legal and finance costs have been allocated with reference to divisional revenue, with human resources support costs allocated based on headcount.
2.5 Restatement of Reported FY18 and 1H19 Divisional PerformanceDue to changes to the operating and reporting structure of the business in FY19, a restatement of FY18 and 1H19 divisional Revenues and Underlying EBITDA’s is required to enable a like for like comparison across periods. The table below sets out those reallocations. The most significant is to combine the Business (Commander) and Consumer division into the Retail division. There is also a reallocation of cost from Vocus Network Services to Infrastructure, Operations and Corporate to recognize activities undertaken for the benefit of the Australian business, rather than specifically for Vocus Network Services.
$mFY18
(as per OFR)
Consumer/Business
combined in Retail
Business Unit Re-allocations
LTI expense & Revenue
reclassification
FY18 (post
reallocations)
Revenue 1,898.2 – – (13.4) 1,884.7
Vocus Network Services 568.9 – 6.9 – 575.8
Business 203.9 (203.9) – – –
Consumer 790.3 (790.3) – – –
Retail – 994.2 (6.9) (13.4) 973.9
New Zealand 335.1 – – – 335.1
Underlying EBITDA 366.1 – – 0.6 366.7
Vocus Network Services 318.7 – 26.0 – 344.7
Business 87.1 (87.1) – – –
Consumer 84.4 (84.4) – – –
Retail – 171.5 (0.3) – 171.2
New Zealand 56.6 – – – 56.6
Infrastructure, Operations and Corporate (180.7) – (25.7) 0.6 (205.8)
44
VOCUS GROUP Annual Report 2019
For
per
sona
l use
onl
y

3. GROUP OUTLOOK
3.1 Group StrategyVocus has a clear strategy to deliver long term sustainable growth. The opportunity in each of the three independent operating businesses requires a different strategy.
Vocus Network ServicesOperating under the Vocus Communications brand, Vocus Network Services is building Australia’s specialist fibre and network solutions provider.
Our key assets, connecting Australia with Asia and the USA, are our fibre and core transport network.
|| 15,020km of inter-capital network in Australia
|| Over 9,500km of metropolitan and regional fibre in all major centres
|| 4,200 km of inter-capital network in New Zealand
|| More than 5,500 on-net buildings
|| Connectivity to 17 major sports stadiums
|| 4,600km Australia Singapore Cable providing a gateway to Asia
|| Connectivity to the USA via investment in IRUs
|| North West Cable System connecting offshore oil and gas facilities
Vocus has significant market share opportunity leveraging the quality and extent of our fibre network assets throughout Australia. Digitisation, automation, artificial intelligence, machine learning and 5G are all increasing demand for data connectivity and high bandwidth consumption. Furthermore, hyperscale cloud companies are consuming significant capacity across Australia and into Asia along with large Enterprises increasingly adopting private and public cloud. As these trends continue, there is increasing demand for diversity of supply across multiple providers of network services to meet future growth projections.
Within the core Enterprise, Government and Wholesale segments, a highly targeted approach has been adopted to focus on key verticals whose needs align to our core assets and capability. Understanding that these verticals require different products and go to market strategies to be successful, we are focused on strengthening our sales capability and further differentiating from our competitors by delivering enhanced customer experiences and engagement. This will involve the rationalisation of products and services along with investment in our people to drive our growth ambitions.
To capture the wider market opportunity, the indirect sales channel and partners will be reinvigorated which to allow the Vocus direct sales team to focus on higher value customers in key market segments. In addition, there will be an increased focus on strategic partnerships with major technology players to extend our reach and branding, particularly in products such as public cloud, SD-WAN, and voice and collaboration.
$m1H19
(as per OFR)
Consumer/Business
combined in Retail
Business Unit Re-allocations
LTI expense & Revenue
reclassification
1H19 (post
reallocations)
Revenue 974.2 – – (5.2) 969.0
Vocus Network Services 360.9 – 0.3 – 361.2
Business 88.6 (88.6) – – –
Consumer 350.4 (350.4) – – –
Retail – 439.0 – (5.2) 433.8
New Zealand 174 – – – 174.0
Infrastructure, Operations and Corporate 0.3 – (0.3) – –
Underlying EBITDA 170.7 – – 5.6 176.3
Vocus Network Services 166.9 – 12.3 – 179.2
Business 33.1 (33.1) – – –
Consumer 45.5 (45.5) – – –
Retail – 78.6 0.3 – 78.9
New Zealand 28.3 – – – 28.3
Infrastructure, Operations and Corporate (103.1) – (12.6) 5.6 (110.1)
45
For
per
sona
l use
onl
y
OPERATING AND FINANCIAL REVIEW (CONTINUED)
With the Australia Singapore Cable becoming operational during the last year, Vocus will harness this asset for international and domestic growth. This will be achieved through the creation of an international sales team along with an increased presence in Singapore and the USA.
RetailRetail was established as a standalone business unit during FY19 to implement a strategy to return the business to profitable growth. Retail focuses on the price sensitive and value seeking segments of the consumer market and the small to medium business segment. It provides telecommunications products and services including broadband, voice and mobile services, as well as energy products. Within the Consumer segment, the go to market brands are dodo™ and iPrimus™ with some small legacy brands from prior acquisitions also maintained. Commander™ is the go-to market brand for the small and medium business segment. The Retail business is currently skewed to legacy voice and data products, such as PSTN, ISDN and ADSL. This legacy revenue is declining due to migration to VOIP and mobile solutions, and particularly to the NBN which also attracts lower margins.
To address this structural decline, Retail is executing a multi-brand strategy to drive profitable growth through revenue diversification and taking market share in mobile and energy. In addition, the operating model is changing to be digitally driven sales and service, driving down cost to acquire and cost to serve, to build a scalable, low cost business.
Within the broadband market, one-time costs to acquire and connect customers to the NBN are high and chasing market share is expensive. Accordingly, the focus is to transition existing ADSL copper broadband customers to the NBN. Whilst broadband is the entry point into the home, the opportunity to bundle energy products lengthens the tenure of customers and expands margins and will be aggressively pursued.
Relative to existing share of the fixed telco market, Retail has very low market share in mobile. Although all brands have high levels of awareness relative to other challenger brands, the Commander brand is uniquely placed as an SMB-only brand to grow mobile penetration. The Optus MVNO arrangement provides a path to 5G and fixed wireless broadband which also broadens the mobile product offering.
New ZealandNew Zealand will leverage multiple brands and significant network infrastructure to grow addressable market share across all segments. In the mass market segment, Slingshot and Orcon are well-established brands underpinning a broadband led strategy with compelling reasons to bundle additional products.
Within the Business and Wholesale segments, there is an increasing focus on high bandwidth users that value network performance over lower value customer segments with poor economic returns. Growth in the Enterprise and Government segments will be achieved through increased investment in direct sales and indirect channels, as well as driving leadership in fixed network capability and cloud enablement. The enablement of other market entrants through the Wholesale business is a key focus
3.2 FY2019 guidanceWe are re-investing in the business in FY20 in order to drive revenue and earnings growth in FY21 and beyond.
For FY20, expectations are in line with previously released guidance:
|| Underlying EBITDA – $359m – $379m
|| Capex (ex ASC) – $200m – $210m
3.3 Business RisksThe following information sets out the major Group-wide risks. The risks below do not include generic macro related risks that could impact the Australian economy and they do not include specific financial risks which are identified in the commentary around the financial performance of the Company. All of the risks identified below could have a material impact on the value of the Company’s brands and its reputation in the market. Vocus seeks to mitigate the potential impact of these risks through the effective management of and engagement with its key stakeholder base; an ongoing focus on its cost base and transformation program; and ensuring that it has effective systems and procedures in place to manage the business on a day-to-day basis and address the strategic issues and challenges that may impact the business over the medium term. The risks below are identified to assist investors in understanding the nature of the risks faced by Vocus and the industry in which it operates. The Company’s risk management approach is set out in detail in the Corporate Governance Statement which is available on the Company’s website www.vocusgroup.com.au.
Increased Competition and Exposure to Counterparty risk|| NBN Co continues to evolve their wholesale pricing model.
The current high pricing structure, variable nature of the pricing construct and the increasing consumer demand for data has had, and potentially continues to have, a significant impact on profitability of NBN plans for all RSPs.
|| New technologies such as fixed wireless and 5G open up opportunities for existing players and new entrants. In December 2018 Vocus executed an extension to its existing MVNO agreement to secure access to future technologies.
|| Increased competition in the Enterprise & Wholesale segments of the market as incumbents compete to retain share. NBN Co has also entered the competitive Enterprise segment, which has implications for strategy and our ability to compete.
|| The Company is exposed to the financial and operational performance of third-party suppliers including companies such as Optus, Telstra and the provider of the Vocus Retail contact centre services in the Philippines, Acquire BPO Pty Ltd.
46
VOCUS GROUP Annual Report 2019
For
per
sona
l use
onl
y

Regulatory, Safety and Environmental Risks|| Vocus operates in highly regulated industry sectors, which
have been identified as focus areas for enforcement by various regulators including the ACCC.
|| The protection of customer, employee and third-party data is critical. The regulatory environment surrounding information security and privacy is evolving constantly and becoming increasingly complex and demanding, including the implementation of a number of new regulations such as mandatory data breach reporting and more recently, the cyber surveillance laws and consumer data right legislation. Customer requirements and expectations are also becoming more stringent in light of the harms which could occur in this area. Breach incidents in this area could have a material impact on the Company’s reputation and its ability to compete and operate effectively in the market, resulting in an increased cost of compliance to mitigate and manage this risk.
|| The Telecommunications Sector Security Reforms (TSSR) commenced in September 2018. This legislation places an obligation on Vocus to notify the government of proposed changes to a wide range of our networks and services. TSSR legislation provides the Government with wide-ranging directions powers which have the potential both to delay the roll out of new technologies or changes, and also to increase costs of building and maintaining our networks.
|| A small part of the Company’s workforce operate outside the office environment, in roles within our data centre, fibre operations, warehousing and logistics divisions, amongst others. These roles give rise to an inherently higher safety risk, which we manage though our Workplace Health and Safety management system.
|| The Company’s approach to environmental risks is outlined in the Sustainability report on the Company’s website www.vocusgroup.com.au
Network and Operational disruption At Vocus, we are aware of the criticality of the network we provide to our Enterprise, Government, Wholesale and Retail customers. Over the last 18 months we have invested in building up the resilience and reliability of our Network. We have invested in hardening our Voice products by upgrading our Session Board Controls and our transmission network as we complete our Supercore programme of work.
The potential risks to our network performance include:
|| The Company’s ability to deliver its products and services could be impacted by material disruption or damage to both the Company and third-party networks and products. This disruption could arise as a result of events which are to a certain extent beyond the Company’s control such as employee negligence or unauthorised physical or electrical access. In addition, the Company’s ability to deliver its services could be impacted by remote access attacks, viruses and other forms of cybercrime.
|| The prevalence, impact and sophistication of cyber-attacks is increasing, and Vocus has invested substantially in strengthening our cyber defences.
|| In September 2018 the Company’s Australia Singapore Cable (a sub-sea cable between Perth and Singapore via Indonesia) commenced operating. The sub-sea fibre path is subject to the risk of fibre cuts, which can give rise to long lead times to identify and repair, particularly if the cut occurs in deep water.
|| The Company’s infrastructure assets are exposed to the impact of natural disasters & climate change risk across Australia and New Zealand including seismic activity, particularly in New Zealand. Natural disasters do have the potential to impact the delivery of products and services resulting in significant business disruption.
We continue to manage these risks through network hardening, resilience and redundancy programmes coupled with our Future State Programme of work, aimed at reducing complexity in our network.
Technology || The telecommunications and IT industries are continually
evolving as are consumer behaviour and attitudes towards the use of technology. The ability of the Company to keep pace with changes in technology will dictate its ability to maintain and grow its existing market share and margins into the future.
|| The successful completion of our planned product and platform integration and consolidation is critical to the Company achieving its goals, and therefore, any challenge to this represents a key risk to the Company. Migration to the Company’s future Technology architectural state will deliver improved resilience and a better customer experience.
|| In ensuring the Company remains competitive in the face of technology change it also important that it remains disciplined around capital investment to ensure that returns to shareholders are maximised.
|| The Company is party to a number of long-term IRU agreements, both as grantor and recipient of network capacity. The continuation of these agreements in their current form underpins the Company’s future financial performance.
Financial and Commodity Markets|| The Energy business in both Australia and New Zealand is
exposed to an extent to sharp movements in the price of both electricity and gas. The Company seeks to hedge its exposure to adverse fluctuations through the use of over the counter derivatives and contracts via the futures market.
|| The Company is subject to the risk of rising interest rates associated with borrowing on a floating rate basis.
|| The Company has some exposure to foreign currency fluctuations primarily on the translation of earnings from the New Zealand business and payments for access to offshore infrastructure and our call centre facilities.
The Company needs to ensure that it has access to a competitive cost of capital to enable it to operate effectively in its target markets. There may be external factors that impact the efficient working of capital markets at any particular point in time that could impact the Company’s access to capital markets. There may also be Company specific issues impacting the Company’s ability to access capital markets including its delivery on earnings expectations and its financial position.
47
For
per
sona
l use
onl
y

PricewaterhouseCoopers, ABN 52 780 433 757 One International Towers Sydney, Watermans Quay, Barangaroo, GPO BOX 2650, SYDNEY NSW 2001 T: +61 2 8266 0000, F: +61 2 8266 9999, www.pwc.com.au Level 11, 1PSQ, 169 Macquarie Street, Parramatta NSW 2150, PO Box 1155 Parramatta NSW 2124 T: +61 2 9659 2476, F: +61 2 8266 9999, www.pwc.com.au
Liability limited by a scheme approved under Professional Standards Legislation.
36
Auditor’s Independence Declaration
As lead auditor for the audit of Vocus Group Limited for the year ended 30 June 2019, I declare that to the best of my knowledge and belief, there have been:
a) no contraventions of the auditor independence requirements of the Corporations Act 2001 in relation to the audit; and
b) no contraventions of any applicable code of professional conduct in relation to the audit.
This declaration is in respect of Vocus Group Limited and the entities it controlled during the period.
Mark Dow
Sydney Partner PricewaterhouseCoopers
22 August 2019
AUDITOR’S INDEPENDENCE DECLARATION
48
VOCUS GROUP Annual Report 2019
For
per
sona
l use
onl
y

FOR THE YEAR ENDED 30 JUNE 2019
Consolidated
Note2019
$’0002018
$’000
Revenue 5 1,892,296 1,884,743
Other gains and losses (4,553) (5,732)
Expenses
Network and service delivery (1,103,834) (1,095,488)
Employee benefits expense 6 (228,150) (201,507)
Depreciation and amortisation expense 6 (243,357) (229,608)
Administration and other expenses (206,652) (221,600)
Net finance costs 6 (53,052) (40,978)
Profit before income tax expense 52,698 89,830
Income tax expense 7 (18,689) (28,785)
Profit after income tax expense for the year attributable to the owners of Vocus Group Limited 24 34,009 61,045
Other comprehensive income
Items that may be reclassified subsequently to profit or loss
Foreign currency translation 14,628 (7,933)
Net movement on hedging transactions, net of tax 4,676 (3,220)
Net movement on revaluation of equity instrument financial assets 342 (667)
Other comprehensive income for the year, net of tax 19,646 (11,820)
Total comprehensive income for the year attributable to the owners of Vocus Group Limited 53,655 49,225
Note Cents Cents
Basic earnings per share 10 5.47 9.81
Diluted earnings per share 10 5.40 9.79
The above statement of profit or loss and other comprehensive income should be read in conjunction with the accompanying notes.
STATEMENT OF PROFIT OR LOSS AND OTHER COMPREHENSIVE INCOME
49
For
per
sona
l use
onl
y
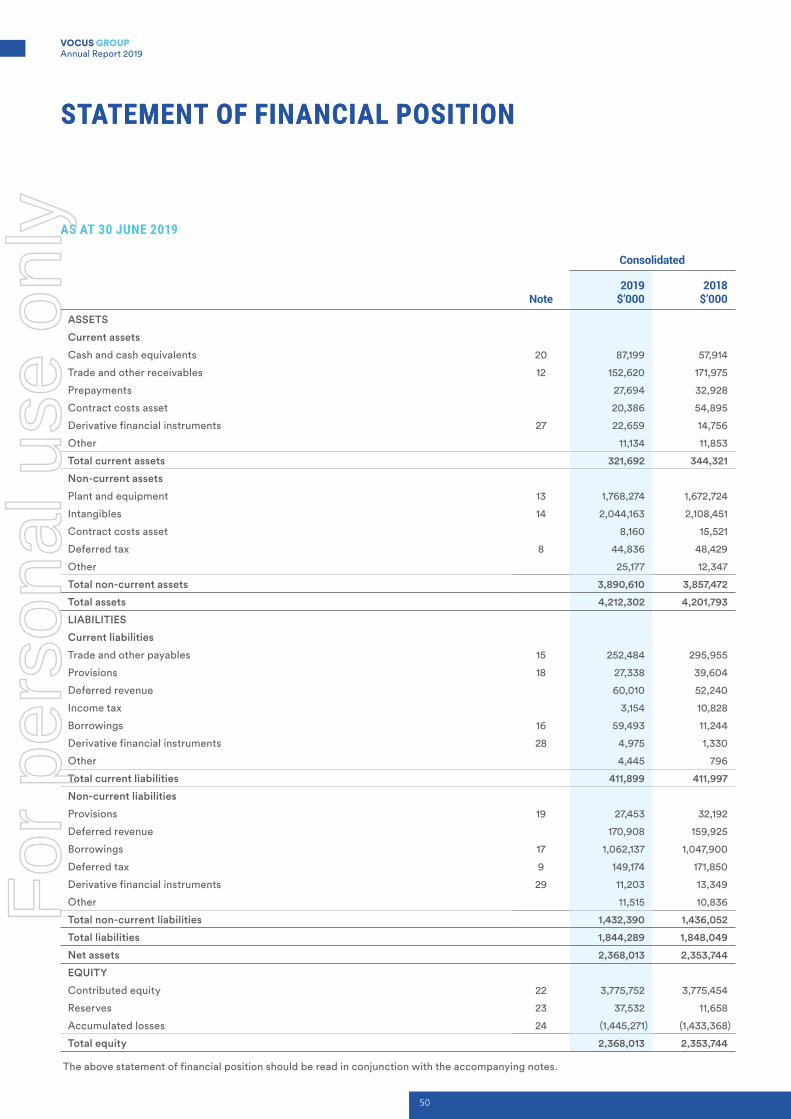
STATEMENT OF FINANCIAL POSITION
AS AT 30 JUNE 2019
Consolidated
Note2019
$’0002018
$’000
ASSETS
Current assets
Cash and cash equivalents 20 87,199 57,914
Trade and other receivables 12 152,620 171,975
Prepayments 27,694 32,928
Contract costs asset 20,386 54,895
Derivative financial instruments 27 22,659 14,756
Other 11,134 11,853
Total current assets 321,692 344,321
Non-current assets
Plant and equipment 13 1,768,274 1,672,724
Intangibles 14 2,044,163 2,108,451
Contract costs asset 8,160 15,521
Deferred tax 8 44,836 48,429
Other 25,177 12,347
Total non-current assets 3,890,610 3,857,472
Total assets 4,212,302 4,201,793
LIABILITIES
Current liabilities
Trade and other payables 15 252,484 295,955
Provisions 18 27,338 39,604
Deferred revenue 60,010 52,240
Income tax 3,154 10,828
Borrowings 16 59,493 11,244
Derivative financial instruments 28 4,975 1,330
Other 4,445 796
Total current liabilities 411,899 411,997
Non-current liabilities
Provisions 19 27,453 32,192
Deferred revenue 170,908 159,925
Borrowings 17 1,062,137 1,047,900
Deferred tax 9 149,174 171,850
Derivative financial instruments 29 11,203 13,349
Other 11,515 10,836
Total non-current liabilities 1,432,390 1,436,052
Total liabilities 1,844,289 1,848,049
Net assets 2,368,013 2,353,744
EQUITY
Contributed equity 22 3,775,752 3,775,454
Reserves 23 37,532 11,658
Accumulated losses 24 (1,445,271) (1,433,368)
Total equity 2,368,013 2,353,744
The above statement of financial position should be read in conjunction with the accompanying notes.
STATEMENT OF FINANCIAL POSITION
50
VOCUS GROUP Annual Report 2019
For
per
sona
l use
onl
y

STATEMENT OF CHANGES IN EQUITYSTATEMENT OF CHANGES IN EQUITY
FOR THE YEAR ENDED 30 JUNE 2019
Consolidated
Contributed equity $’000
Reserves $’000
Retained profits/
(accumulated losses)
$’000
Non-controlling
interest $’000
Total equity $’000
Balance at 1 July 2017 3,774,834 22,703 (1,494,413) – 2,303,124
Profit after income tax expense for the year – – 61,045 – 61,045
Other comprehensive income for the year, net of tax – (11,820) – – (11,820)
Total comprehensive income for the year – (11,820) 61,045 – 49,225
Transactions with owners in their capacity as owners:
Contributions of equity, net of transaction costs (note 22) 136 – – – 136
Share based payments (note 30) – 911 – – 911
Transfers 484 (136) – – 348
Balance at 30 June 2018 3,775,454 11,658 (1,433,368) – 2,353,744
Consolidated
Contributed equity $’000
Reserves $’000
Retained profits/
(accumulated losses)
$’000
Non-controlling
interest $’000
Total equity $’000
Balance at 1 July 2018 3,775,454 11,658 (1,433,368) – 2,353,744
Change on initial application of AASB 15 and AASB 9 – net of tax – – (45,912) – (45,912)
Balance at 1 July 2018 – restated 3,775,454 11,658 (1,479,280) – 2,307,832
Profit after income tax expense for the year – – 34,009 – 34,009
Other comprehensive income for the year, net of tax – 19,646 – – 19,646
Total comprehensive income for the year – 19,646 34,009 – 53,655
Transactions with owners in their capacity as owners:
Contributions of equity, net of transaction costs (note 22) 72 – – – 72
Share-based payments (note 30) – 6,454 – – 6,454
Transfers 226 (226) – – –
Balance at 30 June 2019 3,775,752 37,532 (1,445,271) – 2,368,013
The above statement of changes in equity should be read in conjunction with the accompanying notes.
51
For
per
sona
l use
onl
y

STATEMENT OF CASH FLOWSSTATEMENT OF CASH FLOWS
FOR THE YEAR ENDED 30 JUNE 2019
Consolidated
Note2019
$’0002018
$’000
Cash flows from operating activities
Receipts from customers 2,139,478 2,039,431
Payments to suppliers and employees (1,780,353) (1,715,909)
359,125 323,522
Interest received 761 651
Other finance costs paid (39,949) (53,098)
Income taxes paid (23,170) (18,589)
Net cash from operating activities 21 296,767 252,486
Cash flows from investing activities
Payment for purchase of business, net of cash acquired, acquisition and integration costs (12,751) (1,944)
Payments for property, plant and equipment (133,088) (123,220)
Payments for intangible assets (36,243) (42,917)
Payments for projects under construction (139,357) (52,512)
Proceeds from sale of assets 1,342 –
Net cash used in investing activities (320,097) (220,593)
Cash flows from financing activities
Repayment of former debt facility – (1,011,651)
Drawdown of current debt facility – 1,025,116
Proceeds/(Repayments) from borrowings 64,235 (15,406)
Repayment of finance leases and IRU liabilities (11,620) (14,050)
Payment of upfront borrowing costs – (8,182)
Net cash from/(used in) financing activities 52,615 (24,173)
Net increase in cash and cash equivalents 29,285 7,720
Cash and cash equivalents at the beginning of the financial year 57,914 50,194
Cash and cash equivalents at the end of the financial year 20 87,199 57,914
The above statement of cash flows should be read in conjunction with the accompanying notes.
52
VOCUS GROUP Annual Report 2019
For
per
sona
l use
onl
y

NOTES TO THE FINANCIAL STATEMENTS
NOTE 1. REPORTING ENTITYThe financial statements cover Vocus Group Limited as a Consolidated Entity consisting of Vocus Group Limited and the entities it controlled at the end of, or during, the year (collectively referred to as ‘Vocus’). The financial statements are presented in Australian dollars, which is Vocus Group Limited’s functional and presentation currency.
Vocus Group Limited is a listed public company limited by shares, incorporated and domiciled in Australia. Its registered office and principal place of business is:
Level 10 452 Flinders Street Melbourne Victoria 3000
A description of the nature of Vocus’ operations and its principal activities are included in the Directors’ report, which is not part of the financial statements.
The financial statements were authorised for issue, in accordance with a resolution of Directors, on 22 August 2019. The Directors have the power to amend and reissue the financial statements.
NOTE 2. BASIS OF PREPARATIONThese general purpose financial statements have been prepared in accordance with Australian Accounting Standards and Interpretations issued by the Australian Accounting Standards Board (AASB) and the Corporations Act 2001, as appropriate for for-profit oriented entities. These financial statements also comply with International Financial Reporting Standards as issued by the International Accounting Standards Board (IASB).
Historical cost conventionThe financial statements have been prepared under the historical cost convention, except for the revaluation of derivative financial instruments at fair value.
Net current asset deficiencyAs at 30 June 2019, Vocus Group’s current liabilities exceeded its current assets by $90,208,000. Vocus is satisfied that it will be able to meet all its obligations as they fall due given its strong profitability and operating cash flows, existing cash reserves and available finance facilities.
Parent entity informationIn accordance with the Corporations Act 2001, these financial statements present the results of Vocus (as a consolidated entity) only. Supplementary information about the parent entity is disclosed in note 38.
NOTE 3. CRITICAL ACCOUNTING JUDGEMENTS, ESTIMATES AND ASSUMPTIONSThe preparation of the financial statements requires management to make judgements, estimates and assumptions that affect the reported amounts in the financial statements. Management continually evaluates its judgements and estimates in relation to assets, liabilities, contingent liabilities, revenue and expenses. Management bases its judgements, estimates and assumptions on historical experience and on other various factors, including expectations of future events, management believes to be reasonable under the circumstances. The resulting accounting judgements and estimates will seldom equal the related actual results. The judgements, estimates and assumptions that have a significant risk of causing a material adjustment to the carrying amounts of assets and liabilities (refer to the respective notes) within the next financial year are discussed below.
Revenue recognitionRevenue is recognised in accordance with the policy set out in Note 5.
ImpairmentThe recoverable amounts of Vocus cash-generating units (CGU’S) have been determined based on a value-in-use basis (being higher than fair value less cost to sell).The assessment of the recoverable amount requires the exercise of significant judgement about future market conditions, including growth rates and discount rates, as well as the impact of changing technologies and consumer preferences. Further details of the key judgements and estimates are set out in Note 14.
NOTE 4. OPERATING SEGMENTS
Reporting segmentsSegment information is based on the information that management uses to make decisions about operating matters and allows users to review operations through the eyes of management. Operating segments represent the information reported to the chief operating decision makers (CODM), being the executive management team, for the purposes of resource allocation and assessment of segment performance.
During the second half of financial year 2019, the Business segment and Consumer segment were merged into the Retail Segment. Consequently, the external reporting segments have changed to present Consumer and Business as the Retail segment and thus more accurately reflecting how the Group is currently managed. Comparative balances have been restated to reflect the updated reporting structure. The operating segments were also renamed during the year, the four operating segments are; Vocus Networks – Services (formerly Enterprise, Government & Wholesale), Retail (formerly Consumer and Business), New Zealand and Infrastructure, Operations and Corporate (formerly Group Services).
NOTES TO THE FINANCIAL STATEMENTS
53
For
per
sona
l use
onl
y

NOTES TO THE FINANCIAL STATEMENTS (CONTINUED)
NOTE 4. OPERATING SEGMENTS (CONTINUED)The directors of Vocus have chosen to organise the Group around the four main divisions in which the Group operates.
Specifically, the Group’s reportable segments under AASB 8 are as follows:
|| Vocus Network – Services
|| Retail
|| New Zealand
|| Infrastructure, Operations and Corporate
The reportable segments represent the group’s cash-generating units for impairment testing purposes, except for Corporate which is allocated to the three cash-generating units.
The prior year reporting segment information has been restated below in line with current year segments. Consistent with information presented for internal management reporting purposes, segment performance is measured by EBITDA contribution.
Major customersDuring the year ended 30 June 2019 there were no customers of Vocus which contributed 10% or more of external revenue (2018: nil).
Segment revenues and results
Consolidated – 2019
Vocus Network Services
$’000Retail $’000
New Zealand $’000
Infrastructure, Operations
& Corporate $’000
Total $’000
Revenue
Sales to external customers 709,990 826,080 356,226 – 1,892,296
Total revenue 709,990 826,080 356,226 – 1,892,296
EBITDA 362,064 159,895 59,061 (231,913) 349,107
Depreciation and amortisation (243,357)
Net finance costs (53,052)
Profit before income tax expense 52,698
Income tax expense (18,689)
Profit after income tax expense 34,009
Consolidated – 2018
Vocus Network Services
$’000Retail $’000
New Zealand $’000
Infrastructure, Operations
& Corporate $’000
Total $’000
Revenue
Sales to external customers 575,799 973,895 335,049 – 1,884,743
Total revenue 575,799 973,895 335,049 – 1,884,743
EBITDA 344,662 171,200 56,567 (212,013) 360,416
Depreciation and amortisation (229,608)
Net finance costs (40,978)
Profit before income tax expense 89,830
Income tax expense (28,785)
Profit after income tax expense 61,045
54
VOCUS GROUP Annual Report 2019
For
per
sona
l use
onl
y
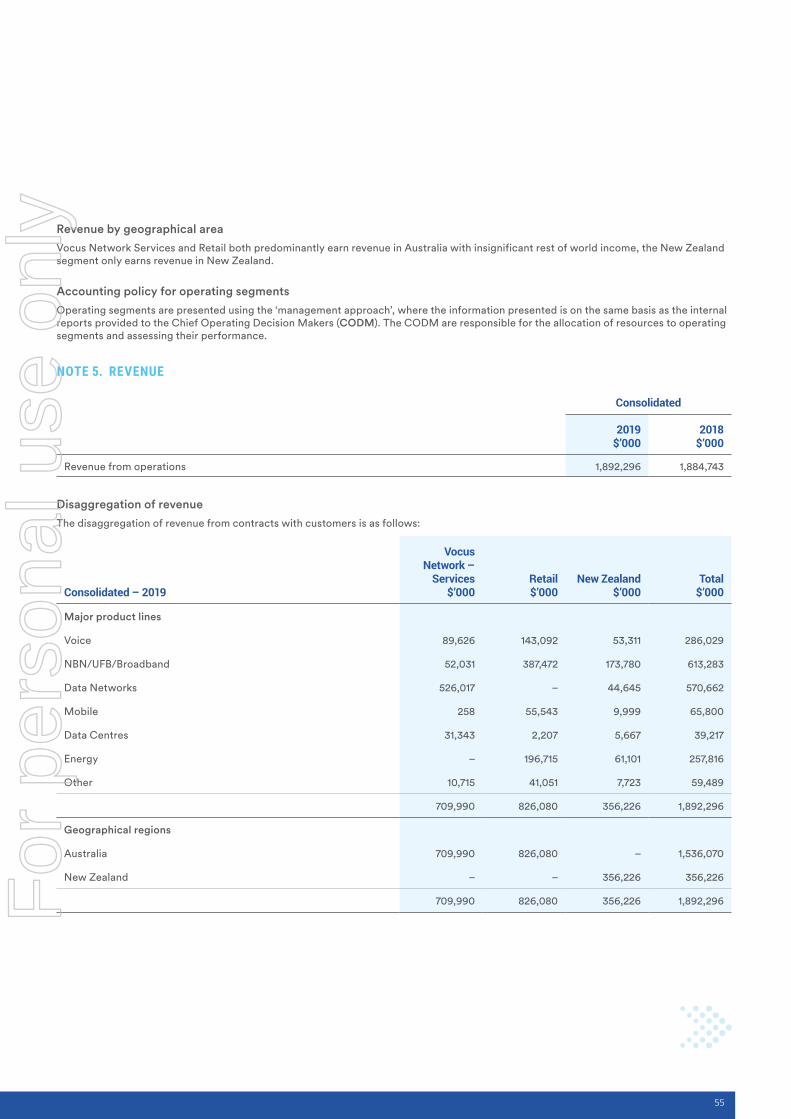
Revenue by geographical areaVocus Network Services and Retail both predominantly earn revenue in Australia with insignificant rest of world income, the New Zealand segment only earns revenue in New Zealand.
Accounting policy for operating segmentsOperating segments are presented using the ‘management approach’, where the information presented is on the same basis as the internal reports provided to the Chief Operating Decision Makers (CODM). The CODM are responsible for the allocation of resources to operating segments and assessing their performance.
NOTE 5. REVENUE
Consolidated
2019 $’000
2018 $’000
Revenue from operations 1,892,296 1,884,743
Disaggregation of revenueThe disaggregation of revenue from contracts with customers is as follows:
Consolidated – 2019
Vocus Network –
Services $’000
Retail $’000
New Zealand $’000
Total $’000
Major product lines
Voice 89,626 143,092 53,311 286,029
NBN/UFB/Broadband 52,031 387,472 173,780 613,283
Data Networks 526,017 – 44,645 570,662
Mobile 258 55,543 9,999 65,800
Data Centres 31,343 2,207 5,667 39,217
Energy – 196,715 61,101 257,816
Other 10,715 41,051 7,723 59,489
709,990 826,080 356,226 1,892,296
Geographical regions
Australia 709,990 826,080 – 1,536,070
New Zealand – – 356,226 356,226
709,990 826,080 356,226 1,892,296
55
For
per
sona
l use
onl
y

NOTES TO THE FINANCIAL STATEMENTS (CONTINUED)
NOTE 5. REVENUE (CONTINUED)
Consolidated – 2018
Vocus Network –
Services $’000
Retail $’000
New Zealand $’000
Total $’000
Major product lines
Voice 92,765 208,782 52,295 353,842
NBN/UFB/Broadband 28,113 409,532 187,333 624,978
Data Networks 408,556 – 36,295 444,851
Mobile 458 58,044 10,156 68,658
Data Centres 34,092 2,998 5,630 42,720
Energy – 231,993 38,944 270,937
Other 11,815 62,544 4,398 78,757
575,799 973,893 335,051 1,884,743
Geographical regions
Australia 575,799 973,893 – 1,549,692
New Zealand – – 335,051 335,051
575,799 973,893 335,051 1,884,743
Deferred revenueSet out below are summaries of the deferred revenue movements for the year:
Consolidated
2019 $’000
2018 $’000
Current deferred revenue:
Opening balance 52,240 62,337
Additions 237,894 255,538
Transfer from non-current 14,334 9,198
Unwind (244,458) (274,833)
60,010 52,240
Consolidated
2019 $’000
2018 $’000
Non-current deferred revenue:
Opening balance 159,926 169,124
Additions 25,316 –
Transfers to current (14,334) (9,198)
170,908 159,926
56
VOCUS GROUP Annual Report 2019
For
per
sona
l use
onl
y

Accounting policy for revenue recognitionAASB 15 establishes a comprehensive framework for determining the quantum and timing of revenue recognition.
The Group has adopted AASB 15 using the Modified approach with changes reflected in the current period only, comparative figures have not been restated. The implementation of AASB 15 resulted in no material impact on the Group’s statement of profit or loss, statement of other comprehensive income and statement of cash flows. However, a review of deferred subscriber acquisition and hardware costs resulted in the derecognition of $34.8m, net of tax, to contract cost assets and retained earnings.
The details of the new significant accounting policies and the nature of the changes to previous accounting policies in relation to the Group’s various goods and services are set out below.
Revenue is recognized at an amount that reflects the consideration to which the Group expects to be entitled in exchange for transferring products or services to a customer. The Group recognizes revenue when it transfers control over a product or service to a customer. Where services have been billed in advance and the performance obligations to transfer the services to the customer have not been satisfied, the consideration received will be recognized as a liability until such time when or as those performance obligations are met and revenue is recognized.
The Group’s customer contracts may include multiple performance obligations (bundled products) over a long period. In these cases, the Group allocated the transaction price to each performance obligation based on the relative stand-alone selling prices of each distinct service. Stand-alone selling prices are determined based on prices charged to customers for individual products and services taking into consideration the size and length of contracts and Group’s overall go to market strategy.
The Group applies the practical expedient in that it does not adjust the promised amount of consideration for the effects of a significant financing component if it expects, at contract inception, that the period between the transfer of the promised good or service to the customer and when the customer pays for that good or service will be one year or less.
In the comparative period, revenue was measured at the fair value of the consideration received or receivable. There were no significant impacts on the timing or measurement of revenue on adoption of AASB 15.
The Group has identified the following main revenue categories by segment:
Fibre/Ethernet/Internet, Voice, Mobile and Other (Segment: Vocus Network Services, Retail and New Zealand)Revenue is recognised by providing Fibre, Ethernet and Internet services over a contracted period. Consideration is recorded and deferred when it is received which is typically at the time of entering the contract and revenue is recognised over the time the customer receives and consumes the benefits of the service provided. The measurement of progress in satisfying this performance obligation is based on the passage of time. The amount of revenue recognised is based on the amount of the transaction price allocated to this performance obligation.
Data Centre (Segment: Vocus Network Services and New Zealand)Revenue is recognised by providing Data Centre services over a contracted period. Revenue is recognised over the time the customer receives and consumes the benefits of the service provided. The measurement of progress in satisfying this performance obligation is based on the passage of time. The amount of revenue recognised is based on the amount of the transaction price allocated to this performance obligation.
Energy (Segment: Retail)Revenue is recognised by providing Energy (electricity and gas) services over a contracted period. Revenue is recognised once the electricity and/or gas is delivered to the customer and they consume the benefits. The electricity and/or gas delivered is measured through regular review of usage meters as well as management estimates between the last billing period and the end of the reporting period. The amount of revenue recognised is based on the amount of the transaction price allocated to this performance obligation.
57
For
per
sona
l use
onl
y
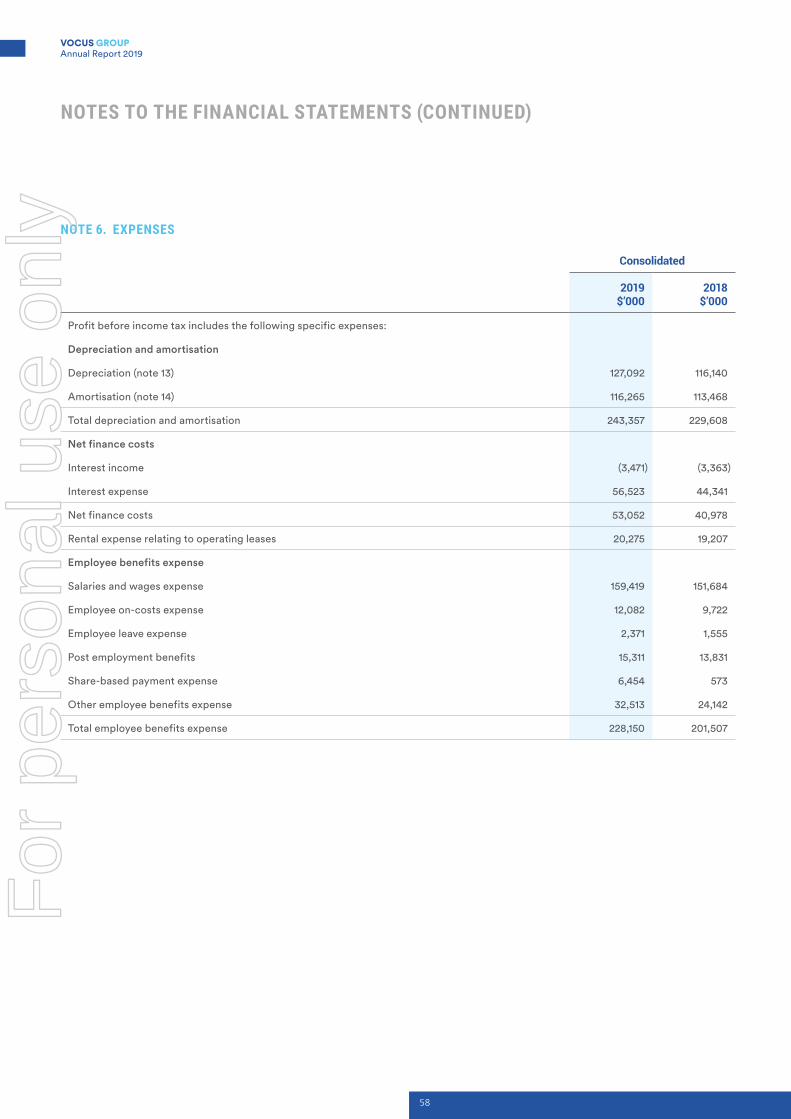
NOTES TO THE FINANCIAL STATEMENTS (CONTINUED)
NOTE 6. EXPENSES
Consolidated
2019 $’000
2018 $’000
Profit before income tax includes the following specific expenses:
Depreciation and amortisation
Depreciation (note 13) 127,092 116,140
Amortisation (note 14) 116,265 113,468
Total depreciation and amortisation 243,357 229,608
Net finance costs
Interest income (3,471) (3,363)
Interest expense 56,523 44,341
Net finance costs 53,052 40,978
Rental expense relating to operating leases 20,275 19,207
Employee benefits expense
Salaries and wages expense 159,419 151,684
Employee on-costs expense 12,082 9,722
Employee leave expense 2,371 1,555
Post employment benefits 15,311 13,831
Share-based payment expense 6,454 573
Other employee benefits expense 32,513 24,142
Total employee benefits expense 228,150 201,507
58
VOCUS GROUP Annual Report 2019
For
per
sona
l use
onl
y

NOTE 7. INCOME TAX EXPENSE
Consolidated
2019 $’000
2018 $’000
Income tax expense
Current tax 22,504 32,644
Deferred tax – origination and reversal of temporary differences (4,007) (4,721)
Adjustment recognised for prior periods 192 862
Aggregate income tax expense 18,689 28,785
Deferred tax included in income tax expense comprises:
Decrease in deferred tax assets (note 8) 6,577 14,595
Decrease in deferred tax liabilities (note 9) (10,584) (19,316)
Deferred tax – origination and reversal of temporary differences (4,007) (4,721)
Numerical reconciliation of income tax expense and tax at the statutory rate
Profit before income tax expense 52,698 89,830
Tax at the statutory tax rate of 30% 15,809 26,949
Tax effect amounts which are not deductible/(taxable) in calculating taxable income:
Entertainment expenses 384 369
Share-based payments 1,937 172
Transaction costs 79 378
Sundry items 839 580
19,048 28,448
Adjustment recognised for prior periods 192 862
Difference in overseas tax rates (551) (525)
Income tax expense 18,689 28,785
Consolidated
2019 $’000
2018 $’000
Amounts charged/(credited) directly to other comprehensive income:
Deferred tax assets (note 8) (2,984) (1,279)
Deferred tax liabilities (note 9) (12,092) 2,536
(15,076) 1,257
59
For
per
sona
l use
onl
y

NOTES TO THE FINANCIAL STATEMENTS (CONTINUED)
NOTE 7. INCOME TAX EXPENSE (CONTINUED)
Accounting policy for taxIncome tax for the period is the tax payable on that period’s taxable income based on the applicable income tax rate for each jurisdiction, adjusted by changes in deferred tax attributable to temporary differences, unused tax losses and the adjustment recognised for prior periods, where applicable.
Deferred taxDeferred tax assets and liabilities are recognised for temporary differences at the tax rates expected to apply when the assets are recovered or liabilities are settled, except for (i) when the deferred tax asset or liability arises from the initial recognition of goodwill or an asset or liability in a transaction that is not a business combination and that, at the time of the transaction, affects neither the accounting nor taxable profits; or (ii) when the taxable temporary difference is associated with interests in subsidiaries, associates or joint ventures, and the timing of the reversal can be controlled and it is probable that the temporary difference will not reverse in the foreseeable future.
Deferred tax assets are recognised for deductible temporary differences and unused tax losses only if it is probable that future taxable amounts will be available to utilise those temporary differences and losses. The carrying amount of recognised and unrecognised deferred tax assets are reviewed each reporting date. Deferred tax assets recognised are reduced to the extent that it is no longer probable that future taxable profits will be available for the carrying amount to be recovered. Previously unrecognised deferred tax assets are recognised to the extent that it is probable that there are future taxable profits available to recover the asset.
Deferred tax assets and liabilities are offset only where there is a legally enforceable right to offset and they relate to the same taxable authority on either the same taxable entity or different taxable entities which intend to settle simultaneously.
Tax consolidation legislationVocus Group Limited and its 100% owned Australian subsidiaries formed a tax consolidated group with effect from 14 September 2010. Vocus Group Limited is the head entity of the tax consolidated group. Members of Vocus have entered into a tax sharing agreement that provides for the allocation of income tax liabilities between the entities should the head entity default on its tax payment obligations. No amounts have been recognised in the financial statements in respect of this agreement on the basis that the possibility of default is remote.
Tax effect accounting by members of the tax consolidated groupMeasurement method adopted under AASB Interpretation 1052 Tax Consolidated Accounting.
The head entity and the controlled entities in the tax consolidated group continue to account for their own current and deferred tax amounts. Vocus has applied the stand-alone taxpayer approach in determining the appropriate amount of current taxes and deferred taxes to allocate to members of the tax consolidated group. The current and deferred tax amounts are measured in a systematic manner that is consistent with the broad principles in AASB 112 Income Taxes. The nature of the tax funding agreement is discussed further below.
In addition to its current and deferred tax amounts, the head entity also recognises current tax liabilities (or assets) and the deferred tax assets arising from unused tax losses and unused tax credits assumed from controlled entities in the tax consolidated group.
Nature of the tax funding agreementMembers of the tax consolidated group have entered into a tax funding agreement. The tax funding agreement requires payments to/from the head entity to be recognised via an inter-entity receivable/(payable) which is at call. To the extent that there is a difference between the amount charged under the tax funding agreement and the allocation under AASB Interpretation 1052, the head entity accounts for these as equity transactions with the subsidiaries.
60
VOCUS GROUP Annual Report 2019
For
per
sona
l use
onl
y

NOTE 8. NON-CURRENT ASSETS – DEFERRED TAX
Consolidated
2019 $’000
2018 $’000
Deferred tax asset comprises temporary differences attributable to:
Carry forward capital losses 59 37
Carry forward tax losses 13 –
Receivables 8,903 7,358
Property, plant and equipment 830 395
Accruals and provisions 23,911 24,385
Derivatives – 1,614
Expenses deductible over five years 4,246 7,953
Unearned income 6,874 6,687
Deferred tax asset 44,836 48,429
Movements:
Opening balance 48,429 61,745
Charged to profit or loss (note 7) (6,577) (14,595)
Credited to equity (note 7) 2,984 1,279
Closing balance 44,836 48,429
NOTE 9. NON-CURRENT LIABILITIES – DEFERRED TAX
Consolidated
2019 $’000
2018 $’000
Deferred tax liability comprises temporary differences attributable to:
Property, plant and equipment 30,264 24,251
Intangibles 104,901 123,492
Contract costs asset 8,459 20,830
Derivatives 2,336 3,267
Other 3,214 10
Deferred tax liability 149,174 171,850
Movements:
Opening balance 171,850 194,534
Credited to profit or loss (note 7) (10,584) (19,316)
Charged/(credited) to equity (note 7) (12,092) 2,536
Additions through business combinations – (5,904)
Closing balance 149,174 171,850
61
For
per
sona
l use
onl
y

NOTES TO THE FINANCIAL STATEMENTS (CONTINUED)
NOTE 10. EARNINGS PER SHARE
Consolidated
2019 $’000
2018 $’000
Profit after income tax attributable to the owners of Vocus Group Limited 34,009 61,045
Number Number
Weighted average number of ordinary shares used in calculating basic earnings per share 622,240,121 622,220,628
Adjustments for calculation of diluted earnings per share:
Options 7,142,022 –
Performance rights 664,077 1,416,433
Weighted average number of ordinary shares used in calculating diluted earnings per share 630,046,220 623,637,061
Cents Cents
Basic earnings per share 5.47 9.81
Diluted earnings per share 5.40 9.79
Accounting policy for earnings per share
Basic earnings per shareBasic earnings per share is calculated by dividing the profit attributable to the owners of Vocus Group Limited, excluding any costs of servicing equity other than ordinary shares, by the weighted average number of ordinary shares outstanding during the financial year, adjusted for bonus elements in ordinary shares issued during the financial year.
Diluted earnings per shareDiluted earnings per share adjusts the figures used in the determination of basic earnings per share to take into account dilutive potential ordinary shares and the weighted average number of shares assumed to have been issued for no consideration in relation to dilutive potential ordinary shares.
NOTE 11. EQUITY – DIVIDENDS
DividendsNo dividends were recommended, declared or paid during FY19. As disclosed to the ASX on 25 June 2018, Vocus closed a new and increased syndicated debt facility with its lenders. The Syndicated Facility Agreement stipulates that dividends will not be paid until the Net Leverage Ratio is below 2.25x for two consecutive testing dates.
62
VOCUS GROUP Annual Report 2019
For
per
sona
l use
onl
y

Franking credits
Consolidated
2019 $’000
2018 $’000
Franking credits available at the reporting date based on a tax rate of 30% 70,115 46,760
Franking credits that will arise from the payment of the amount of the June income tax payment made in July at the reporting date based on a tax rate of 30% 2,114 3,861
Net franking credits available based on a tax rate of 30% 72,229 50,621
Consolidated
2019 $’000
2018 $’000
Franking credits available for subsequent financial years based on a tax rate of 30% 72,229 50,621
The above amounts represent the balance of the franking account as at the end of the financial year, adjusted for:
|| franking credits that will arise from the payment of the amount of the provision for income tax at the reporting date
|| franking debits that will arise from the payment of dividends recognised as a liability at the reporting date
|| franking credits that will arise from the receipt of dividends recognised as receivables at the reporting date
Accounting policy for dividendsDividends are recognised when declared during the financial year.
NOTE 12. CURRENT ASSETS – TRADE AND OTHER RECEIVABLES
Consolidated
2019 $’000
2018 $’000
Trade receivables 142,318 159,069
Accrued revenue 39,659 35,749
Less: Allowance for expected credit losses (30,019) (24,879)
151,958 169,939
Other receivables 662 2,036
152,620 171,975
Impairment of receivablesAn expense of $21,152,628 (2018: $23,593,636) has been recognised in profit or loss in respect of impairment of receivables for the year ended 30 June 2019.
Vocus applies the AASB 9 simplified approach to measure expected credit loss (ECL) which uses a lifetime expected loss allowance for all trade receivables and contract assets.
To measure the ECL, trade receivables and accrued revenue have been grouped based on shared credit risk characteristics and the days past due. This is further split into Vocus Networks – Services, Retail and New Zealand. The accrued revenue relates to unbilled work in progress and have substantially the same risk characteristics as the trade receivables for the same types of contracts.
63
For
per
sona
l use
onl
y
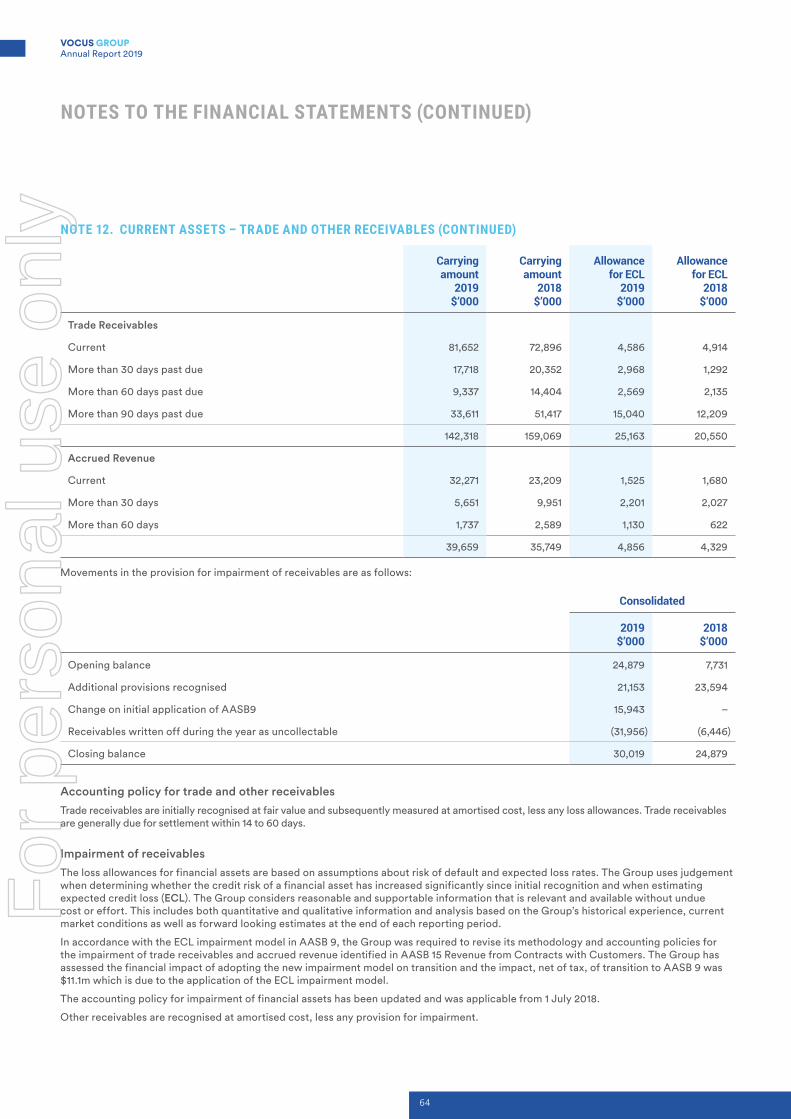
NOTES TO THE FINANCIAL STATEMENTS (CONTINUED)
NOTE 12. CURRENT ASSETS – TRADE AND OTHER RECEIVABLES (CONTINUED)
Carrying amount
2019 $’000
Carrying amount
2018 $’000
Allowance for ECL
2019 $’000
Allowance for ECL
2018 $’000
Trade Receivables
Current 81,652 72,896 4,586 4,914
More than 30 days past due 17,718 20,352 2,968 1,292
More than 60 days past due 9,337 14,404 2,569 2,135
More than 90 days past due 33,611 51,417 15,040 12,209
142,318 159,069 25,163 20,550
Accrued Revenue
Current 32,271 23,209 1,525 1,680
More than 30 days 5,651 9,951 2,201 2,027
More than 60 days 1,737 2,589 1,130 622
39,659 35,749 4,856 4,329
Movements in the provision for impairment of receivables are as follows:
Consolidated
2019 $’000
2018 $’000
Opening balance 24,879 7,731
Additional provisions recognised 21,153 23,594
Change on initial application of AASB9 15,943 –
Receivables written off during the year as uncollectable (31,956) (6,446)
Closing balance 30,019 24,879
Accounting policy for trade and other receivablesTrade receivables are initially recognised at fair value and subsequently measured at amortised cost, less any loss allowances. Trade receivables are generally due for settlement within 14 to 60 days.
Impairment of receivables The loss allowances for financial assets are based on assumptions about risk of default and expected loss rates. The Group uses judgement when determining whether the credit risk of a financial asset has increased significantly since initial recognition and when estimating expected credit loss (ECL). The Group considers reasonable and supportable information that is relevant and available without undue cost or effort. This includes both quantitative and qualitative information and analysis based on the Group’s historical experience, current market conditions as well as forward looking estimates at the end of each reporting period.
In accordance with the ECL impairment model in AASB 9, the Group was required to revise its methodology and accounting policies for the impairment of trade receivables and accrued revenue identified in AASB 15 Revenue from Contracts with Customers. The Group has assessed the financial impact of adopting the new impairment model on transition and the impact, net of tax, of transition to AASB 9 was $11.1m which is due to the application of the ECL impairment model.
The accounting policy for impairment of financial assets has been updated and was applicable from 1 July 2018.
Other receivables are recognised at amortised cost, less any provision for impairment.
64
VOCUS GROUP Annual Report 2019
For
per
sona
l use
onl
y

NOTE 13. NON-CURRENT ASSETS – PLANT AND EQUIPMENT
Consolidated
2019 $’000
2018 $’000
Fibre assets – at cost 1,626,892 1,435,127
Less: Accumulated depreciation (221,824) (175,876)
1,405,068 1,259,251
Data centre assets – at cost 67,779 68,574
Less: Accumulated depreciation (29,707) (26,125)
38,072 42,449
Network equipment – at cost 379,881 230,965
Less: Accumulated depreciation (157,799) (91,306)
222,082 139,659
Other plant and equipment – at cost 64,654 70,983
Less: Accumulated depreciation (30,383) (23,181)
34,271 47,802
Capital work in progress 68,781 183,563
1,768,274 1,672,724
ReconciliationsReconciliations of the written down values at the beginning and end of the current and previous financial year are set out below:
Consolidated
Fibre assets $’000
Data centre assets $’000
Network equipment
$’000
Other plant and
equipment $’000
Capital WIP
$’000Total
$’000
Balance at 1 July 2017 1,243,041 48,427 129,047 68,261 54,203 1,542,979
Additions 77,250 2,009 48,844 14,083 112,338 254,524
Exchange differences (3,562) (670) (823) 249 1,929 (2,877)
Write off of assets (3,223) (1,225) (1,314) – – (5,762)
Transfers in/(out) 457 1 163 (15,714) 15,093 –
Depreciation expense (54,712) (6,093) (36,258) (19,077) – (116,140)
Balance at 30 June 2018 1,259,251 42,449 139,659 47,802 183,563 1,672,724
Additions 77 101 5,994 1,680 202,903 210,755
Transfers 270,336 1,477 52,143 3,551 (327,507) –
Reclassifications (75,404) 162 82,326 (4,449) 1,294 3,929
Exchange differences 4,821 140 1,044 (455) 8,528 14,078
Write off of assets (2,521) (1,386) (2,159) (54) – (6,120)
Depreciation expense (51,492) (4,871) (56,925) (13,804) – (127,092)
Balance at 30 June 2019 1,405,068 38,072 222,082 34,271 68,781 1,768,274
No impairment indicators are present relating to the carrying value of plant and equipment and network equipment.
65
For
per
sona
l use
onl
y

NOTES TO THE FINANCIAL STATEMENTS (CONTINUED)
NOTE 13. NON-CURRENT ASSETS – PLANT AND EQUIPMENT (CONTINUED)
Accounting policy for property, plant and equipmentPlant and equipment is stated at historical cost less accumulated depreciation and impairment. Historical cost includes expenditure that is directly attributable to the acquisition of the items.
Depreciation is calculated on a straight-line basis to write off the net cost of each item of property, plant and equipment over their expected useful lives as follows:
Fibre and duct 10-50 years
Data centre 5-15 years
Network equipment 5-8 years
Plant and equipment 3-15 years
The residual values, useful lives and depreciation methods are reviewed, and adjusted if appropriate, at each reporting date.
Leasehold improvements and plant and equipment under lease are depreciated over the unexpired period of the lease or the estimated useful life of the assets, whichever is shorter.
An item of property, plant and equipment is derecognised upon disposal or when there is no future economic benefit. Gains and losses between the carrying amount and the disposal proceeds are taken to profit or loss.
NOTE 14. NON-CURRENT ASSETS – INTANGIBLES
Consolidated
2019 $’000
2018 $’000
Goodwill 1,466,265 1,453,584
IRU capacity – at cost 188,089 182,732
Less: Accumulated amortisation (67,195) (53,343)
120,894 129,389
Customer intangibles – at cost 381,061 381,033
Less: Accumulated amortisation (211,890) (149,894)
169,171 231,139
Software – at cost 211,977 192,822
Less: Accumulated amortisation (122,235) (80,788)
89,742 112,034
Brands – at cost 180,500 180,500
Other intangibles – at cost 2,048 1,958
Less: Accumulated amortisation (325) (153)
1,723 1,805
Capital work in progress 15,868 –
2,044,163 2,108,451
66
VOCUS GROUP Annual Report 2019
For
per
sona
l use
onl
y

ReconciliationsReconciliations of the written down values at the beginning and end of the current and previous financial year are set out below:
ConsolidatedGoodwill
$’000
IRU capacity
$’000
Customer intangibles
$’000Software
$’000
Brands & other
intangibles $’000
Capital WIP
$’000Total
$’000
Balance at 1 July 2017 1,475,096 143,740 293,141 117,741 182,392 – 2,212,110
Additions – – – 31,295 – – 31,295
Adjustments to provisional business combinations (17,967) – – – – – (17,967)
Disposal – – – (61) (37) – (98)
Exchange differences (3,545) – – (652) 776 – (3,421)
Amortisation expense – (14,351) (62,002) (36,289) (826) – (113,468)
Balance at 30 June 2018 1,453,584 129,389 231,139 112,034 182,305 – 2,108,451
Additions – 5,229 – 4,459 20 37,429 47,137
Transfers – 22 – 17,970 103 (18,095) –
Reclassifications – (36) – 621 – (4,514) (3,929)
Exchange differences 12,681 104 – (4,652) – 1,048 9,181
Write off of assets – – – (412) – – (412)
Amortisation expense – (13,814) (61,968) (40,278) (205) – (116,265)
Balance at 30 June 2019 1,466,265 120,894 169,171 89,742 182,223 15,868 2,044,163
Consolidated
2019 $’000
2018 $’000
Allocation of goodwill and brands
Goodwill and Brands have been allocated for impairment testing purposes to the following cash-generating units:
Retail
Vocus Network – Services
New Zealand
The carrying amount of goodwill allocated to each cash-generating unit was:
Retail 347,306 192,538
Vocus Network – Services 780,779 935,545
New Zealand 338,180 325,501
The carrying amount of brands allocated to each cash-generating unit was:
Retail 153,000 153,000
New Zealand 27,500 27,500
1,646,765 1,634,084
67
For
per
sona
l use
onl
y

NOTES TO THE FINANCIAL STATEMENTS (CONTINUED)
NOTE 14. NON-CURRENT ASSETS – INTANGIBLES (CONTINUED)
Impairment testingIn accordance with the Group’s accounting policy, impairment testing has been undertaken at 30 June 2019 for all groups of cash generating units (CGUs) with indefinite life intangible assets or where there is an indication of impairment. The Group considered the relationship between its market capitalisation and the book value of its equity, among other factors, when reviewing for indicators of impairment.
For the purpose of impairment testing, assets are grouped at the lowest levels for which there are separately identifiable cash flows, known as cash-generating units. If the recoverable amount of the cash-generating unit is less than the carrying amount of the unit, the impairment loss is allocated first to reduce the carrying amount of any goodwill allocated to the unit and then to the other assets of the unit pro-rata on the basis of the carrying amount of each asset in the unit. Impairment losses recognised for goodwill are not reversible in subsequent periods.
The recoverable amount is the higher of fair value less costs to sell and value in use. In assessing value in use, the estimated future cash flows are discounted to their present value using a discount rate that reflects current market assessments of the time value of money and the risks specific to the asset for which the estimates of future cash flows have not been adjusted.
The Value in Use models are based on the Management and Board approved five year cashflow forecasts. The five year forecasts use Management estimates to determine income, expenses, capital expenditure and cashflows for each CGU. In determining the forecasts Management developed a view on the future increases in customer numbers, market share and the mix of the groups product offerings as well as margin per customer as well as the capital and operational expenditure requirements. These determinations were based on past experience and expectations of the future.
Key assumptions used in the value in use estimation of the recoverable amount during the testing for impairment of the Retail, Vocus Network – Services and New Zealand CGUs are set out below (consistent with prior year).
Retail %
Vocus Network –
Services %
New Zealand
%
Discount rate (post tax) 9.5% 10.0% 10.2%
Terminal value growth rate 2.5% 2.5% 2.5%
The discount rates reflect the market determined risk adjusted rates for specific risks relating to each CGU and the markets in which they operate.
The terminal value growth rate represents the growth rate applied to extrapolate cash flows beyond the five year period. These growth rates are based on Vocus expectation of long term performance of the CGU’s.
Other key assumptions used in the calculations are:
|| Board approved five year cashflow forecasts.
|| Board approved five year forecasts for capital expenditure.
The five year cashflow and capital expenditure forecasts use Management estimates to determine revenue, expenses, EBITDA, capital expenditure and cashflows for each CGU. It should be noted that the revenue profile is above industry average which aligns with Vocus’s overall strategy. In determining the forecasts Management developed a view on the future increases in customer numbers, market share and the mix of the groups product offerings as well as margin per customer as well as the capital and operational expenditure requirements. These determinations were based on past experience and expectations of the future.
Each of the above factors is subject to significant judgement about future economic conditions and the ongoing structure of the telecommunications industry. Management have applied their best estimates to each of the variables and cannot warrant their outcome.
The result of those impairment tests was that there was no impairment identified for the Retail, Vocus Network – Services and New Zealand CGUs at 30 June 2019 (2018: nil).
Sensitivity analysisThe estimated recoverable amount for the Retail, Vocus Network – Services and New Zealand CGU exceeded its carrying amount. Management has identified that a reasonable possible change in three key assumptions could cause the carrying amount to exceed the recoverable amount.
Due to the interrelated nature of the assumptions, movements in any one variable can have an indirect impact on others and individual variables rarely change in isolation. Additionally, Management can be expected to respond to some movements, to mitigate downsides and take advantage of upsides, as circumstances allow. Consequently, it is impracticable to estimate the indirect impact that a change in one assumption has on other variables and hence, on the likelihood, or extent, of impairments, or reversals of impairments, under different sets of assumptions in subsequent reporting periods.
The following table shows the amount by which these three assumptions would need to change individually for the estimated recoverable amount to be equal to the carrying amount.
Retail %
Vocus Network –
Services %
New Zealand
%
Change required for carrying amount to equal recoverable amount
Discount rate (post tax) 1.6 1.3 0.5
Terminal value growth rate 2.1 1.7 0.6
Decrease in CAGR% – EBITDA 4.3 3.0 1.1
68
VOCUS GROUP Annual Report 2019
For
per
sona
l use
onl
y

Accounting policy for intangible assetsIntangible assets acquired as part of a business combination, other than goodwill, are initially measured at their fair value at the date of the acquisition. Intangible assets acquired separately are initially recognised at cost. Indefinite life intangible assets are not amortised and are subsequently measured at cost less any impairment. Finite life intangible assets are subsequently measured at cost less amortisation and any impairment. The gains or losses recognised in profit or loss arising from the derecognition of intangible assets are measured as the difference between net disposal proceeds and the carrying amount of the intangible asset. The method and useful lives of finite life intangible assets are reviewed annually. Changes in the expected pattern of consumption or useful life are accounted for prospectively by changing the amortisation method or period.
GoodwillGoodwill arises on the acquisition of a business. Goodwill is not amortised. Instead, goodwill is tested annually for impairment, or more frequently if events or changes in circumstances indicate that it might be impaired, and is carried at cost less accumulated impairment losses. Impairment losses on goodwill are taken to profit or loss and are not subsequently reversed.
Intellectual propertySignificant costs associated with intellectual property are deferred and amortised on a straight-line basis over the period of their expected benefit, being their finite life of 10 years.
Indefeasible Right to Use (IRU)Indefeasible right to use capacity are brought to account as intangible assets at cost, being the present value of the future cash flows payable for the right. Costs associated with IRU’s are deferred and amortised on a straight-line basis over the period of their expected benefit.
SoftwareCosts associated with software, including those associated with capitalised development costs, are amortised on a straight-line basis over the period of their expected benefit, being its finite life of between 3 to 8 years.
An intangible asset arising from development expenditure on an internal project is recognised only when the Group can demonstrate the technical feasibility of completing the intangible asset so that it will be available for use or sale, its intention to complete and its ability to use or sell the asset, how the asset will generate future economic benefits, the availability of resources to complete the development and the ability to measure reliably the expenditure attributable to the intangible asset during its development. All other research costs are expensed as incurred.
Following the initial recognition of the development expenditure, the cost model is applied requiring the asset to be carried at cost less any accumulated amortisation and accumulated impairment losses. Any expenditure so capitalised is amortised over the period of expected benefit from the related project.
The carrying value of an intangible asset arising from development expenditure is tested for impairment annually when the asset is not yet available for use or more frequently when an indication of impairment arises during the reporting period.
Customer intangiblesCustomer intangibles acquired in a business combination are amortised on a straight-line basis over the period of their expected benefit, being their expected finite life of between 4 to 15 years.
BrandsBrands have indefinite useful lives. Intangible assets with indefinite useful lives are tested for impairment annually either individually or at cash-generating unit level consistent with the methodology outlined for goodwill above. Such intangibles are not amortised. Assets with indefinite useful lives are reviewed each reporting period to determine whether the indefinite life assessment continues to be supportable. If not, the change in the useful life assessment from indefinite to finite is accounted for as a change in an accounting estimate and is thus accounted for on a prospective basis. Deferred tax liability in relation to brands is based on the expected manner of recovery of the brands rather than the assumption that the asset will be sold.
Other intangiblesOther intangibles are amortised on a straight-line basis over the period of their expected benefit, except in the case of brands, which are not subsequently amortised.
69
For
per
sona
l use
onl
y

NOTES TO THE FINANCIAL STATEMENTS (CONTINUED)
NOTE 15. CURRENT LIABILITIES – TRADE AND OTHER PAYABLES
Consolidated
2019 $’000
2018 $’000
Trade payables 94,206 48,328
Revenue received in advance 11,274 5,368
Accruals 123,860 141,843
Projects under construction accruals – 71,335
Goods and services tax payable 4,617 9,321
Other payables 18,527 19,760
252,484 295,955
Refer to note 26 for further information on financial instruments.
Accounting policy for trade and other payablesThese amounts represent liabilities for goods and services provided prior to the end of the financial year and which are unpaid. Due to their short-term nature they are measured at amortised cost and are not discounted. The amounts are unsecured and are usually paid within 30 days of recognition.
NOTE 16. CURRENT LIABILITIES – BORROWINGS
Consolidated
2019 $’000
2018 $’000
Bank loans 50,000 –
Backhaul IRU liability 5,811 6,766
Lease liability 3,682 4,478
59,493 11,244
Refer to note 17 for further information on assets pledged as security and financing arrangements.
70
VOCUS GROUP Annual Report 2019
For
per
sona
l use
onl
y

NOTE 17. NON-CURRENT LIABILITIES – BORROWINGS
Consolidated
2019 $’000
2018 $’000
Bank loans 1,044,223 1,025,116
Backhaul IRU liability 6,101 11,912
Lease liability 11,813 10,872
1,062,137 1,047,900
Total secured liabilitiesThe total secured liabilities (current and non-current) are as follows:
Consolidated
2019 $’000
2018 $’000
Bank loans 1,094,223 1,025,116
Lease liability 15,495 15,350
1,109,718 1,040,466
Assets pledged as securityThe bank loans are secured via general security deeds over Vocus’ assets and undertakings.
The lease liabilities are effectively secured as the rights to the leased assets, recognised in the statement of financial position, revert to the lessor in the event of default.
Net debtThe table below lists the carrying value of our net debt components:
Consolidated
2019 $’000
2018 $’000
Bank loans 1,094,223 1,025,116
Backhaul IRU liability 11,912 18,678
Lease liability 15,495 15,350
Less: Cash (87,199) (57,914)
1,034,431 1,001,230
71
For
per
sona
l use
onl
y

NOTES TO THE FINANCIAL STATEMENTS (CONTINUED)
NOTE 17. NON-CURRENT LIABILITIES – BORROWINGS (CONTINUED)
Financing arrangementsUnrestricted access was available at the reporting date to the following lines of credit:
Consolidated
2019 $’000
2018 $’000
Total facilities
Bank loans 1,313,486 1,332,074
Bank guarantee/letter of credit facility 95,000 75,000
1,408,486 1,407,074
Used at the reporting date
Bank loans 1,094,223 1,025,116
Bank guarantee/letter of credit facility 71,411 68,900
1,165,634 1,094,016
Unused at the reporting date
Bank loans 219,263 306,958
Bank guarantee/letter of credit facility 23,589 6,100
242,852 313,058
The Group’s bank facilities at 30 June 2019 consists of a $1,408,486,000 senior finance facility (2018: $1,407,074,000), comprising AU$150,000,000 amortising CAPEX facility, AU$75,000,000 bank guarantee/letters of credit facility, AU$1,020,000,000 and NZ$150,000,000 facilities that are non-amortising and can be used for general corporate purposes. Interest on the facility is recognised at the aggregate of the reference bank bill rate plus a margin.
An AU$20,000,000 uncommitted facility bank guarantee/letters of credit facility provided on a bi-lateral basis is also available to the Group.
Accounting policy for borrowingsLoans and borrowings are initially recognised at the fair value of the consideration received, net of transaction costs. They are subsequently measured at amortised cost using the effective interest method.
NOTE 18. CURRENT LIABILITIES – PROVISIONS
Consolidated
2019 $’000
2018 $’000
Employee benefits 21,851 20,006
Deferred consideration 261 14,341
Onerous contracts 4,394 5,138
Make good 832 119
27,338 39,604
72
VOCUS GROUP Annual Report 2019
For
per
sona
l use
onl
y

Deferred considerationDeferred consideration represents the obligation to pay consideration at a later time following the acquisition of a business or assets. Vocus applies provisional accounting for any business combination. Thereafter, at each reporting date, the deferred consideration liability is reassessed against revised estimates and any increase or decrease of the liability will result in a corresponding gain or loss to profit or loss.
Onerous contractsA provision has been made for onerous contracts in which the unavoidable costs of meeting the obligations under the contract exceed the economic benefits expected to be received under it. The provision is calculated based on the lower of the cost of fulfilling the contract and any compensation or penalties arising from failure to fulfil the contract.
Make goodMake good represents the present value of the estimated costs to make good the premises leased by Vocus at the end of the respective lease terms.
Movements in provisionsMovement in provisions, excluding employee benefits, during the current financial year is set out below:
Consolidated – 2019
Employee benefits
$’000
Deferred consideration
$’000
Onerous contracts
$’000
Make good
$’000
Carrying amount at the start of the year 20,006 14,341 5,138 119
Additional provisions recognised 13,328 – – 238
Amounts transferred from non-current 908 – 3,924 587
Amounts paid (12,391) (13,956) (4,668) (112)
Amount transferred to non-current – (124) – –
Carrying amount at the end of the year 21,851 261 4,394 832
Accounting policy for provisionsProvisions are recognised when there is a present (legal or constructive) obligation as a result of a past event, it is probable Vocus will be required to settle the obligation, and a reliable estimate can be made of the amount of the obligation. The amount recognised as a provision is the best estimate of the consideration required to settle the present obligation at the reporting date, taking into account the risks and uncertainties surrounding the obligation. If the time value of money is material, provisions are discounted using a current pre-tax rate specific to the liability. The increase in the provision resulting from the passage of time is recognised as a finance cost.
Accounting policy for employee benefitsLiabilities for wages and salaries, including non-monetary benefits and annual leave where the Group does not have the unconditional right to defer payment for beyond 12 months of the reporting date are recognised in other payables in respect of employees’ services up to the reporting date. They are measured at the amounts expected to be paid when the liabilities are settled. Expenses for sick leave are recognised when the leave is taken and are measured at the rates paid or payable.
The liability for annual leave and long service leave not expected to be settled within 12 months of the reporting date is measured as the present value of expected future payments to be made in respect of services provided by employees up to the reporting date using the projected unit credit method. Consideration is given to expected future wage and salary levels, experience of employee departures and periods of service. Expected future payments are discounted using market yields at the reporting date on corporate bond rates with terms to maturity and currency that match, as closely as possible, the estimated future cash outflows.
73
For
per
sona
l use
onl
y
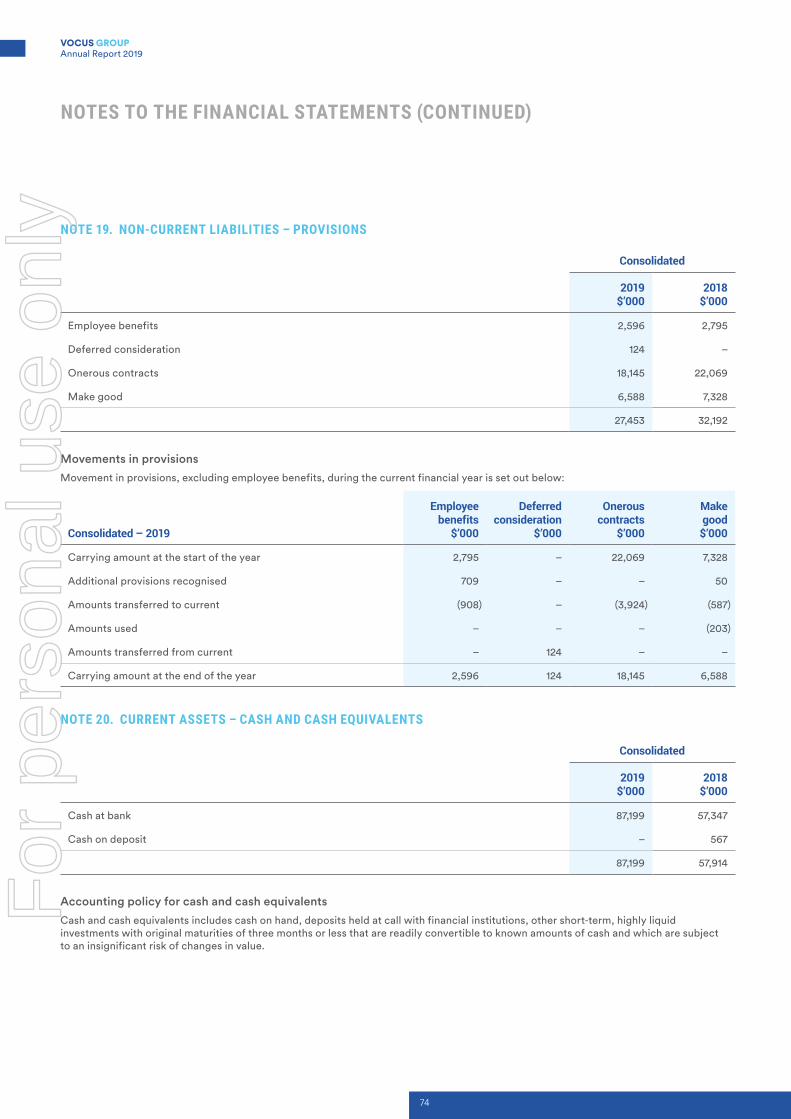
NOTES TO THE FINANCIAL STATEMENTS (CONTINUED)
NOTE 19. NON-CURRENT LIABILITIES – PROVISIONS
Consolidated
2019 $’000
2018 $’000
Employee benefits 2,596 2,795
Deferred consideration 124 –
Onerous contracts 18,145 22,069
Make good 6,588 7,328
27,453 32,192
Movements in provisionsMovement in provisions, excluding employee benefits, during the current financial year is set out below:
Consolidated – 2019
Employee benefits
$’000
Deferred consideration
$’000
Onerous contracts
$’000
Make good
$’000
Carrying amount at the start of the year 2,795 – 22,069 7,328
Additional provisions recognised 709 – – 50
Amounts transferred to current (908) – (3,924) (587)
Amounts used – – – (203)
Amounts transferred from current – 124 – –
Carrying amount at the end of the year 2,596 124 18,145 6,588
NOTE 20. CURRENT ASSETS – CASH AND CASH EQUIVALENTS
Consolidated
2019 $’000
2018 $’000
Cash at bank 87,199 57,347
Cash on deposit – 567
87,199 57,914
Accounting policy for cash and cash equivalentsCash and cash equivalents includes cash on hand, deposits held at call with financial institutions, other short-term, highly liquid investments with original maturities of three months or less that are readily convertible to known amounts of cash and which are subject to an insignificant risk of changes in value.
74
VOCUS GROUP Annual Report 2019
For
per
sona
l use
onl
y
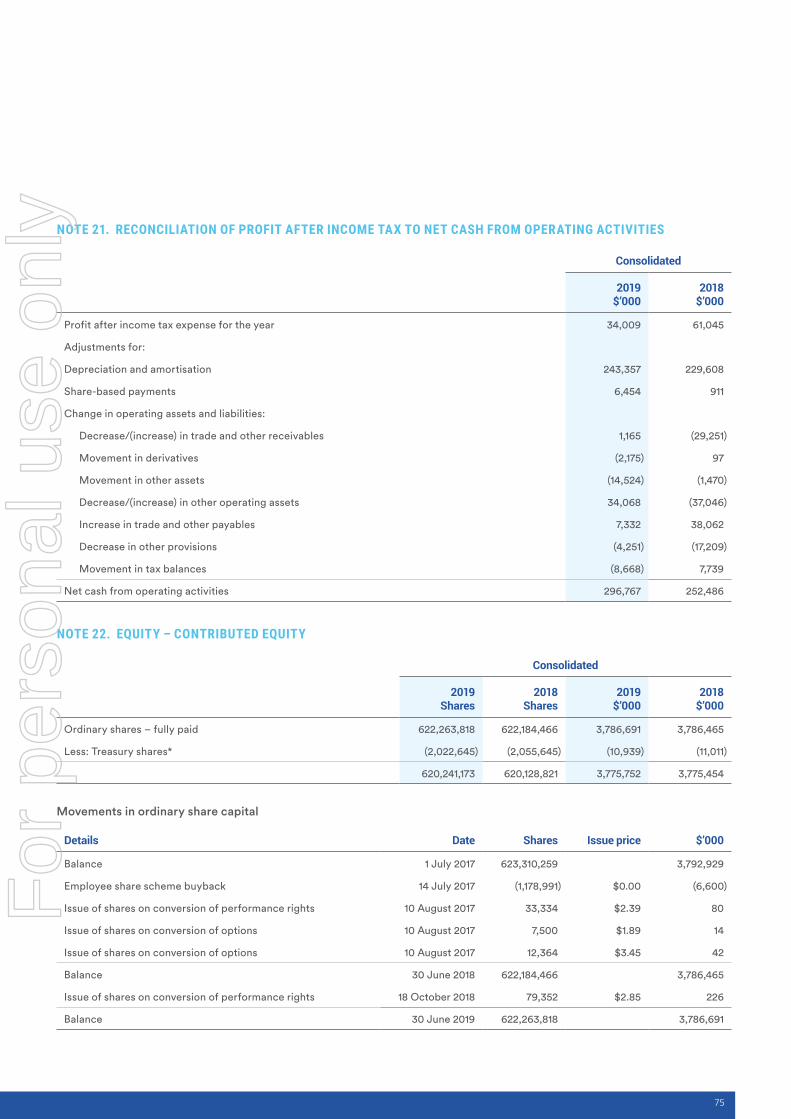
NOTE 21. RECONCILIATION OF PROFIT AFTER INCOME TAX TO NET CASH FROM OPERATING ACTIVITIES
Consolidated
2019 $’000
2018 $’000
Profit after income tax expense for the year 34,009 61,045
Adjustments for:
Depreciation and amortisation 243,357 229,608
Share-based payments 6,454 911
Change in operating assets and liabilities:
Decrease/(increase) in trade and other receivables 1,165 (29,251)
Movement in derivatives (2,175) 97
Movement in other assets (14,524) (1,470)
Decrease/(increase) in other operating assets 34,068 (37,046)
Increase in trade and other payables 7,332 38,062
Decrease in other provisions (4,251) (17,209)
Movement in tax balances (8,668) 7,739
Net cash from operating activities 296,767 252,486
NOTE 22. EQUITY – CONTRIBUTED EQUITY
Consolidated
2019 Shares
2018 Shares
2019 $’000
2018 $’000
Ordinary shares – fully paid 622,263,818 622,184,466 3,786,691 3,786,465
Less: Treasury shares* (2,022,645) (2,055,645) (10,939) (11,011)
620,241,173 620,128,821 3,775,752 3,775,454
Movements in ordinary share capital
Details Date Shares Issue price $’000
Balance 1 July 2017 623,310,259 3,792,929
Employee share scheme buyback 14 July 2017 (1,178,991) $0.00 (6,600)
Issue of shares on conversion of performance rights 10 August 2017 33,334 $2.39 80
Issue of shares on conversion of options 10 August 2017 7,500 $1.89 14
Issue of shares on conversion of options 10 August 2017 12,364 $3.45 42
Balance 30 June 2018 622,184,466 3,786,465
Issue of shares on conversion of performance rights 18 October 2018 79,352 $2.85 226
Balance 30 June 2019 622,263,818 3,786,691
75
For
per
sona
l use
onl
y

NOTES TO THE FINANCIAL STATEMENTS (CONTINUED)
NOTE 22. EQUITY – CONTRIBUTED EQUITY (CONTINUED)
Movements in treasury shares*
Details Date Shares Issue price $’000
Balance 1 July 2017 (3,328,355) (18,095)
Employee share scheme buyback 1,178,991 $0.00 6,600
Transfer of shares to participants** 93,719 $0.00 188
Forfeiture of loan funded share plan – $0.00 296
Balance 30 June 2018 (2,055,645) (11,011)
Transfer of shares to participants 33,000 $0.00 72
Balance 30 June 2019 (2,022,645) (10,939)
* Shares held by Vocus Blue Pty Limited During the financial year ended 30 June 2019 nil shares (2018: nil) were issued to Vocus Blue Pty Limited, a wholly–owned subsidiary of Vocus Group
Limited as part of its Loan Funded Share Plan remuneration scheme to attract and retain key employees. Vocus Blue Pty Limited’s sole purpose is to hold shares as trustee for its beneficiaries (its ‘participants’). The participants are granted a loan by Vocus to purchase the beneficial interest in shares. The loans are limited recourse to the participants and any dividends received in respect of the plan shares are used to reduce the loan balance net of tax payable. Participants are required to meet service requirements and performance conditions before being entitled to acquire full title to these shares and are required to repay the loan in order to do so.
The shares held by Vocus Blue Pty Limited have been deducted from equity as treasury shares in line with accounting standards.
** The transfer of shares to participants during the current and previous year is measured with reference to the loan value attaching to those shares.
Ordinary sharesOrdinary shares entitle the holder to participate in dividends and the proceeds on the winding up of the Company in proportion to the number of and amounts paid on the shares held. The fully paid ordinary shares have no par value and the Company does not have a limited amount of authorised capital.
On a show of hands every member present at a meeting in person or by proxy shall have one vote and upon a poll each share shall have one vote.
Capital risk managementVocus’ objectives when managing capital are to safeguard its ability to continue as a going concern, so that it can provide returns for shareholders and benefits for other stakeholders and to maintain an optimum capital structure to reduce the cost of capital.
Capital is regarded as total equity, as recognised in the statement of financial position, plus net debt. Net debt is calculated as total borrowings less cash and cash equivalents.
In order to maintain or adjust the capital structure, adjustments may be made to the amount of dividends paid to shareholders, return capital to shareholders, issue new shares or sell assets to reduce debt.
Vocus would look to raise capital when an opportunity to invest in a business or company was seen as value adding relative to the current Parent Entity’s share price at the time of the investment.
The capital risk management policy remains unchanged from the 30 June 2019 Annual Report.
Accounting policy for issued capitalOrdinary shares are classified as equity.
Incremental costs directly attributable to the issue of new shares or options are shown in equity as a deduction, net of tax, from the proceeds.
76
VOCUS GROUP Annual Report 2019
For
per
sona
l use
onl
y

NOTE 23. EQUITY – RESERVES
Consolidated
2019 $’000
2018 $’000
Investment revaluation reserve (558) (900)
Foreign currency translation reserve 12,695 (1,933)
Share-based payments reserve 18,659 12,431
Hedge reserve 6,736 2,060
37,532 11,658
Investment revaluation reserveThe reserve is used to recognise increments and decrements in the fair value of financial assets at fair value through other comprehensive income.
Foreign currency reserveThe reserve is used to recognise exchange differences arising from the translation of the financial statements of foreign operations to Australian dollars. It is also used to recognise gains and losses on hedges of the net investments in foreign operations.
Share-based payments reserveThe reserve is used to recognise the value of equity benefits provided to employees as part of their remuneration, and as part of their compensation for services. No gain or loss is recognised in profit or loss on purchase, sale, issue or cancellation of the Company’s own equity instruments.
Hedging reserve – cash flow hedgesThe reserve is used to recognise the effective portion of the gain or loss of cash flow hedge instruments that is determined to be an effective hedge.
77
For
per
sona
l use
onl
y

NOTES TO THE FINANCIAL STATEMENTS (CONTINUED)
NOTE 23. EQUITY – RESERVES (CONTINUED)
Movements in reservesMovements in each class of reserve during the current and previous financial year are set out below:
Consolidated
Investment revaluation
$’000
Foreign currency
$’000
Share-based payments
$’000Hedge $’000
Total $’000
Balance at 1 July 2017 (233) 6,000 11,656 5,280 22,703
Foreign currency translation – (7,933) – – (7,933)
Recognition of share-based payments – – 911 – 911
Net movement on hedging transactions – – – (3,220) (3,220)
Net movements on investments (667) – – – (667)
Transfers to contributed equity – – (136) – (136)
Balance at 30 June 2018 (900) (1,933) 12,431 2,060 11,658
Foreign currency translation – 14,628 – – 14,628
Recognition of share-based payments – – 6,454 – 6,454
Net movement on hedging transactions – – – 4,676 4,676
Net movements on investments 342 – – – 342
Transfers to contributed equity – – (226) – (226)
Balance at 30 June 2019 (558) 12,695 18,659 6,736 37,532
NOTE 24. EQUITY – ACCUMULATED LOSSES
Consolidated
2019 $’000
2018 $’000
Accumulated losses at the beginning of the financial year (1,433,368) (1,494,413)
Change on initial application of AASB 15 and AASB 9 – net of tax (45,912) –
Accumulated losses at the beginning of the financial year – restated (1,479,280) (1,494,413)
Profit after income tax expense for the year 34,009 61,045
Accumulated losses at the end of the financial year (1,445,271) (1,433,368)
78
VOCUS GROUP Annual Report 2019
For
per
sona
l use
onl
y

NOTE 25. FAIR VALUE MEASUREMENT
Fair value hierarchyThe following tables detail assets and liabilities, measured or disclosed at fair value, using a three level hierarchy, based on the lowest level of input that is significant to the entire fair value measurement, being:
Level 1: Quoted prices (unadjusted) in active markets for identical assets or liabilities that the entity can access at the measurement date
Level 2: Inputs other than quoted prices included within Level 1 that are observable for the asset or liability, either directly or indirectly
Level 3: Derived from valuation techniques that include inputs for the instrument that are not based on observable market data.
Consolidated – 2019Level 1
$’000Level 2
$’000Level 3
$’000Total
$’000
Assets
Electricity derivatives – 15,892 – 15,892
Forward foreign exchange contracts – 7,214 – 7,214
Total assets – 23,106 – 23,106
Liabilities
Forward foreign exchange contracts – (92) – (92)
Interest rate swaps – (12,151) – (12,151)
Electricity derivatives – (1,400) (2,535) (3,935)
Deferred consideration – – (385) (385)
Total liabilities – (13,643) (2,920) (16,563)
Consolidated – 2018Level 1
$’000Level 2
$’000Level 3
$’000Total
$’000
Assets
Available-for sale financial assets 1,000 – – 1,000
Electricity derivatives – 5,984 – 5,984
Forward foreign exchange contracts – 9,200 – 9,200
Total assets 1,000 15,184 – 16,184
Liabilities
Interest rate swaps – (2,869) – (2,869)
Electricity derivatives – (7,978) (3,832) (11,810)
Deferred consideration – – (14,341) (14,341)
Total liabilities – (10,847) (18,173) (29,020)
There were no transfers between levels during the financial year.
The carrying amounts of trade and other receivables and trade and other payables are assumed to approximate their fair values due to their short-term nature.
The fair value of financial liabilities is estimated by discounting the remaining contractual maturities at the current market interest rate that is available for similar financial liabilities.
During the year Vocus the Group entered into a long term energy swap which is classified as a level 3 instrument as the primary input, being the long term electricity price curve beyond 3 years, is not directly observable in the market.
79
For
per
sona
l use
onl
y

NOTES TO THE FINANCIAL STATEMENTS (CONTINUED)
NOTE 25. FAIR VALUE MEASUREMENT (CONTINUED)The fair value of this energy derivative is determined as the present value of future contracted cash flows and credit adjustments. The valuation of this instrument is sensitive to changes in this long term electricity price beyond 3 years, with a $1/MWh movement (on average over the duration of the unobservable period) resulting in a $1 million change in the valuation.
Valuation techniques for fair value measurements Available for sale financial assets uses observable values such as publicly available equity prices at the end of the reporting period in the valuation and is classified as in the hierarchy as level 1.
The fair value of derivative financial instruments that are not traded on an active market is determined by using valuation methodologies and assumptions that are based on market conditions existing at the valuation date. These include:
|| The use of forward electricity price curve derived from various inputs such as electricity futures market is used in calculating electricity derivatives.
|| The interest rate yield curve and applying the net present value to future cash flows are techniques used in valuing interest rate swaps.
|| The fair value of forward exchange contracts are determined by using forward exchange market rates in valuing forward exchange contracts.
Accounting policy for fair value measurementWhen an asset or liability, financial or non-financial, is measured at fair value for recognition or disclosure purposes, the fair value is based on the price that would be received to sell an asset or paid to transfer a liability in an orderly transaction between market participants at the measurement date; and assumes that the transaction will take place either: in the principal market; or in the absence of a principal market, in the most advantageous market.
Fair value is measured using the assumptions that market participants would use when pricing the asset or liability, assuming they act in their economic best interests. For non-financial assets, the fair value measurement is based on its highest and best use. Valuation techniques that are appropriate in the circumstances and for which sufficient data are available to measure fair value, are used, maximising the use of relevant observable inputs and minimising the use of unobservable inputs.
Assets and liabilities measured at fair value are classified into three levels, using a fair value hierarchy that reflects the significance of the inputs used in making the measurements. Classifications are reviewed at each reporting date and transfers between levels are determined based on a reassessment of the lowest level of input that is significant to the fair value measurement.
For recurring and non-recurring fair value measurements, external valuers may be used when internal expertise is either not available or when the valuation is deemed to be significant. External valuers are selected based on market knowledge and reputation. Where there is a significant change in fair value of an asset or liability from one period to another, an analysis is undertaken, which includes a verification of the major inputs applied in the latest valuation and a comparison, where applicable, with external sources of data.
NOTE 26. FINANCIAL INSTRUMENTS
Financial risk management objectivesVocus’ activities expose it to a variety of financial risks including market risks such as foreign currency, price and interest rate, and credit and liquidity risks.
The Audit and Risk Committee has general oversight of those financial risks identified here. In addition, it oversees formal risk management policies and risks identified are monitored by executive management on a regular basis to minimise the potential adverse effects these risks may have on financial performance.
Overall risk management focuses on the unpredictability of financial markets and seeks to minimise potential adverse effects on financial performance where material. Derivative financial instruments such as forward foreign exchange contracts are used to hedge certain risk exposures or cash flow hedges where appropriate.
Derivatives are exclusively used for hedging purposes, i.e. not as trading or other speculative activities.
Different methods are used to measure different types of risk to which Vocus is exposed. These methods include sensitivity analysis in the case of interest rate, foreign exchange and other price risks and ageing analysis for credit risk.
The Wholesale Energy Risk Management Committee is a sub-committee of the Audit and Risk Committee that provides direct oversight over the risks and hedging strategies undertaken to mitigate those risks relating to the Group’s retail electricity and gas business in Australia and New Zealand.
Financial assets and liabilities comprise cash and cash equivalents, receivables, payables, bank loans and finance leases.
80
VOCUS GROUP Annual Report 2019
For
per
sona
l use
onl
y

Market risk
Foreign currency riskCertain transactions are denominated in foreign currency and the Group is exposed to foreign currency risk through foreign exchange rate fluctuations.
Foreign exchange risk arises from future commercial transactions and recognised financial assets and financial liabilities denominated in a currency that is not the entity’s functional currency. The risk is measured using sensitivity analysis and cash flow forecasting.
The maturity, settlement amounts and the average contractual exchange rates of outstanding forward foreign exchange contracts at the reporting date was as follows:
Sell Australian dollars Average exchange rates
2019 $’000
2018 $’000
2019 2018
Buy US dollars
Maturity:
0 – 12 months 77,368 229,115 0.7369 0.7657
12 – 24 months 745 18,986 0.7200 0.7520
Buy Philippine Pesos
Maturity:
0 – 12 months 31,731 32,066 39.3900 40.4900
12 – 24 months 4,969 26,500 40.3200 41.1300
Buy Euro
Maturity:
12 – 24 months 877 – 0.6076 –
These figures represent the Australian dollars to be sold under foreign exchange contracts to purchase US dollars, Philippine Pesos and Euro.
The carrying amount of foreign currency denominated financial assets and financial liabilities at the reporting date was as follows:
Assets Liabilities
Consolidated2019
$’0002018
$’0002019
$’0002018
$’000
US dollars 18,457 9,167 11,194 73,319
New Zealand dollars 532 563 44 –
Philippine Pesos – – 1,644 362
18,989 9,730 12,882 73,681
Vocus is exposed to foreign exchange risk arising from various currency exposures, primarily with respect to, the United States of America dollar (USD), New Zealand dollar (NZD) and Philippine peso (PHP). Vocus manages its foreign exchange rate risk by hedging its firm commitments and highly probable forecast transactions over varying time horizons. These hedges are undertaken centrally by Group Treasury.
As at 30 June 2019, future movements in AUD/USD currency of 5% (2018: 5%) will have an approximate $364,000 (2018: $3,215,000) increase or decrease to profit or loss and $4,151,000 increase or decrease (2018: $12,860,000) in equity in the financial year ending 30 June 2019.
81
For
per
sona
l use
onl
y

NOTES TO THE FINANCIAL STATEMENTS (CONTINUED)
NOTE 26. FINANCIAL INSTRUMENTS (CONTINUED)As at 30 June 2019, future movements in AUD/NZD currency of 5% (2018: 5%) will have an approximate $24,000 (2018: $28,000) increase or decrease to profit or loss.
As at 30 June 2019, future movements in AUD/PHP currency of 5% (2018: 5%) will have an approximate $82,000 (2018: $18,000) increase or decrease to profit or loss and $1,924,000 increase or decrease (2018: $2,973,000) in equity in the financial year ending 30 June 2019.
Commodity riskVocus is exposed to commodity price risk associated with the purchase and/ or sale of electricity and to a lesser extent gas. To manage the price risks associated with electricity, Vocus enters into derivative instruments such as options and swaps. To manage gas price risk, Vocus has a supply agreement which has the commercial effect of limiting the price paid from the national pool on a certain amount of gas.
Based on a quarterly forecast of the required electricity supply, Vocus hedges the purchase price using future commodity contracts. The forecast is deemed to be a highly probable transaction.
As at 30 June 2019, future movements in electricity price of 1% (2018: 1%) will have nil effect to profit or loss, because Vocus has not released anything into profit or loss in FY19 (2018: $2,000 increase or decrease) and $1,572,000 increase or decrease in equity (2018: $1,826,000).
Interest rate riskInterest rate risk arises from term deposits, cash on deposit, bank loans and long-term borrowings. Term deposits, cash on deposit and borrowings at variable rates creates exposure to interest rate risk. To manage interest rate risk, the group enters into interest rate swaps or options. The interest rate swaps have the economic effect of converting borrowings from floating rates to fixed rates. Interest rate options economic effect of converting borrowings from floating rates to fixed rates if the option is exercised otherwise the borrowings remain floating.
Obligations under the IRU loan and finance leases are fixed as part of the defined repayment schedules. This mitigates interest rate risk in respect of these obligations.
As at the reporting date, Vocus had the following variable rate borrowings and interest rate swap and option contracts outstanding:
2019 2018
Consolidated
Weighted average
interest rate %
Balance $’000
Weighted average
interest rate %
Balance $’000
Bank overdraft and bank loans 4.38% 1,121,273 4.40% 1,025,116
Interest rate swaps (notional principal amount) 2.28% (341,000) 2.55% (292,553)
Interest rate option (notional principal amount) 3.10% (50,000) 3.10% (50,000)
Net exposure to cash flow interest rate risk 730,273 682,563
As at 30 June 2019, future movements in interest rate of 50 basis points (2018: 50 basis points) will have an approximate $3,651,000 (2018: $3,413,000) increase or decrease to profit or loss and $3,869,000 (2018: $323,000) increase or decrease in equity in the financial year ending 30 June 2019.
Credit riskCredit risk refers to the risk that a counterparty will default on its contractual obligations resulting in financial loss.
Vocus has adopted a lifetime expected loss allowance in estimating expected credit losses to trade receivables through the use of a provisions matrix using fixed rates of credit loss provisioning. These provisions are considered representative across all customers of the Vocus based on recent sales experience, historical collection rates and forward-looking information that is available.
Vocus does not hold any credit derivatives to offset its credit exposure.
Generally, trade receivables are written off when there is no reasonable expectation of recovery. Indicators of this include the failure of a debtor to engage in a repayment plan, no active enforcement activity and a failure to make contractual payments for a period greater than 1 year.
82
VOCUS GROUP Annual Report 2019
For
per
sona
l use
onl
y

It is Vocus’ policy that prior to all customers who wish to trade on credit terms are subject to credit verification procedures including an assessment of their independent credit worthiness, financial position, past experience and industry reputation. Credit limits are set for each individual customer in accordance with parameters set by the board and are regularly monitored. Where appropriate, guarantees and security deposits are used as collateral to mitigate perceived risk. The maximum exposure to credit risk at the reporting date to recognised financial assets, is the carrying amount, net of any provisions for impairment of those assets, as disclosed in the statement of financial position and notes to the financial statements.
In addition, receivable balances are monitored on an ongoing basis with the result that Vocus’ exposure to bad debts is not significant. There are no significant concentrations of credit risk within Vocus.
Liquidity riskVigilant liquidity risk management requires the maintenance of sufficient liquid assets (mainly cash and cash equivalents) and available borrowing facilities to be able to pay debts as and when they become due and payable.
Liquidity risk is managed by maintaining adequate cash reserves and available borrowing facilities by continuously monitoring actual and forecast cash flows and matching the maturity profiles of financial assets and liabilities.
Remaining contractual maturitiesThe following tables detail Vocus’ remaining contractual maturity for its financial instrument liabilities. The tables have been drawn up based on the undiscounted cash flows of financial liabilities based on the earliest date on which the financial liabilities are required to be paid. The tables include both interest and principal cash flows disclosed as remaining contractual maturities (except for bank loans) and therefore these totals may differ from their carrying amount in the statement of financial position.
Consolidated – 20191 year or less
$’000
Between 1 and 2 years
$’000
Between 2 and 5 years
$’000Over 5 years
$’000
Remaining contractual
maturities $’000
Non-derivatives
Non-interest bearing
Trade payables and accruals 229,340 – – – 229,340
Other payables 23,144 – – – 23,144
Interest-bearing – variable
Bank loans 50,000 100,000 944,223 – 1,094,223
Lease liability 4,573 3,097 3,157 11,662 22,489
IRU liability 6,406 6,406 – – 12,812
Total non-derivatives 313,463 109,503 947,380 11,662 1,382,008
Derivatives
Interest rate swaps net settled 4,468 5,657 2,065 – 12,190
Forward foreign exchange contracts net settled (6,767) (446) 92 – (7,121)
Electricity contracts net settled 15,844 5,183 (9,784) 714 11,957
Total derivatives 13,545 10,394 (7,627) 714 17,026
83
For
per
sona
l use
onl
y

NOTES TO THE FINANCIAL STATEMENTS (CONTINUED)
NOTE 26. FINANCIAL INSTRUMENTS (CONTINUED)
Consolidated – 20181 year or less
$’000
Between 1 and 2 years
$’000
Between 2 and 5 years
$’000Over 5 years
$’000
Remaining contractual
maturities $’000
Non-derivatives
Non-interest bearing
Trade payables and accruals 273,097 – – – 273,097
Other payables 29,081 – – – 29,081
Interest-bearing – variable
Bank loans – 50,000 975,116 – 1,025,116
Lease liability 5,440 2,350 2,928 12,120 22,838
IRU liability 7,700 6,406 6,407 – 20,513
Total non-derivatives 315,318 58,756 984,451 12,120 1,370,645
Derivatives
Interest rate swaps net settled 1,330 1,153 386 – 2,869
Forward foreign exchange contracts net settled (8,767) (433) – – (9,200)
Electricity contracts net settled 6,062 841 (10,461) (2,268) (5,826)
Total derivatives (1,375) 1,561 (10,075) (2,268) (12,157)
NOTE 27. CURRENT ASSETS – DERIVATIVE FINANCIAL INSTRUMENTS
Consolidated
2019 $’000
2018 $’000
Forward foreign exchange contracts – cash flow hedges 6,767 8,772
Electricity derivatives – cash flow hedges 15,892 5,984
22,659 14,756
Refer to note 25 for further information on fair value measurement.
Forward foreign exchange contractsVocus has entered a forward exchange hedge relationships to buy and sell specified amounts of foreign currency denominated in USD and Philippine Peso in the future at stipulated exchange rates. The objective of entering the forward exchange contracts is to protect Vocus against unfavourable exchange rate movements for highly probable forecasted purchases of inventory, capital equipment and payments for services.
The forward exchange contracts have been designated based on forecasted foreign currency denominated purchases. Gains or losses recognised in the cash flow hedge reserve in equity on forward foreign exchange contracts as of 30 June 2019 will be released to the income statement when the underlying anticipated transactions affect the income statement or included in the carrying value of asset or liabilities acquired.
84
VOCUS GROUP Annual Report 2019
For
per
sona
l use
onl
y

Interest rate swapsVocus currently holds an interest cap and swap agreements to protect the syndicated loan facility from exposure to increasing interest rates. Under interest rate swap agreements, the Group pays a fixed rate of interest between 1.895% and 2.80% per annum, and receives interest at a variable rate.
Under interest rate cap agreements, the Group pays a maximum rate of 3.10% (strike) if the three-month floating rate is higher for a 3-month period and receives interest at a variable rate. If the interest rate cap is not exercised Vocus pays the then 3-month floating rate for that period and receives interest at a variable rate. The strike rate is assessed against the 3 month variable rate each 90 days.
The contracts require settlement of net interest receivable or payable each 90 days.
The gain or loss from remeasuring the hedging instruments at fair value is recognised in other comprehensive income and deferred in equity in the cash flow hedge reserve, to the extent that the hedge is effective. It is reclassified into the income statement when the hedged interest expense is recognised.
Electricity derivativesVocus manages this exposure of floating purchase price of electricity through the purchase of electricity swaps and options contracts via the futures and over-the-counter markets. The hedged anticipated electricity purchase and sale transactions are expected to occur for each half hour period throughout the next quarter from the reporting date consistent with the forecast demand from customers over this period. Gains or losses recognised in the cash flow hedge reserve in equity on the electricity swap and option contracts as of 30 June 2019 will be released to the income statement when the underlying anticipated purchase or sale transactions are recognised in the income statement. For option contracts only the amount that has intrinsic value is recognised in the cash flow hedge reserve. Extrinsic value is recognised in the income statement.
Accounting policy for derivative financial instrumentsDerivatives are initially recognised at fair value on the date a derivative contract is entered into and are subsequently remeasured to their fair value at each reporting date. The accounting for subsequent changes in fair value depends on whether the derivative is designated as a hedging instrument, and if so, the nature of the item being hedged.
Derivatives are classified as current or non-current depending on the expected period of realisation.
Cash flow hedgesCash flow hedges are used to cover exposure to variability in cash flows that is attributable to particular risks associated with a recognised asset or liability or a firm commitment which could affect profit or loss. The effective portion of the gain or loss on the hedging instrument is recognised directly in equity, whilst the ineffective portion is recognised in profit or loss. Amounts taken to equity are transferred out of equity and included in the measurement of the hedged transaction when the forecast transaction occurs.
Cash flow hedges are tested for effectiveness on a regular basis both retrospectively and prospectively to ensure that each hedge is highly effective and continues to be designated as a cash flow hedge. If the forecast transaction is no longer expected to occur, the amounts recognised in equity are transferred to profit or loss.
If the hedging instrument is sold, terminated, expires, exercised without replacement or rollover, or if the hedge becomes ineffective and is no longer a designated hedge, the amounts previously recognised in equity remain in equity until the forecast transaction occurs.
NOTE 28. CURRENT LIABILITIES – DERIVATIVE FINANCIAL INSTRUMENTS
Consolidated
2019 $’000
2018 $’000
Forward foreign exchange contracts – cash flow hedges 92 –
Interest rate swap contracts – cash flow hedges 4,883 1,330
4,975 1,330
Refer to note 26 for further information on financial instruments.
Refer to note 25 for further information on fair value measurement.
85
For
per
sona
l use
onl
y
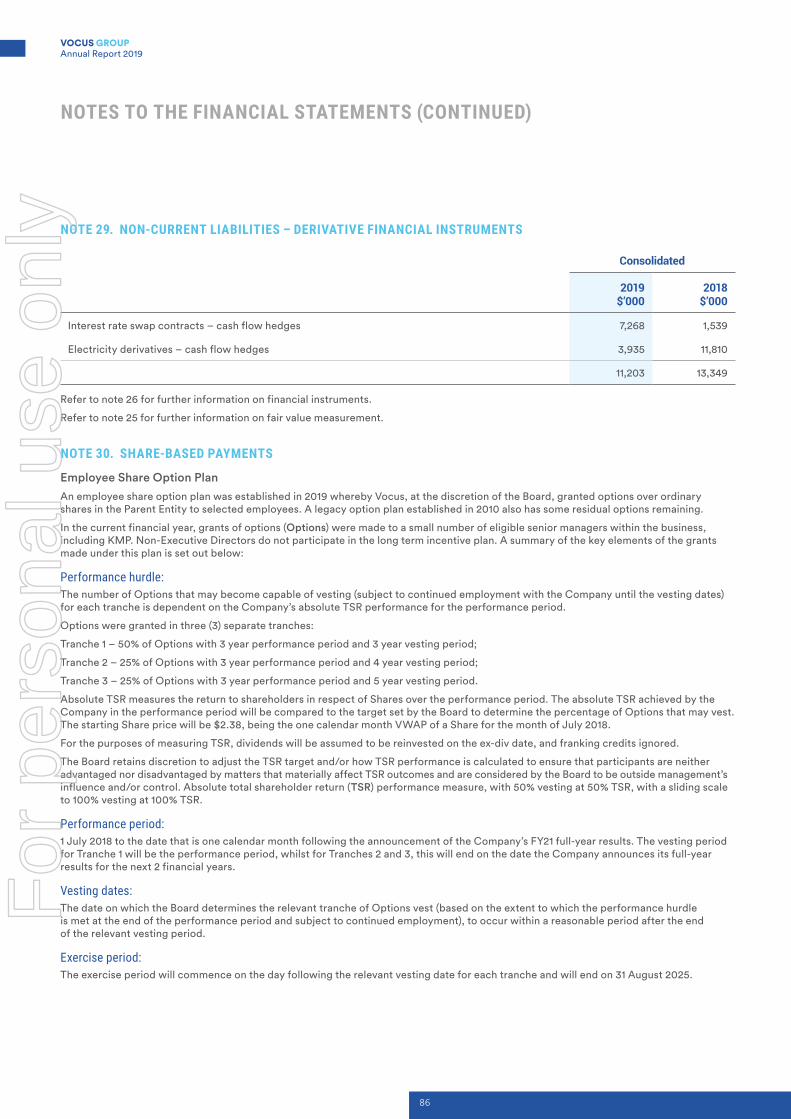
NOTES TO THE FINANCIAL STATEMENTS (CONTINUED)
NOTE 29. NON-CURRENT LIABILITIES – DERIVATIVE FINANCIAL INSTRUMENTS
Consolidated
2019 $’000
2018 $’000
Interest rate swap contracts – cash flow hedges 7,268 1,539
Electricity derivatives – cash flow hedges 3,935 11,810
11,203 13,349
Refer to note 26 for further information on financial instruments.
Refer to note 25 for further information on fair value measurement.
NOTE 30. SHARE-BASED PAYMENTS
Employee Share Option PlanAn employee share option plan was established in 2019 whereby Vocus, at the discretion of the Board, granted options over ordinary shares in the Parent Entity to selected employees. A legacy option plan established in 2010 also has some residual options remaining.
In the current financial year, grants of options (Options) were made to a small number of eligible senior managers within the business, including KMP. Non-Executive Directors do not participate in the long term incentive plan. A summary of the key elements of the grants made under this plan is set out below:
Performance hurdle:The number of Options that may become capable of vesting (subject to continued employment with the Company until the vesting dates) for each tranche is dependent on the Company’s absolute TSR performance for the performance period.
Options were granted in three (3) separate tranches:
Tranche 1 – 50% of Options with 3 year performance period and 3 year vesting period;
Tranche 2 – 25% of Options with 3 year performance period and 4 year vesting period;
Tranche 3 – 25% of Options with 3 year performance period and 5 year vesting period.
Absolute TSR measures the return to shareholders in respect of Shares over the performance period. The absolute TSR achieved by the Company in the performance period will be compared to the target set by the Board to determine the percentage of Options that may vest. The starting Share price will be $2.38, being the one calendar month VWAP of a Share for the month of July 2018.
For the purposes of measuring TSR, dividends will be assumed to be reinvested on the ex-div date, and franking credits ignored.
The Board retains discretion to adjust the TSR target and/or how TSR performance is calculated to ensure that participants are neither advantaged nor disadvantaged by matters that materially affect TSR outcomes and are considered by the Board to be outside management’s influence and/or control. Absolute total shareholder return (TSR) performance measure, with 50% vesting at 50% TSR, with a sliding scale to 100% vesting at 100% TSR.
Performance period:1 July 2018 to the date that is one calendar month following the announcement of the Company’s FY21 full-year results. The vesting period for Tranche 1 will be the performance period, whilst for Tranches 2 and 3, this will end on the date the Company announces its full-year results for the next 2 financial years.
Vesting dates:The date on which the Board determines the relevant tranche of Options vest (based on the extent to which the performance hurdle is met at the end of the performance period and subject to continued employment), to occur within a reasonable period after the end of the relevant vesting period.
Exercise period:The exercise period will commence on the day following the relevant vesting date for each tranche and will end on 31 August 2025.
86
VOCUS GROUP Annual Report 2019
For
per
sona
l use
onl
y

Exercise of Options and allocation of shares:Upon vesting and subject to the Company’s Share Trading Policy, and payment of the exercise price, vested Options may be exercised during the exercise period. Upon exercise of vested Options, participants will be allocated the relevant number of Shares corresponding to the number of vested Options exercised (as soon as practicable following exercise). Upon allocation of the Shares, the participants will be entitled to receive dividends and voting rights along with other Company shareholders.
However, under the Plan Rules, the Board may also determine to either:
|| settle exercised vested Options in cash (equal in value to the Shares underlying the Options being exercised, less the corresponding exercise price, and is inclusive of any statutory superannuation contributions); or
|| deliver the net number shares on the exercise of vested Options where the net number of Shares is equal to the excess between the market value of the Shares underlying the Options being exercised less the corresponding exercise price.
Price payable for securities:No amount will be payable by the participants in respect of the grant of Options. Upon exercise of vested Options, the participants will be required to pay the exercise price in order to be allocated Shares in the Company (unless net-settlement of the Options apply).
Each Option is a right to acquire one fully-paid ordinary share in the Company (Share), upon satisfaction of the applicable vesting conditions (including performance hurdles and continued employment with the Company) and payment of the exercise price. The specific vesting conditions are outlined below. The exercise price payable varies between the individuals, and is based on the one calendar month volume weighted average price (VWAP) of a Share for the month of July 2018 or in the month prior to the individual’s employment, if they were not employed in July 2018.
Options do not carry a right to vote or to receive dividends, or in general, a right to participate in other corporate actions such as bonus issues.
Set out below are summaries of options granted under the plan:
2019
Grant date Vesting date* Exercise price
Balance at the start of the
year Granted Exercised
Expired/ forfeited/
other
Balance at the end of the
year
22/02/2016 22/02/2023 $5.09 135,418 – – – 135,418
14/12/2018 30/09/2021 $2.38 – 11,625,000 – (200,000) 11,425,000
14/12/2018 01/08/2022 $2.38 – 5,812,500 – (100,000) 5,712,500
14/12/2018 01/08/2023 $2.38 – 5,812,500 – (100,000) 5,712,500
14/12/2018 30/09/2021 $3.06 – 250,000 – (41,667) 208,333
14/12/2018 01/08/2022 $3.06 – 125,000 – (20,833) 104,167
14/12/2018 01/08/2023 $3.06 – 125,000 – (20,833) 104,167
135,418 23,750,000 – (483,333) 23,402,085
Weighted average exercise price $5.09 $2.39 $0.00 $2.50 $2.41
2018
Grant date Vesting date* Exercise price
Balance at the start of the
year Granted Exercised
Expired/ forfeited/
other
Balance at the end of the
year
01/08/2011 31/07/2018 $2.39 33,334 – (33,334) – –
11/05/2012 10/05/2019 $1.89 7,500 – (7,500) – –
22/02/2016 22/02/2023 $5.09 135,418 – – – 135,418
176,252 – (40,834) – 135,418
Weighted average exercise price $4.44 $0.00 $2.30 $0.00 $5.09
* Options granted on the 22nd of February 2016 (135,418 options), vested on the 1st of January 2017 with an expiry date of 22/02/2023. These options were granted to replace options originally granted under the M2 Group Option plan (prior to M2’s merger with Vocus).
The fair value of the 23,402,085 (2018: 135,418) shares under option at 30 June 2019 was $23,398,083 (2018: $70,000).
87
For
per
sona
l use
onl
y

NOTES TO THE FINANCIAL STATEMENTS (CONTINUED)
NOTE 30. SHARE-BASED PAYMENTS (CONTINUED)
Performance Rights PlanThe Vocus Long Term Performance Rights Plan was introduced in FY2017, each of Amcom, Vocus and M2 had equity-based LTI plans in place prior to the merger between Vocus and M2 Group which was completed in February 2016.
Grants were made under the Vocus Long Term Performance Rights Plan in FY17 and FY18 respectively, details of which are set out below. No further grants will be made under this plan. A summary of the key elements of the grants made under this plan is set out below:
Performance hurdle:Vesting Conditions are achieving a predetermined level of compound annual growth in Vocus’ reported earnings per share (EPS) and achievement of transformation and synergy benefits during the Vesting Period. The ‘base point’ for measuring the rate of EPS growth is the underlying EPS disclosed in Vocus’ audited annual financial accounts for the financial year immediately preceding the year of grant. These measures will be disclosed after the performance period ends.
Performance period:3-year period
Vesting dates:Upon expiry of the Vesting Period and completion of the testing of the Vesting Conditions
Exercise period:The exercise period will commence 2 years from Vesting Date. Performance Rights may be exercised at any time between the Vesting Date and the Expiry Date.
Form of grant:|| Performance Rights to be settled in Vocus shares
|| Participants are not required to pay for the grant or exercise of Performance Rights
|| Each Performance Right entitles the holder to one ordinary share in Vocus if the applicable Vesting Conditions are met
|| Performance Rights do not carry any voting or dividend entitlements
Set out below are summaries of performance rights granted under the plan:
2019
Grant date Vesting dateBalance at the
start of the year Granted ExercisedExpired/
forfeited/otherBalance at the end of the year
22/02/2016 01/07/2018 143,207 – (60,298) (82,909) –
01/04/2017 01/07/2018 435,000 – – (435,000) –
01/04/2017 01/07/2019 350,421 – (19,054) (175,419) 155,948
01/05/2018 01/07/2020 569,104 – – (60,975) 508,129
1,497,732 – (79,352) (754,303) 664,077
88
VOCUS GROUP Annual Report 2019
For
per
sona
l use
onl
y
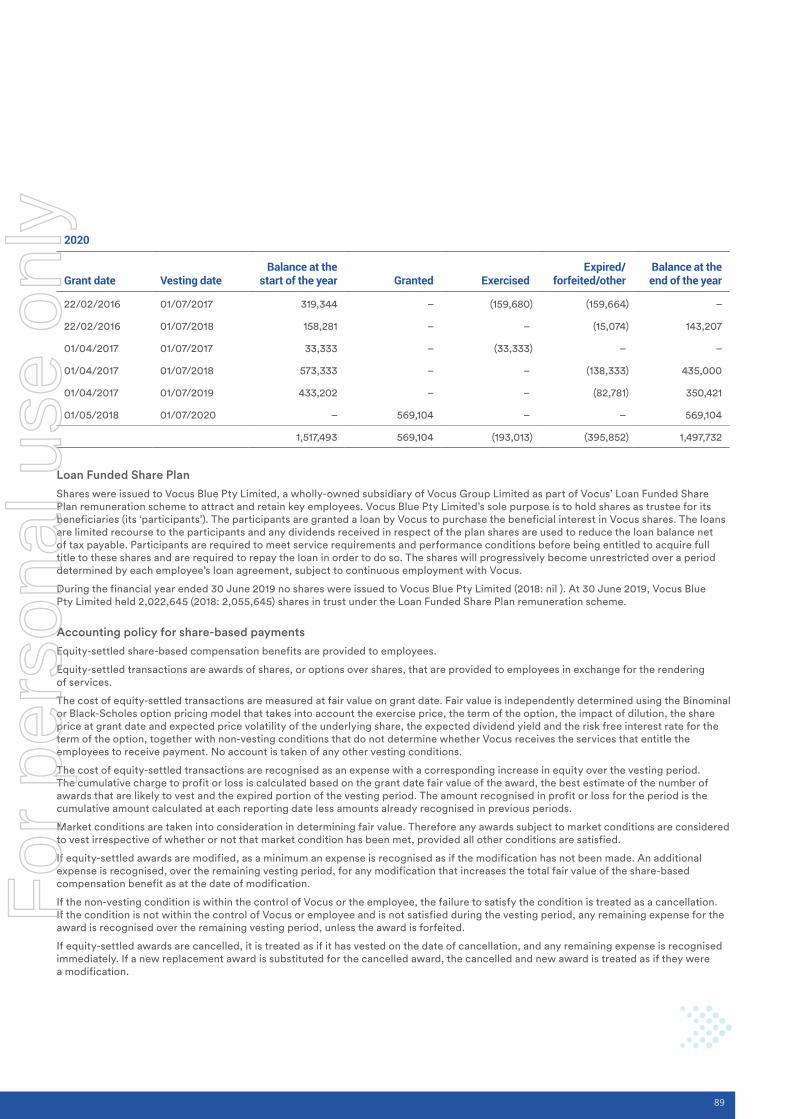
2020
Grant date Vesting dateBalance at the
start of the year Granted ExercisedExpired/
forfeited/otherBalance at the end of the year
22/02/2016 01/07/2017 319,344 – (159,680) (159,664) –
22/02/2016 01/07/2018 158,281 – – (15,074) 143,207
01/04/2017 01/07/2017 33,333 – (33,333) – –
01/04/2017 01/07/2018 573,333 – – (138,333) 435,000
01/04/2017 01/07/2019 433,202 – – (82,781) 350,421
01/05/2018 01/07/2020 – 569,104 – – 569,104
1,517,493 569,104 (193,013) (395,852) 1,497,732
Loan Funded Share PlanShares were issued to Vocus Blue Pty Limited, a wholly-owned subsidiary of Vocus Group Limited as part of Vocus’ Loan Funded Share Plan remuneration scheme to attract and retain key employees. Vocus Blue Pty Limited’s sole purpose is to hold shares as trustee for its beneficiaries (its ‘participants’). The participants are granted a loan by Vocus to purchase the beneficial interest in Vocus shares. The loans are limited recourse to the participants and any dividends received in respect of the plan shares are used to reduce the loan balance net of tax payable. Participants are required to meet service requirements and performance conditions before being entitled to acquire full title to these shares and are required to repay the loan in order to do so. The shares will progressively become unrestricted over a period determined by each employee’s loan agreement, subject to continuous employment with Vocus.
During the financial year ended 30 June 2019 no shares were issued to Vocus Blue Pty Limited (2018: nil ). At 30 June 2019, Vocus Blue Pty Limited held 2,022,645 (2018: 2,055,645) shares in trust under the Loan Funded Share Plan remuneration scheme.
Accounting policy for share-based paymentsEquity-settled share-based compensation benefits are provided to employees.
Equity-settled transactions are awards of shares, or options over shares, that are provided to employees in exchange for the rendering of services.
The cost of equity-settled transactions are measured at fair value on grant date. Fair value is independently determined using the Binominal or Black-Scholes option pricing model that takes into account the exercise price, the term of the option, the impact of dilution, the share price at grant date and expected price volatility of the underlying share, the expected dividend yield and the risk free interest rate for the term of the option, together with non-vesting conditions that do not determine whether Vocus receives the services that entitle the employees to receive payment. No account is taken of any other vesting conditions.
The cost of equity-settled transactions are recognised as an expense with a corresponding increase in equity over the vesting period. The cumulative charge to profit or loss is calculated based on the grant date fair value of the award, the best estimate of the number of awards that are likely to vest and the expired portion of the vesting period. The amount recognised in profit or loss for the period is the cumulative amount calculated at each reporting date less amounts already recognised in previous periods.
Market conditions are taken into consideration in determining fair value. Therefore any awards subject to market conditions are considered to vest irrespective of whether or not that market condition has been met, provided all other conditions are satisfied.
If equity-settled awards are modified, as a minimum an expense is recognised as if the modification has not been made. An additional expense is recognised, over the remaining vesting period, for any modification that increases the total fair value of the share-based compensation benefit as at the date of modification.
If the non-vesting condition is within the control of Vocus or the employee, the failure to satisfy the condition is treated as a cancellation. If the condition is not within the control of Vocus or employee and is not satisfied during the vesting period, any remaining expense for the award is recognised over the remaining vesting period, unless the award is forfeited.
If equity-settled awards are cancelled, it is treated as if it has vested on the date of cancellation, and any remaining expense is recognised immediately. If a new replacement award is substituted for the cancelled award, the cancelled and new award is treated as if they were a modification.
89
For
per
sona
l use
onl
y
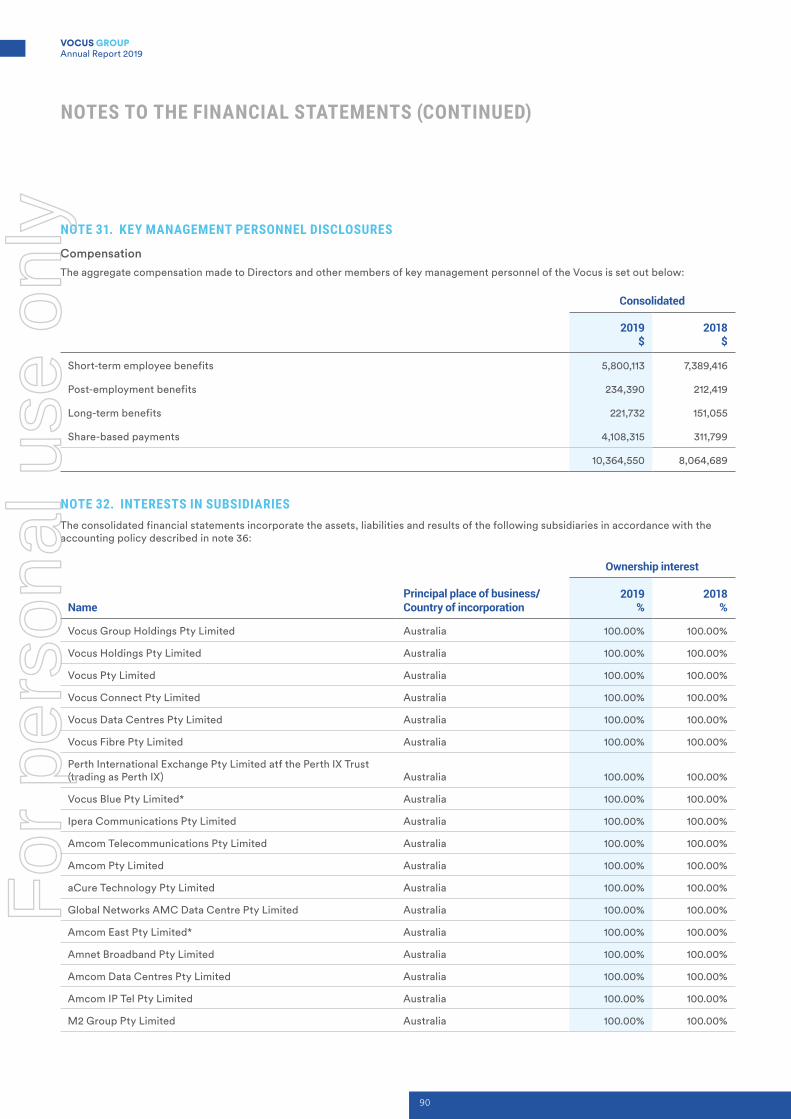
NOTES TO THE FINANCIAL STATEMENTS (CONTINUED)
NOTE 31. KEY MANAGEMENT PERSONNEL DISCLOSURES
CompensationThe aggregate compensation made to Directors and other members of key management personnel of the Vocus is set out below:
Consolidated
2019 $
2018 $
Short-term employee benefits 5,800,113 7,389,416
Post-employment benefits 234,390 212,419
Long-term benefits 221,732 151,055
Share-based payments 4,108,315 311,799
10,364,550 8,064,689
NOTE 32. INTERESTS IN SUBSIDIARIESThe consolidated financial statements incorporate the assets, liabilities and results of the following subsidiaries in accordance with the accounting policy described in note 36:
Ownership interest
NamePrincipal place of business/Country of incorporation
2019 %
2018 %
Vocus Group Holdings Pty Limited Australia 100.00% 100.00%
Vocus Holdings Pty Limited Australia 100.00% 100.00%
Vocus Pty Limited Australia 100.00% 100.00%
Vocus Connect Pty Limited Australia 100.00% 100.00%
Vocus Data Centres Pty Limited Australia 100.00% 100.00%
Vocus Fibre Pty Limited Australia 100.00% 100.00%
Perth International Exchange Pty Limited atf the Perth IX Trust (trading as Perth IX) Australia 100.00% 100.00%
Vocus Blue Pty Limited* Australia 100.00% 100.00%
Ipera Communications Pty Limited Australia 100.00% 100.00%
Amcom Telecommunications Pty Limited Australia 100.00% 100.00%
Amcom Pty Limited Australia 100.00% 100.00%
aCure Technology Pty Limited Australia 100.00% 100.00%
Global Networks AMC Data Centre Pty Limited Australia 100.00% 100.00%
Amcom East Pty Limited* Australia 100.00% 100.00%
Amnet Broadband Pty Limited Australia 100.00% 100.00%
Amcom Data Centres Pty Limited Australia 100.00% 100.00%
Amcom IP Tel Pty Limited Australia 100.00% 100.00%
M2 Group Pty Limited Australia 100.00% 100.00%
90
VOCUS GROUP Annual Report 2019
For
per
sona
l use
onl
y

Ownership interest
NamePrincipal place of business/Country of incorporation
2019 %
2018 %
M2 Loyalty Programs Pty Limited* Australia 100.00% 100.00%
M2 Group Franchising Pty Limited Australia 100.00% 100.00%
M2 Commander Pty Limited Australia 100.00% 100.00%
2Talk Pty Limited* Australia 100.00% 100.00%
M2 Telecommunications Pty Limited Australia 100.00% 100.00%
M2 Clear Pty Limited Australia 100.00% 100.00%
Southern Cross Telco Pty Limited Australia 100.00% 100.00%
People Telecom Pty Limited* Australia 100.00% 100.00%
People Telecommunications Pty Limited* Australia 100.00% 100.00%
M2 Wholesale Pty Limited Australia 100.00% 100.00%
Wholesale Communications Group Pty Limited* Australia 100.00% 100.00%
M2 Wholesale Services Pty Limited Australia 100.00% 100.00%
Primus Telecom Holdings Pty Limited Australia 100.00% 100.00%
First Path Pty Limited Australia 100.00% 100.00%
Primus Network (Australia) Pty Limited Australia 100.00% 100.00%
Primus Telecom Pty Limited Australia 100.00% 100.00%
Hotkey Internet Services Pty Limited* Australia 100.00% 100.00%
Primus Telecommunications Pty Limited Australia 100.00% 100.00%
Primus Telecommunications (Australia) Pty Limited* Australia 100.00% 100.00%
Dodo Australia Holdings Pty Limited Australia 100.00% 100.00%
No Worries Online Pty Limited* Australia 100.00% 100.00%
Dodo Group Services Pty Limited* Australia 100.00% 100.00%
Pendo Industries Pty Limited* Australia 100.00% 100.00%
Dodo Services Pty Limited Australia 100.00% 100.00%
Dodo Insurance Pty Limited* Australia 100.00% 100.00%
Secureway Pty Limited* Australia 100.00% 100.00%
M2 Energy Pty Limited* Australia 100.00% 100.00%
Eftel Pty Limited Australia 100.00% 100.00%
Eftel Wholesale Pty Limited* Australia 100.00% 100.00%
Club Telco Pty Limited* Australia 100.00% 100.00%
Eftel Corporate Pty Limited* Australia 100.00% 100.00%
Visage Telecom Pty Limited* Australia 100.00% 100.00%
Engin Pty Limited Australia 100.00% 100.00%
91
For
per
sona
l use
onl
y

NOTES TO THE FINANCIAL STATEMENTS (CONTINUED)
Ownership interest
NamePrincipal place of business/Country of incorporation
2019 %
2018 %
Eftel Retail Pty Limited* Australia 100.00% 100.00%
Vocus (New Zealand) Holdings Limited New Zealand 100.00% 100.00%
Vocus (New Zealand) Limited New Zealand 100.00% 100.00%
Vocus Group NZ Limited New Zealand 100.00% 100.00%
Data Lock Limited New Zealand 100.00% 100.00%
M2 Group NZ Limited New Zealand 100.00% 100.00%
CallPlus Holdings Limited New Zealand 100.00% 100.00%
2Talk Limited New Zealand 100.00% 100.00%
CallPlus Australia Holdings Limited New Zealand 100.00% 100.00%
CallPlus Limited New Zealand 100.00% 100.00%
Blue Reach Limited New Zealand 100.00% 100.00%
Slingshot Communications Limited New Zealand 100.00% 100.00%
CallPlus Services Limited New Zealand 100.00% 100.00%
CallPlus Trustee Limited New Zealand 100.00% 100.00%
Orcon Limited New Zealand 100.00% 100.00%
CallPlus Assets Limited New Zealand 100.00% 100.00%
Flip Services Limited New Zealand 100.00% 100.00%
CallPlus Services Australia Limited New Zealand 100.00% 100.00%
M2 NZ Limited New Zealand 100.00% 100.00%
Nextgen Networks Group Pty Limited Australia 100.00% 100.00%
Nextgen Networks Pty Limited Australia 100.00% 100.00%
Nextgen Telecom (WA) Pty Ltd Australia 100.00% 100.00%
Nextgen Telecom Pty Ltd Australia 100.00% 100.00%
Nextgen Services Pty Limited Australia 100.00% 100.00%
Nextgen Pure Data Pty Ltd Australia 100.00% 100.00%
Skiron Holdco Pty Limited Australia 100.00% 100.00%
Skiron Finco Pty Limited Australia 100.00% 100.00%
Skiron OpCo Pty Limited Australia 100.00% 100.00%
Australia-Singapore Cable (Australia) Pty Limited Australia – 100.00%
ASC International Group Pty Limited Australia 100.00% 100.00%
Australia-Singapore Cable International Limited* Bermuda – 100.00%
Australia-Singapore Cable (Singapore) Pte Ltd* Singapore 100.00% 100.00%
Switch Utilities Limited New Zealand 100.00% 100.00%
NOTE 32. INTERESTS IN SUBSIDIARIES (CONTINUED)
92
VOCUS GROUP Annual Report 2019
For
per
sona
l use
onl
y

Ownership interest
NamePrincipal place of business/Country of incorporation
2019 %
2018 %
Switch Utilities Southern Limited New Zealand 100.00% 100.00%
Switch Utilities Wellington Limited New Zealand 100.00% 100.00%
Australia-Singapore Cable OpCo Pty Limited* Australia 100.00% 100.00%
Australia-Singapore Cable HoldCo Pty Limited* Australia 100.00% 100.00%
NOTE 33. DEED OF CROSS GUARANTEEThe wholly-owned entities listed in note 32 (other than those identified with an asterisk) are party to a deed of cross guarantee under which each company guarantees the debts of the others. By entering into the deed, the relevant wholly-owned Australian entities have been relieved from the requirement to prepare financial statements and Directors’ report under ASIC Class Order 98/1418 or ASIC Corporations (Wholly-owned Companies) Instrument 2016/785 (as relevant).
The companies that are part of the deed of cross-guarantee represent a ‘Closed Group’ for the purposes of the Class Order, and as there are no other parties to the deed of cross guarantee that are controlled by Vocus Group Limited, they also represent the ‘Extended Closed Group’.
The statement of profit or loss and other comprehensive income and statement of financial position of the ‘Extended Closed Group’ can be found in the consolidated statement of profit or loss and other comprehensive income and statement of financial position along with the note on Vocus Group Limited as parent found in these financial statements.
Set out below is a consolidated statement of profit or loss and other comprehensive income and statement of financial position of the ‘Closed Group’.
Statement of profit or loss and other comprehensive income2019
$’0002018
$’000
Revenue 1,641,795 1,625,551
Other gains and losses (4,551) (5,731)
Network and service delivery (943,570) (891,078)
Employee benefits expense (227,908) (201,397)
Depreciation and amortisation expense (242,523) (229,606)
Administration and other expenses (182,436) (205,260)
Net finance costs (53,110) (41,036)
Profit/(loss) before income tax expense (12,303) 51,443
Income tax expense 4,183 (17,490)
Profit/(loss) after income tax expense (8,120) 33,953
Other comprehensive income
Foreign currency translation 14,628 (7,933)
Net movement on hedging transactions, net of tax 3,694 8,113
Net movement on revaluation of equity instrument financial assets 342 (667)
Other comprehensive income for the year, net of tax 18,664 (487)
Total comprehensive income for the year 10,544 33,466
93
For
per
sona
l use
onl
y

NOTES TO THE FINANCIAL STATEMENTS (CONTINUED)
NOTE 33. DEED OF CROSS GUARANTEE (CONTINUED)
Statement of financial position2019
$’0002018
$’000
Current assets
Cash and cash equivalents 84,177 54,851
Trade and other receivables 144,305 140,188
Prepayments 25,076 33,147
Contract costs asset 20,386 54,895
Derivative financial instruments 6,767 8,772
Other 8,857 9,605
289,568 301,458
Non-current assets
Plant and equipment 1,758,325 1,617,377
Intangibles 2,016,502 2,096,656
Investments 180,656 180,656
Contract costs asset 8,160 15,521
Deferred tax 42,425 42,484
Other 19,011 12,762
4,025,079 3,965,456
Total assets 4,314,647 4,266,914
Current liabilities
Trade and other payables 211,159 248,380
Provisions 27,339 39,604
Deferred revenue 56,926 48,815
Income tax (1,505) 6,170
Borrowings 280,617 140,885
Derivative financial instruments 4,975 1,330
Other 2,915 (1,035)
582,426 484,149
Non-current liabilities
Provisions 27,454 32,192
Deferred revenue 145,867 159,925
Borrowings 1,062,137 1,041,457
Deferred tax 150,806 173,482
Derivative financial instruments 7,268 1,539
Other 11,485 10,409
1,405,017 1,419,004
Total liabilities 1,987,443 1,903,153
Net assets 2,327,204 2,363,761
Equity
Contributed equity 3,775,752 3,775,454
Reserves 29,458 16,061
Accumulated losses (1,478,006) (1,427,754)
Total equity 2,327,204 2,363,761
94
VOCUS GROUP Annual Report 2019
For
per
sona
l use
onl
y

NOTE 34. COMMITMENTS
Consolidated
2019 $’000
2018 $’000
Lease commitments – operating
The operating leases relate primarily to offices and data centre locations.
Committed at the reporting date but not recognised as liabilities, payable:
Within one year 23,523 25,777
One to five years 77,049 80,826
More than five years 68,587 88,733
169,159 195,336
Lease commitments – finance
Committed at the reporting date and recognised as liabilities, payable:
Within one year 4,573 5,440
One to five years 6,254 5,278
More than five years 11,662 12,120
Total commitment 22,489 22,838
Less: Future finance charges (6,994) (7,488)
Net commitment recognised as liabilities 15,495 15,350
Representing:
Lease liability – current (note 16) 3,682 4,478
Lease liability – non-current (note 17) 11,813 10,872
15,495 15,350
Backhaul IRU commitments – finance
Backhaul IRU commitments represent an indefeasible right to use (IRU) purchased to access NBN Points of Interconnect. The liability is accounted for as a finance lease and is payable in annual instalments over a six year period, whilst the asset is recorded as an intangible and amortised over its effective life.
Committed at the reporting date and recognised as liabilities, payable:
Within one year 6,406 7,700
One to five years 6,406 12,813
Total commitment 12,812 20,513
Less: Future finance charges (900) (1,835)
Net commitment recognised as liabilities 11,912 18,678
Representing:
Backhaul IRU liability – current (note 16) 5,811 6,766
Backhaul IRU liability – non-current (note 17) 6,101 11,912
11,912 18,678
95
For
per
sona
l use
onl
y

NOTES TO THE FINANCIAL STATEMENTS (CONTINUED)
NOTE 34. COMMITMENTS (CONTINUED)
Consolidated
2019 $’000
2018 $’000
Other financial commitments
Vocus has a financial commitment in relation to a 10 year contract for the outsourcing of sales and technical support, customer services and provisioning costs. The minimum future commitment is payable as follows:
Within one year 28,312 27,879
One to five years 66,304 72,216
More than five years 32,215 36,558
126,831 136,653
Fibre and network equipment (related to finance lease commitments)
Finance lease commitments includes contracted amounts for various network plant and equipment at the following values under finance leases expiring within one to five years. Under the terms of the leases, there is an option to acquire the leased assets for predetermined residual values on the expiry of the leases.
Fibre and Network equipment – at cost 34,368 30,123
Less: Accumulated depreciation (26,176) (17,908)
Written down value 8,192 12,215
Australia Singapore Cable
Capital commitment to build a 4,600km submarine cable system linking Australia to Singapore and Indonesia.
Within one year – 165,218
Purchase commitments – IRU capacity
The purchase commitments relate to the purchase programme for additional undersea cable capacity, announced on 19 February 2015. Capacity is allocated and paid in annual instalments over a six year period.
Committed at the reporting date but not recognised as assets or liabilities, payable:
Within one year 5,975 7,361
One to five years 4,850 10,825
10,825 18,186
NOTE 35. CONTINGENT LIABILITIES
Consolidated
2019 $’000
2018 $’000
Bank guarantees for operating leases 71,411 68,900
The bank guarantee/letter of credit facility was used to issue bank guarantees for property leases and other performance contracts and replaces the multi-option facility present in the prior year.
From time to time, the Group may be subject to litigation, regulatory actions, legal or arbitration proceedings and other contingent liabilities which, if they crystallise, may adversely affect the Group’s results. There are no proceedings ongoing at balance date, either individually or in aggregate, which are likely to have a material effect on the Group’s financial position.
96
VOCUS GROUP Annual Report 2019
For
per
sona
l use
onl
y

NOTE 36. OTHER SIGNIFICANT ACCOUNTING POLICIESThe principal accounting policies adopted in the preparation of the financial statements are set out either in the respective notes or below. These policies have been consistently applied to all the years presented, unless otherwise stated.
Certain comparative amounts in the statement of profit or loss and statement of financial position have been reclassified as a result of a change in classifications during the current year.
Principles of consolidationThe consolidated financial statements of Vocus comprise of the financial statements of Vocus Group Limited and it’s subsidiaries where it is determined that there is a capacity to control. Vocus controls an entity when it is exposed to, or has rights to, variable returns from its involvement with the entity and has the ability to affect those returns through its power to direct the activities of the entity. Subsidiaries are fully consolidated from the date on which control is transferred. They are de-consolidated from the date that control ceases.
Intercompany transactions, balances and unrealised gains on transactions between entities in Vocus are eliminated. Unrealised losses are also eliminated unless the transaction provides evidence of the impairment of the asset transferred. Accounting policies of subsidiaries have been changed where necessary to ensure consistency with the policies adopted by Vocus.
The acquisition of subsidiaries is accounted for using the acquisition method of accounting. A change in ownership interest, without the loss of control, is accounted for as an equity transaction, where the difference between the consideration transferred and the net asset value of the share of the non-controlling interest acquired is recognised directly in equity attributable to the parent.
Where Vocus loses control over a subsidiary, it derecognises the assets including goodwill, liabilities and non-controlling interest in the subsidiary together with any cumulative translation differences recognised in equity. Vocus recognises the fair value of the consideration received and the fair value of any investment retained together with any gain or loss in profit or loss.
Foreign currency translationThe financial statements are presented in Australian dollars, which is Vocus Group Limited’s functional and presentation currency.
Foreign currency transactionsForeign currency transactions are translated into Australian dollars using the exchange rates prevailing at the dates of the transactions. Foreign exchange gains and losses resulting from the settlement of such transactions and from the translation at financial year-end exchange rates of monetary assets and liabilities denominated in foreign currencies are recognised in profit or loss.
Foreign operationsThe assets and liabilities of foreign operations are translated into Australian dollars using the exchange rates at the reporting date. The revenues and expenses of foreign operations are translated into Australian dollars using the average exchange rates, which approximate the rates at the dates of the transactions, for the period. All resulting foreign exchange differences are recognised in other comprehensive income through the foreign currency reserve in equity.
The foreign currency reserve is recognised in profit or loss when the foreign operation or net investment is disposed of.
Estimation of useful lives of assetsThe estimated useful lives and related depreciation and amortisation charges for its property, plant and equipment and finite life intangible assets is determined by the Company. The useful lives could change significantly as a result of technical innovations or some other event. The depreciation and amortisation charge will increase where the useful lives are less than previously estimated lives, or technically obsolete or non-strategic assets that have been abandoned or sold will be written off or written down.
Current and non-current classificationAssets and liabilities are presented in the statement of financial position based on current and non-current classification.
An asset is classified as current when: it is either expected to be realised or intended to be sold or consumed in the Vocus’ normal operating cycle; it is held primarily for the purpose of trading; it is expected to be realised within 12 months after the reporting period; or the asset is cash or cash equivalent unless restricted from being exchanged or used to settle a liability for at least 12 months after the reporting period. All other assets are classified as non-current.
A liability is classified as current when: it is either expected to be settled in the Vocus’ normal operating cycle; it is held primarily for the purpose of trading; it is due to be settled within 12 months after the reporting period; or there is no unconditional right to defer the settlement of the liability for at least 12 months after the reporting period. All other liabilities are classified as non-current.
Investments and other Financial AssetsInvestments and other financial assets are initially measured at fair value. Transaction costs are included as part of the initial measurement, except for financial assets at fair value through profit or loss. They are subsequently measured at either amortised cost or fair value depending on their classification. Classification is determined based on the purpose of the acquisition and subsequent reclassification to other categories is restricted. The fair values of quoted investments are based on current bid prices. For unlisted investments, fair value is established by using valuation techniques. These include the use of recent arm’s length transactions, reference to other instruments that are substantially the same, discounted cash flow analysis, and option pricing models.
Financial assets are derecognised when the rights to receive cash flows from the financial assets have expired or have been transferred and Vocus has transferred substantially all the risks and rewards of ownership.
97
For
per
sona
l use
onl
y
NOTES TO THE FINANCIAL STATEMENTS (CONTINUED)
NOTE 36. OTHER SIGNIFICANT ACCOUNTING POLICIES (CONTINUED)
Financial assets at fair value through profit or lossFinancial assets not measured at amortised cost or at fair value through other comprehensive income are classified as financial assets at fair value through profit or loss.
Impairment of financial assets at amortised costVocus assesses at the end of each reporting period whether there is any objective evidence that a financial asset or group of financial assets is impaired. Objective evidence includes significant financial difficulty of the issuer or obligor; a breach of contract such as default or delinquency in payments; the lender granting to a borrower concessions due to economic or legal reasons that the lender would not otherwise do; it becomes probable that the borrower will enter bankruptcy or other financial reorganisation; the disappearance of an active market for the financial asset; or observable data indicating that there is a measurable decrease in estimated future cash flows.
Where there has not been a significant increase in exposure to credit risk since initial recognition, a 12-month expected credit loss allowance is estimated. This represents a portion of the asset’s lifetime expected credit losses that is attributable to a default event that is possible within the next 12 months. Where a financial asset has become credit impaired or where it is determined that credit risk has increased significantly, the loss allowance is based on the asset’s lifetime expected credit losses. The amount of expected credit loss recognised is measured on the basis of the probability weighted present value of anticipated cash shortfalls over the life of the instrument discounted at the original effective interest rate.
For financial assets measured at fair value through other comprehensive income, the loss allowance is recognised within other comprehensive income. In all other cases, the loss allowance is recognised in profit or loss.
Contract costs assetCosts directly attributable to obtaining subscribers are capitalised pursuant to AASB 15 Revenue from contracts with customers. Costs are capitalised when directly attributable to acquiring a new customer. The costs include the provision of commissions paid to internal sales personnel. Costs are amortised over the average expected term of the customer contract, generally being between 12 and 36 months.
LeasesThe determination of whether an arrangement is or contains a lease is based on the substance of the arrangement and requires an assessment of whether the fulfilment of the arrangement is dependent on the use of a specific asset or assets and the arrangement conveys a right to use the asset.
A distinction is made between finance leases, which effectively transfer from the lessor to the lessee substantially all the risks and benefits incidental to the ownership of leased assets, and operating leases, under which the lessor effectively retains substantially all such risks and benefits.
Finance leases are capitalised. A lease asset and liability are established at the fair value of the leased assets, or if lower, the present value of minimum lease payments. Lease payments are allocated between the principal component of the lease liability and the finance costs, so as to achieve a constant rate of interest on the remaining balance of the liability.
Leased assets acquired under a finance lease are depreciated over the asset’s useful life or over the shorter of the asset’s useful life and the lease term if there is no reasonable certainty that Vocus will obtain ownership at the end of the lease term.
Operating lease payments, net of any incentives received from the lessor, are charged to profit or loss on a straight-line basis over the term of the lease.
Goods and Services Tax (GST) and other similar taxesRevenues, expenses and assets are recognised net of the amount of associated GST, unless the GST incurred is not recoverable from the tax authority. In this case it is recognised as part of the cost of the acquisition of the asset or as part of the expense.
Receivables and payables are stated inclusive of the amount of GST receivable or payable. The net amount of GST recoverable from, or payable to, the tax authority is included in other receivables or other payables in the statement of financial position.
Cash flows are presented on a gross basis. The GST components of cash flows arising from investing or financing activities which are recoverable from, or payable to the tax authority, are presented as operating cash flows.
Commitments and contingencies are disclosed net of the amount of GST recoverable from, or payable to, the tax authority.
Rounding of amountsThe Company is of a kind referred to in Corporations Instrument 2016/191, issued by the Australian Securities and Investments Commission, relating to ‘rounding-off’. Amounts in this report have been rounded off in accordance with that Corporations Instrument to the nearest thousand dollars, or in certain cases, the nearest dollar.
New, revised or amending Accounting Standards and Interpretations adoptedVocus has adopted all of the new, revised or amending Accounting Standards and Interpretations issued by the Australian Accounting Standards Board (AASB) that are mandatory for the current reporting period. There were no significant impacts other than those disclosed for AASB 15 and AASB 9.
Any new, revised or amending Accounting Standards or Interpretations that are not yet mandatory have not been early adopted.
98
VOCUS GROUP Annual Report 2019
For
per
sona
l use
onl
y

New Accounting Standards and Interpretations not yet mandatory or early adopted
AASB 16 LeasesThe Group will first apply the new leasing standard on its mandatory adoption date of 1 July 2019. AASB 16 Leases will replace AASB 117 Leases, IFRIC 4 Determining whether an arrangement contains a lease, SIC–15 Operating Leases – Incentives; and SIC–27 Evaluating the Substance of Transactions Involving the Legal Form of a Lease.
AASB 16 will introduce a single, on-balance sheet lease accounting model for all leases where the Group is the lessee. This means leases will no longer be classified as either operating or finance leases for the lessee – effectively treating all leases as finance leases. A lessee will recognise a right-of-use asset, which represents its right to use the underlying asset, and a lease liability, which represents its obligation to make future lease payments. The standard also includes recognition exemptions for short-term leases and leases of low-value items. Lessor accounting remains largely unchanged from the current accounting.
The Group has elected to apply the modified retrospective transition approach. This means that the cumulative effect of adopting AASB 16 will be recognised as an adjustment to the opening balance of retained earnings at 1 July 2019, with no restatement of comparative information. The Group intends to apply the practical expedient to grandfather the definition of a lease on transition. This means that it will apply AASB 16 to all contracts entered into before 1 July 2019 which were assessed to contain leases in accordance with AASB 117 and IFRIC 4.
Leases in which the Group is a lessee The Group will recognise right of use assets and lease liabilities for leases previously accounted for as operating except where it will applies the practical exemption to not apply AASB 16 for leases of low value assets. Management consider low value assets as those assets valued at less than $10,000, with the low value assessment based on the fair value of the asset as new. On transition lease liabilities will be recognised at the present value of the remaining lease payments discounted at the Group’s incremental borrowing rate as at 1 July 2019. Under the modified retrospective transition approach, the Group will elect to recognise the right of use assets at an amount equal to the lease liability.
Based on the information currently available, the Group estimates that it will recognise additional right of use assets of between $125,000,000 and $135,000,000 and lease liabilities of between $125,000,000 million and $135,000,000 as at 1 July 2019 in relation to existing operating leases. However, this estimate change following the completion of the adoption procedures.
Previously, operating lease expense was recognised on a straight-line basis over the term of the lease. The nature of expenses related to those leases will now change because the Group will recognise a depreciation charge for its right-of-use assets and interest expense on its lease liabilities.
Following the adoption of AASB 16, the Group’s operating profit will improve, whilst its depreciation expense and interest expense will due to the change in the accounting treatment for leases that were classified as operating leases under AASB 117. Based on the information currently available, the Group estimates an increase in earnings before interest, tax, depreciation and amortisation of between $25,000,000 and $30,000,000. However, this estimate may change following the completion of the adoption procedures.
Leases in which the Group is a lessor The Group does not expect a significant financial impact for leases in which the Group is a lessor. Under AASB 16, these leases will continue to be assessed as either operating or financing leases. The Group will recognise rental income on a straight line basis for operating leases where it is the lessor.
99
For
per
sona
l use
onl
y
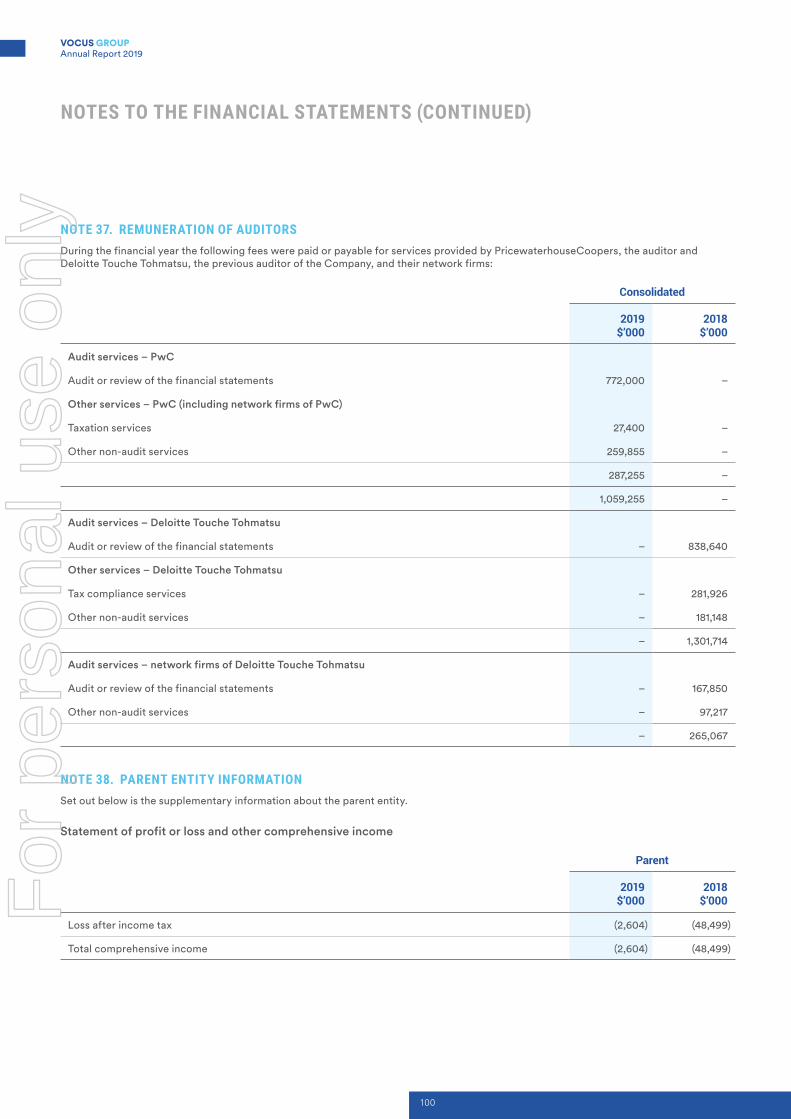
NOTES TO THE FINANCIAL STATEMENTS (CONTINUED)
NOTE 37. REMUNERATION OF AUDITORSDuring the financial year the following fees were paid or payable for services provided by PricewaterhouseCoopers, the auditor and Deloitte Touche Tohmatsu, the previous auditor of the Company, and their network firms:
Consolidated
2019 $’000
2018 $’000
Audit services – PwC
Audit or review of the financial statements 772,000 –
Other services – PwC (including network firms of PwC)
Taxation services 27,400 –
Other non-audit services 259,855 –
287,255 –
1,059,255 –
Audit services – Deloitte Touche Tohmatsu
Audit or review of the financial statements – 838,640
Other services – Deloitte Touche Tohmatsu
Tax compliance services – 281,926
Other non-audit services – 181,148
– 1,301,714
Audit services – network firms of Deloitte Touche Tohmatsu
Audit or review of the financial statements – 167,850
Other non-audit services – 97,217
– 265,067
NOTE 38. PARENT ENTITY INFORMATIONSet out below is the supplementary information about the parent entity.
Statement of profit or loss and other comprehensive income
Parent
2019 $’000
2018 $’000
Loss after income tax (2,604) (48,499)
Total comprehensive income (2,604) (48,499)
100
VOCUS GROUP Annual Report 2019
For
per
sona
l use
onl
y

Statement of financial position
Parent
2019 $’000
2018 $’000
Total current assets 2,187 99
Total assets 2,286,749 2,336,213
Total current liabilities 1,683 53,751
Total liabilities 2,289 56,995
Equity
Contributed equity 3,775,752 3,775,454
Share-based payments reserve 22,103 17,018
Other reserves 104 (2,360)
Accumulated losses (1,513,499) (1,510,894)
Total equity 2,284,460 2,279,218
Guarantees entered into by the parent entity in relation to the debts of its subsidiariesThe Parent Entity is a party to a deed of cross guarantee (refer Note 33) under which it guarantees the debts of its subsidiaries as at 30 June 2019 and 30 June 2018.
Capital commitments – Property, plant and equipmentThe Parent Entity had no capital commitments for property, plant and equipment at as 30 June 2019 and 30 June 2018.
Significant accounting policiesThe accounting policies of the Parent Entity are consistent with those of Vocus, as disclosed in these notes to these financial statements.
NOTE 39. RELATED PARTY TRANSACTIONS
Parent entityVocus Group Limited is the parent entity.
SubsidiariesInterests in subsidiaries are set out in note 32.
Key management personnelDisclosures relating to key management personnel are set out in note 31 and the remuneration report included in the Directors’ report.
Transactions with related partiesThere were no transactions with related parties during the current and previous financial year.
NOTE 40. EVENTS AFTER THE REPORTING PERIODNo matter or circumstance has arisen since 30 June 2019 that has significantly affected, or may significantly affect the Vocus’s operations, the results of those operations, or the Vocus’s state of affairs in future financial years.
101
For
per
sona
l use
onl
y

In the Directors’ opinion:
|| the attached financial statements and notes comply with the Corporations Act 2001, the Accounting Standards, the Corporations Regulations 2001 and other mandatory professional reporting requirements;
|| the attached financial statements and notes comply with International Financial Reporting Standards as issued by the International Accounting Standards Board as described in note 2 to the financial statements;
|| the attached financial statements and notes give a true and fair view of the Vocus’s financial position as at 30 June 2019 and of its performance for the financial year ended on that date;
|| there are reasonable grounds to believe that the Company will be able to pay its debts as and when they become due and payable; and
|| at the date of this declaration, there are reasonable grounds to believe that the members of the Extended Closed Group will be able to meet any obligations or liabilities to which they are, or may become, subject by virtue of the deed of cross guarantee described in note 33 to the financial statements.
The Directors have been given the declarations required by section 295A of the Corporations Act 2001.
Signed in accordance with a resolution of Directors made pursuant to section 295(5)(a) of the Corporations Act 2001.
On behalf of the Directors
Robert Mansfield Non-Executive, Chairman
22 August 2019
Sydney
DIRECTORS’ DECLARATION
102
VOCUS GROUP Annual Report 2019
For
per
sona
l use
onl
y
PricewaterhouseCoopers, ABN 52 780 433 757 One International Towers Sydney, Watermans Quay, Barangaroo, GPO BOX 2650, SYDNEY NSW 2001 T: +61 2 8266 0000, F: +61 2 8266 9999, www.pwc.com.au Level 11, 1PSQ, 169 Macquarie Street, Parramatta NSW 2150, PO Box 1155 Parramatta NSW 2124 T: +61 2 9659 2476, F: +61 2 8266 9999, www.pwc.com.au
Liability limited by a scheme approved under Professional Standards Legislation. 92
Independent auditor’s report To the members of Vocus Group Limited
Report on the audit of the financial report
Our opinion
In our opinion: The accompanying financial report of Vocus Group Limited (the Company) and its controlled entities (together the Group) is in accordance with the Corporations Act 2001, including:
• giving a true and fair view of the Group’s financial position as at 30 June 2019 and of its financial performance for the year then ended
• complying with Australian Accounting Standards and the Corporations Regulations 2001.
What we have audited The Group financial report comprises:
• the statement of financial position as at 30 June 2019 • the statement of changes in equity for the year then ended • the statement of cash flows for the year then ended • the statement of profit or loss and other comprehensive income for the year then ended • the notes to the financial statements, which include a summary of significant accounting policies • the directors’ declaration.
Basis for opinion We conducted our audit in accordance with Australian Auditing Standards. Our responsibilities under those standards are further described in the Auditor’s responsibilities for the audit of the financial report section of our report. We believe that the audit evidence we have obtained is sufficient and appropriate to provide a basis for our opinion.
Independence We are independent of the Group in accordance with the auditor independence requirements of the Corporations Act 2001 and the ethical requirements of the Accounting Professional and Ethical Standards Board’s APES 110 Code of Ethics for Professional Accountants (the Code) that are relevant to our audit of the financial report in Australia. We have also fulfilled our other ethical responsibilities in accordance with the Code.
INDEPENDENT AUDITOR’S REPORT
103
For
per
sona
l use
onl
y

INDEPENDENT AUDITOR’S REPORT (CONTINUED)
93
Our audit approach An audit is designed to provide reasonable assurance about whether the financial report is free from material misstatement. Misstatements may arise due to fraud or error. They are considered material if individually or in aggregate, they could reasonably be expected to influence the economic decisions of users taken on the basis of the financial report. We tailored the scope of our audit to ensure that we performed enough work to be able to give an opinion on the financial report as a whole, taking into account the geographic and management structure of the Group, its accounting processes and controls and the industry in which it operates.
Materiality
• For the purpose of our audit we used overall Group materiality of $8.75 million which represents approximately 2.5% of the Group’s earnings before interest, tax, depreciation and amortisation (EBITDA).
• We applied this threshold, together with qualitative considerations, to determine the scope of our audit and the nature, timing and extent of our audit procedures and to evaluate the effect of misstatements on the financial report as a whole.
• We chose Group EBITDA because, in our view, it is the benchmark against which the performance of the Group is most commonly measured. We utilised a 2.5% threshold based on our professional judgement, noting it is within the range of commonly acceptable thresholds.
Audit Scope
• Our audit focused on where the Group made subjective judgements; for example, significant accounting estimates involving assumptions and inherently uncertain future events.
• The Group comprises businesses operating predominately in Australia and New Zealand with the most financially significant operations being Vocus Network Services, Retail and New Zealand.
• Our team from the Australian PwC firm (“Group audit team”) undertook all audit procedures to provide us with sufficient and appropriate audit evidence to express an opinion on the Group’s financial report as a whole.
104
VOCUS GROUP Annual Report 2019
For
per
sona
l use
onl
y

94
Key audit matters Key audit matters are those matters that, in our professional judgement, were of most significance in our audit of the financial report for the current period. The key audit matters were addressed in the context of our audit of the financial report as a whole, and in forming our opinion thereon, and we do not provide a separate opinion on these matters. Further, any commentary on the outcomes of a particular audit procedure is made in that context. We communicated the key audit matters to the Audit and Risk Committee.
Key audit matter How our audit addressed the key audit matter
Estimated recoverable amount of goodwill and indefinite life intangibles (Refer to note 14) $1,646,765,000
The Group recognises assets for goodwill and indefinite life intangibles in respect of its brand names.
Under Australian Accounting Standards, the Group is required to test the goodwill and indefinite lived intangible assets annually for impairment, irrespective of whether there are indications of impairment. This assessment is inherently complex and judgemental, and requires judgement by the Group in forecasting the operational cash flows and capital expenditure of the cash generating units of the Group, and determining discount rates and growth rates used in the discounted cash flow models used to assess impairment (the models).
The recoverable amount of goodwill and other indefinite life intangible assets was a key audit matter given the:
- financial significance of the intangible assets to the statement of financial position; and
- judgement applied by the Group in completing the impairment assessment.
We focused our efforts on developing an understanding and testing the overall calculation and methodology of the Group’s impairment assessment, including identification of the cash generating units of the Group for the purposes of impairment testing, and the attribution of net assets, revenues and costs to those components.
In obtaining sufficient, appropriate audit evidence, our procedures included, amongst others:
- assessing the cash flow forecasts included in the models with reference to historical earnings and Board approved forecasts
- testing the mathematical calculations within the models
- assessing the terminal value growth rates by comparing to external information sources;
- assessing the reasonableness of the discount rates by comparing them to market data and comparable companies, with the assistance of our valuation specialists
- performing sensitivity analysis over the key assumptions used in the models
- evaluating the related financial statement disclosures for consistency with Australian Accounting Standards requirements.
Revenue from operations (Refer to note 5) $1,892,296,000
The Group adopted a new revenue accounting policy during the year due to the mandatory introduction of AASB 15 Revenue for Contracts with Customers. The new policy is disclosed in Note 5.
In obtaining sufficient, appropriate audit evidence, our procedures included, amongst others:
- consideration and assessment of the Group’s revised accounting policy in line with the requirements of AASB 15 Revenue from Contracts with Customers
105
For
per
sona
l use
onl
y

INDEPENDENT AUDITOR’S REPORT (CONTINUED)
95
The recognition of Revenue from operations was a key audit matter given the:
• financial significance of revenue from operations to the statement of profit or loss and other comprehensive income; and
• complexity of contractual arrangements and diversity of products and services.
- testing, for a sample of customer contracts, whether revenue had been recorded at the correct amount and in the correct financial period, in accordance with the Group’s revenue recognition policy. This included assessing whether:
o evidence of an underlying arrangement with the customer existed
o appropriate performance obligations and consideration had been identified
o amounts allocated to the performance obligations were made with reference to their standalone selling prices, where relevant; and
o the timing of revenue recognition had been appropriately considered and recognised at the appropriate time
- evaluating the related financial statement disclosures for consistency with Australian Accounting Standards requirements.
Other information
The directors are responsible for the other information. The other information comprises the information included in the annual report for the year ended 30 June 2019, but does not include the financial report and our auditor’s report thereon. Prior to the date of this auditor's report, the other information we obtained included the Director's report. We expect the remaining other information to be made available to us after the date of this auditor's report. Our opinion on the financial report does not cover the other information and we do not and will not express an opinion or any form of assurance conclusion thereon.
In connection with our audit of the financial report, our responsibility is to read the other information and, in doing so, consider whether the other information is materially inconsistent with the financial report or our knowledge obtained in the audit, or otherwise appears to be materially misstated.
If, based on the work we have performed on the other information that we obtained prior to the date of this auditor’s report, we conclude that there is a material misstatement of this other information, we are required to report that fact. We have nothing to report in this regard.
When we read the other information not yet received, if we conclude that there is a material misstatement therein, we are required to communicate the matter to the directors and use our professional judgement to determine the appropriate action to take.
Responsibilities of the directors for the financial report The directors of the Company are responsible for the preparation of the financial report that gives a true and fair view in accordance with Australian Accounting Standards and the Corporations Act 2001 and for such internal control as the directors determine is necessary to enable the preparation of the financial report that gives a true and fair view and is free from material misstatement, whether due to fraud or error.
In preparing the financial report, the directors are responsible for assessing the ability of the Group to continue as a going concern, disclosing, as applicable, matters related to going concern and using the going concern basis of
106
VOCUS GROUP Annual Report 2019
For
per
sona
l use
onl
y

96
accounting unless the directors either intend to liquidate the Group or to cease operations, or have no realistic alternative but to do so.
Auditor’s responsibilities for the audit of the financial report Our objectives are to obtain reasonable assurance about whether the financial report as a whole is free from material misstatement, whether due to fraud or error, and to issue an auditor’s report that includes our opinion. Reasonable assurance is a high level of assurance, but is not a guarantee that an audit conducted in accordance with the Australian Auditing Standards will always detect a material misstatement when it exists. Misstatements can arise from fraud or error and are considered material if, individually or in the aggregate, they could reasonably be expected to influence the economic decisions of users taken on the basis of the financial report.
A further description of our responsibilities for the audit of the financial report is located at the Auditing and Assurance Standards Board website at: http://www.auasb.gov.au/auditors_responsibilities/ar1.pdf. This description forms part of our auditor's report.
Report on the remuneration report
Our opinion on the remuneration report We have audited the remuneration report included in pages 7 to 21 of the directors’ report for the year ended 30 June 2019.
In our opinion, the remuneration report of Vocus Group Limited for the year ended 30 June 2019 complies with section 300A of the Corporations Act 2001.
Responsibilities The directors of the Company are responsible for the preparation and presentation of the remuneration report in accordance with section 300A of the Corporations Act 2001. Our responsibility is to express an opinion on the remuneration report, based on our audit conducted in accordance with Australian Auditing Standards.
PricewaterhouseCoopers
Mark Dow Sydney Partner 22 August 2019
107
For
per
sona
l use
onl
y

Additional information required by the Australian Securities Exchance Ltd listing rules and not shown elsewhere in this report is as follows. This information is current as at 30 August 2019.
(a) Distribution of equity holders of securities
(i) Ordinary share capital620,571,174 fully paid ordinary shares are held by 25,620 shareholders
Range Total holders Units % Units
1 – 1,000 10030 4,388,895 0.71
1,001 – 5,000 10181 26,279,906 4.23
5,001 – 10,000 3060 22,324,942 3.6
10,001 – 100,000 2215 50,606,636 8.15
100,001 Over 134 516,970,795 83.31
Rounding 0
Total 25620 620,571,174 100
Unmarketable ParcelsMinimum
Parcel Size Holders Units
Minimum $500.00 parcel at $3.24 per unit 155 1,794 127,500
(b) Substantial holders
Substantial holders at 30 August 2019 were:
Janchor Partners Limited 17.9%*
Greencape Capital Pty Ltd 5.69%
Challenger Limited 7.09%
Dimensional Fund Advisors 5.008%
Goldman Sachs Group 5.4300%
* Janchor owns a 17.9% interest in Vocus (constituted by a relevant interest of 9.24% of Vocus’ voting shares and an economic interest through cash settled equity derivatives in a further 8.66%).
ASX ADDITIONAL INFORMATION
108
VOCUS GROUP Annual Report 2019
For
per
sona
l use
onl
y

(c) Twenty Largest ShareholdersNames of the 20 largest shareholders of Vocus ordinary shares and the percentage of capital each holds:
Rank Name Units % Units
1 HSBC CUSTODY NOMINEES (AUSTRALIA) LIMITED 133,008,875 21.43
2 CITICORP NOMINEES PTY LIMITED 109,487,107 17.64
3 J P MORGAN NOMINEES AUSTRALIA PTY LIMITED 81,037,240 13.06
4 HSBC CUSTODY NOMINEES (AUSTRALIA) LIMITED-GSCO ECA 42,921,792 6.92
5 NATIONAL NOMINEES LIMITED 30,269,286 4.88
6 MERRILL LYNCH (AUSTRALIA) NOMINEES PTY LIMITED 17,480,060 2.82
7 HSBC CUSTODY NOMINEES (AUSTRALIA) LIMITED – A/C 2 14,458,619 2.33
8 BNP PARIBAS NOMS PTY LTD <DRP> 10,324,410 1.66
9 BNP PARIBAS NOMINEES PTY LTD <AGENCY LENDING DRP A/C> 8,738,236 1.41
10 HSBC CUSTODY NOMINEES (AUSTRALIA) LIMITED <NT-COMNWLTH SUPER CORP A/C> 6,269,834 1.01
11 ARGO INVESTMENTS LIMITED 5,652,447 0.91
12 TEFIG PTY LTD <AJ ABERCROMBIE S/FUND A/C> 5,342,835 0.86
13 THE ABERCROMBIE GROUP PTY LTD <THE PHILADELPHIA A/C> 4,657,165 0.75
14 BNP PARIBAS NOMINEES PTY LTD <AGENCY LENDING COLLATERAL> 4,005,000 0.65
15 CITICORP NOMINEES PTY LIMITED <COLONIAL FIRST STATE INV A/C> 2,053,951 0.33
16 UBS NOMINEES PTY LTD 1,808,760 0.29
17 WARBONT NOMINEES PTY LTD <UNPAID ENTREPOT A/C> 1,715,173 0.28
18 ACQUIRE BPO PTY LTD 1,502,469 0.24
19 DENNIS N BASHEER SUPERANNUATION PTY LTD <DENNIS N BASHEER S/F A/C> 1,393,630 0.22
20 AMP LIFE LIMITED 1,372,784 0.22
Totals: Top 20 holders of ORDINARY FULLY PAID SHARES (Total) 483,499,673 77.91
Total Remaining Holders Balance 137,071,501 22.09
Voting Rights – Ordinary SharesBy virtue of the Company’s Constitution, outlined in Clause 34, voting rights for ordinary shares are:
a) on a show of hands, each member has one vote;
b) (subject to section 250L(4)) on a poll, each member has:
i) for each fully paid share held by the member, one vote; and
ii) for each partly-paid share held by the member, a fraction of a vote equivalent to the proportion which the amount paid (not credited nor paid in advance of a call) is of the total amounts paid and payable (excluding amounts credited) for the share.
Restricted SecuritiesAt 31 June 2019, Vocus had 556,621 shares (purchased by and gifted to team members) held in escrow, per the terms of the Vocus Communications Limited Employee Share Plan (Salary Sacrifice) and Vocus Communications Employee Share Grant ($1000).
On-Market Buy-BackThere is no on-market share buy-back in operation.
109
For
per
sona
l use
onl
y
VOCUS GROUP LIMITEDACN 084 115 499 ABN 96 084 115 499
REGISTERED OFFICELevel 10, 452 Flinders Street Melbourne VIC 3000
Telephone: 03 9923 3000 Facsimile: 03 9674 6599
INVESTOR RELATIONSInvestor Relations queries can be directed to:
Investor Relations Level 10, 452 Flinders Street Melbourne VIC 3000
Telephone: 03 9923 3000
Email: [email protected] Website: www.vocusgroup.com.au
STOCK EXCHANGEVocus is listed on the Australian Securities Exchange Ltd (ASX) under the Issuer code: VOC
SHARE REGISTRYComputershare Investor Services Pty Limited Level 4, 60 Carrington Street Sydney NSW 2000
Ph: 1300 850 505 (for callers within Australia) and +61 3 9415 4000 (for callers outside Australia)
To view or update your holding details online, please go to www.investorcentre.com
DIRECTORSBob Mansfield Non-Executive Chairman David Wiadrowski Non-Executive Director John Ho Non-Executive Director Julie Fahey Non-Executive Director Bruce Akhurst Non-Executive Director Matthew Hanning Non-Executive Director Mark Callander Executive Director & Chief Executive – New Zealand Kevin Russell Group Managing Director & CEO
Company Secretary Ashe-lee Jegathesan
Group CFO Mark Wratten
AUDITORPricewaterhouse Coopers 1 International Towers Sydney Watermans Quay, Barangaroo Sydney NSW 2001
CORPORATE DIRECTORY
110
VOCUS GROUP Annual Report 2019
For
per
sona
l use
onl
y

www.colliercreative.com.au #VCG0004
For
per
sona
l use
onl
y

vocusgroup.com.au
Vocus Group | A
nnual Rep
ort 2019
For
per
sona
l use
onl
y