vocus group annual report 2017 operating and...
TRANSCRIPT

Vocus Group Annual Report 2017 27
Operating and Financial Review
1. Group operating performance
1.1 Overview of Operations
Vocus Group Limited (ASX: VOC) (Vocus) is a vertically integrated telecommunications service provider, operating in the Australian and New Zealand markets. The Company owns an extensive national infrastructure network of metro and back haul fibre connecting all capital cities and most regional centres across Australia and New Zealand. Vocus’ infrastructure now connects directly to more than 5,000 buildings, and 70 data centres in Australia and New Zealand. Vocus now offers both consumer and wholesale NBN services through all 121 NBN points of interconnect and 100% coverage of the UFB network in New Zealand. Vocus listed on the ASX in 2010.
Vocus owns a portfolio of brands targeting the enterprise, small business, government and residential market segments across Australia and New Zealand. Vocus also operates in the wholesale market providing high performance, high availability and highly scalable communications solutions which allow service providers to quickly and easily deploy new services for their own customer base.
1.2 Earnings Overview
Twelve months ended 30 June ($’m) 2016 2017 % chg
Statutory Revenue and Other income 829.9 1,820.6 119
Underlying EBITDA1 2 215.6 366.4 70
Statutory EBITDA 194.1 335.5 73
Underlying EBIT3 4 170.2 260.2 53
Statutory EBIT3 116.5 141.9 22
Underlying NPAT 5 6 after minority interests 101.7 152.3 50
Statutory NPAT 6 after minority interests 64.1 (1,464.9) n/m8
Diluted earnings per share – (¢) 18.6 (237.65) n/m8
Fully Diluted Underlying EPS (¢)5 29.5 24.7 (17)
Final dividend per share (¢) 8.0 – (100)
Full year dividend per share (¢)7 15.6 6.0 (62)
1. Pre significant items and below the line costs of $30.9m ($20.7m costs in FY16)2. EBITDA refers to earnings before net financing costs, depreciation and amortisation and tax,3. Statutory EBIT refers to earnings before net financing costs, impairment costs and tax4. Pre significant items costs of $118.3m (costs of $53.8m in FY17)5. Pre significant items costs of $1,617.2m (pre significant costs of $37.6m in FY17)6. NPAT refers to net profit after tax7. FY16 does not include the special dividend of 1.9cps paid in April 20168. N/M – not meaningful
Vocus is managed from a financial and operational perspective as three business divisions.
Enterprise & Wholesale Australia
Provides telecommunications products and services to the enterprise, small business (includes the Commander SMB business) and wholesale segments of the Australian market including all levels of Government. The Division markets its services under the Vocus Communications brand. Services include Fibre & Ethernet, IP transit, voice and data centre and cloud services. For further information on the strategy, business risks and financial performance of the division please refer to Section 2.1
Consumer Australia
This division focuses predominantly on the value end of the consumer market offering a range of telecommunications products and services including broadband data, fixed voice and mobile services. Go to market brands are dodo™ and iPrimus. The division has entered the consumer power and gas market through the dodo™ and Commander power and gas brands. For further information on the strategy and financial performance of the division please refer to Section 2.2
New Zealand
This division operates across all key segments of the market in New Zealand including Business, Government, Wholesale and Consumer. In Business, Government and Wholesale the division’s key brand is Vocus Communications. The key Consumer brands are Slingshot and Orcon. The New Zealand business is run as a separate business to Australia and includes all New Zealand overhead and network related costs. For further information on the strategy and financial performance of the division please refer to Section 2.3

28 Operating and Financial Review
Operating and Financial Review
1. Group operating performance (continued)
FY17 Proforma Divisional Earnings Split
Enterprise & Wholesale AustraliaConsumer AustraliaNew Zealand
17%
42%
41%
15%
16%
69%
FY17 Proforma¹ Revenue Split by Division
FY17 Proforma¹ Underlying EBITDA Split by Division
17%
42%
41%
15%
16%
69%
Vocus’ Group Services function includes the Australian Network & Technology function that manages the Group’s Australian infrastructure and IT assets. The function also includes Australian Head Office activities such as commercial arrangements with third party carriers and shared services such as finance, legal, secretariat and human resources. The Australian head office function includes the costs associated with being an ASX listed company and the costs associated with the recently established Transformation Office.
1.3 Strategic Objective
Vocus’ strategic objective is to be the leading alternative provider of secure, resilient telecommunications connectivity in the Australian and New Zealand market. The Company will look to grow its share of key market segments through the pursuit of measurably superior levels of customer service, while focusing on maintaining its efficient cost base advantage; ensuring competitive outcomes for customers and improved returns for shareholders.
Specifically Vocus’ key business objectives are:
– Connectivity is the core, disciplined investment in our fibre network
– Leverage the expanded infrastructure platform and take share
‐ Take advantage of the roll out of the NBN and UFB and continue market share gains
‐ Leverage the Company’s expanded sales platform and product set in the enterprise and government markets
‐ Focus on winning a great share of every customers wallet
– Focus on house of brands strategy that talk very clearly to our target market segments
– Be the Most Loved Telco
‐ Simplify our products and processes through automation
‐ Put the customer in control with self help
‐ Leverage our data to create actionable customer insights
– Grow Shareholder Returns
‐ Drive our transformation program to achieve operational efficiencies safeguarding the business from competitive forces
‐ Manage working capital effectively, ensure ownership and responsibility sits within the business
‐ Appropriately allocate financial and human capital across the business to ensure that investment and effort is dedicated to Group wide priorities and that resources are managed effectively
In delivering on the Company’s strategic objectives it remains focused on aligning with its core values:
– Live the values and create a great place to work. Vocus’ values are unconventional developed by the senior leadership team to establish an environment conducive to achieve the goal to become a Top 10 great place to work. The key values are:
‐ Clever Company no Muppets – we are awesome people with a great attitude unleashed and empowered to do our jobs
‐ Have a Crack – we detest bureaucracy, we collaborate to find a smarter way, we take risks, we act decisively and we celebrate our wins
‐ Don’t screw the Customer – we put ourselves in the customers shoes, we make it easy to buy and easy to use
‐ Don’t be a d!@khead – we respect each other, we value relationships and we have the hard conversations
1.4 Key Opportunities and Business Risks
Key Opportunities
The rapidly changing telecommunications environment in Australia and New Zealand, driven in part by regulatory changes and in part by technological advancements and innovation, is creating a myriad of growth opportunities for a challenger telco to take share in markets that are still largely dominated by the incumbents. Innovation and technological advancements driving the rapid growth in demand for secure high speed data connectivity, both in the consumer and the enterprise market, are expected to continue to drive the underlying market growth for bandwidth at rates well above GDP growth. These conditions are expected to create opportunities for Vocus to grow its business, gain the benefits of scale and improve its market share.

Vocus Group Annual Report 2017 Operating and Financial Review 29
1.4 Key Opportunities and Business Risks (continued)
Specifically some of the broad trends creating opportunities for Vocus include:
1. Shift from Copper to Fibre – The shift from copper to fibre in the “last mile” customer access network in both Australia and New Zealand is driving a significant opportunity to win customers over the next 2-3 years. This shift is being pushed by Federal Governments in both countries keen to deliver the benefits that access to a high speed ubiquitous broadband platform can deliver in areas such as health and education. Consumer demand is driving uptake as the demand for faster more reliable broadband to facilitate activities such as interactive gaming, live streaming and IoT applications is starting to accelerate. Vocus’ consumer brands are well positioned to increase market share above existing copper broadband levels as the migration occurs. In this environment Vocus will compete on a level playing field with the other carriers in terms of margin, improving its competitive position and protecting it to an extent from price erosion.
2. The shift from on premise to off premise/cloud computing – The shift by the Enterprise market to cloud computing is driving the increasing demand for secure resilient connectivity creating opportunities for Vocus to leverage its infrastructure platform.
3. Growth in demand for upgraded network security systems – Cyber security threats are becoming an increasing concern in the Wholesale, Enterprise & Government market segments. Requirements for improved security protocols and systems is resulting in an increase in resources and focus directed to this area. The completion of the Nextgen acquisition in October 2016 delivers Vocus a competitive network footprint in the Australian market. Vocus is now well placed to meet the growing requirements for Enterprise, Wholesale and Government organisations for highly secure, reliable connectivity and redundancy both in the domestic market and meeting their needs for connection with international markets.
4. The benefits of scale built through recent acquisitions – The recent acquisition of Nextgen delivers Vocus the back haul infrastructure to create an end to end telecommunications network in Australia which rivals the incumbents. The network enables the Enterprise & Wholesale division to compete more effectively for contracts in the Large Enterprise, Wholesale and Government sectors opening up significant opportunities to grow market share in these market segments.
5. Technological Advancement – Significant advancements in software and the customers desire to self-serve and problem shoot should drive material improvements in the ability of the Company to lower the cost of customer acquisition and service across all segments of the market;
– The evolution of wireless technology over the next five years, in particular towards 5G technology, is expected to also drive increased need for fibre to connect base stations. This could open up additional opportunities to increase capacity utilisation on Vocus’ fibre network.
Key Risks
The following information sets out the major Group-wide risks. The risks below do not include generic macro related risks that could impact the Australian economy and they do not include specific financial risks which are identified in the commentary around the financial performance of the Company. All of the risks identified below could have a material impact on the value of the Company’s brands and its reputation in the market. Vocus seeks to mitigate the potential impact of these risks through the effective management of and engagement with its key stakeholder base; an ongoing focus on its cost base and transformation program; and ensuring that it has effective systems and procedures in place to manage the business on a day-to-day basis and address the strategic issues and challenges that may impact the business over the medium term. The risks below are identified to assist investors in understanding the nature of the risks faced by Vocus and the industry in which it operates. The Company’s risk management approach is set out in detail in the Corporate Governance Statement which is available on the Company’s website www.vocusgroup.com.au.
1. Increased Competition and Exposure to Counterparty risk – The shift from copper to fibre in the last mile customer access network in both Australia and New Zealand is driving a significant churn event over the next 2-3 years. The rollout of the NBN and UFB may facilitate the entry of new competitors; and an aggressive competitive response from incumbents that could have an adverse impact on the future financial performance of Vocus
– Increased competition in the Enterprise & Wholesale segments of the market as incumbents compete to retain share; and new technologies, such as fixed wireless and 5G open up opportunities for new entrants
– The Company is exposed to the financial and operational performance of third party suppliers including companies such as Optus, Telstra and the provider of the Vocus consumer call centre services in the Philippines, Acquire BPO Pty Ltd
2. Regulatory and Environmental Risks – Vocus operates in increasingly regulated industries with significant penalties for non-compliance with regulations, including fines and undertakings that may include customer redress and restrictions on future marketing of services. The Company’s future growth prospects are heavily reliant on its ability to market its services through its various sales channels. Any regulatory change, event or enforcement action which would restrict those activities could have a material adverse impact on the Company’s growth and future financial performance
– The protection of customer, employee and third party data is critical. The regulatory environment surrounding information security and privacy is evolving and increasingly complex and demanding. Failure to comply with regulations in this area could have a material impact on the Company’s reputation and its ability to compete and operate effectively in the market
– Changes in the Australian Accounting Standards and the Income Tax Assessment act could have a material impact on the Company’s financial statements in future periods
– The Company’s approach to environmental risks is outlined in the Sustainability report on the Company’s website www.vocusgroup.com.au

30 Operating and Financial Review
Operating and Financial Review (continued)
1. Group operating performance (continued)3. Network and Operational disruption
– The Company’s ability to deliver its products and services could be impacted by material disruption or damage to both the Company and third party networks and products. This disruption could arise as a result of events which are to a certain extent beyond the Company’s control such as employee negligence or un-authorised physical or electrical access. In addition the Company’s ability to deliver its services could be impacted by remote access attacks, viruses and other forms of cybercrime.
– The Company’s infrastructure assets are exposed to the impact of natural disasters across Australia and New Zealand including, seismic activity, in particular in New Zealand. Natural disasters do have the potential to impact the delivery of products and services resulting in significant business disruption.
4. Technology – The telecommunications and IT industries are continually evolving as is consumer behavior and attitudes towards the use of technology. The ability of the Company to keep pace with changes in technology will dictate its ability to maintain and grow its existing market share and margins into the future
– Business integration and in particular the integration of the technology platforms acquired through the period of M&A over the last 3 years is a key risk to the Company achieving its stated rationalisation targets. Recognising these risks the Company has recently established a Transformation Office to manage and drive the key projects around integration and the migration of the business. The details of this were outlined at the Company’s Strategy Day on 14 June 2017. The presentation can be found on the Company’s website.
– In ensuring the Company remains competitive in the face of technology change it also important that it remains disciplined around capital investment to ensure that returns to shareholders are maximised
5. Financial and Commodity Markets – The Energy business in both Australia and New Zealand is exposed to an extent to sharp movements in the price of both electricity and gas. The Company seeks to hedge its exposure to adverse fluctuations through the use of over the counter derivatives and contracts via the futures market
– The Company is subject to the risk of rising interest rates associated with borrowing on a floating rate basis
– The Company has some exposure to foreign currency fluctuations primarily on the translation of earnings from the New Zealand business and payments for access to offshore infrastructure and our call centre facilities
– The Company needs to ensure that it has access to a competitive cost of capital to enable it to operate effectively in its target markets. There may be external factors that impact the efficient working of capital markets at any particular point in time that could impact the Company’s access to capital markets. There may also be Company specific issues impacting the Company’s ability to access capital markets including its delivery on earnings expectations and its financial position.
1.5 Reconciliation of Underlying and Statutory Earnings
Twelve Months Ended 30 June 2017 ($’m) EBITDA EBIT NPAT
Underlying Result 366.4 260.2 152.3
Significant Items:
Gains on total return swaps 0.1 0.1 0.1
Gains/losses associated with foreign exchange & other (0.6) (0.6) (1.3)
Net loss on disposal of assets (4.7) (4.7) (4.1)
Amortisation of acquired customer intangibles arising from purchase price allocation – (61.0) (42.7)
Amortisation of acquired software intangibles arising from purchase price allocation – (26.4) (18.5)
Acquisition & integration Costs (25.7) (25.7) (18.6)
Goodwill impairment – – (1,532.1)
Total Significant Items (30.9) (118.3) (1,617.2)
Statutory Result 335.5 141.9¹ (1,464.9)
1. Pre impairments costs

Vocus Group Annual Report 2017 Operating and Financial Review 31
1.6 FY17 Earnings Overview
$’m PF FY16¹ PF FY17³ FY16A FY17A%chg
16/17
Revenue & Other Income 1,722.3 1,882.7 829.9 1,820.6 119
Enterprise & Wholesale Australia 626.4 764.6 397.7 702.5 77
Consumer Australia² 797.2 795.1 287.6 795.1 176
New Zealand 298.7 323.0 144.6 323.0 123
Other – – – – –
Underlying EBITDA 389.5 215.6 366.4 70
Enterprise & Wholesale Australia 378.1 186.4 346.4 86
Consumer Australia 124.9 59.7 124.9 109
New Zealand 57.5 28.6 57.5 101
Australian/Group Overheads (50.9) (28.5) (50.9) 79
Network and Technology Costs (120.1) (30.6) (111.5) 264
Depreciation (36.9) (87.6) 137
Underlying Amortisation (8.5) (18.6) 119
Underlying EBIT 170.2 260.2 53
Net financing costs (24.4) (40.9) 68
Underlying Profit before tax 145.8 219.3 50
Underlying Tax expense (44.1) (67.0) 52
Underlying Net Profit after Tax and min. interest 101.7 152.3 50
Significant items before tax (53.8) (1,650.4) n/m
Significant items after tax (37.6) (1,617.2) n/m
Net Profit/(loss) after Tax 64.1 (1,464.9) n/m
Underlying EBITDA margin (%) 26% 20% (23)
Fully Diluted Underlying EPS (¢) 29.5 24.7 (17)
Fully Diluted EPS (¢) 18.6 (237.65) n/m
Diluted weighted average number of shares (m) 341 618 81
Full Time Employees4 1,534 2,053 34
1. Proforma FY16 earnings represent the Vocus FY16 reported earnings including the M2 earnings in FY16 year prior to the merger. Refer to page 46 for reconciliation2. Consumer Australia represents the M2 Australian consumer business. It does not include M2 Australian Wholesale earnings or the Commander SMB business which are included in Enterprise
& Wholesale3. Proforma FY17 earnings include a full twelve month contribution from Nextgen refer to page 46 for reconciliation4. Numbers do not include Dodo kiosk team members nor offshore call center team members N/M not meaningful
For further details on the reconciliation between reported FY16 and FY17 and proforma numbers please refer to the Appendices commencing on page 46

32 Operating and Financial Review
Operating and Financial Review (continued)
1. Group operating performance (continued)Revenue for the 12 month period to 30 June 2017 increased 119% over the pcp to $1.8bn driven by:
– The inclusion of a full twelve months of revenue from the M2 businesses versus the contribution from the business in FY16 post the completion of the acquisition on 22 February 2016 (the M2 merger contributed ~$481m revenue in FY16 and ~$1.3bn revenue for a full year contribution in FY17 across all three business divisions)
– An eight month contribution from the Nextgen acquisition completed on 26 October 2016; $127.1m revenue
– The result was impacted by a number of factors including:
‐ The divestment of the Vocus owned non-core IT division (acquired as part of the Amcom takeover) in December 2015 (contributed ~$10.3m in 1HFY16)
‐ The divestment of the Aggregato businesses in Australia and USA and the Cisco HCS voice platform (estimated impact ~$40m in revenue immaterial impact on EBITDA)
‐ The $17m revenue contribution from a bespoke contract in FY16. A number of bespoke contracts were signed in FY17 but did not make a contribution to revenue in the year in line with accounting standards.
Further discussion regarding the factors driving revenue are contained in Section 2 covering the divisional performance
Deferred revenue brought to account in FY17 was $10.4m including an initial $3m contribution from NWCS and contributions from Nextgen and Amcom. (The future run-off of deferred revenue through the P&L is contained in the Appendix on page 47)
Gross profit margins declined from 47.5% in the pcp to 42.6% reflecting a full 12 month contribution from the lower margin mass market businesses in both Australia and New Zealand. Employee benefits expense increased 87% over the period reflecting the 33.8% increase in full time employees over the 12 month period following the Nextgen acquisition in October 2016, combined with a full 12 month employee cost associated with the M2 businesses.
Administration and other expenses increased 181% over the pcp primarily reflecting the costs associated with a full 12 month contribution from the outsourcing expenses associated with the Company’s offshore call centre.
The deferred subscriber acquisition cost (SAC) balances for M2 were reset post the merger with Vocus in February 2016 as required by purchase price accounting. This has had the effect of delivering the P&L a net benefit in both FY16 and FY17 relative to cash flow while the level of costs “normalise” in the balance sheet. The net benefit to EBITDA in the P&L in FY17 across the three Divisions was $41.3m.
The SAC amortised through the P&L in FY17 increased ~200% over the pcp to $49.2m reflecting a full year contribution from the M2 business. Refer to Appendix page 48 for a details on the treatment of deferred SACs in FY17
Group Services Costs by Function $162.4M
Commercial and Corporate
$53.7m
Technology$108.7m
IT Services$6.1m
IT Applications
$18.6m
Network $84.0
Group Services costs in FY18 are forecast to increase from $162.4m to ~$175m driven primarily by a full period contribution from Nextgen (additional ~$9m in costs in FY18 primarily associated with the network).
1.7 EBITDA Bridge
$’(m)
Underlying EBITDA at 30 June 2016 215.6
Price/Mix/Volume 5.2
Fibre build contract in pcp not carried forward (12.0)
Increase in NBN CVC Costs (18.4)
Contribution from M2 for additional ~8 months 111.8
Contribution from NextGen EBITDA for ~8 months 62.5
Contribution from Smart Business Telecom for ~7 months 3.6
Compensation payment 6.0
Electricity price volatility (7.4)
EBITDA related to discontinued businesses (0.5)
Underlying EBITDA at 30 June 2017 366.4
Underlying EBITDA increased 70% over the pcp to $366.4m. Key factors driving the result were:
– An initial contribution from eight months of the Nextgen acquisition completed on 26 October 2016 of $62.5m post synergies
– A full 12 month contribution from the M2 businesses (the M2 merger completed on 22 February 2016 contributed ~$89m underlying EBITDA in FY16 and an additional ~$112m EBITDA for a full year contribution in FY17 across the business)
Depreciation and amortisation increased 134% on the pcp to $106.2m driven by the full year impact of the M2 acquisition and 8 months of the Nextgen acquisition; combined with the increase in depreciation associated with the organic expansion of the Company’s metro fibre network.
Depreciation and above the line amortisation in FY18 is currently estimated to increase to be in a range of $130-140m.

Vocus Group Annual Report 2017 Operating and Financial Review 33
1.8 Net interest Costs
Net finance costs increased 68% on the pcp to $40.9m. 2HFY17 net interest costs increased 80% on the expense in 1HFY17 reflecting the increase in net debt post the Nextgen acquisition and the $2.3m benefit in 1HFY17 from interest earned on the equity raising completed in July 2016 to fund the Nextgen acquisition that closed on 26 October 2016. Net finance costs in FY18 are currently expected to be ~$50m.
1.9 Tax Reconciliation
Year Ended 30 June $(‘m) 2016 2017
Profit/(loss) before tax after underlying expenses 92.2 (1,431.1)
Add back: Impairment – 1,532.1
Adjusted Profit/(loss) before tax 92.2 101.0
Income tax at 30% 27.7 30.3
Adjustment recognised in prior period 0.5 1.1
Tax allowances and incentives (2.0) (0.07)
Loss on sale of JV (NZ) – 0.7
Other 1.7 1.7
Income tax expense recognised in the profit & loss 27.9 33.7
Effective tax rate (%) 30.3 33.4
The difference between the statutory tax rate of 30% and the effective tax rate of 33.4% was driven by a number of factors including the non-deductibility of the capital loss on the sale of Connect 8 shareholding in NZ and the impact of prior period adjustments including the over accrual of an R&D offset in the FY16 provision.
FY18 effective tax rate expected to be ~ 31%
1.10 Significant Items
Twelve Months Ended 30 June ($’m) 2016 2017
Acquisition and integration costs (40.7) (25.7)
Acquired software amortisation (8.9) (26.4)
Acquired customer contracts amortisation (24.2) (61.0)
Gains on total return swaps 19.5 0.1
Gains/losses associated with foreign exchange 1.5 (0.6)
Gain/Loss on disposal of non- core operations/other (1.0) (4.7)
Goodwill impairment – (1,532.1)
Total significant items before tax (53.8) (1,650.4)
Tax expense/benefit 16.2 33.2
Total significant items after tax (37.6) (1,617.2)
Costs taken below the line as significant items included:
– Acquisition and integration costs of $25.7m primarily associated with the payment of external professional fees associated with the Nextgen acquisition and associated equity raising, combined with integration and redundancy costs associated with the restructure of the business post the series of acquisitions
– Amortisation of acquired customer contract and acquired software intangibles of $87.4m, the increase on the pcp related primarily to the full year impact of merger with M2 in February 2016. (The run off of below the line amortisation is outlined in the Appendix on page 48)
– The loss on disposal of non-core assets includes the sale of the Company’s 50% interest in Connect 8 and the sale of the Aggregato businesses
– Gains on total return swaps relate to Vocus’ 16% relevant interest in Macquarie Telecom Group, which represents mark-to-market gains net of dividends received, brokerage costs and interest costs relating to those total returns swap arrangements. The shareholding in Macquarie Telecom was disposed of during 2HFY17

34 Operating and Financial Review
Operating and Financial Review (continued)
1. Group operating performance (continued) – A non-cash impairment of $1,532m post tax spread across both the Australian, $1,333m and New Zealand, $199m cash generating units (CGUs)1 2. The primary changes in the assumptions used to value goodwill in the accounts are:
‐ An increase in the discount rate used:
• The Australian discount rate has increased from 8.5% to 9.9%
• The New Zealand discount rate has increased from 9.01% to 10.2%
The increase in the discount rate reflects the assessed risks associated with the 5 year average blended growth rate assumptions for revenue in the detailed business model:
• The 5 year average blended rate across the Australian businesses is 7%
• The 5 year average blended rate across the New Zealand businesses is 8.4%
‐ A change in the terminal growth rate from 3% to 2.5%, reflecting the ongoing pricing pressure across the telecommunications industry
‐ A reduction in the five year cumulative EBITDA estimates for both Australia and New Zealand
1.11 Cashflow
Twelve months ended 30 June ($’m) 2016 2017
Underlying EBITDA 215.6 366.4
Net cash from operating activities 72.0 131.4
Interest, finance costs, tax and JV distribution 54.7 59.7
Adjusted operating cash flow 126.7 191.1
Net interest and finance costs (23.6) (29.2)
Income taxes paid (31.1) (30.5)
Net cash from operating activities 72.0 131.4
Payments for property plant & equipment (66.9) (131.7)
Intangibles payments and proceeds1 (31.2) (57.9)
Payments related to undersea cable projects2 – (29.5)
Business acquisitions3 75.7 (801.5)
Other cash flows from investing activities 19.8 7.8
Investing cash flows (2.6) (1,012.8)
Proceeds from issue of shares 1.3 673.5
Change in borrowings 100.9 202.6
Repayment of leases (7.2) (12.3)
Dividends paid (50.9) (60.8)
Financing cash flows4 44.1 803.0
Net movement in cash 113.5 (78.4)
Cash conversion (%)5 59% 52%
1. Includes IRU payments and other intangibles2. Relates to upfront payment to Alcatel Submarine Networks (ASN) on the ASC project3. Includes acquisition of Nextgen Networks in October 2016, Switch Energy and Smart Business Telecom4. Financing cash flows include proceeds from pro rata entitlement offer, dividends, change in borrowings and interest expense on borrowings and leases.5. Cash conversion % is calculated by dividing adjusted operating cash flow (in table above) by Underlying EBITDA
1 CGU’s prior to re-Organisation2 Refer ASX announcement 17 August 2017

Vocus Group Annual Report 2017 Operating and Financial Review 35
1.11 Cashflow (continued)
Operating cash conversion over the full year was 52% impacted by a number of factors in the table above including:
– Cash received in advance on contracts secured in the Enterprise & Wholesale business relates to a number of bespoke contracts that are delivered across a number of years. One of these contracts includes a significant fibre build component. Revenue associated with these contracts will be recognised over the life of the contracts that range between 3 and 15 years. There was no revenue associated with these contracts recognised in the FY17 P&L in line with accounting standards.
– The difference between the upfront costs associated with new customer acquisition capitalised in the balance sheet and the level of expenses amortised through the P&L is expected to normalise by the end of the 1QFY18 based on current forecasts for subscriber acquisition growth. The net benefit to the P&L in FY18 is expected to be immaterial (refer to Appendices for more detail on SAC on page 48)
– Operating cash flow over the period was impacted by an overall 148% increase in subscriber acquisition costs compared to the pcp to $90.5m
– The impact of deferred revenue bought to account in FY17 was $10.4m primarily relating to initial revenues under the NWCS project, and the run off of contracts acquired through the Amcom and Nextgen acquisitions (refer Appendices for information on the profile of deferred revenue over the next 13 years page 47 )
– The impact of the release of onerous provisions primarily relates to the un-wind of property leases and the Metronode contract assumed as part of the Nextgen acquisition.
– Other changes in networking capital primarily related to a large payables and accruals unwind.
Cash conversion in FY18 is forecast to be 85-90%. The impact of deferred revenue and onerous contract unwind on cash conversion is detailed in the appendices on page 47.
1.11.1 Cash flow to Underlying EBITDA Reconciliation
$’(m)
Statutory Operating Cash flow 191.1
Cash Received in Advance on E&W contracts (23.0)
Operating Cash flow related to current year activity 168.1
Difference between SAC expense and SAC capitalisation 41.3
Optus bounty roll off 11.3
Underlying net working capital movement 90.9
Acquisition & integration costs 22.9
Other 3.2
Short term cash conversion 337.7
Deferred revenue unwind 10.4
Onerous provision unwind 16.5
Lease straight lining 1.8
FY17 Underlying EBITDA 366.4
1.11.2 “Other” Changes in Net Working Capital
$ (m)
Underlying net working capital movement
Trade debtors 8.3
Prepayments (14.7)
Inventory (0.1)
Trade and other payables 58.7
Provisions 34.5
Other 4.2
Total other change in NWC 90.9

36 Operating and Financial Review
Operating and Financial Review (continued)
1. Group operating performance (continued)In FY18 net working capital movements are expected to normalise.
Investing cash flows over the period were negative $1.0bn driven by:
– The acquisition of Nextgen for a total upfront consideration of $793.2m plus transaction costs
– Cash capital expenditure (excl ASC) of $189.6m including IRU payments in intangible items
– Expenditure on the ASC project was $29.5m (slightly below the original forecast of US$26.6m for FY17)
– Proceeds from the disposal of a number of small investments including the sale of the Macquarie Telecom stake and the sale of the Company’s 50% interest in New Zealand services business Connect 8
1.12 Capital Expenditure
Twelve Months Ended 30 June ($’m) 2016 2017
Growth Capital Expenditure 89.0 122.4
Sustaining capital expenditure – 18.0
Improvement capital expenditure2 – 16.5
IRU Payments 19.3 32.7
ASC project – 29.5
Total Capital Expenditure1 108.3 219.1
1. Cash Capital Expenditure2. Capital Expenditure not defined in these categories in FY16
Capital Expenditure over the period was primarily driven by:
– Growth capex in Enterprise & Wholesale
– IRU payments reflecting the growth in demand for access to international services and access to NBN POIs
– The upfront costs associated with the ASC project of A$29.5m
– Improvement capex associated with augmenting core network capacity, upgrading network applications, integration of legacy platforms and investments in deploying new transformative operating systems
Capital Expenditure (excl ASC) in FY18 is expected to be in the range of $190-210m.
Forecast FY18 Capital Expenditure (A$’m)
0
50
100
150
200
250
33
12219
89
311718
29
96-116
44
21
IRU Payments (SX & TLS)Growth CapexImprovement Capex¹Sustaining Capex
FY15 FY16 FY17 FY18F
1.12.1 Update on Australia Singapore Cable
Vocus has recently signed a contract variation which included the expansion of the project to incorporate the construction of a spur to Christmas Island following significant interest from a range of Government agencies (cost included in forecasts below). The cash flow profile associated with capex as per the contract variation is now expected to be:
– FY17 – US$22m
– 1HFY18 – US$32m
– 2HFY18 – US$6m
– 1HFY19 – US$122m
The project continues to track ahead of expectations and is expected to be ready for service in 1QFY19.

Vocus Group Annual Report 2017 Operating and Financial Review 37
1.13 Balance Sheet
1.13.1 Summary Balance Sheet
Period Ended ($’m) 30 June 16 31 Dec 16 30 June 17
Cash 128.6 131.5 50.2
PP&E 522.4 1,531.0 1,543.0
Intangibles 3,757.1 3,793.0 2,212.1
– Goodwill 2,960.3 3,007.5 1,475.1
– Customer Intangibles 350.2 322.0 293.1
– IRU capacity 126.7 149.6 143.8
– Brands and other 192.6 191.6 182.4
– Software 127.3 122.3 117.7
Trade Receivables 144.4 178.1 167.1
Other assets 144.6 199.2 199.2
Total assets 4,697.10 5,832.8 4,171.6
Loans and borrowings 889.2 1,122.5 1,079.5
Other liabilities 633.6 876.8 789.0
Total Liabilities 1,522.8 1,999.3 1,868.5
Net Assets 3,174.3 3,833.5 2,303.1
Key movements in the balance sheet in FY17 primarily relate to the acquisition of Nextgen completed on 26 October 2017 for a total upfront consideration of $793.2m, including fibre assets of $909m, goodwill of $48.3m, projects under construction of $24.9m (NWCS) and deferred revenue of $160.2m.
The other key movement is the decline in the value of goodwill resulting from the $1,532m impairment recognised in the full year accounts following a review of the assumptions that underpin the valuation.
1.13.2 Net Debt
Period Ending ($’m) 30 June 16 31 Dec 16 30 June 17
Bank loans 828.8 1,071.1 1,031.4
Backhaul IRU liability 31.3 25.3 25.3
Lease liability 29.1 26.1 22.8
Borrowings per balance sheet 889.2 1,122.5 1,079.5
Cash 128.6 131.5 50.2
Net Debt 760.6 991.0 1,029.3
Net Debt over the 12 month period increased 35% to $1bn driven by a number of factors including a 74% increase in capital expenditure (excl ASC) to $189.6m, the upfront investment in the ASC project of US$22m, the purchase price of Nextgen net of the capital raising proceeds of $120m and the increase in subscriber acquisition costs.
1.13.3 Drawn Committed Syndicated Bank Debt Facilities
Facilities 31 Dec 16 30 June 17
A$1,095m 917.3 891.4
NZ$160m 153.8 140.0
Total 1,071.1 1,031.4

38 Operating and Financial Review
Operating and Financial Review (continued)
1.13.4 Financial Covenants
Financial Covenants Covenant Position at 30 June 2017
Leverage ratio ≤3.0x (Net debt/LTM EBITDA) unless a permitted acquisition ( i.e. Nextgen) in which case ≤3.5x for 18 months
2.6x
Interest cover ratio ≥5.0x (LTM EBITDA¹/LTM Net Interest Expense) 9.1x
Gearing ≤ 60% (Net Debt/(Net Debt + Equity) 30.9%
1. Adjusted LTM EBITDA
Vocus debt facilities were renegotiated in May 2016 following the completion of the merger with M2. Facilities are provided by a syndicate of 13 domestic and international banks. At balance date the Group’s committed facilities had a remaining weighted average tenor of 3.1 years (30 June 2016 4.0 years).
Financial covenants remain compliant at balance date. Based on forecast net debt at 30 June 2018 in the range of $1.03-1.06bn the leverage ratio is expected to be ~2.65x.
1.14 Shareholder Returns
1.14.1 EPS and Dividends
Twelve Months Ended 30 June 2016 2017
Interim Dividend (¢) 7.6 6.0
Full Year Dividend (¢) 8.0 –
Payout Ratio1 (%) 53% 24%
Fully diluted underlying EPS (cps) 29.5 24.7
Fully diluted statutory EPS (cps) 18.6 (237.65)
1. Based on underlying earnings
The Vocus Board made the decision not to declare a final dividend for the FY17 year in light of the opportunities to invest in strategic projects such as ASC combined with the focus of the Board on reducing the overall leverage in the business. An interim dividend of 6¢ per share fully franked was paid in April 2017.
The Vocus Board also does not anticipate paying an FY18 interim dividend.
The Board of Vocus expects to review future dividend payments in line with the growth of the business, taking into account the capital requirements and accretive infrastructure opportunities available at any point in time.
Fully diluted underlying EPS growth in FY17 was impacted by a full year of the expanded capital base of the Company following the capital raising completed in July 2016 to fund the acquisition of Nextgen completed in October 2016.

Vocus Group Annual Report 2017 Operating and Financial Review 39
2. Divisional Performance
2.1 Enterprise & Wholesale Australia
The completion of the Nextgen acquisition in October 2016 delivered Vocus a competitive network footprint in the Australian market. Vocus is now well placed to meet the growing requirements of the Enterprise, Wholesale and Government segments of the market for secure high speed reliable connectivity and redundancy both in the domestic market and for connection with international markets.
The integration of the Amcom, M2 and Nextgen Enterprise businesses has delivered a broader product portfolio and the scale to address a wider section of the Enterprise & Government sector.
The Division’s go to market brand is Vocus Communications. The Divisions activities encompass the small to medium business segment (SMB) bringing together the Vocus Communications brand with the Commander branded equipment.
2.1.1 Enterprise & Wholesale Australia Earnings Summary
$’m PF FY163 PF FY174 FY162 FY171 2%chg
16/17
Revenue & Other Income 626.4 764.6 397.7 702.5 77
– Fibre & Ethernet1 117.3 311.9 115.5 249.8 116
– Internet 128.0 128.2 92.8 128.2 38
– Voice 277.9 248.5 119.5 248.5 108
– Data Centre 54.6 41.6 44.4 41.6 (6)
– Other 48.6 34.4 25.5 34.4 35
Underlying EBITDA5 378.1 186.4 346.4 86
EBITDA margin (%) 49 47 49 4
Metro Fibre (kms) 2,624 25,486 871
1. FY17 Includes an eight month contribution from Nextgen of $127.1m in revenue and $85.5m in EBITDA post synergies2. Now includes Commander earnings contribution refer page 46 for earnings reconciliation with past disclosure3. Includes a full 12 month contribution from M2 Wholesale and Commander FY16 refer page 46 for detailed revenue reconciliation4. Includes a full year of Nextgen an additional $62.1m in revenue and $31.7m in EBITDA refer reconciliation in Appendices page 465. Does not include a Network or Group Services cost allocation. Nextgen contribution post network costs was $62.5m
2.1.2 Enterprise & Wholesale Australia Revenue Bridge
($’m)
FY16 Reported Revenue1 397.7
Organic growth in Corporate & Wholesale 19.8
Fibre build contract in prior period (17.0)
Divestment of IT Services division (10.3)
Contribution from M2 Wholesale for additional ~8 months 38.4
Contribution from Nextgen for ~8 months 127.1
Contribution from Commander for additional ~8 months 146.8
FY17 Reported Revenue 702.5
1. Included ~4 month contribution from M2 businesses. Merger occurred 22 February 2016
Revenue for the 12 month period to 30 June 2017 increased 77% on the pcp to $702.5m. Factors impacting the result include:
– An initial eight month contribution from the Nextgen acquisition ($127.1m contribution to Fibre & Ethernet revenues)
– A full twelve month contribution from the businesses acquired through the merger with M2 (an additional $185.2m in revenue).
‐ The 108% increase in voice revenues includes the contribution from the M2 Wholesale and Commander businesses. Voice revenues were negatively impacted by the continuation of the structural decline in voice revenues in the SMB category as the substitution to mobile and the migration to VOIP continues
– Organic growth from new contracts net of contract cancellations
– FY16 revenue included a $17m contribution from a bespoke project contract. In FY17 the contribution from bespoke project based work was $23m cash flow received but not recognized in the P&L in FY17. Revenue and profit associated with these projects will be recognised in future years across the life of the contracts
– The impact of the sale of a non-core IT services platform in December 2015 of $10.3m in the pcp
Reconciliation with Proforma FY16 and FY17 are contained in the Appendix on page 46

40 Operating and Financial Review
Operating and Financial Review (continued)
2. Divisional Performance (continued)
2.1.3 EBITDA Bridge
$’(m)
Underlying EBITDA at 30 June 20161 186.4
Price/Mix/Volume/Cost 8.6
Increase in NBN CVC Costs (2.7)
Fibre build contract in pcp not carried forward (12.0)
Contribution from M2 Wholesale for additional ~8 months 14.4
Contribution from Commander for additional ~8 months 66.2
Contribution from Nextgen for ~8 months 85.5
Underlying EBITDA at 30 June 2017 346.4
1. Includes ~4 mth contribution from M2 Wholesale & M2 Commander. Merger occurred 22 February 2016
Underlying EBITDA for the 12 month period ended 30 June 2017 increased 86% on the pcp to $346.4m. Factors driving the result include:
– An initial eight month contribution from Nextgen $85.5m post synergies (pre overhead and network costs shown in Group Services)
– A full twelve month contribution from M2 Wholesale and Commander compared to 129 day contribution in FY16 post the merger with M2 in February 2016 ($80.6m additional EBITDA) (refer appendices page 46 for proforma reconciliation)
– The ~$12m EBITDA contribution from a bespoke project in FY16 that did not recur in FY17
– Investment in additional sales and provisioning resources during the year
– Organic growth in the business offset to an extent by pressure on pricing and contract cancellations
– The result benefited from a $10.3m difference between deferred and expensed SAC. Refer appendices page 48 for detail on SAC benefit
EBITDA margins improved reflecting the contribution from the Nextgen acquisition.
2.1.4 Outlook
Key Priorities
Enterprise & Wholesale is now focused on leveraging recently acquired businesses. Key priorities include:
– Grow share of market
‐ Invest in Eastern region to drive market share to be in line with current Western market position
‐ Focus on immediate $50M TCV opportunities in Victoria, NSW & Federal Government markets
‐ Increase share of the Carrier & Carriage Service Providers market in wholesale
‐ Partnering approach in small business
‐ Implement a national account management regime to improve customer lifetime value
– Standardise and expand products to ensure consistency of offering and seamless delivery
– Improve automation of provisioning processes and customer self-help portals, drive down quote to cash
– Discipline around costs and capital allocation to improve returns to shareholder
Guidance
Enterprise & Wholesale FY18 earnings are forecast to grow:
– FY18 revenue is expected to grow at mid-single digit % growth compared to FY17 Proforma revenue3
– FY18 EBITDA is forecast to grow at high single digit % growth compared to FY17 Proforma EBITDA
Factors driving this growth include:
– A full 12 month contribution from Nextgen compared to 8 months in FY17
– Contribution in FY18 from bespoke customised contracts signed in FY17 are $21.0m in revenue and ~$13m EBITDA; ~$13.6m in cash revenue
– Growth flowing through from new contracts commenced in 4QFY17 ~$7m EBITDA
– Voice revenues in the SMB sector are expected to continue to decline offset to an extent by forecast growth in Enterprise voice services
– FY18 organic growth
3 E&W proforma earnings include a full 12 month contribution from Nextgen

Vocus Group Annual Report 2017 Operating and Financial Review 41
2.2 Consumer – Australia
The Australian Consumer business is focused predominantly on the value end of the consumer market offering a range of telecommunications products and services including broadband data, voice, and mobile. The division also markets other household services under its key brands including gas, electricity, insurance and Fetch TV set top boxes.
The Division goes to market under a dual brand strategy: Dodo which is a low cost price seeker brand; and iPrimus which is a competitive value seeker brand.
The Consumer business has an estimated market share of the Consumer NBN broadband market of approximately 7.3% at 30 June 2017.
2.2.1 Earnings Summary
$’m PF FY161 FY162 FY17%chg
16/17
Total Revenue Consumer 797.2 287.6 795.1 176
Internet & Bundles 356.5 138.3 388.7 181
Voice Only 101.2 34.3 91.4 167
Mobile 71.3 22.4 53.1 137
Energy 173.7 66.8 211.7 217
Other3 34.7 10.1 37.5 272
Discontinued Businesses4 59.8 15.7 12.7 (19)
Underlying EBITDA5 59.7 124.9 109
EBITDA margin (%) 21 16 (24)
Consumer Broadband SIOs6 528 547 4
– Copper bundles (‘000) 409 324 (21)
– Copper broadband (‘000) 51 45 (12)
– NBN (‘000) 68 178 162
ARPU copper broadband & bundles ($)7 60.62 61.04
AMPU copper broadband & bundles ($)7 24.64 25.26
ARPU NBN ($)6 64.54 64.23
AMPU NBN ($)6 22.07 20.26
Net churn rate copper per month6 2.4% 2.4%
Net churn rate NBN per month6 1.5% 1.4%
Consumer Market Share NBN excl satellite (%) 6.4 7.3
Consumer Mobile SIOs (‘000) 169 163
Consumer Energy SIOs (‘000) 147 161
– Electricity 104 112
– Gas 43 49
1. Represents the M2 Australian Consumer business result for the full FY16 period excluding M2 Wholesale and Commander earnings and the Amnet business acquired in the Amcom acquisition. Refer page 46 for full reconciliation
2. Restated to remove Commander earnings transferred to Enterprise & Wholesale refer page 46 for full reconciliation. Includes the M2 Consumer business from the date of the merger 22 February 2016
3. Other includes Fetch TV4. Discontinued businesses includes Aggregato US sales in FY16 and Aggregato Australia in FY16 and FY175. Underlying EBITDA now includes CVC charges as well as AVC charges6. Now includes Engin subscribers7. Average per user per month

42 Operating and Financial Review
Operating and Financial Review (continued)
2. Divisional Performance (continued)
2.2.2 Revenue Bridge
$’(m)
FY16 Revenue 287.6
Price/Mix/Volume 43.0
Contribution from M2 for additional ~8 months 465.4
Contribution from Smart Business Telecom for ~7 months 14.8
Bounty revenue received in prior period (14.0)
Compensation payment 6.0
Decline in hardware revenue (4.7)
Revenue related to discontinued businesses (3.0)
FY17 Revenue 795.1
Total Australian Consumer revenue was up 176% on the pcp to $795.1m. The result was driven by a number of factors primarily related to the full year impact of the M2 businesses post the merger in February 2016 ($465.4m additional revenue excluding discontinued businesses).
FY17 Consumer revenue declined marginally compared to Proforma FY16 revenue to $797.2m (table 2.2.1) driven by a number of factors including:
– Strong growth in Internet & Bundles reflecting the 5% growth over the pcp in broadband SIOs; offset to an extent by the ongoing weak trend in voice revenues reflecting mobile substitution and a decline in mobile revenue reflecting a 3% decline in mobile SIOs over the pcp
– The revenue impact of the sale of the Aggregato businesses compared to the pcp ~$35m
– The result included a strong increase in Energy revenues reflecting the 10% increase in Energy SIOs over the pcp
2.2.3 EBITDA Bridge
$’(m)
Underlying EBITDA at 30 June 2016 59.7
Price/Mix/Volume/Cost (2.1)
Increase in NBN CVC Costs (15.8)
Contribution from M2 for additional ~8 months 81.4
Contribution from Smart Business Telecom for ~7 months 3.6
Compensation payment 6.0
Impact of volatility created by extreme weather events (7.4)
EBITDA related to discontinued businesses (0.5)
Underlying EBITDA at 30 June 2017 124.9
Underlying EBITDA increased 109% to $124.9m compared to EBITDA in the pcp primarily reflecting a full year contribution from the M2 Consumer business in FY17. Other factors impacting FY17 Underlying EBITDA included:
– CVC costs associated with the provision of NBN services are included in the EBITDA result. CVC costs increased from $2.3m in FY16 (CVC costs in FY16 for M2 Consumer for a full 12 months was $4.7m) to $20.5m in FY17 reflecting the growth in subscribers and the change in the mix of subscribers following the soft launch of iPrimus
– The impact of extreme weather events in NSW that impacted the profitability of the Energy business $7.4m
– The result benefited from a $25.7m difference between deferred and expensed SAC. Refer appendices page 48 for detail on SAC benefit
2.2.4 Outlook
Key Priorities
The Australian Consumer division’s key priorities are:
– Drive top line growth through 2 leading consumer brands
‐ Relaunch iPrimus, leverage awareness and target new customers
‐ Focus on bundling energy, mobile and entertainment to drive value from existing customer base
‐ Leverage dodo retail kiosk network and extend to new NBN areas
– Reducing cost to serve
‐ Complete transformation of operations (Salesforce & Genesys) increasing customer satisfaction and delivering cost to serve improvements
‐ Deliver new web and online capabilities to drive increased on line transactions
‐ Drive simplification and automation
– Improve Returns
‐ Focus data analytics to pre-empt churn
‐ Increase share of wallet through bundling
‐ Deliver a quality in home media streaming experience
Guidance
The Consumer Division’s FY18 earnings are forecast to be:
– Revenue is forecast to grow at a high single digit percentage growth rate compared to the pcp driven by:
‐ the rollout of the NBN and increasing share of the broadband market
‐ focus on securing a higher share of wallet offering additional services such as energy and Fetch TV
‐ the relaunch of iPrimus targeting a different segment of the consumer market
– FY18 EBITDA is expected to decline 15-20% on the pcp reflecting the headwind created by the benefit of DSACs ~$25.7m in the FY17 result

Vocus Group Annual Report 2017 Operating and Financial Review 43
2.3 New Zealand
2.3.1 Earnings Summary
A$’m1 Proforma FY162 FY16 Fy17%chg
16/17
Revenue & Other Income 298.7 144.6 323.0 123
– Enterprise & Wholesale 118.2 84.1 150.2 79
– Consumer 180.5 60.5 172.8 186
Underlying EBITDA 28.6 57.5 101
EBITDA margin (%) 20 18 (10)
Broadband Consumer SIOs 192 189 (2)
– Copper broadband (‘000) 165 144 (13)
– UFB (‘000) 27 45 67
SMB SIOs (‘000) 20 21 5
Broadband ARPU (NZ$) 71.37 71.21 –
Broadband AMPU (NZ$) 29.61 28.87 (2)
Net churn rate copper broadband (%) 2.8 3.0 7
Net churn rate UFB (%) 2.0 1.9 (5)
Market Share UFB (%) 11 13 18
Energy SIOs (‘000) – 5 100
Mobile SIOs (‘000) 17 21 24
1. NZ earnings are converted into A$ monthly at the average conversion rate for the month2. Proforma FY16 includes M2 New Zealand revenues for the FY16 period refer page 46
2.3.2 Earnings in New Zealand Dollars
NZD FY16 1HFY17 FY17 %chg 16/17
Revenue 151.2 167.1 342.0 126
– Enterprise & Wholesale 88.0 74.3 159.0 81
– Consumer market 63.2 92.8 183.0 190
Underlying EBITDA 30.0 31.7 60.9 103
EBITDA margin % 20 19 18 (10)

44 Operating and Financial Review
Operating and Financial Review (continued)
2.3.3 New Zealand Revenue Bridge
($’m)
FY16 Revenue 144.6
Contribution from M2 for additional ~8 months 163.6
Contribution from Switch Utilities 11.1
Organic growth 3.7
FY17 Revenue 323.0
New Zealand revenue increased 123% on the pcp to $323.0m. In NZD revenue increased 126% to NZ$342m. The result was driven by:
– A full 12 month contribution from the M2 New Zealand business. Revenue increased 8% on Proforma FY16 revenue. (Proforma FY16 earnings include a full 12 month contribution from M2 NZ). Refer Appendices on page 46 for a full reconciliation of the proforma earnings)
– An initial contribution from Switch Energy acquired in December 2016
– Growth in Enterprise & Wholesale driven largely by additional wholesale customers secured during the year
2.3.4 EBITDA Bridge
$A’(m)
Underlying EBITDA at 30 June 2016 28.6
Price/Mix/Volume/Cost (0.2)
Contribution from M2 for additional ~8 months 29.1
Underlying EBITDA at 30 June 2017 57.5
The New Zealand division reported 101% increase in Underlying EBITDA on the pcp to $57.5m. In NZD Underlying EBITDA increased 103% to $NZ$60.9m on the pcp. The result was driven by:
– A full 12 month contribution from the M2 NZ business post the M2 merger in February 2016
– The result benefited from a $5.3m difference between deferred and expensed SAC
– An initial contribution from the Switch Energy business acquired in December 2016
2.3.5 Outlook
Key Priorities
The key priorities for the New Zealand business in FY18 include:
– Drive top line growth
‐ Broadband growth and UFB market share
‐ Leverage size and scale to drive growth in all segments
‐ Drive product penetration across all market segments
– Reduce cost to serve
‐ Automate everything and deliver better customer outcomes
‐ Reduced complexity through streamlining brands
‐ Ensure investment improves resiliency while reducing costs
– Reduce churn
‐ Deliver service and support on our customers terms
‐ Bundle more services that complement the core
‐ Improve business processes that impact customer experience
Guidance
In FY18 the New Zealand Division’s revenue is expected to grow at high single digit percentage growth on the pcp and EBITDA is forecast to grow at low single digit percentage on the pcp. Factors expected to drive the result include:
– Top line growth in Consumer driven by modest net broadband growth and energy uptake
– Growth in Business and Enterprise driven by a direct sales approach leveraging a wider product set
– Strong growth in Wholesale activities on the back of new entrants leveraging the UFB roll out
– Ongoing competitive intensity in particular in the consumer market segment
– Earnings growth will be impacted by the head wind created by the net benefit to the P&L in FY17 of deferred SAC of $5.3m.

Vocus Group Annual Report 2017 Operating and Financial Review 45
3. Group Outlook
Key Priorities
The key Group priorities in FY18 include:
– Focus on accelerating Company-wide transformation programs
‐ Transformation team in place leaders appointed in each business unit
‐ Key programs accelerated with priority given to projects that translate directly to earnings and improved customer experience
‐ Initial benefits expected to flow in FY18, three year program to deliver all benefits
– Strategy in place to leverage the Company’s assets and drive top line growth
‐ Leverage the increased scale of the Company to drive growth in Enterprise/Government /Carrier markets
‐ Take advantage of the rollout of NBN and UFB networks to take share in consumer markets in Australia and new Zealand
‐ Unifying our product portfolio and markets to improve product penetration
‐ Refining our brand portfolio and go to market strategy to optimise marketing spend
‐ Transforming our technology environment to improve customer experience and create an efficient scalable platform for growth
– Focus on a reduction in costs
‐ Execute on transformation to remove complexity and duplication – singular scale
‐ Automate everything – programs in place across the business
‐ Give the customer control; improve self-service portals
– Improve Returns
‐ Cost focus to improve earnings efficiency
‐ Discipline around capital allocation to improve cash returns
‐ Improving capital management to drive cash returns for shareholders
FY18 Guidance – Group
FY18 Guidance
Revenue $1.9-2bn
Underlying EBITDA $370-390m
D&A $130-140m
Net Financing Costs ~$50m
Underlying NPAT $140-150m
Below the line amortisation ~$87m
Capex (ex ASC) $190-210m
ASC Capex US$38m
Net Debt 30 June 2018 $1.03-1.06bn
Leverage Ratio 30 June 2018 ~2.65x
– The 12 month benefit from the Nextgen acquisition (the four months prior to the completion of the acquisition in October 2016 represented $23.1m EBITDA)
– The FY18 results will be impacted by the headwinds resulting from the deferred subscriber acquisition costs (DSAC) benefit in FY17 of ~$41.3m, $13.3m in 2HFY17.
– Most significant impact in Consumer Australia (benefit in FY17 of $25.7m)
– Above the line depreciation will increase materially on the pcp primarily reflecting the acquisition of Nextgen
– Net interest expense will be materially higher given the positive offset of the funds from the capital raising in 1HFY17 and higher net debt levels
– Significant items taken below the line are expected to be a pre-tax non-cash expense of $87m related to the amortisation of acquired customer relationship and software balances. Significant items will include costs associated with the engagement with private equity firms
– Capital expenditure is expected to be in a range of $190-210m excl. ASC
FY18 Earnings Guidance – Divisions
FY17 Proforma ($’m) FY18 Forecast % chgRevenue EBITDA Revenue EBITDA
Australia
– Enterprise & Wholesale 764.6 378.1 Mid–single digit growth High single digit growth
– Consumer 795.1 124.9 High single digit growth 15–20% decline
New Zealand1 323.0 57.5 High single digit growth Low single digit growth
Group Services – (171.0) – ~(175)
– Top line growth forecast across all divisions driven by leveraging expanded platform, increasing penetration of key markets and growing share of wallet through expanded product set
– Increased competition in all segments driving ongoing focus on improving customer service and reducing cost to serve through automation

46 Operating and Financial Review
Operating and Financial Review (continued)
4. Appendix
4.1 Reconciliation from FY17 reported to FY17 Proforma Earnings
A$mFy17
Reported
Nextgen ~4mths prior to acquisition FY17PF
Consumer1 795.1 – 795.1
Enterprise & Wholesale 702.5 62.1 764.6
New Zealand 323 – 323
Group Services – – –
Revenue 1,820.60 62.1 1,882.70
Consumer1 124.9 – 124.9
Enterprise & Wholesale2 346.4 31.7 378.1
New Zealand 57.5 – 57.5
Segment EBITDA 528.8 31.7 560.5
Group Services (162.4) (8.6) (171.0)
Underlying EBITDA 366.4 23.1 389.5
1. Consumer does not include Commander. Consumer now includes CVC costs of $20.5m2. Enterprise & Wholesale now includes Commander SMB and CVC costs of $3.1m
4.2 Reconciliation from FY16 reported to FY16 Proforma Earnings
A$mFY16
Reported Commander CVC Costs OtherFY16
adjustedM2 prior to
merger FY16PF
Consumer1 372.9 (94.1) – 8.8 287.6 509.6 797.2
Enterprise & Wholesale2 310.4 94.1 – (6.8) 397.7 228.7 626.4
New Zealand 144.6 – – – 144.6 154.1 298.7
Group Services/Other 2.9 – – (2.9) – – –
Revenue 830.8 – – (0.9) 829.9 892.4 1,722.3
Consumer1 95.5 (36.4) (2.3) 2.9 59.7 – –
Enterprise & Wholesale2 155.0 36.4 (0.4) (4.6) 186.4 – –
New Zealand 28.6 – – – 28.6 – –
Segment EBITDA 279.1 – (2.7) (1.7) 274.7 – –
Group Services (63.5) – 2.7 1.7 (59.1) – –
Underlying EBITDA 215.6 – – – 215.6 – –
1. In FY16 reported Consumer included Commander SMB and did not include CVC charges. The reported figure only includes M2 earnings from 22 February 20162. In FY16 Enterprise & Wholesale did not include Commander SMB or CVC charges3. Interest income moved to net finance costs
4.3 Reconciliation from 1HFY17 reported to 1HFY17 Restated
A$m1HFY17
Reported1HFY17
Commander CVC Costs OtherRestated 1HFY17
Nextgen4mths
Proforma 1HFY17
Consumer1 517.6 (127.0) – 5.5 396.1 – 396.1
Enterprise & Wholesale2 204.0 127.0 – 0.5 331.5 62.1 393.6
New Zealand 158.3 – – – 158.3 – 158.3
Group Services 6.0 – – (6.0) – – –
Revenue 885.9 – – – 885.9 62.1 948.0
Consumer1 135.0 (53.4) (7.1) – 74.5 – 74.5
Enterprise & Wholesale2 102.5 53.4 (0.9) 2.9 157.9 31.7 189.6
New Zealand 30.1 – – – 30.1 – 30.1
Segment EBITDA 267.6 – (8.0) 2.9 262.5 31.7 294.2
Group Services (80.4) – 8.0 (2.9) (75.3) (8.6) (83.9)
Underlying EBITDA 187.2 – – – 187.2 23.1 210.3
1. 1HFY17 reported Consumer included Commander SMB and did not included CVC charges.2. 1HFY17 reported Enterprise & Wholesale did not include Commander SMB or CVC charges
Vocus Group Annual Report 2017 Operating and Financial Review 47
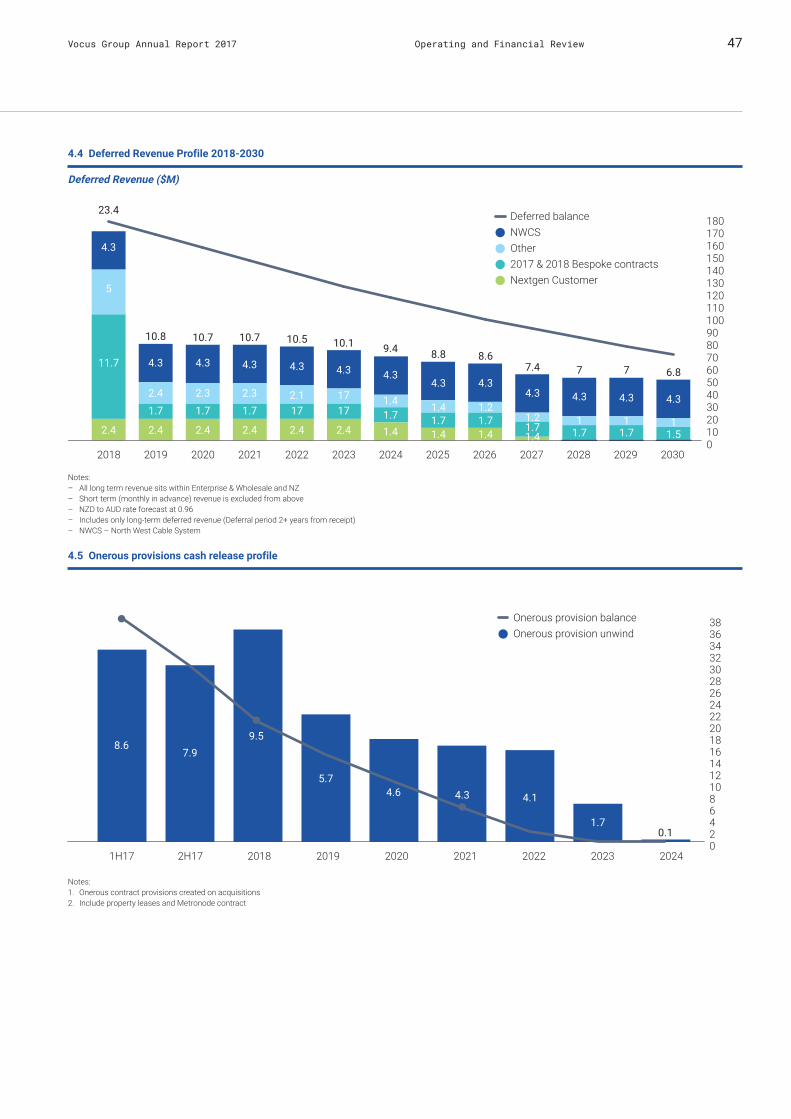
4.4 Deferred Revenue Profile 2018-2030
Deferred Revenue ($M)
0102030405060708090100110120130140150160170180
2018 2019 2020 2021 2022 2023 2024 2025 2026 2027 2028 2029 2030
2.4
11.7
5
4.3
23.4
4.3
10.8
2.41.7
2.4 2.4
1.72.3
4.3
10.7
4.3
10.7
2.31.7
2.4 2.4
172.1
4.3
10.5
4.3
10.1
1717
2.4
4.3
9.4
1.41.71.4
4.3
8.8
4.3
8.6
1.21.71.4
4.3
7.4
4.3
7
11.7
4.3
7
11.7
4.3
6.8
11.5
1.21.71.4
1.41.71.4
Deferred balanceNWCSOther2017 & 2018 Bespoke contractsNextgen Customer
Notes: – All long term revenue sits within Enterprise & Wholesale and NZ – Short term (monthly in advance) revenue is excluded from above – NZD to AUD rate forecast at 0.96 – Includes only long-term deferred revenue (Deferral period 2+ years from receipt) – NWCS – North West Cable System
4.5 Onerous provisions cash release profile
02468101214161820222426283032343638
1H17 2H17 2018 2019 2020 2021 2022 2023 2024
8.67.9
9.5
5.74.6 4.3 4.1
1.70.1
Onerous provision balanceOnerous provision unwind
Notes:1. Onerous contract provisions created on acquisitions2. Include property leases and Metronode contract

48 Operating and Financial Review
Operating and Financial Review (continued)
4. Appendix (continued)
4.6 Below the line Amortisation of Acquired Customer Relationships and Software
Acquired Customer Relationship & Software ($M)
2017 2018 2019 2020 2021 2022 2023 2024 2025 2026 2027 2028 2029 2030
26 26 2618
61 61
87
61
87
61
79-9
47
146 6 6 5 4 466
87
Customer relationship
Software
-31
-34
4.7 Treatment of Deferred Subscriber Acquisition costs
Deferred SAC ($’m) Consumer NZ EW Total
Deferred SAC balances 30/6/16 18 4.3 11.5 33.8
Deferred 25.5 10.6 10.7 46.8
Expensed -9.2 -5 -4.7 -18.9
Deferred SAC balances 31/12/16 34.3 9.9 17.5 61.7
Deferred 25 7.6 11.1 43.7
Expensed -15.6 -7.9 -6.8 -30.3
Deferred SAC balances 30/6/17 43.7 9.6 21.8 75.1
Current Deferred SAC 33.5 8.4 14.5 56.3
Non Current Deferred SAC 10.2 1.3 7.3 18.8
Deferred SAC balances 30/6/17 43.7 9.7 21.8 75.1
FY17 Movements Consumer NZ EW Total
Deferred 50.5 18.2 21.8 90.5
Expensed -24.8 -12.9 -11.5 -49.2
Delta 25.7 5.3 10.3 41.3

Vocus Group Annual Report 2017 49
Liability limited by a scheme approved under Professional Standards Legislation.
Member of Deloitte Touche Tohmatsu Limited
49
Deloitte Touche Tohmatsu ABN 74 490 121 060 Grosvenor Place 225 George Street Sydney, NSW 2000 PO Box N250 Grosvenor Place Sydney, NSW 1220 Australia Tel: +61 2 9322 7000 Fax: +61 2 9322 7001 www.deloitte.com.au
23 August 2017 Dear Board Members
Vocus Group Limited In accordance with section 307C of the Corporations Act 2001, I am pleased to provide the following declaration of independence to the directors of Vocus Group Limited. As lead audit partner for the audit of the financial statements of Vocus Group Limited for the financial year ended 30 June 2017, I declare that to the best of my knowledge and belief, there have been no contraventions of:
(i) the auditor independence requirements of the Corporations Act 2001 in relation to the audit; and
(ii) any applicable code of professional conduct in relation to the audit. Yours sincerely
DELOITTE TOUCHE TOHMATSU
Don Pasquariello Partner Chartered Accountants
The Board of Directors Vocus Group Limited Level 10, 452 Flinders Street Melbourne VIC 3000