australian nut conference - anic 2017/01. salt, bernard - connecting...connecting with the consumer...
TRANSCRIPT
Connecting with the consumer of the future
Bernard Salt AM
28 March 2017
Australian Nut Conference

© 2016 KPMG, an Australian partnership and a member firm of the KPMG network of independent member firms affiliated with KPMG International Cooperative (“KPMG International”), a Swiss entity. All rights reserved. The KPMG name and logo are registered trademarks or trademarks of KPMG International. Liability limited by a scheme approved under Professional Standards Legislation.
The world will want more food, energy and resources … tensions will ensue
Source: Based on UN Population Division data; World Bank World data
Global population 1900-2100 and global cereal production 1961-2014
0
0.5
1
1.5
2
2.5
3
-
2
4
6
8
10
12
1900
1904
1908
1912
1916
1920
1924
1928
1932
1936
1940
1944
1948
1952
1956
1960
1964
1968
1972
1976
1980
1984
1988
1992
1996
2000
2004
2008
2012
2016
2020
2024
2028
2032
2036
2040
2044
2048
2052
2056
2060
2064
2068
2072
2076
2080
2084
2088
2092
2096
2100
Glo
bal c
erea
l pro
duct
ion
(billi
on m
etric
tons
)
Wor
ld p
opul
atio
n (b
illion
s)
Population (projected) Cereal (metric tons)Population (historic)
Food Energy WaterResources
CommoditiesSpaceSecurity

© 2016 KPMG, an Australian partnership and a member firm of the KPMG network of independent member firms affiliated with KPMG International Cooperative (“KPMG International”), a Swiss entity. All rights reserved. The KPMG name and logo are registered trademarks or trademarks of KPMG International. Liability limited by a scheme approved under Professional Standards Legislation.
Big disruption is already here …must build a culture of agility
United States Year USbn1. Apple 1976 690 2. Google 1998 5653. Microsoft 1975 4904. Berkshire Hathaway 1955 4025. Amazon.com 1994 3866. Facebook 2004 3817. Exxon Mobil 1870 3438. JPMorgan Chase 1799 3108. Johnson & Johnson 1886 30910. Wells Fargo 1852 283
Australia Year USbn1. BHP Billiton 1885 1982. Commonwealth Bank 1911 1083. Westpac Banking 1817 83 4. ANZ 1835 655. National Australia Bank 1893 626. Telstra 1901 467. CSL 1916 398. Wesfarmers 1914 359. Woolworths 1924 2510. Macquarie Group 1970 22
Source: Bloomberg Terminal Data as at 9 February 2017; KPMG Demographics

© 2016 KPMG, an Australian partnership and a member firm of the KPMG network of independent member firms affiliated with KPMG International Cooperative (“KPMG International”), a Swiss entity. All rights reserved. The KPMG name and logo are registered trademarks or trademarks of KPMG International. Liability limited by a scheme approved under Professional Standards Legislation.
All major Australian cities will be re-imagined by 2050
19541 Sydney 1,8632 Melbourne 1,5243 Brisbane 5024 Adelaide 4845 Perth 3496 Newcastle 1787 Hobart 958 Wollongong 919 Geelong 7210 Launceston 4911 Ballarat 4812 Toowoomba 4313 Rockhampton 4114 Townsville 4015 Ipswich 3916 Bendigo 3717 Broken Hill 3118 Canberra 2819 Blue Mountains 2320 Kalgoorlie 23
20151 Sydney 4,9212 Melbourne 4,5293 Brisbane 2,3094 Perth 2,0395 Adelaide 1,3176 Gold Coast – Tweed 6257 Newcastle–Maitland 4348 Canberra - Queanbeyan 4259 Sunshine Coast 302
10 Wollongong 29211 Greater Hobart 22112 Geelong 18713 Townsville 18014 Cairns 14815 Greater Darwin 14216 Toowoomba 11517 Ballarat 10018 Bendigo 9319 Albury - Wodonga 8920 Launceston 87
20501 Sydney 7,6882 Melbourne 7,6703 Perth 4,6334 Brisbane 4,1885 Adelaide 1,7976 Gold Coast - Tweed 1,2257 Canberra - Queanbeyan 7228 Newcastle-Maitland 5889 Sunshine Coast 503
10 Wollongong 38411 Townsville 34012 Geelong 30113 Greater Hobart 26514 Cairns 22515 Greater Darwin 20916 Toowoomba 19717 Mackay 19318 Ballarat 18119 Bendigo 16120 Rockhampton 142
Source: Based on data from the Australian Bureau of Statistics; relevant State Government planning authorities; KPMG Demographics

© 2016 KPMG, an Australian partnership and a member firm of the KPMG network of independent member firms affiliated with KPMG International Cooperative (“KPMG International”), a Swiss entity. All rights reserved. The KPMG name and logo are registered trademarks or trademarks of KPMG International. Liability limited by a scheme approved under Professional Standards Legislation.
We have a globally unique consumer culture
Source: relevant local census data; KPMG Demographics
Proportion of city population comprising international-born residents as measured by local censuses
Berlin 13%London 36%
Paris 22%
Madrid 20%
Mumbai 1%
Shanghai 0%Tokyo 2%
Seoul 4%
Singapore 29%
Darwin 33% Cairns 29%Alice Springs 29%
Auckland 39%
Wellington 27%
Adelaide 30%Perth 41% Buenos Aires 13%
Miami 39%San Francisco 36%
Pittsburgh 4%
Toronto 49%New York
29%
Johannesburg 6%
8,000kmMoscow 13%
Vienna 32%
Brisbane 30%
Melbourne 37%
Dubai 83%
Stockholm 30%
Sydney 42%

© 2016 KPMG, an Australian partnership and a member firm of the KPMG network of independent member firms affiliated with KPMG International Cooperative (“KPMG International”), a Swiss entity. All rights reserved. The KPMG name and logo are registered trademarks or trademarks of KPMG International. Liability limited by a scheme approved under Professional Standards Legislation.
New acronyms for our newest tribes
PUMCINS …→ Professional Urban Middle Class In Nice Suburbs
…NETTELs ←Not Enough Time To Enjoy Life
KIPPERS …→ Kids In Parents Pockets Eroding Retirement Savings
…LOMBARDS←Lots Of Money But A Real Dickhead
Source: KPMG Demographics

© 2016 KPMG, an Australian partnership and a member firm of the KPMG network of independent member firms affiliated with KPMG International Cooperative (“KPMG International”), a Swiss entity. All rights reserved. The KPMG name and logo are registered trademarks or trademarks of KPMG International. Liability limited by a scheme approved under Professional Standards Legislation.
The changing ethic mix of the Australian consumer market
Source: KPMG Demographics
2015 2005 Change Change %
India 432,690 148,960 283,730 190%
China 481,820 227,600 254,220 112%
New Zealand 611,380 423,550 187,830 44%
Philippines 236,400 134,580 101,820 76%
United Kingdom 1,204,280 1,116,890 87,390 8%
South Africa 178,680 114,150 64,530 57%
Vietnam 230,170 174,440 55,730 32%
Malaysia 156,460 101,390 55,070 54%
South Korea 102,570 51,150 51,420 101%
Sri Lanka 114,370 70,620 43,750 62%
Top 10 nationalities by country of birth between 2015 and 2005

© 2016 KPMG, an Australian partnership and a member firm of the KPMG network of independent member firms affiliated with KPMG International Cooperative (“KPMG International”), a Swiss entity. All rights reserved. The KPMG name and logo are registered trademarks or trademarks of KPMG International. Liability limited by a scheme approved under Professional Standards Legislation.
The Australian palate has evolved to incorporate “new” foods
ANGLO ASIAN ARAB/PERSIANMEDITERRANEAN

© 2016 KPMG, an Australian partnership and a member firm of the KPMG network of independent member firms affiliated with KPMG International Cooperative (“KPMG International”), a Swiss entity. All rights reserved. The KPMG name and logo are registered trademarks or trademarks of KPMG International. Liability limited by a scheme approved under Professional Standards Legislation.
Australia offers good prospects for business growth
Source: Based on OECD data; KPMG Demographics
2016 2050 Change Working Age Change
1 Australia 24 38 +54% +45%
2 Canada 36 49 +33% +18%
3 United States 324 400 +23% +15%
4 United Kingdom 65 77 +18% +10%
5 New Zealand 4 5 +13% +1%
6 Germany 81 69 -14% -27%
7 Japan 126 97 -23% -34%

© 2016 KPMG, an Australian partnership and a member firm of the KPMG network of independent member firms affiliated with KPMG International Cooperative (“KPMG International”), a Swiss entity. All rights reserved. The KPMG name and logo are registered trademarks or trademarks of KPMG International. Liability limited by a scheme approved under Professional Standards Legislation.
A generation of prosperity has created a culture of aspiration
Source: Based on Australian Bureau of Statistics data; KPMG Demographics
Per cent change in Australian GDP by quarter from December 1960 to December 2016
-1.5
-1
-0.5
0
0.5
1
1.5
2
2.5
3
Dec
-196
0Ju
l-196
1Fe
b-19
62Se
p-19
62Ap
r-196
3N
ov-1
963
Jun-
1964
Jan-
1965
Aug-
1965
Mar
-196
6O
ct-1
966
May
-196
7D
ec-1
967
Jul-1
968
Feb-
1969
Sep-
1969
Apr-1
970
Nov
-197
0Ju
n-19
71Ja
n-19
72Au
g-19
72M
ar-1
973
Oct
-197
3M
ay-1
974
Dec
-197
4Ju
l-197
5Fe
b-19
76Se
p-19
76Ap
r-197
7N
ov-1
977
Jun-
1978
Jan-
1979
Aug-
1979
Mar
-198
0O
ct-1
980
May
-198
1D
ec-1
981
Jul-1
982
Feb-
1983
Sep-
1983
Apr-1
984
Nov
-198
4Ju
n-19
85Ja
n-19
86Au
g-19
86M
ar-1
987
Oct
-198
7M
ay-1
988
Dec
-198
8Ju
l-198
9Fe
b-19
90Se
p-19
90Ap
r-199
1N
ov-1
991
Jun-
1992
Jan-
1993
Aug-
1993
Mar
-199
4O
ct-1
994
May
-199
5D
ec-1
995
Jul-1
996
Feb-
1997
Sep-
1997
Apr-1
998
Nov
-199
8Ju
n-19
99Ja
n-20
00Au
g-20
00M
ar-2
001
Oct
-200
1M
ay-2
002
Dec
-200
2Ju
l-200
3Fe
b-20
04Se
p-20
04Ap
r-200
5N
ov-2
005
Jun-
2006
Jan-
2007
Aug-
2007
Mar
-200
8O
ct-2
008
May
-200
9D
ec-2
009
Jul-2
010
Feb-
2011
Sep-
2011
Apr-2
012
Nov
-201
2Ju
n-20
13Ja
n-20
14Au
g-20
14M
ar-2
015
Oct
-201
5M
ay-2
016
Dec
-201
6
1960s 1970s 1980s 1990s 2000s 2010s
MenziesWhitlam
FraserHawke
GSTGFC

© 2016 KPMG, an Australian partnership and a member firm of the KPMG network of independent member firms affiliated with KPMG International Cooperative (“KPMG International”), a Swiss entity. All rights reserved. The KPMG name and logo are registered trademarks or trademarks of KPMG International. Liability limited by a scheme approved under Professional Standards Legislation.
Our houses have changed … and so too have our expectations
Today1950s
© 2016 KPMG, an Australian partnership and a member firm of the KPMG network of independent member firms affiliated with KPMG International Cooperative (“KPMG International”), a Swiss entity. All rights reserved. The KPMG name and logo are registered trademarks or trademarks of KPMG International. Liability limited by a scheme approved under Professional Standards Legislation.
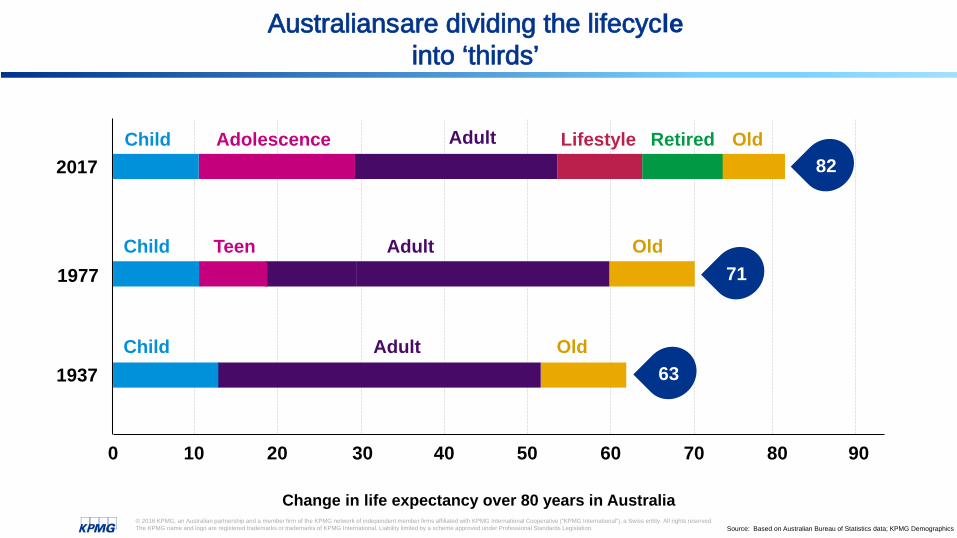
Australians are dividing the lifecycle into ‘thirds’
0 9010 20 30 40 50 60 70 80
1977Child Teen OldAdult
71
2017Child Adolescence Lifestyle OldRetiredAdult
82
1937Child Adult Old
63
Change in life expectancy over 80 years in AustraliaSource: Based on Australian Bureau of Statistics data; KPMG Demographics

© 2016 KPMG, an Australian partnership and a member firm of the KPMG network of independent member firms affiliated with KPMG International Cooperative (“KPMG International”), a Swiss entity. All rights reserved. The KPMG name and logo are registered trademarks or trademarks of KPMG International. Liability limited by a scheme approved under Professional Standards Legislation.
From Boomers to Xers and Ys … and finally to Zeds
Source: KPMG Demographics
HierarchicalIndulged their kidsDepression era parentsSandwich generation
Business investment
BABYBOOMERS
■ Born 1946 – 1964■ Today 52 – 70
YGENERATION
Special … bubble-wrapChaotic connectionEntrepreneurialsDisappointed generation?
Convenience
■ Born 1983 – 2000■ Today 16 – 33
Parents results-orientedYouth in straitened timesHighly educated, globalPragmatists … fixers
After-school snacks
ZGENERATION
■ Born 2001 – 2019■ Today 0 – 15
Forgotten generationWrong place … wrong timeNo workplace guiltAngsty about Ys
On-the-go people
■ Born 1965 – 1982■ Today 34 – 51
XGENERATION

SOCIEn
I f you are w1der 40 and sLarting Lo read this, I politely sugf,,est that you turn the page. There b11't anything here that will interest you . .lust me rabbiting on about
Lhe old days. 13il of a yaw n-fest, really ... I lave they gone? Is it just you and me now' Shhh ... act natural and read this column without making a sound. Do not look up; do not make eye contact wiU1 anyone. Come close to Lhe page. Closer!
I belong to a secret society and I am looking for new recruits. It's a sect known as the Middle-Aged Moralisers. We in the MAM meet monthly in our members' homes in the subwbs, where we disclL,s ... hush ... tl1e youth of today. Why tl1e need for secrecy? Well, if it ever got out that middle-aged people Lalk. about young people, all hell would break loose.
We on ilie l'v1AM membership committee have been watching you. \Ve've seen the pursed lips, the tut-t11tting, the head-shaking. We have seen Lhe sighing, l11e face-palming, the eye-rolling. We iliink. you are one of us. We know it, you know it. Come to our ne,,t meeting. You'll find it liberat.ing to know l11ere are ol11ers just like you.
This week we're di,clL,sing the evil, of hipster cafes. Do you know why hipster cafes have milk crates for seating' To keep baby boomers at bay. They know they can't officially ban us, so what do they do? They rig Ille seating so lllat tight baby-boomer hamsHings recoil al the pmspecl of positioning the buttocks below the latitude of the knees. Sitting is fine. Getting up is problematic. And doesn't. the sub-40 set
BY BERNARD SALT
Moralisers, we need you!
know it. They don't want we over-50s despoiling Ille aulllenlic grooviness of llleir cafes. (ls groovy slill a word?)
Do you know what else hipster cafes do? With malicious aforethought, hip�ter proprietors deliberaleJy design their menus with the tiniest. of writing and print these same menus using a light-coloured ink on light-coloured paper. That is pure evil w1it large. And then these same hipster
proprietors play thumping, pwnping music iliat reverberates off polished conO'ete lloors so as to eliminate all hope of audible conversation. The meandering middle-aged who have naively wm1dered i.nlo hipster cafes are thereby reduced to palhelically lip-reading conversations, hoping to catch ilie odd word so as to guess the meaning of entini sentences.
Don't get me starled on Lhe befuddlement caused by Loilels willl obscure signage. Is Lhal an M or is that a W? Is that a top hat or is that a ladies' bonnet? This is a hipster cafe: they wouldn't have a top hat on the door to tl1e me1is loo. Unless, of cow"Se, they're being ironic. Maybe it is the men's. Why can't we have some light back here? Why can't we have a sign saying men and women?
llul all of U1is is mere ephemera. ll els worse. l have seen young people order smashed avocado wit]) crumbled feta on fivc-f,��1in toasted bread at $22 a pop and more. I can afford local this for lunch because I am middle-aged a.nd have rai�ed m family. But how can yow1g people afford to eat like this? Shouldn't they be economising by eating al home> I low often are they eating ouL? Twenty-two dollm"S several times a week could go towards a deposit on a hotLse.
There. I've said il. I have said what evet)' seo·et middle-aged moraliser has tl10ugh1. hut has never had the cow-age to verbalise. Should you disclose the contents of this conversation, I will disavow all knowledge of you aod of the exi�tence of t11i� secret society. In fact, Lhi� conve1"Sation never took place. Goodbye.

I stopped eating smashed avocado … and now I own a castle

© 2017 KPMG, an Australian partnership and a member firm of the KPMG network of independent member firms affiliated with KPMG International Cooperative (“KPMG International”), a Swiss entity. All rights reserved. The KPMG name and logo are registered trademarks or trademarks of KPMG International. Liability limited by a scheme approved under Professional Standards Legislation.
Knowledge workers are on the rise … maybe leading to a divided society
17 years February quarter 2017 – up 3.2m (8.8m – 12.0m)
Feb 2000 – Feb 2017 (000)Jobs grown: 3,526Jobs contracted: 332Net jobs added: 3,194
Source: Based on Australian Bureau of Statistics data; KPMG Demographics
Professional/Scientific/Tech.
Admin &SupportMining
Retail Trade Financial &InsuranceEducation &
Training
WholesaleTrade
Rental/Hiring& Real Estate
Info Media & Telecoms
Manufacturing
Agriculture/Forestry & Fishing
-200
-100
0
100
200
300
400
500
600
700
800
Public Admin & Safety
Arts &Recreation
Electricity/Gas/Water & Waste
Transport/Postal/Warehouse
Healthcare& Social Assistance
Construction
Accom. &Food
OtherServices

© 2016 KPMG, an Australian partnership and a member firm of the KPMG network of independent member firms affiliated with KPMG International Cooperative (“KPMG International”), a Swiss entity. All rights reserved. The KPMG name and logo are registered trademarks or trademarks of KPMG International. Liability limited by a scheme approved under Professional Standards Legislation.
Australia’s farming community is constantly changing
Selected farmers and growers between the 2006 and 2011 CensusesSource: Based on Australian Bureau of Statistics data; KPMG Demographics
Occupation 2011 2006 Change No. Change %Beef Cattle Farmer 31,857 26,905 4,952 18%Grain, Oilseed or Pasture Grower 9,975 9,510 465 5%Poultry Farmer 2,618 2,582 36 1%Mixed Crop Farmer 2,267 2,311 -44 -2%Vegetable Grower 6,841 7,007 -166 -2%Fruit or Nut Farm Worker 4,004 4,322 -318 -7%Sheep Farmer 10,730 11,368 -638 -6%Sugar Cane Grower 3,724 4,509 -785 -17%Fruit or Nut Picker 2,843 3,728 -885 -24%Fruit or Nut Grower 8,694 9,827 -1,133 -12%Grape Grower 4,976 6,646 -1,670 -25%Dairy Cattle Farmer 13,064 16,112 -3,048 -19%Mixed Crop and Livestock Farmer 34,725 41,347 -6,622 -16%Total 136,318 146,174 -9,856 -7%

© 2016 KPMG, an Australian partnership and a member firm of the KPMG network of independent member firms affiliated with KPMG International Cooperative (“KPMG International”), a Swiss entity. All rights reserved. The KPMG name and logo are registered trademarks or trademarks of KPMG International. Liability limited by a scheme approved under Professional Standards Legislation.
2016-201710.8%2.2%3.0%1.9%1.6%1.1%4.2%2.0%3.5%-4.0%1.6%-6.0%1.6%2.2%
Australians put lifestyle, and some indulgence, first
Per cent change in retail sales in Australia for 13 categories over ten and five years and over 12 months to January 2017
Source: Based on Australian Bureau of Statistics data; KPMG Demographics
2012-201730.2%18.9%17.0%34.6%23.5%33.8%29.6%20.4%24.7%20.2%20.9%4.9%
-25.9%23.3%
2007-201776.8%76.6%71.5%69.8%61.9%51.8%47.3%36.0%33.1%24.6%22.0%12.7%-19.0%50.1%
IndustryTakeaway foodPharmaceutical, cosmetic & toiletriesLiquorCafes, restaurants & catering Supermarket & grocery storesHardware, building & garden suppliesClothingFootwear & other personal accessoriesFurniture, floor coverings, housewares, textilesRecreational goodsElectrical & electronic goodsDepartment storesNewspapers & booksTotal (incl other)

© 2016 KPMG, an Australian partnership and a member firm of the KPMG network of independent member firms affiliated with KPMG International Cooperative (“KPMG International”), a Swiss entity. All rights reserved. The KPMG name and logo are registered trademarks or trademarks of KPMG International. Liability limited by a scheme approved under Professional Standards Legislation.
Net growth in population aged 65+ over 100 years in AustraliaSource: Based on Australian Bureau of Statistics data; KPMG Demographics
More and more older Australians in the market
-
20,000
40,000
60,000
80,000
100,000
120,000
140,000
160,00019
50
1954
1958
1962
1966
1970
1974
1978
1982
1986
1990
1994
1998
2002
2006
2010
2014
2018
2022
2026
2030
2034
2038
2042
2046
2050
1950 20001975 2025 2050
1950: 0.7m2016: 3.7m2050: 7.9m

© 2016 KPMG, an Australian partnership and a member firm of the KPMG network of independent member firms affiliated with KPMG International Cooperative (“KPMG International”), a Swiss entity. All rights reserved. The KPMG name and logo are registered trademarks or trademarks of KPMG International. Liability limited by a scheme approved under Professional Standards Legislation. Source: Icons made by Roundicons, Popcorn Arts from www.flaticon.com, Shutterstock
Points to consider
Australia has a natural advantage in agribusiness … we
should be leveraging off our clean green image and feeding Asia
and beyond
1
The Australian consumer is more health conscious
than ever ... opportunity to
expand nut consumption as a source of protein
2
As with many agribusiness
businesses nut growing must
professionalise … bigger, more sophisticated
operations in the future
3

© 2016 KPMG, an Australian partnership and a member firm of the KPMG network of independent member firms affiliated with KPMG International Cooperative (“KPMG International”), a Swiss entity. All rights reserved. The KPMG name and logo are registered trademarks or trademarks of KPMG International. Liability limited by a scheme approved under Professional Standards Legislation.
Introducing Australia’s bachelor hot spot …
Mullumbimby1.63:1
Roxby Downs1.88:1
Hotspot suburbs for single men and women aged 25-34 at the 2011 Census
“Highway of Love”
Source: Based on Australian Bureau of Statistics data; KPMG Demographics
Barrier Highway

www.bernardsalt.com.au

© 2016 KPMG, an Australian partnership and a member firm of the KPMG network of independent member firms affiliated with KPMG International Cooperative (“KPMG International”), a Swiss entity. All rights reserved. The KPMG name and logo are registered trademarks or trademarks of KPMG International. Liability limited by a scheme approved under Professional Standards Legislation.
kpmg.com.au kpmg.com.au/app
© 2016 KPMG, an Australian partnership and a member firm of the KPMG network of independent member firms affiliated with KPMGInternational Cooperative (“KPMG International”), a Swiss entity. All rights reserved.
The KPMG name and logo are registered trademarks or trademarks of KPMG International.
Liability limited by a scheme approved under Professional Standards Legislation.
The information contained in this document is of a general nature and is not intended to address the objectives, financial situation or needs of any particular individual or entity. It is provided for information purposes only and does not constitute, nor should it be regarded in any manner whatsoever, as advice and is not intended to influence a person in making a decision, including, if applicable, in relation to any financial product or an interest in a financial product. Although we endeavour to provide accurate and timely information, there can be no guarantee that such information is accurate as of the date it is received or that it will continue to be accurate in the future. No one should act on such information without appropriate professional advice after a thorough examination of the particular situation.
To the extent permissible by law, KPMG and its associated entities shall not be liable for any errors, omissions, defects or misrepresentations in the information or for any loss or damage suffered by persons who use or rely on such information (including for reasons of negligence, negligent misstatement or otherwise).