audit of care for children aged 6 to 59 months admitted
TRANSCRIPT

AUDIT OF CARE FOR CHILDREN AGED 6 TO 59 MONTHS
ADMITTED WITH SEVERE MALNUTRITION AT KENYAtTA
NATIONAL HOSPITAL
A DISSERTATION SUBMITTED IN PART FULFILMENT OF THE
REQUIREMENTS FOR TH E DEGREE OF MASTER OF MEDICINE IN
PAEDIATRICS AND CHILD HEALTH, UNIVERSITY OF NAIROBI
Principal investigator
Dr. Charles M. rioki
MB.ChB, Nairobi.
2009
i

DECLARATION
I declare that this dissertation in part fulfilment of the requirements for M.Med,
Paediatrics and Child Health is my original work and has not been presented at any
University or forum.
Date / 4 - 1 ? / 2 . 0 0 ?
M.B. ChB, University o f Nairobi.
THIS DISSERTATION HAS BEEN SUBMITTED WITH OUR APPROVAL AS THE
SUPERVISORS.
Signed—^ ^ = ^ 0 = ^ - - . : -------- p ate - l b f e - 1 ^ . 1
Dr. Irimu Grace
Lecturer, Department of Paediatrics,
University o f Nairobi.
Signed- — Date
Professor Musoke Rachel
Associate Professor, Department o f Paediatrics,
University o f Nairobi.
Dr. English Mike U* V_
Honorary Lecturer, Department o f Paediatrics,
University o f Nairobi.
u

DEDICATION
I dedicate this work to my lovely wife Lois and our three lovely
children Mbindyo, Muuo and Mukii.
in

ACKNOWLEDGEMENT
I wish to acknowledge members o f the Department o f Paediatrics, University of Nairobi
both collectively and individually for their valuable guidance and comments during the
proposal development and write up of this book. I wish to acknowledge specifically Dr.
Dalton Wamalwa for his very useful comments and guidance in the proposal
development.
I wish to thank my supervisors for their support and encouragement that went a long way
to make this study possible.
I thank all the children who took part in this study and their parents and guardians for
allowing me to carry out this study.
I wish to thank my wife Lois and our children Mbindyo, Muuo and Mukii for their
understanding and support that made it possible for me to carry out this study.
Finally 1 wish to thank all nurses and nutritionists in the Paediatric wards for their
valuable support and assistance that enabled me to carry out this study.
IV

TABLE OF CONTENTS
TITLE i
TABLE OF CONTENTS v
ABBREVIATIONS vii
ABSTRACT viii
1.0 INTRODUCTION AND LITERATURE REVIEW 1
2.0JUSTIFICATION AND UTILITY 5
3.0 STUDY QUESTION 6
4.0 STUDY OBJECTIVES 6
5.0 STUDY METHODS 7
6.0 DATA MANAGEMENT 10
7.0 ETHICAL CONSIDERATIONS 10
8.0 RESULTS 11
8.1 EMERGENCY CARE AT PFC 15
8.2 WARD MANAGEMENT 18
8.3 BLOOD TRANSFUSION PRACTICES 25
8.4 HIV STATUS 25
8.5 NURSING PROCEDURES 25
8.6 OUTCOME 26
8.7 INVENTORY OF ESSENTIAL SUPPLIES 27
8.8 CAREGIVERS KNOWLEDGE /PRACTICES 28
9.0 DISCUSSION 29
APPENDICES
Appendix 1. Consent form for parents 35
v

Appendix 2. Consent form for health workers 37
Appendix 3. Data collection tool 38
Appendix 4. Care giver interview form 42
Appendix 5. Health workers questionnaire 43
Appendix 6. Time scale ten steps 44
Appendix 7. Micronutrient doses 44
Appendix 8. Fluid management chart 45
Appendix 9. Feed chart 46
Appendix 10. WHO/NCHS Z scores (weight: height) 47
REFERENCES 49
vi

ABBREVIATIONS
ANOVA Analysis of Variance
ETAT Emergency triage assessment and treatment
ELISA Enzyme Linked Immunosorbent Assay
HIV Human Immunodeficiency Virus
HSD Half Strength Darrow’s
IV Intravenous
IVF Intravenous fluids
KDHS Kenya Demographic and Health Survey
KNH Kenyatta National Hospital
RTUF Ready to use Formula
NCHS National Centre for Health Statistics
NGT Nasogastric Tube
ORS Oral Rehydration Solution
PCR Polymerase Chain Reaction
PFC Paediatric Filter Clinic
PI Principal Investigator
PO Per Oral
RBS Random Blood Sugar
ReSoMal Rehydration Solution for Malnutrition
UNICEF United Nations Children Fund
UoN University of Nairobi
WHO World Health Organization
Vll

ABSTRACT
Background: World Health Organization treatment guidelines for severe malnutrition
aim to improve the quality o f inpatient care and reduce mortality. This study audited
quality o f care for severely malnourished children admitted at Kenyatta National
Hospital, a large tertiary level health facility.
Patients and methods: This was a prospective study o f 101 children, aged 6 to 59
months with severe malnutrition admitted between 1st February and 28th April 2008. A
data pro-forma sheet was prepared according to steps in the WHO guidelines and applied
to each patient thus assessing care provided during hospitalization. The care of the
children was provided by clinicians, nurses and nutritionists.
Results: Overall, 58.5% of children had marasmus and 47.5% of children were younger
than one year old. Common co-morbidities at admission were diarrhoea (70.3%) and
pneumonia (51.4%). O f the eight steps o f care evaluated, five steps were followed
correctly in less than 55% of cases. The proportion o f children appropriately managed
was 7.9 % (95% Cl 2.6-13.2) in step 1, 46.5% (95% Cl 36.8-56.2) in step 2, 54.9 %( 95%
Cl 43.3-66.5) in step 3, 55.4% (95% Cl 45.7-65.1) in steps 4 and 6. 90% (95% Cl 85.1-
96.9) in step 5,16.8% (95% Cl 9.5-24.1) in step 7 and 23.8% (95% Cl 13.6-34.0) in step
8.
Conclusion: Quality o f care for children admitted with severe malnutrition at KNH is
inadequate and often does not follow the evidence based WHO guidelines.
V lll

1.0 INTRODUCTION AND LITERATURE REVIEWSevere malnutrition is a common cause of preventable morbidity and mortality among
children aged below 5 years in developing countries [1]. Globally levels o f malnutrition
have not declined since 1980 and sub Saharan Africa shoulders the highest burden of
childhood malnutrition [2, 3]. In the year 2004, prevalence of malnutrition in children
aged below 5 years worldwide was estimated at 29%, with levels in the African continent
estimated at 33.8% [2]. According to the Kenya Demographic and Health Survey
(KDHS) o f the year 2003, the prevalence o f stunting, underweight and wasting among
children aged below 5 years were 31%, 20% and 6%, respectively [4], The trends in
nutritional indicators as measured in the 1993, 1998, 2003 KDHSs, document no
significant change in prevalence o f malnutrition in Kenya over the last 10 years [4, 5],
Malnutrition forms an important risk factor for illness and death among young children
and is an underlying cause of 60% of the 12 million deaths from preventable causes
among children aged below five years [6-8]. World Heath Organizations estimates that
worldwide, 9 % of children below five years suffer from wasting and are at increased risk
o f death or severe impairment o f growth and psychological and cognitive development.
Severe malnutrition is estimated to be a direct cause o f 300,000 deaths annually mainly in
sub-Saharan Africa [6].
The World Health Organization (WHO) defines severe malnutrition requiring hospital
admission as weight for height measurement of less than 70% o f the median or three
standard deviations or more below the mean NCHS/WHO reference values (severe
wasting), the presence of symmetrical bipedal pitting edema of nutritional origin
(edematous malnutrition) or visible signs of severe malnutrition in children aged less than
five years [1].Severe malnutrition is a common problem in hospitals in economically
poor countries and is associated with poor outcome [9, 10], Over the last five decades,
hospital mortality rates o f severe malnutrition have remained high with an average case
fatality rate o f 20% to 30% and rates of up to 50% being found in many hospitals in
developing countries, particularly in Africa [7, 11-13], Therefore improving clinical
management and appropriate care of severe malnutrition forms an important part of
1

fulfilling the fourth United Nations Millennium Development Goal that aims at reducing
by two thirds the mortality rate among children aged below five years by the year 2015
from the baseline of year 1990 [14]. The high inpatient death of severe malnutrition in the
developing world has been attributed to an outdated and inappropriate clinical care and
that mortality is preventable with correct management [1, 7, 15-17].
In severe malnutrition physiological adaptations to low food intake results in reductive
adaptation o f all body systems and this limits the ability of the body to respond to
infections and other stressors. Marasmus results from loss of subcutaneous fat and
muscles because of endogenous mobilization of all available energy and nutrients.
Kwashiorkor manifests with edema, changes to hair and skin color, anaemia,
hepatomegally, lethargy and severe immunodeficiency. One essential effect o f severe
malnutrition is the fatty degeneration of the heart which causes subclinical or overt
cardiac insufficiency and increases the risk o f cardiac failure with iatrogenic fluid or
sodium load. Loss of subcutaneous fat markedly reduces the body’s capacity for
temperature regulation and water storage.
As a consequence malnourished children become dehydrated, hypothermic and
hypoglycemic more quickly and severely than normal children. Associated atrophy of the
mucosa o f the small bowel leads to loss o f absorptive as well as loss of digestive
capacity. Severe malnutrition is associated with chronic hypovolemia leading to
secondary hyperaldosteronism. This causes sodium retention and loss o f potassium
through urine excretion hence severely malnourished have low total body potassium.
Severely malnourished children have immunodeficiency in the humoral and cellular
subsystem from protein deficiency and also lack immune mediators like tumor necrosis
factor. Most children with severe malnutrition have asymptomatic infections because
their immune system fails to respond with chemotaxis, opsonization, and phagocytosis of
bacteria, fungi or viruses. Hence severely malnourished children are at risk o f several life
threatening problems mainly hypoglycemia, hypothermia, serious infection, and severe
electrolyte disturbances mainly low body potassium levels.
2

The management of children with severe malnutrition emphasizes systematic approach to
care mainly careful assessment, special treatment and management with regular feeding
of small quantities of appropriate feeds, slow rehydration using low sodium fluids and
monitoring due to the increased vulnerability. In an effort to improve the quality of
hospital care for severely malnourished children and reduce case fatality rates, the World
Health Organization developed evidence based clinical guidelines on the treatment and
management of severe malnutrition in developing countries that emphasizes adequate and
prompt triage, assessment and treatment [1, 18-21]. The WHO protocol gives 10 steps
that need to be followed in the hospital care o f severe malnutrition divided into
stabilization and rehabilitation phases. For successful treatment o f severe malnutrition,
the guidelines emphasizes effective and prompt handling of complications and co
morbidities, mainly treatment and prevention o f hypoglycemia, hypothermia,
dehydration, electrolyte imbalance, infection, micronutrient deficiencies, use of
appropriate starter and rehabilitation feeds, sensory and emotional support and
preparation for future follow up. The guidelines have since then been adopted by the
Ministry o f Health, Kenya and incorporated into the Basic Pediatric Protocol [22].
Sufficient evidence exists to show that use of appropriate oral rehydration solution,
antibiotics, and micro nutritional and electrolyte supplements, mainly zinc, vitamin A,
potassium, feeding regimens results in reduction o f child mortality from severe
malnutrition [23, 24]. In addition to nutritional and medical treatment, love and care, a
stimulating environment, structured play therapy, and mothers involvement in the care of
the child are important components of successful therapy of the severely malnourished
child [25],
Studies have provided evidence that use of the standardized WHO protocol results in
improvement of care and subsequently a decline in case fatality associated with severe
malnutrition. In a review of 140 studies on management of severe malnutrition in
developing countries, Bhan et al, found evidence that carefiil assessment and appropriate
treatment using WHO standardized protocol reduces morbidity and mortality [16].
[hough case fatality rate of severe malnutrition remained high in many hospitals in
developing countries averaging 40% to 50%, hospitals that had adopted the standardized
3

treatment protocol reduced case fatality to as low as 6% . It was observed that severely
malnourished children managed using standardized treatment protocol had less risk of
hypoglycemia, were more successfully rehydrated orally, had less risk for severe
complications, had uneventful discharge and had a greater weight gain than those
managed on non protocol treatment [24].
In a pre and post intervention study, Ashworth et al, observed that case fatality rates from
severe malnutrition markedly fell in two hospitals in South Africa after implementation
of WHO treatment protocol despite inadequate resources and incomplete implementation
of guidelines [17]. Case fatality rates fell from 46% to 21% and 25% to 18% respectively
at both Mary Theresa and Sipetu hospitals. Practices those were associated with a decline
in case fatality in the post intervention period included 3 hourly feeds day and night,
keeping children warm, giving oral instead o f intravenous fluids except in shock, routine
administration of antibiotics and micronutrients and elimination o f diuretics for
kwashiorkor. However mortality rates remained higher than the target rate o f 5% in the
WHO protocol. It was observed that most deaths that occurred were preventable and case
fatality rates of 5% were possible in both hospitals if all avoidable causes o f death could
be eliminated. Poor case management resulting from errors by doctors and nurses was the
main determinant of death. Deaths were attributed to inadequate feeding, poor
management o f dehydration and infection, inadequate resources, weak health systems and
inadequate knowledge and skills o f hospital staff. Implementation of the WHO protocol
was shown to be feasible and that generally it resulted in improvement of quality of care.
Similarly in Malawi where full compliance with protocol was not achieved, Morris et
al, observed that mortality rates fell from 55% to 15.7% before and after implementation
o f WHO standardized protocol [26], However faulty management o f dehydration,
hypoglycemia and hypothermia continued to impact negatively on outcome and only
39% of children attained target o f 100% weight for height.
Other studies done in Brazil, Colombia and South Africa have provided strong evidence
that use o f WHO standardized treatment protocol improves outcome and reduces case
4
fatality o f severe malnutrition [27-29]. Benefits were observed despite inadequate
implementation of protocol. Fifty per cent o f deaths in children with severe malnutrition
managed with non-protocol treatment occurred in the first 48 hours .Severe dehydration
at admission, inadequate management and treatment of sepsis, hypoglycemia,
hypothermia, and poor feeding and rehydration practices were the main risk factors for
death. Gerardo et al observed that the quality of care was generally poor where WHO
standardized protocols was not used and this lead to unnecessary deaths and morbidity
130].
2.0 JUSTIFICATION AND UTILITY OF STUDYSevere malnutrition is an important cause of childhood morbidity and mortality at
Kenyatta National Hospital, contributing about 5% o f all admissions and 10% of all
paediatric deaths [31]. Hospital statistics for the period 1999 to 2005 reveals that 21.7 to
28.8% of children admitted with severe malnutrition died. Comparison with Previous
studies done at KNH among children admitted with severe malnutrition show no decline
in case fatality rates over the last 30 years [32, 33]. Adoption and use o f standardized
WHO treatment protocol in hospitals worldwide has been shown to result in a decline in
hospital case fatality rate for severe malnutrition.
At Kenyatta National Hospital there is no official hospital protocol for the management
of severe malnutrition but components of the WHO guidelines have been incorporated in
the Hospital Standard Operating Procedures (SOPs) o f the year 2006. Although the WHO
guideline on management of severe malnutrition has not been formally introduced at
KNH, some members o f staff have undergone training on Emergency Triage Assessment
and treatment plus admission (ETAT+) in which care for children with severe
malnutrition forms a critical component of the training. Moreover, it is reasonable to
expect clinicians at KNH to follow WHO evidence based treatment protocol since KNH
is a teaching hospital. The extent to which care based on WHO guidelines was practiced
in this hospital was unknown.
5
No study had been carried out to assess the care given to children with severe
malnutrition at Kenyatta National Hospital and how it compares to WHO guidelines.
Hence, it was important to systematically evaluate the care given to severely
malnourished children and determine areas, which require improvement.
This study documented the care for severe malnutrition at Kenyatta National Hospital and
how the current practices compared to World Health Organization guidelines. The study
focused on the first 8 steps of care due to their impact on mortality.
The results obtained would be expected to provide a basis on how to improve care, and
guide future policy formulation with regards to management o f severe malnutrition at
KNH.
3.0 STUDY QUESTIONTo what extent does inpatient care for children with severe malnutrition at Kenyatta
National Hospital follow World Health Organization guidelines?
4.0 OBJECTIVES OF THE STUDY
4.1 Broad objective
To audit care of severely malnourished children aged between 6 and 59 months at
Kenyatta National Hospital
4.1.1 Specific objectives
1. To describe the current practices in inpatient care of severely malnourished
children at KNH
2. I o determine the proportion of children appropriately managed according to the
first eight steps of care
6
5.0 METHODS
5.1 Study design
Prospective audit of care for patients admitted with severe malnutrition at KNH.
5.1.1 Study area
This study was carried out in the general paediatric wards of Kenyatta National Hospital.
Kenyatta National Hospital is a 2000 bed hospital that serves both as a teaching hospital
and a national tertiary referral health facility. It is also the primary referral facility for
Nairobi Province and surrounding districts. The hospital has four general paediatric
wards each with a section reserved for the admission o f severe malnutrition. Patients are
admitted to the wards from the Paediatric Filter Clinic (PFC). Clinical care in PFC is
given by a Consultant Paediatrician, Resident-Paediatrician, Paediatric Clinical Officers
and Nurses. Consultant Paediatricians, Resident Paediatricians, Medical Officer Interns,
nurses, nutritionists and other essential paramedics cover the wards. The resident
Paediatricians together with the Medical Officer Interns are responsible for the initial
evaluation and management of patients admitted to the wards with the ward consultants
doing further re-evaluation and management of patients during routine ward rounds.
Administration of drugs, fluids, feeds and monitoring o f patients is done by the nurses.
The nutritionists are responsible for the preparation and provision of appropriate feed,
weight monitoring, nutritional counselling and nutritional follow up once patients are
discharged.
5.1.2 Study population
Children aged 6 to 59 months admitted with a diagnosis o f severe malnutrition.
7

5.1 J Sample size calculation
The sample size was calculated according to WHO formula for calculating one sample
size using precision around a proportion [34].
The following formula was used:
n= z^n-p)d2
N = minimum sample size required for the study
z = 1.96 (normal deviate corresponding to 95 % confidence interval)
d = 0.1 (Accepted degree of precision around mean. This precision would give a small
sample size and results obtained would have a confidence interval o f ±10% around
estimates o f the proportion of children receiving appropriate care)
p = 50 %( the proportion of children with severe malnutrition receiving appropriate care.
This value is unknown but is assumed to be 50%)
Thus
n = 1.962 * 0.5 * 0.5
0.12
= 96
The minimum number of subjects was 96.
5.2 Inclusion criteria
■ Children aged 6 to 59 months with severe malnutrition (defined as WHZ< -3SD
or edema of both feet)
■ Informed consent obtained from parent / guardian.
5.2.1 Exclusion criteria
■ Children with severe malnutrition secondary to known chronic illnesses — cancer,
cardiac disease, renal disease.
8
5.2.2 Sampling criteria
Consecutive enrolment o f patients who satisfied the study criteria and for whom consent
was given was done until the desired sample size was achieved.
53 Study procedures
The Principal Investigator (PI) visited the general paediatric wards daily between 8 am
and 9 pm and recruited eligible patients. Informed consent was obtained from the parent /
guardian before a patient was recruited into the study (Appendix 1). All patients enrolled
in the study had weight and length/height measured and Z scores calculated as per
NCHS/WHO reference values and documented. Weight was measured to the nearest 100
gm using Soehnle electronic scale and height/length to the nearest centimeter using a
modified stadiometer obtained from United Nations Children’s Fund (UNICEF) .To
ensure uniformity in measurement and reduce the margin of error; all measurements were
done by the principal investigator. The PI reassessed the nutritional status of patients
admitted to the ward with a diagnosis of severe malnutrition on day 1 o f admission and
relevant clinical findings were documented in a pro-forma sheet (appendix 2). Children
who did not satisfy the eligibility criteria were not enrolled in the study. Review of case
records was done on day 7 and on death or discharge. Relevant information was
abstracted and entered in a pro- forma sheet. Information collected was supplemented
with information obtained through a structured interview with care givers and also direct
observations done in the ward during recruitment and daily visits (Appendix 5). .
Care givers were interviewed at the end of first week using an open ended questionnaire
on the care given to the child in the initial phase of treatment for those children who were
alive by end o f the first week
An inventory of commodities necessary in the management o f severe malnutrition,
availability and reliability of supplies was done using a self administered questionnaire
with nurses and nutritionists (appendixes 3 and 4).
9

6.0 DATA MANAGEMENTThe principal investigator was responsible for collection, computer entry, and safety of
data. All data were handled in strict confidence. Data were checked for completeness,
accuracy, and consistency and entered into computer. Data were analyzed using SPPS
version 14 software. Weight for height Z scores were calculated using EPINUT.
Descriptive data are presented as frequency tables, bar graphs, pie charts and cross
tabulation. Categorical data were compared using chi square, while student’s t test and
analysis o f variance (ANOVA) were used for comparison o f continuous data. An
outcome was considered significant if p value was equal or less than 0.05. Summary of
inventories, regularity o f supplies, staff and care giver perceptions were made.
7.0 ETHICAL CONSIDERATIONSApproval to carry out the study was given by K.NH Ethics Review and Research
committee. Data were secured to ensure confidentiality. A written consent was obtained
from parent/ guardian for any child to be enrolled into the study. Any life threatening
condition identified was communicated to the ward clinician and resuscitation and
emergency care was done if indicated. For the health workers, informed consent was
obtained before participation in the study.
10

8.0 RESULTS
This study was conducted in the general paediatric wards o f KNH from 1st February to
28th April 2008. A total o f 101 children admitted with severe malnutrition were recruited
in the study. Out of these, 58 (57%) were boys and 43 (43 %) were girls giving a male:
female ratio 1.4:1.
The most frequent type of severe malnutrition was marasmus (58%), followed by
marasmic-kwashiorkor (27%) and kwashiorkor (15%) as shown in table 1 below.
TABLE 1: Sex distribution according to type of malnutrition N=101
Marasmus Kwashiorkor Marasmic-Kwashiorkor Total
Male (%) 36(62.1%) 11(19%) 11(19%) 58(57%)
fem ale (%) 23(53.5%) 4(9.3%) 17(37.2%) 43(43%)
Total (%) 59(58.4%) 15(14.9%) 27(26.7%) 101(100%)
On further analysis, there was no sex based differences in frequency between
kwashiorkor and marasmus (OR 1.76, 95% Cl 0.44-7.51, p value=0.38) and between
marasmic-kwashiorkor and marasmus (OR 0.41, 95% Cl 0.15-1.14, p value=0.058).
11

The median age was 13.0 months with a range of 6 to 59 months. Overall 85.1% of the
children were aged below 24 months.
As illustrated in figure 1 below children with marasmus were significantly younger than
those with kwashiorkor and marasmic- kwashiorkor. The mean age for children with
marasmus was 14.4 months (SD±8.5), kwashiorkor 21.9 months (SD±13.8) and
marasmic- kwashiorkor 18.7 months (SD±10.6) and this was statistically significant
ANOVA p value=0.019.
Fig 1: Age distribution by type of malnutrition N=101
Ca*3O'0>
■ Marasmus
■ Kwashiokor
Marasmus-Kwashiokor
Age in months
12
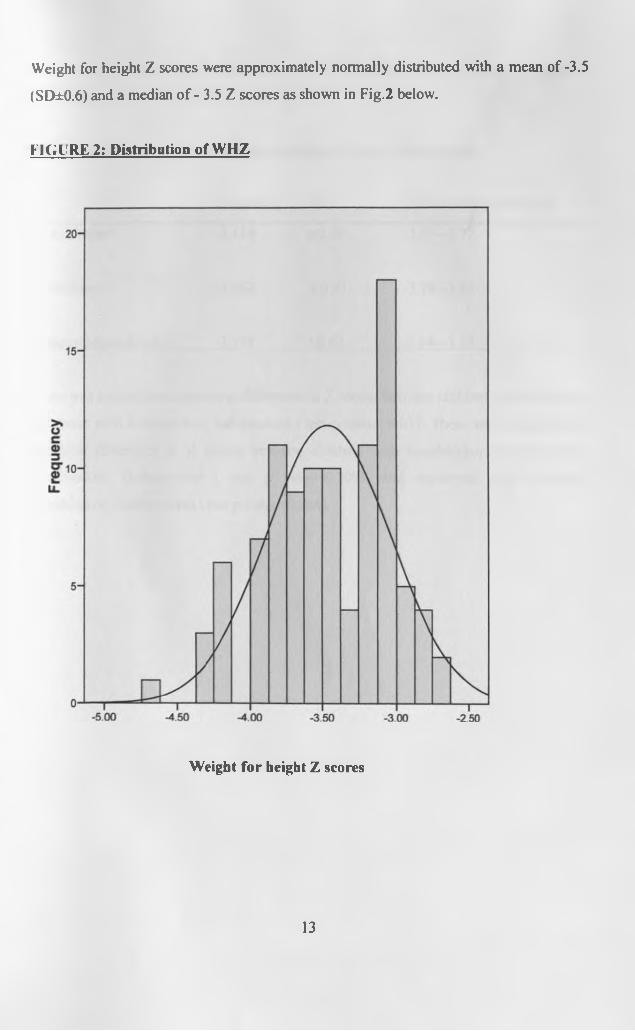
Weight for height Z scores were approximately normally distributed with a mean of -3.5
(SD±0.6) and a median o f - 3.5 Z scores as shown in Fig.2 below.
FIGURE 2; Distribution of WHZ
Weight for height Z scores
13

The mean Z score for kwashiorkor was -3.15, marasmus -3.56 and marasmic-
kwashiorkor -3.39 as illustrated in table 2 below.
TABLE 2: Z scores weight/ height according to type of malnutrition
MeanWHZ SD 95% confidence interval
Kwashiorkor -3.154 ±0.69 -3.54-2.77
Marasmus -3.563 ±0.53 -3.70-3.43
Marasmic-kwashiorkor -3.391 ±0.62 -3.64-3.15
There was a significant statistical difference in Z scores between children with marasmus
and those with kwashiorkor, independent t test p value=0.017. There was no significant
statistical difference in Z scores between children with kwashiorkor and marasmic-
kwashiorkor, (independent t test p value=0.209), and marasmus and marasmic-
kwashiorkor, (independent t test p value=0.204).
14
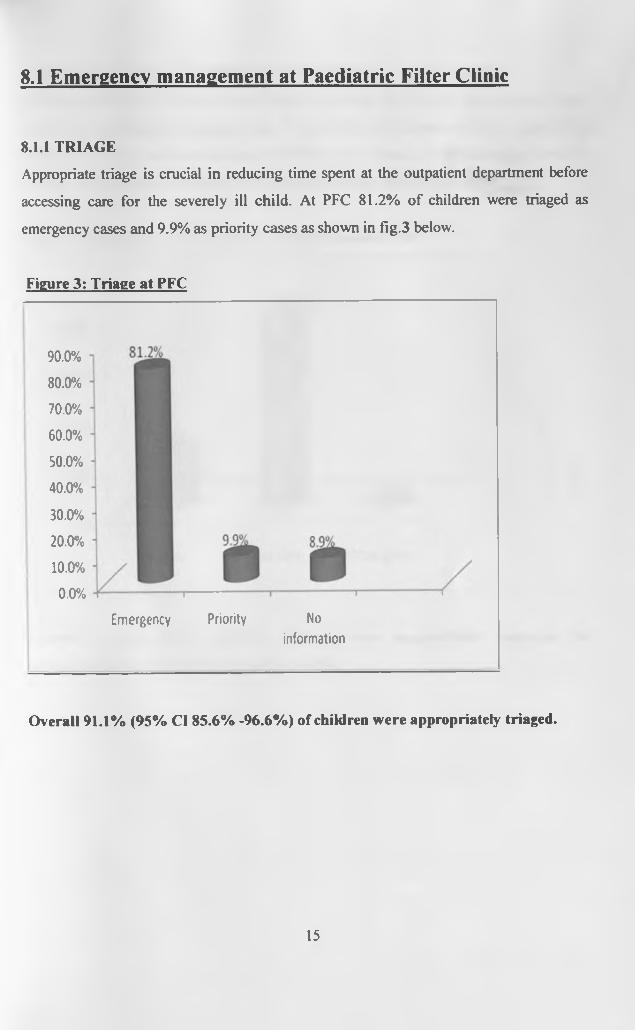
8.1 Emergency management at Paediatric Filter Clinic
8.1.1 TRIAGE
Appropriate triage is crucial in reducing time spent at the outpatient department before
accessing care for the severely ill child. At PFC 81.2% of children were triaged as
emergency cases and 9.9% as priority cases as shown in fig.3 below.
Figure 3: Triage at PFC
90.0%
80.0%
70.0%
60.0%
50.0%
40.0%
30.0%
20.0%
10.0%
0.0%
Emergency Priority No
information
Overall 91.1% (95% Cl 85.6% -96.6%) of children were appropriately triaged.
15

8.1.2 STEP 1: TREAT / PREVENT HYPOGLYCEMIA AT PFC N=101
As illustrated in figure 4 below, out o f the 101 children, 23 (22.8 %) had a random blood
sugar done at pediatric emergency clinic. Two children had a random blood sugar (RBS)
less than 3 mmol/1 and this was corrected with right volume of 10% dextrose bolus. No
feeding or presumptive treatment for hypoglycemia was documented at PFC.
Figure 4: Diagnosis and Treatment of hypoglycemia at PFC
Overall a total of 23 (22.8%) children were appropriately managed for
hypoglycemia at PFC (95% Cl 14.6%-31.0%).
16
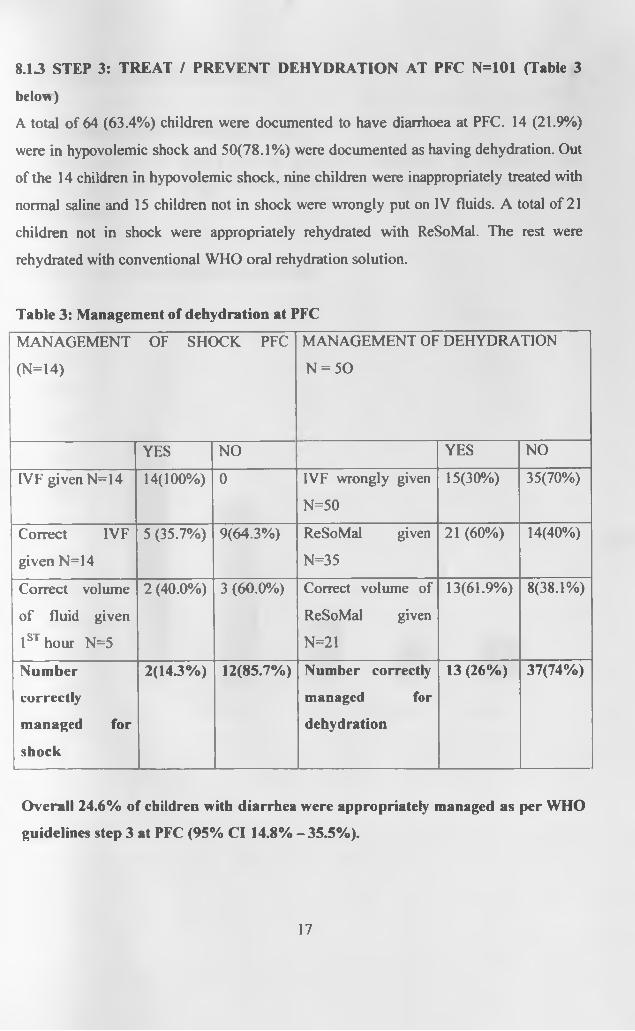
8.13 STEP 3: TREAT / PREVENT DEHYDRATION AT PFC N=101 (Table 3
below)
A total of 64 (63.4%) children were documented to have diarrhoea at PFC. 14 (21.9%)
were in hypovolemic shock and 50(78.1%) were documented as having dehydration. Out
of the 14 children in hypovolemic shock, nine children were inappropriately treated with
normal saline and 15 children not in shock were wrongly put on IV fluids. A total of 21
children not in shock were appropriately rehydrated with ReSoMal. The rest were
rehydrated with conventional WHO oral rehydration solution.
Table 3: Management of dehydration at PFC
MANAGEMENT OF SHOCK PFC
(N=14)
MANAGEMENT OF DEHYDRATION
N = 50
YES NO YES NO
IV F given N=14 14(100%) 0 IVF wrongly given
N=50
15(30%) 35(70%)
Correct IVF
given N=14
5 (35.7%) 9(64.3%) ReSoMal given
N=35
21 (60%) 14(40%)
Correct volume
of fluid given
1st hour N=5
2 (40.0%) 3 (60.0%) Correct volume of
ReSoMal given
N=21
13(61.9%) 8(38.1%)
Number
correctly
managed for
shock
2(143% ) 12(85.7%) Number correctly
managed for
dehydration
13 (26%) 37(74%)
Overall 24.6% of children with diarrhea were appropriately managed as per WHO
guidelines step 3 at PFC (95% Cl 14.8% - 35.5%).
17

8.2 WARP MANAGEMENT
8.2.1 CO-MORBID CONDITIONS N=101
The most common co-morbid clinical conditions documented at admission were
diarrhoea and pneumonia (Fig.5). Many children had more than one co-morbid condition
at presentation.
Figure 5: Co-morbid conditions at admission
100.0% T
90.0% •
80.0%
70.0%
60.0% •
50.0%
40 .0% -
30.0%
20 .0% -
10.0% ■
0 .0%
1<^%
IDiarrhea Pneumonia Rickets Meningitis Others
18
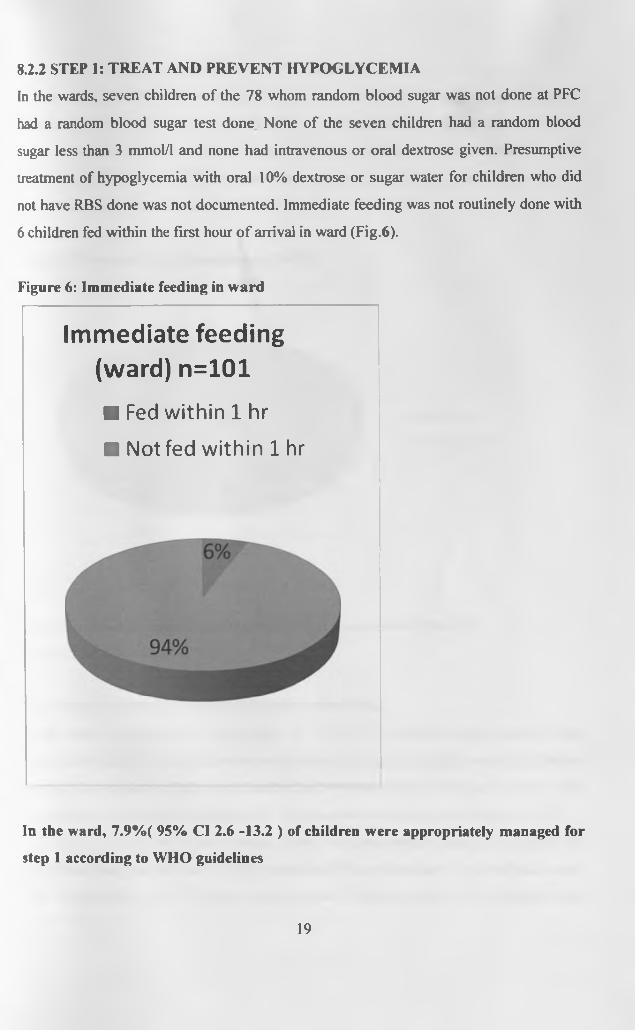
8.2.2 STEP 1: TREAT AND PREVENT HYPOGLYCEMIA
In the wards, seven children of the 78 whom random blood sugar was not done at PFC
had a random blood sugar test done None of the seven children had a random blood
sugar less than 3 mmol/1 and none had intravenous or oral dextrose given. Presumptive
treatment of hypoglycemia with oral 10% dextrose or sugar water for children who did
not have RBS done was not documented. Immediate feeding was not routinely done with
6 children fed within the first hour o f arrival in ward (Fig.6).
Figure 6: Immediate feeding in ward
Immediate feeding (ward) n=101
■ Fed within 1 hr
■ Not fed within 1 hr
In the ward, 7.9%( 95% Cl 2.6 -13.2 ) of children were appropriately managed for
step 1 according to WHO guidelines
19
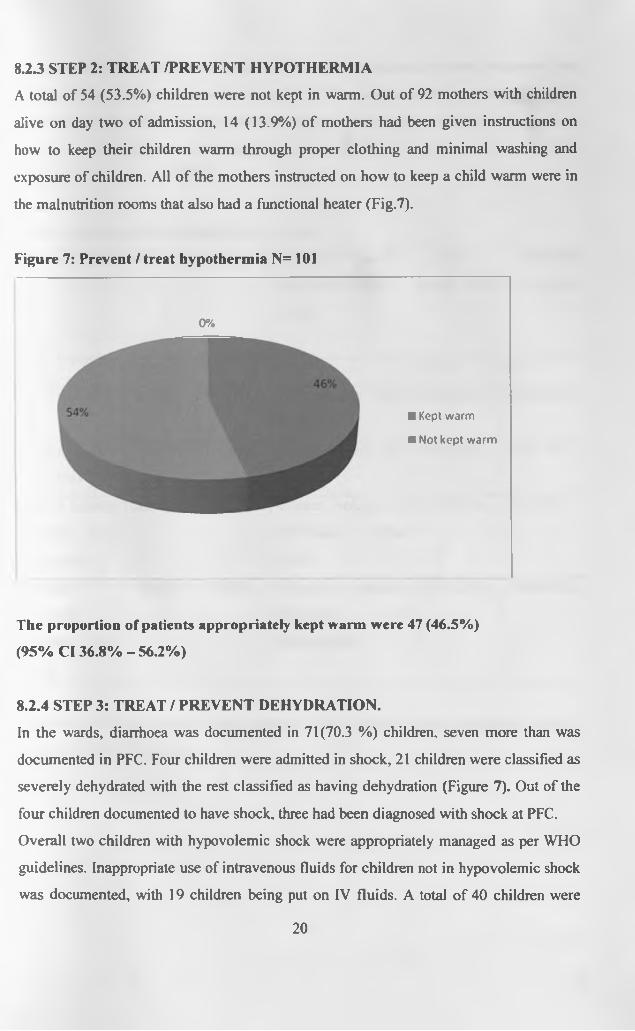
8.23 STEP 2: TREAT /PREVENT HYPOTHERMIA
A total of 54 (53.5%) children were not kept in warm. Out of 92 mothers with children
alive on day two of admission, 14 (13.9%) of mothers had been given instructions on
how to keep their children warm through proper clothing and minimal washing and
exposure of children. All o f the mothers instructed on how to keep a child warm were in
the malnutrition rooms that also had a functional heater (Fig.7).
Figure 7: Prevent / treat hypothermia N= 101
0%
■ Kept warm
■ Not kept warm
The proportion of patients appropriately kept warm were 47 (46.5%)
(95% Cl 36.8% -56.2% )
8.2.4 STEP 3: TREAT / PREVENT DEHYDRATION.
In the wards, diarrhoea was documented in 71(70.3 %) children, seven more than was
documented in PFC. Four children were admitted in shock, 21 children were classified as
severely dehydrated with the rest classified as having dehydration (Figure 7). Out of the
four children documented to have shock, three had been diagnosed with shock at PFC.
Overall two children with hypovolemic shock were appropriately managed as per WHO
guidelines. Inappropriate use of intravenous fluids for children not in hypovolemic shock
was documented, with 19 children being put on IV fluids. A total of 40 children were
20

rehydrated with ReSoMal, out of whom 37(92.5%) of them got the correct volume of oral
fluid (Table 4). Concurrent administration of F75 in children rehydrated with ReSoMal
was done in only twelve children. Monitoring o f changes in pulse and respiratory rate as
signs o f over hydration was not adequately done with documentation done for only four
children.
Table 4: Management of dehydration in ward
MANAGEMENT OF SHOCK N=4 MANAGEMENT OF SEVERE
DEHYDRATION/ SOME DEHYDRATION
N = 67
YES NO YES NO
IVF given N=4 3(75%) 1(25%) IVF wrongly given
N=67
19(28.4%) 48(71.6%)
Correct IVF
given N=3
2(66.7%) 1(33.3%) ReSoMal given =48 40(83.3%) 8(16.7%)
Correct volume
of fluid given
1st hour N=2
2(100%) 0 Correct volume of
ReSoMal given
N=40
37(92.5%) 3(7.5 %)
Number
correctly
managed for
shock
2(50%) 2(50%) Number correctly
managed for
dehydration
37(55.2%) 30(44.8%)
Overall 54.9% of children with diarrhoea were appropriately managed in step 3
(95% Cl 433% - 66.6%).
21

8.2.5 STEP 4: CORRECT ELECTROLYTE IMBALANCE
A total of 56(55.4%) children were fed on ready to use formula F75 that contains extra
potassium and magnesium. Four children with edematous malnutrition were wrongly
given furosemide for their edema. Thus in step 4, percentage of children appropriately
managed was 55.4% (95% Cl 45.7% — 65.1%).
8.2.6 STEP 5: TREAT INFECTIONS ROUTINELY
Ninety one children were appropriately managed with broad spectrum antibiotics and
correct dosages as per WHO guidelines (Fig 8).
Figure 8: Antibiotics given
■ Benzyl penicillin alone
■ Benzyl penicillin +Gentamicin+Metronidazole
■ Benzyl penicillin ♦Gentamicin
■ Benzyl penicillin* Chloramphenicol
■ Other antibiotics
No antibiotics
2% 3%
In step 5, 90% of children were appropriately managed (95% Cl 85.1% - 96.9%).
8.2.7 STEP 6: CORRECT MICRONUTRIENT DEFFICIENCES
Out o f the 101 children 62 (61.4 %) received high dose vitamin A on day one in ward.
55.4% of children received F75 that contains adequate zinc and other essential
micronutrients. Overall 56(55.4%) children received 4 micronutrients, 29(28.7%)
received 3 micronutrients, 12 (11.9%) received one micronutrient and 4 ((4%) received
22

none (Table 5). Iron was appropriately not prescribed in the acute phase except for 3
children. However it was also not prescribed in the rehabilitation phase.
Table 5: Administration of micronutrients
Micronutrient Yes % No %
Vitamin A given( N=I01) 62 (61.4%) 39 (38.6%)
Correct dose o f Vitamin A (N= 62) 49 (79.0%) 13(21%)
Multivitamins given (N= 101) 90(89.1%) 11 (10.9%)
Folic acid given( N=101) 72 (71.3%) 29 (28.7%)
Zinc given (N=101) 56(55.4%) 45 (44.6%)
Overall 55.4% of children were appropriately managed in step 6 (95% Cl 45.7%-
65.1% ).
8.2.8 STEP 7: FEED CAUTIOUSLY
A total of 56 children (55.4 %) were fed with F75 in the initial phase. The rest of 45
children were fed on ward special milk, normal cow’s milk and a few on routine ward
diet. Children continued with breast feeding where applicable. The average volume of
F75 prescribed was 125 ml/ kg per day. A total o f 46(82.1%) children of those started on
F75 received more than 80% of calculated amounts as per caretakers’ interview and
observations. Route of feeding was specified for 66.1% of children and feed was
monitored for 32.1% children (Table 6).
Table 6: Starter formula F75 given N= 101
YES NONumber % Number %
Fed with F75 ( N= 101) 56 (55.4%) 45 (44.6%)Correct feed volume in the initial phase ( N = 56) 46(82.1%) 10(17.9%)Fed in the first hour of arrival in ward ( N=56) 6(10.7%) 48 (89.3%)Route of feeding specified ( N= 56) 37(66.1%) 19(33.9%)Feed intake monitored (N=56) 18(32.1%) 38 (67.9%)
23

The median time from admission to first feed was 14 hours with only six children being
fed within one hour. Majority of children (58.5%) had documented feed after 12 hours in
the ward with 33.7% of children being fed after 19 hours o f arrival in ward (Table 7).
Table 7: Time duration from arrival in ward to first feed.
Time to first
feed(hours)
Frequency Percent Cumulative percent
1 - 6 26 25.7 25.7
7 - 12 12 11.9 37.6
13 -18 25 24.8 62.4
>19 34 33.7 96.1
No information 4 100
Total 101 100 100
Four children were in hypovolemic shock and not eligible for immediate feeding while
seven children on ReSoMal were concurrently put on F75 by the fourth hour as per the
WHO guidelines.
Overall in step 7, 16.8% of children were appropriately managed according to
WHO protocol (95% Cl 9.5% - 24.1%).
8.2.9 STEP 8: CATCH UP FEED N=56
The initial phase had a median duration of 6 days (range 2-12 days). A total o f 67(63.3%)
children were alive by day six and eligible for FI00 o f whom 64.2% were started on
FI 00 (Table 8).
Table 8: Catch up feed given
Number %
Transition to F I00 prescribed N=67 43 64.2
Correct feed volume during transition N= 43 27 62.7
Feed volume increased after transition N=43 16 37.2
In step 8, 23.8% of children were appropriately managed (95% Cl 13.6% - 34.0%).
24
83 BLOOD TRANSFUSION PRACTICES
A total of 12 (11.9%) children were transfused blood but only one had correct volume of
lOml/kg prescribed. Four children had a hemoglobin level of less than 5gm/dl. Four
children had no documented hemoglobin level and were transfused based on physicians’
clinical judgment.
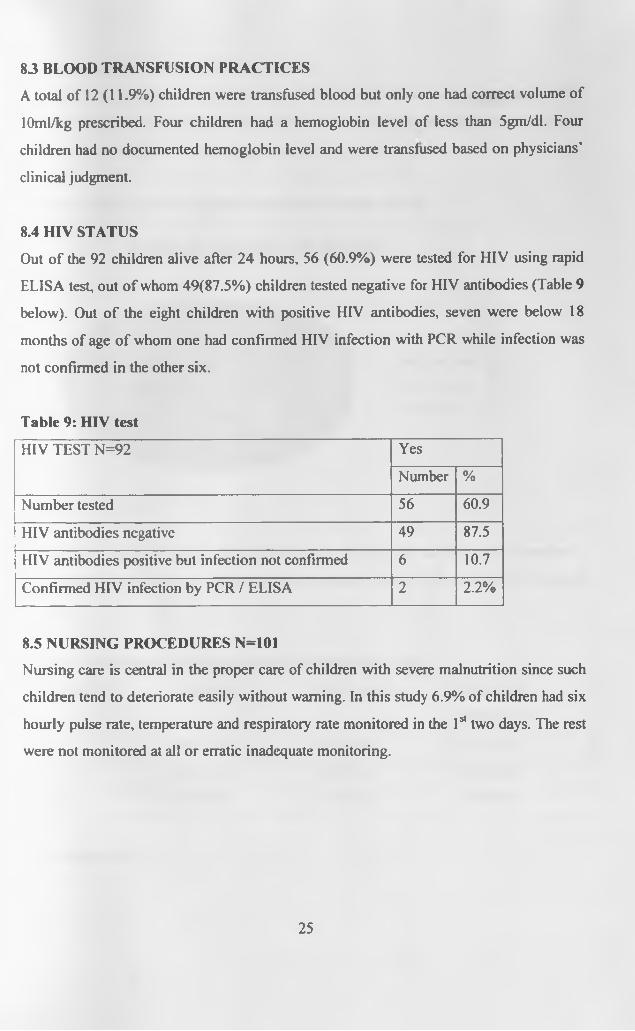
8.4 HIV STATUS
Out o f the 92 children alive after 24 hours, 56 (60.9%) were tested for HIV using rapid
ELISA test, out o f whom 49(87.5%) children tested negative for HIV antibodies (Table 9
below). Out o f the eight children with positive HIV antibodies, seven were below 18
months of age o f whom one had confirmed HIV infection with PCR while infection was
not confirmed in the other six.
Table 9: HIV test
HIV TEST N=92 Yes
Number %
Number tested 56 60.9
HIV antibodies negative 49 87.5
HIV antibodies positive but infection not confirmed 6 10.7
Confirmed HIV infection by PCR / ELISA 2 2.2%
8.5 NURSING PROCEDURES N=101
Nursing care is central in the proper care of children with severe malnutrition since such
children tend to deteriorate easily without warning. In this study 6.9% of children had six
hourly pulse rate, temperature and respiratory rate monitored in the 1sl two days. The rest
were not monitored at all or erratic inadequate monitoring.
25

8.6 OUTCOME
From the study population o f 101 patients, 38 patients died translating into case fatality
rate o f 38% (95% C l 28.5%-47.5%). Half of the deaths 19 (50%) occurred before 48
hours as shown in fig: 9 below.
Figure: 9: Duration in hours from admission to death N= 38.
TIME IN HOURS TO DEATH
■ 1st 24 hours
■ 25-48 hours
■ >48 hours
Overall 46.7 % of children with kwashiorkor, 44.4 % of children with marasmic-
kwashiorkor and 32.8% o f children with marasmus died, x P value=0.443 (Table 10
below).
Table 10: Outcome according to type of malnutrition n =101
OUTCOME Marasmus Kwashiorkor Marasmus-
Kwashiokor
Alive 40(67.7%) 8(53.3%) 15(55.6%)
Dead 19(32.3%) 7(46.7%) 12(44.4%)
Total 59(100%) 15(100%) 27(100%)
X2 p value=0.443
26

8.7 INVENTORY OF ESSENTIAL SUPPLIES
An inventory o f essential supplies was done through observations in the ward and
structured interviews with nurses and nutritionists. A total of 50 health workers were
interviewed.
Throughout the entire duration o f the study, essential supplies were largely available as
shown in table 11 below. Potassium chloride was available in intravenous preparation
only. However no ward had written guidelines on the management o f severe malnutrition.
Table 11: Availability of essential supplies
Always
available
Most times
available
Rarely
available
Never
availa
ble
Glucometer and
glucostix
44(88%) 6(12%)
ReSoMal( premixed
sachets)
36(72%) 14(28%)
F75(pre-mixed bags) 40 (80%) 10(20%)
F100(pre-mixed bags) 40 (80%) 10(20%)
Potassium chloride 28 (56%) 20 (40%) 2(4%)
27

8.8 CARE GIVER’S KNOWLEDGE AND PRACTICES N=61
A total of 61 caregivers were interviewed at the end o f day 7 to assess knowledge and
actual practices in care. O f the 61 care givers, 39 (63.9%) lacked knowledge that their
children had severe malnutrition apart from the other co-morbid conditions.
Overall 31.1% of caregivers knew that starter milk F75 was a major component of the
treatment regime their children were receiving. The majority of the mothers 41 (67.2%)
gave three hourly feeds and 42 (68.9%) gave the correct volumes o f milk per feed. Only
11(18%) of mothers provided psychological stimulation to children through play and
personal interaction with child (Table 12).
Table 12: Care giver’s knowledge and practices n=61
Yes No
Care giver’s knowledge and practice Number % Number %
1. Knew child has severe malnutrition 22 36.1 39 63.9
2. Knew F75 milk is a treatment 19 31.1 42 68.9
3. Gave3 hourly feeds 41 67.2 20 32.8
4. Gave correct amount o f feed 42 68.9 19 31.1
5. Provided stimulation and play 11 18.0 50 82.0
28

9.0 DISCUSSIONThis study evaluated current practices o f care o f children with severe malnutrition at
Kenyatta National Hospital, a large tertiary teaching hospital and how it compares with
the WHO guidelines.
The majority o f the children were younger than 2 years old, and 47.5% were younger
than 12 months. This age distribution among severely malnourished is similar to what
other studies found in Colombia, Uganda, and South Africa ([17, 29, 35]. Marasmus was
the commonest presentation and the burden was highest among those aged 6-12 months.
This contrasts with what Bernal et al, Colombia and Bachou et al, Uganda found in that
kwashiorkor was the commonest presentation in the two studies [29, 35]. In Colombia
kwashiorkor presented in a much younger age group than marasmus. Although this study
did not address feeding practices, the 2003 KDHS, found early weaning from breast
feeding, early and inappropriate introduction o f complementary nutrition and
inappropriate choice of weaning foods a problem in infant feeding in Kenya (4). The
peculiar weaning practices noted in the 2003 KDHS could be associated with the
presentation seen in this study population.
The most common clinical presentation in this study population was diarrhoea with over
70% o f the children suffering from diarrhoea at admission. This is similar to observations
made by Khanum [36] and Bemal [29] where they found 60% and 50% respectively of
children with severe malnutrition had diarrhea. Pneumonia was also a common
complication found in this study.
There was good triaging o f patients at PFC with more than 90% of children appropriately
triaged. Similar studies in South Africa and Colombia found that emergency triaging at
the emergency departments was poorly practiced resulting in long waiting times of up to
8 hours before accessing care [37]. The good triaging practices at KNH could be
attributed to appropriate training in ETAT at KNH unlike in South Africa where nurses in
the outpatient department had not received appropriate training.
29

Prompt diagnosis, treatment and prevention o f hypoglycemia was inadequately done at
both PFC and ward despite availability of dextrostix / glucometer and F 75. There was a
long delay in initiating feeding with a median waiting time of 14 hours. Ashworth in
South Africa found a similar delay in giving first feed with children waiting for up to 11
hours before feeding. No night feeds were given in most wards and children admitted late
in the evening had to wait till the following day for breakfast normally served at 9.00
a.m. This may be attributed to ignorance of nursing staff on the risk of hypoglycemia in
such children and unawareness on the WHO guidelines and also the perception that
providing feeds to such children is the work o f the nutritionist not the nurse. It is also
probable that nurses did not treat feeds for malnourished children as ‘■“drug’" but rather as
routine feed. Poor staffing levels with few overburdened nurses in the various wards
could also be a contributory factor. Absence o f written guidelines on management o f
severe malnutrition and lack of training on management of severe malnutrition among
nursing staff could also be contributory to findings in this study. NGT feeding was
prescribed for 40% of children unlike South Africa where NGT feeding for critically ill
children was uncommon.
Children with severe malnutrition are susceptible to hypothermia. Prompt diagnosis and
treatment o f hypothermia was poor in this study. As in the South African study
temperatures were rarely checked on admission to ward and no routine measurements
were carried out. From this study it was noted that critically ill children and those with
diarrhea were unlikely to be kept in warm rooms since all acute rooms did not have a
heater during the entire duration o f the study. Children with diarrhea were not nursed in
"malnutrition rooms” but in non -warmed diarrhea rooms together with other normal
children with diarrhea. However unlike in South Africa electric heaters were largely
available and mothers were admitted with their children though only 13.9% were trained
on how to keep children warm.
Because of the difficulty in diagnosis of dehydration in severe malnutrition and
estimation o f its severity, rehydration fluid should only be given intravenously only if
children are in shock. Severely malnourished children not in shock should be rehydrated
30

orally using ReSoMal which has low sodium and high potassium. These guidelines were
not adequately followed and a large number o f children not documented to be in shock
were indiscriminately prescribed IV fluids both at PFC and in the wards. This could be
due to lack of well trained motivated clinicians. Choice o f appropriate IVF for shock was
unsatisfactory in PFC compared to the wards with 64.3% of children being resuscitated
with normal saline. This observation could be explained by differences in knowledge and
skills o f health workers with wards being managed by more skilled personnel. Oral
rehydration was also poorly done in PFC compared to wards and there was high
likelihood of standard ORS being used in PFC than in wards. Neither monitoring for
signs o f over hydration nor recording volumes o f fluids given was properly done at both
PFC and the wards. This could be due to lack of knowledge about dangers of over
hydration and also the limited number of nursing staff. Similar practices were observed
by Puone et al in South Africa, where they found indiscriminate use o f intravenous fluids
and lack of monitoring was due to lack of knowledge about dangers o f intravenous
therapy and over hydration in severe malnutrition[38].
Infections are very common in malnourished children but can be difficult to diagnose
because common signs, such as fever, inflammation and crepitations are often missing
[39], Broad spectrum Antibiotics are routinely administered to severely malnourished
children because these children may not present signs or symptoms of infection. In this
study 91 % o f children received appropriate broad spectrum antibiotics with both gram
positive and negative cover unlike in South Africa where antibiotics were not routinely
used. This could be due to the training of clinicians in emergency triage and treatment
plus inpatient care at KNH
The increasing severity o f the biochemical imbalance in malnourished children is
enhanced by the deficit o f vitamins and minerals mainly zinc folic acid, vitamin A and
copper. Therefore, high dose vitamin A, folic acid, other vitamins, and mineral
supplements, given at the start of therapy, are fundamental in improving outcome [40]. In
this study only 39% of children received all micronutrients with correct dose of vitamin
31

A being given to less than 50% of children. A similar finding was documented in South
Africa where most of the micronutrients were not routinely supplemented.
Children with severe malnutrition should be given small frequent feeds o f a starter
formula and continue breastfeeding where applicable. In this study 55.4% of children
were fed with F75 with the rest being fed on porridge, normal milk and some on routine
ward diet. Ashworth in South Africa found that children were being fed on full strength
milk and adult meals. Ready to use starter formula F75 was always available in the ward
unlike in South Africa. Monitoring and computing daily feeds was rarely done. Studies
done in other places have shown that activities that require frequent physician and
nursing staff bedside presence are often poorly done [41]. Severe shortage of nursing
staff at KNH and possible lack o f knowledge about the special needs o f severely
malnourished could explain above findings.
The initial phase had a median duration o f 6 days. Bernal in Colombia found on average,
appetite improved by the fifth day o f hospitalization. At this time children attained the
minimal necessary metabolic and physiological requirements and could transit to
rehabilitation phase safely [29]. In our study, 64.2% o f children alive at day six started
the rehabilitation phase with 62.7% receiving the correct feed volume during the
transition. However feed volume was increased after transition for 37.2%.of children
only. In this study it was observed that failure to increase volume of feed was mainly due
to failure by doctors to change prescription of feeds accordingly.
In our study most of the children were accompanied by care givers who were responsible
for feeding and oral rehydration o f the children. It was also observed that care givers
were responsible for charting of feeds, although task was often poorly done and no proper
supervision systems were in place. For the duration o f the study, most of the caregivers
developed the ability to feed their children competently. However, it was noted that a few
were sharing their ward diet with the children. Hence from this study there is a great
potential for care givers to contribute to care of children in view of the shortage o f
32

nursing staff. However, close supervision and training would be required, a factor that
was missing in all wards.
Severe malnutrition is often a common finding in HIV infected children. In this study,
only 14% of children tested were confirmed either as infected or exposed to maternal
HIV infection. Studies in the region have found the proportion of severely malnourished
who are HIV 1 infected was 30% and above [35, 42, 43]. However apart from the
Kampala study, other studies were carried out in the pre highly active antiretroviral
therapy period. The low prevalence o f HIV 1 infection in this study could to be due to
successful implementation o f prevention of mother to child program and scaling up of
HIV treatment and care resulting in more healthier cohort and reduced tendency to
wasting and hospitalization.
Case fatality rate was high in this study at 38%. Bemal in Turbo Colombia found a
mortality rate o f 5.7%. A study in Bangladesh reported a 17% mortality rate while in
South Africa a rate of 6% was obtained with rigorous application of WHO protocol.
Although it is difficult to compare case fatality across various studies due to population
characteristic differences, studies have shown that implementation of WHO guidelines
results in a decrease in hospital based case fatality rate [17, 29,44], The high case fatality
rate in this study could be a factor o f poor clinical care. Out of the 38 patients who died
35/38(92%) were inappropriately managed for hypoglycemia. Management of
hypothermia, dehydration, electrolyte and micronutrient imbalance and feeding were also
inadequate among those who died. However most of the children in this study did not
receive appropriate care thus deaths cannot be attributed poor care only. Other factors
that could be contributing to high mortality in this study may be the severity o f illness
probably due to delayed hospital presentation, with acute medical conditions mainly
diarrhea and acute respiratory tract infections being the primary reason for hospital
presentation, hence critically ill patients requiring intense medical and nursing care.
From this study, severe malnutrition remains poorly managed at KNH with critical
deficiencies in care being observed in majority o f steps. Major shortfalls in care found in
33

this study include delayed diagnosis and treatment o f hypoglycemia and hypothermia,
delay in prompt start of therapy especially initial feeding of children, inadequate and
erratic basic nursing care like monitoring of feeds, fluid and vital signs. However supply
of major commodities was good most of the times compared to what Chopra found in
South Africa [17]
Finally clinical approach to improve quality of care at KNH should be to be accompanied
by efforts to improve health system infrastructure and management. The rooms set aside
for care of children with severe malnutrition are small and most times highly congested,
with a single bed accommodating up to six children. This makes it difficult to maintain
proper hygiene and cross infection is a major problem.
Shortage of nurses and nutritionists and low morale noted in this study compromised
quality o f care and this has been noted in other studies [45, 46]. Availability o f adequate
skilled, motivated, well trained staff is a vital determinant o f successful implementation.
9.1 STUDY LIMITATIONS
• The study was not designed to assess staff’s knowledge of the WHO guidelines.
9.2 CONCLUSION
• Quality o f care for children admitted with severe malnutrition at KNH is
inadequate and often does not follow the evidence based WHO protocol.
93 RECOMMENDATIONS
• There is need to assess knowledge of staff on the WHO protocol and carry out
training according to gaps identified.
• There is a need to form a hospital nutrition team to address gaps in the
implementation of the WHO protocol and carry out routine supervision and
regular audits on the care o f severe malnutrition.
• . KNH need to consider the establishment of a specialized malnutrition unit. This
will make it possible to improve skills and care for severely malnourished
children.
34

Appendix 1
C onsent explanation form
IP/NO Study number Date
AUDIT OF CARE OF CHILDREN WITH SEVERE MALNUTRITION AT
KENYATTA NATIONAL HOSPITAL.
Investigator: Dr Charles M Nzioki. Postgraduate student, Department o f Paediatrics,
University of Nairobi.
Supervisors: Dr. Irimu G, Prof. Musoke, Dr. English M. Lecturers’, Department of
paediatrics, University of Nairobi.
Investigators statement
We are conducting a study to evaluate the care provided to children admitted with severe
malnutrition in this hospital. Your child has been identified as having severe malnutrition
.1 am requesting you to join this study. This form provides you with information to enable
you to decide whether to allow your child to take part in the study or not. Your
participation is wholly voluntary.
Purpose of study
Children with severe malnutrition are admitted to our wards daily. We wish to look at
the care given to children like yours admitted into our general pediatric wards.
Information obtained will enable us assess the care and where possible make
improvements.
Procedures
As a part of this study we are interested in assessing the nutritional status o f your child by
taking his/her weight and height. We will look at the clinical records of your child and
abstract data including care received clinical findings and results o f laboratory
investigations.
Risks
No direct risks to your child are foreseen as a result o f taking part in this study .The
information obtained in this study will be used for the purpose o f improving care for
children.
university of mairor1m e d i c a l l i b r a r y
Benefits
This study may not benefit your child immediately.
The information obtained in this study will enable the hospital identify any weaknesses in
the treatment o f severe malnutrition. This will aid in improving the care given to children
with this illness.
ConfidentialityInformation obtained will be held in strict confidence .We will not publish or discuss any
information obtained in any way that could be linked to your child.
Rights
Participation in the study is entirely voluntary and you may refuse or withdraw your
consent at any stage without influencing the care your child is receiving in any way. You
have a right to ask any question and clarifications.
Parents / Guardians consent form
The study above has been explained to me. I have understood its purpose and my rights
as a subject in the study. I have had a chance to ask questions and have been assured that
if in future I have any questions about the study or my rights as a subject, I can ask the
investigator. I understand that I can withdraw from the study at any time. I voluntarily
agree to participate in the study.
Signed (parent/guardian)----------------------- Date
Sign (Investigator)--------------------------------- Date
36

Appendix 2
HEALTH WORKERS CONSENT FORM
I am Dr. Charles Nzioki, from the department of pediatrics and child health of the
University of Nairobi. I am carrying out a study on the management of children with
severe malnutrition at KNH as part o f my post graduate training in the same department.
The aim of the study is to audit care o f children with severe malnutrition admitted at
Kenyatta National Hospital in order to determine areas o f care that need improvement
and thus better outcome for such children.
The information collected will be anonymous. No record o f name, qualification or area of
work will be indicated.
I request you to take part in the study and give consent for participation in the same.
Consent given
Signature
Date
Yes Q No | 1
/ /
37

Appendix 3
SEVERE MALNUTRITION CARE STUDY
Study Number Ward-------- Date— /—/2007 IP/No-----------
Fill in the appropriate response in the spaces provided.
A) Demographic characteristics of the patient
1. Date o f birth-------------------
2. Age in months------- months
3. Sex Male EH Female EH
B) Anthropometric measurements by PI
4. Body weight----------------- kg------gm
5. Height / length------------ cm
6. Bilateral pedal edema present? Yes EH No|~]
7. Severe visible wasting seen? Yes I I No[~~|
8. Weight/ length Z scores - 2SD EH - 2 SD-3SD EH -3SD -4SD EH <-4SD EH9. Classification o f severe malnutrition by PIKwashiorkor EH Marasmus I I
Marasmic -Kwashiorkor EH Non severe malnutrition EH
C) Emergency management at Pediatric Filter Clinic
10. How was the Patient triaged at PFC?
Emergency EH Priority EH Non urgent EH No information EH11. Step l.Treat/prevent hypoglycemia
(i) Was random blood sugar done at PFC? Yes EH No EHIf yes
(ii) Results of R B S ---------mmol/1
12. Step 3. Treat /prevent dehydration
(i) Was diarrhea present? Yes EH No EH No information EHIf yes proceed to (ii), if no proceed to D
(ii) Was hypovolemic shock documented? Yes EH No EHIf child in shock proceed, if no skip to (viii)
38
(iii) Did patient have IVF prescribed? Yes D N o □
(iv) Was choice o f IVF correct? Yes □ No □
(v) Was amount o f IVF given in first hour correct? Yes □ No □
(vi) Was fluid monitored and volumes recorded? Yes D N o □
(vii) Was there medical review after 1 hour of IVF? Yes D N o □
(viii) Did patient have ReSoMal prescribed? Yes Q N o □
(ix) Was the correct volume of ReSoMal used? Yes D N o □
(x) Was the ReSoMal monitored? Yes D N o □
D) Assessment on admission to the ward
13. Temperature at admission--------- °C
14. Edema documented by ward clinician? Yes Q No Q
15. Visible severe wasting documented by ward clinician? Yes I I No Q
16. Admission diagnosis by admitting ward clinician
Marasmus Q Marasmic-Kwarshiokor Q Kwashiorkor Q Not classified Q
17. Other co-morbid conditions specified by admitting clinician.
(ii)--------------------------
E) Ward management
18. Step l.Treat/prevent hypoglycemia
(i) Was random blood sugar done?
(ii) Results o f R B S --------mmol/1
19. Step 2.Treat /prevent hypothermia
(i) Was child kept warm?
If yes how?
(ii) Heater provided?
(ii) Instructions given to mother to keep warm?
20. Step 3. Treat /prevent dehydration
Yes □ No □
Yes □ No □
Yes □ No □
Yes □ No □
39
(i) Was diarrhea present? Yes [ ] No [ ] No information^]
If yes proceed to (ii)
(ii) Was hypovoleamic documented? Yes I I No I I
If child in shock proceed, if no skip to (viii)
(iii) Did patient have IVF prescribed?
(iv) Was choice o f IVF correct?
(v) Was amount o f IVF given in first hour correct?
(vi) Was fluid monitored?
(vii) Was there medical review after 1 hour of IVF?
(viii) Did patient have ReSoMal prescribed?
(ix) Was the correct volume o f ReSoMal used?
(x) Was F75 given concurrently with ReSoMal in the ini
(xi) Was the ReSoMal intake monitored?
21. Step 4. Correct electrolyte imbalance
(i) Was at least 4mmol/kg extra potassium prescribed/ supplemented? Yes □ No I I
iii) Were diuretics wrongly given for edema? Yes |~| No I I
22. Step 5. Treat / prevent infection
(i) Were antibiotics prescribed? Yes □ No O
(ii) If yes, what antibiotics prescribed? Crystalline penicillin Q Gentamicin Q
Yes Q N o □
Yes □ No □
Yes 0 No □
Yes Q N o □
*< a □ z o □
S? □ z o □
Yes D N o □10 hours? Yes I I No I I
Yes □ No □
Metronidazole □ others (specify) □
23. Step 6. Correct micro -nutrient deficiencies
(i) Was vitamin A given? Yes □ No □
(ii) Was correct vitamin A dose given? Yes □ No □
(iii) Was Zinc given? Yes □ No □
(iv) Was Folic acid given? Yes □ No □
(v) Was multivitamin given? Yes □ No □
(vi) Was iron withheld in acute phase? Yes □ No □
(vii) Was iron given in catch up phase if indicated? Yes □ No □
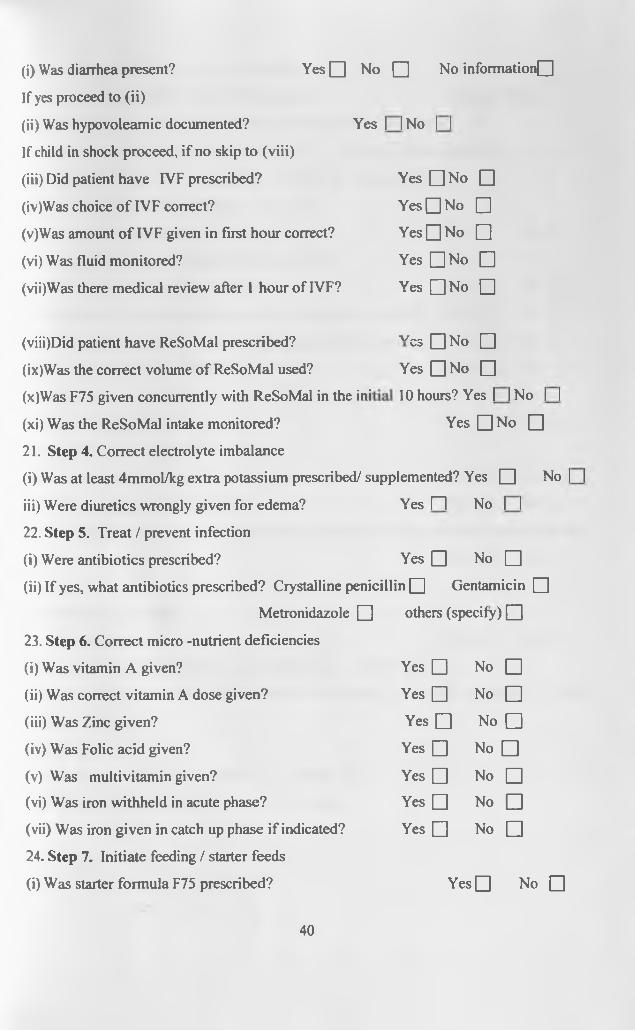
24. Step 7. Initiate feeding / starter feeds
(i) Was starter formula F75 prescribed? Y e sD No □
40
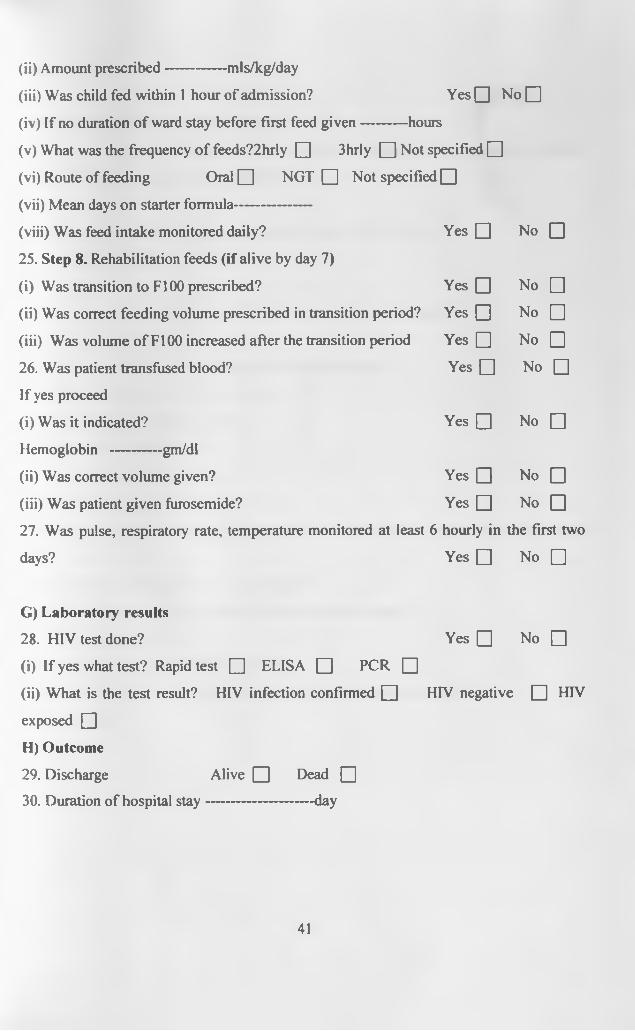
(ii) Amount prescribed------------ mls/kg/day
(iii) Was child fed within 1 hour of admission? Yes Q No Q
(iv) If no duration o f ward stay before first feed given-------- hours
(v) What was the frequency o f feeds?2hrly Q 3hrly Q Not specified Q
(vi) Route of feeding Oral Q NGT Q Not specified Q]
(vii) Mean days on starter formula----------------
(viii) Was feed intake monitored daily? Yes □ No □
25. Step 8. Rehabilitation feeds (if alive by day 7)
(i) Was transition to F I00 prescribed? Yes □ No □
(ii) Was correct feeding volume prescribed in transition period? Yes □ No □
(iii) Was volume o f FI 00 increased after the transition period Yes □ No □
26. Was patient transfused blood? Yes □ No □
If yes proceed
(i) Was it indicated? Yes □ No □
Hemoglobin ---------- gm/dl
(ii) Was correct volume given? Yes □ No □
(iii) Was patient given furosemide? Yes □ No □
27. Was pulse, respiratory rate, temperature monitored at least 6 hourly in the first two
days? Yes □ No □
G) Laboratory results
28. HIV test done? Yes □ No □
(i) If yes what test? Rapid test Q ELISA Q PCR Q
(ii) What is the test result? HIV infection confirmed Q HIV negative O HIV
exposed Q
H) Outcome
29. Discharge Alive Q Dead Q
30. Duration o f hospital s tay--------------------- -day
41

Appendix 4
Care givers interview at end of first week
Fill in the caregivers’ responses in the spaces provided. Let the caregiver explain
then indicate the response as provided.
1. Have you been informed about the cause of your child’s illness?
If yes, explain-----------------------
2. Do you know the treatment your child is receiving for this illness?
If yes, explain-------
3. In the last one day, how many times did the child feed?
i) During the day ---------------------
ii) During the n ight-------------------
4. Who feeds the child?
i) During the day---------
ii) During the night-----------
5. Have you been informed on the amount of milk the child is supposed to take at each
feed? -------------------------
6. Are the feeds measured?------------ Explain
7. Have you been informed on how to keep your child warm?
If yes, explain----------
8. Do you always have a heater in the room?
9. Have you been informed on the importance o f playing with the child?
If yes explain
42

Appendix 5
Health workers (nurses/ nutritionists) questionnaire - severe malnutrition care
Please answer the following questions in the spaces provided.
Date o f interview--------------------------
1. Indicate the availability o f the following commodities
Drug Always
available
Available most
o f the times
Rarely
available
Never available
Glucometer and
glucostix
ReSoMal
F75
F100
Potassium
supplement
2. How many heaters in functional condition are available for use by malnourished
children in your w ard?----------------------------
43

Appendix 6
Ten steps in the care of severely malnourished children
Time frame for the management of the child with severe malnutrition
Stabilization________ Rehabilitation
Days 1-2 Days 3-7 weeks 2-6
1. Treat/prevent hypoglycemia
2. Treat /prevent hypothermia
3. Treat/prevent dehydration
4. Correct imbalance of electrolytes
5. T reat infections ---------
6. Correct deficiencies of micronutrients-
7. Start cautious feeding -------------
-no lron- -► with iron-
8. Rebuild wasted tissues (catch up growth) --------------------►
9. Sensory stimulation --------------------------------------------------------------------------- ►
10. Prepare for follow up _____________
Source of chart: Pocket book o f Hospital care for children; guidelines for the
management o f common illnesses with limited resources, WHO, 2006: page 176.
Appendix 7
Micronutrient replacement
Give daily for at least 2 weeks:
>■ A multivitamin supplement
>• Folic acid (5mg on day 1, then lmg/day)
>■ Zinc(2mg/kg/day)
>• Give vitamin A orally (aged<6months:50000 IU; aged 6- 12months: 100000 RJ;
older children: 200000 IU) on day 1.
Source of chart: Pocket book o f Hospital care for children; guidelines for the
management o f common illnesses with limited resources, WHO, 2006: page 183.
44

Appendix 8
Fluid management in severe malnutrition
Do not use the IV route for rehydration except in shock. Give ReSoMal orally or by NGT. Give
5ml/kg every 30 minutes for the first 2 hours then give 5— lOml/kg for the next 10 hours.
Shock Reduced consciousness, absent, slow (<60bpm) or weak pulse.
15mls/kg in 1 hr of Half Strength Darrow’s in 5% dextrose.
If improves
• Repeat this bolus over another 1 hour.
• Then switch to oral or nasogastric fluid using ReSoMal at 10 ml/kg/hr for up to 10 hours.
• As soon as conscious, introduce F75 and appropriately reduce amount of ReSoMal given.
If does not improve
• Give maintenance IV fluid at 4 ml/kg/hr.
• Transfuse 10 ml/kg whole blood over 3 hours as soon as it is available.
• Introduce F75 after transfusion complete.
Weight kg
Shock O ral /NGT/ ReSoMal
Emergencymaintenance
15 mls/kg lOmls/kg/hr 4mls/kg/hrHalf Strength Darrow’s in 5% Dextrose
ReSoMal HSD in 5% Dextrose
Iv Oral /NGT/ ivShock= over 1 hour
Drops/min if 20drops/ml giving set
lOmls/lg/hr forup to 10 hours
Hourly until transfusion
4.00 60 20 40 15'5 .00 75 25 50 20
6.00 90 30 60 257.00 105 35 70 308.00 120 40 80 309.00 135 45 90 3510.00 150 50 100 4011.00 165 55 110 4512.00 180 60 120 5013.00 200 65 130 5014.00 220 70 140 5515.00 240 80 150 60
Source of chart:
> Pocket book of Hospital care for children; guidelines for the management of
common illnesses with limited resources, WHO, 2006: page 179.
Basic Pediatric Protocols. Ministry o f Health, Kenya, 2004: page 23
45

Appendix 9
Feeding children with severe malnutrition
1) If respiratory distress or edema get worse or the jugular veins are engorged reduce
feed volumes.
2) When appetite returns (and edema much improved) change from F75 to FI 00, for the
first 2 days use same feed volume as for F75. Then increase to the minimum F100
volume and continue increasing feeds by 10 mis per feed stopping when the child is
not finishing the feeds or if the maximum is reached.
F75 - acute feeding FI00 -catch up feeding
No or moderate Severe edema 3 hourly feededema even face volume
Weight Total 3 Total 3 Total(kg) Feeds/ hourly Feeds hourly Feeds
24hrs feed in 24 feed in 24volume hrs volume hrs Min Max
13.0 390 50 300 40 450 55 803.5 455 60 350 45 525 65 954.0 520 65 400 50 600 75 1104.5 585 75 450 60 675 85 120
( T c T 650 80 500 65 750 95 1355.5 715 90 550 70 825 105 1506.0 780 100 600 75 900 115 1656.5 845 105 650 85 975 125 1757.0 910 115 700 90 1050 135 1907.5 975 120 750 95 1125 140 2058.0 1040 130 800 100 1200 150 220
HT5- 1105 140 850 110 1275 160 2309.0 1170 145 900 115 1350 170 2459.5 1235 155 950 120 1425 180 26010.0 1300 160 1000 125 1500 190 27510.5 1365 170 1050 135 1575 200 28511.0 1430 180 1100 140 1650 210 300
Source:
> Pocket book of Hospital care for children; guidelines for the management of
common illnesses with limited resources, WHO, 2006: page 184-185.
> Basic Pediatric Protocols. Ministry o f Health, Kenya, 2004: page 24
46

Appendix 10
WHO/NCHS normalized reference weight - fo r - length (49- 84 cm) and weight - fo r -
height (85 -1 1 0 cm), by sex
Boys' weight (kg)Length(cm)
Girls’ weight (kg)-4SD60%
-3SD70%
-2SD80%
-1SD90%
Median
Median
-1SD90%
-2SD80%
-3SD70%
-4SD60%
1.8 2.1 2.5 2.8 3.1 49 3.3 2.9 2.6 2.2 1.81.8 2.2 2.5 2.9 3.3 50 3.4 3 2.6 2.3 1.91.8 2.2 2.6 3.1 3.5 51 3.5 3.1 2.7 2.3 1.91.9 2.3 2.8 3.2 3.7 52 3.7 3.3 2.8 2.4 21.9 2.4 2.9 3.4 3.9 53 3.9 3.4 3 2.5 2.12 2.6 3.1 3.6 4.1 54 4.1 3.6 3.1 2.7 2.22.2 2.7 3.3 3.8 4.3 55 4.3 3.8 3.3 2.8 2.32.3 2.9 3.5 4 4.6 56 4.5 4 3.5 3 2.42.5 3.1 3.7 4.3 4.8 57 4.8 4.2 3.7 3.1 2.62.7 3.3 3.9 4.5 5.1 58 5 4.4 3.9 3.3 2.72.9 3.5 4.1 4.8 5.4 59 5.3 4.7 4.1 3.5 2.93.1 3.7 4.4 5 5.7 60 5.5 4.9 4.3 3.7 3.13.3 4 4.6 5.3 5.9 61 5.8 5.2 4.6 3.9 3.33.5 4.2 4.9 5.6 6.2 62 6.1 5.4 4.8 4.1 3.53.8 4.5 5.2 5.8 6.5 63 6.4 5.7 5 4.4 3.74 4.7 5.4 6.1 6.8 64 6.7 6 5.3 4.6 3.94.3 5 5.7 6.4 7.1 65 7 6.3 5.5 4.8 4.14.5 5.3 6 6.7 7.4 66 7.3 6.5 5.8 5.1 4.34.8 5.5 6.2 7 7.7 67 7.5 6.8 6 5.3 4.55.1 5.8 6.5 7.3 8 68 7.8 7.1 6.3 5.5 4.85.3 6 6.8 7.5 8.3 69 8.1 7.3 6.5 5.8 55.5 6.3 7 7.8 8.5 70 8.4 7.6 6.8 6 5.25.8 6.5 7.3 8.1 8.8 71 8.6 7.8 7 6.2 5.46 6.8 7.5 8.3 9.1 72 8.9 8.1 7.2 6.4 5.66.2 7 7.8 8.6 9.3 73 9.1 8.3 7.5 6.6 5.86.4 7.2 8 8.8 9.6 74 9.4 8.5 7.7 6.8 66.6 7.4 8.2 9 9.8 75 9.6 8.7 7.9 7 6.26.8 7.6 8.4 9.2 10 76 9.8 8.9 8.1 7.2 6.47 7.8 8.6 9.4 10.3 77 10 9.1 8.3 7.4 6.67.1 8 8.8 9.7 10.5 78 10.2 9.3 8.5 7.6 6.77.3 8.2 9 9.9 10.7 79 10.4 9.5 8.7 7.8 6.97.5 8.3 9.2 10.1 10.9 80 10.6 9.7 8.8 8 7.17.6 8.5 9.4 10.2 11.1 81 10.8 9.9 9 8.1 7.27.8 8.7 9.6 10.4 11.3 82 11 10.1 9.2 8.3 7.4
47
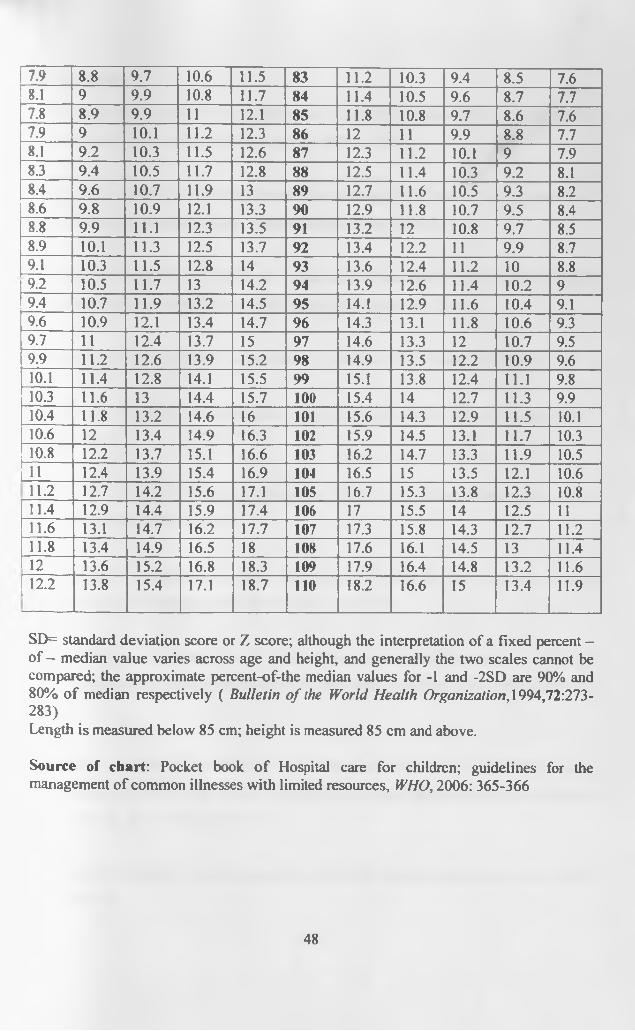
7.9 8.8 9.7 10.6 11.5 83 11.2 10.3 9.4 8.5 7.68.1 9 9.9 10.8 11.7 84 11.4 10.5 9.6 8.7 7.77.8 8.9 9.9 11 12.1 85 11.8 10.8 9.7 8.6 7.67.9 9 10.1 11.2 12.3 86 12 11 9.9 8.8 7.78.1 9.2 10.3 11.5 12.6 87 12.3 11.2 10.1 9 7.98.3 9.4 10.5 11.7 12.8 88 12.5 11.4 10.3 9.2 8.18.4 9.6 10.7 11.9 13 89 12.7 11.6 10.5 9.3 8.28.6 9.8 10.9 12.1 13.3 90 12.9 11.8 10.7 9.5 8.48.8 9.9 11.1 12.3 13.5 91 13.2 12 10.8 9.7 8.58.9 10.1 11.3 12.5 13.7 92 13.4 12.2 11 9.9 8.79.1 10.3 11.5 12.8 14 93 13.6 12.4 11.2 10 8.89.2 10.5 11.7 13 14.2 94 13.9 12.6 11.4 10.2 99.4 10.7 11.9 13.2 14.5 95 14.1 12.9 11.6 10.4 9.19.6 10.9 12.1 13.4 14.7 96 14.3 13.1 11.8 10.6 9.39.7 11 12.4 13.7 15 97 14.6 13.3 12 10.7 9.59.9 11.2 12.6 13.9 15.2 98 14.9 13.5 12.2 10.9 9.610.1 11.4 12.8 14.1 15.5 99 15.1 13.8 12.4 11.1 9.810.3 11.6 13 14.4 15.7 100 15.4 14 12.7 11.3 9.910.4 11.8 13.2 14.6 16 101 15.6 14.3 12.9 11.5 10.110.6 12 13.4 14.9 16.3 102 15.9 14.5 13.1 11.7 10.310.8 12.2 13.7 15.1 16.6 103 16.2 14.7 13.3 11.9 10.5Lu____ 12.4 13.9 15.4 16.9 104 16.5 15 13.5 12.1 10.611.2 12.7 14.2 15.6 17.1 105 16.7 15.3 13.8 12.3 10.811.4 12.9 14.4 15.9 17.4 106 17 15.5 14 12.5 1111.6 13.1 14.7 16.2 17.7 107 17.3 15.8 14.3 12.7 11.211.8 13.4 14.9 16.5 18 108 17.6 16.1 14.5 13 11.412____ 13.6 15.2 16.8 18.3 109 17.9 16.4 14.8 13.2 11.6
| 12.2 13.8 15.4 17.1 18.7 110 18.2 16.6 15 13.4 11.9
SD= standard deviation score or Z score; although the interpretation of a fixed percent - of — median value varies across age and height, and generally the two scales cannot be compared; the approximate percent-of-the median values for -1 and -2SD are 90% and 80% o f median respectively ( Bulletin o f the World Health Organization, 1994,72:273-283)Length is measured below 85 cm; height is measured 85 cm and above.
Source of chart: Pocket book o f Hospital care for children; guidelines for the management o f common illnesses with limited resources, WHO, 2006: 365-366
48

References1. World Health Organization. Management o f severe malnutrition: a manual for
physicians and other health workers. Geneva: WHO, 1999.
2. Mackay M, Montgomery JMA. Plant biotechnology can enhance food security and
nutrition in the developing world. Nutrition today 2004; 39:52-8.
3. de Onis M, Frogillo EA, Blasser M. Is malnutrition declining? An analysis of change
of levels of child malnutrition since 1980. Bull WHO 2000; 78: 1222-3.
4. Central Bureau o f Statistics. Kenya Demographic and Health Survey 2003: 155 -167.
5. Ngare DK, Muttunga JN. Prevalence of malnutrition in Kenya. East Afri Med J 1999:
76; 376-380.
6. Black RE, Morris SS, Bryce J. Where and why are 10 million children dying every
year? Lancet 2003; 361:2226-34.
7. Scholfield C, Ashworth A. Why have mortality rates for severe protein energy
malnutrition remained high? Bull. WHO 1996; 74:223-29.
8. Rice AL, Sacco L, Hyder A, et al. Malnutrition as an underlying cause o f childhood
deaths associated with infectious diseases in developing countries. Bull WHO 2000; 78:
1207-21.
9. Berkley J, Mwangi I, Griffiths K, et al. Assessment of severe malnutrition among
hospitalized children in rural Kenya: Comparison of weight for height and mid upper arm
circumference. JAMA 2005; 294: 591- 7.
10. Allen SJ, Hammer C. Improving quality of care for severe malnutrition. Lancet 2004;
363: 2089- 90.
49

11. Bryce J, Boschi-Pinto G, Shibuya K, et al. WHO estimates of the causes o f death in
children. Lancet 2005; 365: 1147-52.
12. Bryce J, Terreri N, Victoria CG. Countdown to 2015: Tracking intervention coverage
for child survival. Lancet 2006; 368: 1067 - 76.
13. Scholfield C, Ashworth A. Severe malnutrition in children: high case fatality rates
can be reduced. Afr Health 1997; 19: 17-18.
14. United Nations Organization. United Nations Millennium Development Goals.
wwm\ unn. org/milleniumgoals.
15. World Health Organization. Strategies for assisting health workers to modify and
improve their skills: Developing quality health care, a process o f change.
WHO/EIP/OSD/OO. 1.2000.00. Geneva WHO.
16. Bhan MK, Bhandra M, Batil R. Management of the severely malnourished child;
perspective from developing countries. BMJ 2003; 326: 146-151.
17. Ashworth A, Chopra M, McCoy D, et al. WHO guidelines for management of severe
malnutrition in rural South African hospitals; effect on case fatality and influence of
operational factors. Lancet 2004; 363: 1110-15.
18. World Health Organization. Management o f the child with a serious infection or
severe malnutrition: Guidelines fo r care at the First -Referral Level in Developing
Countries. Geneva: WHO 2000.
19. Moss F, Palmberg M. Plesck P, et al. Evidence based health care: the open learning
resource. Br M edJ2000\ 320: 193.
50
20. Tamburlini G, Di Mario S, Maggi R, et al. Evaluation o f guidelines for emergency
triage . assessment and treatment in developing countries. Arch Dis Child 1999; 81: 478-
82.
21. World Health Organization. Improving Quality o f Pediatric Care in Small Hospitals
in Developing Countries. Geneva: WHO, 2001; 25.
22. Ministry of Health. Basic pediatric protocols. Management o f severe malnutrition. :
page 20-22
23. Jones G, Steketee RW, Black RE, Bhutta ZA, Morris SS. How many deaths can we
prevent this year? Lancet 2003; 362:65-71.
24. Ahmed T, Ali M, Ullah MM, et al. Mortality in severely malnourished children with
diarrhea and use o f standardized management protocol. Lancet 1999; 353: 1919-22.
25. Walker SP, Chang SM, Powell CA. Effects o f psychosocial stimulation and dietary
supplementation in early childhood on psychosocial functioning in late adolescence:
Follow up of Randomized controlled trial. BMJ 2006; 333:472.
26. Morris J, Molyneux E. Reduced mortality from severe PEM following introduction o f
WHO protocol in children in Malawi. Arch. Dis. Child 2003; 88 (suppl): A28.
27. Puoane T, Sanders D, Chopra M, et al. Evaluating the clinical management of
severely malnourished children: A study of two rural hospitals. S Africa. Med. J. 2001;
91:137-41.
28. Cavalcante A, Pinheiro L, Monte C, et al. Treatment o f malnutrition in Brazil; simple
solutions to common problems. Tropical Doctor 1998; 28: 95-7.
51

29. Carlos B, Claudia V, Gloria A, et al. Treatment of severe malnutrition in children:
experience in implementing the WHO guidelines in Turbo, Colombia. J Pediatr
Gastroenterol Nutr, 2008; 46 (3):322-328.
30. Weisstub G, Soria R, Araya M. Improving quality o f care for severe malnutrition.
Lancet 2004; 363:2090.
31. Kenyatta National Hospital. Annual Hospital statistical reports 1999-2005.
32. Kinoti S, Okeyo A. Management o f kwashiorkor in KNH. IN proceedings o f the
Kenya Pediatric Association, Nairobi, M arch 1983.
33. Bwibo N. Certain aspects o f fatal cases of kwashiorkor in KNH. IN proceedings o f
the east African regional medical seminar. Nairobi, Kenya 1976; 110-116.
34. World Health Organization. Health research methodology: a guide to training on
research methods. WHO, 2001, Second edition page 76.
35. Bachou H, Tumwine J, Mwandime R, et al. Reduction o f unnecessary transfusion and
intravenous fluids in severely malnourished children is not enough to reduce mortality.
Ann Trop Pediatr 2008; 28: 23-33.
36. Khanun S, Ashworth A, Huttley S. Controlled trial o f three approaches to treatment
o f severe malnutrition. Lancet 1994; 344:1728 -32.
37. Puone T, Sanders D, Ashworth A, et al. Improving the hospital management of
malnourished children by participatory research. International journal fo r quality in
health care 2004; 16(l):31-40.
38. Karaolis N, Jackson D, Ashworth A, et al. WHO guidelines for severe malnutrition:
are they feasible in rural African hospitals? Arch Dis Child 2007; 92: 198 — 204.
52
39. Brown KH, Gilman RH, Goffar A, et al. Infections associated with severe protein -
calorie malnutrition in hospitalized infants and children. Nutr Res 1981; 1: 33-46.
40. Golden MH. Oedematous malnutrition. Br Med Bull 1998;54:433-44.
41. Falbo AR, Filho MB. Cabral JE, et al. Implementation o f World Health Organization
guidelines for management of severe malnutrition in a hospital in north east Brazil. Cad.
Saude. Publica, Rio de Jeneiro, 2006; 22: 561-570.
42. Kessler L, Daley H, Malenga G, et al. The impact of Human immunodeficiency virus
type 1 on the management o f severe malnutrition in Malawi. Ann Trop Paediatri 2000;
20:50-56.
43. Tickley T, Nathoo K, Siziya S, et al. HIV infection in malnourished children in
Harare Zimbabwe. East Afr M ed J 2003; 74: 217-20.
44. Deen JL, Funk M, Guevara VC, et al. Implementation of WHO guidelines on
management of severe malnutrition in hospitals in Africa. Bull WHO 2003; 81: 237-43.
45. English M, Esamai R, Wassuna A, et al. Assessment o f inpatient paediatric care in
first referral level hospitals in 13 districts in Kenya. Lancet 2004; 363: 1948-53.
46. Nolan T, Angos P, Cunha AJ. Quality of hospital care for seriously ill children in
developing countries. Lancet 2001; 357: 106-10.
UNIVERSITY OF NAIROSjMEDiCAL LIBRARY
53
K EN YA TTA N ATIO N AL HOSPITALHospital Rd. along, Ngong Rd.
P.O. Box 20723, Nairobi.Tel: 726300-9
Fax: 725272 Telegrams: MEDSUP", Nairobi.
Email: [email protected]
Ref: KNH-ERC/ 01/ 32 7th January 2008
Dr Charles M. NziokiDept, of Paediatrics & Child HealthSchool of MedicineUniversity of Nairobi
>Dear Dr. Nzioki
RESEARCH PROPOSAL: “AUDIT OF CARE FOR CHILDREN AGED 6 TO 59 MONTHS ADMITTED WITH
SEVERE MALNUTRITION AT KENYATTA N. HOSPITAL’ (P295/10/2007)
This is to inform you that the Kenyatta National Hospital Ethics and Research Committee has reviewed and approved your revised research proposal for the period >,h January z008 -
6m January 2009.
You will be required to request for a renewal of the approval if you intend to continue with the study beyond the deadline given. Clearance for export of biological specimen must also be obtained rom
KNH-ERC for each batch.
On behalf of the Committee, I wish you fruitful research and look forward to receiving a summary of
the research findings upon completion of the study.
This information will form part of database that will be consulted in future when processing related
research study so as to minimize chances of study duplication.
Yours sincerely
4^ 'PROF A N GUANTAI SECRETARY, KNH-ERC
c.c. Prof. K.M.Bhatt, Chairperson, KNH-ERC . The Deputy Director CS, KNH
The Dean, SchoolTrt Medicine, UON The Chairman, Dept, of Paediatarics & Child Health, UON Supervisors: Dr. Irimu G. Deqt. of Paediatrics, UON
Prof. Musoke K, Dept .of Paediatrics, UON
Dr. English M., KEMRI
*