attrition in longitudinal studies using older adults: a
TRANSCRIPT
APPROVED:
Bert Hayslip, Jr., Major Professor Kimberly Kelly, Minor Professor Stan Ingman, Committee Member Linda Marshall, Chair of the Department of
Psychology Sandra L. Terrell, Dean of the Robert B. Toulouse
School of Graduate Studies
ATTRITION IN LONGITUDINAL STUDIES USING OLDER ADULTS:
A META-ANALYSIS
Anthony Ryan Rhodes, B.A.
Thesis Prepared for the Degree of
MASTER OF SCIENCE
UNIVERSITY OF NORTH TEXAS
December 2005

Rhodes, Anthony Ryan. Attrition in Longitudinal Studies Using Older Adults: A Meta-
Analysis. Master of Science (Experimental Psychology), December 2005, 45 pp., 2 tables,
references, 95 titles.
Longitudinal methods have become an improved and essential means of measuring intra-
individual change over time. Yet one of the greatest and most hazardous drawbacks studying
participants over multiple sessions can be the loss of participants over time. This study attempts
to illuminate the problem of attrition in longitudinal research by estimating the mean effect sizes
for participant loss across 57 studies published in 13 prestigious journals which regularly use
older participants. Results estimate overall attrition to be around 34% of the original sample. The
subsequent break down of attrition into its subtypes yield mean effect sizes for attrition due to
Refusal (8%), Loss of contact (10%), Illness (6%), and Death (14%) in studies sampling from
adults 50 years or older. Analyses were then conducted via meta-analytic one-way ANOVA and
weighted regression to identify possible moderators of overall attrition and their four subtypes.

ii
Copyright 2005
by
Anthony Ryan Rhodes
iii
TABLE OF CONTENTS
Page
INTRODUCTION ........................................................................................................................ 1
STATEMENT OF THE PROBLEM............................................................................................ 2
BACKGROUND OF THE STUDY ............................................................................................. 3
HYPOTHESIS ............................................................................................................................ 10
OPERATIONAL DEFINITIONS............................................................................................... 11
METHODS ................................................................................................................................. 13
RESULTS ................................................................................................................................... 17
DISCUSSION............................................................................................................................. 25
ASSUMPTIONS AND LIMITATIONS .................................................................................... 29
REFERENCES ........................................................................................................................... 38

INTRODUCTION
Longitudinal methods of data collection have arisen as an essential tool for the
estimation and analysis of intra-individual change. However, one of the greatest
difficulties in conducting studies over long periods of time is the maintenance of subject
participation. Often persons are unable to continue in a study do to reasons of death,
illness, disinterest, or migratory issues. Within the last three decades it has become well
established in the literature that those participants who remain in a study
characteristically outperform those who dropout in all areas of biological and cognitive
performance; thus effecting both the internal and external validity of the data.
Subsequently, this leads to an overrepresentation of the population, and underestimation
of age related decline. Also, this issue appears to be particularly relevant for studies
which use older adults as participants.
Although attempts have been made by individual researchers to estimate and
compensate for the bias due to participant attrition within their individual research, a
comprehensive analysis of the appearance and characteristics of longitudinal attrition
have yet to be examined.
The goal of this meta-analysis is to provide a comprehensive review of the
occurrence and characteristics of attrition in longitudinal studies using older participants
in an attempt to illuminate the nature of attrition and provide information that may be
used to help address particular factors of methodology, participant characteristics, or
general focus of the study where attrition may be more prominent. Also, a comprehensive
review may help focus efforts toward over-sampling to compensate for attrition or in the
maintenance of subject participation over long periods of time.
1

STATEMENT OF THE PROBLEM
This study attempts to address the lack of comprehensive knowledge linking
various characteristics to the degree of attrition across longitudinal aging studies. While it
has become common practice to address attrition effects in individual research, few
studies have sought to define the dimensions and characteristics of attrition. Moreover, to
this author's knowledge, no one has attempted to identify methodological factors (such as
number of test sessions, tests administered, length of test battery, etc.) which could
influence the extent of participant attrition.
It was the intention of this study to confirm and extend current findings within
individual research studies to a more generalized/global description of attrition and to
provide data that would aid researchers by establishing estimates of attrition and
recognizing demographic characteristics of the participants, issues of research domain,
and methodological factors which may contribute to participant loss.
To solve this problem, a meta-analysis was conducted using longitudinal studies
published in thirteen well-established gerontological journals since 1970.
2

BACKGROUND OF THE STUDY
In longitudinal research studying aging, participant attrition (also termed
experimental mortality, or dropout) has become a prime concern not only due to the fact
that fewer subjects can weaken statistical power, but because loss of participants in
research is anything but random in nature. When the loss of subjects is related to the
variables being studied, attrition will often lead to bias in the remaining data. Indeed,
researchers have found evidence that data based solely on retest participants is
increasingly positively biased and less representative of the original sample or the target
population, thus posing an increased threat to internal and external validity of the study
(Baltes, Shaie, & Nardi, 1971). For example, Siegler and Botwinick (1997) found that
over a twenty-year period, retest participants performed progressively superior in
intellectual ability than those who had dropped out over the eleven trials. This led to an
overestimation of intellectual ability for the original sample and became a limitation to
the generalizability of the findings.
Conversely, there is some evidence which would suggest that while attrition can
bias scores when comparing those who dropout to retest participants, the relationships
between variables appear to remain stable (Goudy, 1985; Norris, 1987; Streib, 1966).
Thus, it would appear that attrition may not be as great a threat when the purpose of the
study is correlational in nature (see Weiss (1999) for an analysis of variance test for
random attrition).
In the present literature three general areas have been associated with participant
loss: (1) characteristics of the participants, (2) issues of research methodology, and (3)
3

issues of the research domain or general focus. Of these three categories, data comparing
characteristics of dropouts to retest participants is the most abundant.
Numerous participant characteristics have been examined in reference to their
relationship with experimental mortality. In general, it appears that retest participants
outperform dropouts in nearly every area including: health (Hoeymans, Feskens, van Den
Bos, & Kromhout, 1998; Markides, Dickson, & Pappas, 1982; Norris, 1985; Powers &
Bultena, 1972; Schmidt, Gruman, King, & Wolfson, 2000; Sharma, Tobin, & Brant,
1989; Streib, 1966; Wilson & Webber, 1976), economic resources (Powers & Bultena,
1972; Rabbit, Watson, Donlan, Bent, & McInnis, 1994; van Groenou, Deeg, & Penninx,
2003), and cognitive performance (Cooney, Schaie, & Willis, 1988; Rabbit, Watson,
Donlan, Bent, & McInnis, 1994), particularly areas of cognition such as verbal meaning,
reasoning, spatial, number, and word fluency (Schaie, Labouvie, & Barrett, 1973).
Dropouts tend to be older than retest participants (Markides, Dickson, & Pappas, 1982;
Powers & Bultena, 1972; Rabbit, Watson, Donlan, Bent, & McInnis, 1994; Schaie,
Labouvie, & Barrett, 1973; Sharma, Tobin, & Brant, 1989; Wilson & Webber, 1976), are
more often male (Brayne et al., 1999; Markides, Dickson, & Pappas, 1982; Streib, 1966),
are observed to participate less in therapy (Oei & Kazmierczak, 1997) and be less
involved with religious institutions (Krause, 1998), to be more likely to express death
wishes (Forsell, 2000), exhibit greater behavioral rigidity (Schaie, Labouvie, & Barrett,
1973,) and for older adults especially, tend to be less active and more likely to view
themselves as old (Markides, Dickson, & Pappas, 1982). However, retest participants do
not appear to differ from dropouts in educational level (Wilson & Webber, 1976), level of
depression (Oei & Kazmierczak, 1997), or life satisfaction (Powers & Bultena, 1972).
4

Moreover, the risk of experimental mortality appears especially high in research sampling
from elderly populations (Schaie, Labouvie, & Barrett, 1973).
While the majority of the literature concerning experimental mortality has tended
to focus upon comparisons between retest participants and dropouts, there have been a
number of studies which have attempted to more fully understand attrition by
categorizing participant’s reasons for dropping out of the study. Most of the data which
exists appear unanimous in their findings. In general participant dropout can be classified
either due to refusal, illness, death, or an inability to locate the participant.
Refusers tend to be the most advantaged of all the dropouts (Markides, Dickson,
& Pappas, 1982) and to more closely resemble the characteristics and performance of
retest participants (Cooney, Schaie, & Willis, 1988; Norris, 1985). Norris (1985) found
that older refusers tended to be younger than other dropouts, healthier, and have better
quality housing. This has been recently supported by Matthews, Chatfield, Freeman,
McCracken, & Brayne (2004) who found higher refusal rates in participants who live in
rural centers. Not surprisingly other studies looking at older refusers have found them to
be of a higher social class, more socially involved (Markides, Dickson, & Pappas, 1982),
less physically frail, more likely to refuse purely due to disinterest (Tennstedt, 1992), and
more likely to be female (van Beijsterveldt et al., 2002). Riegel, Riegel, & Meyer (1968)
found that refusers had fewer interests, were less active, and more dogmatic than their
restest counterparts. Also it has been noted that the largest proportion of attrition due to
refusal takes place early in the study, near the second session (Norris, 1985). Deeg, van
Tilburg, Smit, & de Leeuw (2002) found evidence in two independent samples of older
5

adults what suggested requesting participation in a side study increased the risk of refusal
at the following follow-up.
Attrition due to loss of contact with the participant may result from any number of
reasons. Wilson and Webber (1976) noted that one third of their original sample were
unlocatable after nine years. They also found that lost participants were more
geographically mobile, more likely to live in trailers or hotels, and to have lower incomes
than respondents. Often the most difficult part of keeping track of highly migratory
participants involves an increased investment of time and resources from the researchers.
Of all the older participants, those who dropout due to illness or death often
perform the lowest (Rabbit, Watson, Donlan, Bent, & Mcinnis, 1994), tend to be older
(Norris, 1985; Powers, 1972; Wilson & Webber, 1976), are more often men (Norris,
1985; Wilson & Webber, 1976), and exhibit the lowest levels of health (Norris, 1985;
Powers, 1972). Participants dropping out due to illness have reportedly worse health than
those dropping out due to death. Also, women in this group tend to be less educated and
have fewer social supports (Norris, 1985). Those dropping out due to death before retest
have also been found to be less active (Wilson & Webber, 1976), have lower family
incomes, are more likely to be widowed, confined to their homes, or unemployed
(Powers, 1972), and are most often male (van Beijsterveldt et al., 2002).
Although there appears to be an abundance of work comparing the characteristics
of retest participants with dropouts, there remains a dearth of information examining the
relationship between research methodology and subsequent attrition. Obviously, such
aspects as length of test battery or time between sessions will have some baring on
whether or not a participant desires or is able to return for a follow up session. Sharma,
6
Tobin, and Brant (1989) found that dropouts lived significantly farther from the study
center than retest participants and that attrition was much higher if they were recruited
into the study by another subject who subsequently dropped out. Also, there is some data
to support that attrition in earlier waves may be influenced more by lack of interest
(Norris, 1985), while subsequent waves may be influenced more by death and disability
(Norris, 1985; Schaie, 1996).
While the above information has been collected by researchers addressing
attrition within a particular study, there has yet to be a comprehensive study examining
the characteristics of experimental mortality across several longitudinal studies.
Consequently, there has not been a comprehensive examination of the effects research
domain may have on subject attrition. It would stand to reason that older participants may
be more likely to continue to participate in research which matches their interests than
research they find boring or tedious. To the author's knowledge, only one article has
attempted to address this issue. Cuijpers (1998) conducted a meta-analysis using fourteen
studies concerning outreach programs for the depressed elderly. He found that the mean
dropout rate for all the studies was 23%, but that cognitive behavioral therapies in
particular had significantly higher rates of attrition than other therapies. Cuijpers (1998)
also found that group interventions, studies with large samples of female participants, and
interventions with several sessions could predict significantly higher degrees of attrition.
What’s more, these characteristics accounted for 96% of the total variance. However, due
to the limited number of studies used and their focus upon interventions with depression,
these results may not be generalized to all studies using older participants.
7

Bias due to experimental mortality has been accepted as a known limitation of
longitudinal data. However, some attempts have been made statistically and procedurally
in an attempt to compensate for or reduce the influence of attrition. Schaie (1997) notes a
number of statistical methods presently used to asses and compensate for experimental
mortality. These methods include listwise and pairwise deletions of participants with
missing data and the use of algorithms for estimating missing data. Schaie also notes that
statistical methods such as means replacement downwardly biases the standard errors and
while regression imputation underestimates the variances and standard errors of the data.
Meanwhile, some researchers have had remarkable success adjusting research
procedures to address participant attrition. Coen, Patrick, and Shern (1996), although not
using an elderly sample, were able to maintain 95% of an original sample of 785 over a
five year period by making specific adjustments to office procedures and location
techniques. These included, but were not limited to: (1) a purposeful attempt to develop
community relations, (2) keeping a log sheet of interactions with the participant, (3) an
explanation of the purpose of the study with an emphasis on the subjects importance, (4)
hiring part-time research assistance, (5) collecting names and phone numbers of friends
or relatives of the participant to be contacted in case the participant could not be found,
(6) flexible scheduling, and (7) persistence with 'soft refusals' whereby refusers were
asked if they could be contacted again in a matter of weeks. Tennstedt (1992) found that
waiting three months to re-contact dropouts allowed time for those suffering from illness
to improve in health. This resulted in the retainment of 43% of participants who had
initially refused to continue participation. Similar results were found using advanced
8
tracking means in developing countries where participants were often mobile, can result
in an overall reduction of attrition rates by 45% (Hall, 2004).
Other studies have found promising results by keeping the participants informed
of the research progress via a news letter and managing contact and scheduling using
electronic databases as well as the use of internet based databases for lost participants
(Cotter, Burke, Loeber, Judith, & Navratil, 2002). Currently, nearly every major
longitudinal study on aging employs the use of internet websites which include contact
information for the foundation and/or experimenters (National Institute on Aging, 2005).
Some studies, such as the Seattle Longitudinal Study (2005), make use of their website to
help locate participants who have moved or changed their name. Markedly lower attrition
rates have been reported through enlisting family members for motivational purposes
(Rose, 1976), and by providing added comfort for persons with Alzheimer's disease in an
attempt to enhance participant comfort (Sharma, 1984).
The main goal of the present study is to provide a more comprehensive
description of attrition in research with the elderly. It is hoped that such information may
help pinpoint areas of research which may be apt to experience dropout. Moreover, this
information may prove extremely significant in helping researchers who wish to employ
oversampling techniques to compensate for attrition. However, it should be noted that
while oversampling may help compensate for the number of participants lost to attrition
dropout, it does not address the bias introduced by differences between retest participants
and refusers.
9

HYPOTHESIS
While the main purpose of this study was to collect descriptive data of the
characteristics of subject attrition, it also tested the following hypotheses:
1. Focus of study, participant characteristics, and issues of design will be adequate
predictors of attrition rates.
1-1. An increase in the length of test battery will be associated with greater rates of
participant attrition.
1-2. Longer times between sessions will be associated with greater rates of
participant attrition.
1-3. Larger numbers of test sessions will be associated with greater rates of
participant attrition.
1-4. Higher mean age at the first session will be associated with greater rates of
participant attrition.
1-5. Greater numbers of male participants will be associated with greater rates of
participant attrition.
2. Focus of study, participant characteristics, and issues of design will discriminate
between the four groups of dropout categories (death, illness, unlocatable, and
refusal).
10

OPERATIONAL DEFINITIONS For the purpose of this study the major variables will be operationally defined as
follows:
Attrition and experimental mortality. These terms are used synonymously as the
differential loss of respondents from one test session to the next as defined by Campbell
and Stanley (1963).
Dropouts. Those individuals who, for whatever reason, fail to continue
participating in the study after the first session. Dropouts will be further divided into four
sub-categories:
1. Refusers. Those persons who are located and appear to be healthy but no
longer wish to participate in the study.
2. The unlocatable or lost. Those participants who cannot be located or contact
and subsequently are unable to attend the study.
3. Ill. Those persons who give illness as their reason for discontinuing
participation in the study.
4. Dead or deceased. Those persons who have died since the last session.
Length of test battery. This is defined as the estimated time it takes, in minutes, to
complete a single study session.
Incentives will be defined as any compensation offered for participation in the
research study; monetary or otherwise.
General focus of the study. This is defined as the general category being studied
by the longitudinal study (be it cognitive assessment, medical, etc. in nature).
11

Method of recruitment will be defined as the means by which the researcher
acquired the subject population (be it advertisement in the local newspaper,
announcement in an aging institution, through government databases, etc).
Special attempts at maintaining participation. This will be operationally defined
as any special attempts noted by the authors to locate or retain participants outside of
incentives.
12

METHOD
Criteria for Inclusion
Computer searches for possible articles for inclusion in this meta-analysis were
conducted using online search engines available through EBSCOhost. These included
AGELINE, MEDLINE, PSYCarticles, The Psychological and Behavior Science
Collection, PSYCINFO, AND PsycLIT. Within each of these databases were entered the
key term “longitudinal”. Searches were narrowed to thirteen prominent journals which
regularly publish studies using older populations. These journals included:
Clinical Gerontologist
Death Studies
Developmental Psychology
The Gerontologist
Gerontology
Human Development
International Journal of Aging and Human Development
Journal of Gerontological Nursing
Journal of Gerontological Social Work
Journals of Gerontology A: Biological Sciences and Medical Sciences
Journals of Gerontology B: Psychological and Social Sciences
Omega
Psychology and Aging
13

Initial searches yielded 786 articles published since 1970 which met the criteria for
possible inclusion in the study.
Articles located in the initial searches were selected for inclusion into the study
based upon the following criteria: (a) That the study be longitudinal with two or more
sessions taking place at least one month apart, (b) the study must include older adults
aged 50 or older as well as provide the number of older adults in the first and final
sessions (this was necessary to compute the effect size for the meta-analysis), (c) in order
to avoid the upward bias introduced by effect sizes based on small subject samples, as
identified by Hedges (1981), each study must have a minimum of 30 participants to be
included in the meta-analysis.
Criteria for exclusion from the meta-analysis included: (a) Studies which did not
differentiate between elderly and younger cohort dropout rates, (b) studies which
selectively exclude some participants from later sessions (for example, using only
persons who perform in the upper 50 percent of the initial sample), (c) articles published
prior to 1970, (d) studies using matched pairs where the second of the pair was excluded
if their match dropped out of the study, and (e) studies employing replacement techniques
or other procedures which attempt to control for attrition by including new participants to
replace dropouts or used estimates for missing data to include participants who had
otherwise dropped out were not included in this statistical analysis.
Moreover, in the case of several articles based upon the same sample (such as in
national studies like the Seattle Longitudinal Study), only one article (the original when
possible) was included in this analysis.
14

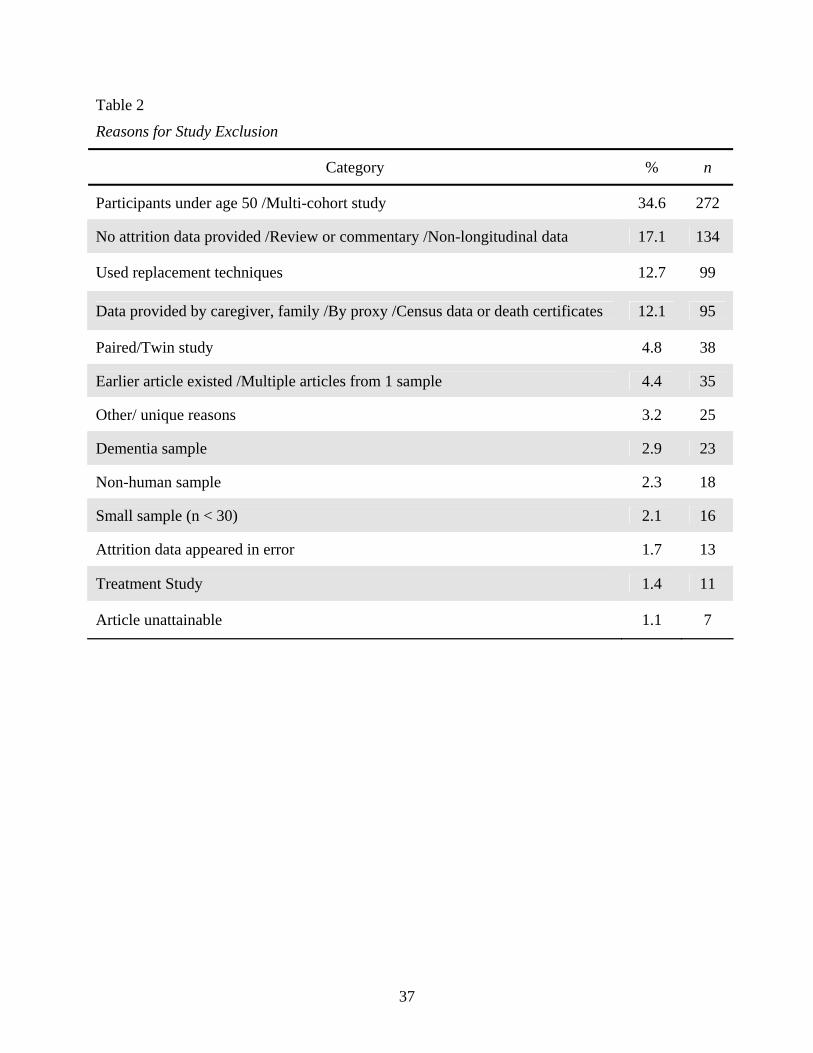
Of the 786 articles identified in initial searches, 57 met the above criteria (see
Table 1). The majority of articles excluded from this analysis were not included due to
the use of young and older (multi-cohort) populations, they verified patient status through
records or by means which did not include an interview or effortful investment on the
part of the participant, or simply failed to provide the necessary data to estimate a proper
effect size (see Table 2 for a detailed breakdown of reasons for study exclusion)
Coding
Each of the 57 studies included in this meta-analysis were coded for the following
information: number of participants at the first and last sessions, demographic
characteristics of the subjects used (e.g. mean age at first session, mean education at first
session, number of males and females, etc.), study focus, whether the participants were
drawn from an institutionalized or community dwelling sample, nationality, general self-
reports of health, as well as various aspects of methodological characteristics of the study
(number of sessions, method of recruitment, location of testing, time between sessions,
individual or group sessions, etc.). In addition, all studies were coded for the use of
monetary or non-monetary incentives as well as any special attempts to maintain subjects
over the course of the study (e.g. reminder postcards, or phone databases which included
close friends or family who might know the whereabouts of the participant). For 16
articles, data were available to break down the total attrition into the four subcategories of
refusal, lost, illness, and death.
15

Meta-Analytic Procedures
Procedures established by Lipsey and Wilson (2001) on generating and testing
effect sizes yielded from proportional data were employed for this meta-analysis. Effect
sizes for overall attrition were calculated for each study by dividing the number of total
dropouts by the total number of participants at the first session (which provided a
percentage of total dropouts). Subsequently, for the 16 studies which included data on
subtypes of attrition, effect sizes were calculated by dividing the number of participants
in a single subtype (refusal, lost, illness, or death) by the total number of participants in
the first session.
The inverse variance weight was then calculated for each effect size using
Microsoft Excel and then verified by hand. Inverse variance weights are employed by
Lipsey and Wilson (2001) as opposed to the standard error, because sampling error is
smaller for effect sizes estimated from large samples while a larger standard error
corresponds to a less precise effect size. In this way, studies using larger samples are
weighted in order to exude greater influence over statistical results than studies with
smaller samples.
Meta-analytic statistics were computed using macros provided by Lipsey and
Wilson (2001) for the statistical software SPSS. These macros were used because,
although most statistical software programs are able to accurately fit the regression model
(i.e., the regression coefficients, betas, R2, etc.), the standard errors must be adjusted to
yield correct assessments of statistical significance. This included estimates for the mean
effect size, one-way ANOVA, and modified weighted multiple regression.
16

RESULTS
Overall Attrition Effect Size
Results from effects sizes in relation to total attrition rate are presented in three
sections: (1) descriptive statistics for study characteristics, (2) effect size analysis, and (3)
analysis of moderating variables on effect size.
Descriptive Statistics for Study Characteristics
The 57 studies involved a total of 41,876 older adults (minimum = 37; maximum
= 12,939). Out of the 13 journals from which potential articles were drawn, 3 did not
provide studies which met the criteria for inclusion in the analysis (Human Development,
The Journal of Gerontological Nursing, and Death Studies). Of the remaining 10 journals
the average number of studies yielded per journal was 7.5 (SD = 3.8). The range of
publication dates for the studies was from 1975 to 2004 with over half of the studies
published after 1993 (n = 35, 61.4%). A great majority of the study topics were
psychological in focus with only 10.5% having a focus purely on medical or other topics.
The number of sessions per study ranged from 2 to 8 with over half comprising two
sessions (n = 35, 57.9%).
Effect Size Analysis
A random effects model of analysis was used for the 57 total attrition effect sizes.
Initial investigations revealed considerable heterogeneity in the variance of effect sizes
(Q(61) = 8106.26, p<.0001). Use of a random effects model assumes that each effect size
differs from the population mean by both subject-level sampling error and a second
17

component associated with random effects variance. The difficulty, however, is obtaining
a good estimate of the random effects variance component. For the purpose of this study,
the iterative method based on maximum likelihood was used to estimate random
variance, as recommended by Raudenbush (1994) for its ability to provide more accurate
estimates. The overall mean effect size for the 57 studies was 34% (d = .332). This effect
was estimated to be between .2917 and .3947 at the 95% confidence level, and indicates
that the effect size is not equal to zero.
Analysis of Moderating Variables
Categorical moderators. Nine categorical variables were analyzed for possible
moderator effects on the overall attrition effect size. Of these 10 variables five were not
found to significantly differ among groups (study focus, institutionalized vs. community
dwelling samples, nationality, group vs. individual research sessions, and method of
recruitment).
Fifteen studies provided clear data rating the health of their sample as either
healthy (n = 6) or unhealthy (n = 8). Effects sizes for the two groups were d = .1820 and
.3627, respectively. A Chi-square test indicated that the difference between the two effect
sizes was significant (Q(1) = 5.690, p = .0171). Thus, it would appear based on these 15
studies that attrition rates are significantly lower for studies using healthier older adults.
This makes perfect sense in light that two of the four subtypes of attrition (illness and
death) are inherently related to participant health.
Number of test session per study was analyzed for moderating effects on overall
attrition rate. Initially six groups were coded. However, due to a limited number of cases,
the latter three groups were collapsed into a single group which included studies with 5 to
18
8 sessions. An ANOVA was run using the 4 groups; those with two sessions (n = 33),
three sessions (n = 16), four sessions (n = 6) and five or more sessions (n = 2). Effect
sizes for the four groups were d = .3192, .4311, .1921, and .4833, respectively. Results of
the analysis indicated that the groups did significantly differ (Q(2) = 10.21, p = .0139).
Subsequent analysis combining data from the 4 and 5 or more sessions groups neared
statistical difference (Q(2) = 2.708, p = .076) with the effect size of the combined 4+
sessions group averaging d = .2651.
The use of incentives (monetary or otherwise) was analyzed for moderating
effects on overall attrition rate. Analysis revealed that studies which include incentives (n
= 8) had a lower level of overall attrition (d = .1893) than those which did not (n = 48, d
= .3648). These differences were also found to be statistically significant (Q(1) = 6.5101,
p = .0107).
Next, special attempts to maintain individual participation in a study were
analyzed for possible moderating effects. Analysis revealed that those studies which did
not implement attempts to maintain study participants (n = 51, d =.359) neared
significantly different effect sizes (Q(1) = 2.8209, p = .0681) than those who did (n = 6,
d = .2171). These results suggest there may be reason to more closely examine
maintenance attempts and their moderating effect on overall attrition rates.
Continuous moderators. Seven continuous variables were examined by means of
statistical regression for their possible moderating effects on overall attrition effect sizes.
Of these, the mean age of participants, the mean education level, the number of males at
the first session, number of females at the first session, the length of the test battery, and
initial response rate all failed as significant predictors of the overall rate of attrition.
19
Fifty-four studies provided information on the time between sessions. During
coding in cases where times were inconsistent between three or more sessions, an average
was taken across times. Weighted regression revealed that time between sessions was a
significant predictor of overall attrition effect size (Q(1) = 18.9597, p < .0001),
accounting for 26% of the variance. This variable was then converted into a categorical
variable in order to analyze possible directional trends in the effect size. Within this new
variable the three groups were: (a) studies with 2 to 12 months between sessions (n = 21
d = .2839), (b) studies with 13 to 24 months between sessions (n = 12, d = .2796), and (c)
studies with 25 or more months between sessions (n = 21, d = .4382). A Chi-square test
revealed the three groups to be significantly different (Q(2) = 10.2104, p = .0061).
However, no clear trend is evident, although the results suggest that studies with more
than 2 years between sessions have an increased risk of participant attrition.
Attrition Subtype Effect Sizes
Of the 57 articles included in this study, 16 broke down the overall attrition into
the four subcategories of refusal, lost, illness, and death. Effect sizes and inverse variance
weights based upon the total number of participants at the first session were calculated
for each of these subtypes as well as tests for possible moderators. It should be noted
however that the results from these few studies may not generalize well to the 57 studies
included in the overall attrition effect size estimates. However, for the sake of shedding
some light on the relation of demographic and methodological factors with attrition
subtypes, meta-analytic procedures were conducted on the select 16. Crosstabulations and
20
Chi-square test of independence were used in comparing the 41 studies which did not
break down attrition into subtypes to the 16 that did. The results suggest that the two
groups did not differ significantly on characteristics such as rate of overall attrition
(Χ2(37) = 39.0, p = .801) study focus (Χ2(4) = 4.644, p = .326), number of subjects at the
first session (Χ2(38) = .390, p = .425), Mean age (Χ2(6) = 5.867, p = .974), mean level of
education (Χ2 (6) = 7, p = .90), institutionalized vs. community dwelling samples (Χ2 (2)
= 3.19, p = .204), number of test session (Χ2(3) = .919, p = .821), or time between
sessions (Χ2(16) = 15.963, p = .456).
Effect Size Analysis
Refusal. A mean effect size was calculated for the proportion of dropouts lost due
to refusal. Initial tests revealed the variance of the effect sizes to be considerably
heterogeneous (Q(14) = 136.40, p < .0001) and subsequent analysis were conducted
using a random effects model. The overall effect size for participants who dropped out
due to refusal was 8% (d = .0857). This effect was estimated to be between .0655 and
.1059 at the 95% confidence interval.
Lost. Of the 12 studies which broke down attrition into the four subtypes, 14
reported the number of dropouts due to participants who could no longer be contacted.
For these thirteen a mean effect size of 10% (d = .0990) was calculated for the proportion
of participants overall lost during the course of a longitudinal study. This effect size was
estimated to be between .0668 and .1312 at the 95% confidence level. The variance of
the effects sizes appeared heterogeneous (Q(11) = 197.0778, p < .0001).
Illness. A mean effect size was calculated for the proportion of dropouts due to
illness but not death. Only seven studies provided data on this attrition subtype. The
21
results, therefore, must be viewed with caution as they may not generalize to even the 16
studies which broke down attrition into subtypes. The mean effect size for participant
attrition due to illness was estimated to be 6% (d = .0612), with effects sizes falling
between .0265 and .0960 at the 95% confidence level. The mean effect size variance was
found to be heterogeneous (Q(6) = 123.3101, p < .0001).
Dead. Of the subtypes reported but not included in this analysis, the proportion
dead was noted most often by the author during coding. Data on the number of
participants was available for all 16 studies. Analysis yielded an overall mean effect size
of 14% (d = .1417) of the participants at the first session dropping out due to death. This
effect was estimated to be between .0994 and .1840 at the 95% confidence level. The
mean effect size was found to be heterogeneous (Q(15) = 1750.5834, p <.0001) and a
random effects model was used in all subsequent analysis based upon this effect size.
Analysis of Moderating Variables
Nine categorical variables (study focus, institutional or community sample type,
number of sessions, group or individual sessions, use of incentives, location, and attempts
to maintain participants) were examined by means of a one-way ANOVA to test for
possible moderating effects on each of the attrition subtype effect sizes. Within the
analysis each of the categorical variables were used as the independent variable and
tested for their moderating effects on the dependent variable (effect sizes for the four
attrition subtypes). Thus, thirty-six individual one-way ANOVAs were tested for
significance.
Nine continuous variables were also examined (number of subjects at the first
session, mean age at first session, mean education at first session, number of males at the
22
first session, number of females at the first session, the length of the test battery in
minutes, the time between test sessions, number of test sessions, and the percentage of
initial response). In most every case, across all four subtypes of attrition, the majority of
demographic and methodological variables were non-significant. What follows are those
moderating variables which reached statistical significance.
Attrition due to refusal. Based upon fifteen studies which reported the proportion
of attrition lost to participant refusal, data suggested that the use of incentives could have
a possible moderating effect on refusal effect size (Q(1) = 4.6948, p = .0303), with those
studies implementing incentives having greater attrition due to refusal (n = 3, d = .1324)
than those studies which did not (n = 12, d = 0740).
After the variable for study focus was condensed into three categories (general
psychological, cognitive psychological, and medical oriented), significant differences
were discovered between the newly coded three groups (Q(7) = 3.6655, p = .0316) with
general psychological focus (n = 8, d = .0711) and medical (n = 2, d = .0590) having
significantly lower rates of attrition due to refusal than those with a cognitive
psychological focus (n = 5, d = .1240).
Due to a limited number of cases per each group, test location was recoded into a
dichotomous variable. The new groups were: (a) those participants who were assessed in
their homes (n = 4, d = .0787), and (b) those participants who were assessed in places
other than their homes (n = 3, d = .1328). A Chi-square test for independence resulted in
a significant result suggesting that these two groups were significantly different (Q(1) =
6.1684, p = .0130).
23
Lost and ill attrition subtypes. Based upon 12 studies, possible moderating effects
on participant dropout due to loss of contact or illness were examined. None of these
variables yielding significant results. Such moderating variables may well exist, however
they were not coded within this study.
Attrition due to death. Analysis were run on the 16 studies which included the
proportion of participants lost to death. The only variable to yield significant results was
the time between studies (Q(1) = 13.9761, p < .0005). A weighted regression revealed
that 46% of the total variance in attrition due to death could be accounted for by the
number of months between the initial and latest session. This variable was then recoded
into a categorical variable for direction and trend analysis. Within the categorical variable
were three groups: (1) studies with 2 to 12 months between sessions (n = 3, d = .0227),
(2) studies with 13 to 24 months between sessions (n = 3, d = .2103), and (3) studies with
25 or more months between sessions (n = 10, d = .1605). A Chi-square test revealed the
three groups to be significantly different (Q(2) = 4.0588, p = .0131), however no clear
trend or could be ascertained from these results.
24
DISCUSSION
What can be concluded from this meta-analysis is that attrition is indeed a sizable
drawback to the study of older aged participants over time. Estimates based upon the 57
longitudinal studies included in this analysis suggest that on average 34% of the initial
sample will be lost by the time of the studies conclusion. This average is somewhat larger
than that found by Cuijpers (1998). However it should be noted that Cuijpers’ meta-
analysis was conducted using 14 studies, whereas my mean effect size has been based on
57 studies published over the past thirty-five years.
Moreover, attrition rates appear to vary considerably from study to study. My
analysis suggests that this variability is non-random. In order to illuminate those factors
which could possibly moderate participant dropout this study examined several
demographic and methodological variables for their possible influence on overall attrition
rates.
Results from this meta-analysis support results found by previous researchers.
This study found the level of participant education to be a non-significant predictor of the
overall attrition rate; results previously observed by Wislon and Webber (1976). Sharma,
Tobin, and Brant (1989) note that distance from test location is significantly related to
participant dropout, while this study also suggests that research conducted in the
participants home, where distance is not an issue for the participant, has markedly lower
levels of overall attrition.
25
Conclusions can also be made from this study which contradict findings found by
other researchers. Results from this analysis suggest that age is not a significant factor for
attrition rates while several studies have shown that dropouts are often older than
participants who remain in the study (Rabbit et al., 1994; Schaie, Labouvie, & Barrett,
1973).
Norris (1985) and Schaie (1996) report that death and illness become increasing
influential on rate of dropout as a longitudinal study moves into subsequent waves. In
support of these findings this study found the number of sessions to be a significant
moderator of overall attrition, though a clear trend was not established. However, an
earlier meta-analysis conducted by Cuijpers (1998) has established this trend. Also, in
support of the role illness and death play as two of the four subtypes of attrition, this
analysis found that studies using older participants rated as healthy showed significantly
less overall attrition.
This analysis also has found evidence to support those researchers whose
individual studies appear to have retained more older adults due to special attempts to
maintain participation (Coen, Patrick & Shern, 1996; Rose, 1976; Tennstedt, 1992).
Maintenance techniques such as reminder postcards and phone calls neared significance
at having a moderating effect on overall attrition. Evidence that detailed contact
information, incentives for participation, and postcard/telephone reminders help to reduce
participant dropout have been found with adolescent samples (Boys, Mardsden, Stillwell,
Hatchings, Griffiths, & Farrell, 2003). Future research should more closely examine the
influence maintenance procedures may have in retaining older participants who would
otherwise dropout from the study, nullifying their contribution.
26
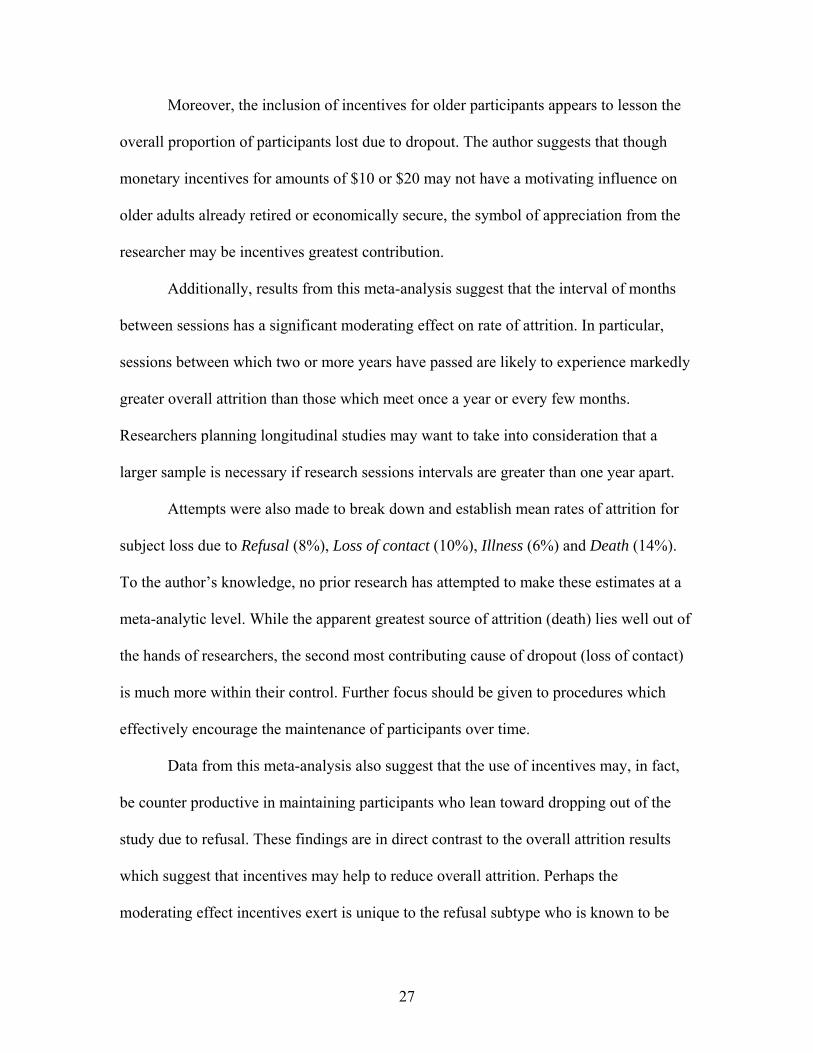
Moreover, the inclusion of incentives for older participants appears to lesson the
overall proportion of participants lost due to dropout. The author suggests that though
monetary incentives for amounts of $10 or $20 may not have a motivating influence on
older adults already retired or economically secure, the symbol of appreciation from the
researcher may be incentives greatest contribution.
Additionally, results from this meta-analysis suggest that the interval of months
between sessions has a significant moderating effect on rate of attrition. In particular,
sessions between which two or more years have passed are likely to experience markedly
greater overall attrition than those which meet once a year or every few months.
Researchers planning longitudinal studies may want to take into consideration that a
larger sample is necessary if research sessions intervals are greater than one year apart.
Attempts were also made to break down and establish mean rates of attrition for
subject loss due to Refusal (8%), Loss of contact (10%), Illness (6%) and Death (14%).
To the author’s knowledge, no prior research has attempted to make these estimates at a
meta-analytic level. While the apparent greatest source of attrition (death) lies well out of
the hands of researchers, the second most contributing cause of dropout (loss of contact)
is much more within their control. Further focus should be given to procedures which
effectively encourage the maintenance of participants over time.
Data from this meta-analysis also suggest that the use of incentives may, in fact,
be counter productive in maintaining participants who lean toward dropping out of the
study due to refusal. These findings are in direct contrast to the overall attrition results
which suggest that incentives may help to reduce overall attrition. Perhaps the
moderating effect incentives exert is unique to the refusal subtype who is known to be
27

more financially stable and more active to their dropout counterparts. It is also possible
that, for participants who are already leaning toward refusal, the offering of monetary or
other incentives may be interpreted as coercion on the part of the researcher.
Moreover, it is suggested that such methodological factors as the use of
incentives, and the administration of assessments in the participants homes could help to
reduce participant loss after the initial session. Also, these findings may help in alerting
those researchers conducting studies with a cognitive psychological focus to prepare for
greater refusal rates than that of general psychological or medical studies. This was more
clearly identified by Cuijpers (1998); as his meta-analysis noted that cognitive
assessments tend to increase the overall participant dropout rate.
This analysis did not find, however, any significantly moderators for the dropout
rates related to lost to ill participants. However, due to the considerable variability of
scores within these two groups, it is suggested by the author that moderators do exist but
were not assessed within this analysis. Further research should be conducted in order to
account for some of this within-group heterogeneity.
28
ASSUMPTIONS AND LIMITATIONS
Within this study, it is possible that some participants may have given illness as
their reason for dropping out when, in fact, they did not wish to continue for other
reasons, such as disinterest. It was therefore assumed that all participants, when giving
reasons for dropout, where sincere with their explanations.
While attempts have been made to be relatively inclusive in the breadth of aging
related journals used for the meta-analysis, the researcher has limited himself to journals
which are more easily found in the University of North Texas campus library. Therefore,
a possible limitation of this study lies in the selectivity of these journals and their
generalizability to all longitudinal studies conducted in the last thirty years. Also, these
are generally considered prestigious journals and perhaps underestimate the overall effect
size for all journals.
Moreover, since the articles included in this study were selected based on their
use of older adults, the results may not generalize well to all age groups. Indeed, Schaie,
Labouvie, and Barrett (1973) found that older adults had a significantly greater degree of
attrition than younger participants. One should take caution when attempting to
generalize these results onto other age cohorts.
One of the possible drawbacks for a Meta-analytical study is significance testing
(The File Drawer Problem) (Anderson, 1999; Gliner & Morgan, 2000). It has been well
documented that if only studies yielding significant results get published, then the data
collected using these articles may be biased. Although the outcomes of the research
articles included in this meta-analysis are inconsequential when looking at attrition rates,
29

it is possible that studies which experienced an extreme amount of attrition may have
failed to render significant results or get published due to a small sample size.
Consequently, one possible limitation of a meta-analysis on attrition could be an
underestimation of participant loss.
30
31
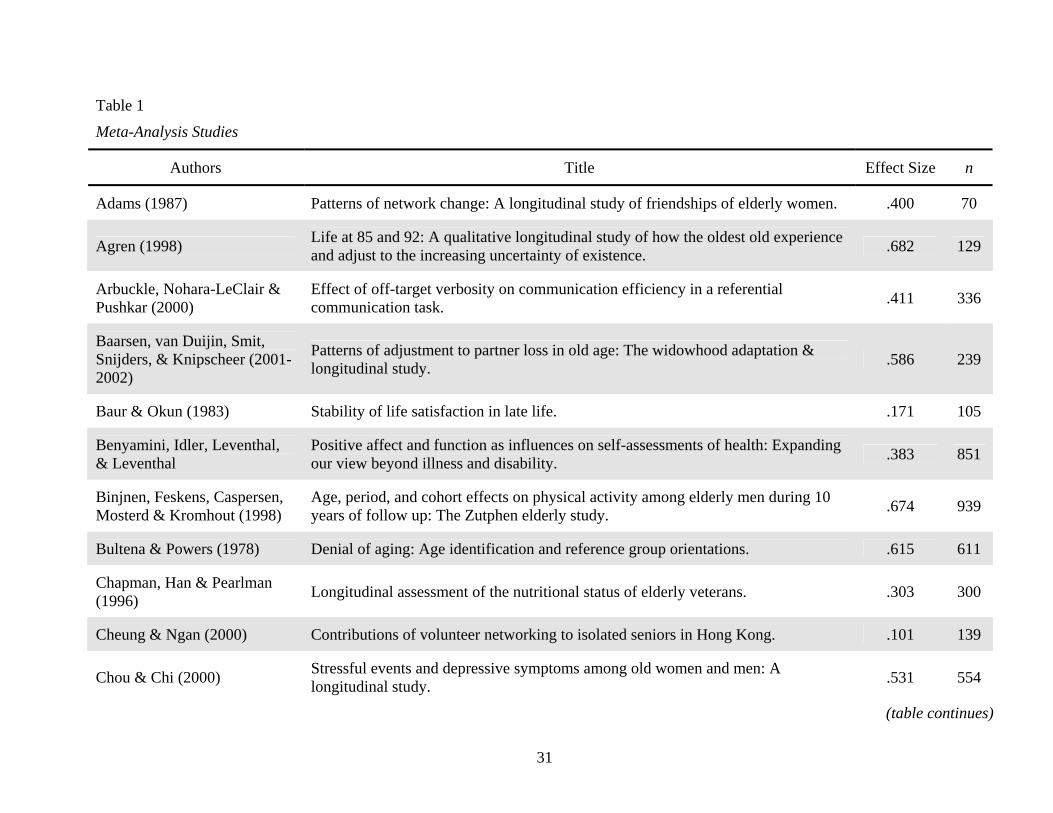
Table 1
Meta-Analysis Studies
Authors Title Effect Size n
Adams (1987) Patterns of network change: A longitudinal study of friendships of elderly women. .400 70
Agren (1998) Life at 85 and 92: A qualitative longitudinal study of how the oldest old experience and adjust to the increasing uncertainty of existence. .682 129
Arbuckle, Nohara-LeClair & Pushkar (2000)
Effect of off-target verbosity on communication efficiency in a referential communication task. .411 336
Baarsen, van Duijin, Smit, Snijders, & Knipscheer (2001-2002)
Patterns of adjustment to partner loss in old age: The widowhood adaptation & longitudinal study. .586 239
Baur & Okun (1983) Stability of life satisfaction in late life. .171 105
Benyamini, Idler, Leventhal, & Leventhal
Positive affect and function as influences on self-assessments of health: Expanding our view beyond illness and disability. .383 851
Binjnen, Feskens, Caspersen, Mosterd & Kromhout (1998)
Age, period, and cohort effects on physical activity among elderly men during 10 years of follow up: The Zutphen elderly study. .674 939
Bultena & Powers (1978) Denial of aging: Age identification and reference group orientations. .615 611
Chapman, Han & Pearlman (1996) Longitudinal assessment of the nutritional status of elderly veterans. .303 300
Cheung & Ngan (2000) Contributions of volunteer networking to isolated seniors in Hong Kong. .101 139
Chou & Chi (2000) Stressful events and depressive symptoms among old women and men: A longitudinal study. .531 554
(table continues)

32
Table 1 (continued).
Authors Title Effect Size n
Cohen, Teresi & Holmes (1985) Social networks and adaptation. .174 161
Cutler (1975) Transportation and changes in life satisfaction. .388 170
Desrosiers, Hebert, Bravo & Rochette (1998)
Comparison of cross-sectional and longitudinal designs in the study of aging of upper extremity performance. .267 360
Falvo & Norman (2004) Never too old to learn: The impact of an HIV/AIDS education program on older adults’ knowledge. .150 40
Fernandez, Mutran, Reitzer & Sudha (1998) Ethnicity, gender, and depressive symptoms in older workers. .082 826
Ferraro (2003) Psychological resilience in older adults following the 1997 flood. .030 37
Fine & Tangeman (1993) Adaptive behavior scale predictive validity with elderly male veterans. .442 120
Gall, Evans & Howard (1997) The retirement adjustment process: Changes in the well-being of male retirees across time. .478 224
Gill, Williams, Richardson & Tinetti (1996)
Impairments in physical performance and cognitive status as predisposing factors for functional dependence among nondisabled older persons. .180 945
Gold & Arbuckle (1995) A longitudinal study of off-target verbosity. .146 205
Graney (1975) Happiness and social participation in aging. .233 60
Holahan & Holahan (1987) Self-efficacy, social support, and depression in aging: A longitudinal analysis. .187 64
(table continues)

33
Table 1 (continued).
Authors Title Effect Size n
Hultsch, Hertzog, Small & Dixon (1999) Use it or lose it: Engaged lifestyle as a buffer of cognitive decline in aging? .487 487
Hultsch, Hertzog, Small, McDonald-Miszczak & Dixon (1992)
Short-term longitudinal change in cognitive performance in later life. .386 484
Hyduk (1996) The dynamic relationship between social support and health in older adults: Assessment implications. .595 1598
Janevic, Janz, Dodge, Wang, Lin & Clark (2004)
Longitudinal effects of social support on the health and functioning of older women with heart disease. .163 570
Krause (1987) Chronic strain, locus of control, and distress in older adults. .245 351
Krause (1990) Perceived health problems, formal/informal support, and life satisfaction among older adults. .380 1831
Lachman (1983) Perceptions of intellectual aging: Antecedent or consequence of intellectual functioning? .208 96
Lachman & Leff (1989) Perceived control and intellectual functioning in the elderly: A 5-year longitudinal study. .594 106
Lee & Markides (1990) Activity and mortality among aged persons over an eight-year period. .500 508
Liu, Liang, Muramatsu & Sugisawa (1995)
Transitions in functional status and active life expectancy among older people in Japan. .171 2200
Markides, Levin & Ray (1987) Religion, aging, and life satisfaction: An eight-year, three-wave longitudinal study. .503 511
(table continues)

34
Table 1 (continued).
Authors Title Effect Size n
McAvay, Seeman & Rodin(1996) A longitudinal study of change in domain-specific self-efficacy among older adults. .114 264
McCulloch (1991) A longitudinal investigation of the factor structure of subjective well-being: The case Of the Philadelphia geriatric center morale scale. .533 418
Meeks, Murrell, & Mehl (2000)
Longitudinal relationships between depressive symptoms and health in normal older and middle-aged adults. .495 2931
Mossey, Knott & Craik (1990) The effects of persistent depressive symptoms on hip fracture recovery. .105 219
Newsom, Nishishiba, Morgan & Rook (2003)
The relative importance of three domains of positive and negative social exchanges: A Longitudinal model with comparable measures. .230 200
Nuttman-Shwartz (2004) Like a high wave: Adjustment to retirement. .071 56
Ostir, Ottenbacker & Markides (2004) Onset of frailty in older adults and the protective role of positive affect. .448 3050
Parmelee, Katz & Lawton (1992) Incidence of depression in long-term care settings. .484 868
Parmelee, Kleban, Lawton & Katz (1991) Depression and cognitive change among institutionalized aged. .798 995
Reinhardt, Boerner & Benn (2003)
Predicting individual change in support over time among chronically impaired older adults. .451 570
Richardson & Kilty (1991) Adjustment to retirement: Continuity vs. discontinuity. .112 250
(table continues)
35
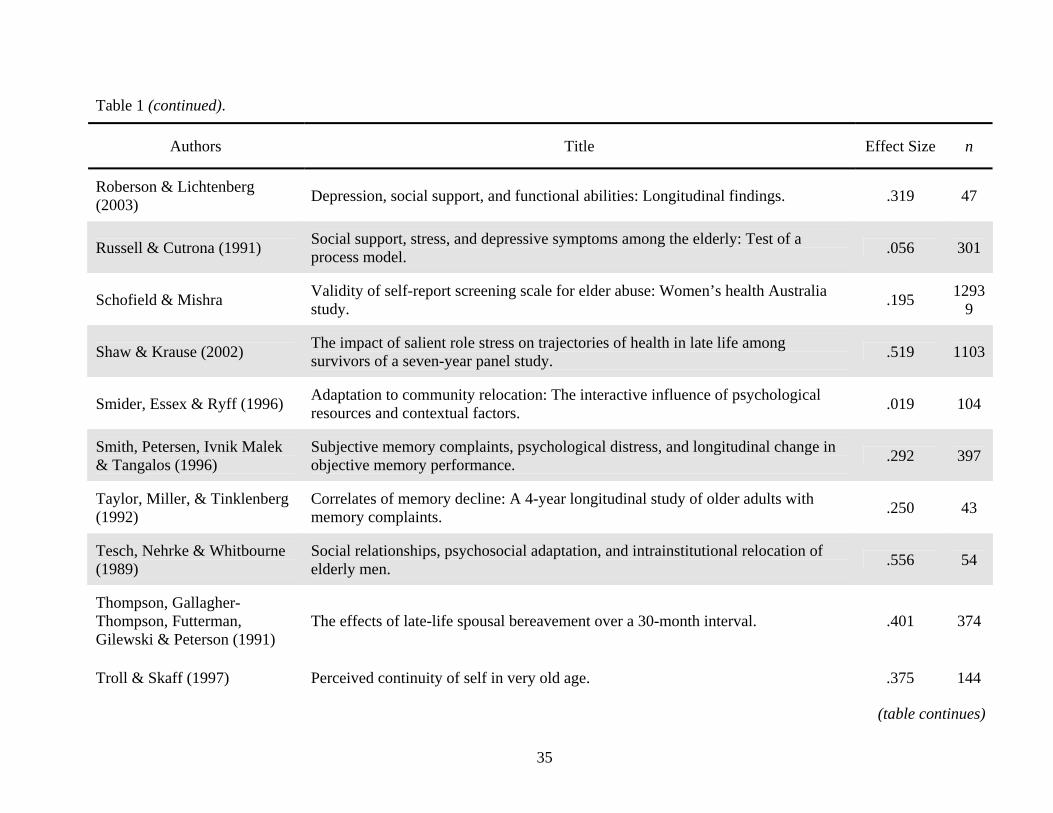
Table 1 (continued).
Authors Title Effect Size n
Roberson & Lichtenberg (2003) Depression, social support, and functional abilities: Longitudinal findings. .319 47
Russell & Cutrona (1991) Social support, stress, and depressive symptoms among the elderly: Test of a process model. .056 301
Schofield & Mishra Validity of self-report screening scale for elder abuse: Women’s health Australia study. .195 1293
9
Shaw & Krause (2002) The impact of salient role stress on trajectories of health in late life among survivors of a seven-year panel study. .519 1103
Smider, Essex & Ryff (1996) Adaptation to community relocation: The interactive influence of psychological resources and contextual factors. .019 104
Smith, Petersen, Ivnik Malek & Tangalos (1996)
Subjective memory complaints, psychological distress, and longitudinal change in objective memory performance. .292 397
Taylor, Miller, & Tinklenberg (1992)
Correlates of memory decline: A 4-year longitudinal study of older adults with memory complaints. .250 43
Tesch, Nehrke & Whitbourne (1989)
Social relationships, psychosocial adaptation, and intrainstitutional relocation of elderly men. .556 54
Thompson, Gallagher- Thompson, Futterman, Gilewski & Peterson (1991)
The effects of late-life spousal bereavement over a 30-month interval. .401 374
Troll & Skaff (1997) Perceived continuity of self in very old age. .375 144
(table continues)

36
Table 1 (continued).
Authors Title Effect Size n
Williamson & Schulz (1995) Activity restriction mediates the association between pain and depressed affect: A Study of younger and older adult cancer patients. .417 132
Zarit, Griffiths & Berg (2004) Pain perceptions of the oldest old: A longitudinal study. .480 190
37
Table 2
Reasons for Study Exclusion
Category % n
Participants under age 50 /Multi-cohort study 34.6 272
No attrition data provided /Review or commentary /Non-longitudinal data 17.1 134
Used replacement techniques 12.7 99
Data provided by caregiver, family /By proxy /Census data or death certificates 12.1 95
Paired/Twin study 4.8 38
Earlier article existed /Multiple articles from 1 sample 4.4 35
Other/ unique reasons 3.2 25
Dementia sample 2.9 23
Non-human sample 2.3 18
Small sample (n < 30) 2.1 16
Attrition data appeared in error 1.7 13
Treatment Study 1.4 11
Article unattainable 1.1 7
REFERENCES
*Adams, R. G. (1987). Patterns of network change: A longitudinal study of friendships of elderly women. The Gerontologist, 27, 222-227.
*Agren, M. (1986). Life at 85 and 92: A qualitative longitudinal study of how the oldest
old experience and adjust to the increasing uncertainty of existence. International Journal of Human Development, 47, 105-117.
Andersson, G. (1999). The role of Meta-Analysis in the significance test controversy.
European Psychologist, 4, 75-82. *Arbuckle, T. Y., Nohara-LeClair, M., & Pushkar, D. (2000). Effect of off-target
verbosity on communication efficiency in a referential communication task. Psychology and Aging, 15, 65-77.
Baltes, P. B., Schaie, K. W., & Nardi, A. H. (1971). Age and experimental Mortality in a
seven-year longitudinal study of cognitive behavior. Developmental Psychology, 5, 19-26.
*Baur, P. A., & Okun, M. A. (1983). Stability of life satisfaction in late life. The
Gerontologist, 23, 261-265. *Benyamini, Y., Idler, E. L., Leventhal, H., & Leventhal, E. A. (2000). Postitive affect
and function as influences on self-assessments of health: Expanding our view beyond illness and disability. Journal of Gerontology, 55B, P107-P116.
*Bijnen, F. C. H., Feskens, E. J. M., Caspersen, C. J., Mosterd, W. L., & Kromhout, D.
(1998). Age, period, and cohort effects on physical activity among elderly men during 10 years of follow-up: The Zutphen elderly study. Journal of Gerontology, 53A, M235-M241.
Boys, A., Marsden, J., Stillwell, G., Hatchings, K., Griffiths, P., & Farrell, M. (2003).
Minimizing respondent attrition in longitudinal research: Practical implications from a cohort study of adolescent drinking. Journal of Adolesence, 26, 363-374.
Brayne, C., Spiegelhalter, D. J., Dufouil, C., Chi, L., Dening, T. R., Paykel, E. S.,
O'Connor, D. W., Ahmed, A., McGee, M. A., & Huppert, F. A. (1999). Estimating the true extent of cognitive decline in the old old. Journal of the American Geriatrics Society, 47, 283-1288.
*Bultena, G. L., & Powers, E. A. (1978). Denial of aging: Age identification and
reference group orientations. Journal of Gerontology, 33, 748-754.
38
Campbell, D. T., & Stanley, J. C. (1963). Experimental and quasi-experimental designs for research on teaching. In N. L. Gage (Ed.), Handbook of research on teaching. Chicago, IL: Rand McNally.
*Chapman, K. M., Ham, J. O., & Pearlman, R. A. (1996). Longitudinal assessment of the
nutritional status of elderly veterans. Journal of Gerontology, 51A, B261-B269.
*Cheung, C., & Ngan, M. (2000). Contributions of volunteer networking to isolated
seniors in Hong Kong. Journal of Gerontological Social Work, 33, 79-98. *Chou, K., & Chi, I. (2000). Stressful events and depressive symptoms among old
women and men: A longitudinal study. International Journal of Aging and Human Development, 51, 275-293.
Coen, A. S., Patrick, D. C., & Shern, D. L. (1996). Minimizing attrition in longitudinal
studies of special populations: An integrated management approach. Evaluation and Program Planning, 19, 309-319.
*Cohen, C. I., Teresi, J., & Holmes, D. (1985). Social networks and adaptation. The
Gerontologist, 25, 297-304. Cooney, T. M., Schaie, K. W., & Willis, S. L. (1998). The relationship between prior
functioning on cognitive and personality dimensions and subject attrition in longitudinal research. Journal of Gerontology, 43, P12-P17.
Cotter, R. B., Burke, J. D., Loeber, R., & Navratil, J. L. (2002). Innovative retention
methods in longitudinal research: A case study of the developmental trends study. Journal of Child and Family Studies, 11, 485-498.
Cuijpers, P. (1998). Psychological outreach programmes for the depressed elderly: A
meta-analysis of effects and dropout. International Journal of Geriatric Psychiatry, 13, 41-48.
*Cutler, S. J. (1975). Transportation and changes in life satisfaction. The Gerontologist,
155-159. Deeg, D. J. H., van Tilburg, T., Smit, J., & de Leeuw, E. (2002). Attrition in the
Longitudinal Aging Study Amsterdam: The effect of differential inclusion in side studies. Journal of Clinical Epidemiology, 55, 319-329.
*Desrosiers, J., Hebert, R., Bravo, G., & Rochette, A. (1998). Comparison of cross-
sectional and longitudinal designs in the study of aging of upper extremity performance. Journal of Gerontology, 53A, B362-B368.
39

*Falvo, N., & Norman, S. (2004). Never too old to learn: The impact of an HIV/AIDS education program on older adults’ knowledge. Clinical Gerontologist, 27, 103-116.
*Fernandez, M. E., Mutran, E. J., Reitzes, D. C., & Sudha, S. (1998). Ethnicity, gender,
and depressive symptoms in older workers. The Gerontologist, 38, 71-79. *Ferraro, F. R. (2003). Psychological resilience in older adults following the 1997 flood.
Clinical Gerontologist, 26, 139-143. *Fine, M. A., & Tangeman, P. J. (1993). Adaptive behavior scale predictive validity with
elderly male veterans. Clinical Gerontologist, 14, 27-31. Forsell, Y. (2000). Death wishes in the very elderly: Data from a 3-year follow up study.
Acta Psychiatr Scand, 102, 135-138. *Futterman, A., Gilewski, M. J., & Peterson, J. (1991). The effects of late-life spousal
bereavement over a 30-month interval. Psychology and Aging, 6, 434-441. *Gall, T. L., Evans, D. R., & Howard, J. (1997). The retirement adjustment process:
Changes in the well-being of male retirees across time. Journal of Gerontology, 52B, P110-P117.
Gliner, J. F. & Morgan, G. A. (2000). Research methods in applied settings: An
integrated approach to design and analysis. Mahwah, NJ: Lawrence Erlbaum Associates, Publications.
*Gill, T. M., Williams, C. S., Richardson, E. D., & Tinetti, M. E. (1996). Impairments in
physical performance and cognitive status as predisposing factors for functional dependence among nondisabled older persons. Journal of Gerontology, 51A, M283-M288.
*Gold, D. P., & Arbuckle, T. Y. (1995). A longitudinal study of off-target verbosity.
Journal of Gerontology, 50B, P307-P315. Goudy, W. J. (1985). Sample attrition and multivariate analysis in the retirement history
study. Journal of Gerontology, 40, 358-367. *Graney, M. J. (1975). Happiness and social participation in aging. Journal of
Gerontology, 30, 701-706. Hall, Z. (2004). Reducing attrition in panel studies in developing countries. International
Journal of Epidemiology, 33, 493-498. Hedges, L. V. (1981). Distribution theory for Glass’s estimator of effect size and related
estimators. Journal of Educational Statistics, 6, 107-128.
40
*Holahan, C. K., & Holahan, C. J. (1987). Self-efficacy, social support, and depression in aging: A longitudinal analysis. Journal of Gerontology, 42, 65-68.
*Hultsch, D. F., Hertzog, C., Small, B. J., & Dixon, R. A. (1999). Use it or lose it:
Engaged lifestyle as a buffer of cognitive decline in aging? Psychology and Aging, 14, 245-263.
*Hultsch, D. F., Hertzog, C., Small, B. J., McDonald-Miszczak, L., & Dixon, R. A.
(1992). Short-term longitudinal change in cognitive performance in later life. Psychology and Aging, 7, 571-584.
*Hyduk, C. A. (1996). The dynamic relationship between social support and health in
older adults: Assessment implications. Journal of Gerontological Social Work, 27, 149-165.
*Janevic, M. R., Janz, N. K., Dodge, J. A., Wang, Y., Lin, X., & Clark, N. M. (2004).
Longitudinal effects of social support on the health and functioning of older women with heart disease. International Journal of Aging and Human Development, 59, 153-175.
*Lee, J. D., & Markides, K. S. (1990). Activity and mortality among aged persons over
an eight-year period. Journal of Gerontology, 45, S39-S42. *Krause, N. (1987). Chronic strain, locus of control, and distress in older adults.
Psychology and Aging, 2, 375-382. *Krause, N. (1990). Perceived health problems, formal/informal support, and life
satisfaction among older adults. Journal of Gerontology, 45, S193-S205. Krause, N. (1998). Neighborhood deterioration, religious coping, and changes in health
during late life. The Gerontologist, 38, 653-664. Lipsey, M. W*Lachman, M. E. (1983). Perceptions of intellectual aging: Antecedent or
consequence of intellectual functioning? Developmental Psychology, 19, 482-498.
*Liu, X., Liang, J., Muramatsu, N., & Sugisawa, H. (1995). Transitions in functional
status and active life expectancy among older people in Japan. Journal of Gerontology, 50B, S383-S394.
*Lachman, M. E., & Leff, R. (1989). Perceived control and intellectual functioning in the
elderly: A 5-year longitudinal study. Developmental Psychology, 25, 722-728.
*McAvay, G. J., Seeman, T. E., & Rodin, J. (1996). A longitudinal study of change in domain-specific self-efficacy among older adults. Journal of Gerontology, 51B, P243-P253.
41

Markides, K. S., Dickson, H. D., & Pappas, C. (1982). Characteristics of dropouts in
longitudinal research on aging: A study of Mexican Americans and Anglos. Experimental Aging Research, 8, 163-167.
*Markides, K. S., Levin, J. S., & Ray, L. A. (1987). Religion, aging, and life satisfaction:
An eight-year, three-wave longitudinal study. The Gerontologist, 27, 660-664.
Matthews, F. E., Chatfield, M., Freeman, C., McCracken, C., & Brayne, C. (2004).
Attrition and bias in the MRC cognitive function and ageing study: An epidemiological investigation. BMC Public Heath,4. Available online at: http://www.biomedicalcentral.com/1471-2458/4/12.
*McCulloch, B. J. (1991). A longitudinal investigation of the factor structure of
subjective well-being: The case of the Philadelphia geriatric center morale scale. Journal of Gerontology, 46, P251-P258.
*Meeks, S., Murrell, S. A., & Mehl, R. C. (2000). Longitudinal relationships between
depressive symptoms and health in normal older and middle-aged adults. Psychology and Aging, 15, 100-109.
*Mossey, J. M., Knott, K., & Craik, R. (1990). The effects of persistent depressive
symptoms on hip fracture recovery. Journal of Gerontology, 45, M163-M168.
National Institute on Aging (2005). All current longitudinal studies. Available at:
http://www.nia.nih.gov/ResearchInformation/ScientificResources/LongitudinalStudiesAllCurrent.htm
*Newsom, J. T., Nishishiba, M., Morgan, D. L., & Rook, K. S. (2003). The relative
importance of three domains of positive and negative social exchanges: A longitudinal model with comparable measures. Psychology and Aging, 18, 746-754.
Norris, F. H. (1985). Characteristics of older nonrespondents over five waves of a panel
study. Journal of Gerontology, 40, 627-636. Norris, F. H. (1987). Effects of attrition on relationships between variables in surveys of
older adults. Journal of Gerontology, 42, 597-605. *Nuttman-Shwartz, O. (2004). Like a high wave: Adjustment to retirement. The
Gerontologist, 44, 229-236.
42
Oei, T. P. S., & Kazmierczak, T. (1997). Factors associated with dropout in a group cognitive behaviour therapy for mood disorders. Behavioral Research Therapy, 35, 1025-1030.
*Ostir, G. V., Ottenbacher, K. J., & Markides, K. S. (2004). Onset of frailty in older
adults and the protective role of positive affect. Psychology and Aging, 19, 402-408.
*Parmelee, P. A., Katz, I. R., & Lawton, M. P. (1992). Incidence of depression in long-
term care settings. Journal of Gerontology, 47, M189-M196. *Parmelee, P. A., Kleban, M. H., Lawton, M. P., & Katz, I. R. (1991). Depression and
cognitive change among institutionalized aged. Psychology and Aging, 6, 504-511.
Powers, E. A. & Bultena, G. L. (1972). Characteristics of deceased dropouts in
longitudinal research. Journal of Gerontology, 27, 530-535. Rabbitt, P., Watson, P., Donlan, C., Bent, N., & Mcinnis, L. (1994). Subject attrition in a
longitudinal study of cognitive performance in community-based elderly people. In Vellas, B. J., Albarede, J. L., & Garry, P. J. (Eds.), Facts and research in gerontology 1994: Epidemiology and aging (pp. 29-34). NY: Springer Publishing Co. Inc.
Raudenbush, S. W. (1994). Random effects models: In H. Cooper & L. V. Hedges (Eds.),
The handbook of research synthesis (pp. 301-321). New York: Russell Save Foundation.
Reigel, Reigel, & Meyer (1968). The prediction of retest resisters in Research on Aging.
Journal of Gerontology, 23, 370-374. *Reinhardt, J. P., Boerner, K., & Benn, D. (2003). Predicting individual change in
support over time among chronically impaired older adults. Psychology and Aging, 18, 770-779.
*Richardson, V., & Kilty, K. M. (1991). Adjustment to retirement: Continuity vs.
discontinuity. International Journal of Aging and Human Development, 33, 151-169.
*Roberson, T., & Lichtenberg, P. A. (2003). Depression, social support, and functional
abilities: Longitudinal findings. Clinical Gerontologist, 26, 55-67. Rose, C. L., Bosse, R., & Szretter, W. T. (1976). The relationship of scientific objectives
to population selection and attrition in longitudinal studies: The case of the normative aging study. The Gerontologist, 16, 508-516.
43
* Russell, D. W., & Cutrona, C. E. (1991). Social support, stress, and depressive symptoms among the elderly: Test of a process model. Psychology and Aging, 6, 190-201.
Schaie, K. W. (1996). Intellectual development in adulthood: The Seattle longitudinal
study. NY: Cambridge University Press. Schaie, K. W. (1997). Advances in longitudinal Research methodology [On-Line].
Retrieved from the World Wide Web 11/28/00. Available: http://www.cas.flinder.edu.au/iag/proceeding/proc0028.htm
Schaie, K. W., Labouvie, G. V., & Barrett, T. J. (1973). Selective attrition effects in a
fourteen-year study of adult Intelligence. Journal of Gerontology, 28, 328-334.
Schmidt, J. A., Gruman, C., King, M. B., & Wolfson, L. I. (2000). Attrition in an exercise
intervention: A comparison of early and later dropouts. Journal of the American Geriatrics Society, 48, 952-960.
*Schofield, M. J., & Mishra, G. D. (2003). Validity of self-report screening scale for
elder abuse: Women’s health. The Gerontologist, 43, 110-120. Seattle Longitudinal Study (2005). Available online at:
http://geron.psu.edu/sls/index.html Sharma, S. K., Tobin, J. D., & Brant, L. J. (1989). Attrition in the Baltimore longitudinal
study of aging during the first twenty years. In Lawton, M. P. & Herzog, A. R. (Eds.), Hendricks, J. A. (Series Ed.), Special research methods for gerontology. Amityville, NY: Baywood Publishing Company, Inc.
Siegler, I. C., & Botwinick, J. (1979). A long-term longitudinal study of intellectual
ability of older adults: The matter of selective subject attrition. Journal of Gerontology, 34, 242-245.
*Smith, G. E., Petersen, R. C., Ivnik, R. J., Malec, James F., & Tangalos, E. G. (1996).
Subjective memory complaints, psychological distress, and longitudinal change in objective memory performance. Psychology and Aging, 11, 272-279.
Strieb, G. F. (1966). Participants and drop-outs in a longitudinal study. Journal of
Gerontology, 21, 200-209. *Taylor, J. L, Miller, T. P., & Tinklenberg, J. R. (1992). Correlates of memory decline: A
4-year longitudinal study of older adults with memory complaints. Psychology and Aging, 7, 185-193.
44
Tennstedt, S. L., Dettling, U., & McKinlay, J. B. (1992). Refusal rates in a longitudinal study of older people: Implications for field methods. Journal of Gerontology, 47, S313-S318.
*Tesch, S. A., Nehrke, M. F., Whitbourne, S. K. (1989). Social relationships, psychosocial adaptation, and intrainstitutional relocation of elderly men. The Gerontologist, 29, 517-523.
*Troll, L. E., & Skaff, M. M. (1997). Perceived continuity of self in very old age.
Psychology and Aging, 12, 162-169. *van Baarsen, B., van Duijn, M. A. J., Smit, J. H., Snijders, T. A. B., & Knipscheer, K. P.
M. (2001-2002). Patterns of adjustment to partner loss in old age: The widowhood adaptation longitudinal study. Omega, 44, 5-36.
van Beijsterveidt, C. E. M., van Boxtel, M. P. J., Bosma, H., Houx, P. J., Buntinx, F., &
Jolles, J. (2002). Predictors of attrition in a longitudinal aging study: The Maastricht Aging Study (MAAS). Journal of Clinical Epidemiology, 55, 216-224.
van Grouenou, B., Deeg, D. J., Penninx, B. W. (2003). Income differentials in functional
disability in old age: Relative risks of onset, recovery, decline, attrition, and mortality. Aging Clinical and Experimental Research, 15, 174-183.
Weiss, D. J. (1999). An analysis of variance test for random attrition. Journal of Social
Behavior and Personality, 14, 433-439. *Williamson, G. M., & Schulz, R. (1995). Activity Restriction mediates the association
between pain and depressed affect: A study of younger and older adult cancer patients. Psychology and Aging, 10, 369-378.
Wilson, A. J. E., & Webber, I. L. (1976). Attrition in a longitudinal study of an aged
population. Experimental Aging Research, 2, 367-387. *Zarit, S. H., Griffiths, P. C., & Berg, S. (2004). Pain perceptions of the oldest old: A
longitudinal study. The Gerontologist, 44, 459-468.
45