atomic spectroscopy newsletter - march/april...
TRANSCRIPT

Issues also available
electronically.
(see inside front cover)
ASPND7 24(2) 37–78 (2003)ISSN 0195-5373
AtomicSpectroscopy
March/April 2003 Volume 24, No. 2
In This Issue:
Analyzing Semiconductor Samples With the ELAN DRC II ICP Mass Spectrometer …... 37
Merck Electronic Chemicals: Proud Owners of 10 ELANs ………………………………… 40
Analysis of Silicon Wafers Using the ELAN DRC ICP-MSArthur F. Porche, Yoko Kishi, and Ruth E. Wolf ………………..……………....……… 42
Effect of Plasma Parameters on the Analysis of Semiconductor ProcessYoko Kishi and Katsu Kawabata .....………………………........………………………… 46
Reaching SEMI Grade 5 Purity Levels in Hydrogen Peroxide With Dynamic Reaction Cell ICP-MS TechnologyJ-M. Collard, Katsu Kawabata, Yoko Kishi, and R. Thomas……………………….…… 49
The Benefits of Dynamic Reaction Cell ICP-MS Technology to Determine Ultra Trace Metal Contamination Levels in High Purity Phosphoric and Sulfuric AcidKatsu Kawabata, Yoko Kishi, and Robert Thomas…………………….................…… 57
DRC-ICP-MS Analysis of Various Chemicals Used in the Semiconductor IndustryKatsu Kawabata and Yoko Kishi ................................................................................. 66
How Low Can Impurities in Pure Water be Analyzed by ICP-MS?Katsu Kawabata and Yoko Kishi ................................................................................. 73
ICP-MS
DRC TECHNOLOGY
for the
SEMICONDUCTOR
INDUSTRY

AutoLens™
Optimizes voltagefor each element
PlasmaLok®
Easy optimization and extended cone life
Dynamic Bandpass TuningEfficiently screens out interferenceswhile maximizing analytetransmission
Axial Field™TechnologyOptimizes performance andspeed in all matrices
Platinum Quick-ChangeInterface ConesEasy maintenance,maximum uptime
SimulScan™
Simultaneous dual-stagedetector with 9 orders of dynamic range
High-SpeedQuadrupoleFast transient signal analysis
AutoRes™
Custom resolution minimizesspectral interferences andimproves detection limits
All-Quartz SampleIntroductionMinimizes contamination
When your applications extend beyond the capabilitiesof conventional ICP-MS, you need the power of theinnovative ELAN® DRC II. The DRC II combines the power of patented Dynamic Reaction Cell (DRC)technology with performance-enhancing Axial FieldTechnology, providing uncompromised sensitivity andperformance in all matrices for even the toughestapplications. Unlike collision cell, high-resolution, orcold plasma systems, the DRC II completely eliminatespolyatomic interferences providing ultratrace-leveldetection limits.
The DRC II uses chemical resolution to eliminateplasma-based polyatomic species before they reach thequadrupole mass spectrometer. This ion-moleculechemistry uses a gas to “chemically scrub” polyatomicor isobaric species from the ion beam before they enterthe analyzer, resulting in improved detection limits forelements such as Fe, Ca, K, Mg, As, Se, Cr, and V.
Unlike more simplistic collision cells, patented DRCtechnology not only reduces the primary interference;it eliminates sequential side reactions that create newinterferences. Unless kept in check by DRC technology,these uncontrolled reactions increase spectral complexity and create unexpected interferences.
Dynamic Reaction Cell™ (DRC™) with Axial Field Technologyprovides superior interference reduction and performance for all applications.
Eliminates interferences COMPLETELY
37
Analyzing Semiconductor Samples With the ELAN DRC II ICP Mass Spectrometer
Atomic SpectroscopyVol. 24(2), March/April 2003
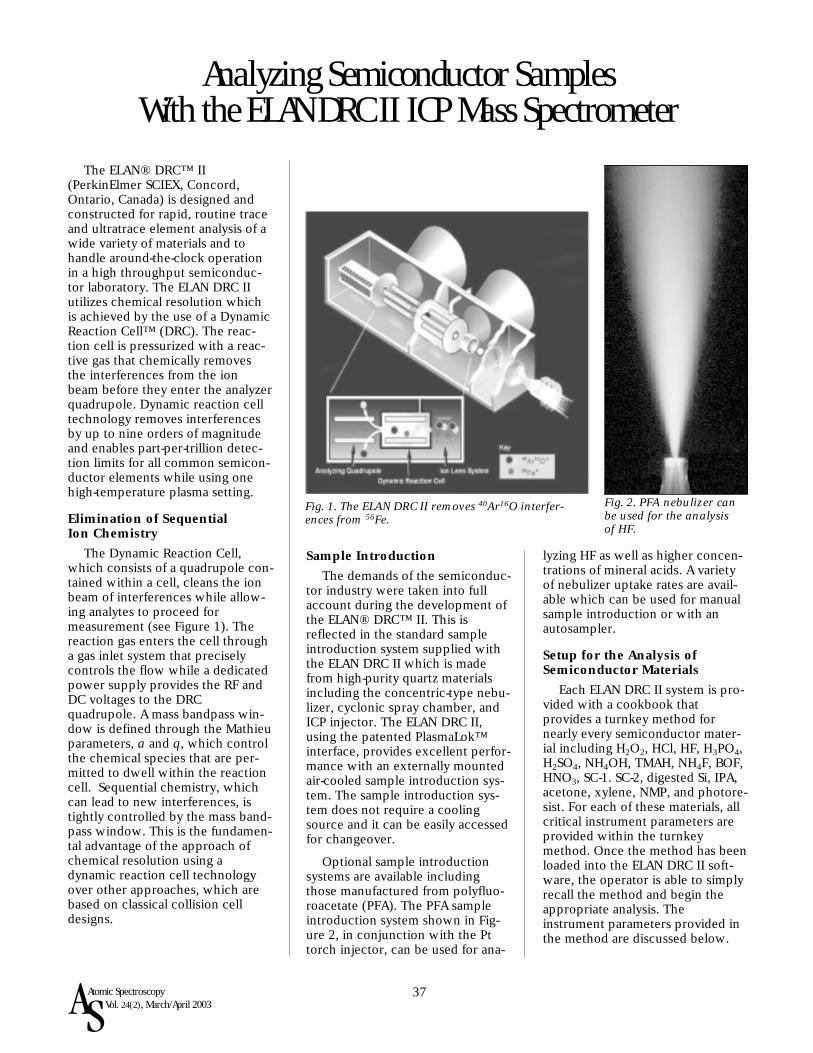
The ELAN® DRC™ II(PerkinElmer SCIEX, Concord,Ontario, Canada) is designed andconstructed for rapid, routine traceand ultratrace element analysis of awide variety of materials and tohandle around-the-clock operationin a high throughput semiconduc-tor laboratory. The ELAN DRC IIutilizes chemical resolution whichis achieved by the use of a DynamicReaction Cell™ (DRC). The reac-tion cell is pressurized with a reac-tive gas that chemically removesthe interferences from the ionbeam before they enter the analyzerquadrupole. Dynamic reaction celltechnology removes interferencesby up to nine orders of magnitudeand enables part-per-trillion detec-tion limits for all common semicon-ductor elements while using onehigh-temperature plasma setting.
Elimination of Sequential Ion Chemistry
The Dynamic Reaction Cell,which consists of a quadrupole con-tained within a cell, cleans the ionbeam of interferences while allow-ing analytes to proceed formeasurement (see Figure 1). Thereaction gas enters the cell througha gas inlet system that preciselycontrols the flow while a dedicatedpower supply provides the RF andDC voltages to the DRCquadrupole. A mass bandpass win-dow is defined through the Mathieuparameters, a and q, which controlthe chemical species that are per-mitted to dwell within the reactioncell. Sequential chemistry, whichcan lead to new interferences, istightly controlled by the mass band-pass window. This is the fundamen-tal advantage of the approach ofchemical resolution using adynamic reaction cell technologyover other approaches, which arebased on classical collision celldesigns.
Sample Introduction
The demands of the semiconduc-tor industry were taken into fullaccount during the development ofthe ELAN® DRC™ II. This isreflected in the standard sampleintroduction system supplied withthe ELAN DRC II which is madefrom high-purity quartz materialsincluding the concentric-type nebu-lizer, cyclonic spray chamber, andICP injector. The ELAN DRC II,using the patented PlasmaLok™interface, provides excellent perfor-mance with an externally mountedair-cooled sample introduction sys-tem. The sample introduction sys-tem does not require a coolingsource and it can be easily accessedfor changeover.
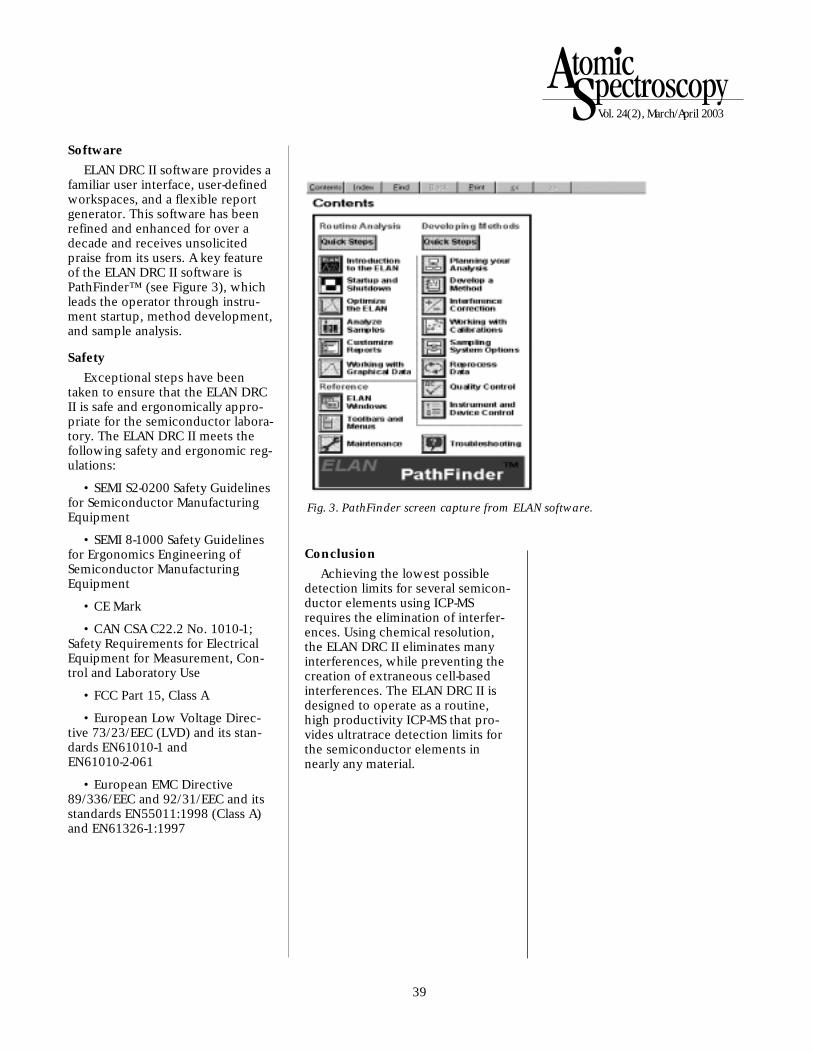
Optional sample introductionsystems are available includingthose manufactured from polyfluo-roacetate (PFA). The PFA sampleintroduction system shown in Fig-ure 2, in conjunction with the Pttorch injector, can be used for ana-
lyzing HF as well as higher concen-trations of mineral acids. A varietyof nebulizer uptake rates are avail-able which can be used for manualsample introduction or with anautosampler.
Setup for the Analysis of Semiconductor Materials
Each ELAN DRC II system is pro-vided with a cookbook thatprovides a turnkey method fornearly every semiconductor mater-ial including H2O2, HCl, HF, H3PO4,H2SO4, NH4OH, TMAH, NH4F, BOF,HNO3, SC-1. SC-2, digested Si, IPA,acetone, xylene, NMP, and photore-sist. For each of these materials, allcritical instrument parameters areprovided within the turnkeymethod. Once the method has beenloaded into the ELAN DRC II soft-ware, the operator is able to simplyrecall the method and begin theappropriate analysis. Theinstrument parameters provided inthe method are discussed below.
Fig. 1. The ELAN DRC II removes 40Ar16O interfer-ences from 56Fe.
Fig. 2. PFA nebulizer canbe used for the analysisof HF.

38
Setting the Bandpass Window
The strength of the DRC technol-ogy lies in its ability to use rejectionparameters as the means of control-ling interferences. As it is stated earlier, this elimination of interfer-ences is controlled through the set-ting of the mass bandpass windowwhich is controlled through theMatthieu parameters a and q. Theappropriate a and q values, identi-fied as rejection parameter a (RPa)and rejection parameter q (RPq),for each element to be determinedare contained in the semiconductorcookbook.
Setting Reaction Gas Flows
Nearly all methods used for theanalysis of semiconductor materialsuse ammonia as the only reactiongas. The flow of the gas is undercomputer control and is containedwithin the methods provided in thecookbook. The reaction cell gasflows provided in the method arethe result of extensive testing thathas taken place in our semiconduc-tor laboratory located within ourmanufacturing facility. Like thebandpass window, the reaction cellgas flows need not be modifiedonce they have been entered into amethod. So that the ELAN DRC IIcan analyze samples as rapidly aspossible, elements determinedunder the same reaction cell gasflow are automatically grouped anddetermined together.
A Semiconductor Method
Using a turnkey method for theanalysis of a semiconductor mater-ial is extremely easy. The followingtwo tables contain the completemethod for the determination of 23 elements in ultra pure water(UPW). Table I shows the plasmaconditions, sample uptake rate, anddata acquisition parameters whichremain the same for all elements tobe determined. Table II lists, foreach element, an RPq value and thereaction gas flows. Note: For theelements determined in this exam-ple, RPa is always set at 0.
With the use of the turnkeymethods provided with the ELANDRC II, the instrument can be readyto analyze samples almost immedi-ately following installation. Once aturnkey method is open, the opera-tor need only perform a daily per-formance check and then begin theanalysis of their samples.
TABLE IGeneral Operating Conditions
RF power 1600 W
Plasma gas 18 L/min
Auxiliary gas 2 L/min
Nebulizer gas 1.1 L/min
Integration time 1 sec/mass
Repetitions 5
TABLE IIReaction Cell Settings*
Element m/z RPq Cell Gas(mL/min)
B 11 0.25 0
Na 23 0.25 0
Mg 24 0.25 0
Al 27 0.5 0.6
K 39 0.5 0.6
Ca 40 0.5 1Ti 48 0.5 0.3
V 51 0.5 0.3
Cr 52 0.5 0.6
Mn 55 0.5 0.6
Fe 56 0.5 0.6
Ni 60 0.5 0.3
Co 59 0.5 0.3
Cu 63 0.5 0.3
Zn 64 0.5 0.3
Ga 69 0.5 0.6
As 75 0.25 0
Mo 98 0.25 0
Sn 120 0.25 0
Sb 121 0.25 0
W 184 0.25 0
Au 197 0.25 0
Pb 208 0.5 0.6
*Numbers in bold letters indicate elements determined using the DRCmode.
39
Vol. 24(2), March/April 2003
Software
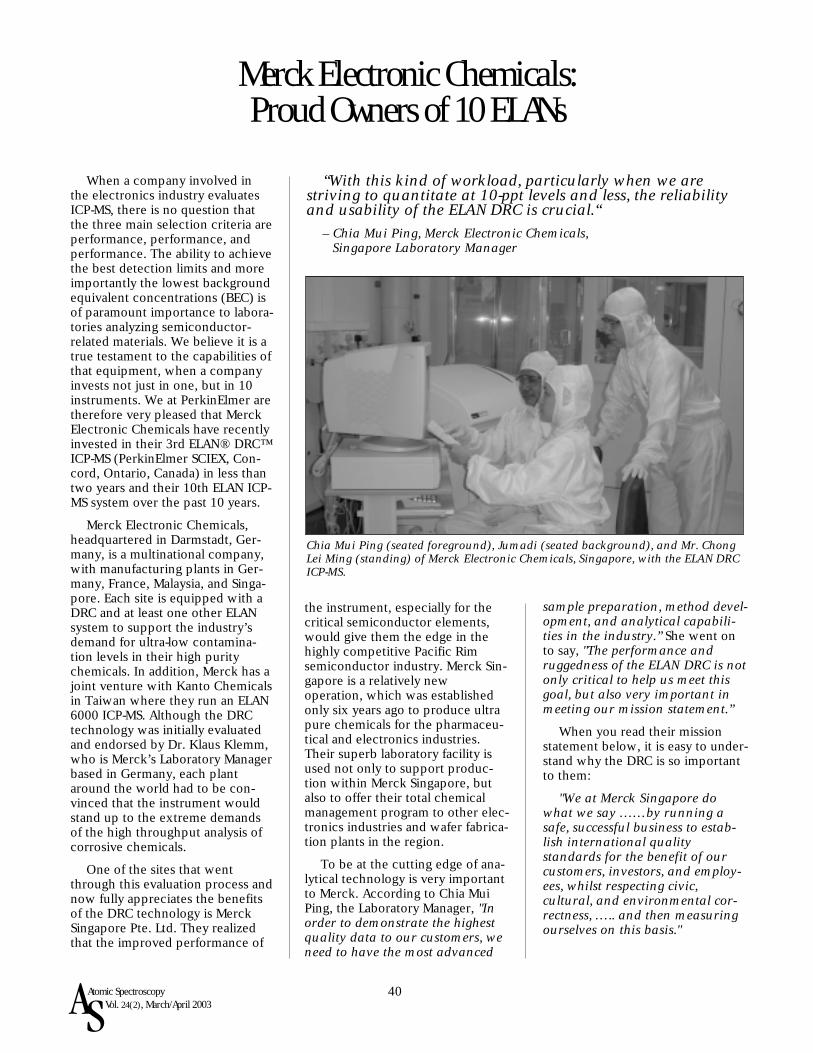
ELAN DRC II software provides afamiliar user interface, user-definedworkspaces, and a flexible reportgenerator. This software has beenrefined and enhanced for over adecade and receives unsolicitedpraise from its users. A key featureof the ELAN DRC II software isPathFinder™ (see Figure 3), whichleads the operator through instru-ment startup, method development,and sample analysis.
Safety
Exceptional steps have beentaken to ensure that the ELAN DRCII is safe and ergonomically appro-priate for the semiconductor labora-tory. The ELAN DRC II meets thefollowing safety and ergonomic reg-ulations:
• SEMI S2-0200 Safety Guidelinesfor Semiconductor ManufacturingEquipment
• SEMI 8-1000 Safety Guidelinesfor Ergonomics Engineering ofSemiconductor ManufacturingEquipment
• CE Mark
• CAN CSA C22.2 No. 1010-1;Safety Requirements for ElectricalEquipment for Measurement, Con-trol and Laboratory Use
• FCC Part 15, Class A
• European Low Voltage Direc-tive 73/23/EEC (LVD) and its stan-dards EN61010-1 andEN61010-2-061
• European EMC Directive89/336/EEC and 92/31/EEC and itsstandards EN55011:1998 (Class A)and EN61326-1:1997
Conclusion
Achieving the lowest possibledetection limits for several semicon-ductor elements using ICP-MSrequires the elimination of interfer-ences. Using chemical resolution,the ELAN DRC II eliminates manyinterferences, while preventing thecreation of extraneous cell-basedinterferences. The ELAN DRC II isdesigned to operate as a routine,high productivity ICP-MS that pro-vides ultratrace detection limits forthe semiconductor elements innearly any material.
Fig. 3. PathFinder screen capture from ELAN software.
40Atomic SpectroscopyVol. 24(2), March/April 2003
Merck Electronic Chemicals:Proud Owners of 10 ELANs
When a company involved inthe electronics industry evaluatesICP-MS, there is no question thatthe three main selection criteria areperformance, performance, andperformance. The ability to achievethe best detection limits and moreimportantly the lowest backgroundequivalent concentrations (BEC) isof paramount importance to labora-tories analyzing semiconductor-related materials. We believe it is atrue testament to the capabilities ofthat equipment, when a companyinvests not just in one, but in 10instruments. We at PerkinElmer aretherefore very pleased that MerckElectronic Chemicals have recentlyinvested in their 3rd ELAN® DRC™ICP-MS (PerkinElmer SCIEX, Con-cord, Ontario, Canada) in less thantwo years and their 10th ELAN ICP-MS system over the past 10 years.
Merck Electronic Chemicals,headquartered in Darmstadt, Ger-many, is a multinational company,with manufacturing plants in Ger-many, France, Malaysia, and Singa-pore. Each site is equipped with aDRC and at least one other ELANsystem to support the industry’sdemand for ultra-low contamina-tion levels in their high puritychemicals. In addition, Merck has ajoint venture with Kanto Chemicalsin Taiwan where they run an ELAN6000 ICP-MS. Although the DRCtechnology was initially evaluatedand endorsed by Dr. Klaus Klemm,who is Merck’s Laboratory Managerbased in Germany, each plantaround the world had to be con-vinced that the instrument wouldstand up to the extreme demandsof the high throughput analysis ofcorrosive chemicals.
One of the sites that wentthrough this evaluation process andnow fully appreciates the benefitsof the DRC technology is MerckSingapore Pte. Ltd. They realizedthat the improved performance of
the instrument, especially for thecritical semiconductor elements,would give them the edge in thehighly competitive Pacific Rimsemiconductor industry. Merck Sin-gapore is a relatively newoperation, which was establishedonly six years ago to produce ultrapure chemicals for the pharmaceu-tical and electronics industries.Their superb laboratory facility isused not only to support produc-tion within Merck Singapore, butalso to offer their total chemicalmanagement program to other elec-tronics industries and wafer fabrica-tion plants in the region.
To be at the cutting edge of ana-lytical technology is very importantto Merck. According to Chia MuiPing, the Laboratory Manager, "Inorder to demonstrate the highestquality data to our customers, weneed to have the most advanced
sample preparation, method devel-opment, and analytical capabili-ties in the industry.” She went onto say, "The performance andruggedness of the ELAN DRC is notonly critical to help us meet thisgoal, but also very important inmeeting our mission statement.”
When you read their missionstatement below, it is easy to under-stand why the DRC is so importantto them:
"We at Merck Singapore dowhat we say ……by running asafe, successful business to estab-lish international qualitystandards for the benefit of ourcustomers, investors, and employ-ees, whilst respecting civic,cultural, and environmental cor-rectness, ….. and then measuringourselves on this basis."
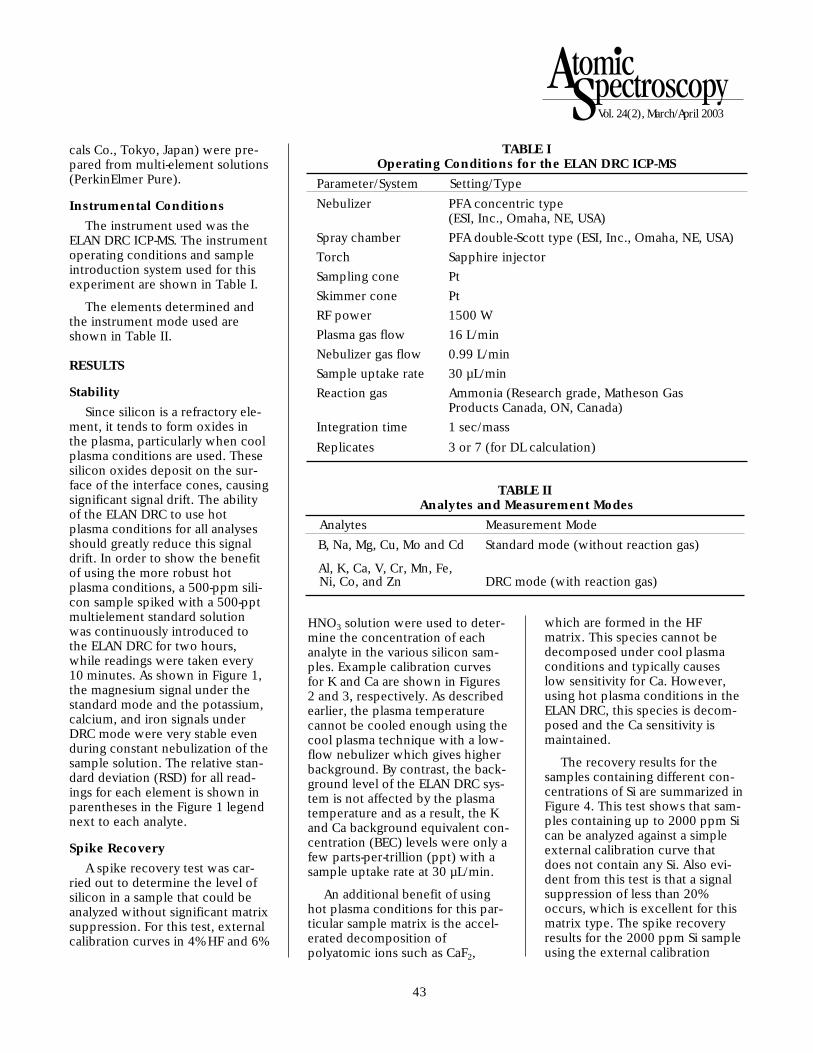
“With this kind of workload, particularly when we arestriving to quantitate at 10-ppt levels and less, the reliabilityand usability of the ELAN DRC is crucial.“
– Chia Mui Ping, Merck Electronic Chemicals, Singapore Laboratory Manager
Chia Mui Ping (seated foreground), Jumadi (seated background), and Mr. ChongLei Ming (standing) of Merck Electronic Chemicals, Singapore, with the ELAN DRCICP-MS.

41
Vol. 24(2), March/April 2003
When Merck Singapore firstopened the laboratory, they utilizeda SIMAA™ 6000 graphite furnaceatomic absorption spectrometer(PerkinElmer Life and AnalyticalSciences, Shelton, CT USA) and anELAN 5000 ICP-MS to analyze theirchemicals. Unfortunately, the sam-ple throughput requirements,detection capability, and samplepreparation issues made them real-ize that this analytical instrumenta-tion setup was hindering theirability to achieve high quality data,especially in a high throughput pro-duction environment. For this rea-son, they invested in an ELAN 6000ICP-MS in 1996. Today, with theELAN 5000 and ELAN DRC on line,they are routinely running 25 sam-ples per day for 32–34 elements persample.
In the words of Mui Ping, "Withthis kind of workload, particularlywhen we are striving to quantitateat 10-ppt levels and less, the relia-bility and usability of the ELANDRC is crucial. Even though webelieve there are some aspects ofthe instrument that could beimproved, we are very happy withits capabilities." She continued, "Itis not only important that the per-formance of the instrument meetsour customers’ requirements, butalso that the service and applica-tion support is available wheneverwe need it. We are very satisfiedwith PerkinElmer’s commitmentto Merck Singapore."
This is a statement the localPerkinElmer office likes to hear;they are well recognized as havingthe highest quality support organi-zation in the region. According toCT Yong, the Inorganic SupportManager for PerkinElmer, "We prideourselves on paying close atten-tion to the needs of our users.Merck is one of our most impor-tant ICP-MS customers, not only inSingapore but also in other partsof the world.” We at PerkinElmerfully appreciate these comments,
because in this global economy, aproblem with an instrument in Sin-gapore can affect a sale on theopposite side of the world.
We believe the reason thatMerck Electronic Chemicals has 10 of our ELANs is a testament tothe worldwide support and com-mitment they receive fromPerkinElmer.
It was Merck’s desire to achievethe next level of purity levels setdown by the SEMI (SemiconductorEquipment and ManufacturingInternational) Standards organiza-tion that would lead them to invest-ing in a DRC. Their standard ELANsystems were struggling with someof the more difficult trace elements,particularly at the Grade 5 level (10ppt in the chemical). Even thoughtheir instruments were comfortablymeeting current specifications, theywere not allowing them to reachdetection limits down at the 1-pptlevel, using strict SEMI methodol-ogy.
This was summed up by MuiPing who said, "I believe the chemi-cal manufacturers are the onesthat are really pushing contami-nation levels, and even though theindustry may not follow immedi-ately, it is the suppliers of the ana-lytical equipment who have toshow the semiconductor commu-nity that this kind of performanceis possible." She went on to say,"Some of the commercially avail-able technology, like the DRC, hasmet this challenge, while otherapproaches have some way to go."
Her point was well emphasizedby some concerns they had withthe analysis of one of their organicsolvents – iso propyl alcohol (IPA).Using conventional ICP-MS instru-mentation, this sample had to bepretreated to remove the organicmatrix in order to minimize the for-mation of solvent-based polyatomicspectral interferences. The determi-
nation of chromium in particularproved to be problematic, becausean elevated baseline caused by thepolyatomic species 40Ar12C wasinterfering with the major isotopeof chromium at mass 52 - producingvery questionable data. By using theELAN DRC to eliminate the poly-atomic interference, the elementwas successfully determined in theneat solvent, without the need forany sample pretreatment. Using theDRC in this way, as a troubleshoot-ing tool, proved in fact that theoriginal results were correct.
Another element that benefitedfrom the DRC was the determina-tion of arsenic. The ability to runthe instrument using a high-temper-ature plasma allowed for morefavorable ionization conditions,resulting in superior detection capa-bility for arsenic in IPA. Not onlywas it satisfying to Merck that theDRC could determine many of thedifficult elements like Cr and Asdirectly in the neat solvent, but alsothat the exhaustive sample prepara-tion steps could be eliminated.
Merck Electronic Chemicalsshould be very proud of their ana-lytical setup in Singapore. Theyhave proved that by a combinationof the expertise of their laboratorypersonnel, the power of their twoELANs backed up by the localPerkinElmer support organization,they are capable of producing dataof the very highest quality – a factconfirmed by the large number ofcustomers they have in the highlycompetitive Pacific Rim electronicsindustry.

42Atomic SpectroscopyVol. 24(2), March/April 2003
Analysis of Silicon Wafers Using the ELAN DRC ICP-MS*
Arthur F. Porche, Hemlock Semiconductor Corporation, Hemlock, MI USAYoko Kishi, PerkinElmer Life and Analytical Sciences, Concord, ON, Canada L4K 4V8
Ruth E. Wolf, PerkinElmer Life and Analytical Sciences, 710 Bridgeport Avenue, Shelton, CT 06859 USA
such as ArO, ArH, and Ar. Coolplasma has previously been usedto reduce these interferences.However, the amount and type ofsample introduced into the plasmaplays an important role in the per-formance achievable using coolplasma conditions. When low-flownebulizers are used with coolplasma, the low sample flow ratedoes not cool the plasma enoughto eliminate the Ar and ArH inter-ferences, resulting in higher back-grounds for Ca and K, respectively.In addition, cool plasma suffersfrom severe matrix suppressionwith high matrix samples becausethe plasma is insufficient to breakup the sample matrix. As a result,the method of standard additions(MSA) calibration is often used.MSA has many disadvantages, suchas being a time-consuming proce-dure, requiring multiple samplealiquots, and acid blank contamina-tion levels cannot be subtracted.This combination of factors makesthe analysis of high silicon sampleswith cool plasma difficult due tomatrix effects and the inability ofcool plasma to reach the necessarydetection limits.
DRC Technology
The ELAN® DRC™ (DynamicReaction Cell™) ICP-MS(PerkinElmer SCIEX, Concord,Ontario, Canada) does not need touse cool plasma because it uses atechnique called chemical resolu-tion to remove the interferences.By providing a low flow of theproper reaction gas into thepatented Dynamic Reaction Celland using the unique DynamicBandpass Tuning (DBT) feature,interferences can be chemicallyscrubbed out of the ion beambefore they enter the analyzerquadrupole of the mass spectrome-ter. Another advantage of theELAN DRC is that it always oper-
INTRODUCTION
The control of impurity levels insilicon-based semiconductordevices is critical because evenultratrace amounts of impurities,including alkali and alkali-earth ele-ments and transition metals, cancause defects such as voltagebreakdown or high dark current.For quality control purposes, thereare two types of silicon that areroutinely analyzed, bulk silicon andthe surface of silicon wafers. Bulksilicon analysis can be performedby totally digesting the siliconusing a very aggressive acid. Vaporphase decomposition is the mostcommon method used for theanalysis of silicon wafers. For bulksilicon analysis, sample volume isnot an issue; however, small sam-ple volumes are desirable in orderto minimize time-consuming sam-ple preparation. For the analysis ofsilicon wafers, impurities on thewafer surface are collected using avery small amount of aciddeposited on the surface as adroplet. This results in a typicalsample volume of around 200 µL.Both types of silicon analysisrequire the ability to handle smallsample volumes and high siliconmatrices, as well as a hydrofluoric(HF) acid-resistant sample introduc-tion system. Since a typical analysismay take 2–3 minutes per sample,low-flow nebulizers with sampleuptake rates from 40–100 µL/minare routinely used.
Adding to the complexity of theanalysis for silicon impurities is thefact that many of the critical ana-lytes are difficult to analyze byinductively coupled plasma massspectrometry (ICP-MS) becausethey suffer from plasma-based mol-ecular and isobaric interferences
ates under robust hot plasma con-ditions, effectively decomposingthe sample matrix and eliminatingthe need for matrix-matched stan-dards or MSA. The ELAN DRC alsohas the ability to combineelements run in DRC mode (withreaction gas) with elements run instandard mode (without reactiongas) in a single analytical run, elim-inating the need for running thesample twice or under two differ-ent plasma conditions. The resultsobtained by both modes (DRC andstandard) are combined by theinstrument software and printedout in one report. It is also possi-ble to determine an element inboth DRC mode and standardmode in the same run and directlycompare the results. This applica-tion note will show how the ELANDRC eliminates interferences forthe analysis of small volume sili-con-matrix samples using a low-flow nebulizer for the analysis ofimpurities in silicon.
EXPERIMENTAL
Sample Preparation
A bulk silicon sample (HemlockSemiconductor Corporation, Hem-lock, MI, USA) was digested with asmall amount of concentratedhigh-purity HF and HNO3 acids.Several aliquots of the digestedsample were then diluted to obtainsamples containing 100, 500,1000, 2000, and 5000 ppm of Si.The final acid concentration ineach sample was adjusted to con-tain 4% HF and 6% HNO3. Twosamples were prepared for each Siconcentration and one of each pairwas spiked with a standard solu-tion (PerkinElmer Pure™,PerkinElmer Life and AnalyticalSciences, Shelton, CT, USA) inorder to perform a spike recoverytest. Calibration solutions in 4% HFand 6% HNO3 (Tama Pure Chemi-
*Application Note D-6444, published byPerkinElmer Life and Analytical Sciencesin February 2001.
43
Vol. 24(2), March/April 2003
cals Co., Tokyo, Japan) were pre-pared from multi-element solutions(PerkinElmer Pure).
Instrumental Conditions
The instrument used was theELAN DRC ICP-MS. The instrumentoperating conditions and sampleintroduction system used for thisexperiment are shown in Table I.
The elements determined andthe instrument mode used areshown in Table II.
RESULTS
Stability
Since silicon is a refractory ele-ment, it tends to form oxides inthe plasma, particularly when coolplasma conditions are used. Thesesilicon oxides deposit on the sur-face of the interface cones, causingsignificant signal drift. The abilityof the ELAN DRC to use hotplasma conditions for all analysesshould greatly reduce this signaldrift. In order to show the benefitof using the more robust hotplasma conditions, a 500-ppm sili-con sample spiked with a 500-pptmultielement standard solutionwas continuously introduced tothe ELAN DRC for two hours,while readings were taken every10 minutes. As shown in Figure 1,the magnesium signal under thestandard mode and the potassium,calcium, and iron signals underDRC mode were very stable evenduring constant nebulization of thesample solution. The relative stan-dard deviation (RSD) for all read-ings for each element is shown inparentheses in the Figure 1 legendnext to each analyte.
Spike Recovery
A spike recovery test was car-ried out to determine the level ofsilicon in a sample that could beanalyzed without significant matrixsuppression. For this test, externalcalibration curves in 4% HF and 6%
HNO3 solution were used to deter-mine the concentration of eachanalyte in the various silicon sam-ples. Example calibration curvesfor K and Ca are shown in Figures2 and 3, respectively. As describedearlier, the plasma temperaturecannot be cooled enough using thecool plasma technique with a low-flow nebulizer which gives higherbackground. By contrast, the back-ground level of the ELAN DRC sys-tem is not affected by the plasmatemperature and as a result, the Kand Ca background equivalent con-centration (BEC) levels were only afew parts-per-trillion (ppt) with asample uptake rate at 30 µL/min.
An additional benefit of usinghot plasma conditions for this par-ticular sample matrix is the accel-erated decomposition ofpolyatomic ions such as CaF2,
which are formed in the HFmatrix. This species cannot bedecomposed under cool plasmaconditions and typically causeslow sensitivity for Ca. However,using hot plasma conditions in theELAN DRC, this species is decom-posed and the Ca sensitivity ismaintained.
The recovery results for thesamples containing different con-centrations of Si are summarized inFigure 4. This test shows that sam-ples containing up to 2000 ppm Sican be analyzed against a simpleexternal calibration curve thatdoes not contain any Si. Also evi-dent from this test is that a signalsuppression of less than 20%occurs, which is excellent for thismatrix type. The spike recoveryresults for the 2000 ppm Si sampleusing the external calibration
TABLE IOperating Conditions for the ELAN DRC ICP-MS
Parameter/System Setting/Type
Nebulizer PFA concentric type (ESI, Inc., Omaha, NE, USA)
Spray chamber PFA double-Scott type (ESI, Inc., Omaha, NE, USA)
Torch Sapphire injector
Sampling cone Pt
Skimmer cone Pt
RF power 1500 W
Plasma gas flow 16 L/min
Nebulizer gas flow 0.99 L/min
Sample uptake rate 30 µL/min
Reaction gas Ammonia (Research grade, Matheson GasProducts Canada, ON, Canada)
Integration time 1 sec/mass
Replicates 3 or 7 (for DL calculation)
TABLE IIAnalytes and Measurement Modes
Analytes Measurement Mode
B, Na, Mg, Cu, Mo and Cd Standard mode (without reaction gas)
Al, K, Ca, V, Cr, Mn, Fe, Ni, Co, and Zn DRC mode (with reaction gas)

44
curve are shown in Table III. Theseresults indicate that most of theelements show greater than 90%spike recovery, which is excellentfor this matrix, particularly sincethe calibration curve was preparedin an acid-only matrix.
The detection limits obtained in this experiment are also shown in Table III. They were calculatedusing three times the standarddeviation of 4% HF/6% HNO3 blanksolution. Since matrix-matched cal-ibration curves are not required toanalyze Si matrix samples, thedetection limits achieved on theELAN DRC are independent from
the sample matrix and can be deter-mined from the simple acid blank.
CONCLUSION
The data presented in this appli-cation note show that the ELANDRC can effectively eliminate the40Ar interference on 40Ca, the38Ar1H interference on 39K, and the40Ar16O interference on 56Fe, as wellas other common troublesomeinterferences in ICP-MS usingammonia as the reaction gas. Byadjusting the dynamic bandpasstuning parameters to eliminateunwanted reaction by-products,and combining DRC mode and stan-dard mode elements in the same
analytical method, 16 elements canbe determined in the same sampleanalysis, increasing laboratory pro-ductivity.
In addition, spike recovery testsdemonstrate the ability of the ELANDRC to perform these analyses uti-lizing robust hot plasma conditions,significantly reducing matrix sup-pression effects. This means thatthe ELAN DRC can perform siliconanalysis with minimal matrix sup-pression using a simple externalcalibration curve, unlike the previ-ously used cool plasma method,where the sensitivity changes drasti-cally as a function of Si concentra-tion and matrix-matched standards
Fig. 1. Two-hour stability test– continuous introduction of0.5 ppb in 500 ppm Si.
Fig. 4. Summary of spike recovery tests (100–5000 ppm of Si).Fig. 3. 40Ca calibration curve.
Fig. 2. 39K calibration curve..

45
Vol. 24(2), March/April 2003
TABLE IIISpike Recovery Results for 2000 ppm of Si
Unspiked Sample Spiked SampleMeasured Spike Measured Spike
Concentration Amount Concentration Recovery DLElement m/z (ppb) (ppb) (ppb) (%) (ppt)
B 11 1.311 4.85 5.232 80.8 6.9
Na 23 1.055 4.85 5.696 95.7 1.9
Mg 24 0.045 4.85 4.675 95.5 1.1
Al 27 0.846 4.85 5.261 91.0 3.4
K 39 0.264 4.85 5.138 100.5 1.9
Ca 40 0.214 4.85 5.300 104.9 1.11
V 51 0.001 4.85 4.896 100.9 0.84
Cr 52 0.052 4.85 4.869 99.3 2.7
Mn 55 0.001 4.85 4.723 97.4 0.67
Fe 56 0.018 4.85 4.560 93.7 3.6
Ni 58 0.017 4.85 4.265 87.6 3.0
Co 59 0.003 4.85 4.414 90.9 0.72
Cu 65 0.034 4.85 4.351 89.0 5.1
Zn 66 0.048 4.85 4.380 89.3 7.7
Mo 98 0.005 4.85 4.385 90.3 2.0
Cd 114 0.001 4.85 3.938 81.2 0.98
or the method of standard additionsis required. This attribute gives theELAN DRC a tremendous advantagein performing ultratrace level deter-minations over cool plasma analy-sis. Even though the method ofstandard additions is used in coolplasma analysis, impurities in theacid blank used for sample prepara-tion cannot be subtracted from thesample because the sensitivities inthe acid blank and in the silicon-containing sample matrix are quitedifferent. This leads to higher back-
ground equivalent concentration(BEC) levels and inadequate detec-tion limits using cool plasma analy-sis for silicon-containing matrices.Because the ELAN DRC uses robusthot plasma conditions all the time,matrix suppression is kept to a min-imum, eliminating the need formatrix-matched standards. As aresult, acid-only calibration curvescan be used for high Si matrix sam-ples containing up to 2000 ppm Siinstead of the time-consumingmethod of standard additions.
46Atomic SpectroscopyVol. 24(2), March/April 2003
*Application Note D-6482, published byPerkinElmer Life and Analytical Sciencesin March 2001.
Effect of Plasma Parameters on the Analysis of the Semiconductor Process*
Yoko Kishi and Katsu KawabataPerkinElmer Life and Analytical Sciences, 71 Four Valley Drive, Concord, ON, Canada L4K 4V8
INTRODUCTION
The manufacturing processes ofsemiconductor devices require avariety of chemicals which must beultrapure because the presence ofimpurities degrades theperformance of the resultantdevices. Impurity levels in thesechemicals are usually determinedby ICP-MS because of its ability toperform low-level analyses. Unfor-tunately, some important analytes,such as potassium, calcium, andiron are present at parts-per-trillionlevels and suffer from plasma-gen-erated polyatomic interferences. Asa result, determination of these ele-ments is difficult.
For the past several years, coolplasma has been used to reducethese interferences. With this tech-nique, the energy of the plasma islowered, thereby minimizing theformation of species with higherionization potentials, such as Ar,ArH, and ArO. Yet elements withlower ionization potentials (e.g., K,Ca, and Fe) are effectively ionized.In this way, the plasma-based inter-ferences on K, Ca, and Fe arereduced, and these analytes can bedetermined at low levels. However,drawbacks to the cool plasma tech-nique exist, mainly because of thelower plasma energy. Due to thefact that some important analyteshave high ionization potentials(e.g., boron and zinc) or strongbond energies with oxygen (e.g.,titanium and tungsten), the lowerplasma energy of cool plasma pro-hibits their ionization or decompo-sition and, therefore, analysis. As aresult, these analytes must be ana-lyzed separately with a hotter,more energetic plasma.
Another problem with coolplasma is that analyte sensitivity isgreatly affected by sample matrixand acid concentration. To over-come this limitation, the method ofstandard additions, matrix-matchedcalibration standards, or samplepre-treatment must be used forquantitation. Although acid contentand matrix effects can beminimized through dilution, thevery low analyte levels prohibitextensive dilutions.
DRC Technology
The problems associated withcool plasma analysis can be circum-vented by using Dynamic ReactionCell™ (DRC™) ICP-MS. This tech-nique uses a hot, high-energyplasma for all analytes. The DRCeliminates interferences by simulta-neously employing two techniques:chemical resolution and DynamicBandpass Tuning (DBT). Chemicalresolution involves the use of a gaswithin the DRC, which reacts with
the interference to completely elim-inate it. At the same time, DBT isapplied. DBT provides both a highmass cutoff and a low mass cutoffto define a precise mass bandpasswindow inside the DRC. The massbandpass ejects all ions with massesoutside the window, thus prevent-ing the formation of new speciesthat may interfere with theanalytes.
This work explores the effects ofplasma parameters on the analysisof chemicals important to semicon-ductor manufacturing processes.
EXPERIMENTAL
Instrumental Conditions
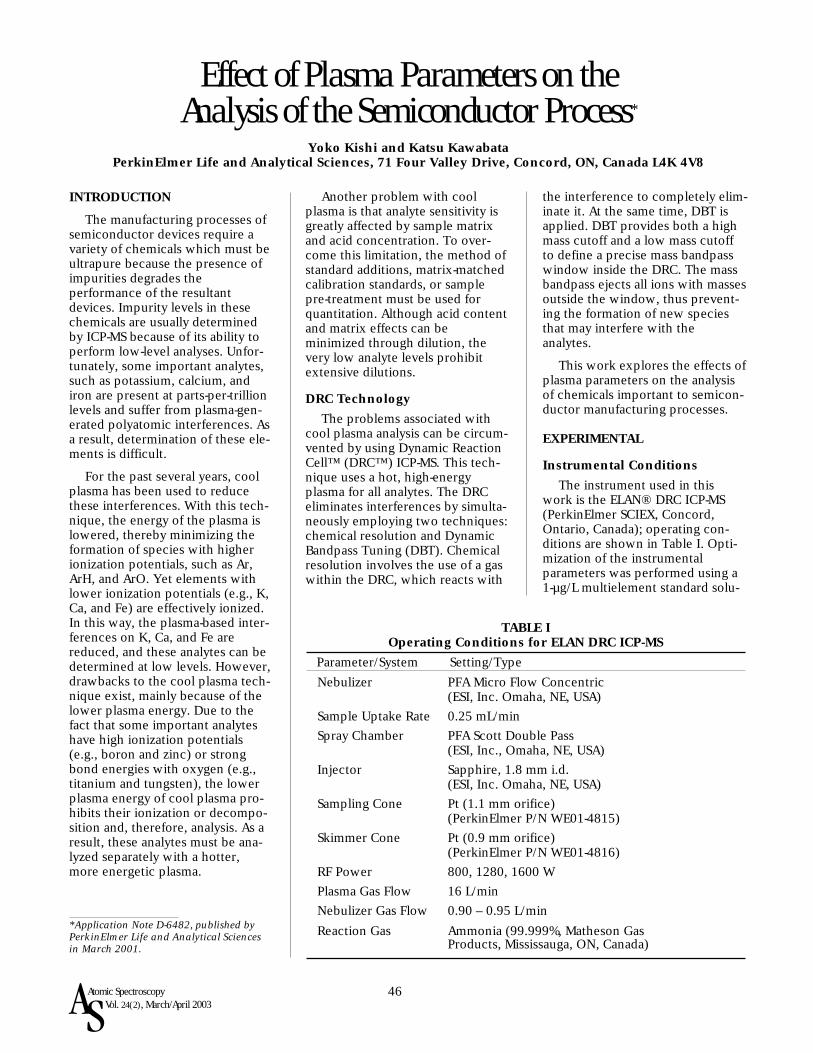
The instrument used in thiswork is the ELAN® DRC ICP-MS(PerkinElmer SCIEX, Concord,Ontario, Canada); operating con-ditions are shown in Table I. Opti-mization of the instrumentalparameters was performed using a1-µg/L multielement standard solu-
TABLE IOperating Conditions for ELAN DRC ICP-MS
Parameter/System Setting/Type
Nebulizer PFA Micro Flow Concentric (ESI, Inc. Omaha, NE, USA)
Sample Uptake Rate 0.25 mL/min
Spray Chamber PFA Scott Double Pass (ESI, Inc., Omaha, NE, USA)
Injector Sapphire, 1.8 mm i.d.(ESI, Inc. Omaha, NE, USA)
Sampling Cone Pt (1.1 mm orifice)(PerkinElmer P/N WE01-4815)
Skimmer Cone Pt (0.9 mm orifice)(PerkinElmer P/N WE01-4816)
RF Power 800, 1280, 1600 W
Plasma Gas Flow 16 L/min
Nebulizer Gas Flow 0.90 – 0.95 L/min
Reaction Gas Ammonia (99.999%, Matheson Gas Products, Mississauga, ON, Canada)

47
Vol. 24(2), March/April 2003
tion in 1% HNO3. Once determined,all instrumental parametersremained constant throughout thiswork, with only the RF powerbeing altered. However, for coolplasma operation, optimization ofthe nebulizer gas flow is usuallyrequired.
The analytes of interest and themode in which they were runappear in Table II. Elements whichdo not suffer from interferenceswere determined without a reac-tion gas in the cell. This mode ofanalysis is known as standard modeand is the same as conventionalICP-MS analysis. Elements whichsuffer from interferences were runin the DRC mode, which refers tothe cell being pressurized with areactive gas, and the application ofa DBT parameter. The gas flow andDBT parameters are determinedusing the ELAN DRC software. Forall analyses, both standard modeand DRC mode elements weredetermined during a singlemeasurement. The software auto-matically switches modes during ananalysis; therefore, samples onlyneed to be run one time, conserv-ing sample and time.
Samples and Sample Preparation
The chemicals used in this workwere 70% HNO3 and 98% H2SO4
(Seastar Chemicals, Sidney, BC,Canada). Dilutions (when used)were made with 18.3 MΩ water(Millipore, Nepean, Ontario,Canada). A 10-mg/L multielementPerkinElmer Pure™ stock solution(PerkinElmer Life and AnalyticalSciences, Shelton, CT USA) wasspiked into each sample to give afinal concentration of 5 µg/L. Rela-tive sensitivity calculations werebased on the sensitivities from awater blank and a 5-µg/L standardsolution in water. Internalstandards were not used in thiswork.
RESULTS
Nitric Acid (HNO3)
For this study, a PFA nebulizerwas used. This nebulizer generatessmall droplets and has a low sampleuptake rate (0.25 mL/min). Thesecharacteristics result in accelerateddroplet decomposition in theplasma.
Figure 1 shows relative sensitivi-ties for potassium in 1% – 30%HNO3 acquired with cool plasma,normal plasma, and hot plasma con-ditions (800 W, 1280 W, and 1600W, respectively). From this data, itis evident that the potassium signalis much more stable with increas-ing acid content under hot plasmaconditions than for the lowerenergy plasma. Figure 2 displaysthe same data for a number of ele-ments. Clearly, with lower plasmaenergy, significant signal suppres-sion occurs as the acid concentra-tion increases. Cool plasma
conditions show a significant sup-pression even in 5% HNO3, whichlimits the acid content of samplesthat can be analyzed using thistechnique. On the other hand, thedata obtained using the ELAN DRCunder hot plasma conditions inDRC mode show that this matrixsuppression is greatly reduced. Infact, Figures 1 and 2 show that anRF power of 1600 W effectivelyeliminates matrix suppression.
These results clearlydemonstrate that the effect ofmatrix concentration can be mini-mized by using a hotter plasma.Furthermore, the data also demon-strate that by using an RF power of1600 W, a single, external calibra-tion curve can be used for thedetermination of various concentra-tions. This eliminates the need formatrix-matched standards and themethod of standard additions,which are required when coolplasma is used. In addition, as a
TABLE IIAnalytes and Measurement Mode
Analytes Measurement Mode
Na, Al, Cu, Zn Standard (without reaction gas)
K, Ca, Fe DRC (with reaction gas)
Fig. 1. Relative sensitivity for potassium in various concentrations of HNO3 atthree different plasma powers (800 W, 1280 W, 1600 W).

48
result of only running a single calibrationcurve, a significant time-savings is accom-plished during the analysis.
Sulfuric Acid (H2SO4)
The same instrumental conditions andtests used for HNO3 were applied toH2SO4. Figure 3 shows the effect of plasmapower on the relative intensities of severalelements in 1% and 5% H2SO4. As seenwith HNO3, the hotter, more energeticplasma proves to be more robust withhigher acid concentrations, although thereis still significant suppression at concentra-tions of 5% and above. However, this workdoes not explore how internal standardsmay reduce this effect.
CONCLUSION
This work clearly shows the advantagesof using a hot, energetic plasma with theELAN DRC for the analysis of various acidmatrices. By using hot plasma conditions,the relative sensitivities of analytes are min-imally affected by acid concentration. Theresult of this observation is that one set ofplasma conditions can be used to analyze avariety of samples of different acid concen-trations. This characteristic is much differ-ent than the cool plasma technique, whichrequires optimization for each differentmatrix composition, even of the samechemical. As a result, the ELAN DRCincreases sample throughput andminimizes troublesome sample preparationprocedures.
The ELAN DRC can routinely determinepotassium, calcium, and iron impurities insemiconductor process chemicals usinghot plasma conditions. These analyses canbe performed since interference removal isaccomplished in the dynamic reaction cellthrough chemical resolution and the appli-cation of dynamic bandpass tuning. Inaddition, once the conditions areestablished for the DRC, they remain con-stant and are transferable from one instru-ment to another, unlike cool plasma whichrequires continuous adjustments forchanges in plasma conditions. The ELANDRC is the only ICP-MS with these uniquecapabilities.
Fig. 3. Relative sensitivities for several elements in various concentrationsof H2SO4 at three RF power conditions: 800 W (cool plasma); 1280 W (normal plasma); 1600 W (hot plasma).
Fig. 2. Relative sensitivities for several elements in various concentrationsof HNO3 at three different plasma powers (800 W, 1280 W, 1600 W).
1280 W
1600 W
800 W
49Atomic SpectroscopyVol. 24(2), March/April 2003
*This article was previously published inthe January 2002 issue of MICRO Maga-zine. Used with permission.
Reaching SEMI Grade 5 Purity Levels in Hydrogen Peroxide With Dynamic Reaction Cell
ICP-MS Technology*
J-M. Collard, Solvay Interox, Brussels, BelgiumKatsu Kawabata and Yoko Kishi
PerkinElmer Life and Analytical Sciences, 71 Four Valley Drive, Concord, ON, Canada L4K 4V8R. Thomas, Scientific Solutions, Gaithersburg, MD USA
INTRODUCTION
The drive for more compact inte-grated circuits and smallerelectronic devices has put challeng-ing demands on the manufacturersof analytical instrumentation usedby the semiconductor industry.Nowhere is this more obvious thanin the analysis of high purity chemi-cals, which are used in variousstages of the manufacturing processof the semiconductor devices. Inorder to reduce costs and increaseyield, chip manufacturers are usingever larger diameter wafers andever narrower line widths in orderto produce more semiconductordevices per wafer. This trend hasresulted in a demand for lower andlower trace element contaminationlevels in the process chemicals.Whereas 10 years ago, the SEMI(Semiconductor Equipment andMaterials International) organiza-tion deemed that 10 ppb purity lev-els were adequate for many of theprocess chemicals, today 100 ppt istypical; and for some of the morecritical materials like hydrogen per-oxide (H2O2), 10 ppt purity levelsare currently being proposed (1).
Traditionally, ICP-MS has beenthe technique of choice for ultra-trace element determinations inhigh purity hydrogen peroxide. Ithas been successfully used to deter-mine trace impurities at the 100-pptlevel (Grade 4) using SEMI method-ology. Unfortunately, it didn’t havethe detection capability for all 21trace metals to reach the next
purity level of 10 ppt (Grade 5) -even with the use of traditionalbackground reduction techniques.However, a novel approach toimprove ICP-MS detection limitsusing Dynamic Reaction Cell™(DRC™) technology has recentlybeen developed. This techniqueutilizes ion-molecule chemistry toeliminate many argon and solvent-based interferences in order toimprove detection limits and back-ground equivalent concentration(BEC**) for the problematic ICP-MSelements (2).
This paper will describe the prin-cipal uses of hydrogen peroxide inthe semiconductor industry andfocus on Solvay Interox, a leadingmanufacturer, who uses DRC tech-nology to help meet the next gener-ation of purity levels. It will go onto describe the dynamic reactioncell in greater detail and explainhow the detection limit and back-ground equivalent concentrationimprovements are achieved. Datawill be presented showing methoddetection limits and spike recover-ies at the Grade 5 level (10 ppt) in31% hydrogen peroxide usingmethodology described in the Bookof SEMI Standards (BOSS) (3).
Uses of Hydrogen Peroxide inthe Semiconductor Industry
Of all the process chemicalsused in the electronics industry,hydrogen peroxide needs to be oneof the cleanest because it is used invast quantities on the bare wafer in
various steps of the semiconductormanufacturing process. An addedincentive for low contaminationlevels is that it is usually mixed withother process chemicals, like sulfu-ric acid (H2SO4), hydrochloric acid(HCl) and ammonium hydroxide(NH4OH), that are used to dissolvemetals from the surface of the sili-con wafer, or build a silicon dioxidelayer on top of the silicon substrate.Because of the extremely high vol-ume use of these chemicalmixtures, there has always been avery stringent purity requirementfor the hydrogen peroxide suppliedto the semiconductor industry. Forthis reason, when SEMI looks tolower contamination levels in orderto improve device yield, hydrogenperoxide is always in the first groupof chemicals to be evaluated. Theyare currently investigating the pos-sibility of lowering the maximumcontamination levels from 100 pptdown to10 ppt for the purest gradeof chemical.
One company that has a vestedinterest in these levels is SolvayInterox, recognized in the field asone of the leading suppliers of highpurity hydrogen peroxide to thesemiconductor industry. SolvayInterox is a subsidiary of SolvayS.A., an international chemical andpharmaceutical group headquar-tered in Brussels, which employsabout 32,000 people in 50 coun-tries worldwide. They are most wellknown for the "Solvay Process" – anestablished inexpensive way of
** Background Equivalent Concentration (BEC) is defined as the apparent concentration forthe background signal based on the sensitivity of the element at a specified mass. The lowerthe BEC value, the more easily a signal generated by an element can be discerned from thebackground Many in the semiconductor industry believe that the BEC is a more accurateindicator of the performance of an ICP-MS system.

50
making soda ash from sodium chlo-ride and calcium carbonate, whichwas named after its inventor, ErnestSolvay who founded the company138 years ago.
Solvay Interox prides itself asbeing a very innovative companyand has always invested in cuttingedge technology in order to be aleading supplier to the electronicsindustry. They were one of the firstcompanies to realize the potentialof ICP-MS to monitor ultra-tracemetal contamination levels in theirhigh purity chemicals and continu-ally strive to push the technique’sanalytical performance.Unfortunately, even with the use ofcool plasma conditions, they soonrealized that there were a numberof critical elements like Fe, Ca, andK that were not achievable at theSEMI Grade 5 purity level
This was the case for manychemical suppliers that utilized ICP-MS. Some of them tried simple pre-concentration methods, whileothers invested in other detectionenhancing techniques likeelectrothermal vaporization (ETV)ICP-MS (4), magnetic sector-highresolution (MS-HR) ICP-MS (5), andmore recently collision cell ICP-MS(6). But even though these alterna-tive approaches offered someimprovement, they still couldn’troutinely get down to the 10 pptcontamination levels for all 21 ele-ments specified for some of themost critical chemicals by the SEMIorganization
However, a new technologycalled dynamic reaction cell (DRC)ICP-MS emerged in 1999. This novelapproach uses a reaction gas to pro-mote ion-molecule chemistry insidea reaction cell in order to eliminateargon and solvent-based polyatomicspectral interferences, and dramati-cally improve detection limits andBECs for many of the problematicICP-MS elements. The first data pre-sented on semiconductor processchemicals using this new technol-
ogy was so encouraging that SolvayInterox decided to investigate itspotential for the analysis of Grade 5hydrogen peroxide. In particular,the results of an early study showedthat for many key elements, particu-larly boron, the background levelson the DRC were significantlylower than traditional ICP-MSinstrumentation. After a lengthyevaluation, they invested in adynamic reaction cell-based instru-ment in the early part of 2001.Before we examine some of thedata generated by Dr. Collard andhis team, let’s take a closer look atthe DRC technology.
DRC Technology: How does it compare?
To get a better perspective ofthe DRC technology, it’s importantto understand the differentapproaches that have been used toreduce polyatomic spectral interfer-ences with a quadrupole ICP-MS.The first major breakthrough camein the mid-1990s with the commer-cialization of the cool or coldplasma approach. This technology,reported in the literature in the late1980s, used a reduced-temperatureplasma to minimize the formation
of the troublesome polyatomic ionsgenerated in the plasma (7). Undernormal plasma conditions (typically1000 W of RF power and 1.0 L/minof nebulizer gas flow), argon ionscombine with matrix and solvent-based ions (hydrogen, oxygen,chlorine, nitrogen, sulfur, carbon,etc.) to generate polyatomic spec-tral interferences that interfere withmany analyte ions. Table I showssome typical examples.
By using cool plasma conditions(500–800 W RF power and 1.5–1.8L/min nebulizer gas flow), the ion-ization conditions in the plasma arechanged and many of these poly-atomic interferences are dramati-cally reduced. The result is thatdetection limits are improved for anumber of the critical semiconduc-tor elements like Fe, K and Ca (8).However, one of the disadvantagesof the cool plasma approach is thatit contains much less energy than anormal, high-temperature plasma.As a result, elemental sensitivity forthe majority of elements is severelyaffected by the sample matrix. Thisis exemplified in Figure 1, whichshows cool plasma sensitivity for aselected group of elements in vary-
TABLE ISome Common Polyatomic Spectral Interferences Seen in ICP-MS
Element/Isotope Matrix/Solvent Interference39K H2O 38ArH40Ca H2O 40Ar44Ca HNO3
14N14N16O48Ti H2O 16O16O16O56Fe H2O 40Ar16O31P H2O 15N16O34S H2O 16O18O75As HCl 40Ar35Cl51V HCl 35Cl16O64Zn H2SO4
32S16O16O24Mg Organics 12C12C52Cr Organics 40Ar12C55Mn HNO3
40Ar15N

51
Vol. 24(2), March/April 2003
ing concentrations of nitric acidand Figure 2, which shows thesame group of elements under hotplasma conditions. It can be seenclearly in Figure 1 that analyte sensi-tivity is dramatically reduced in acool plasma as the acid concentra-tion is increased; whereas underhot plasma conditions, the sensitiv-ity for most of the elements variesonly slightly with increasing acidconcentration. This is the inherentweakness of the cool plasmaapproach – the instrument perfor-mance is very dependent on thesample being analyzed. As a result,cool plasma operation oftenrequires the use of standard addi-tions or matrix matching to achievesatisfactory results. Additionally, to obtain the best performance fora full suite of elements, a multiele-ment analysis often necessitates theuse of two sets of operating condi-tions – one run for the cool plasmaelements and another for normalplasma elements – which can be avery time-consuming and cumber-some process.
The next major developmentwas collision cell technology,which was introduced several yearsago in an effort to reducepolyatomic spectral interferencesand improve the performance ofquadrupole ICP-MS. Collision celltechnology employs a multipole
(typically hexapole or octapole)housed within a cell that is placedprior to the analyzer quadrupole. Ituses a collision gas, which is typi-cally hydrogen or helium, to stimu-late ion-molecule collisions in orderto convert the polyatomic spectralinterference to a non-interferingspecies. The analyte ions thenemerge from the collision cellwhere they are directed towardsthe quadrupole analyzer for normalmass separation. Although this tech-nology initially showed greatpromise, it struggled to reducebackground levels low enough tosignificantly improve detection lim-its for problematic elements like Fe,K, and Ca over the cool/coldplasma approach. Even though itappeared to be beneficial for othertypes of spectral interferences, itwas not viewed as beingsignificantly better than traditionalquadrupole instrumentation forsemiconductor-type samples.
DRC: Principles of Operation
The need for ICP-MS to provideexcellent detection limits for semi-conductor-related elements led tothe development of dynamic reac-tion cell (DRC) technology (10).Similar in appearance to the colli-sion cell, the dynamic reaction cellis a pressurized multipolepositioned prior to the analyzer
quadrupole. However, this is wherethe similarity ends. In DRC technol-ogy, a quadrupole is used instead ofa hexapole or octapole. A reactivegas, such as ammonia is bled intothe cell, which causes ion moleculechemistry to take place. By a num-ber of different mechanisms, whichare predominantly reactions andnot just collisions, the gaseous mol-ecules react with the interferingions to convert them into speciesthat will not interfere with the ana-lyte. The analyte mass then emergesfrom the dynamic reaction cell freeof its interference and is steeredinto the analyzer quadrupole forconventional mass separation. Theadvantages of using a quadrupole inthe reaction cell is that the stabilityregions are much better definedthan with a hexapole or octapoleallowing the precise control of thechemistry that takes place withinthe cell. By careful optimization ofthe quadrupole electrical fields,unwanted reaction by-products,which could potentially lead tonew interferences, are prevented.This cleansing process, which isknown as "chemical resolution,"means that every time an analyteand interfering ions enter thedynamic reaction cell, the bandpassof the quadrupole can be optimizedfor that specific problem and thenchanged on-the-fly for the next ana-lyte.
Fig. 1. Sensitivity of a selected group of elements in differentHNO3 concentrations - using cool plasma conditions (RF power: 800 W, nebulizer gas: 1.5 L/min).
Fig. 2. Sensitivity of a selected group of elements in differentHNO3 concentrations - using hot plasma conditions (RF power: 1600 W, nebulizer gas: 1 L/min).
52
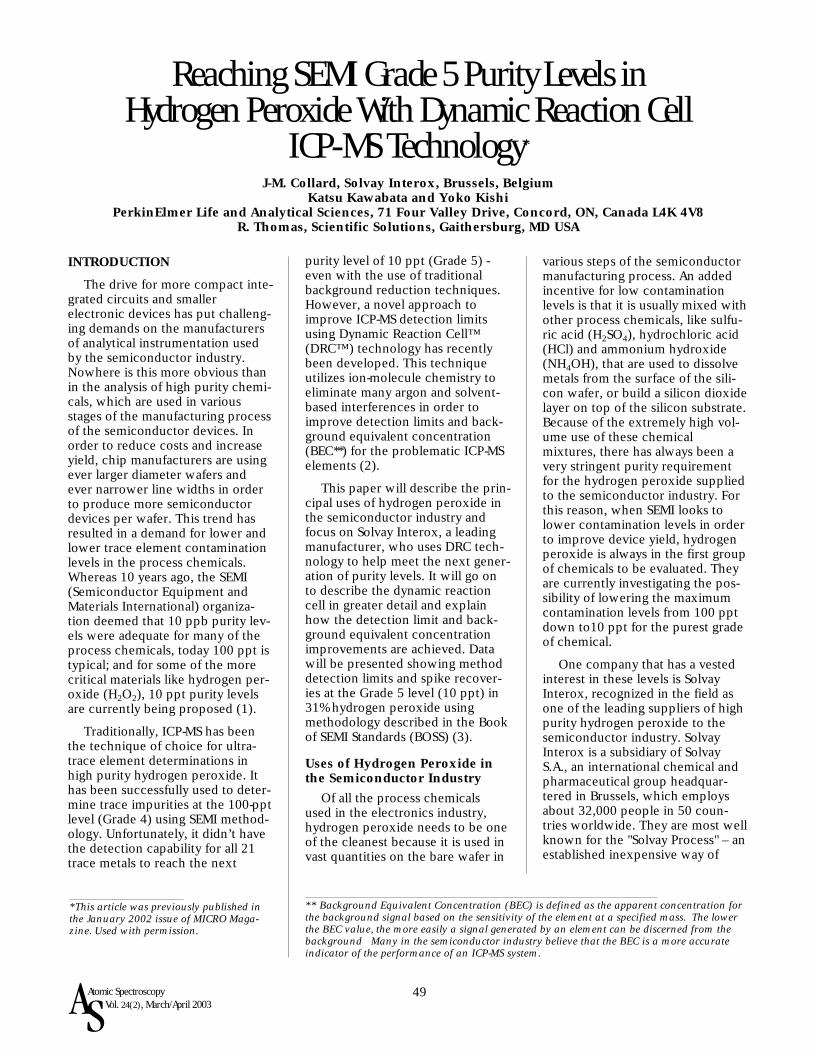
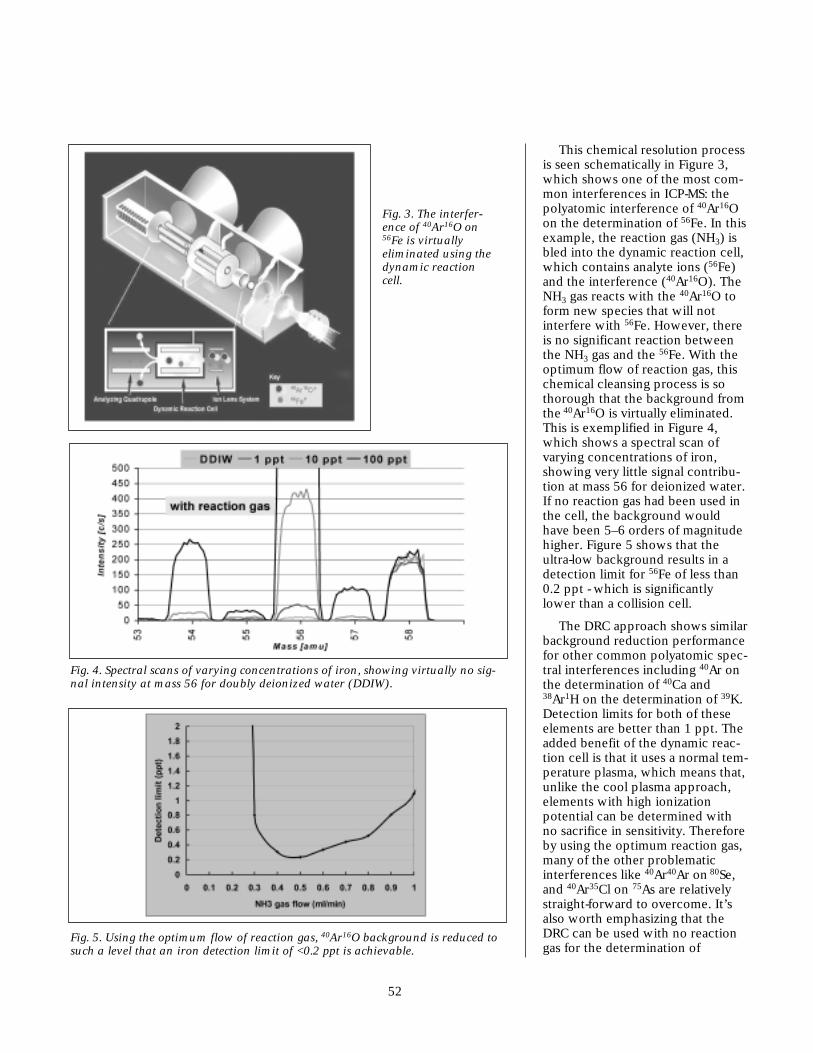
This chemical resolution processis seen schematically in Figure 3,which shows one of the most com-mon interferences in ICP-MS: thepolyatomic interference of 40Ar16Oon the determination of 56Fe. In thisexample, the reaction gas (NH3) isbled into the dynamic reaction cell,which contains analyte ions (56Fe)and the interference (40Ar16O). TheNH3 gas reacts with the 40Ar16O toform new species that will notinterfere with 56Fe. However, thereis no significant reaction betweenthe NH3 gas and the 56Fe. With theoptimum flow of reaction gas, thischemical cleansing process is sothorough that the background fromthe 40Ar16O is virtually eliminated.This is exemplified in Figure 4,which shows a spectral scan ofvarying concentrations of iron,showing very little signal contribu-tion at mass 56 for deionized water.If no reaction gas had been used inthe cell, the background wouldhave been 5–6 orders of magnitudehigher. Figure 5 shows that theultra-low background results in adetection limit for 56Fe of less than0.2 ppt - which is significantlylower than a collision cell.
The DRC approach shows similarbackground reduction performancefor other common polyatomic spec-tral interferences including 40Ar onthe determination of 40Ca and38Ar1H on the determination of 39K.Detection limits for both of theseelements are better than 1 ppt. Theadded benefit of the dynamic reac-tion cell is that it uses a normal tem-perature plasma, which means that,unlike the cool plasma approach,elements with high ionizationpotential can be determined withno sacrifice in sensitivity. Thereforeby using the optimum reaction gas,many of the other problematicinterferences like 40Ar40Ar on 80Se,and 40Ar35Cl on 75As are relativelystraight-forward to overcome. It’salso worth emphasizing that theDRC can be used with no reactiongas for the determination of
Fig. 3. The interfer-ence of 40Ar16O on56Fe is virtually eliminated using thedynamic reactioncell.
Fig. 4. Spectral scans of varying concentrations of iron, showing virtually no sig-nal intensity at mass 56 for doubly deionized water (DDIW).
Fig. 5. Using the optimum flow of reaction gas, 40Ar16O background is reduced tosuch a level that an iron detection limit of <0.2 ppt is achievable.

53
Vol. 24(2), March/April 2003
elements that don’t suffer frompolyatomic spectral interferences.In this mode, the cell is used as anion-focusing guide and not to carryout ion-molecule reactions. Table IIrepresents some typical multiele-ment detection limits (DL) andbackground equivalent concentra-tions (BEC) in ppt, achieved withthe dynamic reaction cell. The datafor the elements in bold letters areobtained using a reaction gas, whilethe elements listed in normal fontare obtained in standard mode.
SEMI Guidelines
To put this kind of performanceinto perspective, let’s take a look atpurity levels demanded by the semi-conductor industry. SEMI currentlyhas a proposed Tier C guideline for30–32% hydrogen peroxide of 100ppt for 18 elements. This is in itsfinal stages of approval, and whenapproved will go into the SEMIBOSS (Book of SEMI Standards) as aGrade 4 specification. However,because it is such a critical chemi-cal in the manufacturing process,the next generation of purity levelfor hydrogen peroxide (Tier Dguidelines), is already beingproposed at 10 ppt for 21 elements.When approved, this will go intothe BOSS as a Grade 5 specification.The current Tier C (Grade 4) andproposed Tier D (Grade 5) guide-line levels are shown in Table III.
The conversion of Tier D Guide-lines to a specification is dependenton analytical data being generated,which shows spike recovery databetween 75% and 125% at 50% ofthe proposed 10 ppt specification.Only when this happens, will it bepublished in the BOSS as a Grade 5specification. Unfortunately, thishas not been possible untilrecently, because traditional ICP-MStechnology has not shown thedetection capability to generatespike recovery data at the 5-pptlevel, using strict SEMI methodol-ogy.
TABLE IITypical Multielement Detection Limits (DL) and Background Equiva-lent Concentrations (BEC) Achieved With the Dynamic Reaction Cell
The data for the elements in bold letters are obtained using a reaction gas, whilethe elements listed in normal font are obtained in standard mode. The results are in ppt and achieved using a 1-second integration time. (Note: It should be emphasized that improved detection limits can be achieved usinglonger integration times in the single-element mode.)
Element Detection BEC Element Detection BECLimit (ppt) (ppt) Limit (ppt) (ppt)
7Li 0.26 0.22 74Ge 0.58 0.579Be 1.00 0.87 75As 0.48 1.611B 3.60 7.10 88Sr 0.03 0.0223Na 0.20 0.22 90Zr 0.05 0.0424Mg 0.23 0.18 98Mo 0.11 0.1227Al 0.23 0.42 107Ag 0.09 0.1039K 0.27 2.60 114Cd 0.08 0.1140Ca 0.27 0.63 115In 0.03 0.0248Ti 0.92 1.70 120Sn 0.12 0.8851V 0.12 0.04 121Sb 0.08 0.0852Cr 0.14 0.29 138Ba 0.06 0.0455Mn 0.17 0.54 181Ta 0.06 0.0256Fe 0.49 2.60 184W 0.07 0.0760Ni 0.43 0.66 197Au 0.15 0.0559Co 0.04 0.04 205Tl 0.02 0.0163Cu 0.06 0.68 208Pb 0.07 0.0964Zn 0.63 1.20 209Bi 0.02 0.0169Ga 0.06 0.05 238U 0.02 0.01
Aluminum 100 10
Antimony 100 10
Arsenic 100 10
Barium 10
Boron 100 10
Calcium 100 10
Chromium 100 10
Cobalt 10
Copper 100 10
Gold 100
Iron 100 10
Table IIICurrent Tier C and Proposed Tier D Trace Metal Purity Guidelines
Element Tier C (ppt) Tier D (ppt) Element Tier C (ppt) Tier D (ppt)(Grade 4) (Grade 5) (Grade 4) (Grade 5)
Lead 100 10
Lithium 10
Magnesium 100 10
Manganese 100 10
Nickel 100 10
Potassium 100 10
Sodium 100 10
Tin 100 10
Titanium 100 10
Vanadium 10
Zinc 50 10

54
SEMI Methodology
For any instrumental techniqueto fully comply with SEMI method-ology, the analytical data must meetvery stringent validation criteria,which are based on analyzing 2unspiked samples and 2 spiked sam-ples. This methodology is outlinedin Figure 6, which explains the sam-pling procedure, and Table IV laysout the complete data reportingrequirements (11).
The data generated from thismethodology are then evaluatedbased on certain performance crite-ria, which determine thetechnique’s suitability for this typeof analysis. These criteria are sum-marized in Table V.
Data Generated by SolvayInterox
Although Solvay Interox carriedout a thorough evaluation of thetechnology, its full potential for theanalysis of ultra high purity hydro-gen peroxide could only be realizedwhen the instrument was installedin a laboratory designed for theanalysis of semiconductor-type sam-ples. So to complete this study, wewould like to share some of theearly data generated in a class 100clean room by Dr. Collard and thescientists at PerkinElmer SCIEX,using the complete SEMI methodol-ogy described above (13). Theinstrument used for this study wasan ELAN® 6100 DRC™(PerkinElmer SCIEX Instruments,Concord, ON, Canada). The mainICP-MS instrumental parameters areshown in Table VI, while the reac-tion cell gas flows for each elementare shown in Table VII.
Calibration was performed witha 100-ppt multielement standardmade by dilution of a commercialstock solution in ultra pure water(UPW) with the addition of 1%nitric acid (HNO3). The 31% ultrahigh purity hydrogen peroxide wasinjected directly into the
Fig. 6. Sampling procedure for SEMI spike recovery studies.
TABLE IVComplete SEMI Spike Recovery Data Reporting Requirements
Sample A Result A (average of 5 replicates)
Sample B Result B (average of 5 replicates)
Average Average of result A and B
Spike The amount of spike equivalent to 50% of the specified value of the trace impurity and should be added to the sample prior to any sample preparation
Spike Sample C Result C (average of 5 replicates)
Spike Sample D Result D (average of 5 replicates)
Recovery 1 Result C - Average of Result A and B
% Recovery 1 (Recovery 1/Spike) x 100%
Recovery 2 Result D - Average of Result A and B
% Recovery 2 (Recovery 2/Spike) x 100%
% Recovery Range Max % Recovery – Min % Recovery
% RSD Relative standard deviation of the 5 replicates foreach spike sample = Std. Dev. Result / spike x 100
TABLE V: Performance Criteria Which Determine the Successof the SEMI Spike Recovery Methodology
Figures of Merit Criteria for Successful Methodology
Measurement Accuracy Between 75% and 125% spike recovery for each spike sample
Method Precision Recovery range less than or equal to 35%
Measurement Precision RSD on repetitive measurement at spikelevel less than or equal to 20%
Method Detection Limit (MDL) Estimated as per SEMI MDL methodologywhere MDL cannot exceed the specification (12)

55
Vol. 24(2), March/April 2003
instrument using a PFA-100 micro-concentric nebulizer (ESI, Omaha,NE USA). The method detectionlimit (MDL) was calculated fromlinear regression of a calibrationcurve generated from 2 sets ofhydrogen peroxide samples spikedwith 0, 5, 10, 20, 50, and 100 ppt ofeach element. A summary of thedata for all 21 elements specified inGrade 5 is shown in Table VIII. Itshould be noted that although theUPW blank was analyzed, the datain this table were not blank-subtracted.
It can be seen that every elementexceeds the "SEMI criteria for suc-cess" laid out in Table V. Theimproved background reductionand detection capability of the DRCICP-MS technology has allowed thedetermination of 21 elements at the10 ppt level in neat 31% hydrogenperoxide, using a robust, hotplasma at all times. This level ofperformance could not have beenachieved with conventional ICP-MStechnology. There is no questionthat dynamic reaction cell hasallowed Solvay Interox to reach thenext generation of purity levels,even before they become specifica-tions. Although this study hasfocused on hydrogen peroxide, it is typical of other semiconduc-tor–type samples being analyzedwith the DRC technology (14).
TABLE VI Instrumental Parameters for the Analysis
of SEMI Grade 5 Hydrogen Peroxide
Parameter Value
Nebulizer PFA-100 microconcentric
Spray chamber Quartz cyclonic
Sample injector Quartz
Interface cones Platinum
RF power 1400 W
Plasma gas flow 17 L/min
Auxiliary gas flow 1.5 L/min
Nebulizer gas flow 1.05 L/min
Sample uptake rate 0.25 mL/min
Measurement protocol 1 point/mass
Integration time 1 sec/mass
Replicates 5
Element/ Dynamic ReactionMass Cell Gas Flows
(mL/min)
Lithium 7 0.0
Boron 11 0.0
Sodium 23 0.0
Magnesium 24 0.0
Aluminum 27 0.6
Potassium 39 0.6
Calcium 40 1.0
Titanium 48 0.3
Vanadium 51 0.3
Chromium 52 0.6
Manganese 55 0.6
TABLE VIIDynamic Reaction Cell Gas Flows for the Analysis
of SEMI Grade 5 Hydrogen Peroxide
Element/ Dynamic Reaction Mass Cell Gas Flows
(mL/min)
Iron 56 0.6
Cobalt 59 0.3
Nickel 60 0.3
Copper 63 0.0
Zinc 64 0.0
Arsenic 75 0.0
Tin 118 0.0
Antimony 121 0.0
Barium 138 0.0
Lead 208 0.0

56
12. SEMI C10-0299, Guide for Determi-nation of Method Detection Limits.
13. Proceedings from SemiconductorPure Water and Chemicals Confer-ence, 2001, Editor Marjorie K. Bal-azs.
14. D. S. Bollinger and A J. Schleisman,At. Spectrosc. 20(2), 60-63, (1999).
7. S. J. Jiang, R. S. Houk, and M. A.Stevens, Anal. Chem. 60, 217,(1988).
8. S. D. Tanner, M. Paul, S. A. Beres, andE. R. Denoyer, At. Spectrosc.16(1),16-18 (1995)
9. P. Turner, T. Merren, J. Speakman,and C. Haines, Plasma Source MassSpectrometry: Developments andApplications, Proceedings from the5th International Conference onPlasma Source Mass Spectrometry,Durham, England (1996)
10. Covered by U.S. Patent Number6140638.
11. SEMI C1-1000, Specifications forReagents. Section 3.14: MethodValidation.
REFERENCES
1. SEMI C30-0600 Specifications andGuidelines for Hydrogen Peroxide.
2. S. D. Tanner, V. I. Baranov, AtomicSpectrosc. 20, 2, 45-52 (1999).
3. Book of SEMI Standards (BOSS), Semi-conductor Equipment and Materi-als International, San Jose, CA USA.
4. S. Beres, E. Denoyer, R. Thomas, P.Bruckner, Spectrosc. 9, 1, 20-26,(1994).
5. D. Potter, A. Walsh, E. McCurdy, andR. C. Hutton, Anal. Sciences 7, 467-470 (1991).
6. I. Feldman, N. Jakubowski, C. Thomas, and D. Stuewer, Frese-nius’ J. of Anal. Chem. 365, 422-428 (1999).
TABLE VIIISummary of Spike Recovery and MDL Data for SEMI Grade 5 Hydrogen Peroxide
Using DRC ICP-MS Technology
Analyte Unspike 1 Unspike 2 Average Spike 1 RSD Spike 2 RSD % % % MDL(ppt) (ppt) unspike (ppt) (%) (ppt) (%) Recovery Recovery Recovery (ppt)
Spike 1 Spike 2 Range
Aluminum 2.1 3.2 2.6 7.0 9 7.2 11 86 91 4 5.9
Antimony 0.41 0.39 0.40 4.7 16 4.7 7 86 87 1 0.55
Arsenic 2.2 2.4 2.3 6.4 15 6.4 13 83 82 1 1.6
Barium 0.34 0.32 0.33 4.9 8 4.7 4 91 87 4 0.45
Boron 12.2 11.9 12.0 16.7 14 17.6 14 92 111 19 7.0
Calcium 2.5 2.8 2.6 6.6 7 6.9 14 80 86 6 1.4
Chromium 0.86 1.0 0.9 5.2 9 5.4 7 85 89 4 0.70
Cobalt 0.26 0.35 0.3 5.0 5 4.9 4 93 92 1 0.56
Copper 2.3 2.9 2.6 7.0 20 7.1 12 88 91 3 2.4
Iron 9.2 9.8 9.5 14.7 6 14.2 3 103 94 9 2.7
Lead 1.2 1.2 1.2 6.0 8 5.9 4 96 94 1 0.69
Lithium 0.47 0.44 0.5 5.7 9 5.0 12 104 91 13 1.2
Magnesium 0.66 0.87 0.8 5.6 5 5.5 16 96 94 3 1.1
Manganese 0.95 0.81 0.9 4.9 8 4.8 7 80 78 2 1.6
Nickel 3.0 3.0 3.0 7.1 12 7.4 15 83 89 6 1.5
Potassium 5.1 5.2 5.1 9.1 12 9.2 7 79 81 3 1.3
Sodium 4.5 4.5 4.5 9.6 3 9.9 7 103 109 6 1.8
Tin 5.7 6.1 5.9 10.8 12 10.9 8 97 100 3 2.4
Titanium 4.7 5.2 5.0 10.1 10 10.3 10 103 107 4 2.3
Vanadium 0.23 0.29 0.3 4.8 7 4.8 15 90 91 1 0.32
Zinc 5.8 6.5 6.1 11.3 11 11.5 9 103 108 5 3.0

57Atomic SpectroscopyVol. 24(2), March/April 2003
The Benefits of Dynamic Reaction Cell ICP-MS Technology to Determine
Ultra Trace Metal Contamination Levels in High Purity Phosphoric and Sulfuric Acid
Katsu Kawabata and Yoko KishiPerkinElmer Life and Analytical Sciences, 41 Four Valley Drive, Condord, ON Canada L4K 4V8
Robert Thomas, Scientific Solutions, Gaithersburg, MD USA
INTRODUCTION
The drive for more compactintegrated circuits and smaller elec-tronic devices has put very strin-gent demands on suppliers of highpurity chemicals used in the semi-conductor manufacturing process.In order to reduce defects andincrease yield, lower trace elementcontamination levels are beingrequired in all process chemicals,especially as initiatives like theInternational Technology Roadmapfor Semiconductors (ITRS) (1) aresetting the course for the next gen-eration of semiconductor devices.Of particular significance are conta-mination issues associated withhigh purity acids, because theiraggressive dissolution propertiesmake them prone to "pick up"metal from other sources. In addi-tion, they are often used in largequantities with other chemicals todissolve metals from the surface ofsilicon wafers, to build a layer ofsilicon dioxide on top of the siliconsubstrate, or as an etchant. Forthese reasons, trace element puritylevels in concentrated mineralacids must be monitored veryclosely.
Two of the most important acidsused in the manufacture of semi-conductor devices are phosphoric(H3PO4) and sulfuric (H2SO4) acids.Even though trace element puritylevels are not as strict for acidssuch as hydrofluoric (HF) andhydrochloric (HCl), they are stilllow enough to present problemsfor the analytical techniques being
used. The major difficulties arerelated to their extremely high acidconcentration (phosphoric acid is~85% w/v and sulfuric acid is ~98%w/v), which produces corrosionproblems and very high specificgravity (phosphoric acid is 1.70g/mL and sulfuric acid is 1.83g/mL), which in turn producessample viscosity effects. In addi-tion, when inductively coupledplasma mass spectrometry (ICP-MS) is required to analyze the high-est purity acids, the phosphate(PO4) and sulfate (SO4) matricesgenerate a significant number ofplasma-based ionic species, whichinterfere with many of the analyteelements.
Phosphoric Acid
The Semiconductor Equipmentand Materials International (SEMI)Standards organization has realizedthe implication of the difficultiesassociated with the analysis of boththese acids. For example, in theirBook of SEMI Standards (BOSS) (2),it has approved the use of ICP-MSfor the determination of 23elements in Grade 3 phosphoricacid (3). However, to meet themethod QC and data quality objec-tives of 75–125% spike recovery at50% of the maximum limit of impu-rity, it states that 5.00 g of samplemust be weighed and diluted to 10mL with deionized water. In otherwords, this is the maximum dilu-tion that can be made in order tomeet the spike recovery reportingrequirements. SEMI states that theconcentration units in the specifi-
cation should be reported inweight/weight (w/w). Therefore,Table I shows the trace metal limitsfor Grade 3 phosphoric acid,together with the concentrations(in w/w) of each element at 50% ofthe impurity level after samplepreparation - based on 5 g of sam-ple made up to 10 mL with deion-ized water. It can be seen that theconcentration of trace metals beingpresented to the instrument isapproximately 5x less than theGrade 3 purity level. For some ofthe more difficult elements like Fe,K, Ca, Cu, and Zn, these levels arenot much higher than their realisticdetection limit in phosphoric acid.In fact, a study by Aleksejczyk andGibilisco, using SEMI methodology,showed that detection limits forthese elements were only 5–15times lower than Grade 3 levels(4). The predominant reason forsuch poor detection capability inthis study was the effects of majorspectral interferences produced bya combination of ions from thephosphoric acid matrix and theargon gas on analyte backgroundsignals. Therefore, in order toavoid these interferences, the mostsensitive isotopes of someelements could not be used forquantitation. The study also sug-gested that because of theextremely harsh phosphoric acidmatrix, conditioning of the inter-face cones and ion optics was cru-cial to maintain good long-termsignal stability.

58
Sulfuric Acid
Sulfuric acid is even more of aproblem. Grade 3 does not yet existas a specified standard. The lowestpurity levels in the SEMI BOSS areTier B and Tier C Guidelines, whichare set at a maximum of 1 ppb and100 ppt, respectively, for a similargroup of elements to phosphoricacid (5). However, neither of theseguidelines has become a standard,because no methodology is avail-able showing 75–125% spike recov-ery at 50% of 1 ppb and 100 pptpurity levels. In fact the bookstates, that until standardized testmethods are published, methodol-ogy shall be agreed upon between
user and producer. The highestgrade of sulfuric acid in the BOSS isGrade 2, which is set at 10 ppb forthe majority of elements (5). How-ever, it states that for the determi-nation of Cr, Co, Li, Mn, Ni, Ti, V,and Zn, the sulfuric acid must beevaporated off and made up to vol-ume with 1% nitric acid. The reasonbeing that in ICP-MS, the high con-centration of sulfur ions can poten-tially produce severe spectraloverlaps that interfere with the iso-topes of these elements. Eventhough the remainder of theelements can be determined by a1:15 dilution of the acid, it statesthat Na, K, Ca, and Fe must be
determined by graphite furnaceatomic absorption (GFAA). In addi-tion, it says that for B and Ta, thestandards for calibration must bematrix-matched with equal amountsof sulfuric acid certified to haveboth elements below 1 µg/mL.There is no question that if thiscomplicated and time-consumingprocedure is required for 10 ppb, itwill be even more difficult to getdown to 1 ppb and 100 ppt puritylevels.
Spectral Interferences
It is therefore clear that the ultra-trace analysis of phosphoric andsulfuric acid by traditional ICP-MS isvery difficult, because of the veryhigh concentration of matrix ions,combined with their aggressive cor-rosion properties. Unfortunately,the extremely low quantitation lev-els do not permit larger dilutions,so when analyzing these acids, ICP-MS is always going to struggle withmatrix suppression, matrix/plasma-induced spectral interferences, andcorrosion of instrumental compo-nents. Of these three problemareas, by far the two most difficultto overcome, as indicated by theSEMI methodology, are the matrixeffects and the formation of poly-atomic spectral interferences.These are interferences that areformed between the matrix ions(phosphorus, sulfur, oxygen, hydro-gen), or a combination of thematrix ions with ions from theargon plasma, which have thepotential to overlap with analyteisotopes. Table II shows some ofthe major polyatomic spectral inter-ferences in phosphoric and sulfuricacid.
TABLE ISEMI Grade 3 Phosphoric Acid Maximum Trace Metal Purity Levels
Final ConcentrationAfter Sample
Element Grade 3 Level Preparation(ppb) (w/w)
Aluminum 50 10.4 Antimony 1000 207.3 Arsenic 50 10.4 Barium 50 10.4 Boron 50 10.4 Cadmium 50 10.4 Calcium 150 31.1Chromium 50 10.4 Cobalt 50 10.4 Copper 50 10.4 Gold 50 10.4 Iron 100 20.7 Lead 50 10.4 Lithium 10 2.1 Magnesium 50 10.4Manganese 50 10.4Nickel 50 10.4Potassium 150 31.1 Silicon 50 10.4Sodium 250 51.8Strontium 10 2.1Titanium 50 10.4
Zinc 50 10.4

59
Vol. 24(2), March/April 2003
Cool Plasma Technology
There have been a number ofapproaches used to reduce thesekinds of interferences using quadru-pole-based instrumentation. Thefirst major breakthrough came inthe mid-1990s with the commercial-ization of the cool or cold plasmaapproach. This technology,reported in the literature in the late1980s, uses a low-temperatureplasma to minimize the formationof some of the troublesome argon-based polyatomic ions generated inthe plasma (6). Under normalplasma conditions (typically 1200W of RF power and 1.0 L/min ofnebulizer gas flow), argon ions com-bine with matrix and solvent-basedions to generate polyatomic speciesthat spectrally interfere with manyanalyte ions. By using cool plasmaconditions (500–800 W RF powerand 1.5–1.8 L/min nebulizer gasflow), the ionization conditions inthe plasma are changed and manyof these polyatomic interferencescannot be formed. The result is thatdetection limits are improved forsome of the critical semiconductorelements like Fe, K, and Ca (7).
One of the disadvantages of thecool plasma approach is thatbecause the ionization temperatureis so low, matrix-derived oxide and
hydroxide molecular ions are easilyformed, which have the potentialto spectrally interfere with manyanalytes. Also, it is expected thatchemical matrices with a higherboiling point will be difficult to bedecomposed in a cool plasma, as itprovides much less energy than anormal plasma. In addition to thedetection capability for the otherelements being severely compro-mised by the sample matrix, non-decomposed acids can causecorrosion problems on the inter-face and mass spectrometervacuum system. Finally, a signifi-cant disadvantage of the coolplasma approach is that in order toobtain the best performance for afull suite of elements, a multiele-ment analysis often necessitates theuse of two sets of operating condi-tions – one run for the cool plasmaelements and another for normalplasma elements. This results inmuch longer analysis times and alsohigher sample consumption.
Collision Cell Technology
The next major development toreduce spectral interferences wascollision cell technology, whichwas commercially introduced in themid to late 1990s, in an attempt toreduce polyatomic spectral interfer-
ences and improve theperformance of quadrupole ICP-MS(8). Collision cell technologyemploys a multipole (typicallyhexapole or octapole) housedwithin a cell placed just before theanalyzer quadrupole. It uses a colli-sion gas, typically hydrogen orhelium, to stimulate ion-moleculecollisions that convert thepolyatomic spectral interference toa non-interfering species. The ana-lyte ions then emerge from the col-lision cell and are directed towardsthe quadrupole analyzer for normalmass separation. Although thistechnology initially showed greatpromise, it struggled to reducebackground levels low enough toimprove detection limits over thecool/cold plasma approach forproblematic elements like Fe, K,and Ca (9). In addition, it appearedto offer no benefit to eliminatematrix-induced polyatomic interfer-ences, like SO and PO. For that rea-son, it was not viewed as beingsignificantly better than traditionalquadrupole instrumentation forsemiconductor-type samples.
The Dynamic Reaction Cell
The need for ICP-MS to providegood detection limits for semicon-ductor-related elements led to thedevelopment of dynamic reactioncell (DRC) technology (10). Similarin appearance to the collision cell,the dynamic reaction cell is a pres-surized multipole positioned imme-diately before the analyzerquadrupole. However, in DRC tech-nology, a mass-filtering quadrupoleis used instead of a hexapole oroctapole ion guide. A reactive gas,such as ammonia is bled into thecell, which causes ion moleculechemistry to take place. By a num-ber of different mechanisms, thegaseous molecules react with theinterfering ions to convert theminto species that will not interferewith the analyte. The analyte massthen emerges from the dynamicreaction cell free of its interference
TABLE IISome of the Major Polyatomic Spectral Interferences
Seen in Phosphoric and Sulfuric Acid
Analyte Isotope Spectral Interference Spectral Interferencein H3PO4 in H2SO4
39K 38ArH 38ArH40Ca 40Ar 40Ar48Ti 31P16OH 32S16O51V – 34S16OH52Cr – 34S18O56Fe 40Ar16O 40Ar16O63Cu 31P16O16O –64Zn 31P16O2H 32S32S, 32S16O16O71Ga 40Ar31P –72Ge - 40Ar32S

60
and is steered into the analyzerquadrupole for conventional massseparation. The advantage of usinga quadrupole in the reaction cell isthat the stability regions are muchbetter defined than with a hexapoleor octapole. This allows precisecontrol of the chemistry that takes
place within the cell. Therefore,with careful optimization of thequadrupole electrical fields,unwanted side reactions, whichcould potentially lead to new inter-ferences, are prevented by estab-lishing clear high and low massboundaries inside the dynamic reac-
tion cell. This filtering process,known as "chemical resolution,"means that every time an analyteand interfering ions enter thedynamic reaction cell, the bandpassof the quadrupole can be optimizedfor that specific problem and thenchanged on-the-fly for the next ana-lyte (11).
This process of ion-moleculechemistry is exemplified in Figure1, which shows one of the mostcommon interferences in ICP-MS:the polyatomic interference of40Ar16O on the determination of56Fe. In this example, the reactiongas (NH3) is bled into the dynamicreaction cell, which contains ana-lyte ions (56Fe) and the interference(40Ar16O). The NH3 gas reacts withthe 40Ar16O to form new speciesthat will not interfere with 56Fe.However there is very little reactionbetween the NH3 gas and the 56Fe.With optimum flow of the reactiongas, the chemical cleansing processis so thorough that the backgroundfrom the 40Ar16O is virtually elimi-nated.
Figure 2 shows a plot of the40Ar16O background intensity, com-pared to 100 ppt of 56Fe, as theflow of NH3 reaction gas isincreased. It can be clearly seenthat under the optimum gas flowconditions, the 40Ar16O intensityhas been reduced by five to sixorders of magnitude to less than 10cps, which translates into a detec-tion limit of less than 0.2 ppt for56Fe.
The DRC approach shows simi-lar background reduction perfor-mance for other commonpolyatomic spectral interferencesincluding 40Ar on the determinationof 40Ca and 38Ar1H on the determi-nation of 39K. Detection limits forboth of these elements are betterthan 0.3 ppt. The added benefit ofthe dynamic reaction cell is that ituses a robust, high-temperatureplasma. This means that, unlike thecool plasma approach, elements
Fig. 1. The interference of 40Ar16O on 56Fe is dramatically reduced using thedynamic reaction cell.
Fig. 2. Under the optimum NH3 gas flow conditions, the 40Ar16O intensity has beenreduced by 5–6 orders of magnitude to less than 10 cps in the dynamic reactioncell.
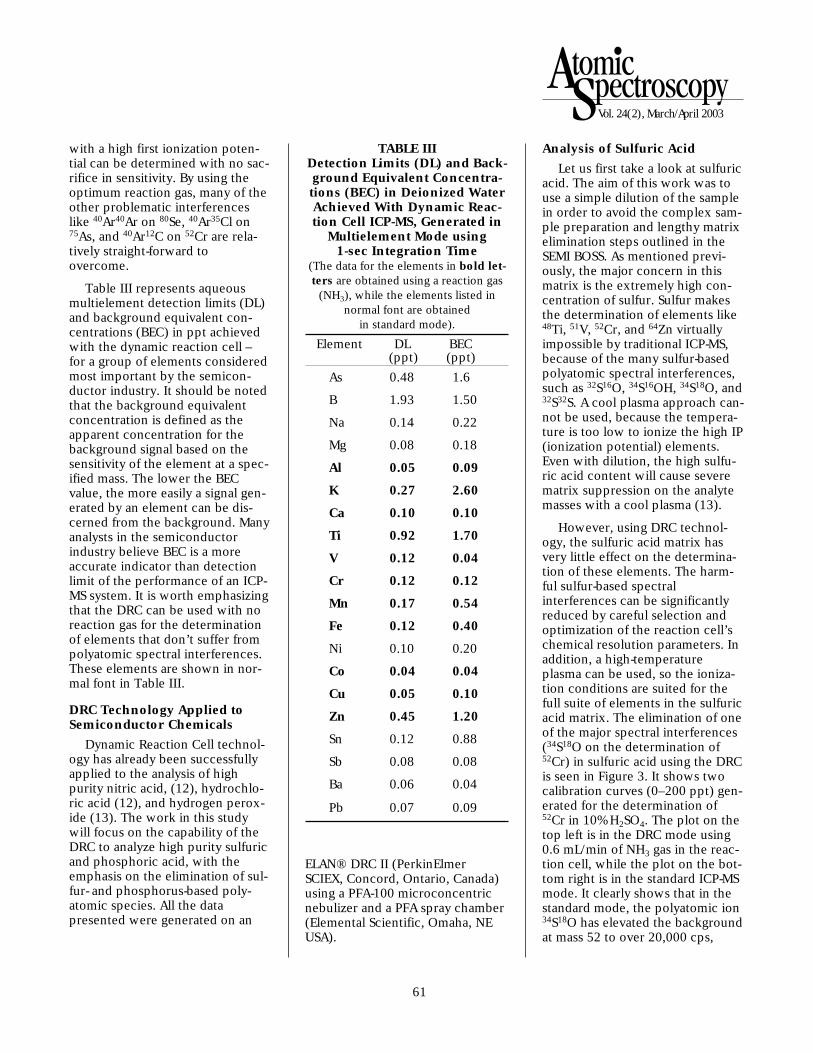
61
Vol. 24(2), March/April 2003
with a high first ionization poten-tial can be determined with no sac-rifice in sensitivity. By using theoptimum reaction gas, many of theother problematic interferenceslike 40Ar40Ar on 80Se, 40Ar35Cl on75As, and 40Ar12C on 52Cr are rela-tively straight-forward toovercome.
Table III represents aqueousmultielement detection limits (DL)and background equivalent con-centrations (BEC) in ppt achievedwith the dynamic reaction cell –for a group of elements consideredmost important by the semicon-ductor industry. It should be notedthat the background equivalentconcentration is defined as theapparent concentration for thebackground signal based on thesensitivity of the element at a spec-ified mass. The lower the BECvalue, the more easily a signal gen-erated by an element can be dis-cerned from the background. Manyanalysts in the semiconductorindustry believe BEC is a moreaccurate indicator than detectionlimit of the performance of an ICP-MS system. It is worth emphasizingthat the DRC can be used with noreaction gas for the determinationof elements that don’t suffer frompolyatomic spectral interferences.These elements are shown in nor-mal font in Table III.
DRC Technology Applied toSemiconductor Chemicals
Dynamic Reaction Cell technol-ogy has already been successfullyapplied to the analysis of highpurity nitric acid, (12), hydrochlo-ric acid (12), and hydrogen perox-ide (13). The work in this studywill focus on the capability of theDRC to analyze high purity sulfuricand phosphoric acid, with theemphasis on the elimination of sul-fur- and phosphorus-based poly-atomic species. All the datapresented were generated on an
ELAN® DRC II (PerkinElmerSCIEX, Concord, Ontario, Canada)using a PFA-100 microconcentricnebulizer and a PFA spray chamber(Elemental Scientific, Omaha, NEUSA).
Analysis of Sulfuric Acid
Let us first take a look at sulfuricacid. The aim of this work was touse a simple dilution of the samplein order to avoid the complex sam-ple preparation and lengthy matrixelimination steps outlined in theSEMI BOSS. As mentioned previ-ously, the major concern in thismatrix is the extremely high con-centration of sulfur. Sulfur makesthe determination of elements like48Ti, 51V, 52Cr, and 64Zn virtuallyimpossible by traditional ICP-MS,because of the many sulfur-basedpolyatomic spectral interferences,such as 32S16O, 34S16OH, 34S18O, and32S32S. A cool plasma approach can-not be used, because the tempera-ture is too low to ionize the high IP(ionization potential) elements.Even with dilution, the high sulfu-ric acid content will cause severematrix suppression on the analytemasses with a cool plasma (13).
However, using DRC technol-ogy, the sulfuric acid matrix hasvery little effect on the determina-tion of these elements. The harm-ful sulfur-based spectralinterferences can be significantlyreduced by careful selection andoptimization of the reaction cell’schemical resolution parameters. Inaddition, a high-temperatureplasma can be used, so the ioniza-tion conditions are suited for thefull suite of elements in the sulfuricacid matrix. The elimination of oneof the major spectral interferences(34S18O on the determination of52Cr) in sulfuric acid using the DRCis seen in Figure 3. It shows twocalibration curves (0–200 ppt) gen-erated for the determination of52Cr in 10% H2SO4. The plot on thetop left is in the DRC mode using0.6 mL/min of NH3 gas in the reac-tion cell, while the plot on the bot-tom right is in the standard ICP-MSmode. It clearly shows that in thestandard mode, the polyatomic ion34S18O has elevated the backgroundat mass 52 to over 20,000 cps,
TABLE IIIDetection Limits (DL) and Back-ground Equivalent Concentra-tions (BEC) in Deionized WaterAchieved With Dynamic Reac-tion Cell ICP-MS, Generated in
Multielement Mode using 1-sec Integration Time
(The data for the elements in bold let-ters are obtained using a reaction gas
(NH3), while the elements listed in normal font are obtained
in standard mode).
Element DL BEC (ppt) (ppt)
As 0.48 1.6
B 1.93 1.50
Na 0.14 0.22
Mg 0.08 0.18
Al 0.05 0.09
K 0.27 2.60
Ca 0.10 0.10
Ti 0.92 1.70
V 0.12 0.04
Cr 0.12 0.12
Mn 0.17 0.54
Fe 0.12 0.40
Ni 0.10 0.20
Co 0.04 0.04
Cu 0.05 0.10
Zn 0.45 1.20
Sn 0.12 0.88
Sb 0.08 0.08
Ba 0.06 0.04
Pb 0.07 0.09
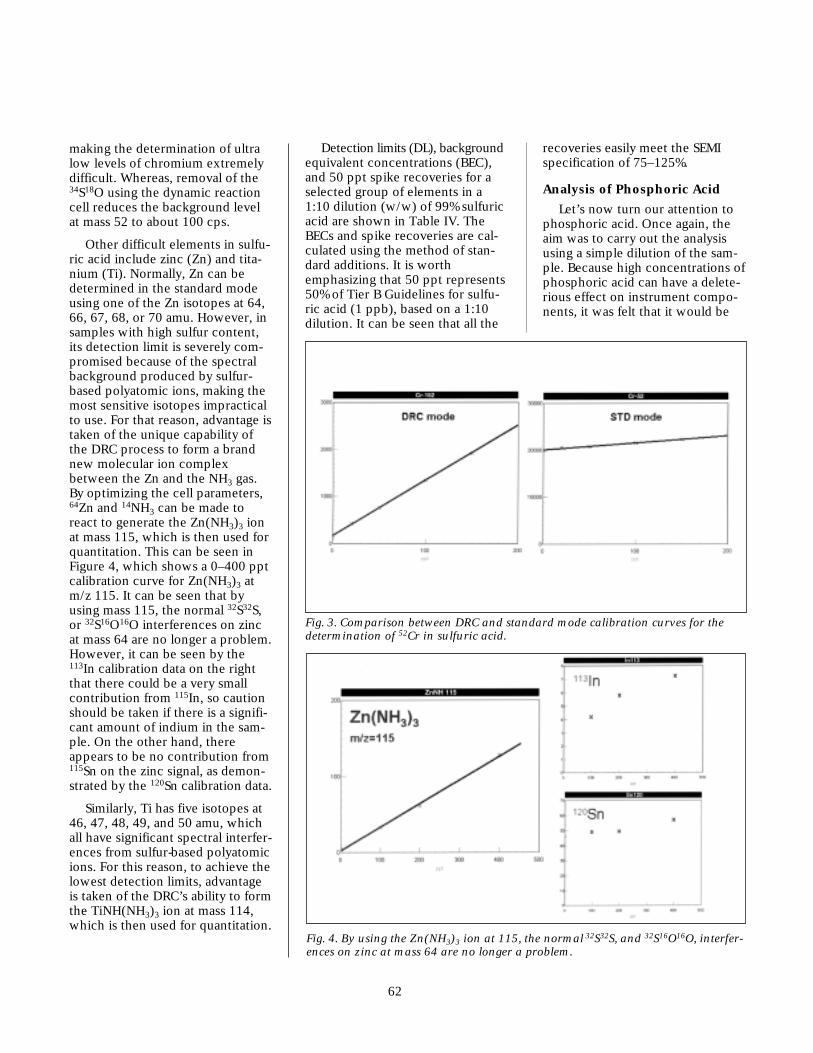
62
making the determination of ultralow levels of chromium extremelydifficult. Whereas, removal of the34S18O using the dynamic reactioncell reduces the background levelat mass 52 to about 100 cps.
Other difficult elements in sulfu-ric acid include zinc (Zn) and tita-nium (Ti). Normally, Zn can bedetermined in the standard modeusing one of the Zn isotopes at 64,66, 67, 68, or 70 amu. However, insamples with high sulfur content,its detection limit is severely com-promised because of the spectralbackground produced by sulfur-based polyatomic ions, making themost sensitive isotopes impracticalto use. For that reason, advantage istaken of the unique capability ofthe DRC process to form a brandnew molecular ion complexbetween the Zn and the NH3 gas.By optimizing the cell parameters,64Zn and 14NH3 can be made toreact to generate the Zn(NH3)3 ionat mass 115, which is then used forquantitation. This can be seen inFigure 4, which shows a 0–400 pptcalibration curve for Zn(NH3)3 atm/z 115. It can be seen that byusing mass 115, the normal 32S32S,or 32S16O16O interferences on zincat mass 64 are no longer a problem.However, it can be seen by the113In calibration data on the rightthat there could be a very smallcontribution from 115In, so cautionshould be taken if there is a signifi-cant amount of indium in the sam-ple. On the other hand, thereappears to be no contribution from115Sn on the zinc signal, as demon-strated by the 120Sn calibration data.
Similarly, Ti has five isotopes at46, 47, 48, 49, and 50 amu, whichall have significant spectral interfer-ences from sulfur-based polyatomicions. For this reason, to achieve thelowest detection limits, advantageis taken of the DRC’s ability to formthe TiNH(NH3)3 ion at mass 114,which is then used for quantitation.
Detection limits (DL), backgroundequivalent concentrations (BEC),and 50 ppt spike recoveries for aselected group of elements in a1:10 dilution (w/w) of 99% sulfuricacid are shown in Table IV. TheBECs and spike recoveries are cal-culated using the method of stan-dard additions. It is worthemphasizing that 50 ppt represents50% of Tier B Guidelines for sulfu-ric acid (1 ppb), based on a 1:10dilution. It can be seen that all the
recoveries easily meet the SEMIspecification of 75–125%.
Analysis of Phosphoric Acid
Let’s now turn our attention tophosphoric acid. Once again, theaim was to carry out the analysisusing a simple dilution of the sam-ple. Because high concentrations ofphosphoric acid can have a delete-rious effect on instrument compo-nents, it was felt that it would be
Fig. 4. By using the Zn(NH3)3 ion at 115, the normal 32S32S, and 32S16O16O, interfer-ences on zinc at mass 64 are no longer a problem.
Fig. 3. Comparison between DRC and standard mode calibration curves for thedetermination of 52Cr in sulfuric acid.

63
Vol. 24(2), March/April 2003
more advantageous to have a muchlarger dilution than the samplepreparation of 5 g/10 mL specifiedin SEMI Grade 3. The major con-cern in phosphoric acid is theextremely high concentration ofphosphorus, which makes thedetermination of Cu and Zn at theirmost abundant isotopes very diffi-cult, because of the polyatomicspectral interferences 31P16O2 and31P16O2H at masses 63 and 64,respectively. Unfortunately, for thesame reasons as sulfuric acid, coolplasma technology does not offerany significant benefits to reducethese interferences.
However, using DRC technol-ogy, the phosphorus-based spectralinterferences can be significantlyreduced by careful selection andoptimization of the DRC parame-ters. The elimination of one of themajor spectral interferences in 1%phosphoric acid is seen in Figure 5.It shows two calibration curves(0–600 ppt) generated for thedetermination of 63Cu. The plot onthe left is in the DRC mode using0.3 mL/min of NH3 gas in the reac-tion cell, while the plot on theright is in the standard ICP-MSmode. It clearly shows that in thestandard mode, the polyatomic ion31P16O2 has elevated thebackground at mass 63 to over700,000 cps, making the determi-nation of ultra low levels of copperextremely difficult. When the31P16O2 is removed using the chem-ical resolution of the dynamic reac-tion cell, the background at mass63 is reduced to about 1000 cps. Asimilar improvement of 3 orders ofmagnitude is also seen for thereduction of the 31P16O2H interfer-ence on the 64Zn isotope. This
TABLE IVDetection Limits, Background Equivalent Concentrations
and 50 ppt Spike Recoveries for a Selected Group of Elements in 10% Sulfuric Acid
[The data for the elements in bold letters are obtained using a reaction gas (NH3), while the elements listed in normal font are obtained in standard mode.]
Element Mass BEC DL 50-ppt Spike(ppt) (ppt) Recovery (%)
B 11 25 24 106
Na 23 3.5 1.5 101
Mg 24 1.6 0.8 104
Al 27 2.4 2.3 103K 39 51 5.7 100Ca 40 5.5 3.0 100TiNH(NH3)3 114 4.4 3.4 92V 51 1.6 0.7 99Cr 52 5.2 2 91Mn 55 11 2.3 99Fe 56 22 7.4 102Co 59 2.2 0.74 100Ni 60 26 7.5 104Cu 63 24 1.9 98Zn(NH3)3 115 14 16 98Ge 74 1.5 2.3 99As 75 12 2.2 98
Sn 120 3.9 1.5 99
Sb 121 0.40 0.2 99
Au 197 0.70 0.67 98
Pb 208 0.93 0.70 100
Fig. 5. Comparison between DRC andstandard mode calibration curves forthe determination of 63Cu in phos-phoric acid.
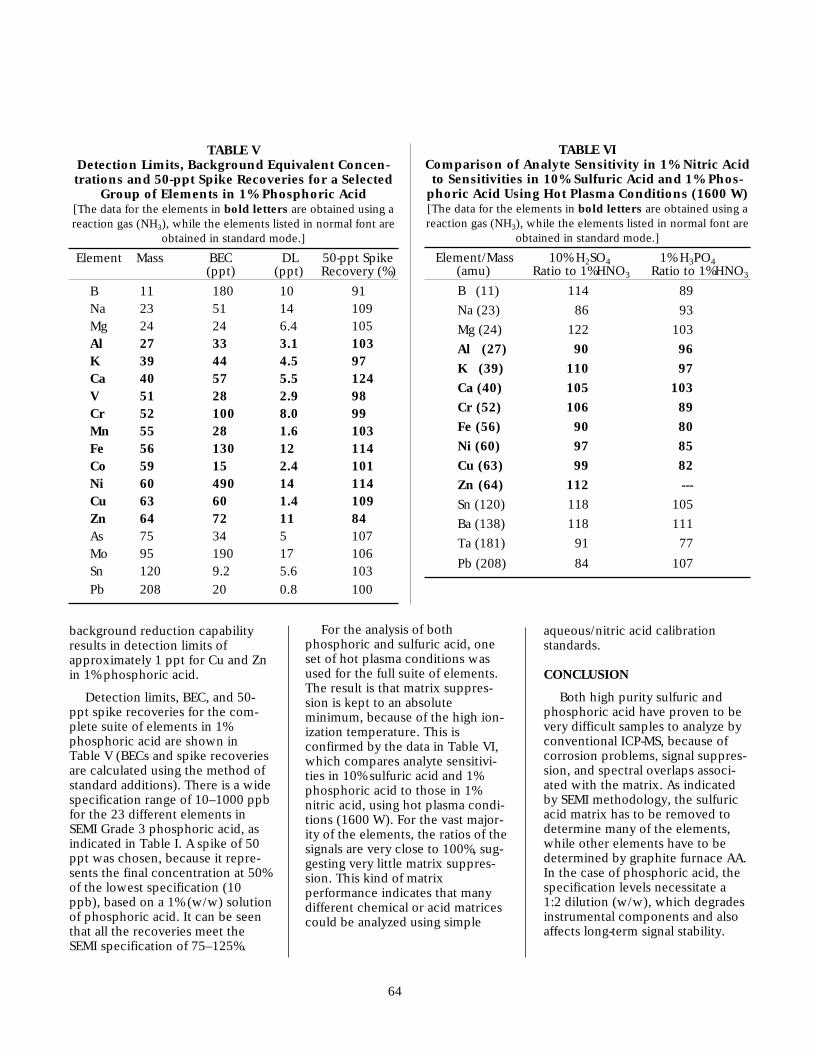
64
background reduction capabilityresults in detection limits ofapproximately 1 ppt for Cu and Znin 1% phosphoric acid.
Detection limits, BEC, and 50-ppt spike recoveries for the com-plete suite of elements in 1%phosphoric acid are shown inTable V (BECs and spike recoveriesare calculated using the method ofstandard additions). There is a widespecification range of 10–1000 ppbfor the 23 different elements inSEMI Grade 3 phosphoric acid, asindicated in Table I. A spike of 50ppt was chosen, because it repre-sents the final concentration at 50%of the lowest specification (10ppb), based on a 1% (w/w) solutionof phosphoric acid. It can be seenthat all the recoveries meet theSEMI specification of 75–125%.
For the analysis of bothphosphoric and sulfuric acid, oneset of hot plasma conditions wasused for the full suite of elements.The result is that matrix suppres-sion is kept to an absoluteminimum, because of the high ion-ization temperature. This isconfirmed by the data in Table VI,which compares analyte sensitivi-ties in 10% sulfuric acid and 1%phosphoric acid to those in 1%nitric acid, using hot plasma condi-tions (1600 W). For the vast major-ity of the elements, the ratios of thesignals are very close to 100%, sug-gesting very little matrix suppres-sion. This kind of matrixperformance indicates that manydifferent chemical or acid matricescould be analyzed using simple
aqueous/nitric acid calibrationstandards.
CONCLUSION
Both high purity sulfuric andphosphoric acid have proven to bevery difficult samples to analyze byconventional ICP-MS, because ofcorrosion problems, signal suppres-sion, and spectral overlaps associ-ated with the matrix. As indicatedby SEMI methodology, the sulfuricacid matrix has to be removed todetermine many of the elements,while other elements have to bedetermined by graphite furnace AA.In the case of phosphoric acid, thespecification levels necessitate a1:2 dilution (w/w), which degradesinstrumental components and alsoaffects long-term signal stability.
TABLE VDetection Limits, Background Equivalent Concen-trations and 50-ppt Spike Recoveries for a Selected
Group of Elements in 1% Phosphoric Acid [The data for the elements in bold letters are obtained using areaction gas (NH3), while the elements listed in normal font are
obtained in standard mode.]
Element Mass BEC DL 50-ppt Spike(ppt) (ppt) Recovery (%)
B 11 180 10 91Na 23 51 14 109Mg 24 24 6.4 105Al 27 33 3.1 103K 39 44 4.5 97Ca 40 57 5.5 124V 51 28 2.9 98Cr 52 100 8.0 99Mn 55 28 1.6 103Fe 56 130 12 114Co 59 15 2.4 101Ni 60 490 14 114Cu 63 60 1.4 109Zn 64 72 11 84As 75 34 5 107Mo 95 190 17 106Sn 120 9.2 5.6 103
Pb 208 20 0.8 100
TABLE VIComparison of Analyte Sensitivity in 1% Nitric Acidto Sensitivities in 10% Sulfuric Acid and 1% Phos-
phoric Acid Using Hot Plasma Conditions (1600 W)[The data for the elements in bold letters are obtained using areaction gas (NH3), while the elements listed in normal font are
obtained in standard mode.]
Element/Mass 10% H2SO4 1% H3PO4(amu) Ratio to 1%HNO3 Ratio to 1%HNO3
B (11) 114 89
Na (23) 86 93
Mg (24) 122 103
Al (27) 90 96
K (39) 110 97
Ca (40) 105 103
Cr (52) 106 89
Fe (56) 90 80
Ni (60) 97 85
Cu (63) 99 82
Zn (64) 112 ---
Sn (120) 118 105
Ba (138) 118 111
Ta (181) 91 77
Pb (208) 84 107

65
Vol. 24(2), March/April 2003
This study has clearly shownthat dynamic reaction cell technol-ogy dramatically reduces the forma-tion of harmful polyatomic spectralinterferences produced by the highconcentration of sulfur and phos-phorus in the sample. The result isthat a full suite of elements can bedetermined both in sulfuric acid atthe Tier B Guideline level and inphosphoric acid at the Grade 3Standard level with a simple dilu-tion of the sample. The added ben-efit of this technology is that arobust, high-temperature plasma isused for all the analytes. The resultis that matrix suppression is kept toan absolute minimum, which offersthe exciting potential of using sim-ple aqueous/nitric acid standards toanalyze a wide variety of complexsample matrices.
REFERENCES
1. International Technology Roadmapfor Semiconductors (ITRS)http://public.itrs.net (2001).
2. Book of SEMI Standards (BOSS),Semiconductor Equipment andMaterials International, San Jose,CA USA.
3. SEMI C36-0301 Specifications forGrade 3 Phosphoric Acid.
4. R. A. Aleksejczyk and D. Gibilisco;Micro, 39-42 (September 1997).
5. SEMI C44-0301 Specifications andGuidelines for Sulfuric Acid.
6. S. J. Jiang, R. S. Houk, M. A. Stevens,Anal. Chem. 60, 217 (1988).
7. S. D. Tanner, M. Paul, S. A. Beres,and E. R. Denoyer, At. Spectrosc.16(1), 16-18 (1995).
8. P. Turner, T. Merren, J. Speakman,and C. Haines, Plasma Source MassSpectrometry: Developments andApplications, Proceedings fromthe 5th International Conferenceon Plasma Source Mass Spectrome-try, Durham, England (1996).
9. I. Feldman, N. Jakubowski, C.Thomas, and D. Stuewer, Frese-nius’ J. of Anal. Chem. 365, 422-428 (1999).
10. S. D. Tanner and V. I. Baranov, At.Spectrosc. 20(2), 45-52 (1999).
11. Covered by US Patent Number6140638.
12. D. S. Bollinger and A J. Schleisman,At. Spectrosc. 20(2), 60-63 (1999).
13. J. M. Collard, K. Kawabata, Y. Kishi,and R. Thomas, Micro (January2002).
66Atomic SpectroscopyVol. 24(2), March/April 2003
*This article was previously published inSemiconductor Pure Water and ChemicalsConference 2001. Used with permission.
DRC-ICP-MS Analysis of Various Chemicals Used in the Semiconductor Industry*
Katsu Kawabata and Yoko KishiPerkinElmer Life and Analytical Sciences
71 Four Valley Drive, Concord, Ontario, Canada L4K 4V8
INTRODUCTION
Since the introduction of induc-tively coupled plasma mass spec-trometry (ICP-MS), researchers inthe semiconductor industry havefavored its extremely high sensitiv-ity. However, some of the key ele-ments were difficult to determineat ppt levels due to interferences(see Table I).
In 1994, this author (1)published the first paper regardingshield torch and cool plasma,
ABSTRACT
Manufacturing processes ofsemiconductor devices require avariety of chemicals and materi-als, which must be ultra purebecause the presence of impuri-ties degrades the performance ofthe resultant devices. Cationicimpurity levels in these chemi-cals have been commonly deter-mined by ICP-MS because of itsability to perform ultra tracelevel analyses. Unfortunately,some important common conta-minants, such as potassium, cal-cium, and iron, suffer fromplasma-generated polyatomicinterferences. A possible solu-tion to this problem is the use ofcool plasma. With thistechnique, the energy of theplasma is lowered, thus minimiz-ing the formation of specieswith higher ionization poten-tials, such as Ar, ArH, and ArO,while elements with lower ion-ization potentials (i.e., K, Ca,and Fe) are effectively ionized.In this way, the plasma-basedinterferences on K, Ca, and Feare reduced, and these analytes
can be determined at lowerparts-per-trillion (ppt) levels.
However, there aredrawbacks to the cool plasmatechnique, mainly due to thelower plasma energy. The prob-lems associated with cool plasmaanalysis can be circumventedwith Dynamic Reaction Cell‘(DRC‘) ICP-MS. This techniqueuses a hot, high-energy plasmafor all analytes. The DRC elimi-nates interferences by simultane-ously employing two techniques:chemical resolution and dynamicbandpass tuning (DBT). Chemi-cal resolution involves the use ofa gas within the DRC, whichreacts with the interference tocompletely eliminate it. At thesame time, DBT is applied. DBTacts as a mass filter, thuspreventing the formation ofspecies that may interfere withthe analytes.
In this paper, DRC-ICP-MSwas used for the determinationof various chemicals used in thesemiconductor industry. Severalbenefits of hot plasma with DRCare also discussed.
which minimized most criticalinterferences such as 40Ar16O, 40Ar,38Ar1H, 40Ar12C, and 12C12C. Sincethen the cool plasma technique hasbeen recognized as an indispens-able tool for the determination ofimpurities in chemicals and materi-als used in the semiconductorindustry. However, cool plasmacannot be applied to determine theother analytes listed in Table Ibecause of the lower plasma tem-perature. N2 and ClO interferencescan be removed with cool plasma,but the sensitivity of Si and V isreduced because of their strongbond energy with oxygen. Oxidescannot be decomposed in coolplasma, so that SiO and VO are not
decomposed; as a result, Si and Vions cannot be formed in coolplasma. Other elements that have astrong bond energy with oxygen,such as Ti, Zr, W, Ta, and the rareearth elements, cannot be ionizedunder cool plasma conditions.
Other interferences such as ArArand ArCl can be reduced by coolplasma, but the sensitivity of Se andAs reduces accordingly because theionization potential of these ele-ments is relatively high, i.e., >9 eV.Other elements having a higherionization potential, such as B, P,and Zn, also show very low sensi-tivity under cool plasma.
In order to determine allelements, a hotter plasma condi-tion must also be employed. As aresult, two plasma conditions mustbe used, with the RF power, sam-pling depth, and carrier gas flowrates being changed accordingly.
TABLE ITypical Interferences on
ICP-MS Analysis
Interference Analyte40Ar16O 56Fe40Ar 40Ca38Ar1H 39K40Ar12C 52Cr12C12C 24Mg40Ar40Ar 80Se14N14N 28Si14N16O1H 31P35Cl16O 51V35Cl16O1H 52Cr40Ar35Cl 75As37Cl16O16O 69Ga32S16O16O, 31P17O16O 64Zn31P16O16O 63Cu
67
Vol. 24(2), March/April 2003
The stabilization time for switchingfrom one plasma condition toanother is very quick when purewater is analyzed. However, it takesseveral minutes or more when it isapplied to higher concentrations ofchemicals. Another benefit of thecool plasma technique is a lowerbackground of Na resulting fromthe interface material. Even thougha high purity metal is used as theinterface material, it contains impu-rities such as B, Na, K, and Ca,which are evaporated from theinterface by the higher plasma tem-perature and are ionized. Whencool plasma is used, the plasmatemperature does not have enoughenergy to evaporate these impuri-ties. This phenomenon can easilybe recognized when comparing thebackground signal of Na under bothnormal and cool plasma conditions.
DRC-ICP-MS
The DRC technique employschemical reactions in a reaction cell(2). A commonly used reaction gasis NH3 because of its ionizationpotential and reactivity with spe-cific ions. Several parametersshould be taken into account tounderstand the mechanisms of reac-tion and collision, but the easiestexplanation would be thedifference of the ionization poten-tial and charge transfer. For exam-ple, the ionization potential of Ar+,NH3
+, and Ca+ is 15.76 eV, 10.16eV, and 6.11 eV, respectively. Sincethe ionization potential of Ar+ ishigher than NH3, collision of thetwo species results in the chargetransfer from Ar+ to NH3, creatingNH3
+ and neutral Ar. On the otherhand, the ionization potential ofCa+ is lower than NH3, thus thecharge transfer is not allowed. Inother words, the reaction betweenAr+ and NH3 is exothermic, whichoccurs without adding extraenergy. On the other hand, thereaction between Ca+ and NH3 isendothermic, which does not occurwithout adding extra energy.
There is a technique similar tothe dynamic reaction cell, but it iscompletely different in the way ofseparating interferences and analyteions. The other technique, called acollision cell (3), uses hexapole oroctopole with only AC voltage.Conventional ICP-MS instrumentsuse AC-only pre-filter to maximizethe transport of ions into the ana-lyzer quadrupole. With its similarconfiguation, a collision cellfocuses ions very well within thecell. Since all ions go through thecell, collisions with a highly reac-tive gas, such as NH3, generatemany by-product ions within thecell. Reduction of the interferencedepends on the number ofcollisions occurring in the cell, andthe reaction rate between the reac-tion gas and interference ions. Thenumber of collisions depends onthe length of the cell and the pres-sure of the reaction gas in the cell.Reduction of the ion kinetic energyalso depends on the number of col-lisions and the mass of the collisiongas. The more collisions, thegreater the kinetic energy reduc-tion. The heavier the collision gas,the more the kinetic energy isreduced by one collision.Therefore, the gases used for thecollision cell are limited in order toavoid the formation of by-products.Furthermore, the number of colli-sions has to be limited to discrimi-nate the kinetic energies of theanalyte ions and of the by-products(4,5). As a result, the interference
reduction is limited to certainorders of magnitude.
The DRC, on the other hand,uses a quadrupole with DC + ACvoltage, which allows only selectedions to pass through thequadrupole, like the main Q-pole.The Q-pole is, in general, set to passonly one amu, while the DRCpasses a wider range of masses, syn-chronizing with the main Q-pole;this process is called dynamic band-pass tuning (DBT). Since DBTallows the passing of only limitedions through the cell, generation ofby-product ions in the cell can beavoided. As a result, the number ofcollisions in the cell is not limitedand complete elimination of theinterferences can be achieved.
EXPERIMENTAL
Instrumentation
The instrumentation used forthis experiment was an ELAN®DRC™ ICP-MS (PerkinElmer SCIEX,Concord, Ontario, Canada). Theinstrumental parameters and sam-ple introduction devices used arepresented in Table II. The RFpower was varied from 800 W to1600 W.
In order to investigate the effectof plasma temperature on the sensi-tivity of the analytes, the nebulizergas flow rate was fixed at 0.94L/min, with a sample uptake rate of0.25 mL/min. The nitric acid used
TABLE IIELAN DRC and Sample Introduction Device Parameters
Plasma gas Ar 15 L/min
Auxiliary gas Ar 1 L/min
Nebulizer PFA-100 and PFA-20 with self-aspiration(Elemental Scientific Inc.)
Nebulizer gas Ar 0.94 L/min
Spray chamber PFA Scott-type double-pass (Elemental Scientific Inc.)
Reaction gas NH3 (0 ~ 1 mL/min)
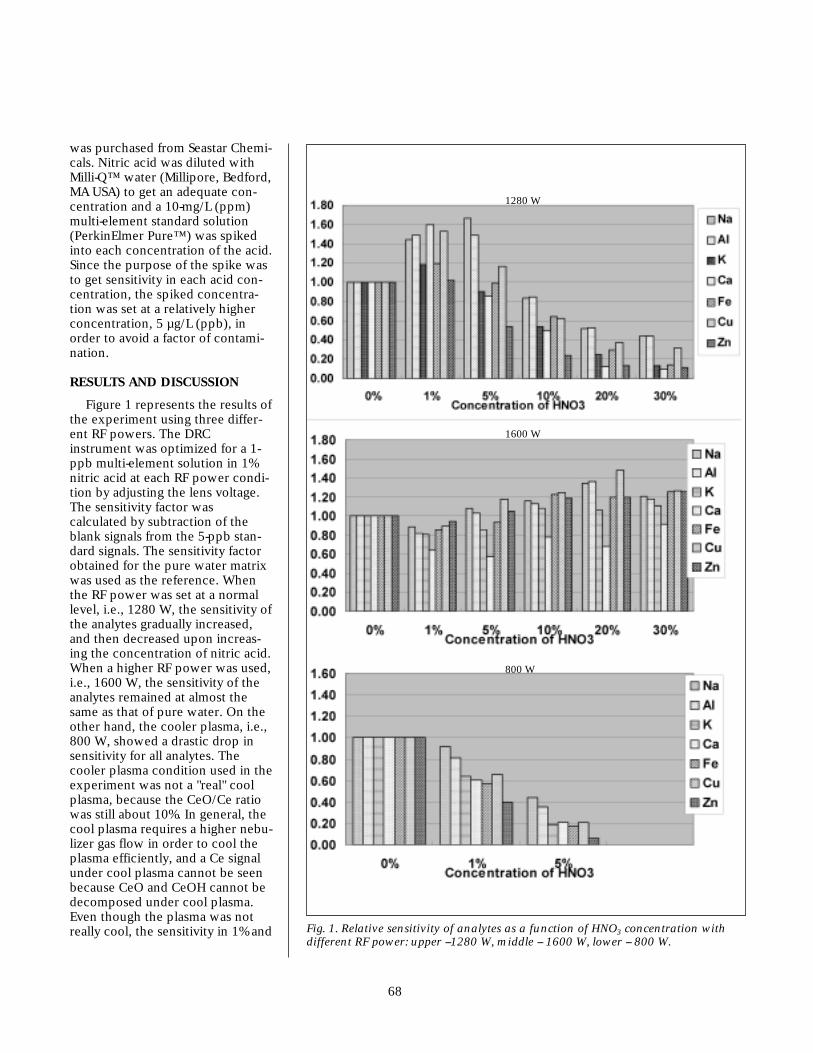
68
was purchased from Seastar Chemi-cals. Nitric acid was diluted withMilli-Q™ water (Millipore, Bedford,MA USA) to get an adequate con-centration and a 10-mg/L (ppm)multi-element standard solution(PerkinElmer Pure™) was spikedinto each concentration of the acid.Since the purpose of the spike wasto get sensitivity in each acid con-centration, the spiked concentra-tion was set at a relatively higherconcentration, 5 µg/L (ppb), inorder to avoid a factor of contami-nation.
RESULTS AND DISCUSSION
Figure 1 represents the results ofthe experiment using three differ-ent RF powers. The DRCinstrument was optimized for a 1-ppb multi-element solution in 1%nitric acid at each RF power condi-tion by adjusting the lens voltage.The sensitivity factor wascalculated by subtraction of theblank signals from the 5-ppb stan-dard signals. The sensitivity factorobtained for the pure water matrixwas used as the reference. Whenthe RF power was set at a normallevel, i.e., 1280 W, the sensitivity ofthe analytes gradually increased,and then decreased upon increas-ing the concentration of nitric acid.When a higher RF power was used,i.e., 1600 W, the sensitivity of theanalytes remained at almost thesame as that of pure water. On theother hand, the cooler plasma, i.e.,800 W, showed a drastic drop insensitivity for all analytes. Thecooler plasma condition used in theexperiment was not a "real" coolplasma, because the CeO/Ce ratiowas still about 10%. In general, thecool plasma requires a higher nebu-lizer gas flow in order to cool theplasma efficiently, and a Ce signalunder cool plasma cannot be seenbecause CeO and CeOH cannot bedecomposed under cool plasma.Even though the plasma was notreally cool, the sensitivity in 1% and Fig. 1. Relative sensitivity of analytes as a function of HNO3 concentration with
different RF power: upper --1280 W, middle -- 1600 W, lower -- 800 W.
1280 W
1600 W
800 W
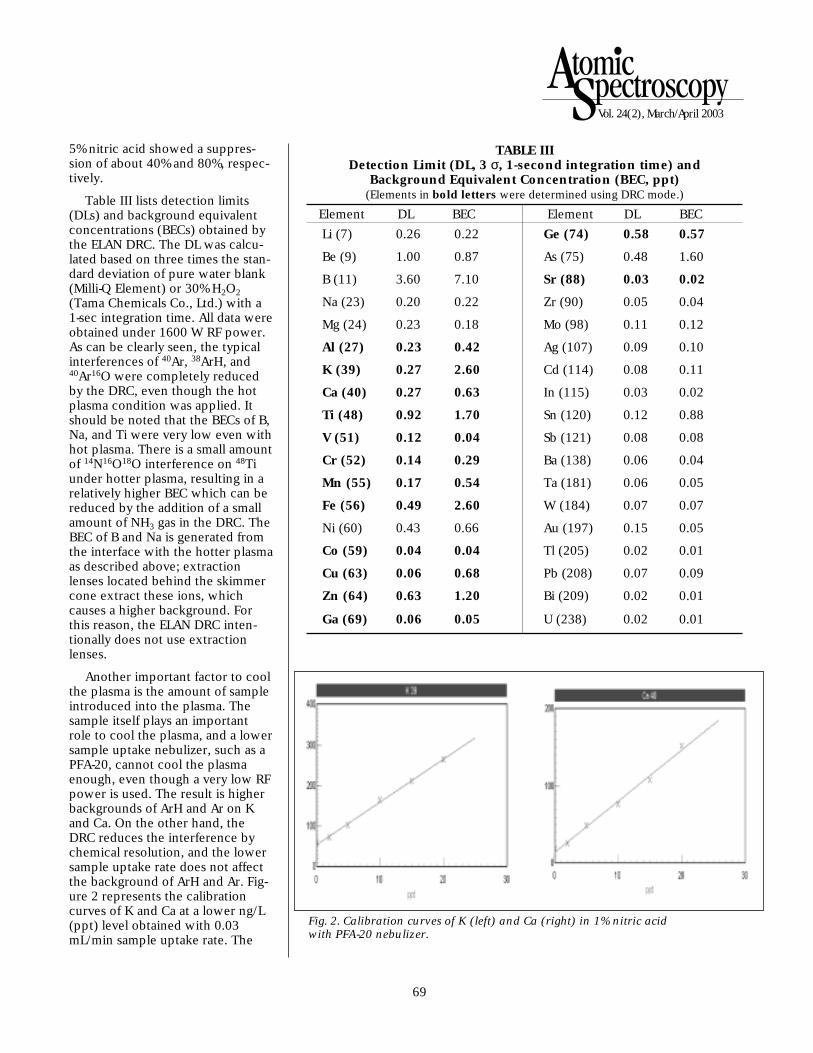
69
Vol. 24(2), March/April 2003
5% nitric acid showed a suppres-sion of about 40% and 80%, respec-tively.
Table III lists detection limits(DLs) and background equivalentconcentrations (BECs) obtained bythe ELAN DRC. The DL was calcu-lated based on three times the stan-dard deviation of pure water blank(Milli-Q Element) or 30% H2O2
(Tama Chemicals Co., Ltd.) with a1-sec integration time. All data wereobtained under 1600 W RF power.As can be clearly seen, the typicalinterferences of 40Ar, 38ArH, and40Ar16O were completely reducedby the DRC, even though the hotplasma condition was applied. Itshould be noted that the BECs of B,Na, and Ti were very low even withhot plasma. There is a small amountof 14N16O18O interference on 48Tiunder hotter plasma, resulting in arelatively higher BEC which can bereduced by the addition of a smallamount of NH3 gas in the DRC. TheBEC of B and Na is generated fromthe interface with the hotter plasmaas described above; extractionlenses located behind the skimmercone extract these ions, whichcauses a higher background. Forthis reason, the ELAN DRC inten-tionally does not use extractionlenses.
Another important factor to coolthe plasma is the amount of sampleintroduced into the plasma. Thesample itself plays an importantrole to cool the plasma, and a lowersample uptake nebulizer, such as aPFA-20, cannot cool the plasmaenough, even though a very low RFpower is used. The result is higherbackgrounds of ArH and Ar on Kand Ca. On the other hand, theDRC reduces the interference bychemical resolution, and the lowersample uptake rate does not affectthe background of ArH and Ar. Fig-ure 2 represents the calibrationcurves of K and Ca at a lower ng/L(ppt) level obtained with 0.03mL/min sample uptake rate. The
TABLE IIIDetection Limit (DL, 3 σ, 1-second integration time) and
Background Equivalent Concentration (BEC, ppt) (Elements in bold letters were determined using DRC mode.)
Element DL BEC Element DL BEC
Li (7) 0.26 0.22 Ge (74) 0.58 0.57
Be (9) 1.00 0.87 As (75) 0.48 1.60
B (11) 3.60 7.10 Sr (88) 0.03 0.02
Na (23) 0.20 0.22 Zr (90) 0.05 0.04
Mg (24) 0.23 0.18 Mo (98) 0.11 0.12
Al (27) 0.23 0.42 Ag (107) 0.09 0.10
K (39) 0.27 2.60 Cd (114) 0.08 0.11
Ca (40) 0.27 0.63 In (115) 0.03 0.02
Ti (48) 0.92 1.70 Sn (120) 0.12 0.88
V (51) 0.12 0.04 Sb (121) 0.08 0.08
Cr (52) 0.14 0.29 Ba (138) 0.06 0.04
Mn (55) 0.17 0.54 Ta (181) 0.06 0.05
Fe (56) 0.49 2.60 W (184) 0.07 0.07
Ni (60) 0.43 0.66 Au (197) 0.15 0.05
Co (59) 0.04 0.04 Tl (205) 0.02 0.01
Cu (63) 0.06 0.68 Pb (208) 0.07 0.09
Zn (64) 0.63 1.20 Bi (209) 0.02 0.01
Ga (69) 0.06 0.05 U (238) 0.02 0.01
Fig. 2. Calibration curves of K (left) and Ca (right) in 1% nitric acid with PFA-20 nebulizer.

70
BEC of K and Ca was 5 and 2 ppt,respectively.
According to these experiments,it is obvious that the hotter plasmais more robust for various matrixsamples. The hotter plasma condi-tion (1600 W RF power) wasapplied to various chemicals andmaterials used for the semiconduc-tor industry.
Table IV represents the quantita-tive results of 5% tetramethylammo-niumhydroxide (TMAH) using thePFA-100 nebulizer. The concentra-tion was calculated based on theexternal calibration curves with apure water matrix.
The 100-ppt spike recoveryresults clearly indicate that the sen-sitivity of all analytes in 5% TMAHwas similar to that in pure water.Furthermore, the concentration ofMg and Cr found in 5% TMAH was4 and 13 ppt, respectively, whichindicates the effectiveness of DRCfor the elimination of C2 and ArCinterferences.
Another chemical analyzedunder the same condition as the 5%TMAH was 0.98% H3PO4. The samewater calibration curves were usedfor quantitation. Table V lists theresults of the 1-ppb spike recovery,which also showed excellent recov-ery for all analytes presented here.Cu and Zn were determined byboth the DRC mode (with NH3
reaction gas) and the standardmode (without the reaction gas) inorder to investigate PO2 interfer-ence: both modes were performedwithin one measurement. Theresults obtained under the standardmode obviously showed a PO2
interference on 63Cu, 65Cu, 64Zn,and 66Zn. On the other hand, theresults obtained under the DRCmode, as indicated in Cu-1 and Zn-1, showed no PO2 interference withNH3 reaction gas.
TABLE IVQuantitative Results of 5% tetramethylammoniumhydroxide
(Elements in bold letters were determined using DRC mode.)
Analyte Mass TMAH 5% 100 ppt Recovery(ppt) spike (ppt) (%)
B 11 277 369 92
Na 23 121 231 110
Mg 24 4.43 115 111
Al 27 20.5 119 99
K 39 101 209 108
Ca 40 11.6 104 93
Ti 48 11.8 118 106
Cr 52 12.8 119 106
Mn 55 5.09 113 108
Fe 56 83.7 175 91
Ni 60 9.84 104 94
Cu 63 7.44 92.3 85
Zn 64 137 235 97
Sn 120 10.7 119 108
Pb 208 22.4 126 103
TABLE VQuantitative Results of 0.98% Phosphoric Acid
(Elements in bold letters were determined using DRC mode.)
Element (m/z) H3PO4 1 ppb spike Recovery (ppb) (ppb) (%)
Na 23 0.121 1.21 109
Mg 24 0.067 1.08 101
Al 27 0.170 1.15 97.7
K 39 0.053 1.03 97.2
Ca 40 0.217 1.46 124
Cr 52 0.131 1.21 108
Mn 55 0.043 1.03 98.4
Fe 56 0.365 1.50 114
Ni 60 0.070 1.03 95.7
Cu 63 185 261 7580
Cu-1 63 0.137 1.20 106
Cu 65 3.06 4.89 182
Zn 64 33.5 51.7 1820
Zn-1 64 0.097 0.938 84.1
Zn 66 0.40 1.23 83.4
As 75 0.056 1.20 115
Pb 208 0.056 1.10 104
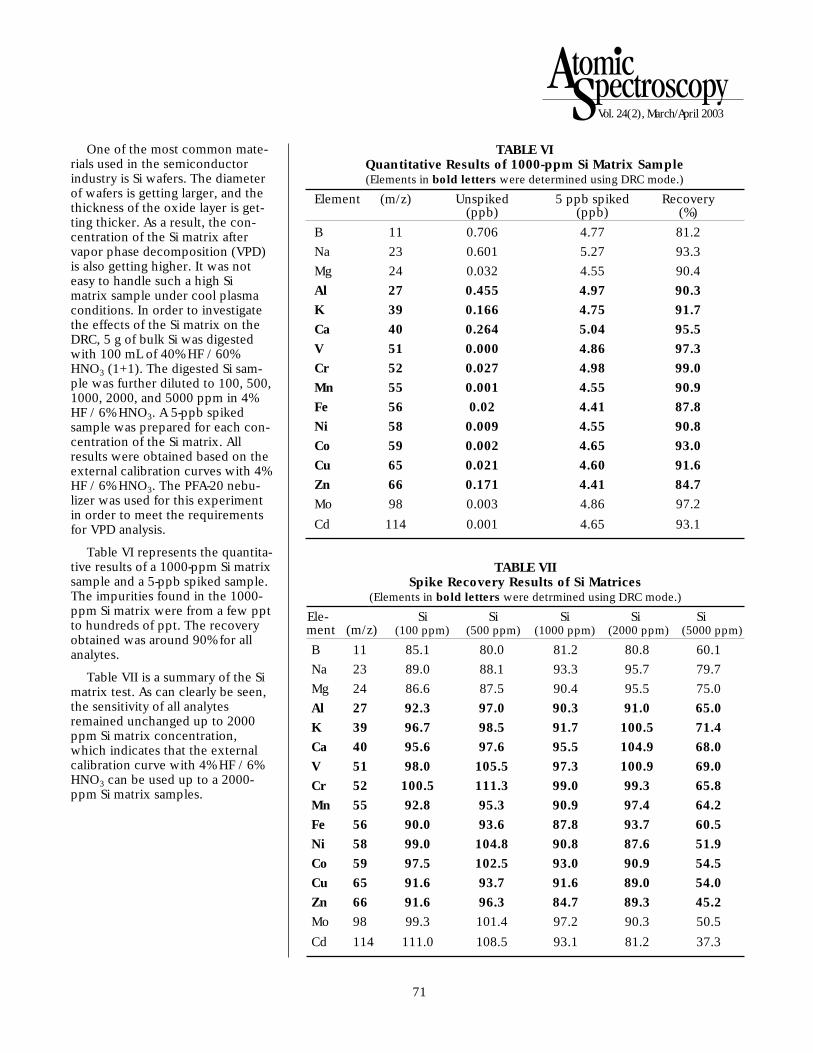
71
Vol. 24(2), March/April 2003
One of the most common mate-rials used in the semiconductorindustry is Si wafers. The diameterof wafers is getting larger, and thethickness of the oxide layer is get-ting thicker. As a result, the con-centration of the Si matrix aftervapor phase decomposition (VPD)is also getting higher. It was noteasy to handle such a high Simatrix sample under cool plasmaconditions. In order to investigatethe effects of the Si matrix on theDRC, 5 g of bulk Si was digestedwith 100 mL of 40% HF / 60%HNO3 (1+1). The digested Si sam-ple was further diluted to 100, 500,1000, 2000, and 5000 ppm in 4%HF / 6% HNO3. A 5-ppb spikedsample was prepared for each con-centration of the Si matrix. Allresults were obtained based on theexternal calibration curves with 4%HF / 6% HNO3. The PFA-20 nebu-lizer was used for this experimentin order to meet the requirementsfor VPD analysis.
Table VI represents the quantita-tive results of a 1000-ppm Si matrixsample and a 5-ppb spiked sample.The impurities found in the 1000-ppm Si matrix were from a few pptto hundreds of ppt. The recoveryobtained was around 90% for allanalytes.
Table VII is a summary of the Simatrix test. As can clearly be seen,the sensitivity of all analytesremained unchanged up to 2000ppm Si matrix concentration,which indicates that the externalcalibration curve with 4% HF / 6%HNO3 can be used up to a 2000-ppm Si matrix samples.
TABLE VIQuantitative Results of 1000-ppm Si Matrix Sample(Elements in bold letters were determined using DRC mode.)
Element (m/z) Unspiked 5 ppb spiked Recovery (ppb) (ppb) (%)
B 11 0.706 4.77 81.2
Na 23 0.601 5.27 93.3
Mg 24 0.032 4.55 90.4
Al 27 0.455 4.97 90.3
K 39 0.166 4.75 91.7
Ca 40 0.264 5.04 95.5
V 51 0.000 4.86 97.3
Cr 52 0.027 4.98 99.0
Mn 55 0.001 4.55 90.9
Fe 56 0.02 4.41 87.8
Ni 58 0.009 4.55 90.8
Co 59 0.002 4.65 93.0
Cu 65 0.021 4.60 91.6
Zn 66 0.171 4.41 84.7
Mo 98 0.003 4.86 97.2
Cd 114 0.001 4.65 93.1
TABLE VIISpike Recovery Results of Si Matrices
(Elements in bold letters were detrmined using DRC mode.)
Ele- Si Si Si Si Si ment (m/z) (100 ppm) (500 ppm) (1000 ppm) (2000 ppm) (5000 ppm)
B 11 85.1 80.0 81.2 80.8 60.1
Na 23 89.0 88.1 93.3 95.7 79.7
Mg 24 86.6 87.5 90.4 95.5 75.0
Al 27 92.3 97.0 90.3 91.0 65.0
K 39 96.7 98.5 91.7 100.5 71.4
Ca 40 95.6 97.6 95.5 104.9 68.0
V 51 98.0 105.5 97.3 100.9 69.0
Cr 52 100.5 111.3 99.0 99.3 65.8
Mn 55 92.8 95.3 90.9 97.4 64.2
Fe 56 90.0 93.6 87.8 93.7 60.5
Ni 58 99.0 104.8 90.8 87.6 51.9
Co 59 97.5 102.5 93.0 90.9 54.5
Cu 65 91.6 93.7 91.6 89.0 54.0
Zn 66 91.6 96.3 84.7 89.3 45.2
Mo 98 99.3 101.4 97.2 90.3 50.5
Cd 114 111.0 108.5 93.1 81.2 37.3

72
CONCLUSION
The DRC technique using a hot-ter plasma showed clear benefitsfor the analysis of various chemicalsand materials used in the semicon-ductor industry. The hotter plasmawas more robust for different con-centrations of chemicals and matri-ces. The external calibration curvewith one or two matrices can beapplied for the analysis of almost allkinds of chemicals and materialsused in the semiconductor indus-try, which minimizes the cumber-some sample preparation steps andthe risk of contamination. The DRCtechnique using NH3 as the reac-tion gas can eliminate not only theinterferences removed by conven-tional cool plasma conditions, butalso those interferences known tobe difficult to remove by conven-tional quadrupole ICP-MS.
REFERENCES
1. K. Sakata and K. Kawabata, "Reduc-tion of fundamental polyatomicions in inductively coupled massspectrometry", SpectrochimicaActa 49B, No. 10, 1027 – 1038(1994).
2. S.D, Tanner and V.I. Baranov, "The-ory, design, and operation of adynamic reaction cell for ICP-MS,"At. Spectrosc. 20(2), 45 – 52(1999).
3. P. Turner, T. Merren, J. Speakman,and C. Haines, "Interface studiesin the ICP-MS spectrometer," inPlasma Source Mass Spectrometry:Development and Applications, G.Holland et al., The Royal Societyof Chemistry, Cambridge (UK), 28– 34 (1997).
4. I. Feldmann, N. Jakubowski, C.Thomas, and Stuewer, Fresenius’J. Anal. Chem. 365, 422 – 428(1999).
5. J.T. Rowan and R.S. Houk, "Attenua-tion of polyatomic ion interfer-ences in inductively coupledplasma mass spectrometry by gas-phase collisions," Appl. Spectrosc.43, 976 – 980 (1989).

73Atomic SpectroscopyVol. 24(2), March/April 2003
How Low Can Impurities in Pure Water be Analyzed by ICP-MS?*
Katsu Kawabata and Yoko KishiPerkinElmer Life and Analytical Sciences
71 Four Valley Drive, Concord, ON, Canada L4K 4V8
INTRODUCTION
Inductively coupled plasma massspectrometry (ICP-MS) has beenused for the determination of ultratrace metallic impurities in variouschemicals and materials used in thesemiconductor field for the past 15 years. Although several interfer-ences on ICP-MS, such as 40Ar16O,40Ar, 38Ar1H, 40Ar12C, and 12C12C,can be eliminated by employingthe cool plasma technique, thereare still some elements, such as B,Si, P, and Ti, that make ultra tracelevel determinations difficult.
One reason for the difficulty indetermining these elements atultra-trace levels is the polyatomicion interference of N2, CO, NOH,and O3 on Si, P, and Ti, respectively.These interferences can be reducedusing the cool plasma technique,but Si, P, and Ti have a strong bondenergy with oxygen and form anoxide that cannot be decomposedunder cool plasma conditions.
The second reason is abackground due to the samplingand skimmer cones. Although veryhigh purity metals, such as Ni andPt, are used as cone material, thesemetals contain a few thousand ppmof impurities. Some of these impu-rities are evaporated and ionized bythe high-temperature plasma andthen enter the mass spectrometerthrough the action of the extrac-tion lenses, thus causing higherbackgrounds for certain elements.Typical elements which have highbackgrounds resulting from thecones are B, Na, K, Fe, and Ni. Na,K, Fe, and Ni can be minimized bythe cool plasma technique, but B
ABSTRACT
Elements such as Si, B, Fe, K,and Ca are difficult to determineat levels lower than 1 pg/mL(ppt) using ICP-MS due to a highbackground. There are twosources of background: isobaricor polyatomic ion interferencesdue to plasma Ar and samplematrices, and contaminationfrom sample introductiondevices.
Several techniques have beenused for the elimination of iso-baric and polyatomic ion interfer-ences. High resolution ICP-MScan separate analytes from inter-ferences, but some elementsrequire an extremely high resolu-tion, which sacrifices the sensi-tivity of the analytes.
The cool plasma techniquecan eliminate interferences thathave a higher ionization poten-tial, but elements having a higherionization potential or strongbond energy with oxygen cannotbe determined.
Dynamic reaction cell (DRC)technology can effectivelyreduce the interferences bychemical resolution that the coolplasma technique cannot. Inaddition, the non-extraction lensdesign allows for very low level Bdetermination.
In this paper, several sampleintroduction devices and operat-ing conditions with the DRC-ICP-MS were evaluated to reducebackground. The results of Si andB in pure waters clearly show thedifference between the multiplewater collection sites at less thanng/mL (ppb) level.
*This article was previously published inSemiconductor Pure Water and ChemicalsConference 2002. Used with permission.
cannot because of its higher ioniza-tion potential.
The third reason is backgroundfrom a sample introduction device.Although high purity material isused for the nebulizer, spray cham-ber, and torch, some background
contamination results from them.In order to eliminate backgroundspecies, DRC™-ICP-MS (DynamicReaction Cell™ inductivelycoupled plasma mass spectrometry)was used in conjunction with vari-ous sample introduction materials.In this paper, the results of B and Sidetermination will be discussed.
EXPERIMENTAL
Instrumentation
The instrumentation used forthis experiment was an ELAN®DRCPlus ICP-MS (PerkinElmerSCIEX, Concord, Ontario, Canada).The parameters and sample intro-duction devices used for this workare presented in Table I.
TABLE IOperating Parameters of the
ELAN DRCPlus and Sample Introduction Devices
Plasma gas Ar 15~20 L/min
Auxiliary gas Ar 0.6~2.0 L/min
RF power 800~1600 W
Torch Quartz (PrecisionGlassblowing)
Ceramic (GlassExpansion)
Nebulizer PFA-ST400 withself-aspiration (Elemental Scien-tific Inc.)
Nebulizer gas Ar 0.9~1.1 L/min
Spray chamber PFA Scott-type double-pass (Elemental Scien-tific Inc.)
Reaction gas NH3 0~1 mL/min
Cones Ni base with Ptinsert (two diffe-ent sizes of Ptinsert)
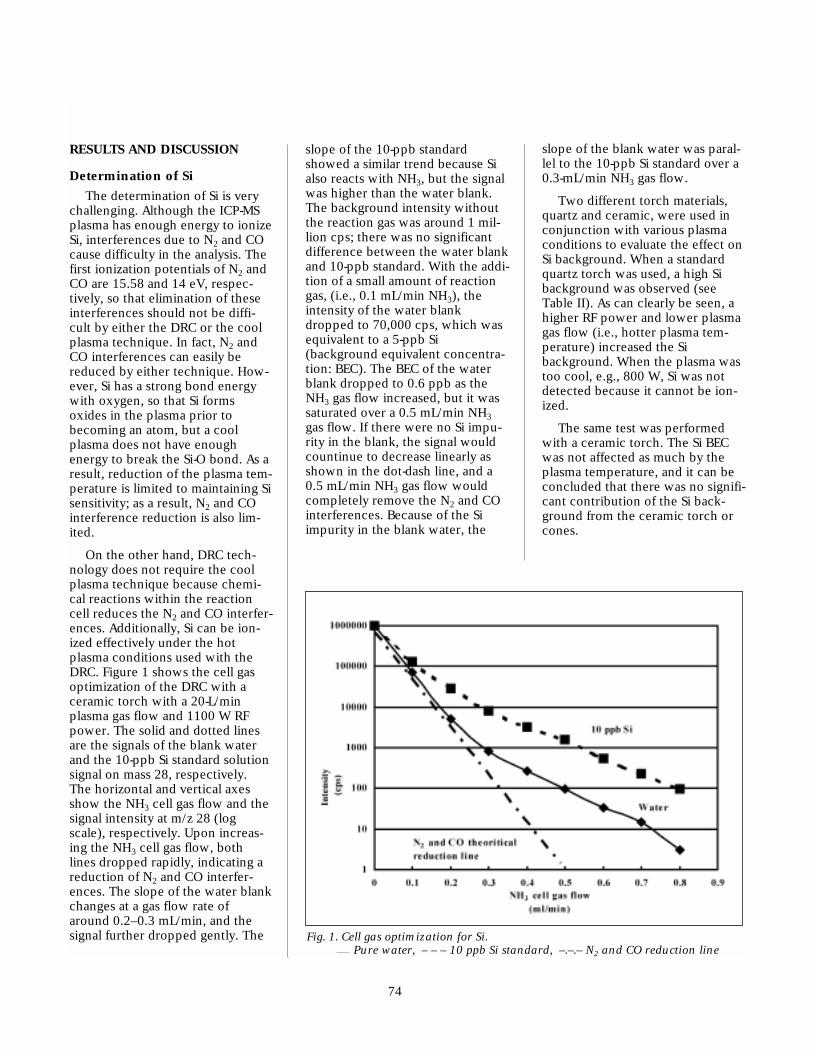
74
RESULTS AND DISCUSSION
Determination of Si
The determination of Si is verychallenging. Although the ICP-MSplasma has enough energy to ionizeSi, interferences due to N2 and COcause difficulty in the analysis. Thefirst ionization potentials of N2 andCO are 15.58 and 14 eV, respec-tively, so that elimination of theseinterferences should not be diffi-cult by either the DRC or the coolplasma technique. In fact, N2 andCO interferences can easily bereduced by either technique. How-ever, Si has a strong bond energywith oxygen, so that Si formsoxides in the plasma prior tobecoming an atom, but a coolplasma does not have enoughenergy to break the Si-O bond. As aresult, reduction of the plasma tem-perature is limited to maintaining Sisensitivity; as a result, N2 and COinterference reduction is also lim-ited.
On the other hand, DRC tech-nology does not require the coolplasma technique because chemi-cal reactions within the reactioncell reduces the N2 and CO interfer-ences. Additionally, Si can be ion-ized effectively under the hotplasma conditions used with theDRC. Figure 1 shows the cell gasoptimization of the DRC with aceramic torch with a 20-L/minplasma gas flow and 1100 W RFpower. The solid and dotted linesare the signals of the blank waterand the 10-ppb Si standard solutionsignal on mass 28, respectively.The horizontal and vertical axesshow the NH3 cell gas flow and thesignal intensity at m/z 28 (logscale), respectively. Upon increas-ing the NH3 cell gas flow, bothlines dropped rapidly, indicating areduction of N2 and CO interfer-ences. The slope of the water blankchanges at a gas flow rate ofaround 0.2–0.3 mL/min, and thesignal further dropped gently. The
slope of the 10-ppb standardshowed a similar trend because Sialso reacts with NH3, but the signalwas higher than the water blank.The background intensity withoutthe reaction gas was around 1 mil-lion cps; there was no significantdifference between the water blankand 10-ppb standard. With the addi-tion of a small amount of reactiongas, (i.e., 0.1 mL/min NH3), theintensity of the water blankdropped to 70,000 cps, which wasequivalent to a 5-ppb Si(background equivalent concentra-tion: BEC). The BEC of the waterblank dropped to 0.6 ppb as theNH3 gas flow increased, but it wassaturated over a 0.5 mL/min NH3
gas flow. If there were no Si impu-rity in the blank, the signal wouldcountinue to decrease linearly asshown in the dot-dash line, and a0.5 mL/min NH3 gas flow wouldcompletely remove the N2 and COinterferences. Because of the Siimpurity in the blank water, the
slope of the blank water was paral-lel to the 10-ppb Si standard over a0.3-mL/min NH3 gas flow.
Two different torch materials,quartz and ceramic, were used inconjunction with various plasmaconditions to evaluate the effect onSi background. When a standardquartz torch was used, a high Sibackground was observed (seeTable II). As can clearly be seen, ahigher RF power and lower plasmagas flow (i.e., hotter plasma tem-perature) increased the Sibackground. When the plasma wastoo cool, e.g., 800 W, Si was notdetected because it cannot be ion-ized.
The same test was performedwith a ceramic torch. The Si BECwas not affected as much by theplasma temperature, and it can beconcluded that there was no signifi-cant contribution of the Si back-ground from the ceramic torch orcones.
Fig. 1. Cell gas optimization for Si. Pure water, – – – 10 ppb Si standard, –.–.– N2 and CO reduction line

75
Vol. 24(2), March/April 2003
In conclusion, lowest Si back-ground was observed using thecombination of PFA-ST 400 nebu-lizer, PFA spray chamber, ceramictorch with Pt torch injector, Ptsampling and skimmer cones, 1100W RF power, and 0.5 mL/min NH3
reaction gas flow.
Figure 2 represents the calibra-tion curve used for the determina-tion of Si in water. The water usedfor the calibration was taken fromour lab. Five replicates and a 3-sec-ond integration time were used.The measurements were repeatedthree times for each calibrationpoint.
Table III summarizes the resultsof Si determination in water sam-ples from different sources. Theconcentration found is given as theBEC, which includes the concentra-tion of Si in the sample and back-ground Si from other sources. Aftercleaning the system for one day byaspirating the pure lab water theanalysis was performed. The watersamples were analyzed in the orderlisted in Table III; the calibrationcurve was obtained after analysis ofall water samples. The water sam-ples listed from A to E were bottled
at several sites and shipped to ourlab. The lab water was freshly bot-tled each time before measurement.
As can be seen, water samples Band C clearly show a higher Si sig-nal, and water E showed slightlyhigher Si results. However, thebackground level of Si still seems tobe high (Lab water), whichsuggests that the backgroundmight come from the sample intro-duction devices. Further investiga-tion into this problem will beperformed in the future.
Determination of B
The determination of B wasinvestigated using the same config-uration as for the Si experiment. Inorder to analyze B, the DRC tech-nique was not required becausethere are no isobaric or polyatomicinterferences. However, contami-nation arises from the conesbecause hotter plasmatemperatures evaporate B, andextraction lenses extract it. Withthe ELAN DRCPlus this problem isreduced due to the ion lens config-uration (Figure 3). With the DRC,
TABLE IISi Background Found with Quartz vs. Ceramic Torches
RF Plasma Quartz Quartz Ceramic power gas flow DRC mode STD mode DRC mode(W) (L/min) (ppb) (ppb) (ppb)
1600 20 70 300 2
1300 20 15 150 1
1100 20 10 120 0.6
900 20 3 50 0.8
900 17 4 55 ---
900 15 6 60 ---
800 20 --- --- ---
Fig. 2. Si cali-bration curvefrom 0-500 pptin pure water.
TABLE IIIResults of Si Determination
in Pure Water
Order Water Si BEC (ppt)
1 Lab 660
2 A 670
3 Lab 630
4 A 630
5 B 1200
6 Lab 650
7 C 1900
8 Lab 650
9 D 590
10 Lab 650
11 E 770
12 Lab 630
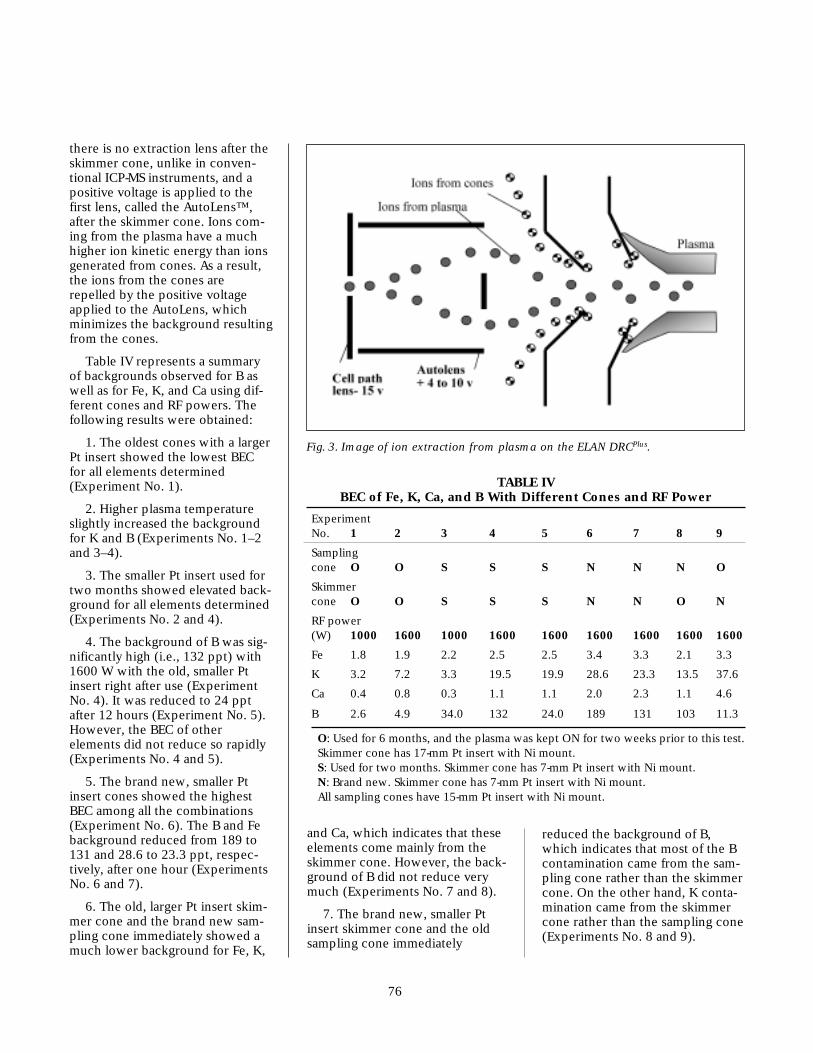
76
there is no extraction lens after theskimmer cone, unlike in conven-tional ICP-MS instruments, and apositive voltage is applied to thefirst lens, called the AutoLens™,after the skimmer cone. Ions com-ing from the plasma have a muchhigher ion kinetic energy than ionsgenerated from cones. As a result,the ions from the cones arerepelled by the positive voltageapplied to the AutoLens, whichminimizes the background resultingfrom the cones.
Table IV represents a summaryof backgrounds observed for B aswell as for Fe, K, and Ca using dif-ferent cones and RF powers. Thefollowing results were obtained:
1. The oldest cones with a largerPt insert showed the lowest BECfor all elements determined (Experiment No. 1).
2. Higher plasma temperatureslightly increased the backgroundfor K and B (Experiments No. 1–2and 3–4).
3. The smaller Pt insert used fortwo months showed elevated back-ground for all elements determined(Experiments No. 2 and 4).
4. The background of B was sig-nificantly high (i.e., 132 ppt) with1600 W with the old, smaller Ptinsert right after use (ExperimentNo. 4). It was reduced to 24 pptafter 12 hours (Experiment No. 5).However, the BEC of otherelements did not reduce so rapidly(Experiments No. 4 and 5).
5. The brand new, smaller Ptinsert cones showed the highestBEC among all the combinations(Experiment No. 6). The B and Febackground reduced from 189 to131 and 28.6 to 23.3 ppt, respec-tively, after one hour (ExperimentsNo. 6 and 7).
6. The old, larger Pt insert skim-mer cone and the brand new sam-pling cone immediately showed amuch lower background for Fe, K,
and Ca, which indicates that theseelements come mainly from theskimmer cone. However, the back-ground of B did not reduce verymuch (Experiments No. 7 and 8).
7. The brand new, smaller Ptinsert skimmer cone and the oldsampling cone immediately
reduced the background of B,which indicates that most of the Bcontamination came from the sam-pling cone rather than the skimmercone. On the other hand, K conta-mination came from the skimmercone rather than the sampling cone(Experiments No. 8 and 9).
Fig. 3. Image of ion extraction from plasma on the ELAN DRCPlus.
TABLE IVBEC of Fe, K, Ca, and B With Different Cones and RF Power
Experiment No. 1 2 3 4 5 6 7 8 9
Sampling cone O O S S S N N N O
Skimmer cone O O S S S N N O N
RF power (W) 1000 1600 1000 1600 1600 1600 1600 1600 1600
Fe 1.8 1.9 2.2 2.5 2.5 3.4 3.3 2.1 3.3
K 3.2 7.2 3.3 19.5 19.9 28.6 23.3 13.5 37.6
Ca 0.4 0.8 0.3 1.1 1.1 2.0 2.3 1.1 4.6
B 2.6 4.9 34.0 132 24.0 189 131 103 11.3
O: Used for 6 months, and the plasma was kept ON for two weeks prior to this test. Skimmer cone has 17-mm Pt insert with Ni mount.S: Used for two months. Skimmer cone has 7-mm Pt insert with Ni mount.N: Brand new. Skimmer cone has 7-mm Pt insert with Ni mount.All sampling cones have 15-mm Pt insert with Ni mount.

77
Vol. 24(2), March/April 2003
For the determination of B invarious waters, the old cones wereused, and the results are shown inTable V. The concentration foundis given as BEC, which includes theconcentration of the background.The water samples were analyzedin the order listed in the Table V.Each water sample was packed intwo different bottles at the varioussites and shipped to our lab. Bothbottles from the same site showedvery reproducible results.
CONCLUSION
The ICP-MS with a dynamic reac-tion cell demonstrated a reductionof background for the determina-tion of Si and B. The sample intro-duction devices, including torchand cones, are very critical for thereduction of the background.Unfortunately, the background of Siwas still found to be high, and weassume that it might come from thesample introduction devices, suchas the nebulizer and spray cham-ber. The authors would like toinvestigate further how to reducethe Si background for this type ofanalysis.
ACKNOWLEDGMENTS
The authors would like to thankthe companies who provided thepure water for this experiment.
REFERENCES
1. N. Bradshaw, E.F.H. Hall, and N.E.Sanderson, J. Anal. At. Spectrom.4, 801 (1989).
2. K. Sakata and K. Kawabata,Spectrochim. Acta 49B, 1027(1994).
3. S. Tanner and V. Baranov, Plasmasource mass spectrometry, TheRoyal Society of Chemistry, Cam-bridge (U.K.), p. 46 (1999).
TABLE VResults of B Determination in Pure Water
Order Water BEC (ppt) Order Water BEC (ppt)
1 Lab 2.8 9 Lab 3.7
2 A1 7.6 10 Lab 3.8
3 B1 13 11 A2 7.5
4 C1 127 12 F1 9.3
5 D1 36 13 D2 38
6 E1 41 14 B2 12
7 E2 38 15 Lab 2.2
8 A2 6.8 16 C2 123
Printed in the United States and published six times a year by:
PerkinElmer Life andAnalytical Sciences710 Bridgeport AvenueShelton, CT 06484-4794 USAwww.perkinelmer.com
Editor
Anneliese LustE-mail: [email protected]
Technical Editors
Glen R. Carnrick, AASusan A. McIntosh, ICPKenneth R. Neubauer, ICP-MS
SUBSCRIPTION INFORMATIONAtomic SpectroscopyP.O. Box 3674Barrington, IL 60011 USAFax: +1 (847) 304-6865
2003 Subscription Rates• U.S. $60.00 includes third-class
mail delivery worldwide; $20.00 extra for electronic file.
• U.S. $80.00 includes airmail delivery; $20 extra for electronic file.
• U.S. $60.00 for electronic file only.• Payment by check (drawn on U.S.
bank in U.S. funds) made out to: “Atomic Spectroscopy”
Electronic File• For electronic file, send request
via e-mail to:[email protected]
Back Issues/Claims• Single back issues are available
at $15.00 each.• Subscriber claims for missing
back issues will be honoredat no charge within 90 daysof issue mailing date.
Address Changes to:Atomic SpectroscopyP.O. Box 3674Barrington, IL 60011 USA
Copyright © 2003PerkinElmer, Inc.All rights reserved.www.perkinelmer.com
MicrofilmAtomic Spectroscopy issues are available from:University Microfilms International300 N. Zeeb RoadAnn Arbor, MI 48106 USATel: (800) 521-0600 (within the U.S.)+1 (313) 761-4700 (internationally)
Guidelines for Authors
AtomicSpectroscopy
Atomic Spectroscopy serves as a medium for the disseminationof general information togetherwith new applications and analytical data in atomicabsorption spectrometry.
The pages of Atomic Spectroscopy are open to allworkers in the field of atomicspectroscopy. There is no chargefor publication of a manuscript.
The journal has around 3000subscribers on a worldwidebasis, and its success can beattributed to the excellentcontributions of its authors aswell as the technical guidanceof its reviewers and theTechnical Editors.
The original of the manuscriptshould be submitted to theeditor by mail plus electronic fileon disk or e-mail in the followingmanner:1. Mail original of text, double-
spaced, plus graphics inblack/white.
2. Provide text and tables in .docfile and figures in .doc or .tiffiles.
3. Number the references in theorder they are cited in the text.
4. Include bibliography.5. Submit original drawings
or glossy photographs and figure captions.
6. Consult a current copy ofAtomic Spectroscopy for format.
7. E-mail text and tables in.doc file and graphics in .docor .tif files to the editor:[email protected] [email protected] manuscripts are sent to two
reviewers. If there is disagreement,a third reviewer is consulted.
Minor changes in style are madein-house and submitted to theauthor for approval.
A copyright transfer form issent to the author for signature.
If a revision of the manuscriptis required before publication canbe considered, the paper isreturned to the author(s) withthe reviewers’ comments.
In the interest of speed ofpublication, a typeset copy isfaxed to the correspondingauthor for final approval.
Before publication, a pdf file ofthe typeset copy will be e-mailedto the corresponding author forfinal approval.
Additional reprints can bepurchased, but the requestmust be made at the time themanuscript is approved forpublication.
Anneliese LustEditor, Atomic SpectroscopyPerkinElmerLife and Analytical Sciences710 Bridgeport AvenueShelton, CT 06484-4794 USA
Vol. 24(2), March/April 2003
006809
PerkinElmer is a registered trademark and Dynamic Reaction Cell, Axial Field, AutoRes,SimulScan, DRC, PathFinder, AutoLens, and SIMAA are trademarks of PerkinElmer, Inc.SCIEX, ELAN, and PlasmaLok are registered trademarks of MDS Inc., a division of MDS Inc.Milli-Q is a trademark of Millipore Corporation.Registered names and trademarks, etc. used in this publication even without specific indication thereof are not to be considered unprotected by law.