atia-iswa iii beacon conference “management of biowaste
TRANSCRIPT
ATIA-ISWA III Beacon Conference“Management of Biowaste, recovery of organic
substances, mitigation of climate change: DEFINING STRATEGIES, ACHIEVING RESULTS ”
Perugia (Italy) 15 th – 16th April 2010
Especial Session – The road to success: Case histories in biowaste management
The case of Catalonia. The growing experience of 17 years
Francesc Giró i FontanalsDepartament de Gestió de Matèria Orgànica
Agència de Residus de Catalunya
2
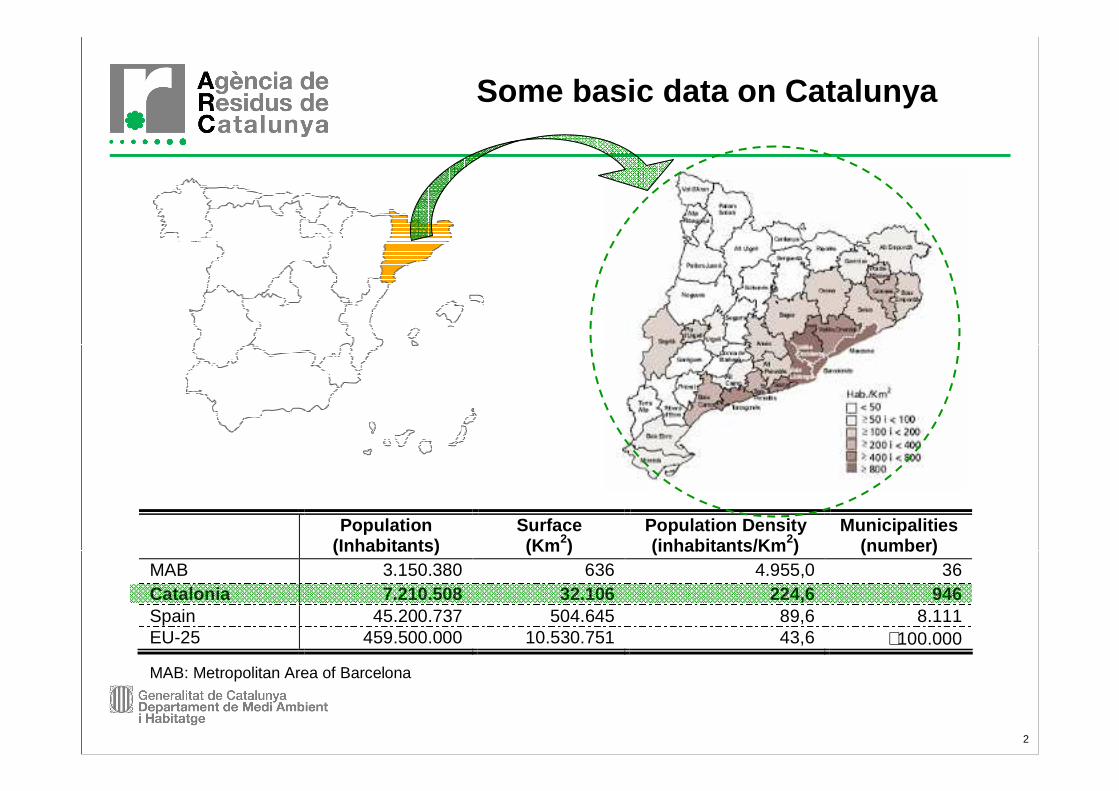
Some basic data on Catalunya
Population (Inhabitants)
Surface (Km 2)
Population Density (inhabitants/Km 2)
Municipalities (number)
MAB 3.150.380 636 4.955,0 36 Catalonia 7.210.508 32.106 224,6 946 Spain 45.200.737 504.645 89,6 8.111 EU-25 459.500.000 10.530.751 43,6 ∼100.000
MAB: Metropolitan Area of Barcelona

3
• Evolution of generation and management of MSW 1995-200 8
MSW Generation Separate Collection Mixed MSW
34,4 %
Some general data on Municipal Waste in Catalunya [2001-2008]
1,59 kg /inhab · day

4
• How to get an optimised approach for separate collection of Biowaste ?– MANDATES– TARGETS– ECONOMIC PRESSURE– A MIX OF ALL THEM
Tools & strategies for the implementation of Biowaste separate collection
• High captures of biowaste• High quality of biowaste (low % impurities)• To avoid the increase of waste generation• Contention of costs• Fulfil diversion targets of biodegradable
waste of the Landfill Directive
What does mean OPTIMISATION?
5
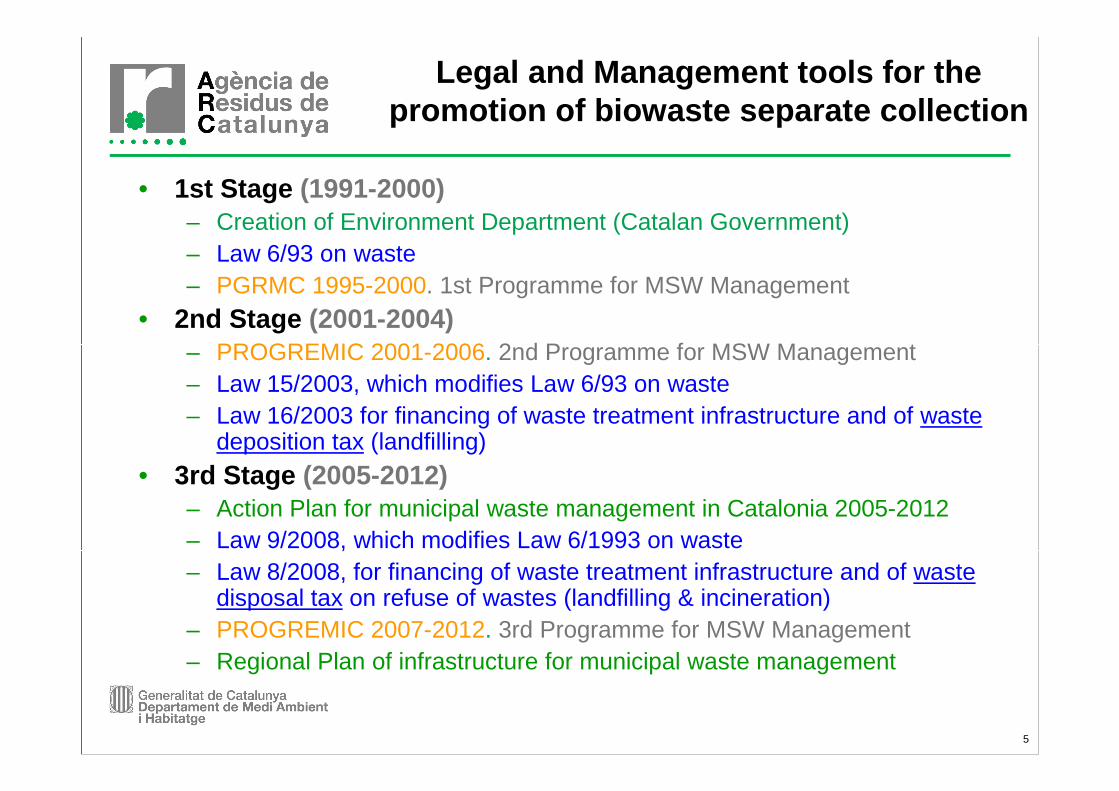
• 1st Stage (1991-2000)– Creation of Environment Department (Catalan Government)– Law 6/93 on waste– PGRMC 1995-2000. 1st Programme for MSW Management
• 2nd Stage (2001-2004)– PROGREMIC 2001-2006. 2nd Programme for MSW Management– Law 15/2003, which modifies Law 6/93 on waste– Law 16/2003 for financing of waste treatment infrastructure and of waste
deposition tax (landfilling)
• 3rd Stage (2005-2012)– Action Plan for municipal waste management in Catalonia 2005-2012– Law 9/2008, which modifies Law 6/1993 on waste– Law 8/2008, for financing of waste treatment infrastructure and of waste
disposal tax on refuse of wastes (landfilling & incineration)– PROGREMIC 2007-2012. 3rd Programme for MSW Management– Regional Plan of infrastructure for municipal waste management
Legal and Management tools for the promotion of biowaste separate collection

6
20 working plants + 9 new plants [C or AD]+ 30 MBT Plants707 M€
14 working plants (C)15 new plants35.000 Milions Ptes (210 M€)
46 composting plants (C)23.000 Milions Ptes (138 M€)
Investment
Reduction: 2% on weight Total Material Recovery :55 % on weightImpurities < 15 %
Material Recovery :40 % on weight (2003)55 % on weight (2006)
Separate Collection :10 % on weight (1996-1997)50 % on weight (1998-2000)
Targets
Road ContainerDoor to Door (Porta a Porta)Collection Points (Deixalleries)Collection of Commercial Waste
Road Container [Biowaste + Residual Waste] [Glass + Paper + Packaging]Collection Points (Deixalleries)
Schemes
PROGREMIC 2007-2012
PROGREMIC 2000-2006
Programa de Gestióde ResidusMunicipals 1995-2000
Legal and Management tools for the promotion of biowaste separate collection

7
36 % Biowaste
18 % Paper
7 % Glass
12 % Light Packaging
27 % Other• Separate collection of:
– Glass
– Paper-cardboard– Light packaging– Biowaste (FORM + FV)
• Biological Treatment [BT] thorough Composting [C] and/or Anaerobic Digestion [AD]
• Collection of RESIDUAL WASTE:– Mechanical-Biological Treatments [MBT]
• Grey Composting. • Stabilisation before landfilling• Bio-drying before incineration
PROGREMIC 2007-2012.Municipal Waste: Composition &
Management Options
Flexibility Approach !!!

8
PROGREMIC 2007-2012. Generation of Biodegradable waste in Catalunya
• Generation of Biodegradable Waste in Catalunya ���� POTENTIAL (100%)
– FORM+FV About 1.540.000 T / year– Paper-Cardboard About 770.000 T / year– TOTAL Biodegradable Waste About 2.310.000 T / ye ar
Generation of Municipal Waste (2008) ���� 4.276.000 T / year
36 % Biowaste(FORM+FV)
18 % Paper-Cardboard
7 % Glass
12 % Light Packaging
27 % Other
Biodegradable Waste54 %
9
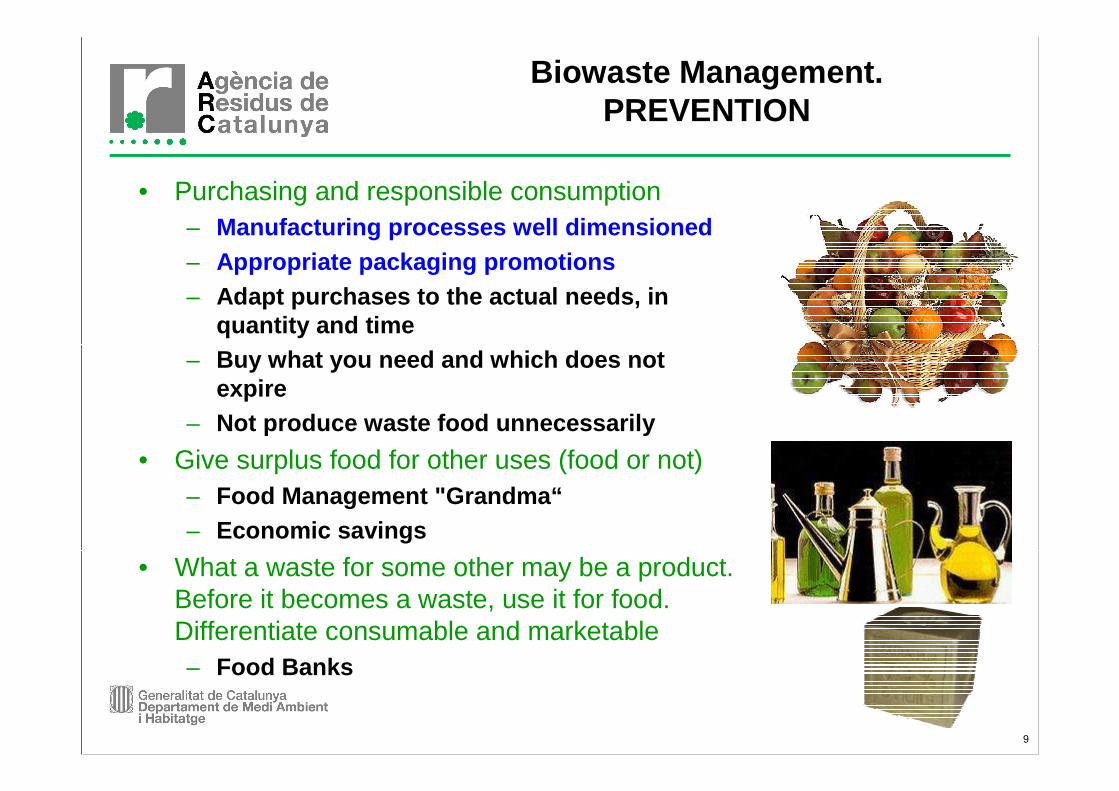
• Purchasing and responsible consumption– Manufacturing processes well dimensioned– Appropriate packaging promotions– Adapt purchases to the actual needs, in
quantity and time– Buy what you need and which does not
expire– Not produce waste food unnecessarily
• Give surplus food for other uses (food or not)– Food Management "Grandma“– Economic savings
• What a waste for some other may be a product. Before it becomes a waste, use it for food. Differentiate consumable and marketable– Food Banks
Biowaste Management.PREVENTION

10
• Managing biowaste at source– Home composting
• Households• Communities
Biowaste Management.PREVENTION

11
Biowaste Management.PREVENTION & Separate Collection
• Managing biowaste at source– Use of compostable bags jointly
with aerated buckets for biowaste collection

12
• Law 8/2008, for financing of waste treatment infrastruc ture and of waste disposal tax on refuse of wastes (landfilling & incineration)– Tax 10 € / Tonne (landfilled) [∼ 25 Millones €uros]
– Tax 5 € / Tonne (incinerated) [∼ 3,5 Millones €uros]– Guide for local authorities about Law 16/2003 on funding of the
waste treatment infrastructures and of the tax on landfilling (annually reviewed), which includes the Tax refund criteria :
• Biowaste Treatment [33,5 € / T]• Biowaste Collection [12,0 € / T] x f1 x f2
• Qualitative factor (f1)
• Population factor (f2)
– If Biowaste separate collection was not implemented in accordance a implementation plan, the tax is increased in 10 €/Tonne
Economic Tools & strategies for the implementation & optimisation of
Biowaste separate collection

13
Economic Tools & strategies for the implementation & optimisation of
Biowaste separate collection
• Subsidies to local authorities for promote Biowaste S eparate Collection [50 M € since 2004]– Technical project
– Promotion & campaign
– Containers, Buckets, Compostable bags– Collection vehicles
– Home composting
– Transfer points

14
• TRANSPARENCY & PUBLIC INFORMATION– Implementation of Biowaste Separate Collection
• http://www.arc-cat.net/webarc/jsp/formimpl/ca/cercarmunicipis.jsf
Other tools & strategies for the implementation & optimisation of
Biowaste separate collection
15
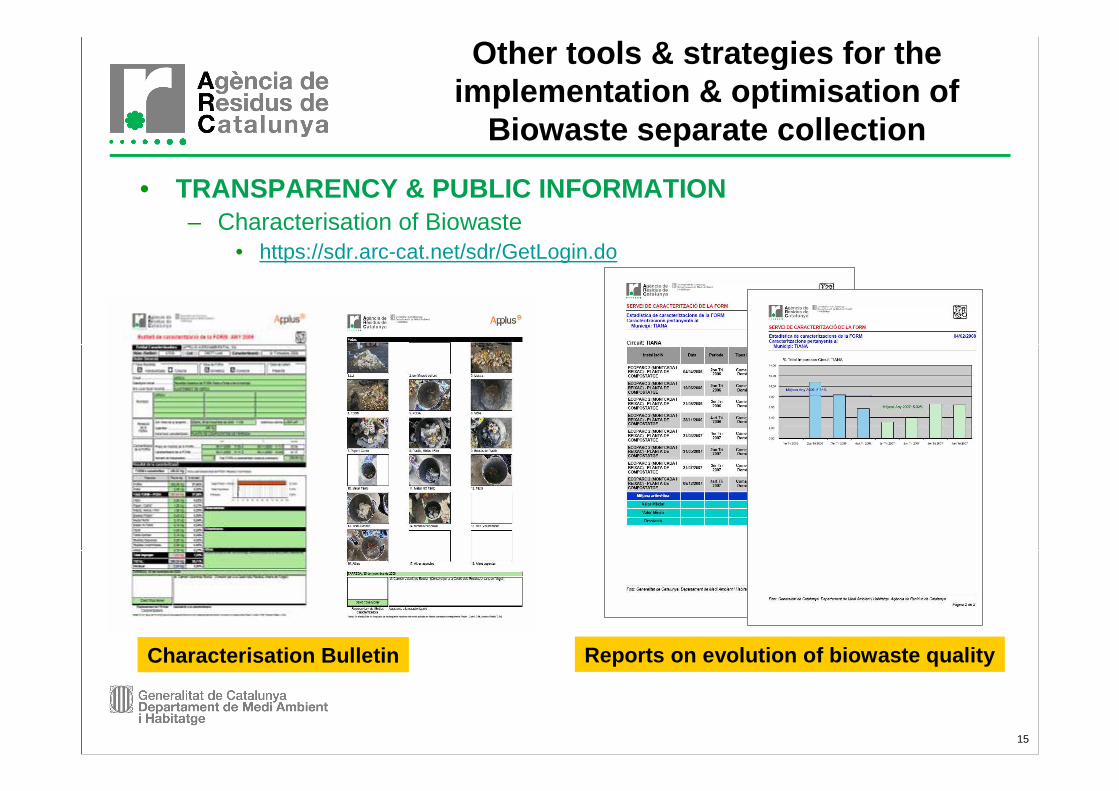
• TRANSPARENCY & PUBLIC INFORMATION– Characterisation of Biowaste
• https://sdr.arc-cat.net/sdr/GetLogin.do
Characterisation Bulletin Reports on evolution of biowaste quality
Other tools & strategies for the implementation & optimisation of
Biowaste separate collection

16
• TRANSPARENCY & PUBLIC INFORMATION– Amount of Biowaste by municipality, region, plant
Introduction of data (INPUT & OUTPUT) per plant and month
Other tools & strategies for the implementation & optimisation of
Biowaste separate collection

17
• TRANSPARENCY & PUBLIC INFORMATION– Amount of Biowaste by municipality, region, plant
Annual Report for all plants
Other tools & strategies for the implementation & optimisation of
Biowaste separate collection
18
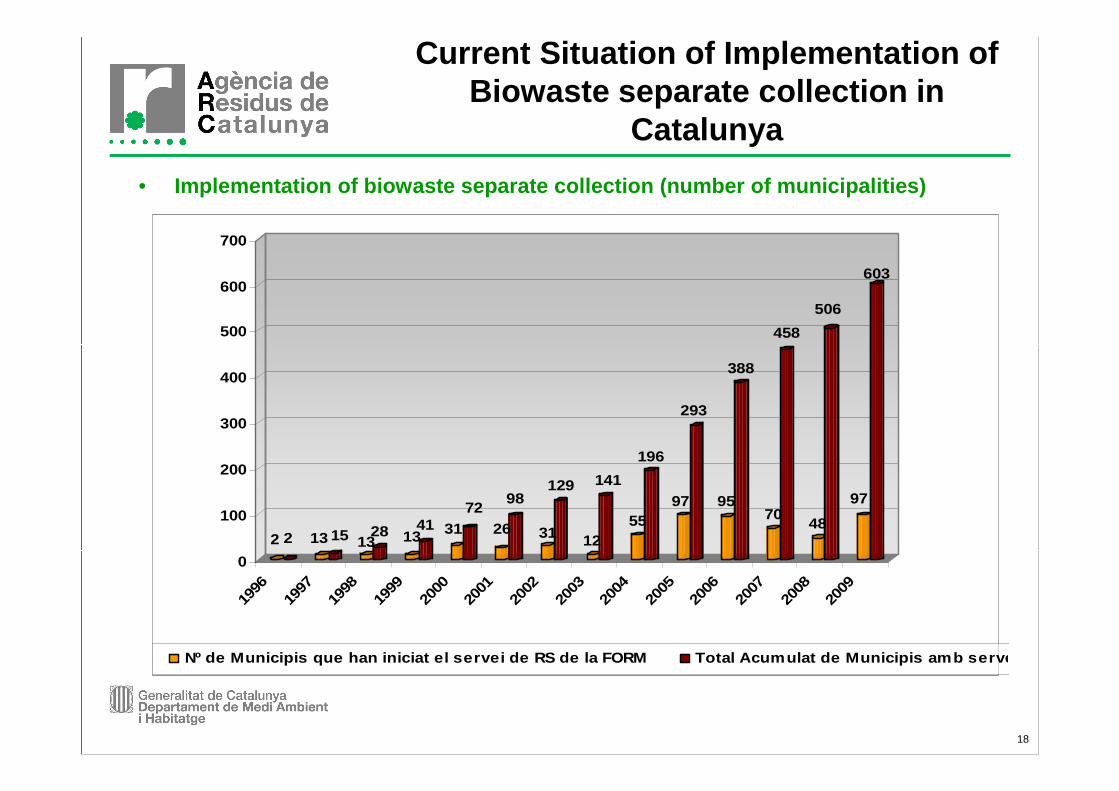
• Implementation of biowaste separate collection (num ber of municipalities)
2 2 13 15 1328 13
41 3172
26
98
31
129
12
141
55
196
97
293
95
388
70
458
48
506
97
603
0
100
200
300
400
500
600
700
1996
1997
1998
1999
2000
2001
2002
2003
2004
2005
2006
2007
2008
2009
Nº de Municipis que han iniciat el servei de RS de la FORM Total Acumulat de Municipis amb servei de RS de la FORM
Current Situation of Implementation of Biowaste separate collection in
Catalunya
19
0
20
40
60
80
100
Nº de
mun
icipis q
ue in
icien
el ser
vei d
e RS d
e la
FO
RM
1996
1997
1998
1999
2000
2001
2002
2003
2004
2005
2006
2007
2008
2009
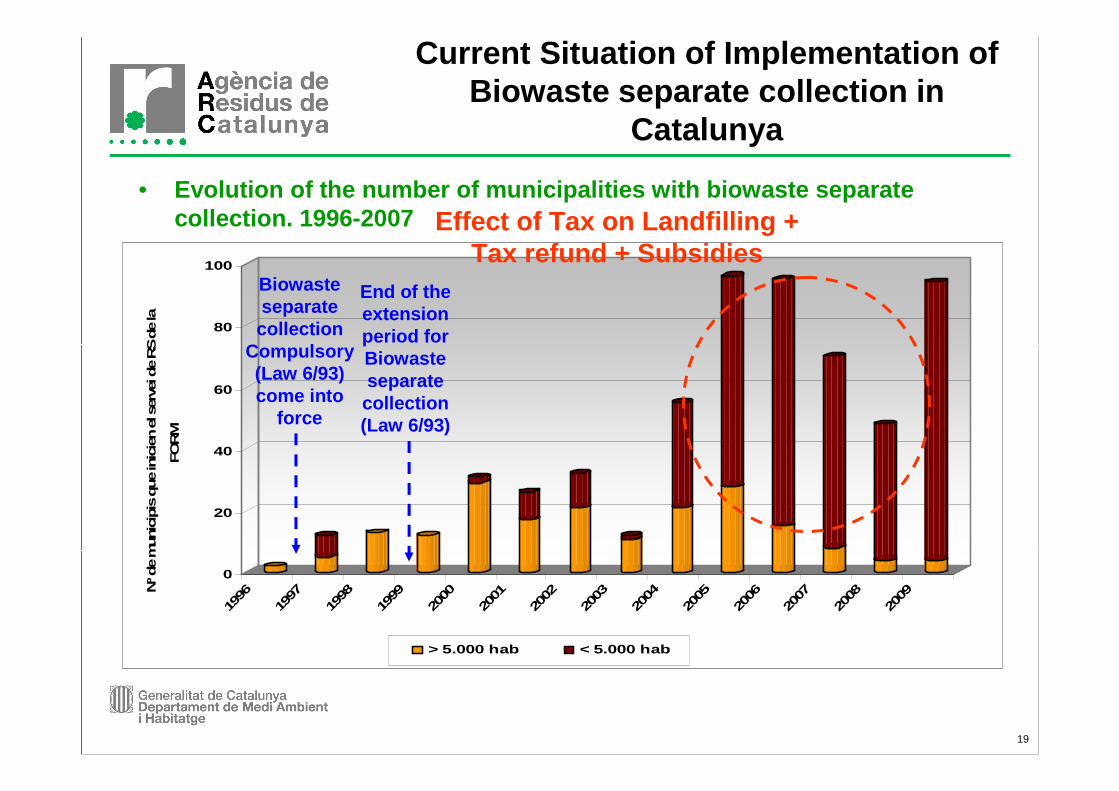
> 5.000 hab < 5.000 hab
Effect of Tax on Landfilling + Tax refund + Subsidies
Biowaste separate collection
Compulsory(Law 6/93)come into
force
End of the extension period for Biowaste separate collection (Law 6/93)
• Evolution of the number of municipalities with biow aste separatecollection. 1996-2007
Current Situation of Implementation of Biowaste separate collection in
Catalunya
20
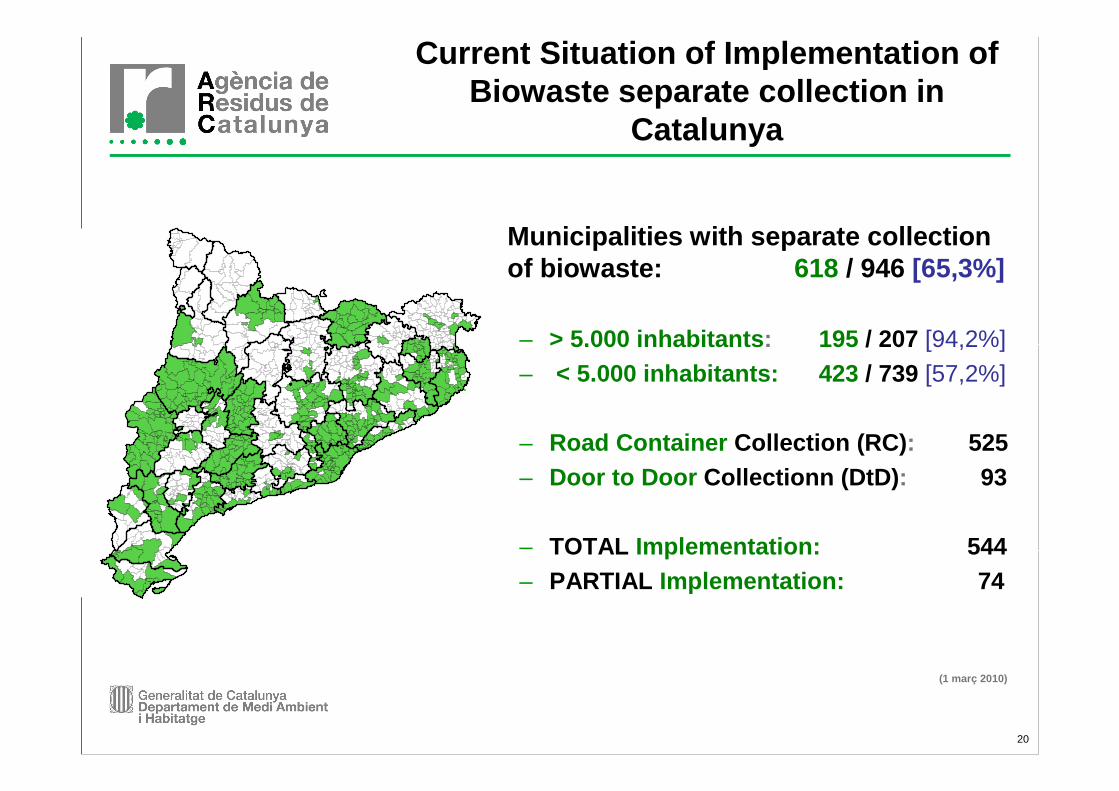
• Municipalities with separate collection of biowaste: 618 / 946 [65,3%]
– > 5.000 inhabitants : 195 / 207 [94,2%]
– < 5.000 inhabitants: 423 / 739 [57,2%]
– Road Container Collection (RC) : 525– Door to Door Collectionn (DtD) : 93
– TOTAL Implementation: 544– PARTIAL Implementation: 74
(1 març 2010)
Current Situation of Implementation of Biowaste separate collection in
Catalunya

21
Biowaste Separate Collection Quantitative Ratio in relation to population size and collection system [183 municipa lities; year 2004]
0
100
200
300
400
500
600
0 25000 50000 75000 100000 125000
Inhabitants
g B
iow
ast /
inh
ab d
ay
Door to Door Road Container
0
0,5
1
1,5
2
2,5
3
3,5
4
kg B
iow
ast /
inh
ab w
eek
0
20
40
60
80
100
120
140
160
180
200
kg B
iow
ast /
inh
ab y
ear
Outcomes on separate collection of Biowaste: Quantity , Quality

22
Biowaste Separate Collection Qualitative Ratio in r elation to population size and collection system [183 municipa lities; year 2004]
70,00
75,00
80,00
85,00
90,00
95,00
100,00
0 25000 50000 75000 100000 125000 150000
Inhabitants
% P
urity
Door to Door Road Container
Outcomes on separate collection of Biowaste: Quantity, Quality

23
• % Impurities ( Arithmetic Average & Weighted Average )
267.991
15,1 % *
315.803
10,8 % *
1.226
2008
291.250
14,6 % *
341.160
9,2 % *
1.336
2009
n.d.
n.d.
302.629
10,3 % *
1.121
2007
n.d.
n.d.
258.729
15,0 %
981
2006
173.715134.341“Clean” Biowasteseparate collection (in T)
22,2 %23,8 %% Total Impurities (Weighted Average)
220.172176.301“Gross” Biowasteseparate collection (in T)
14,3 %14,2 %% Total Impurities (Arithmetic Average)
732428Characterizations
20052004
* Since year 2007 it is used a corrective factor for paper-cardboard and plastic bags due to the presence of water in those fractions
ProvisionalData
Outcomes on separate collection of Biowaste: Quantity, Quality

24
Outcomes on separate collection of Biowaste: Quantity, Quality
0
5
10
15
20
25
30
35
40
45
50
55
60
65
0 200 400 600 800 1000 1200 1400
% Im
purit
ies
27,9 %36,2 %
16,6 %7,3%
3,7 % 8,3 %
Characterization of 1323 samples of Biowaste [Year 2009]

25
% Vidre8%
% Paper-Cartró13%
% Plàstic, Mixtos i Film23%
% Bosses Plàstic14%
% Metall Fèrric4%
% Metall no Fèrric2%
% Tèxtil8%
% Tèxtil-Sanitari10%
% Residus Especials1%
% Residus Voluminosos5%
% Residus Altres12%
0%
10%
20%
30%
40%
50%
60%
70%
80%
90%
100%
Average 1323 characterisations
Biowaste Impurities
Outcomes on separate collection of Biowaste: Quantity, Quality

26
Effects of different schemes of separate collection o n the overall separate collection rates in Catalunya
Glass , Paper-Cardboard , Packaging
& BIOWASTE (at least BIOWASTEand mixed MSW collectedDOOR TO DOOR )
Glass , Paper-Cardboard , Packaging
& BIOWASTE collected by means of ROAD CONTAINERS
Glass , Paper-Cardboard , Packagingcollected by means of ROAD CONTAINERS
20 %
35 %
70 %
Outcomes on separate collection of Municipal Waste: Quantity

27
Overall separate collection (in %) before and after the implem entationof Door to Door (PORTA A PORTA) collection
BEFOREAFTER
Outcomes on separate collection of Municipal Waste: Quantity
www.portaaporta.cat

28
7. Separate collection of Biowaste: implementation, Quantity, Quality
Efficiency linked to collection system
DtD
RC
RC
RC
RC
RC
DtD: Door to Door Collection RC: Road Container
MSW Generation in Tonnes
Municipality BIOWASTE Mixed MSW BiowasteCapture
High quality
Reduce collectionfrequency of Residual
Waste; avoids costincrease
High capture
29
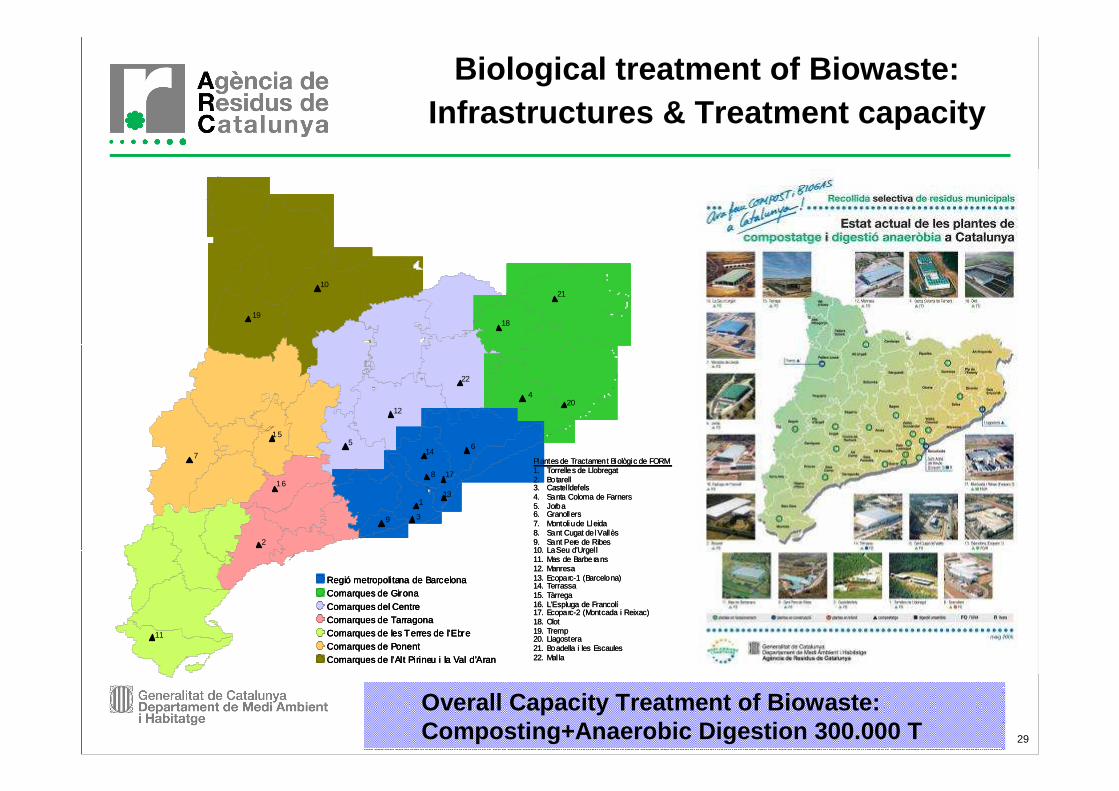
Regió metropolitana de BarcelonaComarques de GironaComarques del CentreComarques de TarragonaComarques de les Terres de l’EbreComarques de PonentComarques de l’Alt Pirineu i la Val d’Aran
Plantes de Tractament Biològic de FORM1. Torrelles de Llobregat2. Botarell3. Castel ldefels4. Santa Coloma de Farners5. Jorba6. Granollers7. Montoliu de Lleida8. Sant Cugat del Vallès9. Sant Pere de Ribes10. La Seu d’Urgel l11. Mas de Barberans12. Manresa13. Ecoparc-1 (Barcelona)14. Terrassa15. Tàrrega16. L’Espluga de Francolí17. Ecoparc-2 (Montcada i Reixac)18. Olot19. Tremp20. Llagostera21. Boadella i les Escaules22. Mal la
15
12
11
10
9
8
765
4
3
2
19
113
1617
18
14
20
22
21
Regió metropolitana de BarcelonaComarques de GironaComarques del CentreComarques de TarragonaComarques de les Terres de l’EbreComarques de PonentComarques de l’Alt Pirineu i la Val d’Aran
Regió metropolitana de BarcelonaComarques de GironaComarques del CentreComarques de TarragonaComarques de les Terres de l’EbreComarques de PonentComarques de l’Alt Pirineu i la Val d’Aran
Plantes de Tractament Biològic de FORM1. Torrelles de Llobregat2. Botarell3. Castel ldefels4. Santa Coloma de Farners5. Jorba6. Granollers7. Montoliu de Lleida8. Sant Cugat del Vallès9. Sant Pere de Ribes10. La Seu d’Urgel l11. Mas de Barberans12. Manresa13. Ecoparc-1 (Barcelona)14. Terrassa15. Tàrrega16. L’Espluga de Francolí17. Ecoparc-2 (Montcada i Reixac)18. Olot19. Tremp20. Llagostera21. Boadella i les Escaules22. Mal la
15
12
11
10
9
8
765
4
3
2
19
113
1617
18
14
20
22
21
Biological treatment of Biowaste: Infrastructures & Treatment capacity
Overall Capacity Treatment of Biowaste:Composting+Anaerobic Digestion 300.000 T

30
• According to the experience of Catalunya it can be a ssumed that:– The adoption of specific legislation on biowaste separate collection
and Tax on landfilling has been essential for developing Biowaste recycling
– Separate collection of Biowaste can be seen as a co mfortable & friendly task when compostable bags and small ventilated bucketsare used
– Separate collection of Biowaste should be implemented thorough an integrated way to optimize sorting schemes, reducing the collection of residual waste, and avoid the increase of collection costs
– The continuous evaluation of biowaste separate collection performance is an important tool to improve the system
– Both the tax refund criteria and the treatment fees -linked to quality of biowaste- , are contributing to improve biowaste quality
– Separate collection of Biowaste allows for a significant increase the overall separate collection rates of paper, glass, packaging, etc.
– Door to Door collection has shown to be the most efficient system
Conclusions
ATIA-ISWA III Beacon Conference“Management of Biowaste, recovery of organic
substances, mitigation of climate change: DEFINING STRATEGIES, ACHIEVING RESULTS ”
Perugia (Italy) 15 th – 16th April 2010
The case of Catalonia. The growing experience of 17 years
Francesc Giró i FontanalsDepartament de Gestió de Matèria Orgànica
Agència de Residus de Catalunya
Grazie tante per l’attenzione !!!