sepa- report on biowaste
TRANSCRIPT
8/12/2019 SEPA- Report on Biowaste
http://slidepdf.com/reader/full/sepa-report-on-biowaste 1/95
The Evaluation of Energy fromBiowaste Arisings and ForestResidues in Scotland
Report to SEPA
ED 02806
Issue Number 1Date April 2008

8/12/2019 SEPA- Report on Biowaste
http://slidepdf.com/reader/full/sepa-report-on-biowaste 2/95
8/12/2019 SEPA- Report on Biowaste
http://slidepdf.com/reader/full/sepa-report-on-biowaste 3/95
The Evaluation of Energy from Biowaste ArisingsAEA/ED02806/Issue 1 and Forestry Residues in Scotland
AEA Energy & Environment iii
Title The Evaluation of Energy from Biowaste Arisings in Scotland
Customer SEPA
Customer reference R60079PUR
Confidentiality,copyright andreproduction
This report is the Copyright of SEPA and has been prepared by AEATechnology plc under contract to SEPA dated 16 March 2007. Thecontents of this report may not be reproduced in whole or in part, norpassed to any organisation or person without the specific prior writtenpermission of SEPA. AEA Technology plc accepts no liability whatsoeverto any third party for any loss or damage arising from any interpretation oruse of the information contained in this report, or reliance on any viewsexpressed therein.
File reference
Reference number ED02806
AEA Energy & EnvironmentGlengarnock Technology Centre,Caledonian Road,Lochshore Business Park,Glengarnock,Ayrshire,KA14 3DD.
t: 0870 190 6191f: 0870 190 5151
AEA Energy & Environment is a business name ofAEA Technology plc
AEA Energy & Environment is certificated to ISO9001and ISO14001
Authors Name Prab Mistry, Andy Mouat, Kirsty Campbell, Patricia
Howes
Approved by Name Colin McNaught
Signature
Date 25 April 2008

8/12/2019 SEPA- Report on Biowaste
http://slidepdf.com/reader/full/sepa-report-on-biowaste 4/95
The Evaluation of Energy from Biowaste Arisingsand Forestry Residues in Scotland AEA/ED02806/Issue 1
iv AEA Energy & Environment
8/12/2019 SEPA- Report on Biowaste
http://slidepdf.com/reader/full/sepa-report-on-biowaste 5/95
The Evaluation of Energy from Biowaste ArisingsAEA/ED02806/Issue 1 and Forestry Residues in Scotland
AEA Energy & Environment v
Executive Summary
The aim of this project was to provide SEPA with an assessment of the energy value within thebiowaste and related wastes and residues that arise in Scotland. This included an assessment of theenergy content of these waste streams and the useful energy. In this report, this refers to heat andelectricity that could be provided by using these waste streams. This study focused on the technicalpotential for energy recovery, to provide SEPA with an evidence base to support their decisionsregarding the treatment options for these types of waste. In particular, SEPA are interested in theenergy available from wastes and residues that arise in:
• Agriculture.
• Forestry residues1.
• Slaughterhouses.• Industrial and Commercial premises.
• Municipal Collections.
• Sewage Works.
The assessment methodology and assumptions were discussed in detail with SEPA and with Jacobs,who are undertaking a parallel study to develop a policy framework for the treatment of commercialand industrial wastes.
Waste volume figures were collected for each of these sectors within the 11 Waste Strategy Areas(WSAs) across Scotland. These wastes were assessed and divided, according to their suitability, foreither anaerobic digestion or thermal treatment. Estimated energy values were then calculated forconversion via these routes.
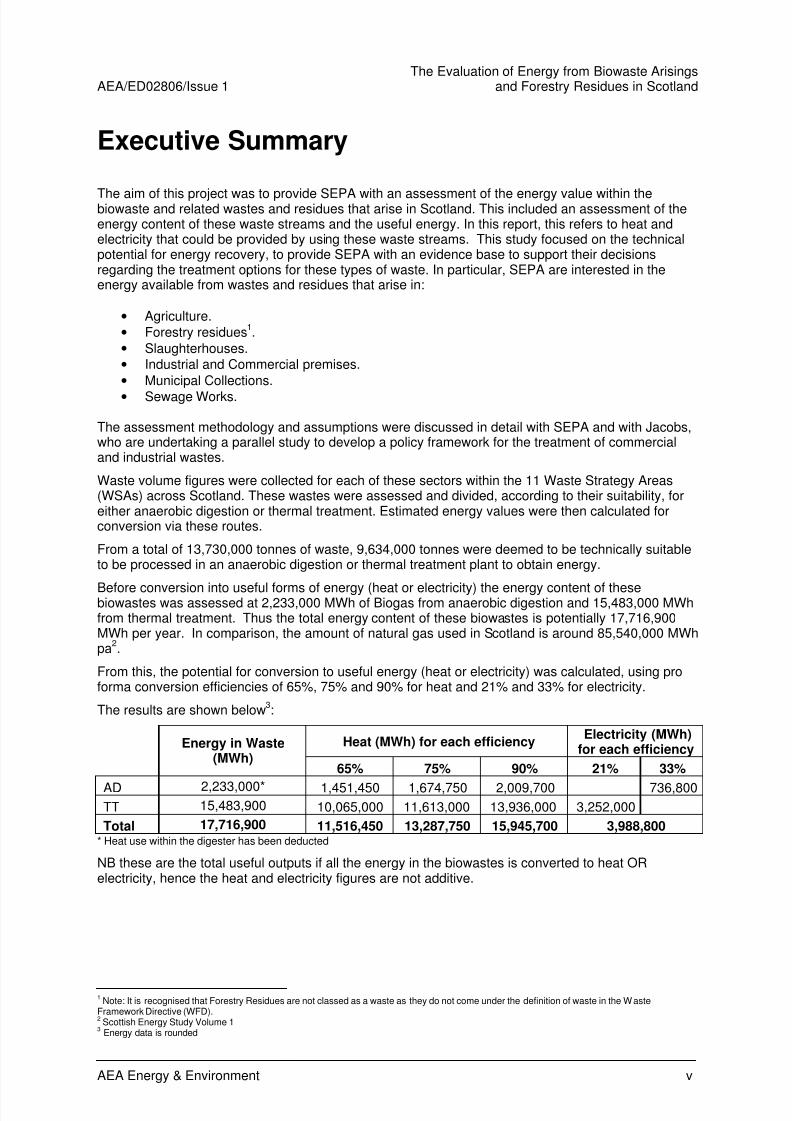
From a total of 13,730,000 tonnes of waste, 9,634,000 tonnes were deemed to be technically suitableto be processed in an anaerobic digestion or thermal treatment plant to obtain energy.
Before conversion into useful forms of energy (heat or electricity) the energy content of thesebiowastes was assessed at 2,233,000 MWh of Biogas from anaerobic digestion and 15,483,000 MWhfrom thermal treatment. Thus the total energy content of these biowastes is potentially 17,716,900MWh per year. In comparison, the amount of natural gas used in Scotland is around 85,540,000 MWhpa
2.
From this, the potential for conversion to useful energy (heat or electricity) was calculated, using proforma conversion efficiencies of 65%, 75% and 90% for heat and 21% and 33% for electricity.
The results are shown below3:
Heat (MWh) for each efficiencyElectricity (MWh)
for each efficiencyEnergy in Waste(MWh)
65% 75% 90% 21% 33%
AD 2,233,000* 1,451,450 1,674,750 2,009,700 736,800TT 15,483,900 10,065,000 11,613,000 13,936,000 3,252,000
Total 17,716,900 11,516,450 13,287,750 15,945,700 3,988,800* Heat use within the digester has been deducted
NB these are the total useful outputs if all the energy in the biowastes is converted to heat ORelectricity, hence the heat and electricity figures are not additive.
1 Note: It is recognised that Forestry Residues are not classed as a waste as they do not come under the definition of waste in the Waste
Framework Directive (WFD).2 Scottish Energy Study Volume 1
3 Energy data is rounded
8/12/2019 SEPA- Report on Biowaste
http://slidepdf.com/reader/full/sepa-report-on-biowaste 6/95
The Evaluation of Energy from Biowaste Arisingsand Forestry Residues in Scotland AEA/ED02806/Issue 1
vi AEA Energy & Environment
Heat (MWh) for eachefficiency
Electricity (MWh) for eachefficiencyEnergy in Waste
(MWh)55% 12% 33% 10%
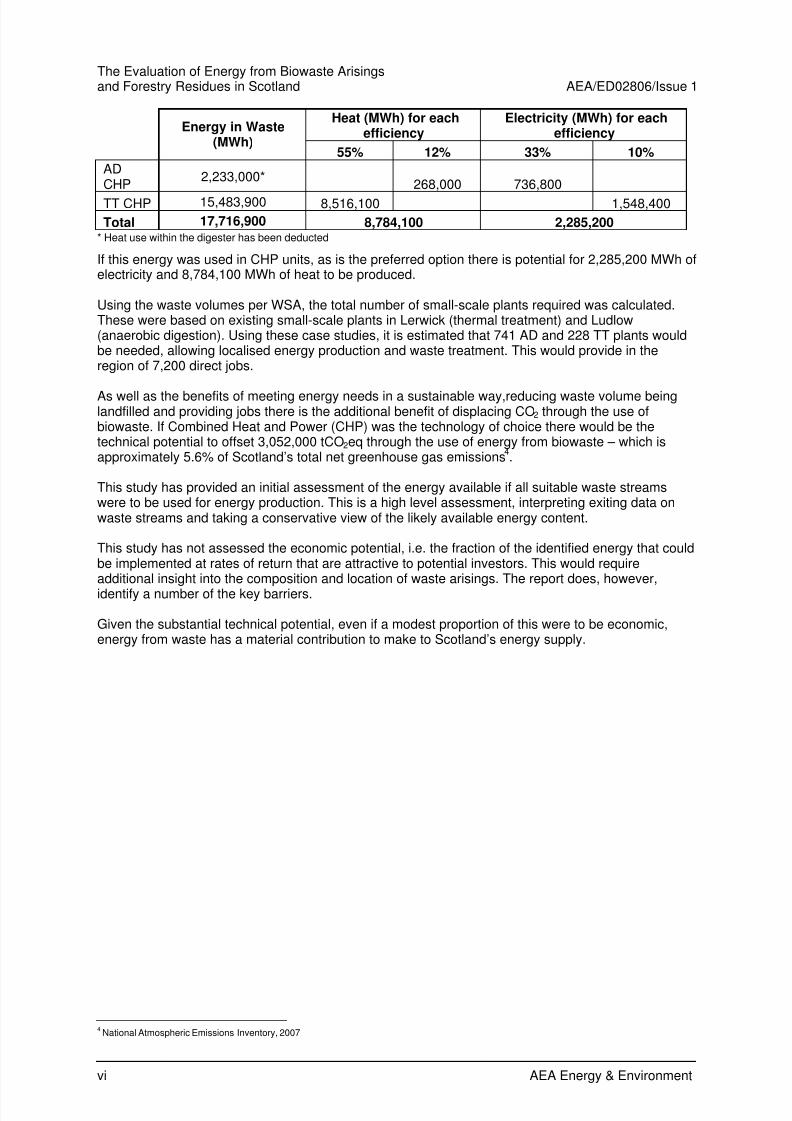
ADCHP
2,233,000*268,000 736,800
TT CHP 15,483,900 8,516,100 1,548,400
Total 17,716,900 8,784,100 2,285,200* Heat use within the digester has been deducted
If this energy was used in CHP units, as is the preferred option there is potential for 2,285,200 MWh ofelectricity and 8,784,100 MWh of heat to be produced.
Using the waste volumes per WSA, the total number of small-scale plants required was calculated.These were based on existing small-scale plants in Lerwick (thermal treatment) and Ludlow(anaerobic digestion). Using these case studies, it is estimated that 741 AD and 228 TT plants wouldbe needed, allowing localised energy production and waste treatment. This would provide in theregion of 7,200 direct jobs.
As well as the benefits of meeting energy needs in a sustainable way,reducing waste volume beinglandfilled and providing jobs there is the additional benefit of displacing CO2 through the use ofbiowaste. If Combined Heat and Power (CHP) was the technology of choice there would be thetechnical potential to offset 3,052,000 tCO2eq through the use of energy from biowaste – which isapproximately 5.6% of Scotland’s total net greenhouse gas emissions
4.
This study has provided an initial assessment of the energy available if all suitable waste streamswere to be used for energy production. This is a high level assessment, interpreting exiting data onwaste streams and taking a conservative view of the likely available energy content.
This study has not assessed the economic potential, i.e. the fraction of the identified energy that couldbe implemented at rates of return that are attractive to potential investors. This would requireadditional insight into the composition and location of waste arisings. The report does, however,
identify a number of the key barriers.
Given the substantial technical potential, even if a modest proportion of this were to be economic,energy from waste has a material contribution to make to Scotland’s energy supply.
4 National Atmospheric Emissions Inventory, 2007

8/12/2019 SEPA- Report on Biowaste
http://slidepdf.com/reader/full/sepa-report-on-biowaste 7/95
The Evaluation of Energy from Biowaste ArisingsAEA/ED02806/Issue 1 and Forestry Residues in Scotland
AEA Energy & Environment vii
8/12/2019 SEPA- Report on Biowaste
http://slidepdf.com/reader/full/sepa-report-on-biowaste 8/95
The Evaluation of Energy from Biowaste Arisingsand Forestry Residues in Scotland AEA/ED02806/Issue 1
viii AEA Energy & Environment
Table of contents
1 Introduction 1 1.1 Report Structure 2 1.2 Project Objective and Limitations 2
2 Sector Waste Arisings 3 2.1 Agricultural Waste 3 2.2 Commercial & Industrial Waste 4 2.3 Slaughterhouse Waste 5 2.4 Forestry Residues 5 2.5 Municipal Solid Waste collected by Local Authorities 5 2.6 Sewage Sludge 6
3 Technology Overview 7 3.1 Thermal Treatment 7 3.2 Biological Process (Anaerobic Digestion) 9
4 Methodology 12 4.1 Data Acquisition 12 4.2 Technology Summary 27 4.3 Modelling 29
5 Model Results 33 5.1 Suitable Energy Routes 33 5.2 Model Discussion 34
6 Potential Barriers & Opportunities 42 6.1 Financial 42 6.2 Infrastructure 44 6.3 Policy 46
7 Comparison with Energy Crops 52 7.1 Energy Crops 52
8 Potential Benefits 55 8.1 Employment Opportunities 55 8.2 Energy Security 57 8.3 CO2 Offset 57 8.4 Cost Offset 58
9 Summary of Findings 59
Appendices

8/12/2019 SEPA- Report on Biowaste
http://slidepdf.com/reader/full/sepa-report-on-biowaste 9/95
The Evaluation of Energy from Biowaste ArisingsAEA/ED02806/Issue 1 and Forestry Residues in Scotland
AEA Energy & Environment ix
Appendix 1: Energy from Waste
Appendix 2: Anaerobic Digestion (AD)
Appendix 3: Quantity and breakdown of Waste Collected by Each Local Authority Area
Appendix 4: Tonnage of Biowastes Available for Processing by Category and Local Authority Area
Appendix 5: Bio-waste suitable for use in AD
Appendix 6: Bio-waste suitable for use in TT
Appendix 7: AD Potential Per Local Authority Area
Appendix 8: Thermal Treatment Potential Per Local Authority Area

8/12/2019 SEPA- Report on Biowaste
http://slidepdf.com/reader/full/sepa-report-on-biowaste 10/95
8/12/2019 SEPA- Report on Biowaste
http://slidepdf.com/reader/full/sepa-report-on-biowaste 11/95
The Evaluation of Energy from Biowaste ArisingsAEA/ED02806/Issue 1 and Forestry Residues in Scotland
AEA Energy & Environment 1
1 Introduction
The recovery of energy from Municipal Solid Waste (MSW) is the subject of a number of studies and isbeing promoted by guidance from the relevant policy and regulatory bodies across the UK. It has beenincluded in this study in order to establish the total energy potential from this waste stream.
The opportunity for energy recovery from the biowaste, forestry residues and other suitable elementsof commercial and industrial waste has to date received less attention. In Scotland the tonnage ofcommercial and industrial waste arisings is at present almost three times the tonnage of MSW
5.
Hence both these streams can be used to provide energy, significant environmental and cost benefits,with the added opportunity to create employment in the plants processing these wastes.
AEA Energy & Environment was commissioned by SEPA to undertake a review of the energy potentialembedded in biowaste and other suitable arisings in Scotland in six specific sectors:
• Agricultural waste.
• Commercial & Industrial waste.
• Forestry Residues.• Slaughterhouse waste.• Municipal Solid Waste (MSW)
• Sewage Sludge
For each sector, data was obtained on the annual waste tonnages arising and its potential to beutilised for energy production. In order to gain a more accurate view of the potential energy productionacross Scotland the study utilised regional data to assign biowaste tonnages from each sector to eachLocal Authority (LA) area
6. Where regional data was not available, national statistics
7 were used to
apportion the biowaste across each Local Authority.
This study assessed the potential tonnage available and the calorific value for each of the biowastesto calculate the energy content of these biowastes as an energy source (the calorific value is aderived figure that indicates how much useful energy could be available within these biowastes). Thisis analogous to the energy content of other fuels such as gas or coal, which are then converted touseful forms of energy.
An assessment was made as to which of two energy conversion routes would be most appropriate foreach waste type. The two energy production routes explored were Thermal Treatment (TT) andAnaerobic Digestion (AD); each conversion route is described in Section 3.
The useful energy, as heat or electrical power, that could be created from these biowastes will dependon the plant conversion efficiency, the facility location and the needs of the local community. As thesecannot be assessed in any detail, the findings of the study are presented for notional conversionefficiencies. The energy conversion efficiencies modelled are 65%, 75% and 90%
8, which represent
differing energy uses based on theoretical energy generation. The model also calculates the“electricity” only efficiency of the thermal treatment and anaerobic digestion processes to provide acomparator to Energy from Waste (EfW) electricity export (see Section 5 below), or in circumstanceswhere heat is not required in high enough volumes. The study also considers the efficiency ofconversion using CHP.
5 Scottish Waste Digest 7, SEPA
6 Derived from baseline data provided by SEPA data team.
7 Derived from the 2004 national statistics: http://www.scotland.gov.uk/Topics/Statistics/16170/2004PDFSectionE
8 Efficiencies modelled are based on SEPA project briefing document to reflect differing potential energy uses.
8/12/2019 SEPA- Report on Biowaste
http://slidepdf.com/reader/full/sepa-report-on-biowaste 12/95
The Evaluation of Energy from Biowaste Arisingsand Forestry Residues in Scotland AEA/ED02806/Issue 1
2 AEA Energy & Environment
1.1 Report Structure
This report is set out in the following sections:
Section 2 – Sectors. This section sets out the details of the six main sectors that were consideredduring this study.
Section 3 – Technologies. This section sets out the main features of the thermal treatment andanaerobic digestion processes.
Section 4 – Methodology. This section provides a summary of the method used to analyse the dataand to assess the useful energy that could be made available from biowastes.
Section 5 – Model Results. This sets out the results of the modelling in terms of the energy contentof the suitable forms of biowaste and the amounts of useful energy (heat or electricity) that could beprovided via the anaerobic digestion or thermal treatment routes.
Section 6 – Potential Barriers and Opportunities. This section presents details of the barriers thatmay prevent use of biowaste as a source of energy along with details of the policy instruments that willinfluence the use of biowaste as a source of energy.
Section 7 – Comparison with Energy Crops. In this section, the report examines the amount ofenergy available from biowastes with energy crops, assessing the amount of land that would berequired.
Section 8 – Potential Benefits. This section summarises the range of benefits that could be realisedif biowaste was to be fully exploited as an energy resource.
1.2 Project Objective and Limitations
1.2.1 Objectives
This main objective of this report is to provide SEPA with an understanding of the energy that couldpotentially be generated if the biowaste and other suitable arisings not currently utilised withinScotland were to be used to produce energy. The information provided in this report can be used tohelp SEPA to support policy development for utilising biowaste arisings in Scotland.
1.2.2 Data Limitations
The evaluation is based on the best available data that could be acquired during the study period.
Precise data on the level and composition of waste arisings is not available, as the cost of obtainingmeasured data would be far in excess of the value of the data collected. Hence this analysis cannotbe exhaustive; data gaps have been identified and these require further exploration in order to providea more accurate picture of energy production potential. Where estimates are provided of the numberof different types of schemes that would be required in each Local Authority area, no checks orreviews have been undertaken as to planning requirements or other restrictions.
8/12/2019 SEPA- Report on Biowaste
http://slidepdf.com/reader/full/sepa-report-on-biowaste 13/95
The Evaluation of Energy from Biowaste ArisingsAEA/ED02806/Issue 1 and Forestry Residues in Scotland
AEA Energy & Environment 3
2 Sector Waste Arisings
In order to gain an understanding of the biowaste, and other suitable waste wastes available and their
potential for use within an energy production process, it is necessary to have a general understandingof what comprises the six sectors and which elements of the waste reviewed are biowaste or areotherwise suitable for energy recovery. The justification for the selection criteria is given in Section 4.
2.1 Agricultural Waste
Agricultural waste comprises wastes that are generated by the farming community and can consist ofa biowaste element, hazardous / special waste element and inert waste element. The study hasreviewed the following waste types from this source based on available data
9:
• Oils.
• Chemicals.
• Plastics.• Livestock mortalities and animal tissue.• Fish waste.
• Milk waste.
• Animal healthcare.
• Metal oil drums.
• Cooling equipment.
• Asbestos roofing.
From these waste types only the following five categories have been considered to contain an elementof biowaste or are otherwise deemed suitable for energy recovery. This includes materials that will bedeemed to be biomass and hence eligible for the benefits and incentives offered to qualifyingrenewable energy schemes. These waste streams will also include materials that are fossil fuel based
and hence suitable for energy recovery, however these will not be eligible for the same incentives.
• Oils.
• Plastics.
• Livestock mortalities and animal tissue.
• Fish waste.
• Milk waste.
There will be an element of suitable waste within the excluded categories - for example many of thechemicals may be flammable - however it is difficult to quantify and it was decided that the morereadily available wastes would provide the most cost effective energy sources.
For these 5 categories the total waste arisings are estimated to be 98,500 tonnes pa.
9 Derived from data provided by SEPA for Agricultural waste in 2005
8/12/2019 SEPA- Report on Biowaste
http://slidepdf.com/reader/full/sepa-report-on-biowaste 14/95
The Evaluation of Energy from Biowaste Arisingsand Forestry Residues in Scotland AEA/ED02806/Issue 1
4 AEA Energy & Environment
2.2 Commercial & Industrial Waste
Commercial waste is waste that is generated by premises wholly used for trade or business andIndustrial waste is waste that is generated mainly from industrial operations. Every effort has beenmade to ensure that, for the purposes of this study the following waste types for this sector have beenreviewed based on available data
10:
• Exploration, mining, quarrying and treatment.
• Agriculture, horticulture, aquaculture, forestry, hunting, fishing and food preparation.• Wood processing & production of panels & furniture, pulp, paper and cardboard.
• Wastes from leather, fur and textile industries.
• Petroleum refining, natural gas purification and pyrolitic treatment of coal.
• Inorganic chemical processes.
• Organic chemical processes.
• Manufacture, formulation, supply & use of coatings, adhesives, sealants & inks.
• Wastes from the photographic industry.
• Thermal processes.• Chemical surface treatment & coating of metals & other materials.
• Shaping & physical & mechanical surface treatment of metals and plastics.
• Oil wastes and wastes of liquid fuels (non-edible).
• Organic solvents, refrigerants and propellants.
• Waste packing; absorbents, cloths, filters & protective clothing.
• Wastes not otherwise specified in the list.
• Construction & demolition (inc excavated soil from contaminated sites).• Human or animal health care or research.
• Waste management facilities, off-site water treatment & water consumption & industry.
• Municipal Waste (household, and similar commercial, industrial and institutional waste).
European Waste Catalogue (EWC) Codes are used by SEPA for recording information on the differentwaste streams. These codes do not necessarily give information that can be bounded within producersectors. For example, ‘Municipal Waste’ is included within ‘Commercial and Industrial Waste’ but doesnot include Local Authority collections. These are accounted for in section 2.5 below. Every effort hasbeen made to avoid the risk of double counting.
From these waste types only the following eight categories have been considered to contain anelement of biowaste or are otherwise deemed suitable for energy recovery:
• Agriculture, Horticulture, aquaculture, forestry, hunting, fishing and food preparation.• Wood processing and production of panels and furniture, pulp, paper and cardboard.
• Wastes from leather, fur and textile industries.
• Oil wastes and wastes of liquid fuels (non-edible).
• Waste packing, absorbents, cloths, filters and protective clothing.• Construction and demolition.• Waste management facilities, off-site water treatment & water consumption & industry.
• Municipal Waste (household, and similar commercial, industrial and institutional waste).
Similar to Agricultural waste, there will be element from the excluded categories that contain a usableenergy.
For these 8 categories the total waste arisings are estimated to be 8,961,000 tonnes pa.
10 Derived from data provided by SEPA, Commercial & Industrial Waste Producer Survey, 2004.
8/12/2019 SEPA- Report on Biowaste
http://slidepdf.com/reader/full/sepa-report-on-biowaste 15/95
The Evaluation of Energy from Biowaste ArisingsAEA/ED02806/Issue 1 and Forestry Residues in Scotland
AEA Energy & Environment 5
2.3 Slaughterhouse Waste
Slaughterhouse waste is a biodegradable waste arising from animal body parts cut off in thepreparation of carcasses for use as food. The study has reviewed the following waste types from thissource based on available data
11:
• Raw meat waste from slaughtering facilities.
For this category the total waste arisings are estimated to be 178,000 tonnes pa.
2.4 Forestry Residues
Forestry Residues do not fall under the definition of ‘Waste’ described in the Waste FrameworkDirective. This allows forestry residues to be classed as ‘clean’ fuels and are not subject to the WasteIncineration Directive, unless they are co-combusted with wastes.
In commercial forestry, residues arise when trees are harvested for stemwood. Poor quality or small
diameter stems may be available for wood fuel. The tops and branches (known as brash) arenormally cut off the trees and left at the harvesting site. Poor quality stems are also cleared as part ofthe forestry thinning operations. The study has reviewed the following waste types from this sourcebased on available data
12:
Thinning Biomass:
• Stemwood 7-14 cm.
• Stemwood 14-16 cm.
• Stemwood 16-18 cm.
• Stemwood 18+ cm.
Thinning and Felling Biomass:
•
Poor quality wood.
13
• Tips.
• Branches.• Foliage.
For these categories the total residue arisings are 904,000 tonnes pa.
2.5 Municipal Solid Waste collected by Local Authorities
MSW is generally defined as household waste and non-household waste with a similar compositionthat is collected by, or on behalf of, a Local Authority
14. This waste stream can be broken down into
three categories15
.
• Recycled Waste.
• Composted Waste.
• Remaining Waste.
The recycled elements were excluded from this total as, under the waste hierarchy, there is lessimpact on the environment to recycle than biologically treat or incinerate. A considerable proportion ofMSW is already recycled and this is set to increase with targets for Scotland set at 30% by 2010. TheScottish Government are considering raising this to 70%. Case studies in Sweden and Denmark haveshown that areas that employ EfW plants have a higher recycling rate due to the increased level ofwaste separation required.
11 Derived from Slaughterhouse waste tonnages provided by SEPA for 2004
12 Derived from W oodfuel Resource Dynamically Generated Report, H McKay, 2003
13 Term from Reference 12, refers to poor quality stems, branches and tips.
14www.sepa.org.uk/pdf/nws/thenetwork/course/part_1.pdf
15 Derived from tables 15 and 16 from SEPA’s Waste Digest 7
8/12/2019 SEPA- Report on Biowaste
http://slidepdf.com/reader/full/sepa-report-on-biowaste 16/95
The Evaluation of Energy from Biowaste Arisingsand Forestry Residues in Scotland AEA/ED02806/Issue 1
6 AEA Energy & Environment
The total waste arisings for MSW (excluding recycled element) in Scotland is estimated to be2,894,387 tonnes pa.
2.6 Sewage Sludge
This is the waste remaining after processing in a sewage treatment plant. This waste can be dividedby the disposal methods used after treatment in the plant.
16
• Reclamation.
• Electric Power and Heat Generation.
• Landfill.
• Incineration.
• Composting.• Agriculture.
For the purposes of this report only the sludge that is currently landfilled or reclaimed is included. Theremaining routes are considered to already be useful.
Due to confidentiality between SEPA and Scottish Water, a breakdown by WSA could not be obtained,instead figures are broken down by region as listed below.
• North East.
• North West.
• South East.
• South West.
That gives the total estimated waste arisings for sewage sludge to be 140,180 tonnes pa (dry weight).
16 Data supplied by SEPA as reported to them by Scottish Water
8/12/2019 SEPA- Report on Biowaste
http://slidepdf.com/reader/full/sepa-report-on-biowaste 17/95
The Evaluation of Energy from Biowaste ArisingsAEA/ED02806/Issue 1 and Forestry Residues in Scotland
AEA Energy & Environment 7
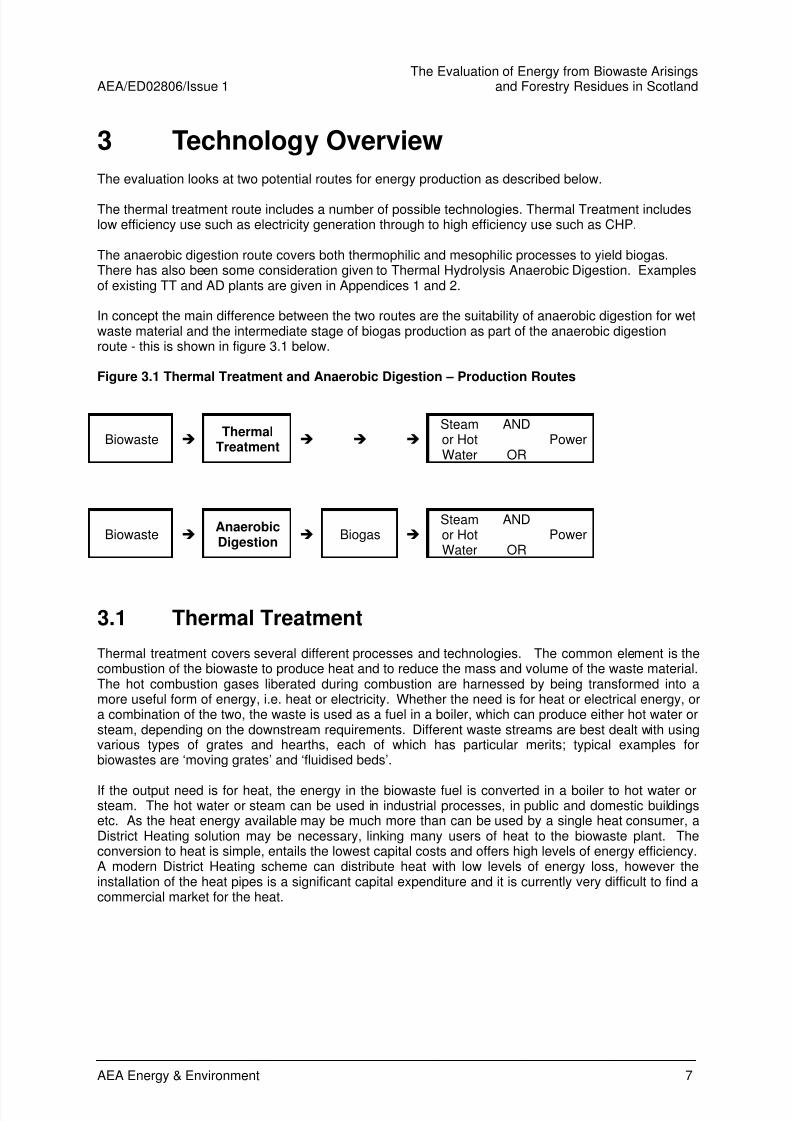
3 Technology Overview
The evaluation looks at two potential routes for energy production as described below.
The thermal treatment route includes a number of possible technologies. Thermal Treatment includeslow efficiency use such as electricity generation through to high efficiency use such as CHP.
The anaerobic digestion route covers both thermophilic and mesophilic processes to yield biogas.There has also been some consideration given to Thermal Hydrolysis Anaerobic Digestion. Examplesof existing TT and AD plants are given in Appendices 1 and 2.
In concept the main difference between the two routes are the suitability of anaerobic digestion for wetwaste material and the intermediate stage of biogas production as part of the anaerobic digestionroute - this is shown in figure 3.1 below.
Figure 3.1 Thermal Treatment and Anaerobic Digestion – Production Routes
Biowaste Thermal
Treatment
Steamor HotWater
AND
ORPower
Biowaste AnaerobicDigestion
Biogas Steamor HotWater
AND
ORPower
3.1 Thermal Treatment
Thermal treatment covers several different processes and technologies. The common element is thecombustion of the biowaste to produce heat and to reduce the mass and volume of the waste material.The hot combustion gases liberated during combustion are harnessed by being transformed into amore useful form of energy, i.e. heat or electricity. Whether the need is for heat or electrical energy, ora combination of the two, the waste is used as a fuel in a boiler, which can produce either hot water orsteam, depending on the downstream requirements. Different waste streams are best dealt with usingvarious types of grates and hearths, each of which has particular merits; typical examples forbiowastes are ‘moving grates’ and ‘fluidised beds’.
If the output need is for heat, the energy in the biowaste fuel is converted in a boiler to hot water orsteam. The hot water or steam can be used in industrial processes, in public and domestic buildingsetc. As the heat energy available may be much more than can be used by a single heat consumer, aDistrict Heating solution may be necessary, linking many users of heat to the biowaste plant. Theconversion to heat is simple, entails the lowest capital costs and offers high levels of energy efficiency.A modern District Heating scheme can distribute heat with low levels of energy loss, however theinstallation of the heat pipes is a significant capital expenditure and it is currently very difficult to find acommercial market for the heat.
8/12/2019 SEPA- Report on Biowaste
http://slidepdf.com/reader/full/sepa-report-on-biowaste 18/95
The Evaluation of Energy from Biowaste Arisingsand Forestry Residues in Scotland AEA/ED02806/Issue 1
8 AEA Energy & Environment
Alternatively, if the output need is for electricity and/or heat, the biowaste fuel is converted in a boilerto produce high-pressure steam, suitable for use in a steam turbine generator to produce electricity;this is known as the ‘Rankine Cycle’ and is a well-proven concept. This is the same process found inlarge coal-fired power stations, although these generally use more advanced derivatives of the
Rankine cycle called ‘Re-heat’ and ‘Re-generation’. However the electrical output is lower than from asimilar mass of coal on account of the calorific value of the material and the generally smaller scale ofthe power plant will result in somewhat lower efficiencies. The electricity generated can be used onsite or sold to another party via the electricity distribution or transmission networks. The capital cost ofelectricity generation will be higher than a simple heat conversion scheme, however electricity issignificantly more valuable than heat and has a larger commercial market. In addition, for largeelectricity generation plant there are currently limitations in connecting to the electricity networks asdiscussed in 6.2 below.
The Rankine cycle automatically produces both heat energy and mechanical power from the steamturbine (which is usually coupled to an electrical generator to convert the mechanical energy toelectrical). If the operator uses only the mechanical/electrical energy, then the majority of the energycontent of the biowaste fuel will itself be wasted to the atmosphere through an air-cooled condenser,
or through cooling towers. If, on the other hand, a use can be found for the very large amount of heatenergy which is produced in the Rankine Cycle, then the fuel energy input to heat/electrical energyoutput ratios are very high; this ratio is sometimes expressed as an ‘efficiency’.
Gasification/pyrolysis is also a potential thermal treatment option. The biowaste fuel is heated in anoxygen-poor atmosphere to produce a gas “syngas”. The calorific value of the gas produced (CarbonMonoxide and Hydrogen), comprises most of the syngas’ energy content, although it has asignificantly lower calorific value compared to natural gas. There are a few examples of Gasifiers inthe UK and overseas, most running on wood waste. Some of these applications seem to be workingsatisfactorily, showing that it could become a viable option in the future, although the world’s twolargest plants at Karlsruhe and Fürth, in Germany, have both closed because they could not meet theirdesign specifications.
The theoretical advantages of gasification are cleaner gas prior to combustion, lower emissions andthe possibility of directly running a gas engine or gas turbine, which may offer a higher level ofelectricity generation efficiency than is achieved using small steam turbines. However, theunsuccessful ARBRE plant at Eggborough in Yorkshire, had it ever operated successfully, would haveactually generated less electricity from its extremely expensive combined-cycle gas turbine (CCGT)than it would have done from a simple and reliable Rankine-cycle steam turbine arrangement.
Gasification and pyrolysis are advanced technologies that are at the demonstration stage. Hence theanalysis in this study focused on combustion as this is the established thermal treatment option whichis most likely to have a wide spread application. If, in future years gasification and pyrolysis becomeavailable on a commercial scale, with equivalent reliability, this would offer a potentially higher level ofelectricity generation from thermal treatment.
Thermal treatment is therefore all about harnessing the energy content of the fuel. In order todetermine this energy content, the specific calorific values (expressed in GJ/tonnes biowaste fuel) ofeach type of waste have been collected from various sources (DTI, SEPA and DEFRA and otherstudies). The suitable types of waste for thermal treatment are those wastes that have a good calorificvalue and can be readily burned without the need for high temperatures to remove hazardouselements.
It should be noted that the type of waste suitable for biological process (i.e. digestion) are often notsuitable for thermal treatment and vice versa, with the moisture content being a key factor indetermining which process is most suitable. Some wastes are at the borderline between biologicaland thermal treatment in terms of their suitability. Other wastes are wet enough to be digested but stillhave a high enough calorific value for thermal treatment. In this study material with moisture content of90% or more is assumed to be treated using biological process while material with a lower moisture
content is assumed to be processed using thermal treatment.
8/12/2019 SEPA- Report on Biowaste
http://slidepdf.com/reader/full/sepa-report-on-biowaste 19/95
The Evaluation of Energy from Biowaste ArisingsAEA/ED02806/Issue 1 and Forestry Residues in Scotland
AEA Energy & Environment 9
The nature of the data provided meant that it wasn’t always clear what the moisture content of thewaste/residues were. For those that didn’t specify moisture content, it was assumed the figures werefor dry tonnages.
3.2 Biological Process (Anaerobic Digestion)
Anaerobic digestion uses microbial organisms in the absence of oxygen to decompose organic matter.As with all biological processes anaerobic digestion is strongly influenced by the temperature at whichit is occurs. Two different temperature ranges are commonly used in commercial anaerobic digestionplants, thermophilic (50 – 60
oC) and mesophilic (30 - 37
oC). The volume of biogas that is produced is
only slightly affected by the temperature, however the rate at which the material is processed will bestrongly influenced by temperature. In mesophilic plants waste will take longer to process than inthermophilic plants however, mesophilic plants tend to be more tolerant of variations in feedstock thanthermophilic processes.
The choice between use of mesophilic or thermophilic processes will in practice be decided by the
composition of the waste and the economic trade offs between digestion rate, capital cost, plantfootprint etc. For this study it is assumed that mesophilic processes are chosen, as this is the moststable process and is likely to be better suited to the wide range of wastes considered in this study. Inaddition less heat is needed to sustain mesophilic digestion systems, hence more energy is availablefor other purposes.
Legislation also dictates how some wastes can be used. This is the case for livestock mortalities andanimal tissue and waste from slaughterhouses. The Animal By-products Regulations only allow‘traditional’ anaerobic digestion of waste materials that are from sources that were suitable for humanconsumption (defined as Category 3). This means that slaughter waste, classed as Category 3, canbe used in an anaerobic digestion plant however livestock mortalities and tannery waste cannot. Thisregulatory issue overrides the fact that these wastes are similar in terms of energy and physicalconstitution.
However there are ‘second generation’ anaerobic digestion plants that can process all Category 2 and3 materials and these should be considered wherever possible (see section 3.3). Category 2 wastecan be utilised for energy production providing that the requirements of Article 15 of the animal by-products regulations for processing in an approved biogas or composting plant, are met (see section3.3 Thermal Hydrolysis Process). It is also likely that the Waste Incineration Directive (WID) will applyto most of the biowaste fuels although many processes will contend that they are utilising cleanbiomass. These regulatory issues are examined in more detail in Section 6.
The biological process by which biogas is produced can be split into three main stages (Hydrolysis,acidognesis, methanogenesis) and can be influenced by several factors impacting on the productionrate and the methane content of the biogas.
One of these factors is the Total Solid content (TS) of the feedstock and this was the basis fordeciding which type of waste would be suitable for anaerobic digestion. Anaerobic digesters work bestwith a mix of wet materials (up to 30-40% of solid content). This means that animal manure, milkwaste and sludges from various sources are most suitable for digestion. Through various studies,biogas yield ranges of figures (expressed in m³/kg of waste) have been observed and this is what hasbeen used to determine the biogas output from anaerobic digestion.
The biogas produced by anaerobic digestion can be used in several different ways:
1. Burnt in a biogas boiler to provide heat.2. Burnt in a biogas reciprocating engine or biogas turbine to provide electricity.3. As option 2, but with recovery of heat from the biogas engine or turbine, i.e. operating as CHP.
In most AD schemes some of the heat produced from the combustion of biogas is used in theanaerobic digestion process itself. This helps maintain the digestion process, particularly duringperiods of cooler external temperature. This has been taken into account in the assessment of usefulenergy available.
8/12/2019 SEPA- Report on Biowaste
http://slidepdf.com/reader/full/sepa-report-on-biowaste 20/95
The Evaluation of Energy from Biowaste Arisingsand Forestry Residues in Scotland AEA/ED02806/Issue 1
10 AEA Energy & Environment
The digestate that remains at the end of the digestion process can be used as fertiliser or compost ifspread on land or further thermally treated.
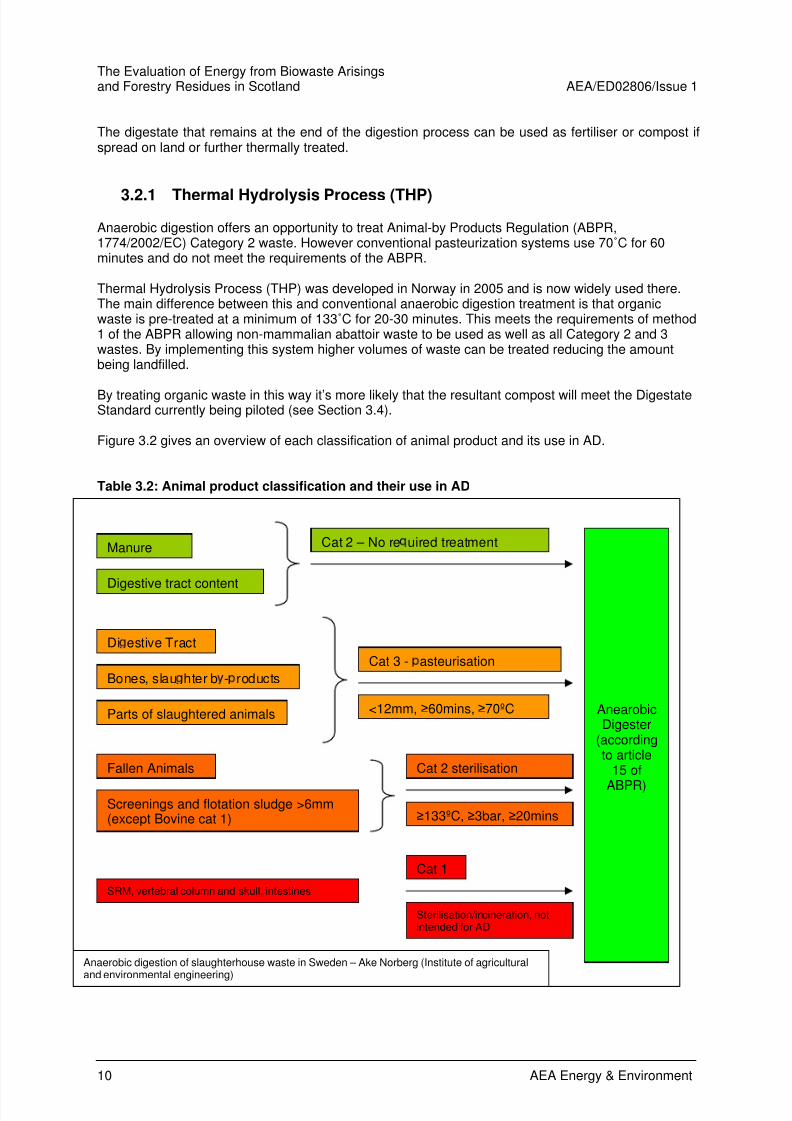
3.2.1 Thermal Hydrolysis Process (THP)
Anaerobic digestion offers an opportunity to treat Animal-by Products Regulation (ABPR,1774/2002/EC) Category 2 waste. However conventional pasteurization systems use 70˚C for 60minutes and do not meet the requirements of the ABPR.
Thermal Hydrolysis Process (THP) was developed in Norway in 2005 and is now widely used there.The main difference between this and conventional anaerobic digestion treatment is that organicwaste is pre-treated at a minimum of 133˚C for 20-30 minutes. This meets the requirements of method1 of the ABPR allowing non-mammalian abattoir waste to be used as well as all Category 2 and 3wastes. By implementing this system higher volumes of waste can be treated reducing the amountbeing landfilled.
By treating organic waste in this way it’s more likely that the resultant compost will meet the DigestateStandard currently being piloted (see Section 3.4).
Figure 3.2 gives an overview of each classification of animal product and its use in AD.
Table 3.2: Animal product classification and their use in AD
AnearobicDigester
(accordingto article
15 of
ABPR)
Manure
Digestive tract content
Parts of slaughtered animals
Di estive Tract
Cat 2 – No re uired treatment
Bones, slau hter b - roducts
Fallen Animals
Cat 3 - asteurisation
Screenings and flotation sludge >6mm(except Bovine cat 1)
Cat 2 sterilisation
<12mm, ≥60mins, ≥70ºC
≥133ºC, ≥3bar, ≥20mins
SRM, vertebral column and skull, intestines
Cat 1
Sterilisation/incineration, notintended for AD
Anaerobic digestion of slaughterhouse waste in Sweden – Ake Norberg (Institute of agriculturaland environmental engineering)

8/12/2019 SEPA- Report on Biowaste
http://slidepdf.com/reader/full/sepa-report-on-biowaste 21/95
The Evaluation of Energy from Biowaste ArisingsAEA/ED02806/Issue 1 and Forestry Residues in Scotland
AEA Energy & Environment 11
3.2.2 Digestate Standard and Code of Practice
As part of Defra’s Business Resource Efficiency and Waste Programme (BREW) initiative theDigestate Standard is just entering the pilot phase, however there is potential for it to impact on theuse of anaerobic digestion as a sustainable waste treatment route. The purpose of the standard is thecreation of a certification system that will ensure the quality of digestate products, which can take theform of Whole Digestate, Separated Liquor or Separated Fibre. These are currently used as compostand fertiliser however there are quality issues surrounding these applications. This will help ensurethere is a market for these ‘products’ making the use of anaerobic digestion more attractive.
This standard will place requirements on the quality of feedstocks which will have an impact on thetypes and quality of wastes that can be digested. This will encourage a more stringent collection policyand systems to ensure high organic recovery rates with minimal contamination; however, there is alsothe risk that it will limit the wastes that are digested as the operator may see the compost as a productrather than the AD process.
8/12/2019 SEPA- Report on Biowaste
http://slidepdf.com/reader/full/sepa-report-on-biowaste 22/95
The Evaluation of Energy from Biowaste Arisingsand Forestry Residues in Scotland AEA/ED02806/Issue 1
12 AEA Energy & Environment
4 Methodology
There are several factors which have had a bearing on how the evaluation has been undertaken,
namely the availability of baseline data, the completeness of this data and suitable benchmarkinginformation. In general there was limited data available for the six sectors reviewed, in particularhistoric information to predict waste growth and tonnage breakdown by Local Authority region in orderto establish the geographical distribution of the biowastes. The geographic distribution was used toestimate the potential number of anaerobic digestion and thermal treatment plants that would berequired to treat the biowastes identified.
Data was acquired from several sources including SEPA, the Forestry Commission and ScottishPower as well as published literature. Where the data was not sufficiently broken down to allowregional comparisons to be made, national statistics such as number of employees within a regionwere utilised to apportion the tonnages of industrial and commercial waste.
For each of the six biowaste sectors used in this study, the waste arisings were evaluated to
determine their suitability for treatment; the wastes were classed as not suitable, suitable for AD orsuitable for TT. The energy potential for each of the suitable waste types was then determined andefficiency factors assigned to establish the useful energy output.
Benchmarking information was obtained from published information and included data on boilerefficiencies and information on existing and proposed thermal and biological process plants to allow acomparison of tonnage throughput to useful energy output to be made.
4.1 Data Acquisition
4.1.1 Baseline Data
Information on biowaste for this evaluation was obtained from the SEPA data team, SEPAs WasteDigest 7 and the Active Compost report
17. The information was reviewed to determine its suitability.
Where gaps were identified SEPA were contacted for additional information, as well as an internetsearch being conducted in order to ascertain if additional information was available from othersources.
4.1.2 Data Gaps
Data gaps identified included:
• Insufficient historical data on most sectors to allow waste growth modelling to beundertaken, for example in the agricultural sector where there has been no historic datacollection prior to the past two years.
• Insufficient breakdown of data to allow an accurate regional assessment to be made.
• The industrial and commercial section of the Active Compost report had limited datacoverage of these sectors, for example this report identifies municipal waste for localauthorities but does not consider private companies that produce larger amounts of waste.
17 Szmidt, R.A.K, Weir, G.B (2006) Biowaste Arisings and treatment methodologies in Scotland, Active Compost
8/12/2019 SEPA- Report on Biowaste
http://slidepdf.com/reader/full/sepa-report-on-biowaste 23/95
The Evaluation of Energy from Biowaste ArisingsAEA/ED02806/Issue 1 and Forestry Residues in Scotland
AEA Energy & Environment 13
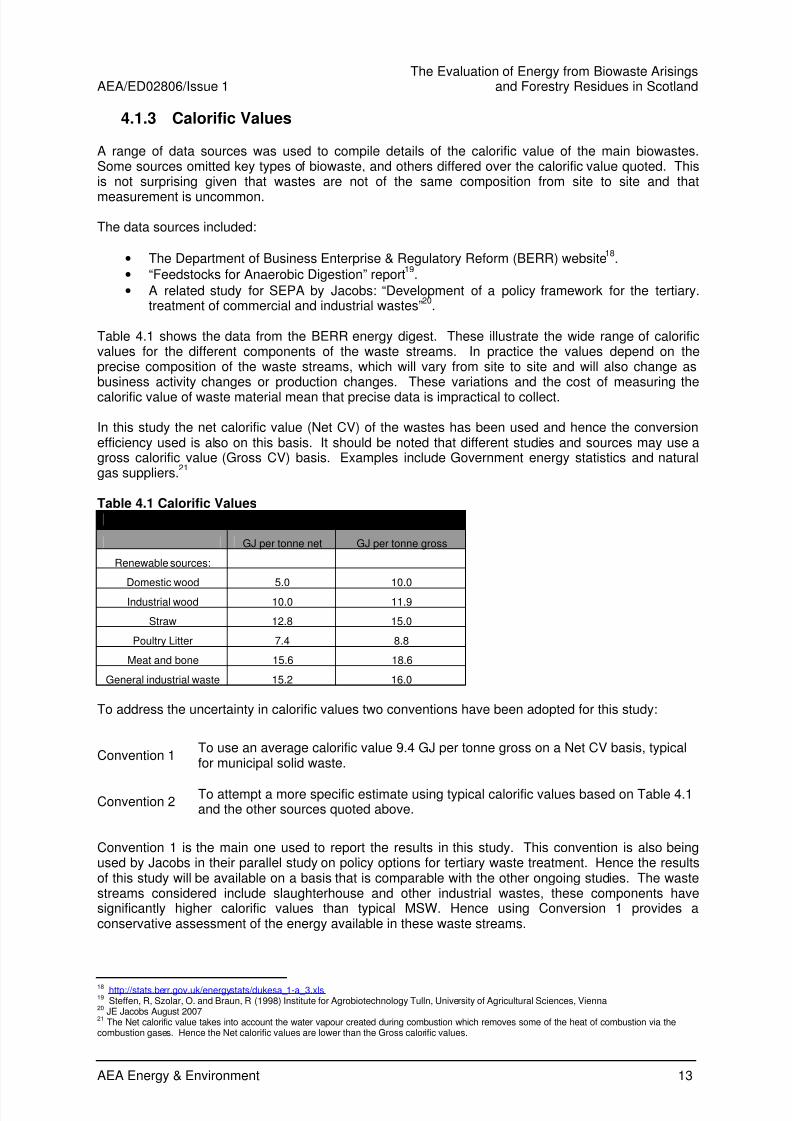
4.1.3 Calorific Values
A range of data sources was used to compile details of the calorific value of the main biowastes.Some sources omitted key types of biowaste, and others differed over the calorific value quoted. Thisis not surprising given that wastes are not of the same composition from site to site and that
measurement is uncommon.
The data sources included:
• The Department of Business Enterprise & Regulatory Reform (BERR) website18
.
• “Feedstocks for Anaerobic Digestion” report19
.
• A related study for SEPA by Jacobs: “Development of a policy framework for the tertiary.treatment of commercial and industrial wastes”
20.
Table 4.1 shows the data from the BERR energy digest. These illustrate the wide range of calorificvalues for the different components of the waste streams. In practice the values depend on theprecise composition of the waste streams, which will vary from site to site and will also change asbusiness activity changes or production changes. These variations and the cost of measuring the
calorific value of waste material mean that precise data is impractical to collect.
In this study the net calorific value (Net CV) of the wastes has been used and hence the conversionefficiency used is also on this basis. It should be noted that different studies and sources may use agross calorific value (Gross CV) basis. Examples include Government energy statistics and naturalgas suppliers.
21
Table 4.1 Calorific Values
Typical Calorific Values (2006)
GJ per tonne net GJ per tonne gross
Renewable sources:
Domestic wood 5.0 10.0
Industrial wood 10.0 11.9
Straw 12.8 15.0
Poultry Litter 7.4 8.8
Meat and bone 15.6 18.6
General industrial waste 15.2 16.0
To address the uncertainty in calorific values two conventions have been adopted for this study:
Convention 1To use an average calorific value 9.4 GJ per tonne gross on a Net CV basis, typicalfor municipal solid waste.
Convention 2To attempt a more specific estimate using typical calorific values based on Table 4.1and the other sources quoted above.
Convention 1 is the main one used to report the results in this study. This convention is also beingused by Jacobs in their parallel study on policy options for tertiary waste treatment. Hence the resultsof this study will be available on a basis that is comparable with the other ongoing studies. The wastestreams considered include slaughterhouse and other industrial wastes, these components havesignificantly higher calorific values than typical MSW. Hence using Conversion 1 provides aconservative assessment of the energy available in these waste streams.
18 http://stats.berr.gov.uk/energystats/dukesa_1-a_3.xls
19 Steffen, R, Szolar, O. and Braun, R (1998) Institute for Agrobiotechnology Tulln, University of Agricultural Sciences, Vienna
20 JE Jacobs August 2007
21 The Net calorific value takes into account the water vapour created during combustion which removes some of the heat of combustion via the
combustion gases. Hence the Net calorific values are lower than the Gross calorific values.
8/12/2019 SEPA- Report on Biowaste
http://slidepdf.com/reader/full/sepa-report-on-biowaste 24/95
The Evaluation of Energy from Biowaste Arisingsand Forestry Residues in Scotland AEA/ED02806/Issue 1
14 AEA Energy & Environment
To illustrate this we have provided some summary results using Convention 2 – to demonstrate thedegree to which Convention 1 could be conservative in reporting the energy available.
4.1.4 Data Allocation by Waste Strategy Area
In order for the data to be utilised on a regional basis the following manipulation was undertaken todetermine the regional tonnage allocations.
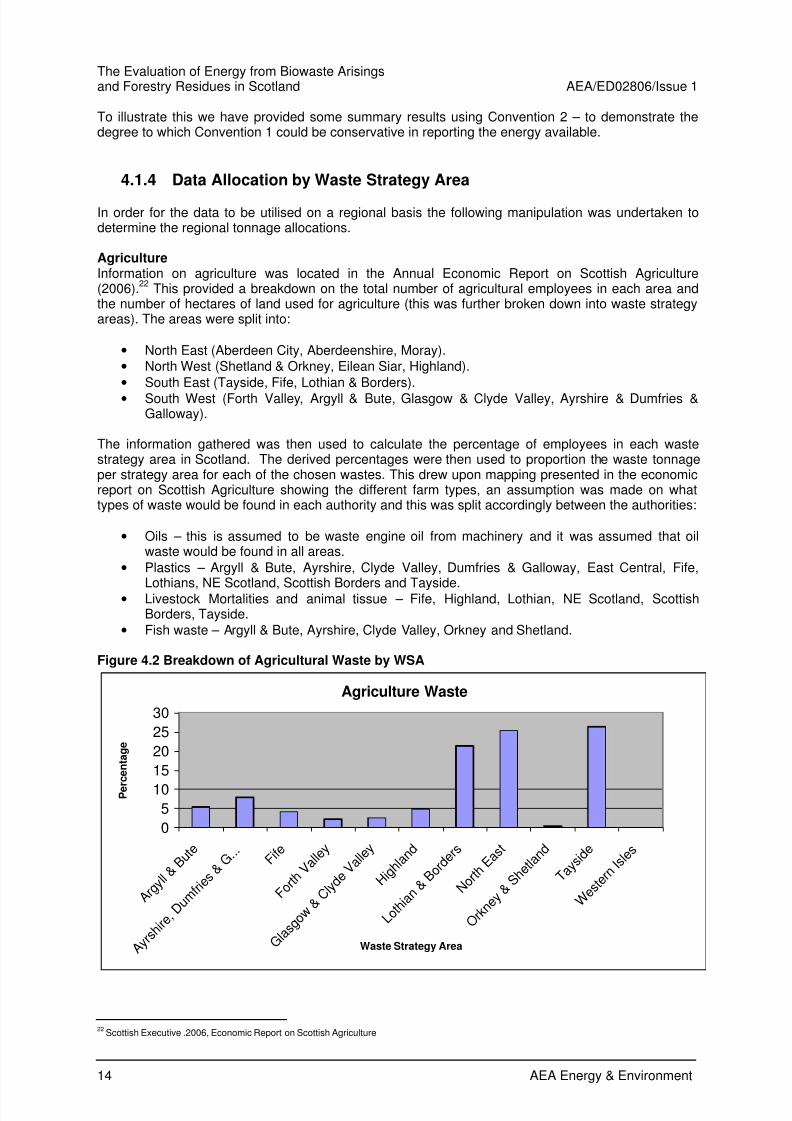
AgricultureInformation on agriculture was located in the Annual Economic Report on Scottish Agriculture(2006).
22 This provided a breakdown on the total number of agricultural employees in each area and
the number of hectares of land used for agriculture (this was further broken down into waste strategyareas). The areas were split into:
• North East (Aberdeen City, Aberdeenshire, Moray).• North West (Shetland & Orkney, Eilean Siar, Highland).
• South East (Tayside, Fife, Lothian & Borders).
• South West (Forth Valley, Argyll & Bute, Glasgow & Clyde Valley, Ayrshire & Dumfries &Galloway).
The information gathered was then used to calculate the percentage of employees in each wastestrategy area in Scotland. The derived percentages were then used to proportion the waste tonnageper strategy area for each of the chosen wastes. This drew upon mapping presented in the economicreport on Scottish Agriculture showing the different farm types, an assumption was made on whattypes of waste would be found in each authority and this was split accordingly between the authorities:
• Oils – this is assumed to be waste engine oil from machinery and it was assumed that oilwaste would be found in all areas.
• Plastics – Argyll & Bute, Ayrshire, Clyde Valley, Dumfries & Galloway, East Central, Fife,
Lothians, NE Scotland, Scottish Borders and Tayside.• Livestock Mortalities and animal tissue – Fife, Highland, Lothian, NE Scotland, Scottish
Borders, Tayside.
• Fish waste – Argyll & Bute, Ayrshire, Clyde Valley, Orkney and Shetland.
Figure 4.2 Breakdown of Agricultural Waste by WSA
Agriculture Waste
0
510
15
20
25
30
A r g y l l &
B u t e
A y r s h i r e
, D u m
f r i e s &
G . . . F i f
e
F o r t h
V a l l e y
G l a s g o w & C l y d e V
a l l e y
H i g h l a
n d
L o t h i
a n & B o r d
e r s
N o r t h
E a s t
O r k n
e y & S h e
t l a n d
T a y s i d e
W e s t e r
n I s l e
s
Waste Strategy Area
P e r
c e n t a g e
22 Scottish Executive .2006, Economic Report on Scottish Agriculture
8/12/2019 SEPA- Report on Biowaste
http://slidepdf.com/reader/full/sepa-report-on-biowaste 25/95
The Evaluation of Energy from Biowaste ArisingsAEA/ED02806/Issue 1 and Forestry Residues in Scotland
AEA Energy & Environment 15
Of the 98,000 tonnes of agricultural waste considered suitable, 76% of this is estimated to arise inthree regions - Tayside, North East and Lothian.
Commercial and Industrial
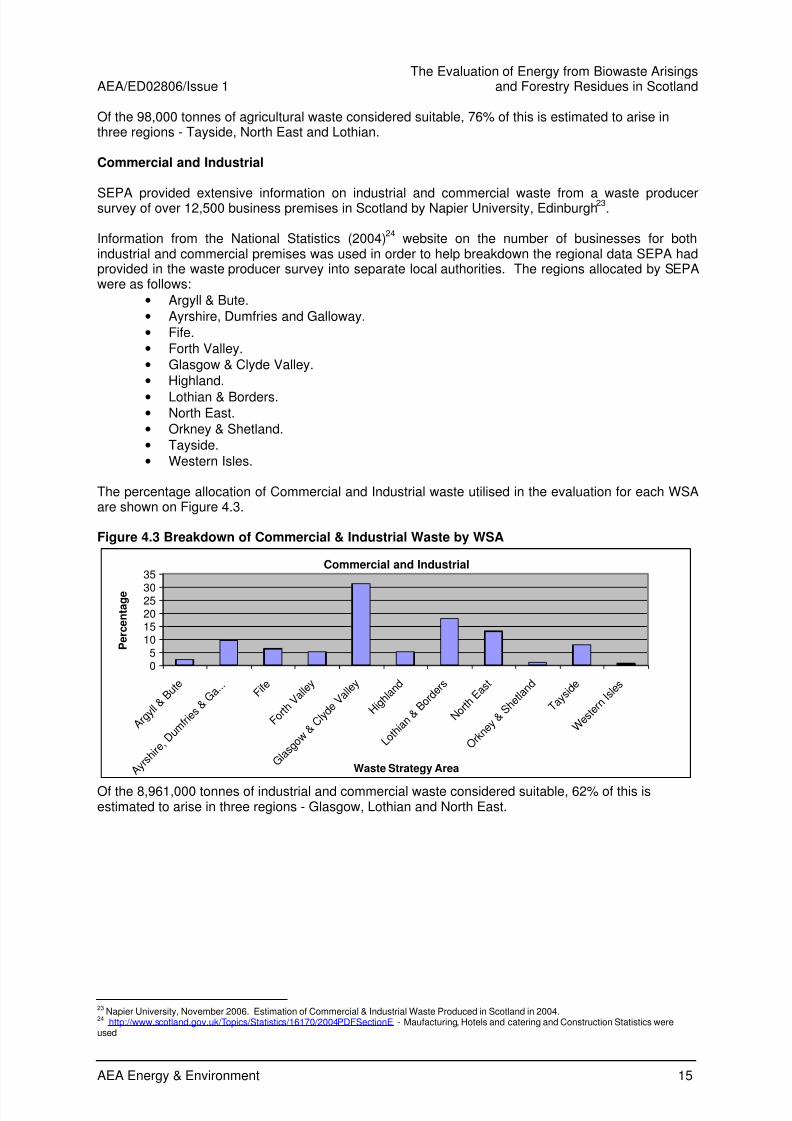
SEPA provided extensive information on industrial and commercial waste from a waste producersurvey of over 12,500 business premises in Scotland by Napier University, Edinburgh23
.
Information from the National Statistics (2004)24
website on the number of businesses for bothindustrial and commercial premises was used in order to help breakdown the regional data SEPA hadprovided in the waste producer survey into separate local authorities. The regions allocated by SEPAwere as follows:
• Argyll & Bute.
• Ayrshire, Dumfries and Galloway.
• Fife.• Forth Valley.
• Glasgow & Clyde Valley.
• Highland.
• Lothian & Borders.• North East.
• Orkney & Shetland.
• Tayside.
• Western Isles.
The percentage allocation of Commercial and Industrial waste utilised in the evaluation for each WSAare shown on Figure 4.3.
Figure 4.3 Breakdown of Commercial & Industrial Waste by WSA
Commercial and Industrial
05
1015202530
35
A r g y l l &
B u t e
A y r s h i r e
, D u m
f r i e s &
G a . .
. F i f
e
F o r t h
V a l l e y
G l a s g o w & C l y d e V
a l l e y
H i g h l a n
d
L o t h i
a n & B o r d
e r s
N o r t h
E a s t
O r k n
e y & S h e t l a
n d
T a y s i d e
W e s t e r
n I s l e
s
Waste Strategy Area
P e r c e n t a g e
Of the 8,961,000 tonnes of industrial and commercial waste considered suitable, 62% of this isestimated to arise in three regions - Glasgow, Lothian and North East.
23 Napier University, November 2006. Estimation of Commercial & Industrial Waste Produced in Scotland in 2004.
24 http://www.scotland.gov.uk/Topics/Statistics/16170/2004PDFSectionE - Maufacturing, Hotels and catering and Construction Statistics were
used
8/12/2019 SEPA- Report on Biowaste
http://slidepdf.com/reader/full/sepa-report-on-biowaste 26/95
The Evaluation of Energy from Biowaste Arisingsand Forestry Residues in Scotland AEA/ED02806/Issue 1
16 AEA Energy & Environment
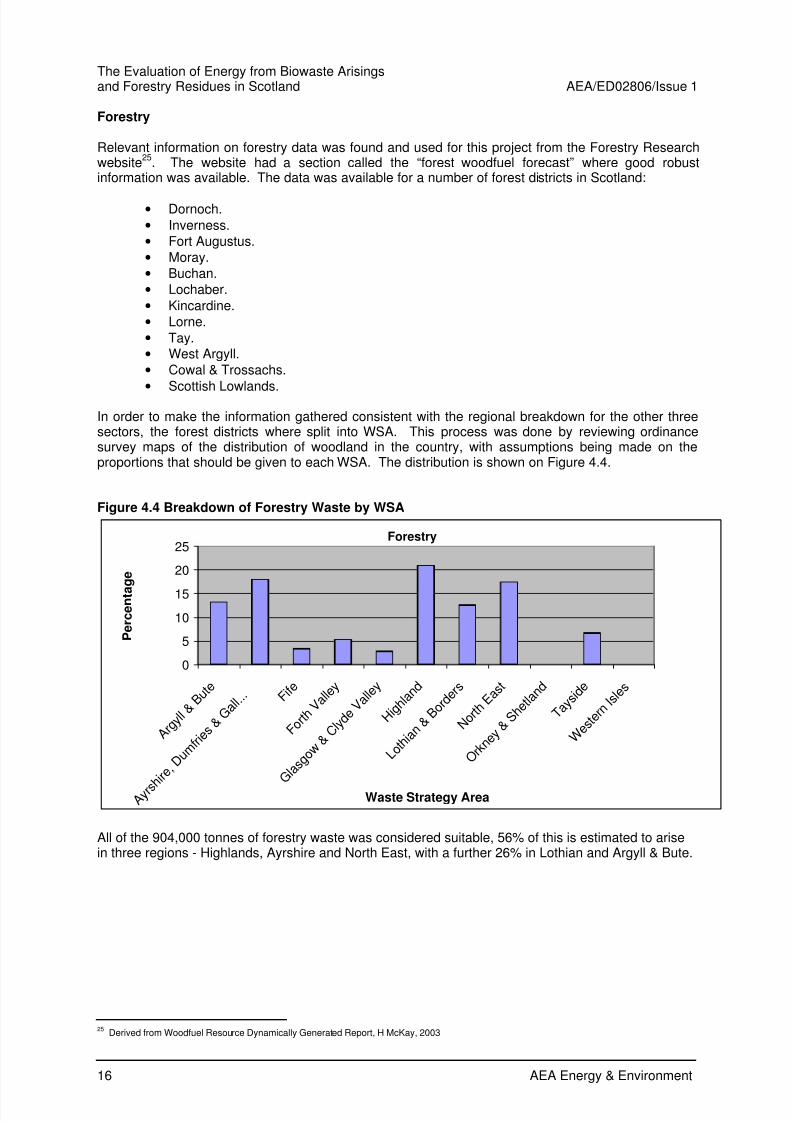
Forestry
Relevant information on forestry data was found and used for this project from the Forestry Researchwebsite
25. The website had a section called the “forest woodfuel forecast” where good robust
information was available. The data was available for a number of forest districts in Scotland:
• Dornoch.
• Inverness.
• Fort Augustus.
• Moray.
• Buchan.
• Lochaber.
• Kincardine.
• Lorne.
• Tay.• West Argyll.
• Cowal & Trossachs.
•
Scottish Lowlands.
In order to make the information gathered consistent with the regional breakdown for the other threesectors, the forest districts where split into WSA. This process was done by reviewing ordinancesurvey maps of the distribution of woodland in the country, with assumptions being made on theproportions that should be given to each WSA. The distribution is shown on Figure 4.4.
Figure 4.4 Breakdown of Forestry Waste by WSA
Forestry
0
5
10
15
20
25
A r g y l l &
B u t e
A y r s h i r e
, D u m
f r i e s &
G a l l
. . . F i f e
F o r t h
V a l l e y
G l a s g o w & C l y d e V
a l l e y
H i g h l a
n d
L o t h i
a n & B o r d
e r s
N o r t h
E a s t
O r k n
e y & S h e t l a
n d
T a y s i d e
W e s t e r
n I s l e
s
Waste Strategy Area
P e r c e n t a g e
All of the 904,000 tonnes of forestry waste was considered suitable, 56% of this is estimated to arisein three regions - Highlands, Ayrshire and North East, with a further 26% in Lothian and Argyll & Bute.
25 Derived from Woodfuel Resource Dynamically Generated Report, H McKay, 2003
8/12/2019 SEPA- Report on Biowaste
http://slidepdf.com/reader/full/sepa-report-on-biowaste 27/95
The Evaluation of Energy from Biowaste ArisingsAEA/ED02806/Issue 1 and Forestry Residues in Scotland
AEA Energy & Environment 17
Slaughterhouse
SEPA were able to provide information for slaughterhouse waste for 2005. Information on locations ofslaughterhouses was located from the Food Standards Agency website, which provided a breakdownon the number of slaughterhouses within each WSA (the information was for 2004 and is the most up
to date from this website)26
. This information was then used in conjunction with the following regionalinformation on tonnages provided by SEPA to allocate Slaughterhouse waste by the following areas:
• Argyll & Bute.
• Ayrshire, Dumfries and Galloway.
• Fife.
• Forth Valley.
• Glasgow & Clyde Valley.
• Highland.
• Lothian & Borders.
• North East.
• Orkney & Shetland.
• Tayside.
• Western Isles.
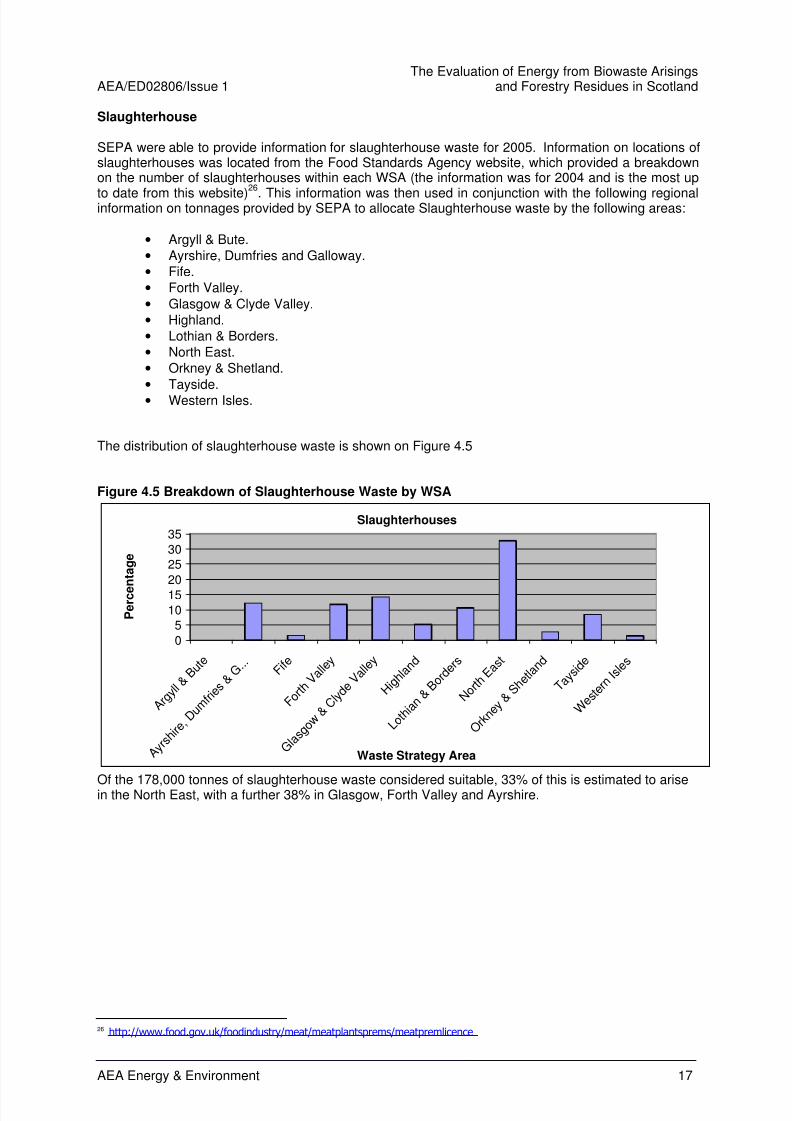
The distribution of slaughterhouse waste is shown on Figure 4.5
Figure 4.5 Breakdown of Slaughterhouse Waste by WSA
Slaughterhouses
0
5
10
15
20
2530
35
A r g y l l &
B u t e
A y r s h i r e
, D u m
f r i e s &
G . . . F i f
e
F o r t h
V a l l e y
G l a s g o w & C l y d e V
a l l e y
H i g h l a
n d
L o t h i
a n & B o r d
e r s
N o r t h
E a s t
O r k n
e y & S h e
t l a n d
T a y s i d e
W e s t e r
n I s l e
s
Waste Strategy Area
P e r c e
n t a g e
Of the 178,000 tonnes of slaughterhouse waste considered suitable, 33% of this is estimated to arisein the North East, with a further 38% in Glasgow, Forth Valley and Ayrshire.
26 http://www.food.gov.uk/foodindustry/meat/meatplantsprems/meatpremlicence
8/12/2019 SEPA- Report on Biowaste
http://slidepdf.com/reader/full/sepa-report-on-biowaste 28/95
The Evaluation of Energy from Biowaste Arisingsand Forestry Residues in Scotland AEA/ED02806/Issue 1
18 AEA Energy & Environment
MSW
Information on household waste was obtained from SEPA’s Waste Digest 7 having been initiallysupplied by each Local Authority. The wastes were broken down by Local Authority and were split
between Household, Commercial and Industrial Wastes with recycled and composted elementsaccounted for. It is worth pointing out that the Industrial and Commercial element of this waste arethose collected by each Local Authority and are not included under the ‘Commercial and Industrial’Section listed above. MSW waste was broken down by the following areas:
• Argyll & Bute.
• Ayrshire, Dumfries and Galloway.
• Fife.
• Forth Valley.
• Glasgow & Clyde Valley.
• Highland.
• Lothian & Borders.
• North East.
• Orkney & Shetland.
• Tayside.
• Western Isles.
Recycling rates were also obtained from the Waste Data Digest and these elements were removedfrom the total as recycling is the preferred treatment route. Indigestible and un-combustible/inertwastes were also removed from the total leaving only the putrescible or combustible element.
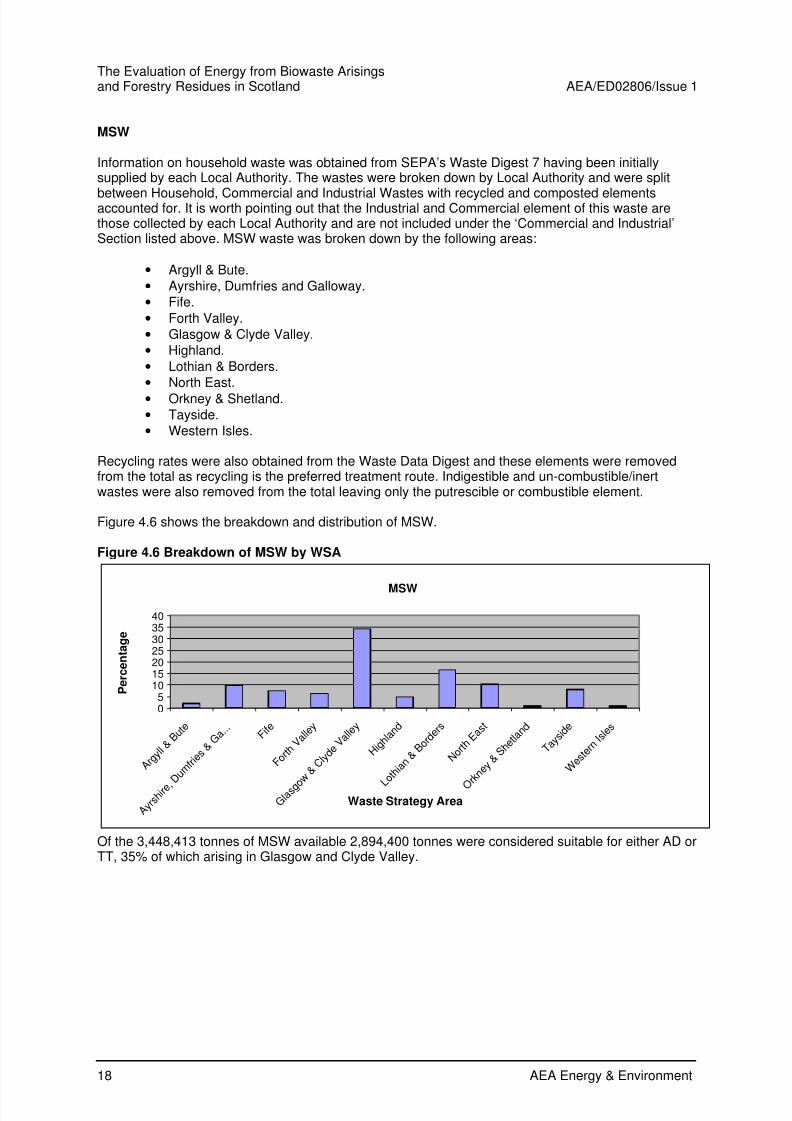
Figure 4.6 shows the breakdown and distribution of MSW.
Figure 4.6 Breakdown of MSW by WSA
MSW
05
10152025303540
A r g y l l &
B u t e
A y r s h
i r e , D u
m f r i e
s & G a . .
. F i f
e
F o r t h
V a l l e y
G l a s g o
w & C l y d e V
a l l e y
H i g h l a
n d
L o t h
i a n & B o r d
e r s
N o r t h
E a s t
O r k n
e y & S h e
t l a n d
T a y s i d e
W e s t e r
n I s l e
s
P e r c e n t a g e
Waste Strategy Area
Of the 3,448,413 tonnes of MSW available 2,894,400 tonnes were considered suitable for either AD orTT, 35% of which arising in Glasgow and Clyde Valley.
8/12/2019 SEPA- Report on Biowaste
http://slidepdf.com/reader/full/sepa-report-on-biowaste 29/95
The Evaluation of Energy from Biowaste ArisingsAEA/ED02806/Issue 1 and Forestry Residues in Scotland
AEA Energy & Environment 19
Sewage Sludge
This information was provided by SEPA who, as the regulating authority, Scottish Water report to. Dueto confidentiality between these two organisations a breakdown by WSA could not be obtained,
instead figures are broken down by region as listed below.
• North East.• North West.
• South East.
• South West.
For the purposes of this report only the sludge that is currently landfilled or reclaimed is included. Theremaining routes are considered to already be useful.
It is considered that the most efficient use of sewage sludge would be to use on site by Scottish Waterto meet their heating and electricity needs, with any excess being sold to the grid. This will limit thetransport, manpower, treatment and cost required to move the sludge offsite. This is in accordance
with the ‘proximity principle’’ as outlined in the National Waste Strategy.
Volumes of Sewage Sludge are likely to increase as Scottish Water diversifies the range of wastematerials it can manage at sewage treatment sites.
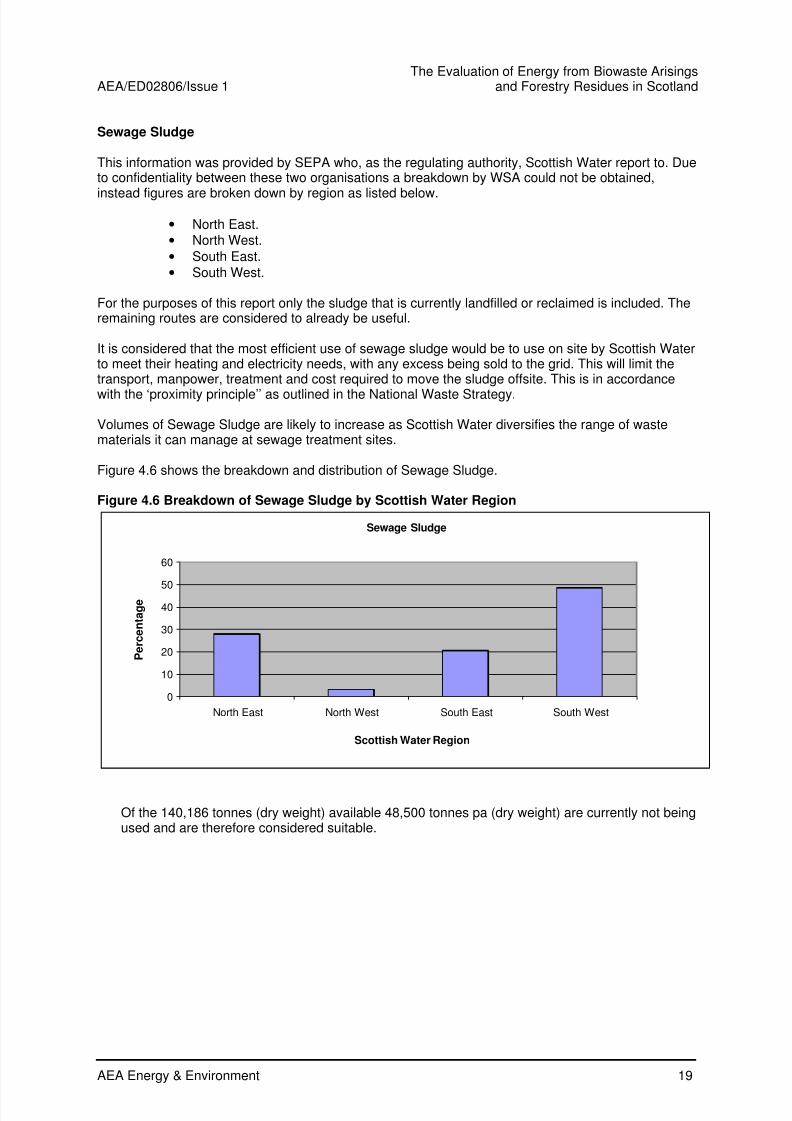
Figure 4.6 shows the breakdown and distribution of Sewage Sludge.
Figure 4.6 Breakdown of Sewage Sludge by Scottish Water Region
Sewage Sludge
0
10
20
30
40
50
60
North East North West South East South West
P e r c e n t a g e
Scottish Water Region
Of the 140,186 tonnes (dry weight) available 48,500 tonnes pa (dry weight) are currently not beingused and are therefore considered suitable.
8/12/2019 SEPA- Report on Biowaste
http://slidepdf.com/reader/full/sepa-report-on-biowaste 30/95
The Evaluation of Energy from Biowaste Arisingsand Forestry Residues in Scotland AEA/ED02806/Issue 1
20 AEA Energy & Environment
4.1.5 Energy Conversion
Information on electricity output from existing thermal treatment plants and fossil fuel boiler efficiencieswas obtained in order to establish whether the assumptions made and the results obtained from thisevaluation were robust. The fossil fuel boiler efficiency information is obtained from published data and
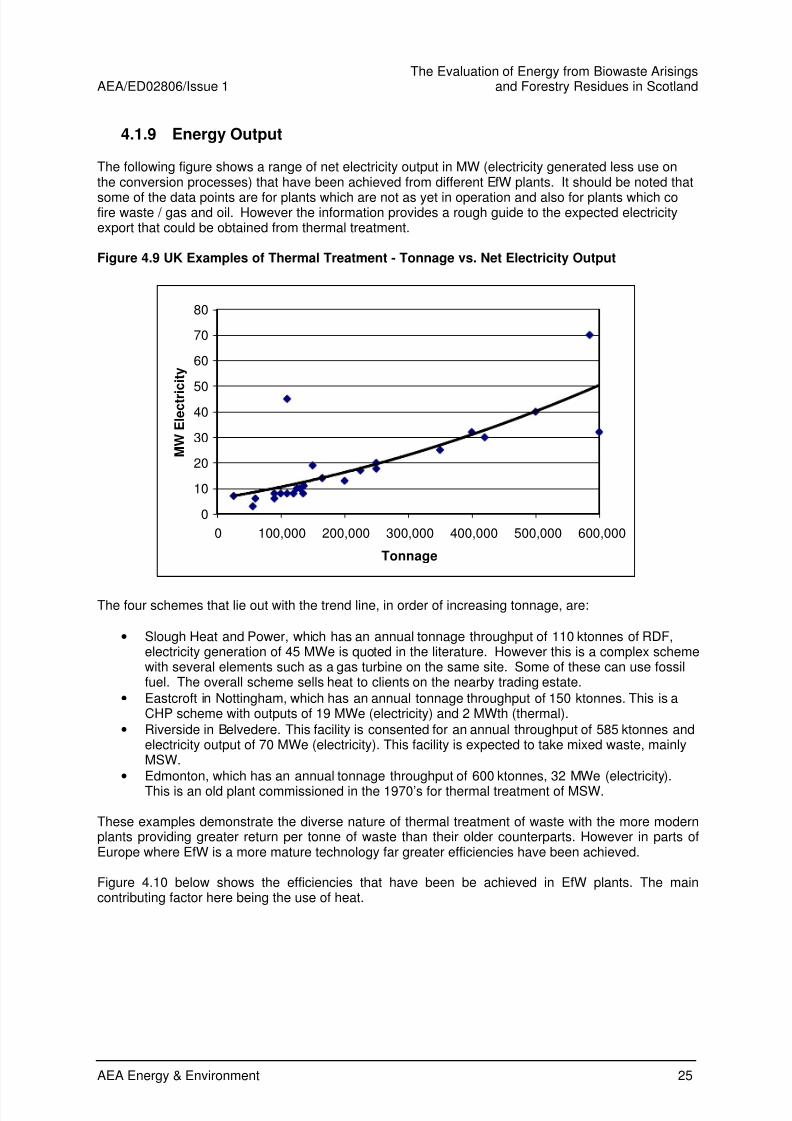
shows the range of efficiencies that can be expected. The CHP data is based on the UK CHPstatistics and the Cogeneration Directive. The energy outputs obtained are from existing and proposedthermal treatment plants and are detailed in Appendix 1 and summarised on Figure 4.8. This waspurely a form of sense checking and isn’t intended to directly compare boilers running on differentfuels.
4.1.6 Heat Conversion Efficiency
For all the conversion technologies there will be a range of energy conversion efficiencies. For aparticular conversion the efficiency will depend on a range of factors including:
• The calorific value of the fuel.
• The design efficiency of the conversion plant.• The maintenance of efficient conversion, through maintaining optimal fuel:air ratios,
management of blow down losses, effective heat transfer etc.• The operational profile, for example boilers running at part load have lower efficiency.
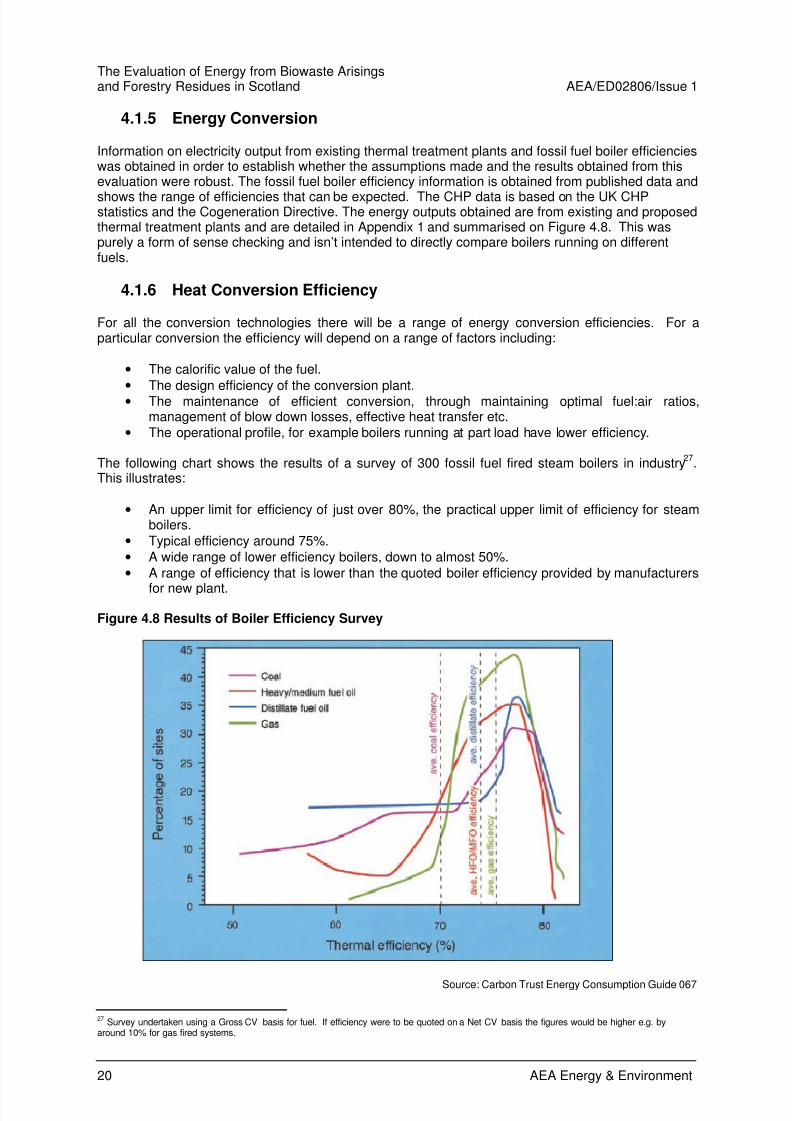
The following chart shows the results of a survey of 300 fossil fuel fired steam boilers in industry27
.This illustrates:
• An upper limit for efficiency of just over 80%, the practical upper limit of efficiency for steamboilers.
• Typical efficiency around 75%.
• A wide range of lower efficiency boilers, down to almost 50%.
• A range of efficiency that is lower than the quoted boiler efficiency provided by manufacturers
for new plant.
Figure 4.8 Results of Boiler Efficiency Survey
Source: Carbon Trust Energy Consumption Guide 067
27 Survey undertaken using a Gross CV basis for fuel. If efficiency were to be quoted on a Net CV basis the figures would be higher e.g. by
around 10% for gas fired systems.
8/12/2019 SEPA- Report on Biowaste
http://slidepdf.com/reader/full/sepa-report-on-biowaste 31/95
The Evaluation of Energy from Biowaste ArisingsAEA/ED02806/Issue 1 and Forestry Residues in Scotland
AEA Energy & Environment 21
As conversion of biowaste to energy is currently uncommon in the UK, there is no equivalent survey ofboilers burning biowastes. If such a survey were to be possible in the future it would be likely to show:
• A upper limit for efficiency below that found for fossil fuel boilers, due to the lower calorificvalue of the fuel, the higher excess air needed for combustion of waste material and thehigher moisture content. In addition, biowaste boilers will be physically larger than their fossilfuel equivalents, leading to higher radiant heat losses.
• A lower value for the typical efficiency, for the above reasons.
• A broader range of efficiency values, as the type and composition of biowaste will vary overtime, unlike fossil fuels which must meet defined standards.
The way in which biowaste boilers are used will also have an impact on efficiency levels. Wherebiowaste is being used as a fuel, the plant has to process the fuel in a certain time irrespective of thelevel of heat needed by the on or off site heat consumers. The plant is normally designed to run at ahigh load factor and with the minimum amount of downtime for maintenance. In essence the plant will
be capable of provided a near constant level of heat. Heat consumers will seldom have constant, yearlong requirements for heat. If the heat produced from the boiler does not have a heat consumer, thenthe excess heat energy may have to be rejected to atmosphere; this will lower the resource efficiency.Generating electricity using an extraction/condensing steam turbine via CHP is one way of addressingthis issue.
It is worth noting that the reference efficiency values for heat production used in the EU CogenerationDirective are 80% for Agricultural and Municipal wastes, with 86% used for Wood fuels (Net CVbasis)
28. While these are figures to be used to test the performance of cogeneration systems, rather
than specific figures for a particular plant, they provide a useful benchmark.
To cope with these uncertainties in boiler efficiency, this review uses a range of heat conversionefficiencies, 65%, 75% and 90%, representing low, medium and high levels of heat conversion. The
range of efficiencies was also intended to consider other uncertainties, for example size of scheme.
4.1.7 Electricity Generation Efficiency
Three technologies for electricity generation are considered in this study:
• Steam Turbine – this would be used with thermal treatment plant.A Steam turbine engine uses the thermal energy found in steam (from water boiled as a resultof incineration in this case) and converts it into useful mechanical energy. This is then used todrive an electrical generator.
• Biogas Engine – this would be used with the biogas from an anaerobic digestion plant.This runs in the same way as any reciprocating, or internal combustion, engine in that fuel is
oxidised then combusted causing an expansion of hot gases which drives pistons, thismechanical movement can be used to drive an electric generator.
• Biogas Turbine – this would be used with the biogas from an anaerobic digestion plant. Thisworks in the same way as a steam turbine except the fuel is burnt and the hot combustiongases drive the turbine.
There are a number of issues with the use of biogas, be it in an engine or turbine:
• Biogas has a higher hydrogen sulphide content. When combusted, SO2 is released and cancombine with water and create sulphuric acid, which is corrosive to engine parts.
• Higher water content means water condensate is more likely to build up causing corrosion andwashing of engine oils resulting in more wear.
• There tends to be more debris in biofuels which causes wear and corrosion throughout theengine or turbine.
28 Commission Decision of 21 Dec 2006 – 2007/74/EC
8/12/2019 SEPA- Report on Biowaste
http://slidepdf.com/reader/full/sepa-report-on-biowaste 32/95
The Evaluation of Energy from Biowaste Arisingsand Forestry Residues in Scotland AEA/ED02806/Issue 1
22 AEA Energy & Environment
Biogas engines and turbines therefore need to be more resistant to corrosion. This is done in anumber of ways:
• Use of ‘yellow’ metals such as brass or bronze should be avoided.
• Lubricant temperatures are often raised to reduce condensate.• Base or slightly alkaline lubricants can be used to prevent oils from becoming acidic.
• Biogas engines operate at higher temperatures to avoid condensation of acids.
• A coalescing filter can be used to remove water (this will also capture debris).
• A particle filter is used to remove debris (this reduces the need to replace coalescing filters).
The primary route to generate electricity in a biowaste combustion plant is to raise steam in a steamboiler. This steam is used to drive a steam turbine and hence to generate electricity. In a large coalfired power station this technology can be optimised to provide efficiency levels up to 44% (Net CVbasis)
29. Electricity generation efficiency will be lower in the smaller scale steam turbines that will be
used in plants that use biowaste materials as fuel. The Cogeneration Directive reference values forelectricity generation efficiency are 33% for wood fuel systems, and 25% for Agricultural and Municipalwastes (Net CV basis). Electricity is used within the electricity generation process and for the
mechanical handling equipment in the EfW scheme. Hence a lower level of electricity generationefficiency should be used to account for the on site use. The Jacobs study suggests a figure of 21%,as this is below the range quoted above, so this is a reasonable and conservation assumption.
For wet waste material treated in anaerobic digestion, the biogas that is produced can be used to fuela biogas engine. If the biogas is suitable this offers a higher level of energy efficiency than the thermaltreatment/steam turbine route. The composition of the biogas will determine the suitability for use inan engine, with the main concerns being contaminants that will impair the engine’s operational life.The potential contaminants will depend on the chemical composition of the feedstock for the anaerobicdigestion process.
The electrical efficiency of biogas engine systems will depend on the design, the size of the engineand the percentage load. Electrical efficiency increases with engine size. Heat can be recovered
from the engine flue gas and the engine cooling system. Some of this heat is needed to keep theanaerobic digestion process at optimal temperature for biogas production. This arrangement is oftenfound in sewage gas anaerobic digestion schemes.
The amount of heat that is needed by the anaerobic digestion process will depend on a number offactors. For example, mesophilic processes will require less heat than thermophilic processes. Therewill be seasonal variations, with more heat needed in the winter months. In this study it is assumedthat 20% of the energy content of the biogas is used to heat the anaerobic digestion process.
30
As commented elsewhere in this report, the recovery of additional heat will be more practical forsmaller schemes that can be located closer to heat consumers. Hence the efficiency of small-scalebiogas engines should be the reference point for this study.
The Cogeneration Directive does not provide any reference figures for anaerobic digestion and biogasengines – as the reference figures are linked to fuel types and not to the type of conversiontechnology. Manufacturers specifications for biogas engines range from 33% (30 kWe) to 38% (1,000kWe)
31. The lower figure corresponds with the efficiency data used by Jacobs in their parallel study;
hence 33% has been used in this study.
The final option is to use a gas turbine with the biogas produced in an anaerobic digestion scheme.Small-scale gas turbines suitable for use with biogas became available from the late 1990’s.
When compared with a gas engine of the same power output, a gas turbine will always have a lowerefficiency. For this reason they are seldom found on sewage gas anaerobic digestion schemes. Thuswe have not included use of gas turbine technology in estimating the useful energy output frombiowastes.
29 See footnote 28
30 Extracted from Energy Efficiency Best Practice Prgramme Case Study 231
31 Source Ener-g website and converted to Net CV basis
8/12/2019 SEPA- Report on Biowaste
http://slidepdf.com/reader/full/sepa-report-on-biowaste 33/95
The Evaluation of Energy from Biowaste ArisingsAEA/ED02806/Issue 1 and Forestry Residues in Scotland
AEA Energy & Environment 23
The changes to the Renewables Obligation discussed in Section 6 are likely to increase interest inCHP rather than electricity only schemes.
4.1.8 Combined Heat and Power Efficiency
In a CHP system electricity is generated and some of the heat released during the process isrecovered and used to heat industrial processes, buildings or homes. Because of this, the overallenergy efficiency will always be higher than for an electricity only generation plant of the same scale.The actual level of efficiency will depend on the ability of the scheme to recover as much heat aspossible and to sell this to heat consumers.
Industrial CHP schemes are designed to match the size of the scheme to the level and pattern of heatdemands within the industrial processes that they serve. As a result they can achieve high levels ofenergy recovery and hence energy efficiency. This is reflected in the data for average efficiency ofCHP schemes in the UK in 2006 which was 72.7% (Net CV basis)
32. The UK statistics report
performance for “other” CHP schemes, which includes schemes in the agriculture, community heating,leisure, landfill and incineration sectors. This category will include schemes that are similar to the EfW
schemes considered in this study. The overall efficiency for the “other” category of CHP schemes is52% (Gross CV basis)
33.
In general any electricity generation scheme that recovers some heat can claim to be CHP. There areexamples of schemes where the heat recovered is a very small percentage of the fuel input – suchschemes do not provide a significant degree of energy efficiency or environmental benefit.
The development of revenue and capital support schemes for CHP led to the requirement todistinguish those CHP schemes that do provide significant energy and environmental benefits fromthose that do not. The first such scheme was the UK CHP Quality Assurance programme (CHPQA)
34.
More recently the Cogeneration Directive has put in place EU wide rules and definitions.
The Cogeneration Directive provides a number of different approaches to assessing the performance
of CHP schemes. These are complex, so the UK is adopting an approach to change the definitionsused by the CHPQA programme so that UK operators and developers of CHP schemes do not needto refer directly to the Directive, but can continue with the reporting mechanisms used under theCHPQA programme.
The changes to the CHPQA will ensure that passing the CHPQA tests will match the requirements ofArticle 12 (2) of the Cogeneration Directive. In summary these are:
• For schemes over 25 MWe the overall efficiency is over 70% (Net CV basis).• For schemes between 1 MWe and 25 MWe the Primary Energy Savings (PES) compared to
efficiency reference values must be greater than or equal to 10%.
• For schemes below 1 MWe the Primary Energy Savings (PES) compared to efficiencyreference values must be greater than or equal to 0%.
From Figure 4.9, an electricity output of 25 MWe would correspond to a waste processing capacity ofaround 300,000 tonnes pa. The heat available from a scheme of this size would be many times higherthan the heat loads that are likely to be in the vicinity of the plant. Hence smaller plants will beinherently better suited to operation as CHP schemes. Thus in the following sections of this reportsmaller scale schemes are considered as the exemplars.
32 Digest of UK Energy Statistics 2007 – Quotes Gross CV effiicency of 67.7% and that Net CV basis will be 5 points higher.
33 Digest of UK Energy Statistics 2007 – Analysis of Table 6.8 data is not available on a Net CV basis.
34 See www.chpqa.com

8/12/2019 SEPA- Report on Biowaste
http://slidepdf.com/reader/full/sepa-report-on-biowaste 34/95
The Evaluation of Energy from Biowaste Arisingsand Forestry Residues in Scotland AEA/ED02806/Issue 1
24 AEA Energy & Environment
The proposal for the revised Waste Framework Directive35
included in Annex II a definition for“recovery operations” for MSW schemes of 65% (Net CV basis) for schemes permitted after 31December 2008. However, the choice of this figure is not justified within the relevant text. To beconsistent with the Jacobs report we have used a figure for CHP efficiency of 65%. This is less than
the Cogeneration Directive target figure of 70% for larger schemes, which is in line with theassumption that smaller schemes are the likely route to develop CHP.
When considering CHP systems there is an additional aspect that needs to be considered for thethermal treatment route. This route will employ a steam turbine to generate electricity, via a gearboxand electrical generator. To maximise electricity generation the steam will be condensed at the exitfrom the steam turbine. The condensed heat will be at too low a temperature and pressure to supply toother consumers. Hence a different form of steam turbine is needed for CHP applications. Thisextracts some of the steam before it has passed through all stages of the turbine, providing steam thatcan be used to provide heat to other consumers. By extracting steam the electricity output of theturbine is slightly reduced. Typically, for every five units of heat exacted the electricity output will bereduced by 1 unit
36. Thus to achieve 65% total efficiency the electrical efficiency of the thermal
treatment/steam turbine CHP system would be 10% with heat efficiency of 55%.
35 COM (2005) 677 Final
36 This ratio is described in the CHPQA documentation as the Z ratio, this is influenced by the steam pressures used, a figure of 5:1 is typical for a
CHP system extracting steam for use in District Heating, see www.chpqa.com for more details.
8/12/2019 SEPA- Report on Biowaste
http://slidepdf.com/reader/full/sepa-report-on-biowaste 35/95
The Evaluation of Energy from Biowaste ArisingsAEA/ED02806/Issue 1 and Forestry Residues in Scotland
AEA Energy & Environment 25
4.1.9 Energy Output
The following figure shows a range of net electricity output in MW (electricity generated less use onthe conversion processes) that have been achieved from different EfW plants. It should be noted that
some of the data points are for plants which are not as yet in operation and also for plants which cofire waste / gas and oil. However the information provides a rough guide to the expected electricityexport that could be obtained from thermal treatment.
Figure 4.9 UK Examples of Thermal Treatment - Tonnage vs. Net Electricity Output
0
10
20
30
4050
60
70
80
0 100,000 200,000 300,000 400,000 500,000 600,000
Tonnage
M W E
l e c t r i c i t y
The four schemes that lie out with the trend line, in order of increasing tonnage, are:
• Slough Heat and Power, which has an annual tonnage throughput of 110 ktonnes of RDF,electricity generation of 45 MWe is quoted in the literature. However this is a complex schemewith several elements such as a gas turbine on the same site. Some of these can use fossilfuel. The overall scheme sells heat to clients on the nearby trading estate.
• Eastcroft in Nottingham, which has an annual tonnage throughput of 150 ktonnes. This is aCHP scheme with outputs of 19 MWe (electricity) and 2 MWth (thermal).
• Riverside in Belvedere. This facility is consented for an annual throughput of 585 ktonnes andelectricity output of 70 MWe (electricity). This facility is expected to take mixed waste, mainlyMSW.
• Edmonton, which has an annual tonnage throughput of 600 ktonnes, 32 MWe (electricity).This is an old plant commissioned in the 1970’s for thermal treatment of MSW.
These examples demonstrate the diverse nature of thermal treatment of waste with the more modernplants providing greater return per tonne of waste than their older counterparts. However in parts ofEurope where EfW is a more mature technology far greater efficiencies have been achieved.
Figure 4.10 below shows the efficiencies that have been be achieved in EfW plants. The maincontributing factor here being the use of heat.
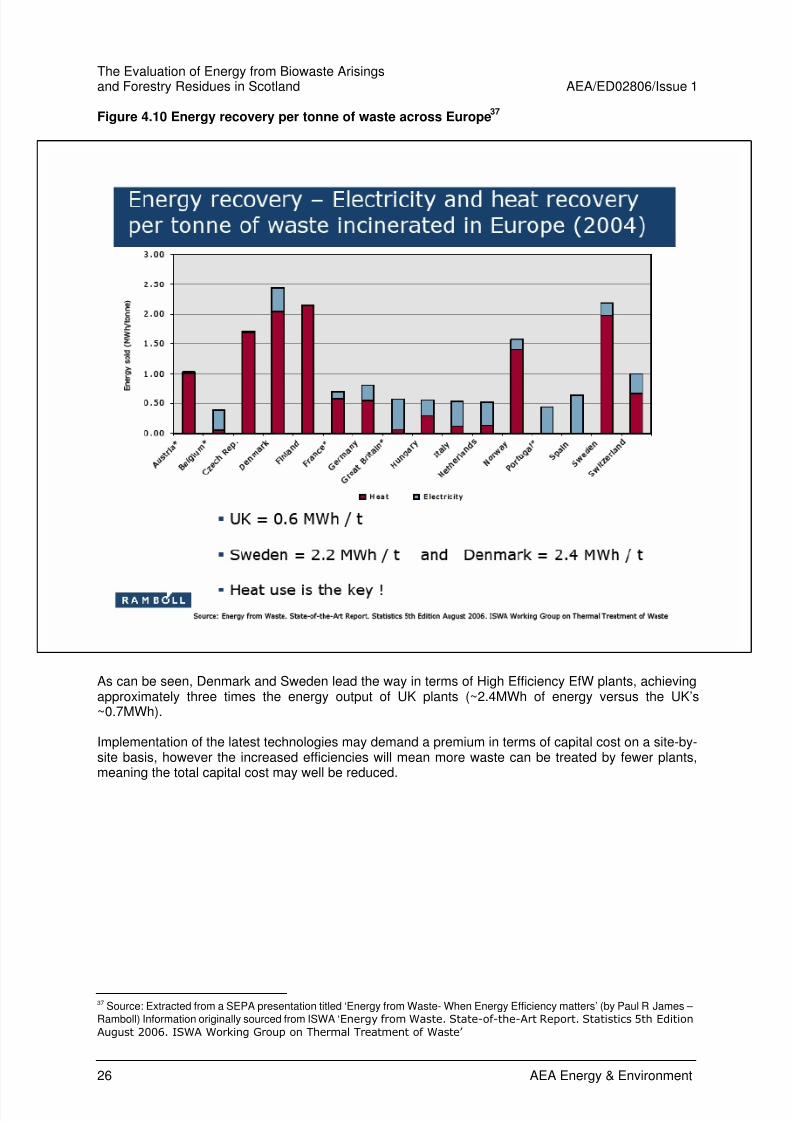
8/12/2019 SEPA- Report on Biowaste
http://slidepdf.com/reader/full/sepa-report-on-biowaste 36/95
The Evaluation of Energy from Biowaste Arisingsand Forestry Residues in Scotland AEA/ED02806/Issue 1
26 AEA Energy & Environment
Figure 4.10 Energy recovery per tonne of waste across Europe37
As can be seen, Denmark and Sweden lead the way in terms of High Efficiency EfW plants, achievingapproximately three times the energy output of UK plants (~2.4MWh of energy versus the UK’s~0.7MWh).
Implementation of the latest technologies may demand a premium in terms of capital cost on a site-by-site basis, however the increased efficiencies will mean more waste can be treated by fewer plants,meaning the total capital cost may well be reduced.
37 Source: Extracted from a SEPA presentation titled ‘Energy from Waste- When Energy Efficiency matters’ (by Paul R James –
Ramboll) Information originally sourced from ISWA ‘Energy from Waste. State-of-the-Art Report. Statistics 5th Edition
August 2006. ISWA Working Group on Thermal Treatment of Waste’
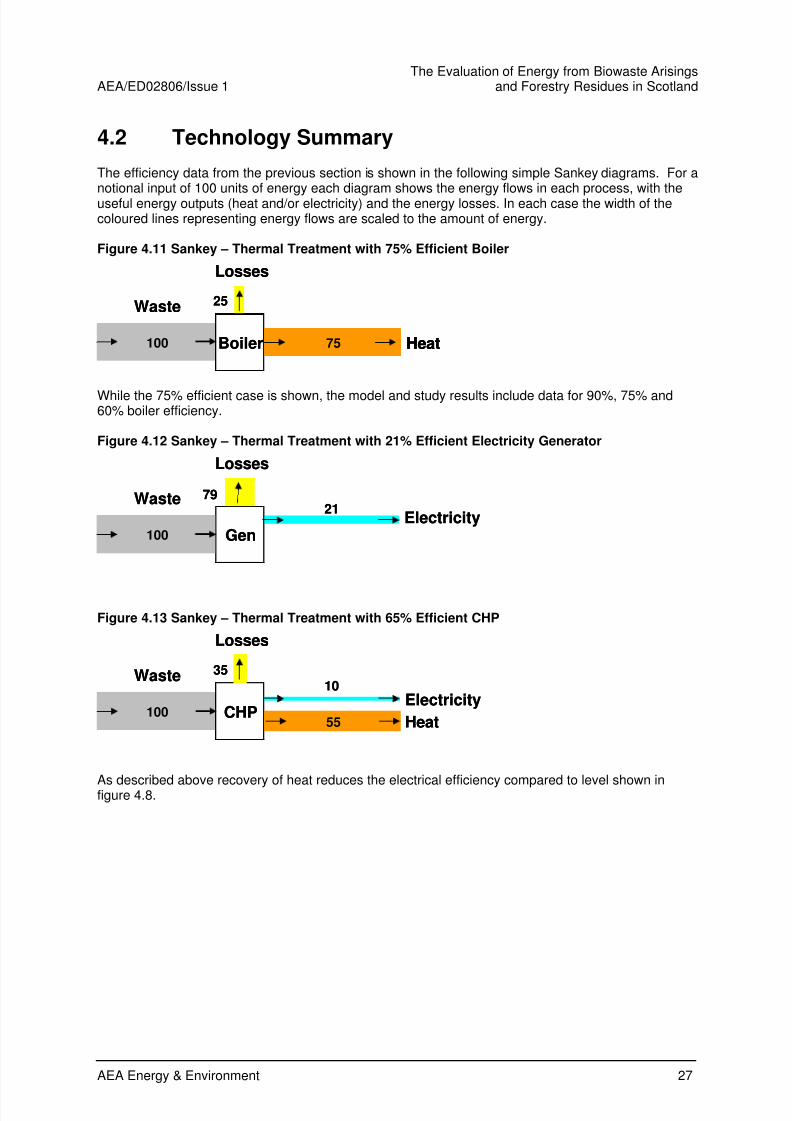
8/12/2019 SEPA- Report on Biowaste
http://slidepdf.com/reader/full/sepa-report-on-biowaste 37/95
The Evaluation of Energy from Biowaste ArisingsAEA/ED02806/Issue 1 and Forestry Residues in Scotland
AEA Energy & Environment 27
4.2 Technology Summary
The efficiency data from the previous section is shown in the following simple Sankey diagrams. For anotional input of 100 units of energy each diagram shows the energy flows in each process, with theuseful energy outputs (heat and/or electricity) and the energy losses. In each case the width of thecoloured lines representing energy flows are scaled to the amount of energy.
Figure 4.11 Sankey – Thermal Treatment with 75% Efficient Boiler
While the 75% efficient case is shown, the model and study results include data for 90%, 75% and60% boiler efficiency.
Figure 4.12 Sankey – Thermal Treatment with 21% Efficient Electricity Generator
Figure 4.13 Sankey – Thermal Treatment with 65% Efficient CHP
As described above recovery of heat reduces the electrical efficiency compared to level shown infigure 4.8.
Waste
Losses
25
100 Heat75Boiler
Waste
Losses
25
100100 Heat75 Heat75Boiler
Waste
Electricity
Heat
Losses
35
100
10
55CHP
Waste
Electricity
Heat
Losses
35
100100
10
5555CHP
WasteElectricity
Losses
79
100
21
Gen
WasteElectricity
Losses
79
100100
21
Gen
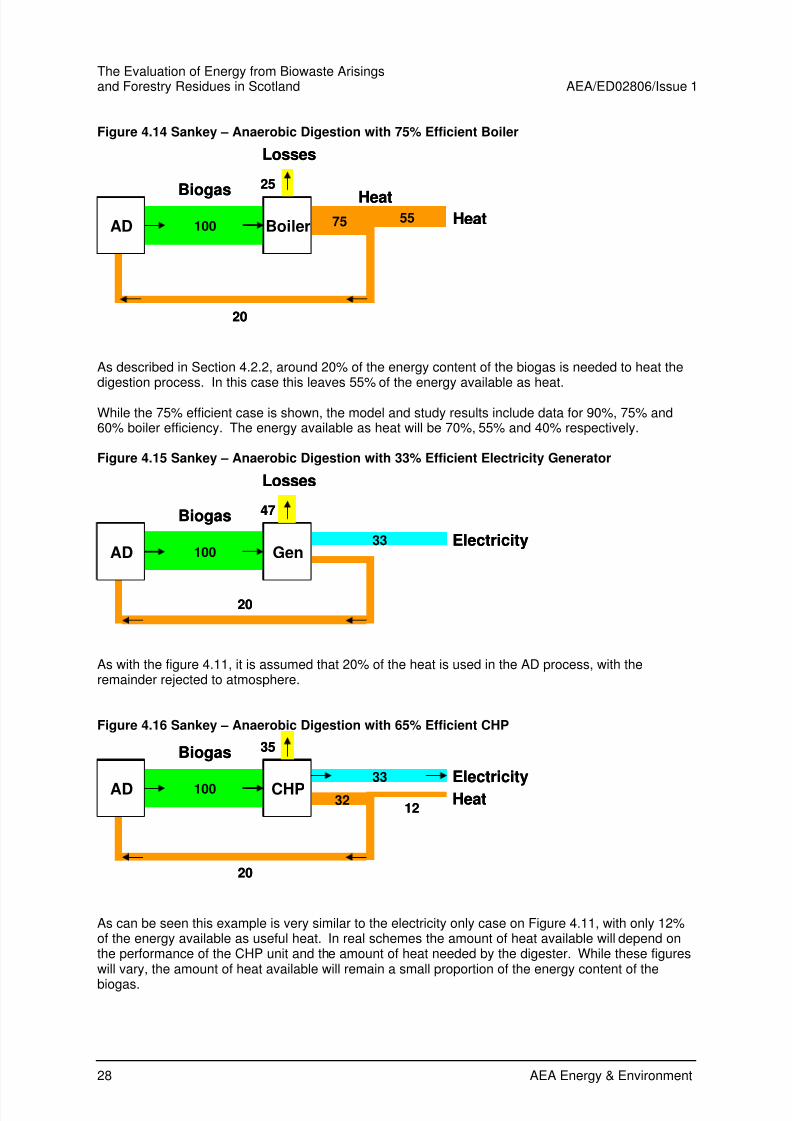
8/12/2019 SEPA- Report on Biowaste
http://slidepdf.com/reader/full/sepa-report-on-biowaste 38/95
The Evaluation of Energy from Biowaste Arisingsand Forestry Residues in Scotland AEA/ED02806/Issue 1
28 AEA Energy & Environment
Figure 4.14 Sankey – Anaerobic Digestion with 75% Efficient Boiler
As described in Section 4.2.2, around 20% of the energy content of the biogas is needed to heat thedigestion process. In this case this leaves 55% of the energy available as heat.
While the 75% efficient case is shown, the model and study results include data for 90%, 75% and60% boiler efficiency. The energy available as heat will be 70%, 55% and 40% respectively.
Figure 4.15 Sankey – Anaerobic Digestion with 33% Efficient Electricity Generator
As with the figure 4.11, it is assumed that 20% of the heat is used in the AD process, with theremainder rejected to atmosphere.
Figure 4.16 Sankey – Anaerobic Digestion with 65% Efficient CHP
As can be seen this example is very similar to the electricity only case on Figure 4.11, with only 12%of the energy available as useful heat. In real schemes the amount of heat available will depend onthe performance of the CHP unit and the amount of heat needed by the digester. While these figureswill vary, the amount of heat available will remain a small proportion of the energy content of the
biogas.
Losses
Biogas
Electricity
47
33100
20
GenAD
Losses
Biogas
Electricity
47
33100100
20
GenAD
25
Biogas75 55
HeatHeat
Losses
100
20
AD Boiler
25
Biogas75 55
HeatHeat
Losses
100100
20
AD Boiler
33
Biogas
32
Electricity
Heat
35
100
12AD
20
CHP3333
Biogas
32
Electricity
Heat
35
100100
12AD
20
CHP
8/12/2019 SEPA- Report on Biowaste
http://slidepdf.com/reader/full/sepa-report-on-biowaste 39/95
The Evaluation of Energy from Biowaste ArisingsAEA/ED02806/Issue 1 and Forestry Residues in Scotland
AEA Energy & Environment 29
In practical terms the level of heat will often be too low to recover and likely to be too low to considerinstalling a District Heating scheme. The most common anaerobic digestion application at present isfor treatment of sewage sludge. In some of these sites a small amount of heat is used for spaceheating and hot water in the site buildings. This practice is consistent with examples from this sector.
4.3 Modelling
The model used in this study has been designed to take the biowaste tonnages for each WSA and tocalculate the potential energy yield that could be expected if the biowaste could be collected for use.In order to make this as accurate as possible an extensive range of data on waste arisings has beengathered, checked and presented for each Local Authority and waste stream grouped in four principalcategories: Agriculture, Commercial and Industrial, Forestry and Slaughterhouse, the base linetonnages used are presented in Appendix 3.
4.3.1 Waste Suitable for Energy Use
Based on AEA’s expertise, various waste streams such as chemicals, asbestos roofing, animal healthcare etc. have been taken out of the analysis, as they are deemed not suitable for energy purposes.This is either because these are hazardous wastes and therefore subject to special treatment or theysimply cannot be digested nor combusted, at least not in an efficient, productive or economicallyviable way.
Waste arisings from agriculture and forestry in the “Agriculture, horticulture, aquaculture, forestry,hunting, fishing and food preparation” waste stream under the Industrial and Commercial wastecategory are similar to those from the Agricultural sector and the Forestry sector. The difference liesin the businesses involved. It means that, although they produce the same types of waste, thebusinesses in the Commercial and Industrial sector are not the same as those in the Agriculturalsector and from a logistics standpoint they each have distinct waste streams.
The following is a list of the wastes that are considered suitable for energy recovery, listed by sector.A detailed breakdown of all the waste streams considered is presented in Appendix 4 with thosesuitable for energy recovery detailed in Appendix 5.
Agriculture:
• Oils.*
• Plastics.*• Livestock mortalities and animal tissue.
• Fish waste.
• Milk waste.
Commercial and Industrial:
• Agriculture, Horticulture, aquaculture, forestry, hunting, fishing and food preparation.• Wood processing and production of panels and furniture, pulp, paper and cardboard.
• Wastes from leather, fur and textile industries.
• Oil wastes and wastes of liquid fuels (non-edible).
• Waste packing, absorbents, cloths, filters and protective clothing.**
• Construction and demolition. ***
• Municipal wastes (household, and similar commercial, industrial and institutional waste).
8/12/2019 SEPA- Report on Biowaste
http://slidepdf.com/reader/full/sepa-report-on-biowaste 40/95
The Evaluation of Energy from Biowaste Arisingsand Forestry Residues in Scotland AEA/ED02806/Issue 1
30 AEA Energy & Environment
Forestry, waste derived from the cultivation of:
• Stemwood 7-14 cm
• Stemwood 14-16 cm
• Stemwood 16-18 cm
• Stemwood 18+ cm• Poor Quality Wood
• Tips
• Branches
• Foliage
Slaughterhouse:
• Raw meat waste from slaughtering facilities.
MSW
• Putrescible or combustible waste not already being recycled.
Sewage Sludge
• The element that is currently being landfilled or reclaimed.
* Plastics and oil wastes are not bio-wastes as such but as oil derived products they have a non-negligible calorific value andcan theoretically be considered for thermal treatment. There are other economic and environmental issues about plastics thatmay lead to the conclusion that plastics and oil wastes are simply better for recycling. These issues will be discussed at a laterstage.
** Waste packaging is partly made up of wood and plastics. It is assumed that each material made up 15% of the total category.
*** Only the wood and plastics elements from construction and demolition waste are considered.
It should be noted that with the information currently available, only the above categories have apotential to recover energy. More detailed information on the waste composition could mean that acertain amount of waste previously discarded could potentially become re-classed as an energyresource. For example some types of waste arising from “Wastes not otherwise specified in the list” or“organic chemical processes” might turn out to be suitable for energy production. These twocategories represent a fair portion of the total waste and therefore if only a fraction of it is deemedsuitable it could still make a difference in the final energy figure. However at present it is consideredtoo speculative to determine any figure for the integration of unknown waste in the model.
Figure 4.17 below shows the waste category breakdown for each of the five sectors (excludingSewage Sludge).
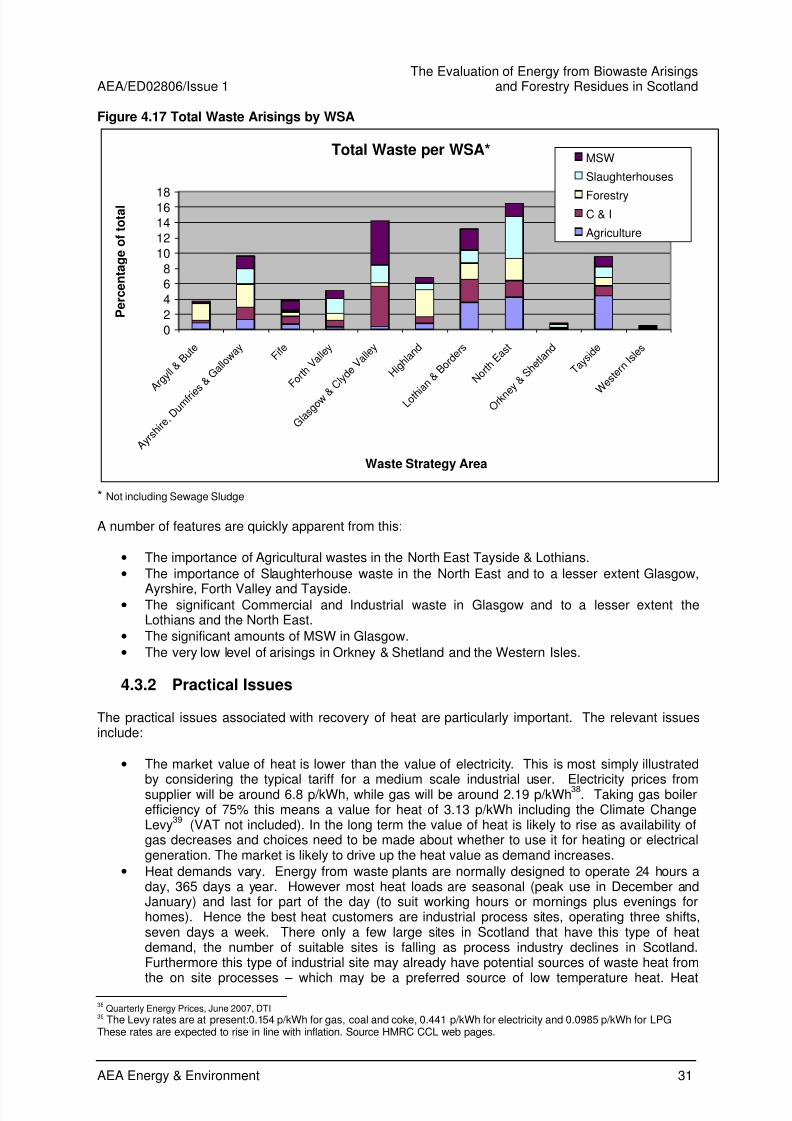
8/12/2019 SEPA- Report on Biowaste
http://slidepdf.com/reader/full/sepa-report-on-biowaste 41/95
The Evaluation of Energy from Biowaste ArisingsAEA/ED02806/Issue 1 and Forestry Residues in Scotland
AEA Energy & Environment 31
Figure 4.17 Total Waste Arisings by WSA
Total Waste per WSA*
0
2
4
68
10
12
141618
A r g y l l &
B u t e
A y r s h
i r e , D u m
f r i e s
& G a l l o w
a y F i f e
F o r t h
V a l l e y
G l a s g o
w & C l y d
e V a l l e y
H i g h l a
n d
L o t h i a
n & B o r d
e r s
N o r t h
E a s t
O r k n e y &
S h e
t l a n d
T a y s i d e
W
e s t e r
n I s l e
s
Waste Strategy Area
P e r c e n t a g e o f t o t a l
MSW
Slaughterhouses
ForestryC & I
Agriculture
* Not including Sewage Sludge
A number of features are quickly apparent from this:
• The importance of Agricultural wastes in the North East Tayside & Lothians.
• The importance of Slaughterhouse waste in the North East and to a lesser extent Glasgow,
Ayrshire, Forth Valley and Tayside.• The significant Commercial and Industrial waste in Glasgow and to a lesser extent the
Lothians and the North East.
• The significant amounts of MSW in Glasgow.
• The very low level of arisings in Orkney & Shetland and the Western Isles.
4.3.2 Practical Issues
The practical issues associated with recovery of heat are particularly important. The relevant issuesinclude:
• The market value of heat is lower than the value of electricity. This is most simply illustrated
by considering the typical tariff for a medium scale industrial user. Electricity prices fromsupplier will be around 6.8 p/kWh, while gas will be around 2.19 p/kWh38
. Taking gas boilerefficiency of 75% this means a value for heat of 3.13 p/kWh including the Climate ChangeLevy
39(VAT not included). In the long term the value of heat is likely to rise as availability of
gas decreases and choices need to be made about whether to use it for heating or electricalgeneration. The market is likely to drive up the heat value as demand increases.
• Heat demands vary. Energy from waste plants are normally designed to operate 24 hours aday, 365 days a year. However most heat loads are seasonal (peak use in December andJanuary) and last for part of the day (to suit working hours or mornings plus evenings forhomes). Hence the best heat customers are industrial process sites, operating three shifts,seven days a week. There only a few large sites in Scotland that have this type of heatdemand, the number of suitable sites is falling as process industry declines in Scotland.Furthermore this type of industrial site may already have potential sources of waste heat from
the on site processes – which may be a preferred source of low temperature heat. Heat38
Quarterly Energy Prices, June 2007, DTI39
The Levy rates are at present:0.154 p/kWh for gas, coal and coke, 0.441 p/kWh for electricity and 0.0985 p/kWh for LPGThese rates are expected to rise in line with inflation. Source HMRC CCL web pages.
8/12/2019 SEPA- Report on Biowaste
http://slidepdf.com/reader/full/sepa-report-on-biowaste 42/95
The Evaluation of Energy from Biowaste Arisingsand Forestry Residues in Scotland AEA/ED02806/Issue 1
32 AEA Energy & Environment
storage systems offer a solution to this problem and they would be worth considering. Theyuse a variety of materials, from water to pebbles, to store heat until it is needed. Howeverthese systems should only be considered where the heat cannot be directly used as they offera relatively short term solution.
• The cost of transporting heat. District Heating is found throughout Europe and is often
associated with EfW. In the UK there are relatively few District Heating schemes. Only onescheme in Scotland (Lerwick) has a large number of heat customers. Building a new DistrictHeating scheme is capital intensive, due to the cost of the pipes and the trenching required.In broad terms the costs is £1 million per mile of trench. This places restrictions on thedistance that heat can be piped to consumers, or requires a high level of heat sales to providesufficient income to justify the capital costs.
To illustrate the impact of these practical issues with heat recovery it is worth considering onesuccessful form of energy from biowaste. In 2006 there were 106 anaerobic digestion schemes on UKsewage treatment works registered under the Renewables Obligation, with a total generating capacityof 73 MW. Almost all of these schemes are CHP, with heat used to maintain the temperature in thedigestion tank. This heat load is present year round and at all times of the day - so it is in step with theavailability of heat from the CHP.
The CHP will produce more heat than is required by the digestion tank. In many cases this heat willbe rejected to the atmosphere via heat dump radiators. This is done because the heat is collectedfrom the jacket of the CHP engine, if this is not cooled the engine will overheat and cut out. Theoption of heat recovery for this additional heat is generally not implemented as the value is low, thereare limited opportunities to use this on site (occasionally there are some works offices) and the cost ofsale to other customers is too high as they will seldom be in close proximity to the water treatmentworks.
8/12/2019 SEPA- Report on Biowaste
http://slidepdf.com/reader/full/sepa-report-on-biowaste 43/95
The Evaluation of Energy from Biowaste ArisingsAEA/ED02806/Issue 1 and Forestry Residues in Scotland
AEA Energy & Environment 33
5 Model Results
In the previous section we set out the data on biowastes, by type and by Local Authority. When
combined with the calorific values of these wastes, this provides an assessment of the raw energycontent of the biowastes available. However, as useful energy is in the form of heat or electricity, thissection considers the different conversion options to recover useful energy from the raw energyavailable in the biowaste resources identified in Section 4. In some cases a significant portion of theenergy recovered is used within the conversion plant. The most important example of this is the useof some of the heat recovered from anaerobic digestion to maintain the temperature in the digestionprocess.
5.1 Suitable Energy Routes
One of the main objectives of this evaluation was to compare the suitability of the biowaste with regardto the conversion routes of thermal treatment and anaerobic digestion as described in Section 1. As
described previously, anaerobic digestion is more suitable for wet waste (high moisture content or lowsolid content) and combustion for drier wastes. The higher the moisture content the more efficient theprocess. Ideally a wet digestion process should contain 90% moisture meaning some wastes mayneed to be supplemented with water.
40 In the absence of further information it was assumed the
weights were for dry tonnage.
In general the above criteria is relevant to all wastes considered for treatment. However, theCommercial and Industrial waste categories needed more detailed consideration. This is because theyeach comprise a wide range of wastes that can either be digested, combusted, or both. For some, likeinert wastes, there is no alternative but to dispose of them to landfill. In order to overcome theseuncertainties a set of assumptions have been applied to the quantity of waste in each stream thatcould potentially be used.
In Construction and Demolition wastes, only wood and plastic materials are considered for energypurposes and this represents only 0.75% of those wastes. Municipal Waste was broken down basedon SEPA’s Waste Date Digest 7 information. This meant 45.5% of waste was deemed suitable forThermal Treatment and 26% for anaerobic digestion. For Waste Packaging and Absorbants 15% wasassumed to be wood, based on the DTI’s (now known as BERR) waste statistics and another 15%was attributed to account for paper, card, plastics and textiles. In absence of more information it hasbeen assumed that 70% and 80% of each category could be used for anaerobic digestion and thermaltreatment respectively. This principle has also been applied to the other categories (Agriculture,Forestry and Slaughterhouses) as explained below.
Municipal Waste Collected by Local Authorities presented a similar problem. The Waste Data Digest 7gave a breakdown of urban wastes and details of recycling rates per Local Authority. The recycledvolumes for each Local Authority were subtracted from the total. The remaining waste was then split
into three categories:
• Suitable for Anaerobic Digestion (26%).
• Suitable for Combustion (45.5%).
• Inert.
40 www.waste.nl/page/248
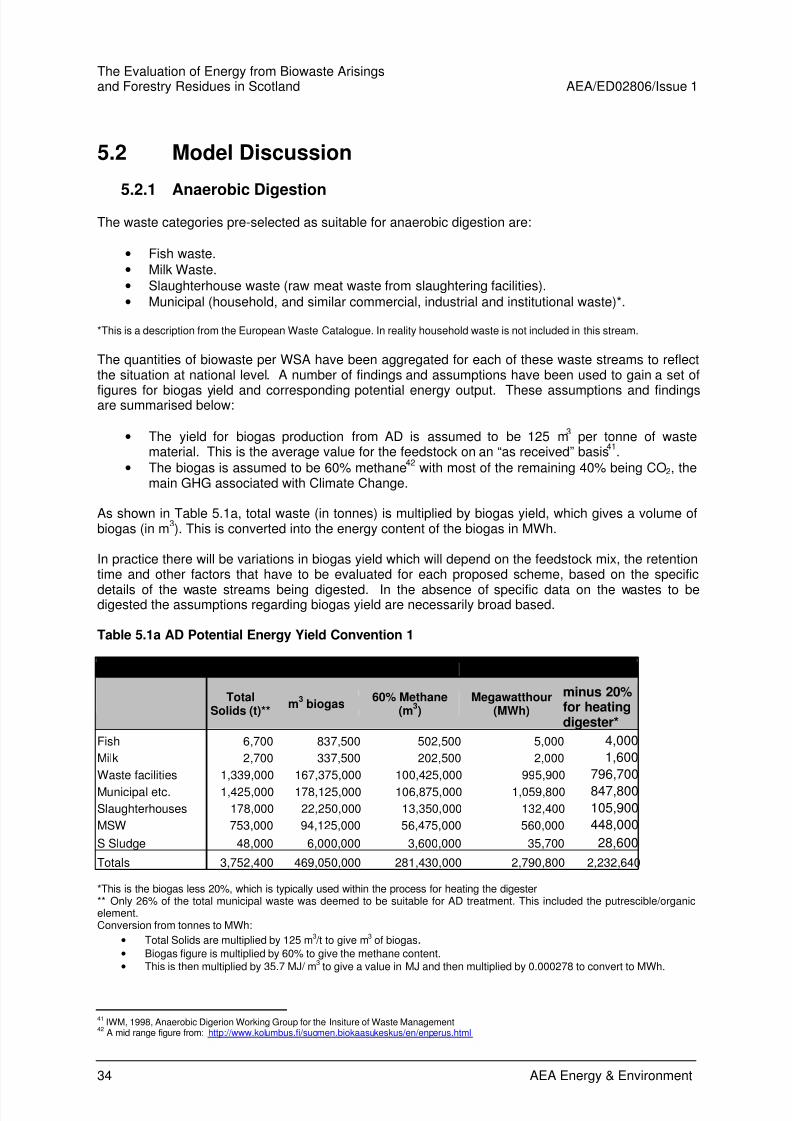
8/12/2019 SEPA- Report on Biowaste
http://slidepdf.com/reader/full/sepa-report-on-biowaste 44/95
The Evaluation of Energy from Biowaste Arisingsand Forestry Residues in Scotland AEA/ED02806/Issue 1
34 AEA Energy & Environment
5.2 Model Discussion
5.2.1 Anaerobic DigestionThe waste categories pre-selected as suitable for anaerobic digestion are:
• Fish waste.• Milk Waste.
• Slaughterhouse waste (raw meat waste from slaughtering facilities).
• Municipal (household, and similar commercial, industrial and institutional waste)*.
*This is a description from the European Waste Catalogue. In reality household waste is not included in this stream.
The quantities of biowaste per WSA have been aggregated for each of these waste streams to reflectthe situation at national level. A number of findings and assumptions have been used to gain a set of
figures for biogas yield and corresponding potential energy output. These assumptions and findingsare summarised below:
• The yield for biogas production from AD is assumed to be 125 m3 per tonne of waste
material. This is the average value for the feedstock on an “as received” basis41
.
• The biogas is assumed to be 60% methane42
with most of the remaining 40% being CO2, themain GHG associated with Climate Change.
As shown in Table 5.1a, total waste (in tonnes) is multiplied by biogas yield, which gives a volume ofbiogas (in m
3). This is converted into the energy content of the biogas in MWh.
In practice there will be variations in biogas yield which will depend on the feedstock mix, the retentiontime and other factors that have to be evaluated for each proposed scheme, based on the specific
details of the waste streams being digested. In the absence of specific data on the wastes to bedigested the assumptions regarding biogas yield are necessarily broad based.
Table 5.1a AD Potential Energy Yield Convention 1
AD Potential Energy Yield
TotalSolids (t)**
m3 biogas
60% Methane(m
3)
Megawatthour(MWh)
minus 20%for heatingdigester*
Fish 6,700 837,500 502,500 5,000 4,000
Milk 2,700 337,500 202,500 2,000 1,600
Waste facilities 1,339,000 167,375,000 100,425,000 995,900 796,700
Municipal etc. 1,425,000 178,125,000 106,875,000 1,059,800 847,800
Slaughterhouses 178,000 22,250,000 13,350,000 132,400 105,900
MSW 753,000 94,125,000 56,475,000 560,000 448,000
S Sludge 48,000 6,000,000 3,600,000 35,700 28,600
Totals 3,752,400 469,050,000 281,430,000 2,790,800 2,232,640 *This is the biogas less 20%, which is typically used within the process for heating the digester** Only 26% of the total municipal waste was deemed to be suitable for AD treatment. This included the putrescible/organicelement.Conversion from tonnes to MWh:
• Total Solids are multiplied by 125 m3 /t to give m
3 of biogas.
• Biogas figure is multiplied by 60% to give the methane content.
• This is then multiplied by 35.7 MJ/ m3 to give a value in MJ and then multiplied by 0.000278 to convert to MWh.
41 IWM, 1998, Anaerobic Digerion Working Group for the Insiture of Waste Management
42 A mid range figure from: http://www.kolumbus.fi/suomen.biokaasukeskus/en/enperus.html
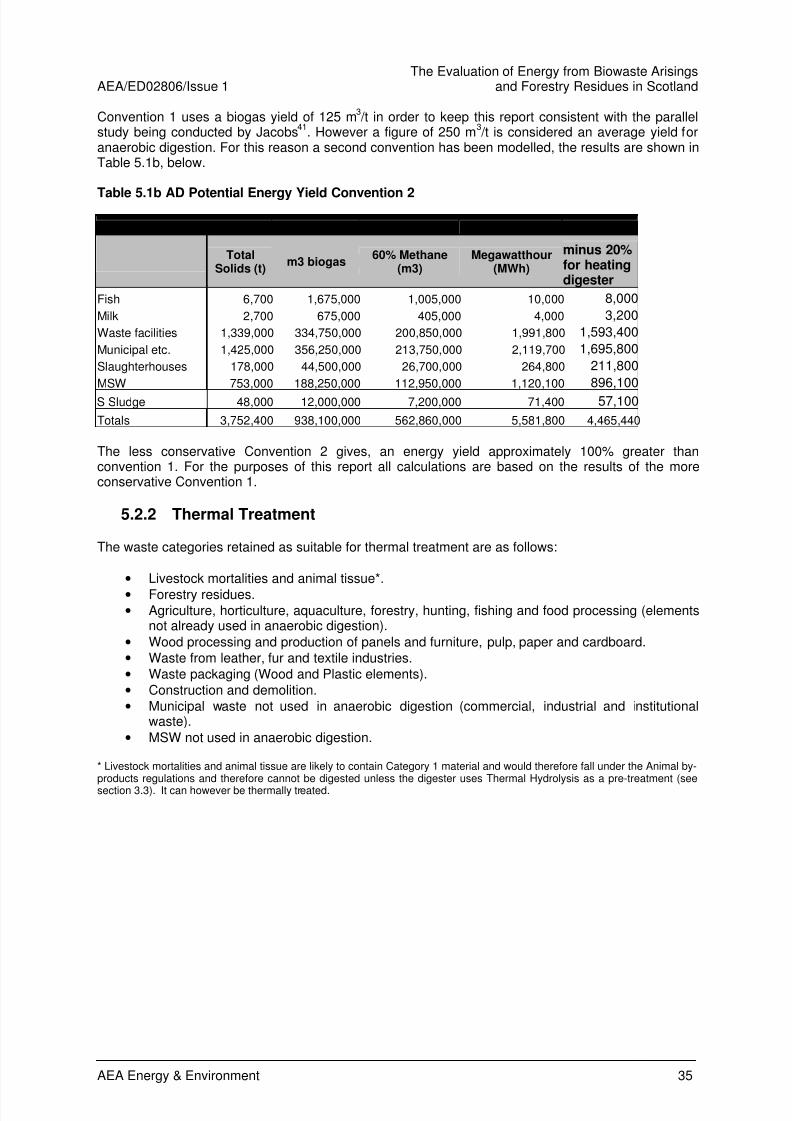
8/12/2019 SEPA- Report on Biowaste
http://slidepdf.com/reader/full/sepa-report-on-biowaste 45/95
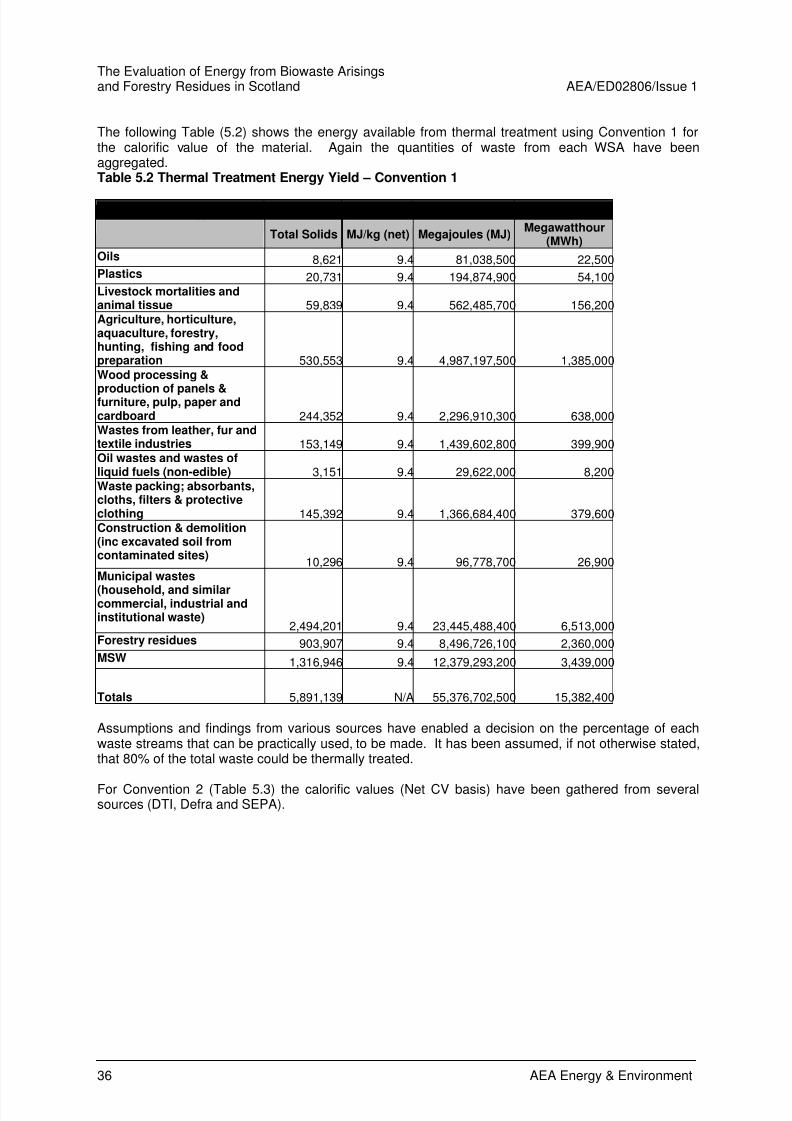
8/12/2019 SEPA- Report on Biowaste
http://slidepdf.com/reader/full/sepa-report-on-biowaste 46/95
The Evaluation of Energy from Biowaste Arisingsand Forestry Residues in Scotland AEA/ED02806/Issue 1
36 AEA Energy & Environment
The following Table (5.2) shows the energy available from thermal treatment using Convention 1 forthe calorific value of the material. Again the quantities of waste from each WSA have beenaggregated.Table 5.2 Thermal Treatment Energy Yield – Convention 1
TT Potential Energy Yield
Total Solids MJ/kg (net) Megajoules (MJ)Megawatthour
(MWh)
Oils 8,621 9.4 81,038,500 22,500Plastics 20,731 9.4 194,874,900 54,100Livestock mortalities andanimal tissue 59,839 9.4 562,485,700 156,200Agriculture, horticulture,aquaculture, forestry,hunting, fishing and foodpreparation 530,553 9.4 4,987,197,500 1,385,000Wood processing &
production of panels &furniture, pulp, paper andcardboard 244,352 9.4 2,296,910,300 638,000Wastes from leather, fur andtextile industries 153,149 9.4 1,439,602,800 399,900Oil wastes and wastes ofliquid fuels (non-edible) 3,151 9.4 29,622,000 8,200Waste packing; absorbants,cloths, filters & protectiveclothing 145,392 9.4 1,366,684,400 379,600Construction & demolition(inc excavated soil fromcontaminated sites)
10,296 9.4 96,778,700 26,900Municipal wastes
(household, and similarcommercial, industrial andinstitutional waste)
2,494,201 9.4 23,445,488,400 6,513,000Forestry residues 903,907 9.4 8,496,726,100 2,360,000MSW 1,316,946 9.4 12,379,293,200 3,439,000
Totals 5,891,139 N/A 55,376,702,500 15,382,400
Assumptions and findings from various sources have enabled a decision on the percentage of eachwaste streams that can be practically used, to be made. It has been assumed, if not otherwise stated,that 80% of the total waste could be thermally treated.
For Convention 2 (Table 5.3) the calorific values (Net CV basis) have been gathered from severalsources (DTI, Defra and SEPA).
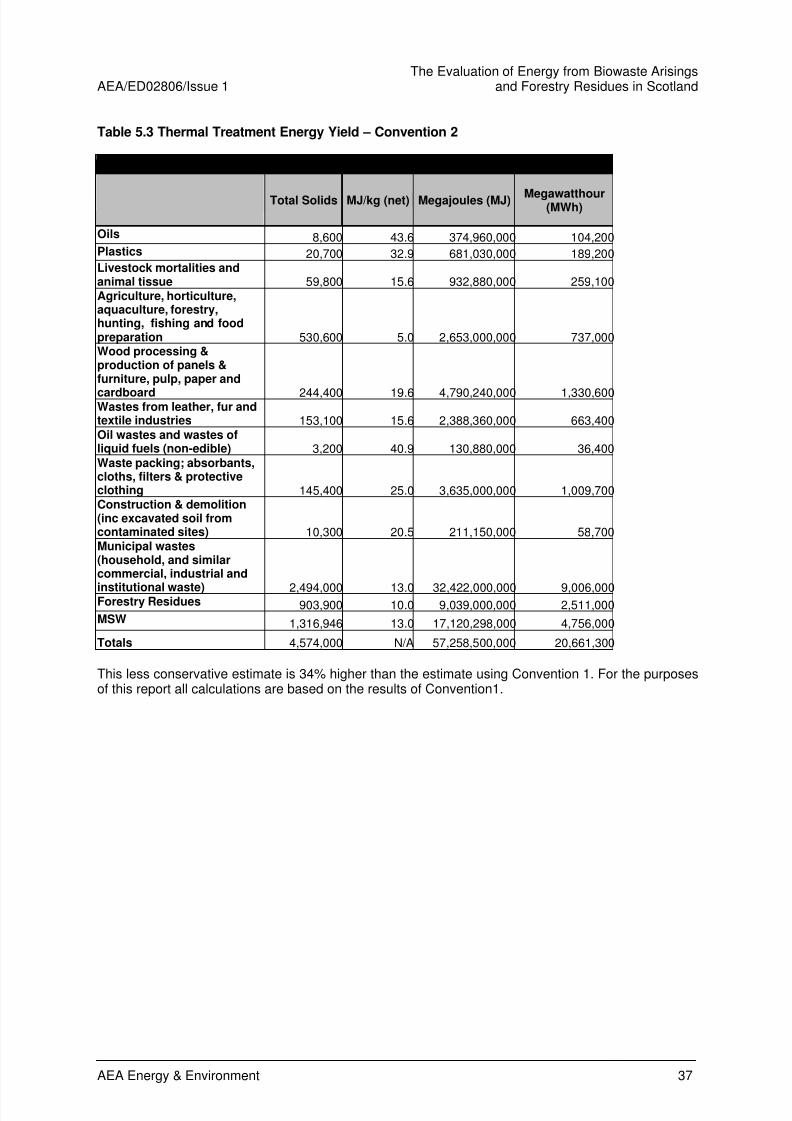
8/12/2019 SEPA- Report on Biowaste
http://slidepdf.com/reader/full/sepa-report-on-biowaste 47/95
The Evaluation of Energy from Biowaste ArisingsAEA/ED02806/Issue 1 and Forestry Residues in Scotland
AEA Energy & Environment 37
Table 5.3 Thermal Treatment Energy Yield – Convention 2
TT Potential Energy Yield
Total Solids MJ/kg (net) Megajoules (MJ) Megawatthour(MWh)
Oils 8,600 43.6 374,960,000 104,200Plastics 20,700 32.9 681,030,000 189,200Livestock mortalities andanimal tissue 59,800 15.6 932,880,000 259,100Agriculture, horticulture,aquaculture, forestry,hunting, fishing and foodpreparation 530,600 5.0 2,653,000,000 737,000Wood processing &production of panels &furniture, pulp, paper and
cardboard 244,400 19.6 4,790,240,000 1,330,600Wastes from leather, fur andtextile industries 153,100 15.6 2,388,360,000 663,400Oil wastes and wastes ofliquid fuels (non-edible) 3,200 40.9 130,880,000 36,400Waste packing; absorbants,cloths, filters & protectiveclothing 145,400 25.0 3,635,000,000 1,009,700Construction & demolition(inc excavated soil fromcontaminated sites) 10,300 20.5 211,150,000 58,700Municipal wastes(household, and similarcommercial, industrial and
institutional waste) 2,494,000 13.0 32,422,000,000 9,006,000Forestry Residues 903,900 10.0 9,039,000,000 2,511,000MSW 1,316,946 13.0 17,120,298,000 4,756,000
Totals 4,574,000 N/A 57,258,500,000 20,661,300
This less conservative estimate is 34% higher than the estimate using Convention 1. For the purposesof this report all calculations are based on the results of Convention1.
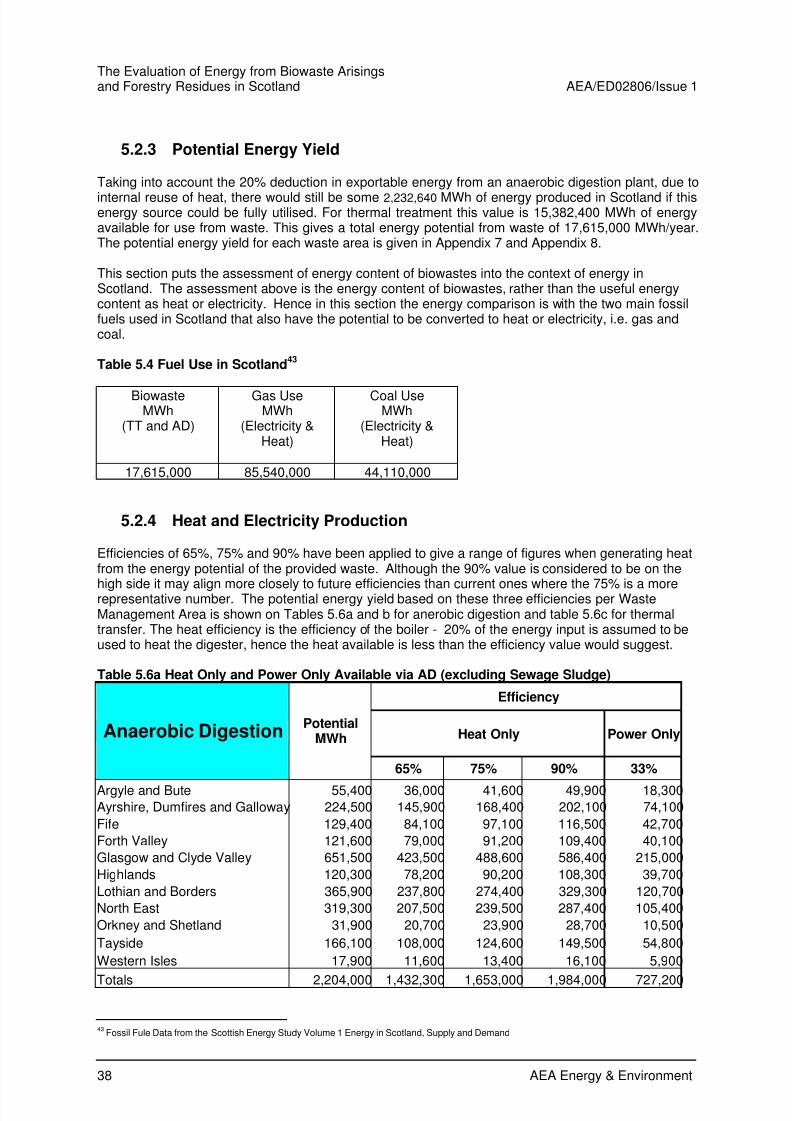
8/12/2019 SEPA- Report on Biowaste
http://slidepdf.com/reader/full/sepa-report-on-biowaste 48/95
The Evaluation of Energy from Biowaste Arisingsand Forestry Residues in Scotland AEA/ED02806/Issue 1
38 AEA Energy & Environment
5.2.3 Potential Energy Yield
Taking into account the 20% deduction in exportable energy from an anaerobic digestion plant, due to
internal reuse of heat, there would still be some 2,232,640 MWh of energy produced in Scotland if thisenergy source could be fully utilised. For thermal treatment this value is 15,382,400 MWh of energyavailable for use from waste. This gives a total energy potential from waste of 17,615,000 MWh/year.The potential energy yield for each waste area is given in Appendix 7 and Appendix 8.
This section puts the assessment of energy content of biowastes into the context of energy inScotland. The assessment above is the energy content of biowastes, rather than the useful energycontent as heat or electricity. Hence in this section the energy comparison is with the two main fossilfuels used in Scotland that also have the potential to be converted to heat or electricity, i.e. gas andcoal.
Table 5.4 Fuel Use in Scotland43
BiowasteMWh
(TT and AD)
Gas UseMWh
(Electricity &Heat)
Coal UseMWh
(Electricity &Heat)
17,615,000 85,540,000 44,110,000
5.2.4 Heat and Electricity Production
Efficiencies of 65%, 75% and 90% have been applied to give a range of figures when generating heatfrom the energy potential of the provided waste. Although the 90% value is considered to be on the
high side it may align more closely to future efficiencies than current ones where the 75% is a morerepresentative number. The potential energy yield based on these three efficiencies per WasteManagement Area is shown on Tables 5.6a and b for anerobic digestion and table 5.6c for thermaltransfer. The heat efficiency is the efficiency of the boiler - 20% of the energy input is assumed to beused to heat the digester, hence the heat available is less than the efficiency value would suggest.
Table 5.6a Heat Only and Power Only Available via AD (excluding Sewage Sludge)
Efficiency
Heat Only Power Only Anaerobic DigestionPotential
MWh
65% 75% 90% 33%
Argyle and Bute 55,400 36,000 41,600 49,900 18,300Ayrshire, Dumfires and Galloway 224,500 145,900 168,400 202,100 74,100
Fife 129,400 84,100 97,100 116,500 42,700
Forth Valley 121,600 79,000 91,200 109,400 40,100
Glasgow and Clyde Valley 651,500 423,500 488,600 586,400 215,000
Highlands 120,300 78,200 90,200 108,300 39,700
Lothian and Borders 365,900 237,800 274,400 329,300 120,700
North East 319,300 207,500 239,500 287,400 105,400
Orkney and Shetland 31,900 20,700 23,900 28,700 10,500
Tayside 166,100 108,000 124,600 149,500 54,800
Western Isles 17,900 11,600 13,400 16,100 5,900
Totals 2,204,000 1,432,300 1,653,000 1,984,000 727,200
43 Fossil Fule Data from the Scottish Energy Study Volume 1 Energy in Scotland, Supply and Demand
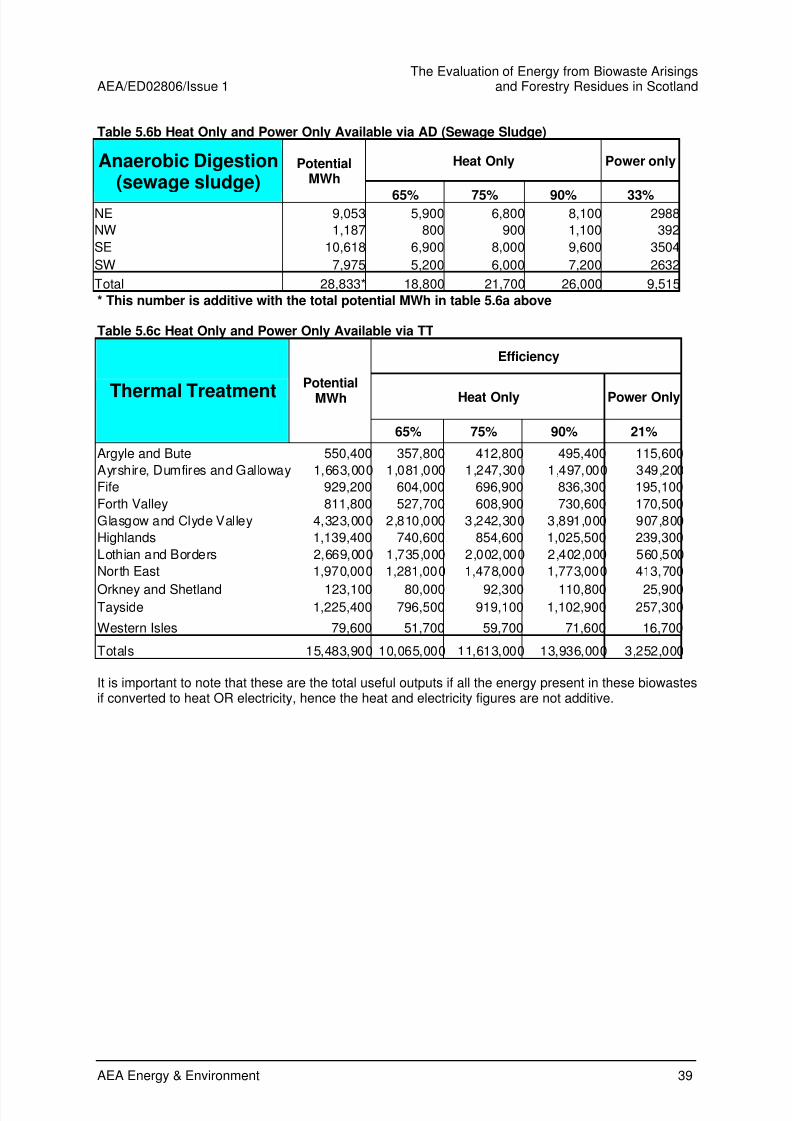
8/12/2019 SEPA- Report on Biowaste
http://slidepdf.com/reader/full/sepa-report-on-biowaste 49/95
The Evaluation of Energy from Biowaste ArisingsAEA/ED02806/Issue 1 and Forestry Residues in Scotland
AEA Energy & Environment 39
Table 5.6b Heat Only and Power Only Available via AD (Sewage Sludge)
Heat Only Power only Anaerobic Digestion(sewage sludge)
PotentialMWh
65% 75% 90% 33% NE 9,053 5,900 6,800 8,100 2988
NW 1,187 800 900 1,100 392
SE 10,618 6,900 8,000 9,600 3504
SW 7,975 5,200 6,000 7,200 2632
Total 28,833* 18,800 21,700 26,000 9,515
* This number is additive with the total potential MWh in table 5.6a above
Table 5.6c Heat Only and Power Only Available via TT
Efficiency
Heat Only Power Only Thermal TreatmentPotential
MWh
65% 75% 90% 21%
Argyle and Bute 550,400 357,800 412,800 495,400 115,600
Ayrshire, Dumfires and Galloway 1,663,000 1,081,000 1,247,300 1,497,000 349,200
Fife 929,200 604,000 696,900 836,300 195,100
Forth Valley 811,800 527,700 608,900 730,600 170,500
Glasgow and Clyde Valley 4,323,000 2,810,000 3,242,300 3,891,000 907,800
Highlands 1,139,400 740,600 854,600 1,025,500 239,300
Lothian and Borders 2,669,000 1,735,000 2,002,000 2,402,000 560,500
North East 1,970,000 1,281,000 1,478,000 1,773,000 413,700
Orkney and Shetland 123,100 80,000 92,300 110,800 25,900Tayside 1,225,400 796,500 919,100 1,102,900 257,300
Western Isles 79,600 51,700 59,700 71,600 16,700
Totals 15,483,900 10,065,000 11,613,000 13,936,000 3,252,000
It is important to note that these are the total useful outputs if all the energy present in these biowastesif converted to heat OR electricity, hence the heat and electricity figures are not additive.

8/12/2019 SEPA- Report on Biowaste
http://slidepdf.com/reader/full/sepa-report-on-biowaste 50/95
The Evaluation of Energy from Biowaste Arisingsand Forestry Residues in Scotland AEA/ED02806/Issue 1
40 AEA Energy & Environment
The following three Tables (5.7a, 5.7b and 5.7c) show the useful energy outputs for CHP. The 12%heat efficiency figure allows for the heat used in the anaerobic digestion process.
Table 5.7a CHP and AD (excluding Sewage Sludge)
Electrical efficiency Heat efficiency Anaerobic DigestionCHP
Potential MWh
33% 12%
Argyle and Bute 55,400 146,300 53,200
Ayrshire, Dumfires and Galloway 224,500 74,100 26,900
Fife 129,400 42,700 15,500
Forth Valley 121,600 40,100 14,600
Glasgow and Clyde Valley 651,500 215,000 78,200
Highlands 120,300 39,700 14,400Lothian and Borders 365,900 120,700 43,900
North East 319,300 105,400 38,300
Orkney and Shetland 31,900 10,500 3,800
Tayside 166,100 54,800 19,900
Western Isles 17,900 5,900 2,100
Totals 2,204,000 727,300 264,500
Table 5.7 b AD (Sewage Sludge)
Electrical efficiency Heat efficiency Anaerobic DigestionCHP (sewage sludge)
Potential MWh
33% 12% NE 9,053 3,000 1,100
NW 1,187 400 100
SE 10,618 3,500 1,300
SW 7,975 2,600 1,000
Total 28,833 9,500 3,500
Table 5.7c CHP and Thermal Treatment
Electrical efficiency Heat efficiency TT CHP Potential MWh
10 55
Argyle and Bute 550,400 55,000 302,700
Ayrshire, Dumfires and Galloway 1,663,000 166,300 914,700
Fife 929,200 92,900 511,100
Forth Valley 811,800 81,200 446,500
Glasgow and Clyde Valley 4,323,000 432,300 2,377,700
Highlands 1,139,400 113,900 626,700
Lothian and Borders 2,669,000 266,900 1,468,000
North East 1,970,000 197,000 1,083,500
Orkney and Shetland 123,100 12,300 67,700
Tayside 1,225,400 122,500 674,000
Western Isles 79,600 8,000 43,800
Totals 15,483,900 1,548,400 8,516,100

8/12/2019 SEPA- Report on Biowaste
http://slidepdf.com/reader/full/sepa-report-on-biowaste 51/95
The Evaluation of Energy from Biowaste ArisingsAEA/ED02806/Issue 1 and Forestry Residues in Scotland
AEA Energy & Environment 41
Table 5.8 Summary of Useful Energy Available
AnaerobicDigestion
ThermalTreatment
Total
Heat Only (75%) 1,674,750 11,613,000 13,287,750OR
Power Only 736,800 3,252,000 3,988,800
OR
CHP Power 736,800 1,548,400 2,285,200CHP Heat 268,000 8,516,100 8,784,100
In terms of electricity context, the potential to generate 736,800 MWh from anaerobic digestion plus3,252,000 MWh from thermal transfer i.e. 3,988,800MWh is 10.1% of total the electricity generation inScotland in 2005 of 39,398,000 MWh
44 (excluding exports). By using CHP instead of power only
schemes the total energy recovered (heat and power) would increase to 11,069,300.
44 BERR Energy Trends 2007
8/12/2019 SEPA- Report on Biowaste
http://slidepdf.com/reader/full/sepa-report-on-biowaste 52/95
The Evaluation of Energy from Biowaste Arisingsand Forestry Residues in Scotland AEA/ED02806/Issue 1
42 AEA Energy & Environment
6 Potential Barriers & Opportunities
To exploit biowaste as an energy source will require investment in the infrastructure and plant to
collect and convert the waste and to sell the useful energy to customers. To develop a project willrequire a range of parties to be involved, including:
• The industrial and commercial site operators whose activities produce the waste, who mayavoid the costs of waste disposal and who are also the most likely customers for heatproduced by the plant.
• Project developers who will develop the plants, organise the finance and undertake ongoingoperation of the facilities.
• Local Authorities who will have a strategic interest in the waste and environmental issues andwho also have a planning role.
• SEPA, who will have a regulatory role.• The electricity industry. The supply business may be the customer for the electricity
generated, and the distribution business may have the plant connected to their networks.
• Other stakeholders such as the public who have fundamental concerns about waste to energyand its local impacts.
There are several potential barriers that may detract from Scotland’s ability to develop an energy frombiowaste market. Three potential barriers are discussed below; these are not intended to be anexhaustive list and have not been selected as the most important barriers. They do however highlightthree important obstacles that will required to be overcome. The financial barriers will need to beaddressed with regard to providing the incentive to develop renewable schemes and the supportinfrastructure will need to be put in place. This may require changes in policy to be brought in whichencourage the market as well as help the market become established.
6.1 Financial
Financial issues are key to the successful exploitation of biowaste as an energy resource. Thefinancial benefits to the main parties will be the driver for collaboration and investment – without thisthere is unlikely to be significant development of plants. The fact that there are few example plants inthe UK could indicate that to date the financial attractiveness of biowaste to energy schemes havebeen insufficient to bring forward significant investment.
However over recent years a number of incentives have been put in place that will improve thefinancial position for these investments. These include:
• Landfill Allowance Trading Scheme (Scotland) (LAS).• Renewable Obligation Certificates (ROCs).
• Climate Change Levy (CCL).
• Enhanced Capital Allowance (ECA) for Good Quality CHP (GQ CHP).
• Landfill Tax.
• EU Emissions Trading Scheme.
ROCs provides additional revenue for electricity generation from qualifying renewable energy sourcesand technologies, i.e. where the biomass fraction is considered to be a renewable source of energyand the technology is deemed to need the financial incentive. As the value of the ROC is typicallytwice the wholesale price of the electricity, this is a potentially significant incentive. Hence thisadditional revenue is a key factor in the financial viability of the biowaste plant.
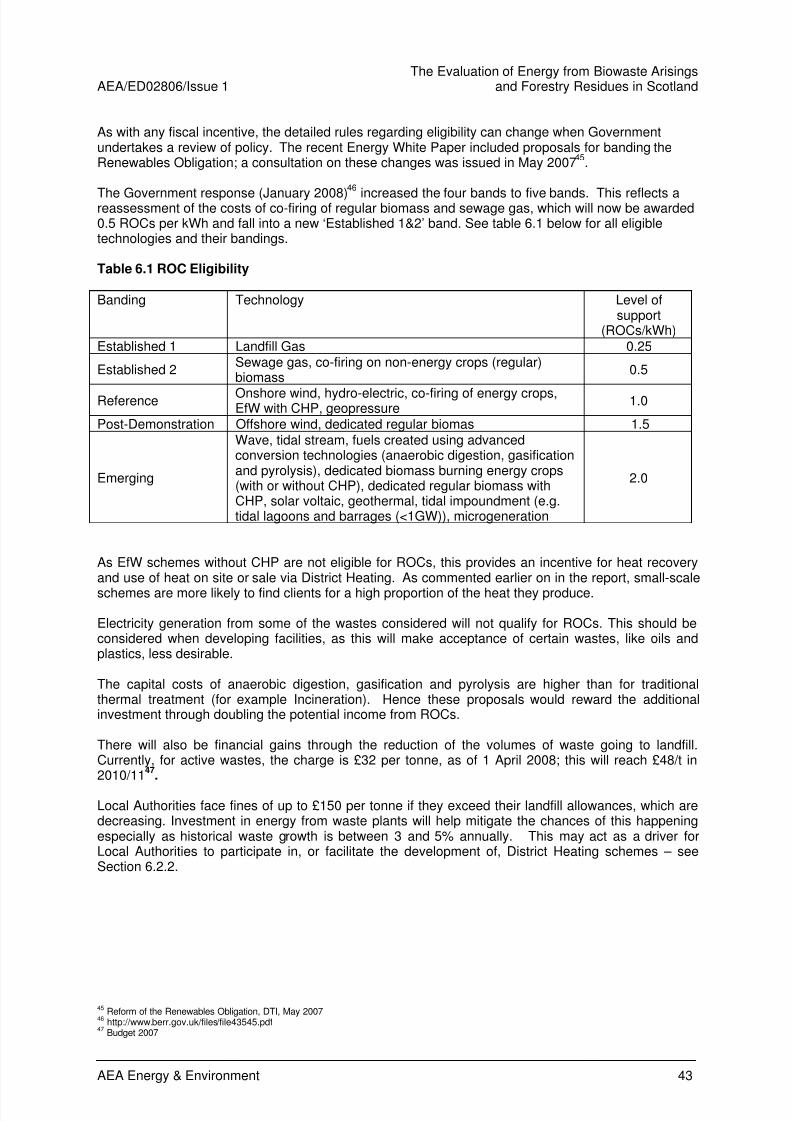
8/12/2019 SEPA- Report on Biowaste
http://slidepdf.com/reader/full/sepa-report-on-biowaste 53/95
The Evaluation of Energy from Biowaste ArisingsAEA/ED02806/Issue 1 and Forestry Residues in Scotland
AEA Energy & Environment 43
As with any fiscal incentive, the detailed rules regarding eligibility can change when Governmentundertakes a review of policy. The recent Energy White Paper included proposals for banding theRenewables Obligation; a consultation on these changes was issued in May 2007
45.
The Government response (January 2008)46
increased the four bands to five bands. This reflects areassessment of the costs of co-firing of regular biomass and sewage gas, which will now be awarded0.5 ROCs per kWh and fall into a new ‘Established 1&2’ band. See table 6.1 below for all eligibletechnologies and their bandings.
Table 6.1 ROC Eligibility
Banding Technology Level ofsupport
(ROCs/kWh)Established 1 Landfill Gas 0.25
Established 2Sewage gas, co-firing on non-energy crops (regular)biomass
0.5
Reference Onshore wind, hydro-electric, co-firing of energy crops,EfW with CHP, geopressure
1.0
Post-Demonstration Offshore wind, dedicated regular biomas 1.5
Emerging
Wave, tidal stream, fuels created using advancedconversion technologies (anaerobic digestion, gasificationand pyrolysis), dedicated biomass burning energy crops(with or without CHP), dedicated regular biomass withCHP, solar voltaic, geothermal, tidal impoundment (e.g.tidal lagoons and barrages (<1GW)), microgeneration
2.0
As EfW schemes without CHP are not eligible for ROCs, this provides an incentive for heat recoveryand use of heat on site or sale via District Heating. As commented earlier on in the report, small-scale
schemes are more likely to find clients for a high proportion of the heat they produce.
Electricity generation from some of the wastes considered will not qualify for ROCs. This should beconsidered when developing facilities, as this will make acceptance of certain wastes, like oils andplastics, less desirable.
The capital costs of anaerobic digestion, gasification and pyrolysis are higher than for traditionalthermal treatment (for example Incineration). Hence these proposals would reward the additionalinvestment through doubling the potential income from ROCs.
There will also be financial gains through the reduction of the volumes of waste going to landfill.Currently, for active wastes, the charge is £32 per tonne, as of 1 April 2008; this will reach £48/t in2010/11
47.
Local Authorities face fines of up to £150 per tonne if they exceed their landfill allowances, which aredecreasing. Investment in energy from waste plants will help mitigate the chances of this happeningespecially as historical waste growth is between 3 and 5% annually. This may act as a driver forLocal Authorities to participate in, or facilitate the development of, District Heating schemes – seeSection 6.2.2.
45 Reform of the Renewables Obligation, DTI, May 2007
46http://www.berr.gov.uk/files/file43545.pdf
47 Budget 2007
8/12/2019 SEPA- Report on Biowaste
http://slidepdf.com/reader/full/sepa-report-on-biowaste 54/95
The Evaluation of Energy from Biowaste Arisingsand Forestry Residues in Scotland AEA/ED02806/Issue 1
44 AEA Energy & Environment
6.2 Infrastructure
This section considers the barriers and opportunities regarding the infrastructure that may be requiredto transport electricity or heat to consumers.
6.2.1 Grid Capacity in Scotland
It is estimated that up to 5,537,115 MWh/year could be generated as electricity from biowastes, with acapacity of around 692 MWe
48. The exact size and electricity output of these projects will depend on
local factors such as the geographic distribution and size of the sites where the biowaste material isavailable.
There are a number of ways to gain income from electricity generation. The main options include:
• Displacement of on site electricity needs with the electricity generation from the biowasteplant. This is the simplest option as no other third party is involved. In addition the value of
the electricity is the price that would have been charged by an electricity supplier, i.e. the retailprice for the size of demand. In practice on site generation will not operate all of the timefurthermore, the on site demand and on site generation will not always match. Hence thebiowaste generator is normally operated in parallel with a grid connection – so that back upand top up electricity supplies are available. Because the electricity is used on site this optiondoes not allow the operator to gain income from ROCs as these have to be sold to a licensedelectricity supplier. As this is a major financial restriction, this simple option may only besuitable for small scale schemes or schemes on sites with high on-site electricity use –particularly if the fuel used is not eligible for ROCs and/or if there is no heat recovery, i.e. thescheme is not operating in CHP mode.
• Sale to an electricity supplier. This is also a simple option, however the supplier will offer awholesale market price that will be significantly lower than the retail price paid for on site
demand. Against this is the fact that to realise the value of ROCs the electricity must be soldto an electricity supplier as suppliers have a target to achieve under the Obligation. This hasled to an arrangement known as ”sale and buy back” – where the operator of the biowastesells the electricity and the ROCs to an electricity supplier and buys back some of theelectricity. This option is routinely used for small on site renewable energy projects.
• Sale to a third party consumer. If electricity generation is in excess of on site demands theexcess can be sold to other electricity consumers. Like the first option this can realise retailprice levels for the electricity sold. The sale can be made across the existing electricitynetwork, however the network operator will levy a small charge for each unit of electricity soldacross its network. This route is less commonly used than the other two options.
As a result all biowaste schemes that generate electricity will require connection to the electricitynetwork. This is a requirement to:
• Provide back up and top up electricity supplies.• To provide a route to sell to electricity suppliers or third parties.
A number of technical requirements need to be complied with to ensure the safe operation of thebiowaste electricity generation scheme in parallel with the network. Thus all generators wishing toconnect to the electricity network will need a connection agreement and to pay any capital or operatingcosts associated with the connection. These charges will be site specific and will depend on:
• The capacity of the existing electricity network in the area to accommodate the power flows.
• The existing generation in the area.
48 Assuming 8,000 hours a year of non CHP plant operation
8/12/2019 SEPA- Report on Biowaste
http://slidepdf.com/reader/full/sepa-report-on-biowaste 55/95
The Evaluation of Energy from Biowaste ArisingsAEA/ED02806/Issue 1 and Forestry Residues in Scotland
AEA Energy & Environment 45
The costs of connection local to the generation project will be borne by the developer of the biowasteproject. These costs will include:
• Works on the site of the generation (e.g. new transformers, switchgear etc).
• Any new or upgraded cable (over or underground) from the biowaste site to the nearestsuitable connection point on the network.
• Additional or upgraded transformers and switchgear at the connection point.
The size of the generator, the distance to the connection point and the voltage level at which theconnection for connection will determine the scale of costs for the local connection. The costs ofadditional or upgraded transformers and switchgear at the connection point will depend on the level (ifany) of unused capacity on the existing grid equipment.
Small generation projects will be connected to the lower voltage distribution network (below 132 kV),whereas larger projects will be connected to the transmission network (132 kV and 275 kV).
There are differences between connection processes for the transmission network and the lower
voltage distribution system. The size of the generator and the proximity of the generator to theexisting network will determine the connection voltage for the generator. Broadly speaking, in theScottish Power area schemes above 30 MW will connect to the transmission network, while in theScottish & Southern area schemes above 10 MW will require a transmission connection.
For transmission connected schemes there are significant delays in the availability of transmissioncapacity. Hence this may act as a material influence on the size of central waste treatment schemes.
6.2.2 Heat Infrastructure
Unlike the electricity network there is not a national network of heat pipes that can be used to transferheat from a biowaste plant to heat consumers. The amount of heat that could be generated will notbe an exact match to the needs of the site where the biowaste is processed. Thus a biowaste toenergy project will have several options:
• To restrict the amount of waste processed, and thus the amount of heat generated, to theneeds of the on site processes.
• To reject to atmosphere the heat that is in excess of on site requirements.
• To invest in a District Heating network to transport the excess heat to other heat consumers.
While the first two options are straightforward, they are sub-optimal in terms of energy efficiency. Inthe case of central processing plants the amount of heat available may be significantly in excess of onsite heat demands, hence the loss of energy may be a significant issue.
The alternative is to invest in District Heating. This is the solution adopted by the Lerwick scheme,which provides heat to businesses, to public sector buildings and to homes. This solution is oftenfound in European countries but is less common in the UK.
District Heating is costly to install, particularly in built up areas. To keep the pipe lengths and resultingcapital costs to a minimum, the biowaste plant should be as close as is practically possible to the heatconsumers. This may prove difficult in terms of land availability and from the perception of the public. The high capital costs and the community nature of District Heating often involves Local Authorityinvolvement in the development and operation of the project. For example, the Lerwick scheme wasset up with funding from the Shetland Islands Council Charitable Trust along with EU and HIE funding.
District Heating will be a challenging option for most biowaste projects to develop. For District Heatingto be viable some form of additional financial incentive is likely to be needed. The Defra funded
Community Energy Programme offered development and capital grants for District Heating. Thissuccessfully brought forward a number of District Heating schemes, including a number that usedwaste as an energy input, such as landfill gas and waste heat from industry.
8/12/2019 SEPA- Report on Biowaste
http://slidepdf.com/reader/full/sepa-report-on-biowaste 56/95
The Evaluation of Energy from Biowaste Arisingsand Forestry Residues in Scotland AEA/ED02806/Issue 1
46 AEA Energy & Environment
6.3 Policy
In addition to the financial issues, a number of policy issues will have an influence over the practicaland economic exploitation of the energy within biowaste. This section identifies the key policymeasures and provides an overview of their impact on the different waste streams.
The key policies relevant to biowastes either encourage the generation of energy from biomass(including biomass from waste) or regulate its combustion in order to minimise its environmentalimpact, using Best Available Techniques (BAT). The latter are part of the group of regulations thatmust be complied with under Integrated Pollution, Prevention and Control (IPPC) regulations, in orderfor an activity to be licensed on a site.
The details of which specific regulations and policies apply to which biowaste stream depends on thedefinition of that biowaste as a waste or a biomass within the relevant legislation.
6.3.1 Is the Biowaste a Waste or a Biomass?
This study covers a wide range of biowaste material, not all of which can be classed as biomass forthe purposes of some legislation; and some of which is classed as waste for the purposes ofregulations relating to environmental emissions. Consequently it is important to understand thedefinitions used to determine if a material is deemed to be a waste and the definitions used todetermine if a material is deemed to be biomass. As will be discussed later in this section, differentregulations define these terms in different ways.
This issue is important because the definition of biomass or waste is crucial to the application ofvarious regulations and legislation – and has implications for the cost of developing a plant. Thesedefinitions are confusing for developers of biomass plants. For example, many fail to understand thata material that is a “biomass” as defined within the Renewables Obligation (Scotland) can also be awaste for the purposes of the Waste Incineration Directive (WID). This is even more confusingbecause a material classified as a “biomass” for the purposes of WID is exempt from WID. The
confusion is thus understandable – a biomass within ROS is not necessarily a biomass within the WIDand thus may not be exempt from the emissions limits within WID. To the developers it appears thatthe regulations reward the generation of power from a material on the one hand, but on the other handpenalise it for being a waste, adding cost to the development. The following example illustrates thesedifferences in definition in the Renewables Obligation and the Waste Incineration Directive.
The Renewables Obligation (Scotland) states that a material is only eligible to be classed as biomassif it can show that its calorific value is derived from greater than 90% of biomass material. Thisdefinition does not consider the source of the material or whether or not it is a waste; the material maybe a residue from a sawmill or any other industrial process. However the same material may bedeemed to be a waste for the purposes of combustion under the WID. This is important, as there maybe considerable cost implications in achieving the emissions limits set out within the WID.
The term “waste” is determined by the definition within the Waste Framework Directive and relates towhether or not a material can be deemed to have been discarded. What is more, once a material isdefined as a waste it remains so until the point of combustion, so the plant must meet WID emissionslimits. This definition has been tested in European Case Law and is quite complex. Challenges to theclassification of particular materials as wastes have included materials as diverse as tallow andrecovered fuel oil. This confusion and lack of clarity creates uncertainty for prospective developersand creates financial and investment barriers that can be difficult to overcome. As a result both theEnvironment Agency and SEPA have drawn up a list of materials that may be difficult to classify, withan indication on whether or not they are classified as a biomass or a waste for the purposes of theWID.
49
49 Further details referenced in EA Biomass Guidance Notes. The SEPA notes are in their guidance leaflet “Is it a waste?”
available on the web site: www.sepa.org.uk/pdf/guidance/waste/is_it_waste_v2.pdf
8/12/2019 SEPA- Report on Biowaste
http://slidepdf.com/reader/full/sepa-report-on-biowaste 57/95
The Evaluation of Energy from Biowaste ArisingsAEA/ED02806/Issue 1 and Forestry Residues in Scotland
AEA Energy & Environment 47
The term “biowaste” is not defined within this legislation and its use therefore adds to this confusion.The issue of definition of wastes and biomass is covered in detail in report for the EnvironmentAgency
50. For the purposes of this report biowaste is the generic term used for the waste streams
identified as being useful for energy recovery.
Public perception will influence the ease with which energy from biowaste facilities are introduced. Theword waste automatically raises concerns from those who don’t fully understand what is meant.Biowaste is just a form of Biomass so could be classified in this way to avoid confusion.
6.3.2 Regulations that apply to “Biowaste”
The following regulations may apply to thermal conversion of the materials indicated within this study:
1. Waste Framework Directive (WFD).2. The Landfill Directive.3. Integrated Pollution Prevention and Control (IPPC and the WID).4. The Landfill Tax Regulations.
5. The Waste Minimisation Act.6. The Animal By-products Order and Regulations.
Each of the above regulations will represent either a barrier to, or driver for, to the development ofbiowaste projects. The following is a brief outline of each of the characteristics of the differentregulations. They are examined briefly below and are covered in detail in a separate AEA report
50.
Waste Framework Directive51
This provides a framework for waste policy, and is intended to encourage waste reduction, reuse andrecycling. The Directive puts forward heat recovery initiatives in preference to landfilling.
The Landfill Directive52
This is designed primarily to minimise the environmental and health impacts of landfill. One of therequirements of the Directive is the diversion of biodegradable waste from landfill and targets havebeen set for the UK, including Scotland. The regulation to achieve these targets is the LandfillAllowance Scheme (Scotland)
53. These regulations will encourage the diversion of biodegradable
waste from landfill and indirectly act as a driver for alternative options such as recycling and recovery,including the treatment of biowastes with energy recovery. The implementation of the Landfill Directivein the UK has resulted in increasing landfill charges (through the Landfill tax on biodegradable waste).As a result alternative treatment options are becoming increasingly economic, incentivising wasteproducers to examine how best to divert their waste from landfill. Using thermal treatment or anaerobicdigestion with energy recovery gives biowaste producers an option to displace their existing fossil fueluse and reduce their energy costs or to develop income from sales of energy.
50 “Regulation of Energy from Solid Biomass Plants” report produced for the Environment Agency by AEA (2006). Available
from:www.biomassenergycentre.org.uk/pls/portal/docs/PAGE/BEC_RESOURCES/PUBLICATIONS/REGULATION%20OF%20ENER
GY%20DEFRA.PDF51
Waste Framework Directive, Council Directive 75/442/EEC of 15th July 1975
52 Landfill Directive. Guidance on landfill directive is available from both SEPA and the Environment Agency on their web sites.
53 See “Landfill allowance scheme (Scotland) Regulations 2005: SEPA Guidance on Operational Procedures” available:
www.sepa.org.uk/pdf/guidance/waste/LAS_guidance.pdf
8/12/2019 SEPA- Report on Biowaste
http://slidepdf.com/reader/full/sepa-report-on-biowaste 58/95
The Evaluation of Energy from Biowaste Arisingsand Forestry Residues in Scotland AEA/ED02806/Issue 1
48 AEA Energy & Environment
Waste Incineration Directive54
This is the main legislation that regulates the thermal conversion of waste streams under IntegratedPollution Prevention and Control (IPPC – see below). The WID regulations are designed to provide
conditions that must be met in waste combustion plant, including its emissions and disposal of ashfrom the plant. WID requires the monitoring of emissions (on a continuous or periodic basis,depending on the parameter in question), with annual reporting. The design of plants must take theemissions limits and monitoring requirements into account. Abatement equipment is not only costly –it is an integral part of the combustion plant design and takes up considerable space (it can representat least half of the size of a large municipal energy from waste plant). It is considerably more difficultand more costly to retrofit emissions abatement and so the requirements of WID are an importantconsideration in the design of a plant.
Integrated Pollution Prevention and ControlThis is a regulatory system that controls all environmental impacts of certain listed industrial activities.The process is essentially a licensing system, which all relevant activities must comply with in order toobtain a licence to build and operate the plant. To comply with IPPC the operator must demonstrate
that the design of the plant uses the Best Available Techniques (BAT) and takes account of other localor unique process factors that may be imposed upon them. The interpretation of what is meant by BATcan be difficult for designers to assess, thus to ensure compliance there can be a risk that the plant isover designed for the purpose that it is intended. Guidance on BAT is available through “BREF”notes, published by the European Commission
55.
IPPC has three main sections: Part A (1) Part A (2) and Part B. Each of the sections define the typesof installation that would apply and the regulating authority (in Scotland this is SEPA). Since we areprimarily concerned with thermal conversion technologies using biowaste then it is likely that Part A (1)or Part (B) will apply and this gives a range of thermal capacity between 0.4MW - 50 MW heat input
56.
The Animal By Products Order and RegulationThe Animal By-products Regulations
57 apply controls on the use, treatment, handing and disposal of
animal by-products and enforce the Animal By-products Regulation (EC) No 1774/2002. They aim tocontrol the risks, including disease, to both animals and the public. Under the Animal By-productsRegulations, animal by-products are divided into three categories:
Category 1 – very high risk material, including the carcasses of animals suspected or confirmed ofbeing infected with Transmissible Spongiform Encephalopathy (TSE, the family of diseases whichBSE belongs to); specified risk material (SRM, i.e. the riskiest parts of an animal’s body); all animalmaterial collected from premises/processing plants treating category 1 material; catering waste frominternational transport; and mixtures of category 1 material with category 2 and 3 material.
Category 2 – High risk material which includes animals that die on a farm; animal by-products that arenot contaminated; manure; the digestive tract content; and mixtures of category 2 and 3 material.
54 Equivalent in Scotland Waste Incineration (Scotland) Regulations 2003 (WIR) (Scottish Statutory Instrument 2003/170)
55 These are “Best available techniques reference documents” and are available through the European IPPC Bureau at
http://eippcb.jrc.es 56
Schedule 1 of the Regulations defines activities that fall under Part A(1), A(2) and B:
• A1 processes: A combustion process would be Part A(1) if it is a combustion activity with a rated thermal input of 50MW or more. However, it would also be an A(1) combustion activity if burning a waste and has thermal input of 3 MWor more.
• A2 processes. These are regulated under the local Authority IPPC scheme.• Part B processes: combustion plant with a thermal input of 20 MW or more but less than 50 MW; or burning waste
with a thermal input of greater than 0.4 MW but less than 3 MW.Further information is available from SEPA in: PPC regulations: A practical guide (Part A Activities).57 Animal By-products Regulations 2005 (S.I. 2005/2347)
8/12/2019 SEPA- Report on Biowaste
http://slidepdf.com/reader/full/sepa-report-on-biowaste 59/95
The Evaluation of Energy from Biowaste ArisingsAEA/ED02806/Issue 1 and Forestry Residues in Scotland
AEA Energy & Environment 49
Category 3 – Animal by-products that have previously been fit for human consumption, includingcatering waste, raw meat and fish.
Category 3 materials are the only materials directly suitable for AD plants. Some types of Category 2
waste can be used in AD, provided that they undergo pre-treatment. A guidance note from SEPA58
states that:
“With the exception of manure, digestive tract content separated from the digestive tract, milk andcolostrum, Category 2 animal by-products may only be composted or transformed in a biogas plantafter pre treatment. Manure, digestive tract content separated from the digestive tract, milk andcolostrum may be composted or processed as a raw material in a biogas plant without being pre- treated first.”
Permitted disposal routes (See figure 3.2)
Category 3:
• Incineration in an approved plant.• Rendering and permanent marking, followed by use in feeding stuffs or fertiliser (subject to the
ban on feeding catering waste to livestock and the restriction on the use of processed animalprotein in feeding stuffs).
• Use in pet food.
• In a technical plant.
• Treatment in an anaerobic digester or composting plant.
• For feeding fish, ensiling or composting.• Use in an oleochemical plant to produce tallow derivatives.
• Disposal of former foodstuffs of animal origin in accordance with the Commission’s newregulation on the former foodstuffs.
Category 2:
• Incineration.
• Rendering.
• Treatment in an Anaerobic Digester provided the waste is pre-treated in accordance witharticle 15 of the Animal By-Products Regulations.
Category 1:
• Sterilisation.
• Incineration.
Renewable Electricity Targets
The renewable energy resource in Scotland is the best in Europe and amongst the best in the world.The resource, the potential economic benefits and the energy policy drivers led the ScottishGovernment to set two aspirational targets for renewable electricity generation in Scotland:
• At least 31% of demand by 2011, and
• At least 50% of demand by 2020.
This is defined as 50% of the demand for Scottish electricity generation, minus any exports, to besupplied from renewable sources by 2020, with an interim milestone of 31% by 2011.
58http://www.sepa.org.uk/pdf/guidance/waste/interp_guidance_animal_waste.pdf
8/12/2019 SEPA- Report on Biowaste
http://slidepdf.com/reader/full/sepa-report-on-biowaste 60/95
The Evaluation of Energy from Biowaste Arisingsand Forestry Residues in Scotland AEA/ED02806/Issue 1
50 AEA Energy & Environment
European Renewable Energy TargetsThe Renewable Energy Road map
59 was published in January 2008 and proposed a legally binding
target of 20% of energy from renewable sources in the EU by 2020. European leaders at the summitin Germany endorsed this target on March 9th 2007. The UK Government are currently considering
what the UK target should be and how this target will be met. The target will be embedded in a newRenewable Energy Directive.
The proposed target includes energy used for heating and transport as well as electricity production.Compared to the renewable electricity targets, this broader 20% target will require a greater degree ofchange in the sources of energy used in the future.
Renewable Heat Targets for ScotlandWith 80% of domestic energy use being heat related
60 the Scottish Government aim to produce a
Renewable Heat Strategy, encompassing bioenergy and other technologies, in 2008. This will includetargets for the production of renewable heat up to 2020. In the Scottish Biomass Action Plan, otherpolicies for biomass heat are detailed. These include regulation and planning guidance and publicprocurement initiatives. Some of these initiatives may be relevant to the use of biowastes to generate
heat and to heat and power plants61
.
Incentives for CHPGood quality CHP can claim important revenue and capital benefits:
• CCL exemption on fuel input and power output.
• ROCs for the Biomass equivalent.
• Qualify for Enhanced Capital Allowances.
• Exemption from Business Ratings on CHP Plant & Machinery.
In order to claim these benefits each CHP scheme requires a certificate from the CHPQA. Inaddition, a Secretary Of State (CHP) Exemption and Energy Efficiency-CHP Certificates are alsorequired if wishing to claim the 'revenue' and 'capital' benefits respectively.
Under the CHPQA programme, schemes are given an overall efficiency score called the Quality Index(QI) depending on how efficient they are overall (electrically and thermally). This score will affect howmuch of the power generated is deemed Good Quality CHP. If the QI falls below a threshold of 100,only a proportion of the power generated qualifies for LECs and ROCs. This is called QualifyingPower Output (QPO). For further information, see CHPQA Guidance Note 41 downloadable fromwww.chpqa.com.
Good Quality CHP may also be eligible to claim a capital benefit in the form of an Enhanced CapitalAllowance (ECA) on qualifying capital expenditure if the main intended business of the scheme is toprovide heat and electricity for clearly identified users on site or to known third parties.
Standard Capital Allowances allow the costs of capital assets to be written off against a business's
taxable profits and take the place of depreciation charged in the commercial accounts. ECAs givecorporate relief for the full cost of qualifying expenditure incurred in the accounting period up front,therefore reducing the effective capital cost, reducing payback period and saving money oncorporation tax on a discounted life cost basis. The Threshold Criteria for ECA eligibility are based onthe CHPQA Threshold Criteria for Good Quality CHP for Proposed New Power Generation Capacityas set out in the CHPQA standard, Issue 2, November 2007. However, the Threshold PowerEfficiency Criterion is relaxed for Schemes that burn a proportion of biomass or solid or liquid wastefuels. For further information, see CHPQA Guidance Note 42 downloadable from www.chpqa.com.
59 The road map is available on: http://eur-lex.europa.eu/LexUriServ/site/en/com/2006/com2006_0848en01.doc"Renewable Energy Road Map: renewable energies in the 21st century:building a more sustainable future" SEC(2007)12Communication from the Commission to the Council and the European Parliament COM(2006)848 final60
http://www.energysavingtrust.org.uk/schri/community/view.cfm?articleid=444&archive=161
See: the Biomass Action Plan for Scotland (2007), available: www.scottishexecutive.gov.uk/publications/2007/03/12095912/0

8/12/2019 SEPA- Report on Biowaste
http://slidepdf.com/reader/full/sepa-report-on-biowaste 61/95
The Evaluation of Energy from Biowaste ArisingsAEA/ED02806/Issue 1 and Forestry Residues in Scotland
AEA Energy & Environment 51
In addition, a CHPQA Certificate can be used to obtain exemption from Business Rating of CHP Plantand Machinery. This rating exemption applies to specified plant and machinery contained within aCHP Scheme, which qualifies for, and is in possession of, either a full or partial SOS (CHP) exemptionCertificate. The exemption extends to accessories associated to the power generating plant and
machinery (these items may be rateable in their own right elsewhere in the P & M Schedule) but not toheat recovery plant and machinery. For further information, see CHPQA Guidance Note 43downloadable from www.chpqa.com.
6.3.3 Summary
As can be seen from the information above, some of the regulations encourage energy recovery fromwaste through Government support and targets, and others provide barriers, such as increased costfor emissions control. This can cause confusion to developers and investors and even threaten thedevelopment of the projects. It is advised that developers seek advice from the appropriate regulatorybody (such as SEPA for IPPC and WID and Ofgem’s Scottish Office for the ROS) in the early stage of
the plant design.
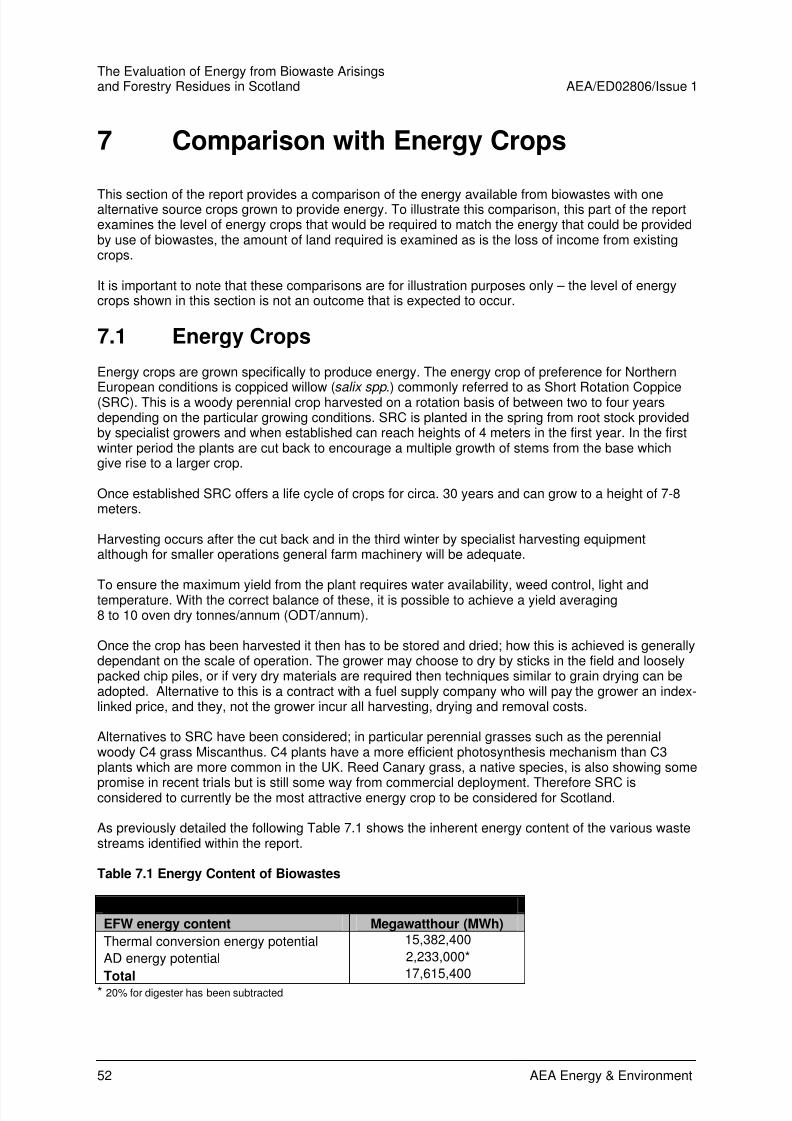
8/12/2019 SEPA- Report on Biowaste
http://slidepdf.com/reader/full/sepa-report-on-biowaste 62/95
The Evaluation of Energy from Biowaste Arisingsand Forestry Residues in Scotland AEA/ED02806/Issue 1
52 AEA Energy & Environment
7 Comparison with Energy Crops
This section of the report provides a comparison of the energy available from biowastes with onealternative source crops grown to provide energy. To illustrate this comparison, this part of the reportexamines the level of energy crops that would be required to match the energy that could be providedby use of biowastes, the amount of land required is examined as is the loss of income from existingcrops.
It is important to note that these comparisons are for illustration purposes only – the level of energycrops shown in this section is not an outcome that is expected to occur.
7.1 Energy Crops
Energy crops are grown specifically to produce energy. The energy crop of preference for Northern
European conditions is coppiced willow (salix spp .) commonly referred to as Short Rotation Coppice(SRC). This is a woody perennial crop harvested on a rotation basis of between two to four yearsdepending on the particular growing conditions. SRC is planted in the spring from root stock providedby specialist growers and when established can reach heights of 4 meters in the first year. In the firstwinter period the plants are cut back to encourage a multiple growth of stems from the base whichgive rise to a larger crop.
Once established SRC offers a life cycle of crops for circa. 30 years and can grow to a height of 7-8meters.
Harvesting occurs after the cut back and in the third winter by specialist harvesting equipmentalthough for smaller operations general farm machinery will be adequate.
To ensure the maximum yield from the plant requires water availability, weed control, light andtemperature. With the correct balance of these, it is possible to achieve a yield averaging8 to 10 oven dry tonnes/annum (ODT/annum).
Once the crop has been harvested it then has to be stored and dried; how this is achieved is generallydependant on the scale of operation. The grower may choose to dry by sticks in the field and looselypacked chip piles, or if very dry materials are required then techniques similar to grain drying can beadopted. Alternative to this is a contract with a fuel supply company who will pay the grower an index-linked price, and they, not the grower incur all harvesting, drying and removal costs.
Alternatives to SRC have been considered; in particular perennial grasses such as the perennialwoody C4 grass Miscanthus. C4 plants have a more efficient photosynthesis mechanism than C3plants which are more common in the UK. Reed Canary grass, a native species, is also showing some
promise in recent trials but is still some way from commercial deployment. Therefore SRC isconsidered to currently be the most attractive energy crop to be considered for Scotland.
As previously detailed the following Table 7.1 shows the inherent energy content of the various wastestreams identified within the report.
Table 7.1 Energy Content of Biowastes
EFW energy content Megawatthour (MWh)
Thermal conversion energy potential 15,382,400
AD energy potential 2,233,000*
Total17,615,400
* 20% for digester has been subtracted
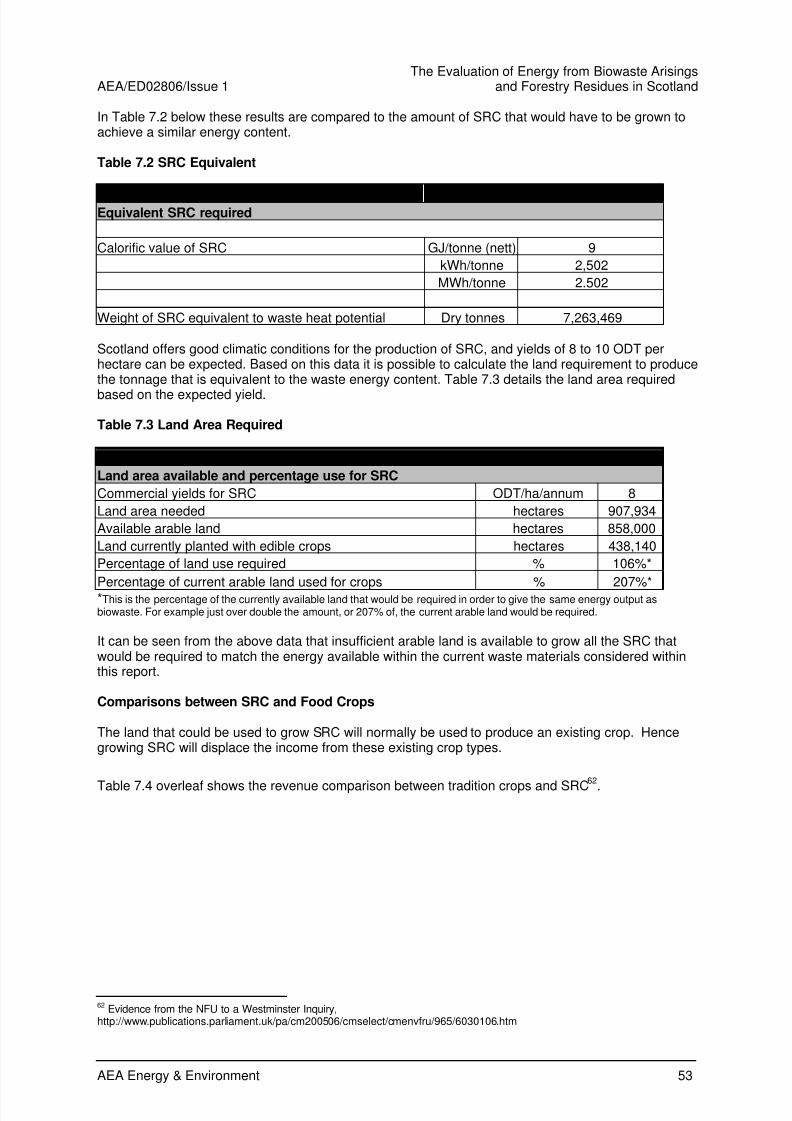
8/12/2019 SEPA- Report on Biowaste
http://slidepdf.com/reader/full/sepa-report-on-biowaste 63/95
The Evaluation of Energy from Biowaste ArisingsAEA/ED02806/Issue 1 and Forestry Residues in Scotland
AEA Energy & Environment 53
In Table 7.2 below these results are compared to the amount of SRC that would have to be grown toachieve a similar energy content.
Table 7.2 SRC Equivalent
Equivalent SRC required
Calorific value of SRC GJ/tonne (nett) 9
kWh/tonne 2,502
MWh/tonne 2.502
Weight of SRC equivalent to waste heat potential Dry tonnes 7,263,469
Scotland offers good climatic conditions for the production of SRC, and yields of 8 to 10 ODT perhectare can be expected. Based on this data it is possible to calculate the land requirement to producethe tonnage that is equivalent to the waste energy content. Table 7.3 details the land area required
based on the expected yield.
Table 7.3 Land Area Required
Land area available and percentage use for SRC
Commercial yields for SRC ODT/ha/annum 8
Land area needed hectares 907,934
Available arable land hectares 858,000
Land currently planted with edible crops hectares 438,140
Percentage of land use required % 106%*
Percentage of current arable land used for crops % 207%*
*This is the percentage of the currently available land that would be required in order to give the same energy output asbiowaste. For example just over double the amount, or 207% of, the current arable land would be required.
It can be seen from the above data that insufficient arable land is available to grow all the SRC thatwould be required to match the energy available within the current waste materials considered withinthis report.
Comparisons between SRC and Food Crops
The land that could be used to grow SRC will normally be used to produce an existing crop. Hencegrowing SRC will displace the income from these existing crop types.
Table 7.4 overleaf shows the revenue comparison between tradition crops and SRC62
.
62 Evidence from the NFU to a Westminster Inquiry,
http://www.publications.parliament.uk/pa/cm200506/cmselect/cmenvfru/965/6030106.htm
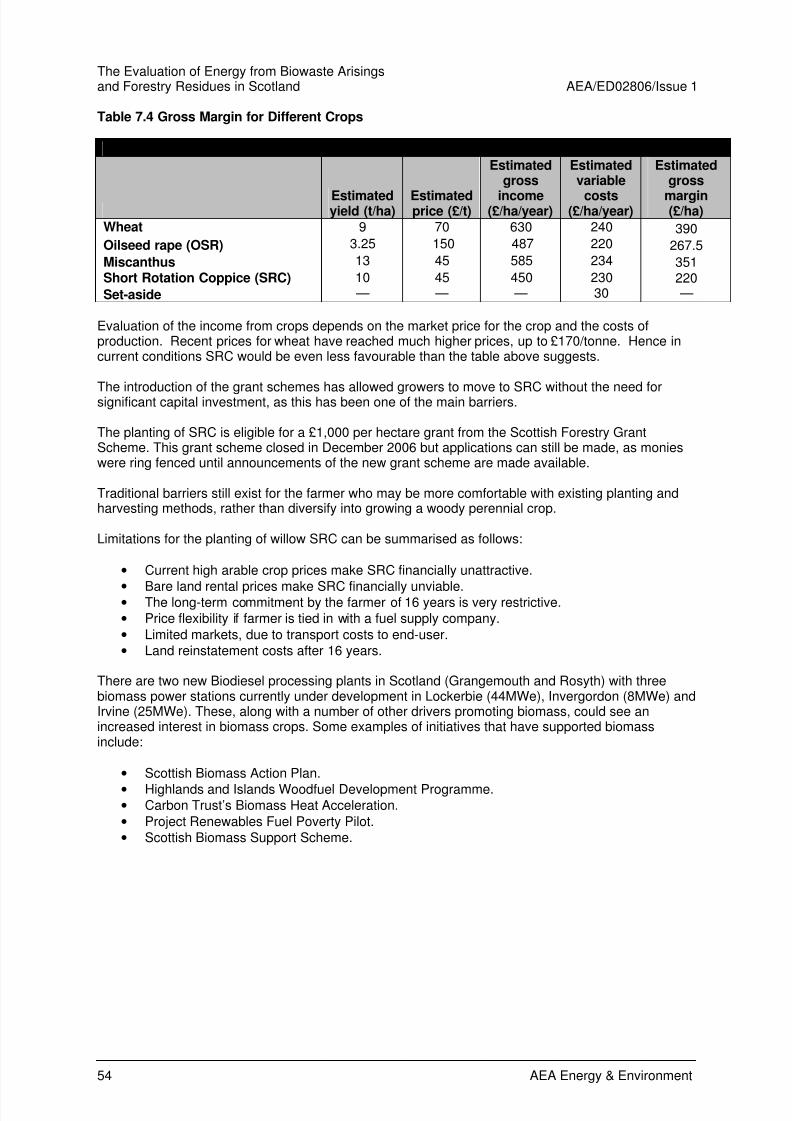
8/12/2019 SEPA- Report on Biowaste
http://slidepdf.com/reader/full/sepa-report-on-biowaste 64/95
The Evaluation of Energy from Biowaste Arisingsand Forestry Residues in Scotland AEA/ED02806/Issue 1
54 AEA Energy & Environment
Table 7.4 Gross Margin for Different Crops
Estimatedyield (t/ha)
Estimatedprice (£/t)
Estimatedgross
income(£/ha/year)
Estimatedvariable
costs(£/ha/year)
Estimatedgross
margin(£/ha)
Wheat 9 70 630 240 390
Oilseed rape (OSR) 3.25 150 487 220 267.5
Miscanthus 13 45 585 234 351Short Rotation Coppice (SRC) 10 45 450 230 220
Set-aside — — — 30 —
Evaluation of the income from crops depends on the market price for the crop and the costs ofproduction. Recent prices for wheat have reached much higher prices, up to £170/tonne. Hence incurrent conditions SRC would be even less favourable than the table above suggests.
The introduction of the grant schemes has allowed growers to move to SRC without the need forsignificant capital investment, as this has been one of the main barriers.
The planting of SRC is eligible for a £1,000 per hectare grant from the Scottish Forestry GrantScheme. This grant scheme closed in December 2006 but applications can still be made, as monieswere ring fenced until announcements of the new grant scheme are made available.
Traditional barriers still exist for the farmer who may be more comfortable with existing planting andharvesting methods, rather than diversify into growing a woody perennial crop.
Limitations for the planting of willow SRC can be summarised as follows:
• Current high arable crop prices make SRC financially unattractive.• Bare land rental prices make SRC financially unviable.• The long-term commitment by the farmer of 16 years is very restrictive.
• Price flexibility if farmer is tied in with a fuel supply company.
• Limited markets, due to transport costs to end-user.
• Land reinstatement costs after 16 years.
There are two new Biodiesel processing plants in Scotland (Grangemouth and Rosyth) with threebiomass power stations currently under development in Lockerbie (44MWe), Invergordon (8MWe) andIrvine (25MWe). These, along with a number of other drivers promoting biomass, could see anincreased interest in biomass crops. Some examples of initiatives that have supported biomassinclude:
• Scottish Biomass Action Plan.
• Highlands and Islands Woodfuel Development Programme.• Carbon Trust’s Biomass Heat Acceleration.
• Project Renewables Fuel Poverty Pilot.
• Scottish Biomass Support Scheme.

8/12/2019 SEPA- Report on Biowaste
http://slidepdf.com/reader/full/sepa-report-on-biowaste 65/95
The Evaluation of Energy from Biowaste ArisingsAEA/ED02806/Issue 1 and Forestry Residues in Scotland
AEA Energy & Environment 55
8 Potential Benefits
There are several potential benefits to developing an energy from biowaste market. These range from
displacement of fossil fuel derived energy through to the creation of direct and indirect employmentopportunities in supporting a biowaste market.
Potential benefits include:
• Reduction of waste to landfill, which allows limited landfill space to be used for wastes where thereis no alternative.
• Reduction of methane released to atmosphere (methane is one of the basket of 6 gases listed bythe Kyoto Protocol as being destructive to the ozone layer, it has a greenhouse potential 20 timesthat of CO2).
• The value of the heat and electricity provided from biowaste.
• The use of digestate as a soil improver will reduce the amount of artificial fertilisers used
• Reduction of CO2 emissions as energy from biomass will displace energy from non-renewable
sources.• Improved sustainability through better waste management.
• Creating an incentive for people to separate their waste as there is a tangible outcome.
8.1 Employment Opportunities
In order to utilise biowaste as a resource there will be a need to develop new waste managementinfrastructure. This may range from (2,000t/y) on farm anaerobic digestion plants to large (100,000t/y)thermal treatment facilities in towns. Table 7.1 provides an idea of the size and staffing levels thatmay be required based on existing anaerobic digestion and thermal treatment plants and their staffinglevels.
Another important element of context is the number of plants that would be required and the potentialemployment opportunities. To establish this would require detailed data on the geographicaldistribution of waste that is not available. To provide an indication of the scale of plants required, twoexample small-scale plants have been used to provide an indicative answer to this question. Otheremployment opportunities would be created in the transport and waste collection sector.
The following boxes provide summary details of an anaerobic digestion scheme and a thermaltreatment scheme.
Greenfinch Anaerobic Digestion Plant, Ludlow, Shropshire Plant Scale: 5,000 tonnes per annumWaste input: Source-separated household kitchen waste along with some garden waste (can acceptpaper and card)
Staff employed: 4Scale: Suitable for a small town or village (around 1,200 households)Capital Cost: £1,200,000 with a predicted depreciation of 15 yearsLand Uptake: 1,500m
2(Necessary), 2,500m
2 (Actual)
http://agendas.luton.gov.uk/cmiswebpublic/Binary.ashx?Document=9942 http://www.environment-agency.gov.uk/wtd/679004/?lang=_e
Relevance to biowastes in Scotland: – this case study uses similar technology to farm scaleanaerobic digestion schemes that this company installed in Scotland. This example is representativeof small scale anaerobic digestion schemes.
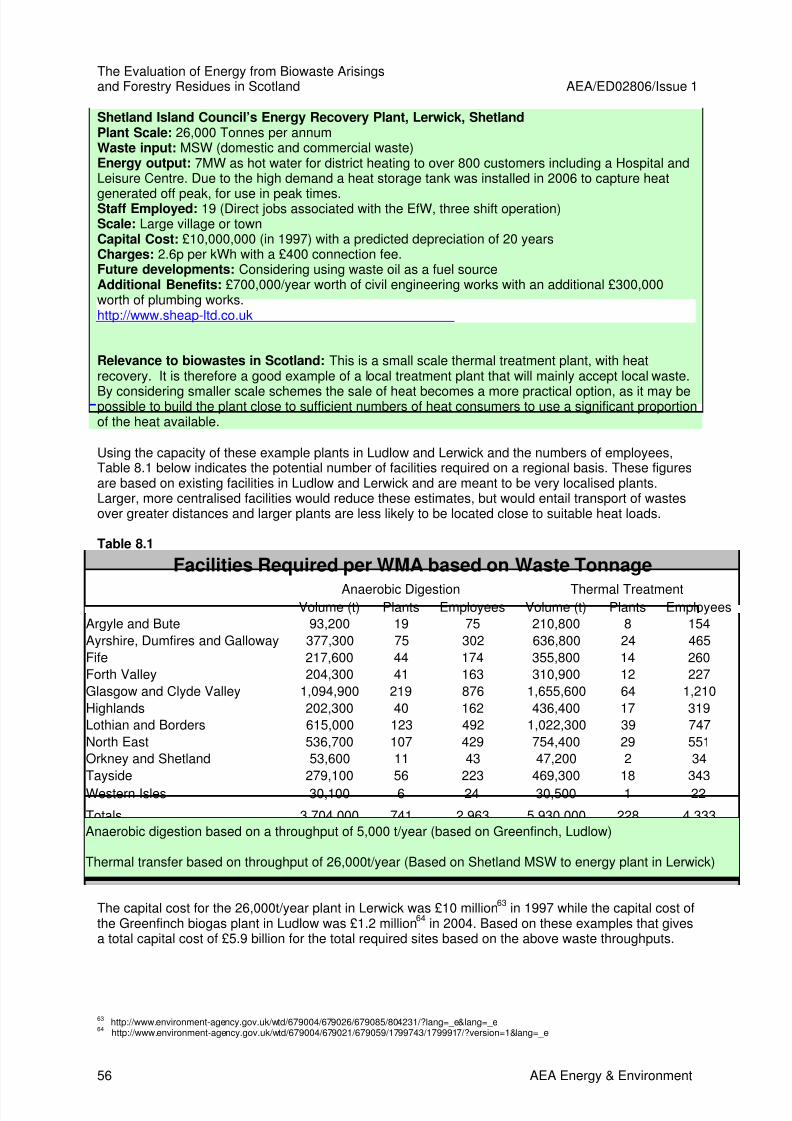
8/12/2019 SEPA- Report on Biowaste
http://slidepdf.com/reader/full/sepa-report-on-biowaste 66/95
The Evaluation of Energy from Biowaste Arisingsand Forestry Residues in Scotland AEA/ED02806/Issue 1
56 AEA Energy & Environment
Shetland Island Council’s Energy Recovery Plant, Lerwick, ShetlandPlant Scale: 26,000 Tonnes per annumWaste input: MSW (domestic and commercial waste)Energy output: 7MW as hot water for district heating to over 800 customers including a Hospital andLeisure Centre. Due to the high demand a heat storage tank was installed in 2006 to capture heat
generated off peak, for use in peak times.Staff Employed: 19 (Direct jobs associated with the EfW, three shift operation)Scale: Large village or townCapital Cost: £10,000,000 (in 1997) with a predicted depreciation of 20 yearsCharges: 2.6p per kWh with a £400 connection fee.Future developments: Considering using waste oil as a fuel sourceAdditional Benefits: £700,000/year worth of civil engineering works with an additional £300,000worth of plumbing works.http://www.sheap-ltd.co.uk http://www.environment-agency.gov.uk/wtd/679004/?lang=_e
Relevance to biowastes in Scotland: This is a small scale thermal treatment plant, with heatrecovery. It is therefore a good example of a local treatment plant that will mainly accept local waste.
By considering smaller scale schemes the sale of heat becomes a more practical option, as it may bepossible to build the plant close to sufficient numbers of heat consumers to use a significant proportionof the heat available.
Using the capacity of these example plants in Ludlow and Lerwick and the numbers of employees,Table 8.1 below indicates the potential number of facilities required on a regional basis. These figuresare based on existing facilities in Ludlow and Lerwick and are meant to be very localised plants.Larger, more centralised facilities would reduce these estimates, but would entail transport of wastesover greater distances and larger plants are less likely to be located close to suitable heat loads.
Table 8.1
Facilities Required per WMA based on Waste Tonnage
Anaerobic Digestion Thermal TreatmentVolume (t) Plants Employees Volume (t) Plants Employees
Argyle and Bute 93,200 19 75 210,800 8 154
Ayrshire, Dumfires and Galloway 377,300 75 302 636,800 24 465
Fife 217,600 44 174 355,800 14 260
Forth Valley 204,300 41 163 310,900 12 227
Glasgow and Clyde Valley 1,094,900 219 876 1,655,600 64 1,210
Highlands 202,300 40 162 436,400 17 319
Lothian and Borders 615,000 123 492 1,022,300 39 747
North East 536,700 107 429 754,400 29 551
Orkney and Shetland 53,600 11 43 47,200 2 34
Tayside 279,100 56 223 469,300 18 343
Western Isles 30,100 6 24 30,500 1 22
Totals 3,704,000 741 2,963 5,930,000 228 4,333Anaerobic digestion based on a throughput of 5,000 t/year (based on Greenfinch, Ludlow)
Thermal transfer based on throughput of 26,000t/year (Based on Shetland MSW to energy plant in Lerwick)
The capital cost for the 26,000t/year plant in Lerwick was £10 million63
in 1997 while the capital cost ofthe Greenfinch biogas plant in Ludlow was £1.2 million
64 in 2004. Based on these examples that gives
a total capital cost of £5.9 billion for the total required sites based on the above waste throughputs.
63http://www.environment-agency.gov.uk/wtd/679004/679026/679085/804231/?lang=_e&lang=_e
64http://www.environment-agency.gov.uk/wtd/679004/679021/679059/1799743/1799917/?version=1&lang=_e
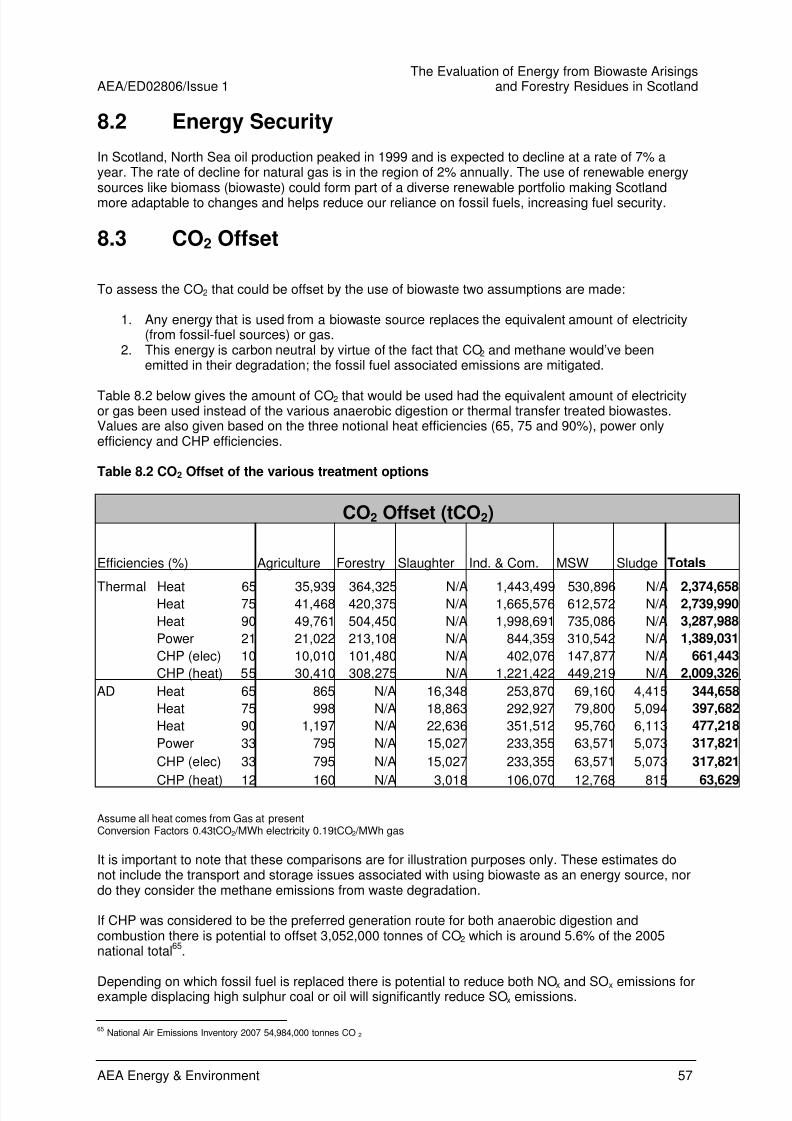
8/12/2019 SEPA- Report on Biowaste
http://slidepdf.com/reader/full/sepa-report-on-biowaste 67/95
The Evaluation of Energy from Biowaste ArisingsAEA/ED02806/Issue 1 and Forestry Residues in Scotland
AEA Energy & Environment 57
8.2 Energy Security
In Scotland, North Sea oil production peaked in 1999 and is expected to decline at a rate of 7% ayear. The rate of decline for natural gas is in the region of 2% annually. The use of renewable energysources like biomass (biowaste) could form part of a diverse renewable portfolio making Scotlandmore adaptable to changes and helps reduce our reliance on fossil fuels, increasing fuel security.
8.3 CO2 Offset
To assess the CO2 that could be offset by the use of biowaste two assumptions are made:
1. Any energy that is used from a biowaste source replaces the equivalent amount of electricity(from fossil-fuel sources) or gas.
2. This energy is carbon neutral by virtue of the fact that CO2 and methane would’ve beenemitted in their degradation; the fossil fuel associated emissions are mitigated.
Table 8.2 below gives the amount of CO2 that would be used had the equivalent amount of electricityor gas been used instead of the various anaerobic digestion or thermal transfer treated biowastes.Values are also given based on the three notional heat efficiencies (65, 75 and 90%), power onlyefficiency and CHP efficiencies.
Table 8.2 CO2 Offset of the various treatment options
CO2 Offset (tCO2)
Efficiencies (%) Agriculture Forestry Slaughter Ind. & Com. MSW Sludge Totals
Thermal Heat 65 35,939 364,325 N/A 1,443,499 530,896 N/A 2,374,658Heat 75 41,468 420,375 N/A 1,665,576 612,572 N/A 2,739,990
Heat 90 49,761 504,450 N/A 1,998,691 735,086 N/A 3,287,988
Power 21 21,022 213,108 N/A 844,359 310,542 N/A 1,389,031
CHP (elec) 10 10,010 101,480 N/A 402,076 147,877 N/A 661,443
CHP (heat) 55 30,410 308,275 N/A 1,221,422 449,219 N/A 2,009,326
AD Heat 65 865 N/A 16,348 253,870 69,160 4,415 344,658
Heat 75 998 N/A 18,863 292,927 79,800 5,094 397,682
Heat 90 1,197 N/A 22,636 351,512 95,760 6,113 477,218
Power 33 795 N/A 15,027 233,355 63,571 5,073 317,821
CHP (elec) 33 795 N/A 15,027 233,355 63,571 5,073 317,821
CHP (heat) 12 160 N/A 3,018 106,070 12,768 815 63,629
Assume all heat comes from Gas at presentConversion Factors 0.43tCO2 /MWh electricity 0.19tCO2 /MWh gas
It is important to note that these comparisons are for illustration purposes only. These estimates donot include the transport and storage issues associated with using biowaste as an energy source, nordo they consider the methane emissions from waste degradation.
If CHP was considered to be the preferred generation route for both anaerobic digestion andcombustion there is potential to offset 3,052,000 tonnes of CO2 which is around 5.6% of the 2005national total
65.
Depending on which fossil fuel is replaced there is potential to reduce both NOx and SOx emissions forexample displacing high sulphur coal or oil will significantly reduce SOx emissions.
65 National Air Emissions Inventory 2007 54,984,000 tonnes CO2
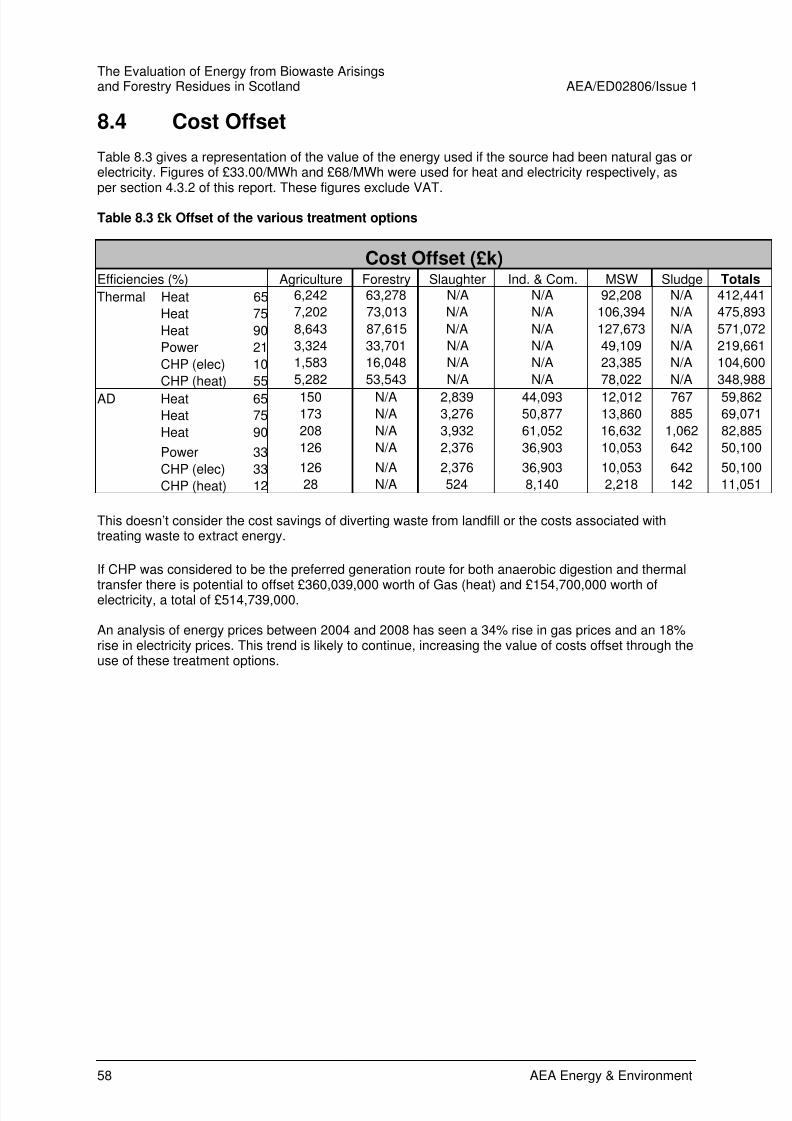
8/12/2019 SEPA- Report on Biowaste
http://slidepdf.com/reader/full/sepa-report-on-biowaste 68/95
The Evaluation of Energy from Biowaste Arisingsand Forestry Residues in Scotland AEA/ED02806/Issue 1
58 AEA Energy & Environment
8.4 Cost Offset
Table 8.3 gives a representation of the value of the energy used if the source had been natural gas orelectricity. Figures of £33.00/MWh and £68/MWh were used for heat and electricity respectively, asper section 4.3.2 of this report. These figures exclude VAT.
Table 8.3 £k Offset of the various treatment options
Cost Offset (£k)Efficiencies (%) Agriculture Forestry Slaughter Ind. & Com. MSW Sludge Totals
Thermal Heat 65 6,242 63,278 N/A N/A 92,208 N/A 412,441
Heat 75 7,202 73,013 N/A N/A 106,394 N/A 475,893
Heat 90 8,643 87,615 N/A N/A 127,673 N/A 571,072
Power 21 3,324 33,701 N/A N/A 49,109 N/A 219,661
CHP (elec) 10 1,583 16,048 N/A N/A 23,385 N/A 104,600
CHP (heat) 55 5,282 53,543 N/A N/A 78,022 N/A 348,988
AD Heat 65 150 N/A 2,839 44,093 12,012 767 59,862
Heat 75 173 N/A 3,276 50,877 13,860 885 69,071
Heat 90 208 N/A 3,932 61,052 16,632 1,062 82,885
Power 33 126 N/A 2,376 36,903 10,053 642 50,100
CHP (elec) 33 126 N/A 2,376 36,903 10,053 642 50,100
CHP (heat) 12 28 N/A 524 8,140 2,218 142 11,051
This doesn’t consider the cost savings of diverting waste from landfill or the costs associated withtreating waste to extract energy.
If CHP was considered to be the preferred generation route for both anaerobic digestion and thermal
transfer there is potential to offset £360,039,000 worth of Gas (heat) and £154,700,000 worth ofelectricity, a total of £514,739,000.
An analysis of energy prices between 2004 and 2008 has seen a 34% rise in gas prices and an 18%rise in electricity prices. This trend is likely to continue, increasing the value of costs offset through theuse of these treatment options.
8/12/2019 SEPA- Report on Biowaste
http://slidepdf.com/reader/full/sepa-report-on-biowaste 69/95
The Evaluation of Energy from Biowaste ArisingsAEA/ED02806/Issue 1 and Forestry Residues in Scotland
AEA Energy & Environment 59
9 Summary of Findings
This study has attempted to quantify the potential energy there may be available in the biowaste andforestry residues arising in Scotland. In doing so it considered a number of waste streams, determinedthe element of that waste that could be used to generate energy and assessed the potential andavailable energy for each waste stream.
This report also looked at some of the barriers and opportunities to using biomass for energy.
The use of biomass as a renewable energy source represents an opportunity to generateapproximately 11,069,000 MWh of energy (assuming the use of CHP), as well as diverting up to9,634,000 tonnes of waste from landfill, creating in the region of 7,200 jobs and reducing CO2 emissions by an estimated 3,052,000 tonnes helping Scotland and the UK to meet ever more stringentGreenhouse Gas reduction targets. In order for energy crops to meet the energy potential frombiowastes just over double the amount, or 207% of, the current arable land would be required.
The use of anaerobic digestion methods offer an opportunity to meet the Animal By-ProductsRegulations whilst generating electricity and creating a safe and effective fertiliser and compost.Anaerobic digestion is proving more economically attractive as double ROCs are proposed foradvanced conversion technologies.
Combustion-based EfW methods can be used to extract energy from solid wastes, further reducingwaste volumes while supplying heat and electricity.
Each plant should be designed on the basis of the most efficient use of the resources available locallywhilst best meeting demand in the local area, however for best use of available energy, CHP is thepreferred energy generation option.
Smaller scale plants would be better suited to make best use of the available heat. There is a greaterrisk that larger plants will produce heat in excess of what is required locally.
Reduction and efficiency strategies should still be promoted. As per the National Waste Strategy,neither anaerobic digestion or thermal treatment should be used ahead of Prevention, Reuse orRecycling, with thermal treatment only being used after these options have been considered. Althoughrecycling consumes energy it is considerably less than if virgin materials are used. There are alsoother considerations like availability of raw materials; for example, plastic is petroleum based which isbecoming less available and more costly. It makes sense to reuse the plastic we have rather than burnit for energy and continue to consume raw materials.
In accordance with the Proximity Principle, waste treatment near to, or on the same site as, wasteproduction or collection sites would increase efficiency of the entire process and encourage more
appropriate separation of wastes.
Energy from biowaste, forestry residues and other suitable elements of Commercial and Industrialwaste will allow many of the targets set out in the National Waste Plan to be met and should beseriously considered if Scotland is to become a nation of ‘zero waste’ whilst leading the way inreducing emissions and becoming a sustainable nation. The added benefit of increased energysecurity should also be considered.

8/12/2019 SEPA- Report on Biowaste
http://slidepdf.com/reader/full/sepa-report-on-biowaste 70/95
8/12/2019 SEPA- Report on Biowaste
http://slidepdf.com/reader/full/sepa-report-on-biowaste 71/95
AEA Energy & Environment
Appendices
Appendix 1: Energy from Waste
Appendix 2: Anaerobic Digestion (AD)
Appendix 3: Quantity and breakdown of Waste Collected by Each WasteManagement Area
Appendix 4: Tonnage of Biowastes Available for Processing by Categoryand Local Authority Area
Appendix 5: Bio-waste suitable for use in AD
Appendix 6: Bio-waste suitable for use in TT
Appendix 7: AD Potential per Local Authority Area
Appendix 8: Thermal Treatment Potential per Local Authority Area

8/12/2019 SEPA- Report on Biowaste
http://slidepdf.com/reader/full/sepa-report-on-biowaste 72/95
AEA Energy & Environment
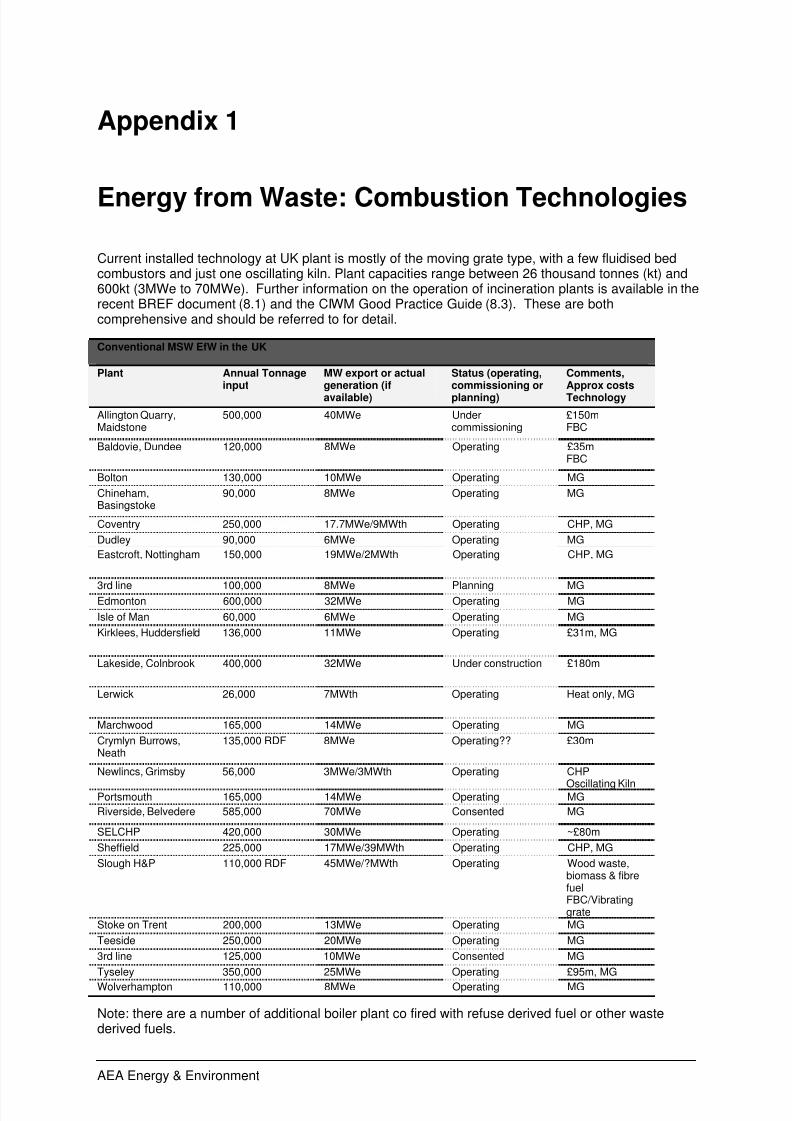
8/12/2019 SEPA- Report on Biowaste
http://slidepdf.com/reader/full/sepa-report-on-biowaste 73/95
AEA Energy & Environment
Appendix 1
Energy from Waste: Combustion Technologies
Current installed technology at UK plant is mostly of the moving grate type, with a few fluidised bedcombustors and just one oscillating kiln. Plant capacities range between 26 thousand tonnes (kt) and600kt (3MWe to 70MWe). Further information on the operation of incineration plants is available in therecent BREF document (8.1) and the CIWM Good Practice Guide (8.3). These are bothcomprehensive and should be referred to for detail.
Conventional MSW EfW in the UK
Plant Annual Tonnageinput
MW export or actualgeneration (ifavailable)
Status (operating,commissioning orplanning)
Comments,Approx costsTechnology
Allington Quarry,Maidstone
500,000 40MWe Undercommissioning
£150mFBC
Baldovie, Dundee 120,000 8MWe Operating £35mFBC
Bolton 130,000 10MWe Operating MG
Chineham,Basingstoke
90,000 8MWe Operating MG
Coventry 250,000 17.7MWe/9MWth Operating CHP, MG
Dudley 90,000 6MWe Operating MG
Eastcroft, Nottingham 150,000 19MWe/2MWth Operating CHP, MG
3rd line 100,000 8MWe Planning MGEdmonton 600,000 32MWe Operating MG
Isle of Man 60,000 6MWe Operating MG
Kirklees, Huddersfield 136,000 11MWe Operating £31m, MG
Lakeside, Colnbrook 400,000 32MWe Under construction £180m
Lerwick 26,000 7MWth Operating Heat only, MG
Marchwood 165,000 14MWe Operating MG
Crymlyn Burrows,Neath
135,000 RDF 8MWe Operating?? £30m
Newlincs, Grimsby 56,000 3MWe/3MWth Operating CHP
Oscillating KilnPortsmouth 165,000 14MWe Operating MG
Riverside, Belvedere 585,000 70MWe Consented MG
SELCHP 420,000 30MWe Operating ~£80m
Sheffield 225,000 17MWe/39MWth Operating CHP, MG
Slough H&P 110,000 RDF 45MWe/?MWth Operating Wood waste,biomass & fibrefuelFBC/Vibratinggrate
Stoke on Trent 200,000 13MWe Operating MG
Teeside 250,000 20MWe Operating MG
3rd line 125,000 10MWe Consented MG
Tyseley 350,000 25MWe Operating £95m, MG
Wolverhampton 110,000 8MWe Operating MG
Note: there are a number of additional boiler plant co fired with refuse derived fuel or other wastederived fuels.
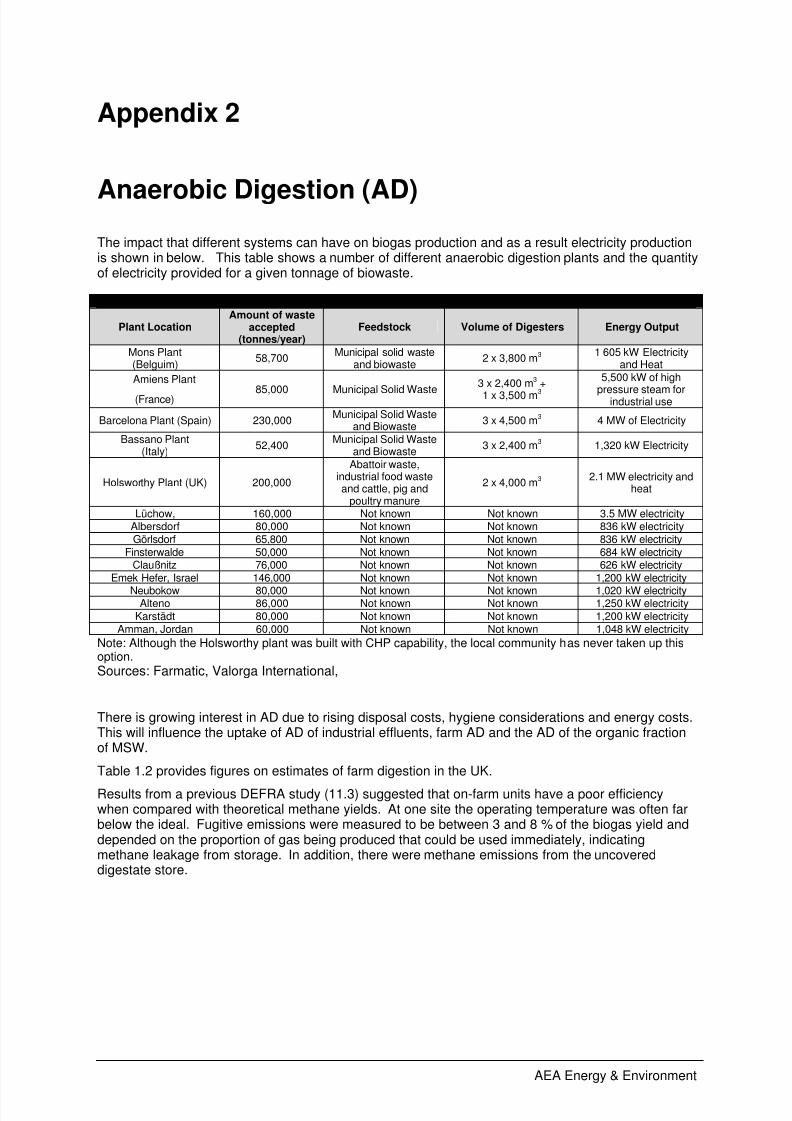
8/12/2019 SEPA- Report on Biowaste
http://slidepdf.com/reader/full/sepa-report-on-biowaste 74/95
AEA Energy & Environment
Appendix 2
Anaerobic Digestion (AD)The impact that different systems can have on biogas production and as a result electricity productionis shown in below. This table shows a number of different anaerobic digestion plants and the quantityof electricity provided for a given tonnage of biowaste.
Types of Anaerobic Digestion Plants in Europe
Plant LocationAmount of waste
accepted(tonnes/year)
Feedstock Volume of Digesters Energy Output
Mons Plant(Belguim)
58,700Municipal solid waste
and biowaste2 x 3,800 m3
1 605 kW Electricityand Heat
Amiens Plant
(France) 85,000 Municipal Solid Waste
3 x 2,400 m3 +
1 x 3,500 m3
5,500 kW of high
pressure steam forindustrial use
Barcelona Plant (Spain) 230,000Municipal Solid Waste
and Biowaste3 x 4,500 m
3 4 MW of Electricity
Bassano Plant(Italy)
52,400Municipal Solid Waste
and Biowaste3 x 2,400 m
3 1,320 kW Electricity
Holsworthy Plant (UK) 200,000
Abattoir waste,industrial food wasteand cattle, pig and
poultry manure
2 x 4,000 m3
2.1 MW electricity andheat
Lüchow, 160,000 Not known Not known 3.5 MW electricityAlbersdorf 80,000 Not known Not known 836 kW electricityGörlsdorf 65,800 Not known Not known 836 kW electricity
Finsterwalde 50,000 Not known Not known 684 kW electricityClaußnitz 76,000 Not known Not known 626 kW electricity
Emek Hefer, Israel 146,000 Not known Not known 1,200 kW electricity
Neubokow 80,000 Not known Not known 1,020 kW electricityAlteno 86,000 Not known Not known 1,250 kW electricity
Karstädt 80,000 Not known Not known 1,200 kW electricityAmman, Jordan 60,000 Not known Not known 1,048 kW electricity
Note: Although the Holsworthy plant was built with CHP capability, the local community has never taken up thisoption.
Sources: Farmatic, Valorga International,
There is growing interest in AD due to rising disposal costs, hygiene considerations and energy costs.This will influence the uptake of AD of industrial effluents, farm AD and the AD of the organic fractionof MSW.
Table 1.2 provides figures on estimates of farm digestion in the UK.
Results from a previous DEFRA study (11.3) suggested that on-farm units have a poor efficiencywhen compared with theoretical methane yields. At one site the operating temperature was often farbelow the ideal. Fugitive emissions were measured to be between 3 and 8 % of the biogas yield anddepended on the proportion of gas being produced that could be used immediately, indicatingmethane leakage from storage. In addition, there were methane emissions from the uncovereddigestate store.

8/12/2019 SEPA- Report on Biowaste
http://slidepdf.com/reader/full/sepa-report-on-biowaste 75/95
AEA Energy & Environment
Estimated number of AD plant in UK
Review Estimate of Units in UK Estimate of EnergyProduction
Baldwin (1993) (11.2) 40 (on farm)
AD-NETT, (2000)66 31
Restats review (www.restats.org.uk)67, 15 (including 1 CAD) 31, 600 MWh (mostlyheat)
European review (Kottner, 2005) < 20 Total capacity <2 MW
Recent discussions with industry 40 of which 20 operational
66 AD-NETT was a European network that undertook a survey of AD plants around Europe
67 Restats is the DTI’s renewable energy statistics database.
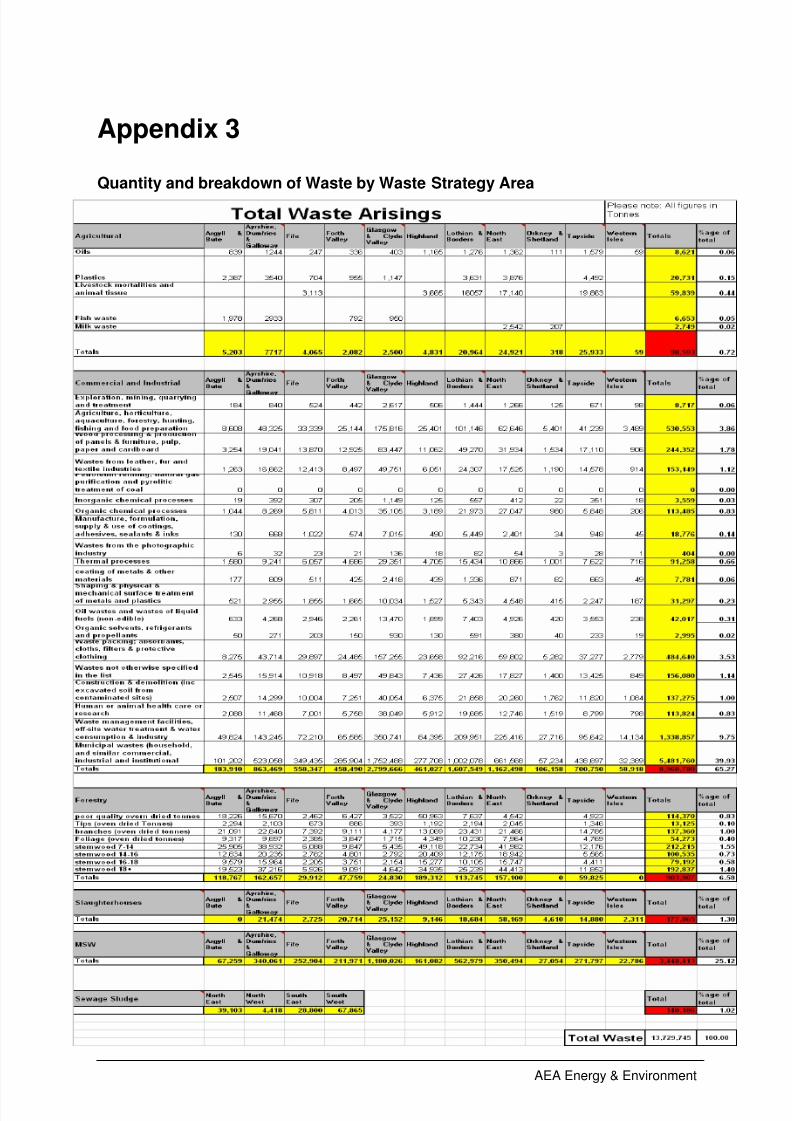
8/12/2019 SEPA- Report on Biowaste
http://slidepdf.com/reader/full/sepa-report-on-biowaste 76/95
AEA Energy & Environment
Appendix 3
Quantity and breakdown of Waste by Waste Strategy Area
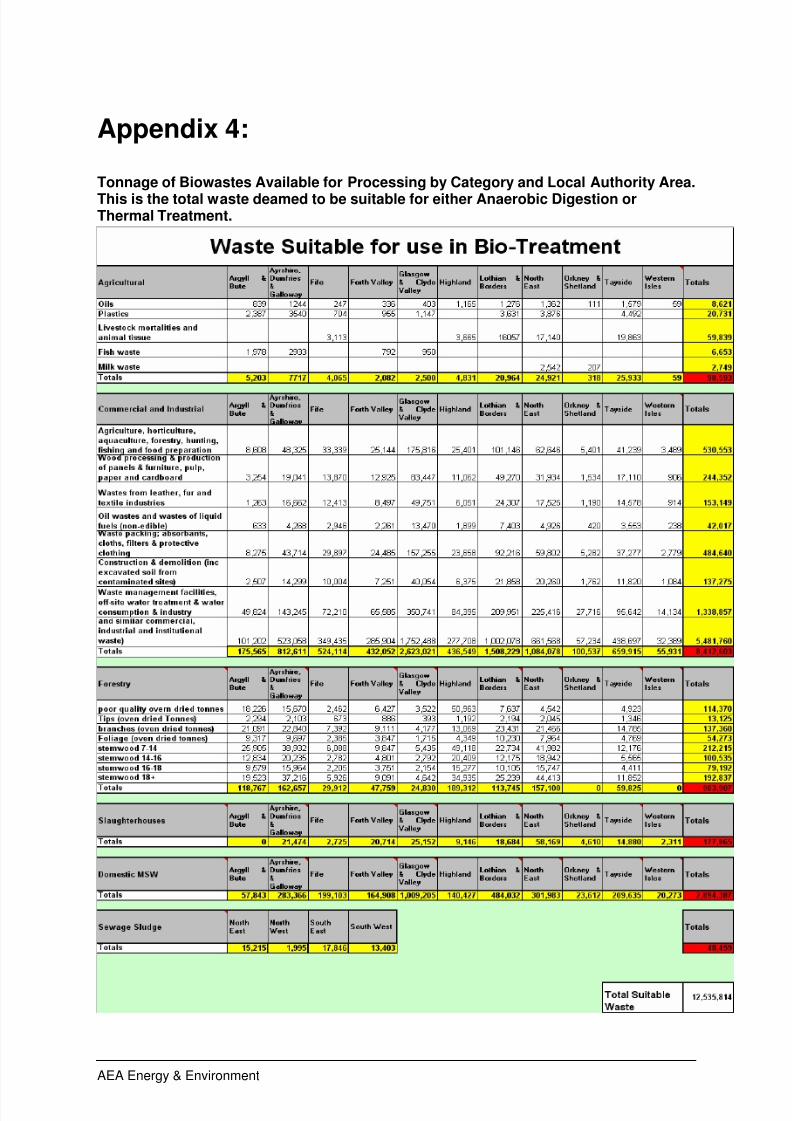
8/12/2019 SEPA- Report on Biowaste
http://slidepdf.com/reader/full/sepa-report-on-biowaste 77/95
AEA Energy & Environment
Appendix 4:
Tonnage of Biowastes Available for Processing by Category and Local Authority Area.
This is the total waste deamed to be suitable for either Anaerobic Digestion orThermal Treatment.
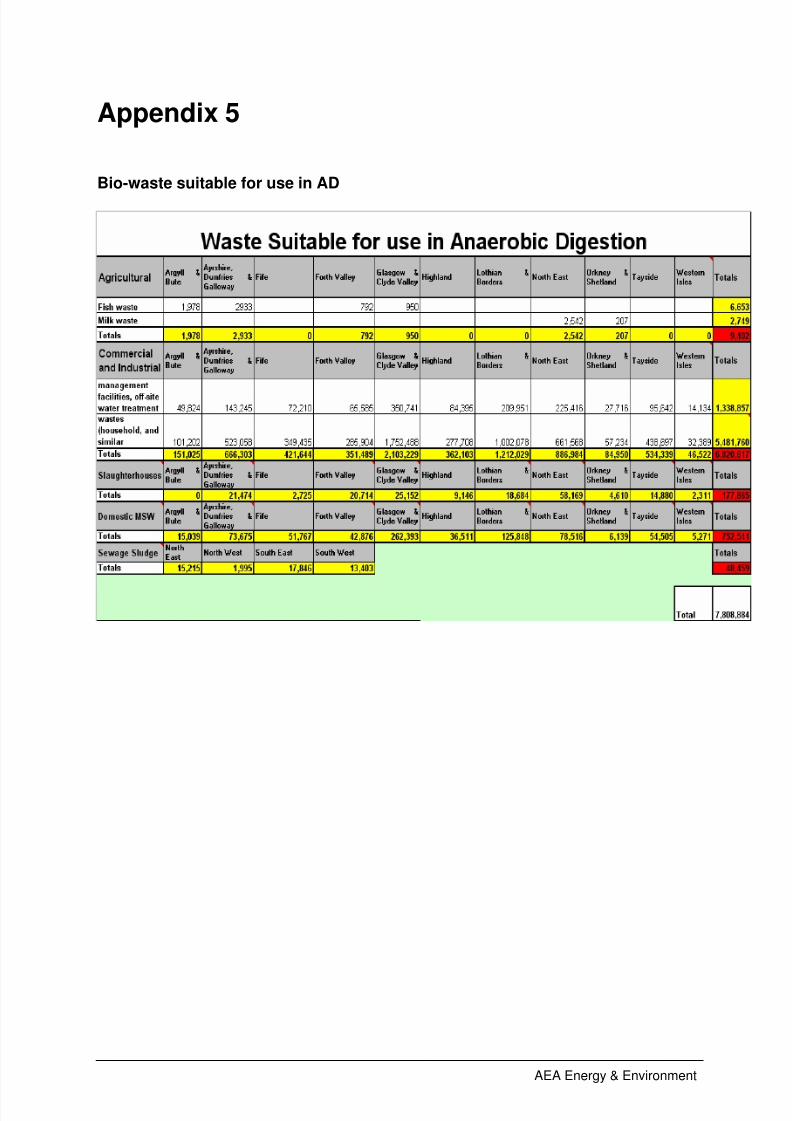
8/12/2019 SEPA- Report on Biowaste
http://slidepdf.com/reader/full/sepa-report-on-biowaste 78/95
AEA Energy & Environment
Appendix 5
Bio-waste suitable for use in AD

8/12/2019 SEPA- Report on Biowaste
http://slidepdf.com/reader/full/sepa-report-on-biowaste 79/95
AEA Energy & Environment
Appendix 6
Bio-waste suitable for use in TT

8/12/2019 SEPA- Report on Biowaste
http://slidepdf.com/reader/full/sepa-report-on-biowaste 80/95
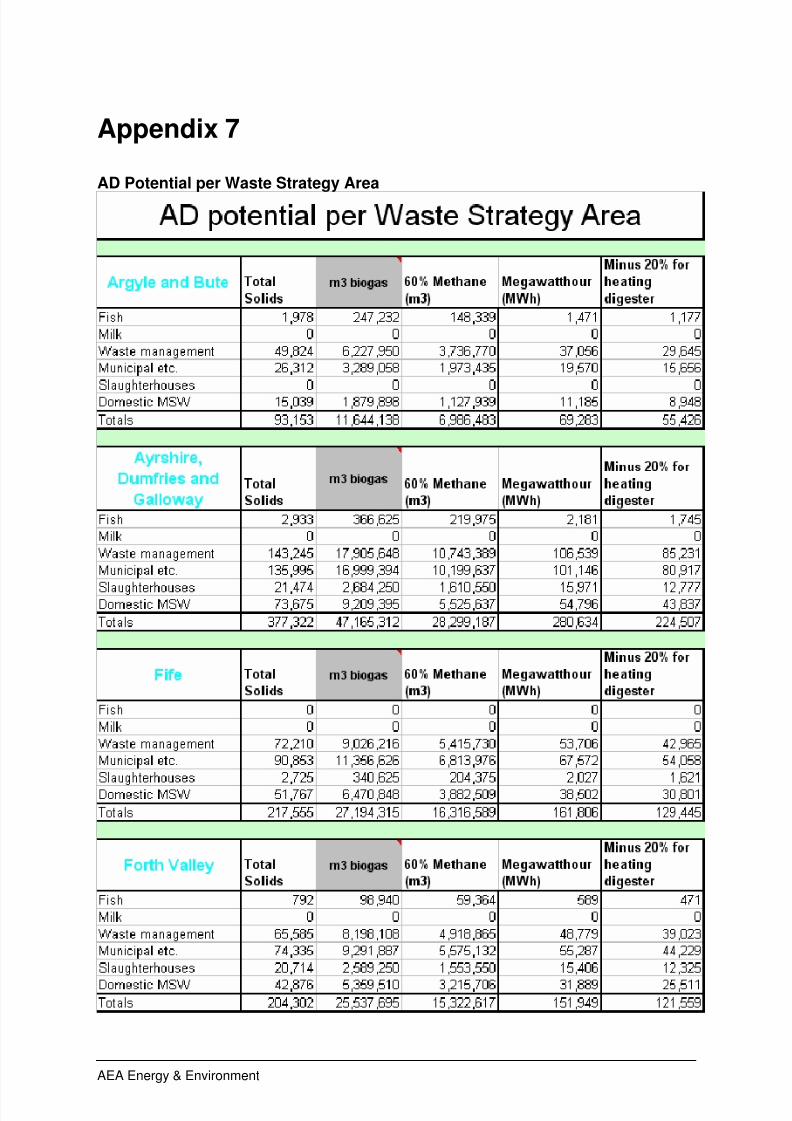
8/12/2019 SEPA- Report on Biowaste
http://slidepdf.com/reader/full/sepa-report-on-biowaste 81/95
AEA Energy & Environment
Appendix 7
AD Potential per Waste Strategy Area

8/12/2019 SEPA- Report on Biowaste
http://slidepdf.com/reader/full/sepa-report-on-biowaste 82/95
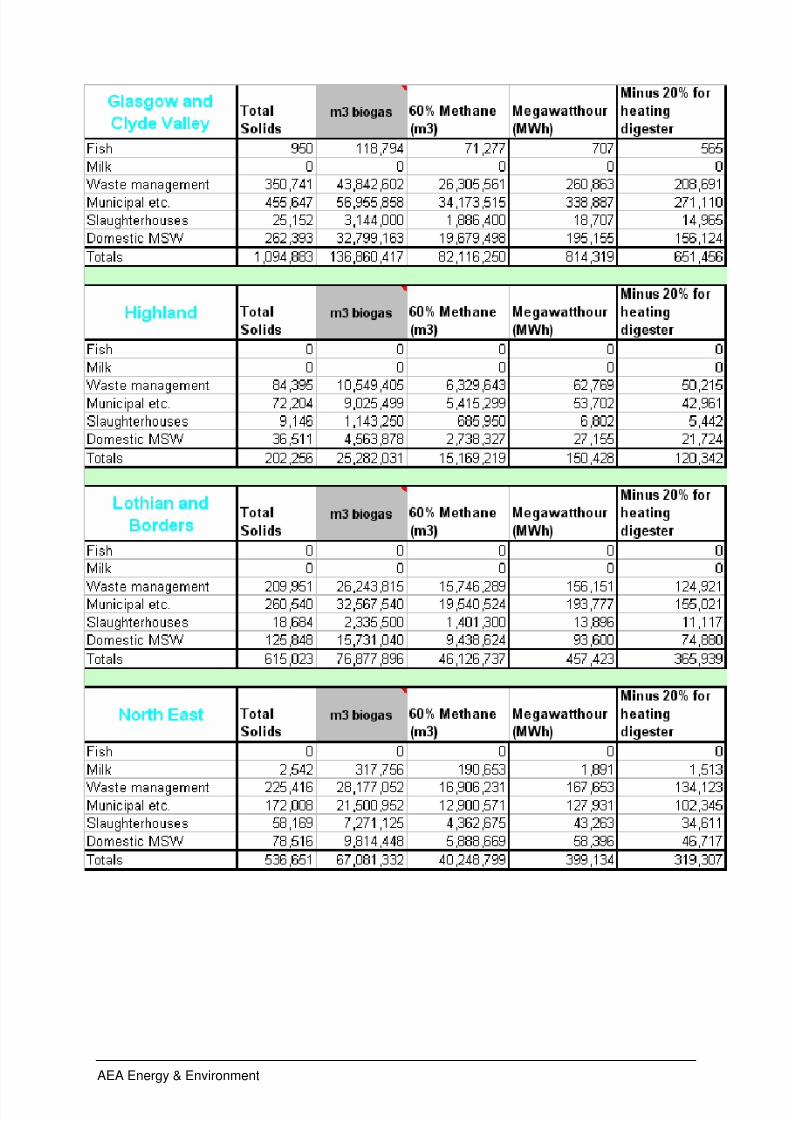
8/12/2019 SEPA- Report on Biowaste
http://slidepdf.com/reader/full/sepa-report-on-biowaste 83/95
AEA Energy & Environment
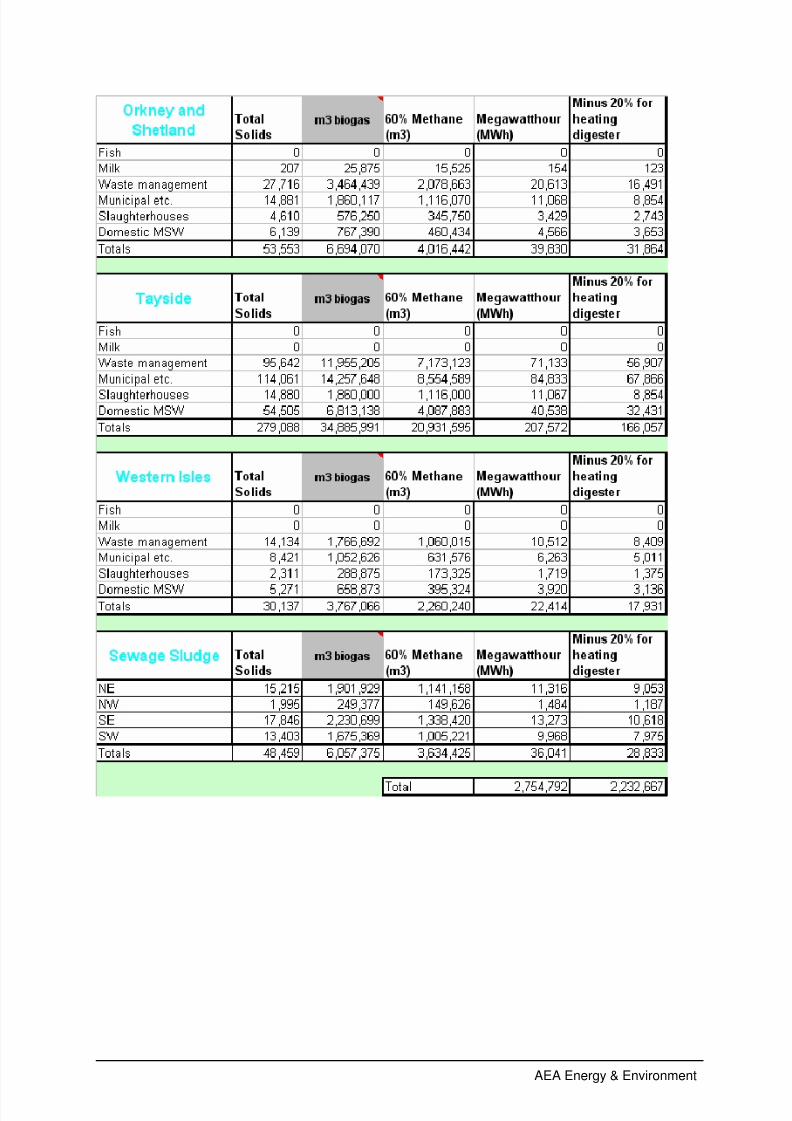
8/12/2019 SEPA- Report on Biowaste
http://slidepdf.com/reader/full/sepa-report-on-biowaste 84/95
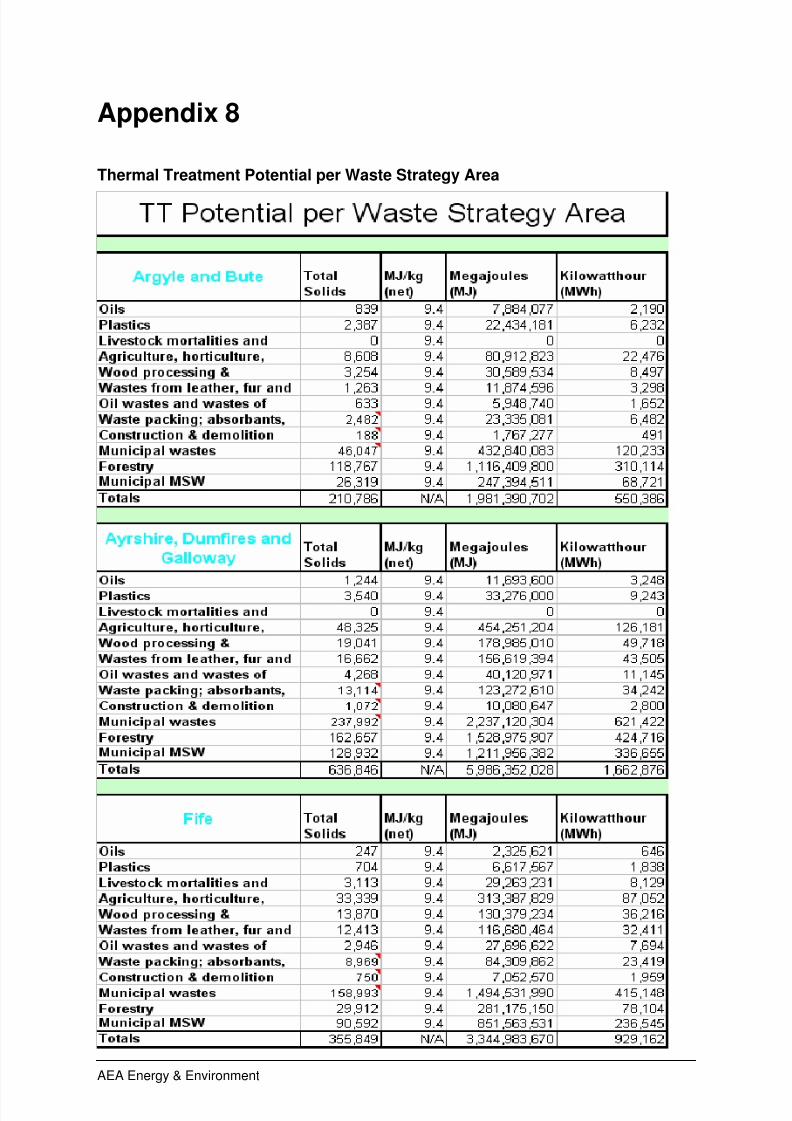
8/12/2019 SEPA- Report on Biowaste
http://slidepdf.com/reader/full/sepa-report-on-biowaste 85/95
AEA Energy & Environment
Appendix 8
Thermal Treatment Potential per Waste Strategy Area

8/12/2019 SEPA- Report on Biowaste
http://slidepdf.com/reader/full/sepa-report-on-biowaste 86/95
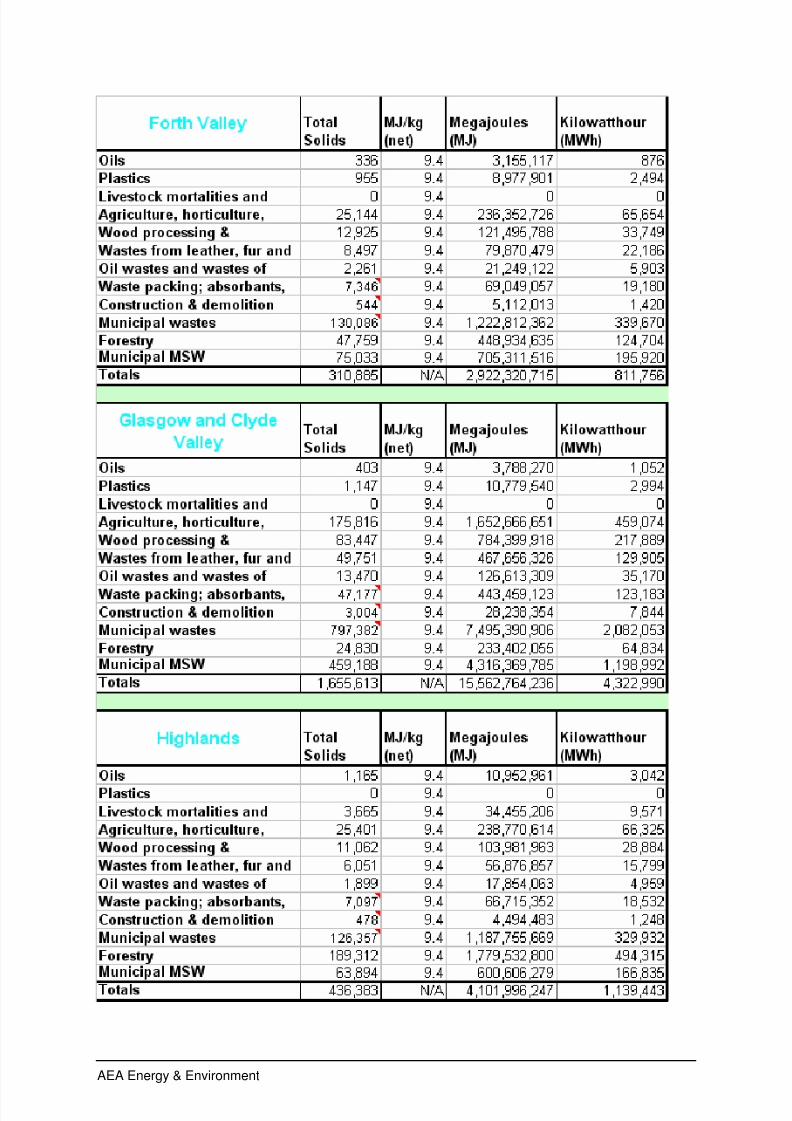
8/12/2019 SEPA- Report on Biowaste
http://slidepdf.com/reader/full/sepa-report-on-biowaste 87/95
AEA Energy & Environment

8/12/2019 SEPA- Report on Biowaste
http://slidepdf.com/reader/full/sepa-report-on-biowaste 88/95
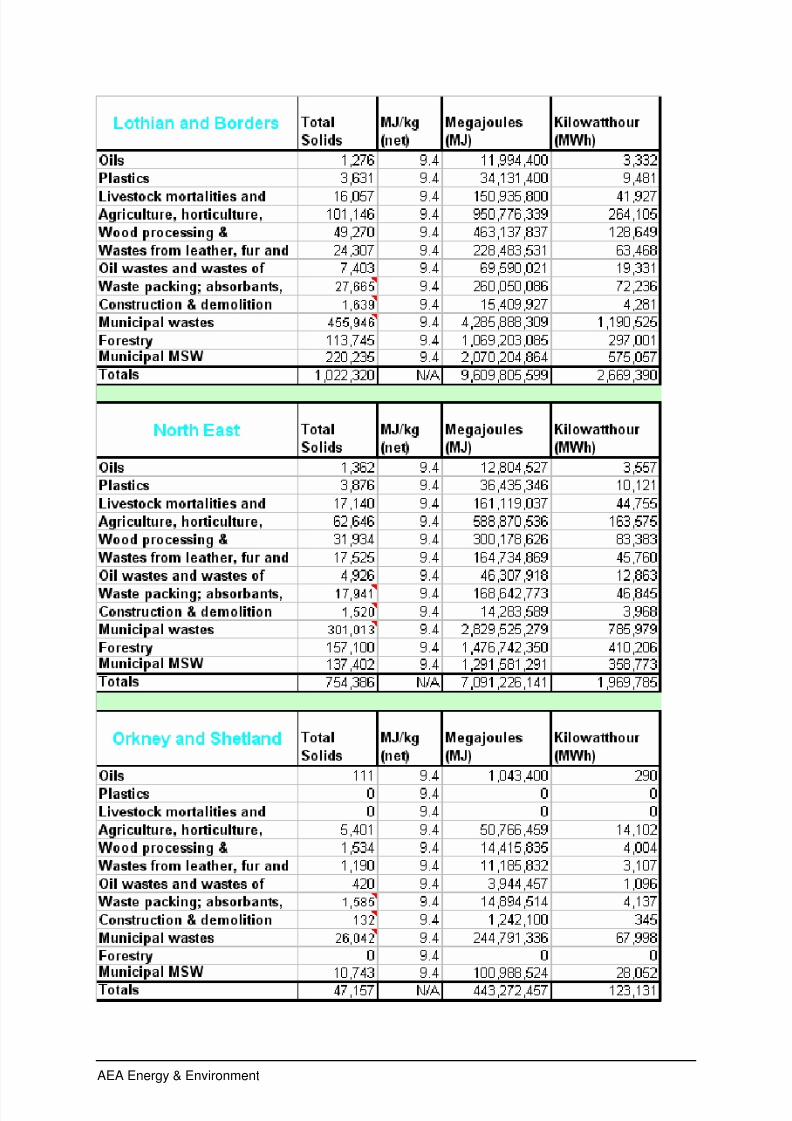
8/12/2019 SEPA- Report on Biowaste
http://slidepdf.com/reader/full/sepa-report-on-biowaste 89/95
AEA Energy & Environment

8/12/2019 SEPA- Report on Biowaste
http://slidepdf.com/reader/full/sepa-report-on-biowaste 90/95
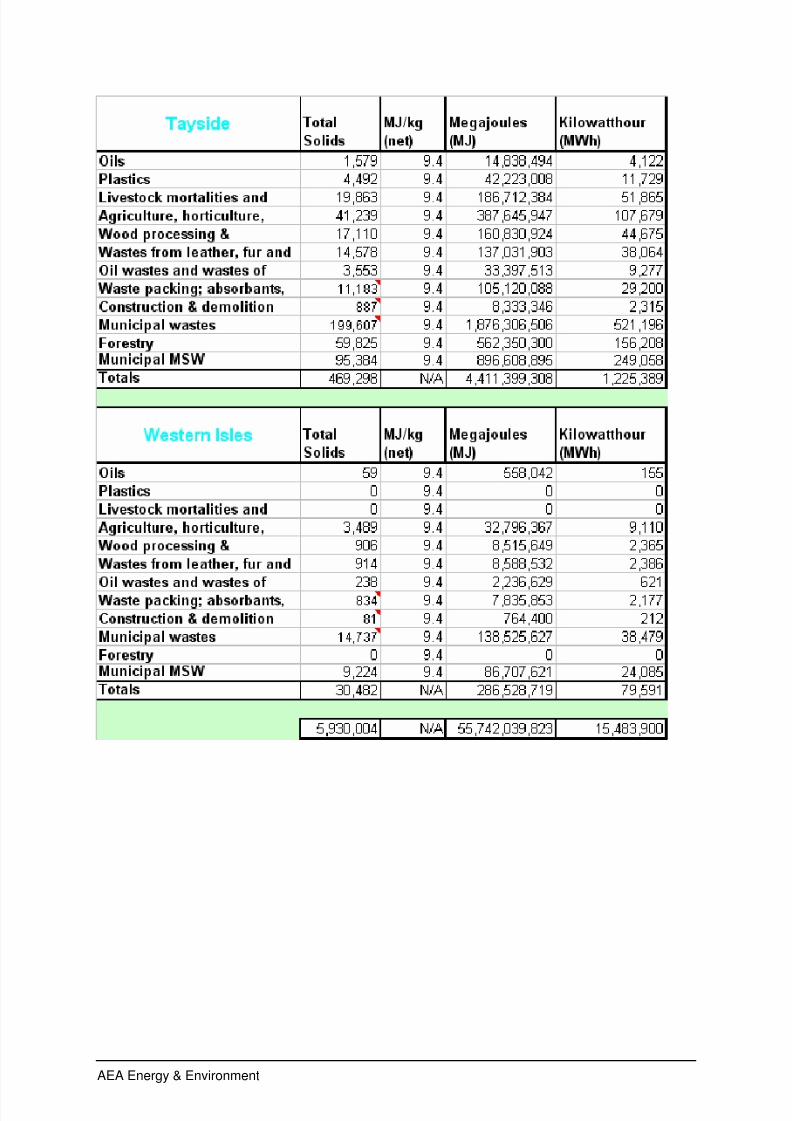
8/12/2019 SEPA- Report on Biowaste
http://slidepdf.com/reader/full/sepa-report-on-biowaste 91/95
AEA Energy & Environment

8/12/2019 SEPA- Report on Biowaste
http://slidepdf.com/reader/full/sepa-report-on-biowaste 92/95

8/12/2019 SEPA- Report on Biowaste
http://slidepdf.com/reader/full/sepa-report-on-biowaste 93/95
AEA Energy & Environment

8/12/2019 SEPA- Report on Biowaste
http://slidepdf.com/reader/full/sepa-report-on-biowaste 94/95
AEA Energy & Environment
8/12/2019 SEPA- Report on Biowaste
http://slidepdf.com/reader/full/sepa-report-on-biowaste 95/95