astudy of factors affecting the catching of …
TRANSCRIPT

A STUDY OF FACTORS AFFECTING THE CATCHING
OF LARGFMOUTH BASS, {MICROWERUS SALMOIDES)
AND SMALLMOUTH BASS. {MI-CROPTERUS DOLOMIEUI)
WITH HOOK AND LINE
Thais for the Degree of M. S.
MICHIGAN STATE UNIVERSITY
Jack GIann Mali - .
I962 .

LIBRARY
Michigan State
University

S
1.10134;

A STUDY OF FACTORS AFFECTING THE CATCHING 0F
LARGEMOUTH BASS, (MICROPTERUS SALMOIDES) AND
SMALLMOUTH BASS, (MICROPTERUS 90L0M__I_§I_J;)
WITH HOOK AND LINE
By fin I
JACK GLENN MELL
A THESIS
Submitted to the College of Agriculture
of Michi an State University in
partial fulf§llment of.the requirements
for the degree of
MASTER OF SCIENCE
Department of Fisheries and Wildlife
1962

ACKNOWLEDGEMENTS
This thesis is the result of the efforts of many.
Without the help of others, my work could not have been done.
A word of thanks to the fishermen who shared the boat
with me when making comparison studies. I am also greatful
to Dr. G. W. Mouser for encouraging me to keep with the
study and his confidence in me when I greatly needed it. My
thanks go out to the Sport Fishing Institute who in part,
sponsored my research.
I Thanks go to Dr. E. W. Roelofa, for keeping me ever
mindful of the scientific approach, dispite my frequent
tendency to overlook this very important principle, and
for the encouragement and the great amount of personal
time devoted to the study.
ii

ABSTRACT
A STUDY OF FACTORS AFFECTING THE CATCHING OF
LARGEMOUTH BASS, (MICROPTERUS SALMOIDES) AND
SMALLMCUIH BASS, (MLCBCPTERUS DCLCMIEg;)
WITH HOOK AND LINE
BY
Jack Glenn Mell
For three summers, records were kept on largemouth
bass, Micropterus salmoides, and smallmouth bass, Micropterus
dolomieui, caught by hook and line to determine under what
conditions bass strike. On each fishing trip, date were
collected on the phase of the moon, wind direction, barometric
pressure, air temperature, water temperature, water-surface
disturbance, color of bait, and sky condition. Most of the
data were collected in Diamond Lake, Cass County, Michigan,
trolling an underwater lure at night.
Over 1500 bass were caught during the period of study.
Of the bass taken in Diamond Lake, 319 were tagged and re-
leased to check their movement. Ninety-four were sacrificed
for stomach analysis.
No one stimulus was found to be the controlling factor
in causing bass to strike a lure. Tagging experiments
showed most bass confined their movements to small areas
in the lake.
iii
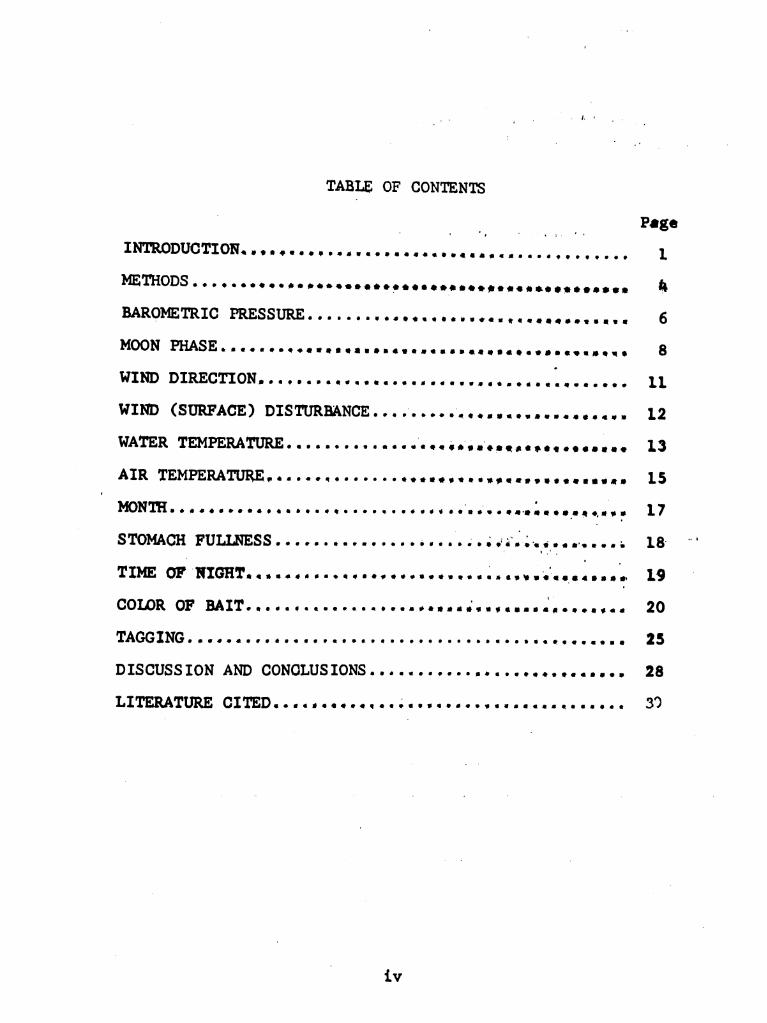
TABLE OF CONTENTS
IN'I'RODUGTIONOIOOOQODIIIJICOOICCCOOIQIIICIeIaea.cease.
METHODS...osones.soaaeaaeaeeeaeaeaseeoflsesststitoetea
BAROMETRIC PRESSURE..................................
MOON PHASE...........................................
WIND DIRECTION.......................................
'WIND (SURFACE) DISTURBANCE...........................
‘WATER TEMPERATURE......................-.............
AIR TEMPERATURE......................................
O
mnmeeeaaseeeeOaaassoc-0000.0IGUOiOOIOOOQI'IIIOOII‘QO,IOI
STOMACH FULLNESS...............5..a.ao8{Elisaa‘san-guuni
TIM 0F.INIGHTIQOIOIIIIQQQIOvtidloiifillOlCI‘I..‘.C._.CIII-..o
COLOR OF BAIT...............................J........
TACCINC..................... ..... ....................
DISCUSSION AND CONCLUSIONS...........................
LITERATURE CITED.....................................
iv
Page
11
12
13
15
17
18
19
20
25
28
39
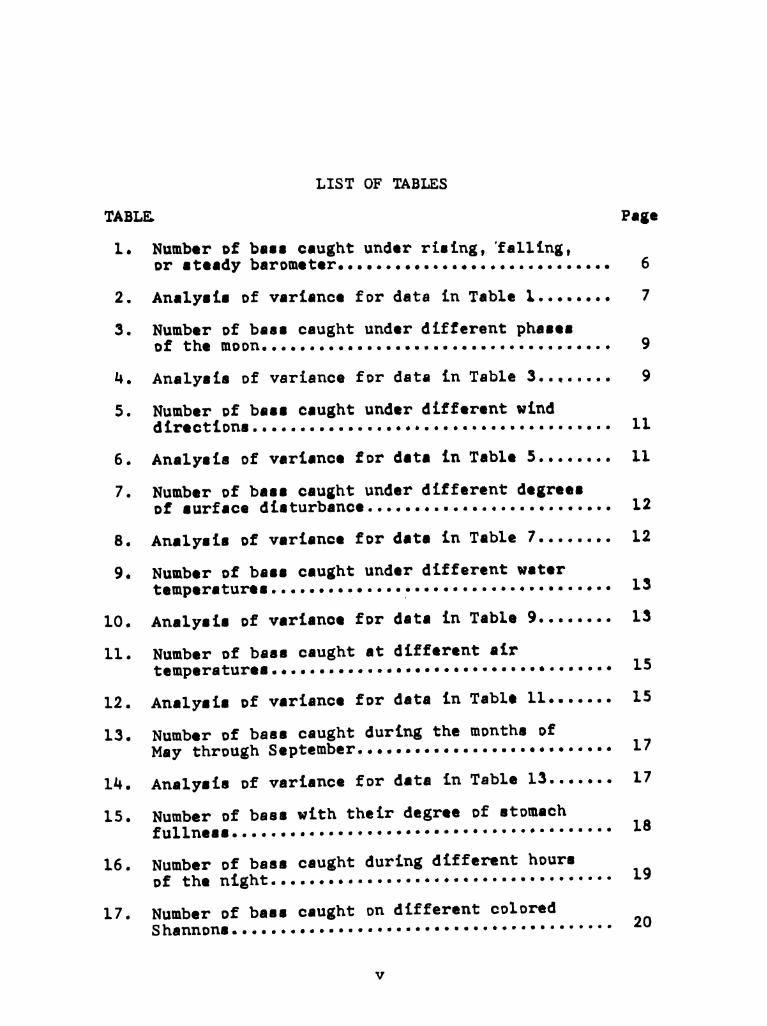
LIST OF TABLES
TABLE.
1. Number of bass caught under rising,’falling,
or steady barometer.............................
2. Analysis of variance for data in Table 1........
3. Number of bass caught under different phases
of the moon.....................................
4. Analysis of variance for data in Table 3........
5. Number of bass caught under different wind
dir.ction.0...l.....COOIOOOUO0.0IOOCOOOIOIOIOOI.
6. Analysis of variance for data in Table 5........
7. Number of bass caught under different degrees
of surface disturbance..........................
8. Analysis of variance for data in Table 7........
9. Number of bass caught under different water
t.mp.r.tur...0......000000'000...0.000.000.0I0000
10. Analysis of variance for data in Table 9........
11. Number of bass caught at different air
temperatur..I.IIIIIOOOOOCOUOOCO...0......OOIO...
12. Analysis of variance for data in Table 11.......
13. Number of bass caught during the months of
May through September...........................
1“. Analysis of variance for data in Table 13.......
15. Number of bass with their degree of stomach
inllne‘.........COOCOOOOOOOOOOOCOC00.000.000.00.
16. Number of bass caught during different hours
Df th. night...‘........00....‘0.00......0000000
17. Number of bass caught on different colored
Shannon.ooeoaO...OOOOO
OOCOIIOOOIQOeOeIeoasee
ease
Page
11
11
12
12
13
13
15
15
17
17
18
19
20

TABLE Page
18. Number of bass caught on different colors
of artificial nightcrawlers..................... 2h
19. Summary of bass tagged and recaught in
Di.mond Lak.00000IOOOOOIOOOOIOOOOOOO0.0.0.000... 26
20. Summary of bass tagged and recaught in
B.rr°n “RQIOICCCOOOIOOIICOIOOOOOOIOOOOOOIIII... 27
vi
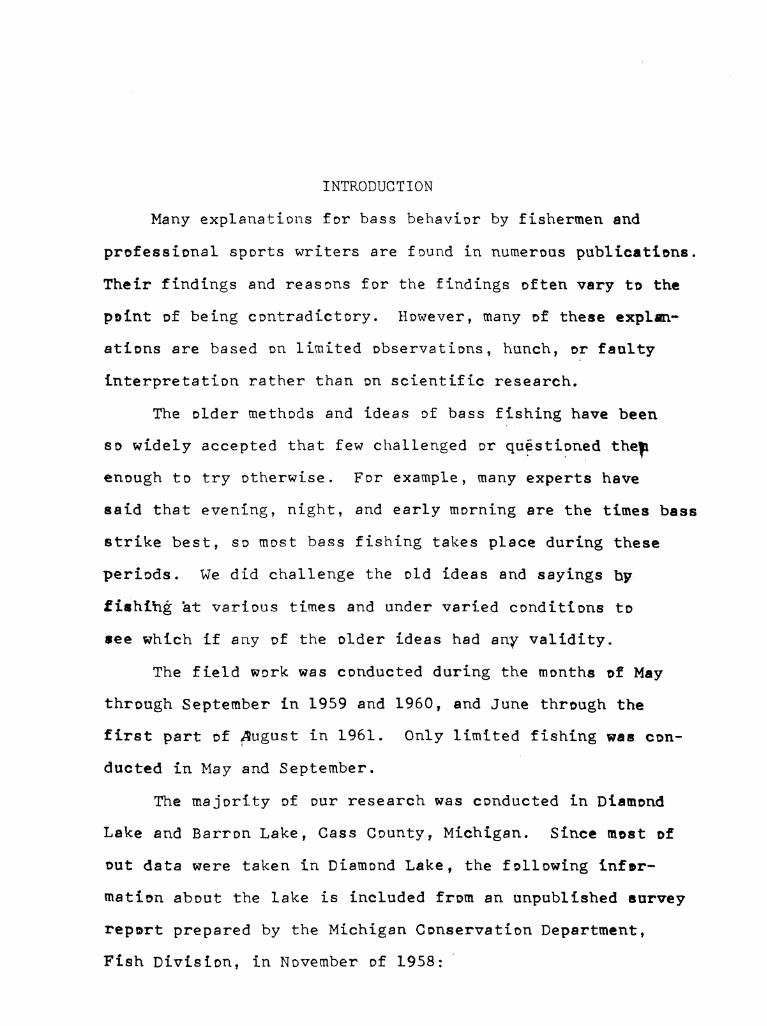
INTRODUCTION
Many explanations for bass behavior by fishermen and
professional sports writers are found in numerous publications.
Their findings and reasons for the findings often vary to the
point of being contradictory. However, many of these explan-
ations are based on limited observations, hunch, or faulty
interpretation rather than on scientific research.
The older methods and ideas of bass fishing have been
so widely accepted that few challenged or questioned them
enough to try otherwise. For example, many experts have
said that evening, night, and early morning are the times bass
strike best, so most bass fishing takes place during these
periods. We did challenge the old ideas and sayings by.
fishihg at various times and under varied conditions to
see which if any of the older ideas had any validity.
The field work was conducted during the months of May
through September in 1959 and 1960, and June through the
first part of August in 1961. Only limited fishing was con-
ducted in May and September. I
The majority of our research was conducted in Diamond
Lake and Barron Lake, Cass County, Michigan. Since most of
out data were taken in Diamond Lake, the following infor-
mation about the lake is included from an unpublished survey
report prepared by the Michigan Conservation Department,
Fish Division, in November of 1958:'

"The area of Diamond Lake is 1021 acres. The maximum
depth at the time of mapping was 6h feet. Shoal (water less
than 15 feet deep) comprises about 60 percent of the area.
The bottom soil on most of the shoal is marl, but there are
extensive deposits of sand, gravel, and rocks adjacent to
to the shoreline; patches of peat bottom occur close to the
small bay at the south end of the lake and in the small
bay at the south-east corner. Marl is the bottom soil in
the deeper parts of the basin."
"---A thermocline (zone in which the temperature drops
abruptly at successive depth levels toward the bOttom) oc-
cured between 32 and 40 feet. ---Dissolved oxygen in suffi-
cient quantity to meet the need of fish occurred from the
surface to 30 feet. The supply was sharply reduced at 3h
feet, and at 40 feet there was only a trace."
"As is characteristic of marl—bottom lakes, the water
of Diamond Lake is fairly hard. The methyl orange test for
alkalinity gave values that ranged from 135 to 165 parts
per million of dissolved mineral salts (mainly lime)."
"On the whole, acquatic vegetation is not plentiful in
this lake. Floating and emergent types of plants are sparse,
while submergents are sparse to medium. Water milfoil
(myriophyllum) wild celery (Vallisnerig), and two musk-
grasses (92223 and Nitella) are the more prevalent plants."
"---The results show that growth of largemouth bass,
northern pike, and perch in Diamond Lake is above average;
growth of 2-year-old bluegills and rock bass is average,

3
while that Of age classes above 2-year-olds in both species
is above average. Good evaluations could not be made for
smallmouth bass, crappies, or warmouths because of insuf-
ficient samples, but indications are that the growth rates
of these fish are also above average. The two 6-year—old
walleyes were average."
"We have no new fisheries management recommendations
to offer for this lake. The water contains goodly numbers
of a wide variety of fish with good growth rates. ---It
is not known why smallmouth bass are not more plentiful.
Spawning facilities appear to be excellent. Possibly this
species suffers from competition by other fish."
Over 1500 bass bere caught during the period of study.
Less than 100 of the bass were smallmouth. With five
exceptions, all bass included in this data were legal size,
10 inches or more.

METHODS
Our basic fishing technique was trolling a Shannon
Twin Spinner with an Uncle Josh Pork Frog in Diamond Lake
at night. The depth trolled ranged between five and fifteen
feet of water, close to bottom, or just over weeds if they
covered the bottom.
At the beginning of each fishing trip, air temperature,
barometric pressure, water temperature, phase of moon, wind
direction, degree of surface distrubance, turbidity, lake
and location, date, personnel, and time were recorded. At
the end of each fishing trip, time, hours fished, bass
caught, bass lost, number of strikes, species of bass
(largemouth or smallmouth), method of fishing, air temper-
ature, barometric pressure, and additional comments on tech-
nique used were recorded.
Since many of the conditions, wind, barometer, etc.
Often vary during the fishing period, it is important to
fill out another card, in addition to the starting and ending
card. Each time a bass was caught, a card was filled out
with the following data; lake and location, date, personnel,
species of bass, length of fish, bait, method of fishing,
time, wind direction, water surface disturbance, sky condi-
tion, phase of moon, barometric pressure, location in lake,
tag number, and an estimate of stomach fullness, along with
additional comments.

When figuring time required to catch a bass, time
was deducted for tagging, data recording, or other reasons
for having the bait out of water.
Other methods include casting and spinning with a
variety of lures in lakes in the vicinity of Diamond Lake.
BAROMETRIC PRESSURE
A change of .01 inches of mercury per hour either up
or down was chosen to indicate barometric movement. Baro-
vmetric movement of less than .01 inches per hour was listed
as steady.
The only data used in the statistical treatment were
those taken when the barometric pressure was increasing,
decreasing, or remaining steady during the entire time it
took to catch the fish. For example, bass might be taken
throughout several hours of a falling barometer. Then the
barometer failed to continue its .01 inch-per-hour drop.
The first fish caught after the barometer failed to continue
its downward trend would not be used in the statistical
treatment for this factor, as we could not be sure at what
time the barometer changed in its movement.
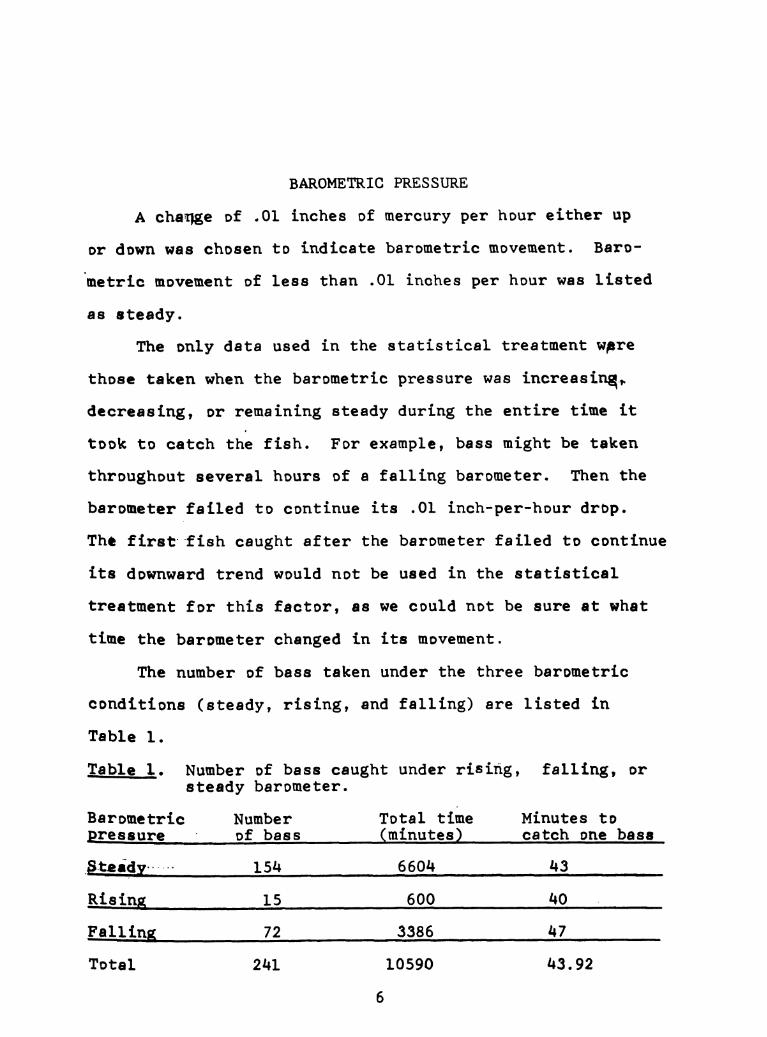
The number of bass taken under the three barometric
conditions (steady, rising, and falling) are listed in
Table 1.
Table 1. Number of bass caught under riSing, falling, or
steady barometer.
Barometric Number Total time Minutes to
pressure - of bass (minutes) catch one bass
.§£gidy“~~ 15h 660A #3
Rising 15 600 40
Falling 72 3386 #7
Total 2&1 10590 “3.92
6

Analysis of variance (Table 2) shows no difference
in catch rate associated with the barometric condition
studied.
Table 2. Analysis of variance for data in Table 1.
Source of Sum of Degrees Mean Variance
variation squares of freedom? square ratio
Barometric
pressure 1091 2 5u5.5 .a- .HZHZ
Residual 308611 2&0 1285.9

MOON PHASE
The phase of the moon was recorded as l/h, 1(2, etc.
even when the moon was completely covered by clouds and no
light appeared in the sky. Notations were then made on
the cards that the moon was present but no light could be
detected. Bass caught under these conditions (less than 20)
were not included in the data in Table 3. If the light
from the moon illuminated the sky to any degree, the bass
caught were listed in Table 3 under the corresponding moon
phase.
Bass caught following a change in the visibility of the
moon are not included in the data for that particular
condition. For example; Several base were caught with no
moon. An hour later a bass was caught after a 1/2 moon
had risen. This bass was not included in the calculations,
inasmuch as the time at which the moon rose was not re-
corded. All bass taken later were recorded as taken under
1/2 moon condition.

T8913 3. Number of bass caught under different phases of
the moon. .
Number Total time Minutes to
jMoongphege of bass (minuteg) . catch one bass
No moon 192_ A? 8452 4_ 44
ya" g 17 612 A 36 g f
1/2 W 29 155a g g 5L:
3/3 ' 19 904 < ‘ as W
,Epll . 92 4592 50
Total 349 16114 . 46.17
Analysis of variance (Table 4) indicates that the moon
phase has some effect on bass fishing success. A variance
ratio of 2.37 is significant at the 5% lever and 3.32 at
the 1% level.
Table 4. Analysis of variance for data in Table 3.
Source of Sum of Degrees -‘ Mean, Variance
variation squares of freedom square ratio_
‘Moon phase 26743 , 4 6685.8 4.1174
Residual 565074 348_ ‘ » 1623.8
. wright (1943) found from his study on Fish Lake, Utah,
that the phase of the moon had no apparent influenCe on fish-
ing success when trolling for rainbow and mackinaw trout.
However, fly fishing success decreased significantly at
times of first quarter moon when moonlight reached the fish—
ing area during the normal fishing hours. At times of full
moon, a mountain ridge protected the fiShing area during
the hours when most of the sport fishing occurred. His
conclusions, then, were that moonlight had some influence
on fly fishing success, but had no effect on trolling success.
10
It is difficult to understand the results of our study.
If light were the essential factor in determining fishing
success, a trend in fishing success from lower to higher
light intensity would be expected. Such a trend is lacking
in our data.

WIND DIRECTION
The number of bass caught under different wind directions
are listed in Table 5.
Table 5. Number of bass caught under different wind directions.
‘Wind Number Total time Minutes to
girection of bass (minutes) catch one bass
west 53 2468 47
Southwest 16‘ 746 as
Sggth 104 4124 40
East 34 1674 49
North 61 3236 53
None (nil) 52 2722 52
Total 320 14970 46.78
Analysis of variance (Table 6) shows no significant
difference in wind direction. A difference of 2.21 would be
necessary to indicate that wind direction had a significant
effect on catching bass. The observed variance ratio was
only 1.0306.
Table 6. Analysis of variance for data in Table 5.
Source of Sum of Degrees Mean Variance
variation squares of freedom Sguare ratio
Wind 949] s _;899.4 1.0306
Residual 587905 319 1843.0
ll

WIND ( SURFACE) DISTURBANCE
'When each bass was caught, the wave height was esti-
mated (Table 7). No data are included for waves over one
foot as the lake became too rough to troll.
Table 7. Number of bass caught under different degrees of
surface disturbance.
Wind (surface) Number Total time Minutes to
disturbance of bass (minutes) catch one bass
Less than 2" 150 6770 " ' ‘ as"
2" to 5" wave 80 3460 43
5" to 12" wave 27 1002 37
Total 257 11232 43.70
As Table 8 points out, no significant difference in
catch rate can be associated with surface disturbance.
Table 8. Analysis of variance for data in Table 7.
Source of Sum of Degrees Mean Variance
variation squares of freedom square ratio
Wind (surface)
disturbance 1497 2 748.5 .4602
Residual 416346 256 1626.3.
12

WATER TEMPERATURE
Table 9 lists the number of bass caught during differ-
ent water temperature conditions.
Table 9. Number of bass caught under different water tem-
peratures.
‘Water Number Total time Minutes to
_;ggperature of bass (minutes) catch one bass
80D - 85° F. 98 4728 48
75° - 79.5D F. 203 9954 49
70° - 74.5D F. an 2314 53
65° - 69.5° F. 24 1104 46
Total 369 18100 49.05
Water temperature by itself did not show any significant
effect on bass fishing (Table 10).
Table 10. Analysis of variance for data in Table 9.
Source of Sum of Degrees Mean Variance
variation squares of freedom square ratio
Water
gemperature 1238 3 412.7 .2326
Rgsidual 653032 368 1774.5
According to Bardach and Bjorklund (1957) who studied
several species of freshwater fish, a change in water temper-
ature of at least .05°C./minute was necessary for the fish
to detect. Because of the slow change in a body of water
as large as Diamond Lake (the greatest temperature change
for a twenty-four hour period was 2°F.), it is doubtful
that any changes occured rapidly enough for a fish to detect
l3

14
immediately, and therefore rapid changes in their position
or behavior pattern in the lake due to temperature changes
seem unlikely.

AIR TEMPERATURE
The air temperature was recorded at the beginning and
end of each fishing trip and the difference between the
temperatures was adjusted to give the effect of a steadily
changing temperature for the nights fishing (Table 11).
The air temperature was then assigned for the time the bass
was caught.
Table 11. Number of bass caught at different air temperatures.
Air Number Total time Minutes to
tgmperature of bass (minutes), catch one bass
,§p° P~3“'5° F. 17 752 an
15° - 79.5° F. 9a 3594 38 __
70° - 7u.s° F. 129 5964 46
65° - 69.5° F. 83 4578 55
60° — 64.5° F. 25 1384 55
Total 348 16272 46.76
A significant difference is indicated (Table 12), inas-
much as F.95(4,347) = 2.37.
Table 12. Analysis of variance for data in Table 11.
Source of Sum of Degrees Mean Variance
zpriation squares of freedom square ratio
A r
temperature 14678 44__ 3669.5 2.3879
Essidual 533232 347 *1536.7
I can see no reason why air temperature should affect
fishing unless some unseen factor was operating along with
15

16
it indirectly. Perhaps this is one of the 5% of the times
that the observed differences are due to chance rather
than air temperature. Our method of assigning air temper-
ature to each fish may also be responsible for the variance
r.t19s

MONTH
Although it only took an average of forty minutes to
catch a bass in August (Table 13), analysis of variance shows
that month alone is not responsible for bass fishing success
(Table 14). A variance ratio of 2.37 would be necessary to
be significant at the 5% level.
gpble l . Number of bass caught during the months of May
through September.
Number Total time Minutes to
NLa figtffibgpi A (Ill-115E133 fl - catch on' bass
Liar ”-1 9# A §03_; -fi5.7-- g; _
fine 1.- A, A 73:4 aszs 9g q _52 w p A
July, ,f ; 151 7836 ‘ fig 52 4
August . 127 f 5342 _ 40
September 15 701 47
Total 375 18310 48.90
Table 14. Analysis of variance for data in Table 13.
Source of Sum of Degrees ' Mean Variance
variation gquares of freedom square ratio
Math A _ fifi - 11263 111 fihwfi _2815.8 _ 1.4886
Residgl 707406 374 g 11 18914;
I did notice a difference in hooking. More base were
snagged around the south instead of _i__g the month during late
June or early July than any other time of the year.
17

STOMACH FULLNESS
Solo say whenever a bass strikes he is hungry, although
most will concede some fish are caught defending their
territory.
A total of 94 bass were opened and the degree of fullu
ness was estimated. As table 15 points out, base were
tskenwwith every degree of stomach fullness. It would seem
that the degree of fullness alone is not the reason for a
bass to strike a lure. Due to the digestive processes, by
chance alone you would expect to find more bass with empty
stomachs than full stomachs. However, it is interesting to
note that over half of the bass examined had empty or nearly
empty stomachs, indicating that hunger may be involved.
Table 15. Number of bass with their degree of stomach
fullness.
E!LLE£§1,._-- - vaumb rrof E!!!
Eliot! ~~~~--~~~~ :7
Trace --——~~~—--—_ 19
1/4 to 1/2 ~~~~~~~~~~~~ 13
1/2 to 3/4 -~———~~-——-— 13
all *7”'“"”————— 1 12
18

TIME OF NIGHT
The time of night may have something to do with the
success of bass fishing.
It should be pointed out that the Shannon Twin Spinner
was not as effective during daylight hours as it was at
night; hence, trolling usually didn't start until the sun
was down. However, some bass were taken effectively when
there was still enough light to land the bass without the
use of a flashlight.
Time was not deducted for data recording when determining
the number of minutes required to catch one bass in Table 16.
Ilble l . Number of bass caught during different hours of
the night.
Number Total fishing time ‘Minutes to
gppgl_~ of bass (gdnutes) catch gap bgss
§_._p,u, - 9 p.m. 16 1120 70 fl
_9___p,.m_.L - 10 p.m. 47 3530 74
mm, - 11 p.33. 74 4225 57
11pm,L - 12gp.m. 70 -44065 ._ 58 g
.12_a3m. f l a,m. 54 Agg3560 w 66 a,
,Lam. .- 2 a.m. 40 2860 - '72 :
2 .‘..,, :1 3 a.m. 27 12605‘fi , 96 -
3 gal, ~ 4 5.m. 27 ,+1825 .1 70
4 agna— Sam. 13 _ 1150 #81 V
Total 368
19

COLOR OF BAIT
Several different colored bucktails were tried on the
Shannon and no significant differences in catch were apparent
(Table 17).
Tgble 17. Number of bass caught on different colored Shannons.
.Qolor 1g 44;3_s__caught
Black bucktail a
& . Black -----~~ 42
Red,bucktail
1959 & 1960 Red ------- “3
k A _. -44
Black bucktail
& Black ------- 28
White bucktail
1959 & 1960 White ------~ 33
Black bucktail
&
White bucktail
1961 White ----—-- 17
Black -----~- 23
Only fishermen of equal ability to use the Shannon
assisted in this phase of the research. These were friends
with.whom I have fished for several years, using the Shannon.
Even so, the first time out on the study with a new assistant,
the data were taken so the assistant might adjust to the
study technique but wan-not used in the analysis.
The black-colored Shannon was used as a control and
all colors tested were compared with it, i. e., I used one
color and another fisherman used black or vice versa.
20
' 21
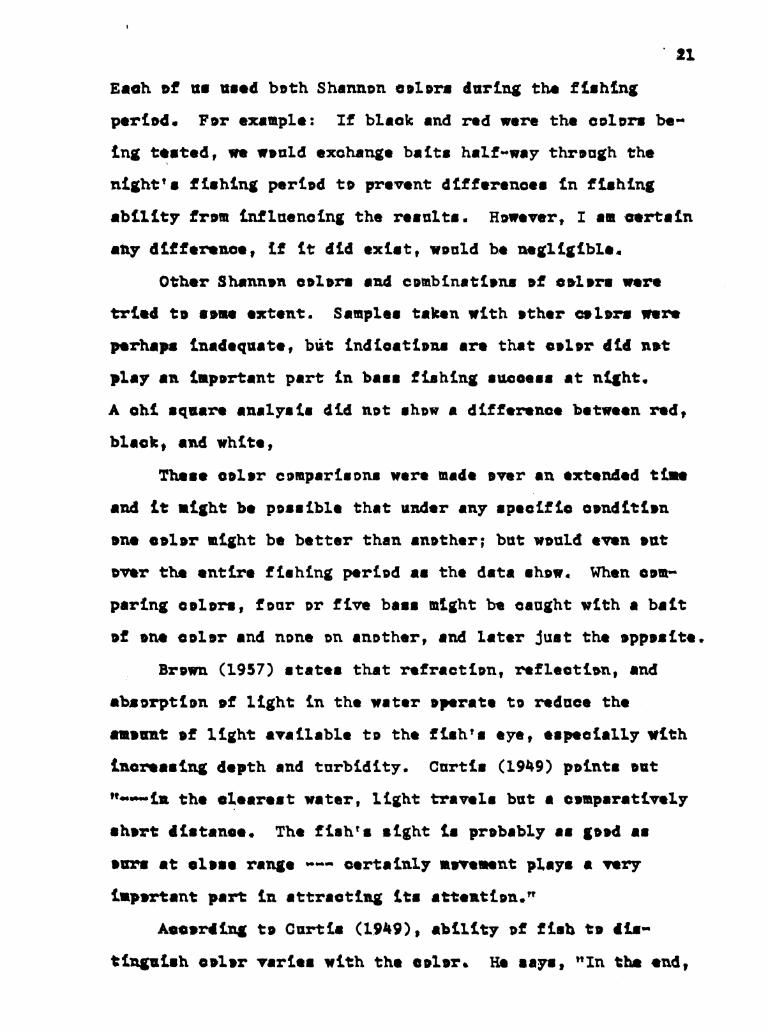
Each of us used both Shannon colors during the fishing
period. For example: If black and red were the colors be-
ing tested, we would exchange baits halfuway through the
night's fishing period to prevent differences in fishing
ability from influencing the results. However, I am certain
any difference, if it did exist, would be negligible.
Other Shannon colors and combinations of colors were
tried to some extent. Samples taken with other colors were
perhaps inadequate, but indications are that color did not
play an important part in bass fishing success at night.
A chi square analysis did not show a difference between red,
black, and white,
These color comparisons were made over an extended time
and it might be possible that under any specific condition
one color might be better than another; but would even out
over the entire fishing period as the data show. ‘When com-
paring colors, four or five bass might be caught with a bait
of one color and none on another, and later just the opposite.
Brown (1957) states that refraction, reflection, and
absorption of light in the water operate to reduce the »
amount of light available to the fish’s eye, especially‘with
increasing depth and turbidity. Curtis (19h9) points out
"~*~in the clearest water, light travels but a comparatively
short distance. The fish's sight is probably as good as
ours at close range ~~- certainly movement plays a very
important part in attracting its attention."
According to Curtis (19h9), ability of fish to dis-
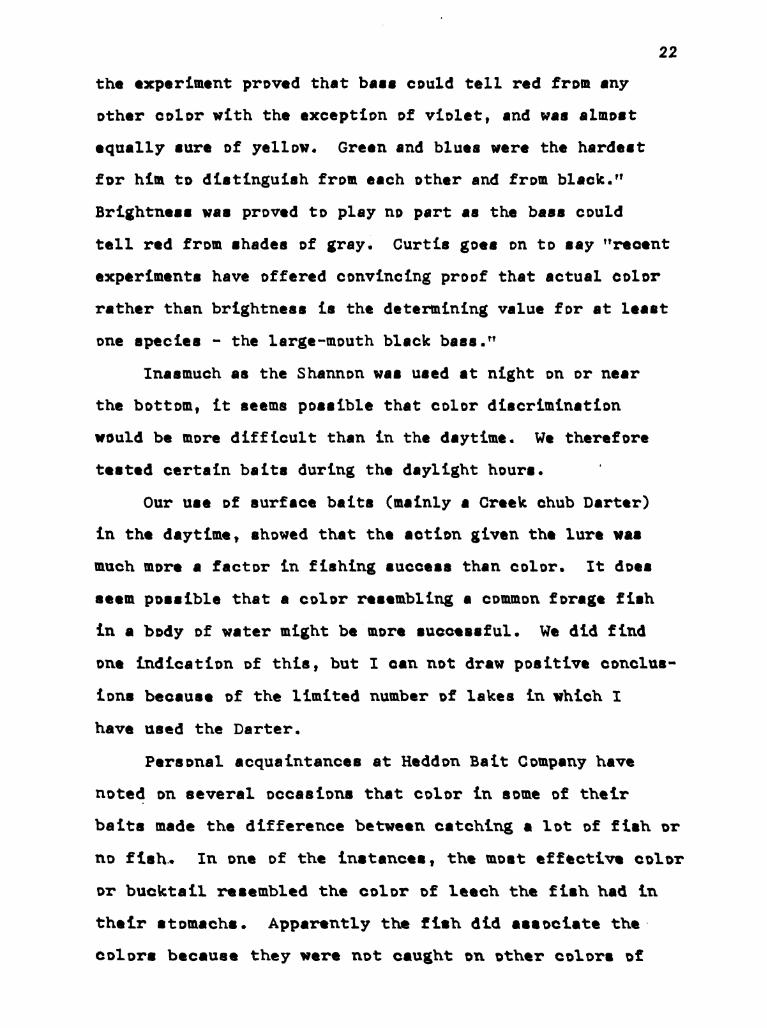
tinguish color varies with the color. He says, "In the end,
22
the experiment proved that base could tell red from any
other color with the exception of violet, and was almost
equally sure of yellow. Green and blues were the hardest
for him to distinguish from each other and from black."
Brightness was proved to play no part as the bass could
tell red from shades of gray. Curtis goes on to say "recent
experiments have offered convincing proof that actual color
rather than brightness is the determining value for at least
one species - the large-mouth black bass."
Inasmuch as the Shannon was used at night on or near
the bottom, it seems possible that color discrimination
would be more difficult than in the daytime. We therefore
tested certain baits during the daylight hours.
Our use of surface baits (mainly a Creek chub Darter)
in the daytime, showed that the action given the lure was
much more a factor in fishing success than color. It does
seem possible that a color resembling a common forage fish
in a body of water might be more successful. we did find
one indication of this, but I can not draw positive conclus-
ions because of the limited number of lakes in.which I
have used the Darter.
Personal acquaintances at Heddon Bait Company have
noted on several occasions that color in some of their
baits made the difference between catching a lot of fish or
no fish. In one of the instances, the most effective color
or bucktail resembled the color of leech the fish'had in
their stomachs. Apparently the fish did associate the'
colors because they were not caught on other colors of

~23
bucktail. Accordingly, it would seem quite apparent that
this was a case of the fish making an association with the
color of lure and natural food.
Different colors of artificial nightcrawlers were tried
and all were essentially equal in effectiveness when given
proper action. ‘We tried them on several lakes and could
find no color preferences in any of the lakes. I have had
many reports about success of some of my fishing associates
in other States and sections of Michigan, where they claim
color made a difference between successful bass fishing,
mediocre fishing, or no base at all. I have not personally
.tested their results.
‘we compared every color of artificial nightcrawler we
could find. ‘Most of the color comparisons were made during
.the afternoon hours as we caught fewer bass in the early
morning and late evening than through the middle of the day.
The colors used were black, dark red, natural nightcrewler
color, light red, black with white spots, yellow, yellow
with black spots, and blue. Black was used as a control-
color in comparing all the colors. 'When colors of night—
crawler were tested, the same companion and I fished
during all the time recorded for that color, and we ex-
changed nightcrawlers in the middle of the fishing trip.
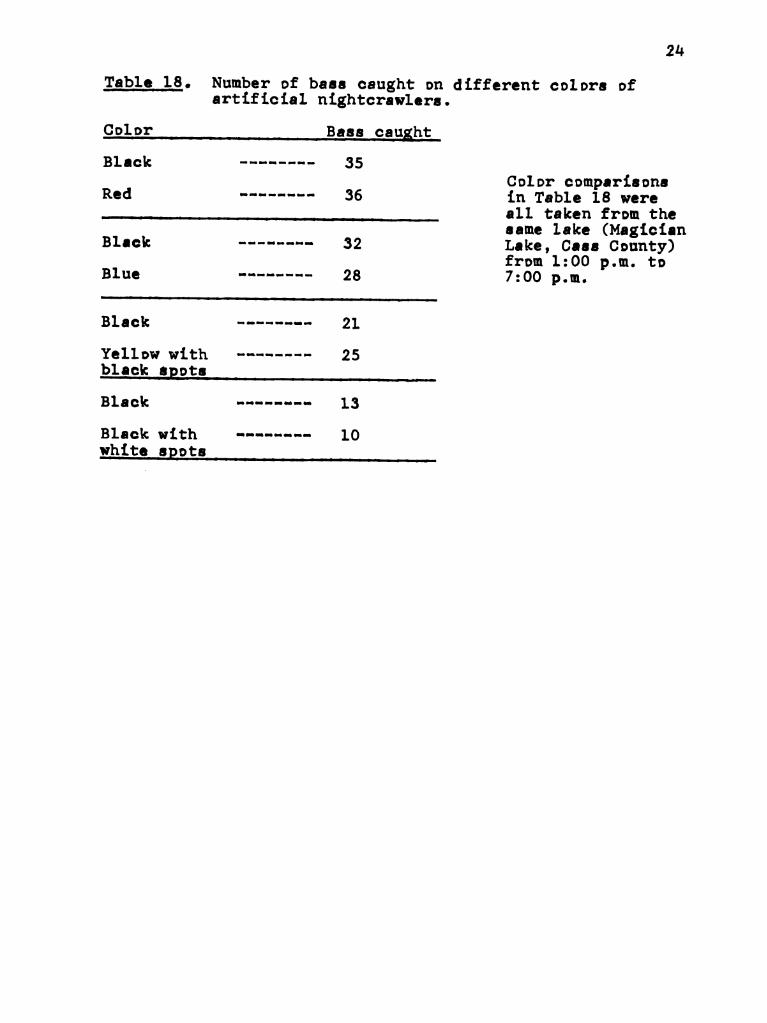
The results are listed in.Table l8.
2h
Table 18. Number of bass caught on different colors of
artificial nightcrawlers.
Color Bass caught
Black -------- 35
Red -------- 36
Black ----—--- 32
Blue -------- 28
Black -------- 21
Yellow with -------- 25
black spots
Black -~---~-- 13
Black with -----~-- 10
white spots
Color comparisons
in Table 18 were
all taken from the
same lake (Magician
Lake, Cass County)
from 1:00 p.m. to
7:00 p.m.
TAGGING
In 1959 and 1960, 319 base were tagged. Most of our
base were caught and tagged in Diamond Lake. Both Diamond
and Barron lakes were marked off in zones. Pluses and
minuses were used to designate the ends of zones. (See map
of Diamond Lake in insert on back cover.) The distance from
shore where the base were caught was estimated. See Table
19 for tagging data.
The tags were attached by a nylon string just below
and behind the dorsal fin in about a quarter of an inch of
flesh. The small, one-half by one-quarter-inch red plastic
tag had a number on one side and the M. S. U. Fish Depart-
ment's address on the other side.
Generally speaking, the bass showed very little move-
ment. It is difficult to determine exact movements as the
normal area of movement of certain fish might be at the
edges of our arbitrary zones. Hence, I estimated the bass's
maximum movement. The fish bearing tag number 3102 was
recovered five days later at the exact spot I originally
caught the fish --- at the base of a cement pier.
I personally know of bass being caught with tags that
were not returned, in spite of efforts to-get the infor-
mation on the tag.
25

26
, Table 12. NSummary of bass tagged and recaught 1n DiaMond Lake.
Tag Date Area first Area Distance
umb r ta a can ht re:ggygh;_, ef travel
1312 79.10.60 11-6—60 ’ Y" to c a nu
F Uoo y&.T‘Uoo yds.
1179 A_ 7-11.60 from shore) from shorelg hi]
fi"’ M (550 ydi. N+ (TE Ft. 1 less than
212§le 7.15-60 from shore) of water 1 0 ds
‘ a? (TOO ydfiT—Wy s.
,3102_ 6-11-60 from shore) from shore) n11
A F (50 vaufT- (20 ft. *"
11g] _]-]1.60 from shore)_ of water)__ n11 A
K' (100 van. K- (25 Ft. ‘ ‘v"
2227 “6-3-60 from shore)_ of waterl_ nil‘ ,
08 ‘-]59‘0 A+ A+ n11
‘1 Wmo m.:282 5-22—60 from share) from shore) nil
11104 fi‘I-l 1-60
33.6 8-20-22 8-11-59
1129 6-20-59_ J-28-59
z to g- L“ z- n” fl
Y' Y' ‘ hi! i
Q (75 yfi. Q
from shore)_; n11
nil
Z ,Z A T
NIF (30 yas. 5* I55??. 1ess than
. from share), from shore): 2501:“I
go - 7-8-59
1190 17-22-59
1128' J-Bréz
3170. 7-11-52
32h: 8-18-59
2;: 6-25-60
0- to 1* 0* to 1* n1] ,4
W” W‘ nil
2‘ to Y 2‘ to Y n41 - .
less than
0* 6+ _550 yds,
mo 8-15-59
3:65 7-10-60
3712 8-8-60
Tm Wu. c (’75 yJi.
from shore
1”to I (1 O 8'
yds. from at Ieast 300 yds.
share), from shorel
A (150 ydfiT to r' (100
from shore) yds. from n11
shprel

27
Table 20. Summary of bass tagged and recaught in Barron Lake.
Tag Date Date Days Area first Area Distance
number tagged recaptured out cau ht re-cau ht of travei
F: 5500 yas. F' {200 yds. “
329 6-2 -60 6-21-60 2 from shore) from shore) nii
1 i 1" 175 Ft. A- (T60 ft.
3132, 6-26-59 47-19-59 23 from shore} from shore) nil
3 y 8.
32h 6-21-12 1-20-59 2] from shore} nii
ase o (exact
3102 6-17-59 6-22959 _5 cement aierl spot tagged) nil
V3 75 y 8. S 0 t. *Tess than
2503 6-11-59 6-23-59 6 from shorelg from shore) 100 ydsL
NT7§ yds. ’0’(§00 Ft. ’Tess than
2123 6-23-59- J-i9-52_ 26 from share) from shore) 200 xds.
Although indications are that bass usually confined
their movements to small areas in our two lakes, studies
with tags on a very small lake by Bell (l9hh) indicate the
bass may be moving over the entire lake. Ball tagged fifty-
two bass in a lO-acre lake which had a narrow band around
the edge and then dropped down quite rapidly to 55 feet. He
concluded, "---seven were returned by hook and line or in
nets. The returns indicate that the bass roved over the
entire lake and showed no tendency to remain in one location."
From his work in Douglas Lake, Michigan, Rodeheffer
(l9h0) reports very little movement. He set up artificial
brush shelters and kept records of the movements between
shelters within the lake. Rodeheffer concludes, "The re-
sults of three summer's work at Douglas Lake quite definit-
ely indicate that there is little movement of the native
game fish from one part of the lake to another. Of all
the fish marked at several locations in Douglas Lake and
loosed at the point of capture none were retaken in distant
parts of the lake. Recaptures were made only in the near
vicinity of original capture and release."
DISCUSSION AND CONCLUSIONS
What causes bass to strike is still a partial mystery
to me. Each one of the characteristics tested is a study in
itself, and our study did not show any one factor to be re-
sponsible for fishing success. Probably a combination of
stimuli are operating at all times. Fishing success would
then depend on the number of stimuli operating in combination
at any one time.
I have been fishing and had bass begin to strike as if
a signal had been given, and then stop just as quickly. At
the same time, this condition was also true of several lakes
in the nearby area where some of my companions were fishing.
This suggests that some atmospheric or meteorological phenom—
enon influences bass fishing.
It has been said that bass won't bite during a heavy
rain with thunder and lightening. At times this is true,
but I have experienced very good bass fishing during a
severe electrical storm accompanied by heavy rainfall. I
have, however, noticed that bass fishing, trolling the
Shannon at night, is generally slower after rains.
There was not enough fishing time during periods when
the northern lights were showing to draw any conclusions;
but both good and poor bass fishing was experienced during
this condition.
28

29
The section of the study related to the phase of the
moon has left me with many new questions. I plan in the
future to look into several possibilities such as how well
bass strike various colors of a bait during different
phases of the moon, feeding periods in relation to position
and fullness of the moon, and others. I would even look
more deeply into tides, though, on even the largest inland
lakes, they are very small; and rays coming through the
clouds at night which are not visible to the eye.
I feel the most important factor in catching bass is
the individual angler's skill and understanding in the use
of his particular lure. I have found that skill in operat-
ing a lure is usually far more important than color, or
even its shape.

LITERATURE CITED
Ball, Robert C. 19h9. A tagging experiment on the fish
population of Third Sister Lake, Michigan. Trans. Am.
Fish. Soc., 74: 360 - 369.
Bardach, John E., and Richard G. Bjorklund. 1957. The
temperature sensitivity of some American freshwater
fishes. Am. Nat., 91: 233 - 251.
Brown,‘Margaret E. 1957. The physiology of fishes. Vol. 2.
Academic Press Inc., New York. 526 pp.
Curtis, Brian. l9h9. The life story of the fish, his morals
and manners. Harcourt, Brace and Co. New York. 28& pp.
Rodeheffer, Immanuel A. 1941. The movement of marked fish
in Douglas Lake, Michigan. Mich..Acad. Sci., 26:
265 "‘ 2800
Wright, Stillman. l9h5. The effect of moonlight on fishing
success in Fish Lake, Utah. Trans. Am. Fish. Soc.,
73: 52 - 58. . M
30

mam USE 0m

B.M.=IO0.0-CROSS ON TOP OF
CEMENT PILLA I
CLAPPERS OF CLAPPERS BOAT A
MARINE LOADING PIER. 0
$ .. HOSPITAL WATER SURFACE ELEV.=96.5 ;
2/l4/47
S
‘6‘
INSTITUTE FOR FISHERIES RESEARCH
. ' g
. \
DIVISION OF FISHERIES MICHIGAN CONSERVATION DEPT.
e . %
LAKE INVENTORY MAP"'5,
5. I SANDY I BEACH ' I s .
DIAMOND LAKE
q, ' 's.sll as IIns-IlssIsIIlslssla .a_ ' .
s __ _ .=. . -- ' ' e
AREA IOZOACRES,, \ a. ""‘ + ”a - . -=,®
\‘ \\ ,A
~ .
MARGINAL SURVEY AND SOUNDINGS I/24-3I & 2/ L3,6,7,8,I I-I4/47\‘\ “
®
\\\‘ .
0
\‘ r
\\ ,’
e \\ ’/
CASS COUNTY T. 6—7 5.,R. I4-I5.,w sac s.I,6,5,3I,32,36 uowsu. \\\\ X” .
POINT \\J,’ .,
\‘, ,
\I ;||
' :‘.® x‘
'II
PRIVATE
PARKfl‘Ix
WAoEs
ADDITION
LEGENDIII
L7”
-——:::::::::===::3:'—:::
"'
I", T—
w
I/L~ A:
III
”FY-'3”, ‘
'
OUTLINE &CONTOURS I} ,7'
-—-- Shoreline 'I’I’ /,"
g I",
I I I
—5—— Coniours H ," 0 7‘II mil/.0
l I
\u
SHORE FEATURES .: I
I Coiiaqe if ’37:
I",
“I Dock x H ." '-IP C453 II III I
I
Slope I - xm Sprmq “Nix;
—— Improved road ‘.‘I
::::: Ummproved FOCId pARK .sI-Ioas .‘I‘\ E I
s Booihouse susoIVISION .II
-°°'°°°- Breakwoier '5"
w Marsh '1';I
* Brush :1:
GD Wooded
0 Porily wooded (9
© CuIIIvoied
a InleI ®
‘—
=< Ouilei
t
® at
. _. “ I” 33:21 SHORES
\\
x j," ’ ’5” '
“\
a“. 6 ’10,
\:\II/ :Ilf’
\‘\:\
I? :III,3
\
. . I,o
\\‘.,’/’
O
\\\
.II/it,3o
\ .
- I;
o
n a. t 'I EAGLE '
\\‘\®
,e .IIII POINTg;
\\ \“
e01,
0
© \t\ .
’1’!
\
\
\\\ g
‘0‘ "
® ®
‘0‘ e.\\\
e\\\\‘ 1 t
‘0‘1 \l /
\\“ \\\
0“ \ul
\\ . §\
t
®
Q I:
\--l
g 400’ 800’ I200’ I690’
SCALE I“;
Q \I-l
"e
DAM’ Q9 °
0
3 fix
0
{\7‘0 w
w.c.
\‘\.44.ee
\\
BARNI
DIAMOND LAKE Cass Couniy T. 5—7 3, R.I4—|5 W., Sec’s.|,6,5,3|,32,36

.a "r"
‘t VI. r .o—L-“fi. 0-7 ‘ ‘ ‘ IV