association between single-nucleotide polymorphisms and milk production …€¦ · ·...
TRANSCRIPT

©FUNPEC-RP www.funpecrp.com.brGenetics and Molecular Research 13 (4): 10256-10268 (2014)
Association between single-nucleotide polymorphisms and milk production traits in buffalo
G.C. Venturini1, D.F. Cardoso1, F. Baldi1, A.C. Freitas1, R.R. Aspilcueta-Borquis1, D.J.A. Santos1, G.M.F. Camargo1, N.B. Stafuzza2, L.G. Albuquerque1 and H. Tonhati1
1Faculdade de Ciências Agrárias e Veterinárias, Universidade Estadual Paulista, Jaboticabal, SP, Brasil2Instituto de Biociências, Letras e Ciências Exatas, Universidade Estadual Paulista, São José do Rio Preto, SP, Brasil
Corresponding author: G.C. VenturiniE-mail: [email protected]
Genet. Mol. Res. 13 (4): 10256-10268 (2014)Received January 15, 2014Accepted September 23, 2014Published December 4, 2014DOI http://dx.doi.org/10.4238/2014.December.4.20
ABSTRACT. The aim of this study was to identify single-nucleotide polymorphisms (SNPs) in buffaloes associated with milk yield and content, in addition to somatic cell scores based on the cross-species transferability of SNPs from cattle to buffalo. A total of 15,745 SNPs were analyzed, of which 1562 showed 1% significance and 4742 with 5% significance, which were associated for all traits studied. After application of Bonferroni’s correction for multiple tests of the traits analyzed, we found 2 significant SNPs placed on cattle chromosomes BTA15 and BTA20, which are homologous to buffalo chromosomes BBU16 and BBU19, respectively. In this genome association study, we found several significant SNPs affecting buffalo milk production and quality. Furthermore, the use of the high-density bovine BeadChip was suitable for genomic analysis in buffaloes. Although extensive chromosome arm homology was described between cattle and buffalo, the exact chromosomal position of SNP

10257
©FUNPEC-RP www.funpecrp.com.brGenetics and Molecular Research 13 (4): 10256-10268 (2014)
GWAS for milk production traits in buffalo
markers associated with these economically important traits in buffalo can be determined only through buffalo genome sequencing.
Key words: Cross-species transferability; Fat; Protein
INTRODUCTION
Buffaloes in Brazil are mainly bred for the production of milk to make dairy products for economic reasons. Compared with cow milk, buffalo milk has higher levels of fat, protein, and total solids (Verruma and Salgado, 1994; Ahamad et al., 2008). The concentration of these constituents is reflected in the high economic value of this milk. According to Tonhati et al. (2000, 2008), the favorable attributes of buffalo milk and the strong demand for mozzarella cheese have resulted in high profits from raising buffaloes in Brazil.
To identify high-quality genetic material for animal improvement programs, many re-searchers have used molecular genetics techniques to identify genes responsible for phenotypic variation associated with traits of economic interest. Methods have been developed for the selection of superior genotypes. However, even with the development of molecular genetic methods to study genomic associations between various animals, such as cattle (Meredith et al., 2012), poultry (Xie et al., 2012), and pigs (Schneider et al., 2012), molecular information and tools for buffaloes (Bubalus bubalis) is limited. Genomic techniques are particularly attractive for animal improvement because of the ability to directly use DNA information for selection, allowing higher selective efficiency, a faster rate of obtaining genetic gains, and low cost com-pared with traditional selection based on phenotypic data (Schaeffer, 2006). Among the avail-able genomic tools, the use of single-nucleotide polymorphism (SNP) markers is particularly effective for selecting traits measured in a single sex, such as milk yield and milk composition.
Several studies have examined buffaloes to identify SNP markers associated with milk components. Otaviano et al. (2005), Riaz et al. (2008), and Feligini et al. (2009) reported the association between molecular markers and components of buffalo milk for several mo-lecular isoforms of caseins (alpha s1-, alpha s2-, beta-, and kappa casein). Additionally, Ra-mesha et al. (2008) and Meignanalakshmi and Nainar (2009) found an important association between genetic markers and the beta-lactoglobulin and alpha-lactoglobulin genes, while Gil et al. (2013) and Zetouni et al. (2013) identified genes involved in feed intake.
The water buffalo B. bubalis and cattle (Bos taurus) belong to the subfamily Bovinae, with evolutionary divergence estimated to be 20 million years ago (Parma et al., 2004). An extensive chromosome arm homology between both species has been established through cy-togenetic studies (Di Meo et al., 2008) and genetic mapping (Amaral et al., 2008). While the bovine genome consists of 29 acrocentric autosomes (single-armed) and a pair of sex chromo-somes (X/Y), the buffalo genome contains 19 acrocentric (single-armed) and 5 submetacentric (biarmed) autosomes as well as the X and Y chromosomes. In buffalo, the 5 biarmed pairs originated from centric fusion translocations involving cattle (ancestral bovid) homologous chromosomes. Thus, the arm number is identical between both species, and all buffalo chro-mosomes share homology with single bovine acrocentric chromosomes. B. bubalis chromo-some 1 (BBU1) is a fusion of B. taurus (BTA) chromosomes 1 and 27, BBU2 equals BTA2 and 23, BBU3 equals BTA8 and 19, BBU4 equals BTA5 and 28, and BBU5 equals BTA16 and 29. The remaining acrocentric chromosomes have a one-to-one correspondence between the 2 species: BBU6/BTA3, BBU7/BTA6, BBU8/BTA4, BBU9/BTA7, BBU10/BTA9, BBU11/

10258
©FUNPEC-RP www.funpecrp.com.brGenetics and Molecular Research 13 (4): 10256-10268 (2014)
G.C. Venturini et al.
BTA10, BBU12/BTA11, BBU13/BTA12, BBU14/BTA13, BBU15/BTA14, BBU16/BTA15, BBU17/BTA17, BBU18/BTA18, BBU19/BTA20, BBU20/BTA21, BBU21/BTA22, BBU22/BTA24, BBU23/BTA26, and BBU24/BTA25 (Cribiu et al., 2001).
Because buffaloes and cattle are closely related, genomic studies have been devel-oped for buffaloes based on the abundant genomic resources available for cattle. Amaral et al. (2008) obtained maps for the entire buffalo genome base on cattle-derived markers, with a total of 2621 markers mapped on the buffalo genome, of which 1734 were cattle-derived SNPs and the remaining 887 markers were classified as cattle sequence tagged site, including coding genes, expressed sequence tags, and microsatellites.
Genomic studies involving buffaloes have been carried out based on the bovine 50k chip. Michelizzi et al. (2011) and Wu et al. (2013) demonstrated the efficiency of Illumina Bo-vineSNPS50 BeadChip (54,001 SNPs) to study buffaloes. Michelizzi et al. (2011) genotyped 10 water buffaloes and observed 1159 polymorphic markers, while Wu et al. (2013) genotyped 91 water buffaloes and found 935 polymorphic markers. The high-density bovine chip (Illumi-na Infinium® BovineHD BeadChip) contains more than 777,000 SNP markers spread through-out the bovine genome and more than 167,000 SNPs in buffaloes (Illumina, 2010; NBAGR, 2013). It can be used to develop strategies for conserving genetic variability, organization of genetic improvement programs, and evaluation of commercial herds to identify associations between the quantitative trait loci and traits of economic interest.
Using the buffalo-bovine chromosome homologies and the extensive resources avail-able for cattle, the goal of this study was to identify SNPs in buffaloes associated with milk, protein, and fat yield, percentage of fat and protein, and somatic cell score using the777k chip developed for bovine (Illumina Infinium® BovineHD BeadChip).
MATERIAL AND METHODS
Herd data
The dataset used in the present study was provided by 384 female water buffaloes (B. bubalis), born in 2007 and 2008, from to 2 dairy farms in the states of Rio Grande do Norte and São Paulo, Brazil. These data are contained in the database maintained at the Department of Animal Science of Faculdade de Ciências Agrárias e Veterinárias of Universidade Estadual Paulista. The animals were raised on pastures with feed supplementation during the dry period from April to September.
Lactation records were unadjusted for days in milk and lactation records with a length above 305 days were truncated at this point, as suggested by Tonhati et al. (2000). Lactation records shorter than 90 days in milk were deleted. The first test-day milk record was measured from days 5-75 after calving. Primiparous buffaloes with an average age of 2.78 ± 0.28 years were utilized.
Studied traits included the 305-day accumulated yields of fat (FY305), protein (PY305), and milk (MY305), as well as the percentages of milk fat (%F) and protein (%P) and the somatic cell score (SCS). The %F, %P, and SCS values were obtained by averaging the monthly test-day records per lactation following the recommended by Tonhati et al. (2000).Somatic cells counts (SCC) were transformed to linear scores using the following equation: SCS = [log2 (SCC/100.000)] + 3, as described by Dabdoub and Shook (1984).

10259
©FUNPEC-RP www.funpecrp.com.brGenetics and Molecular Research 13 (4): 10256-10268 (2014)
GWAS for milk production traits in buffalo
DNA extraction and quality control
DNA samples were collected from the hair follicles of each animal and stored at 4°C until DNA extraction. The DNA was extracted from the hair follicles using the phenol-chloro-form-isoamyl alcohol method. The quantity and quality of the DNA obtained were analyzed in a Nanodrop 1000 spectrophotometer (Thermo Scientific, Waltham, MA, USA). Stock DNA solution was diluted to 50 ng/mL for use later use.
Genotyping was performed using the Illumina BovineHD BeadChip, with the Infin-ium® HD assay kit and Illumina HiScanTM system (Illumina Inc., San Diego, CA, USA). The BovineHD BeadChip contains 777,962 SNP markers spread through the genome and an aver-age distance between markers of 3.43 kb. Although the BovineHD BeadChip was developed for bovines, there is strong homology between water buffalo and bovine chromosomes. initial analyses of the images and genotypes were carried out using the Genome Studio software (Il-lumina Inc.). A total of 1735 markers were excluded because of unknown genomic position. Only markers with a call frequency greater than 80% and heterozygote excess lower than -0.70 or greater than 0.70 were considered. The markers showing low average cluster inten-sity (AB_R, AA_R or BB_R mean <0.1; AB_T_mean <0.2 and AB_T_mean >0.8), GenTrain score <0.30, and cluster separation index <0.13 were excluded from the analysis. Similar crite-ria for filtering genomic data were implemented by Michelizzi et al. (2011) using the Illumina BovineSNPS50 BeadChip on DNA samples from 10 water buffaloes. In the present study, we only included markers in autosomal chromosomes with minor allele frequencies greater than 0.05. All quality control was performed using the UNIX language in the FEDORA operational system. This cleaning generated a file containing a total of 15,745 markers, which were used for genomic association.
Genome-wide association analyses
Association analyses were carried out considering only 1 marker at a time using the maximum restricted likelihood method and the MACRO command and the MIXED proce-dure of the SAS program (version 9.2, SAS Institute Inc., Cary, NC, USA). The fixed effects considered in the model were as follows: SNP marker [as linear covariable defined as 0 (AA); 1 (AB) and 2 (BB)], contemporary group (CG) and daily milking number (2 levels), and age of animals as a linear and quadratic covariables. CGs were defined as: farm, year, and calving season: dry season (April-September) and rainy season (October-March), generating a total of 33 CGs. After evaluating the consistency of the data, there were 358 phenotypic data remain-ing for each trait. The descriptive statistics of each trait are shown in Table 1.
Trait Mean SD MIN MAX CV
MY305 (kg) 1578.90 508.54 570.00 3535.00 32.20FY305 (g) 106.41 34.04 0.00 244.00 31.98PY305 (g) 67.16 21.86 23.00 156.00 32.54SCS 7.29 1.17 0.00 11.06 16.05%F 6.84 1.04 3.62 10.28 15.20%P 4.26 0.28 3.53 5.53 6.57
Table 1. Descriptive statistics for the yields of milk (MY305), fat (FY305) and protein (PY305), somatic cell score (SCS), fat percentage (%F), and protein percentage (%P).

10260
©FUNPEC-RP www.funpecrp.com.brGenetics and Molecular Research 13 (4): 10256-10268 (2014)
G.C. Venturini et al.
Manhattan graphs were constructed using the GAP instructions in the R software (R Development Core Team, 2012), considering 5 and 1% significance levels for the markers. In addition to these tests, the Bonferroni test was applied at 5% significance for all traits.
The false discovery rate (FDR) was estimated using the equation below (Benjamini and Hochberg, 1995):
where n is the number of SNPs included in the association analysis, P is the level of signifi-cance (α) utilized, and k is the number of SNPs significantly associated with the trait of interest at that level (α).
RESULTS AND DISCUSSION
Figures 1-6 present the results of the association analyses for MY305, PY305, and FY305, %P and %F, and SCS, respectively. Of a total of 15,745 SNPs subjected to quality control, 1562 and 4742 SNP markers were significantly associated at the levels of P < 0.01 and P < 0.05 for all traits studied. A total of 452 SNPs for MY305, 192 SNPs for FY305, 449 SNPs for PY305, 161 SNPs for %F, 142 SNPs for %P, and 166 SNPs for SCS, at the levels of 1% were observed (a summary of these SNPs is shown in Tables S1-S6, respectively). At the level of 5%, we observed 1429 SNPs for MY305, 798 SNPs for FY305, 1448 SNPs for PY305, 860 SNPs for %F, 714 SNPs for %P, and 811 SNPs for SCS. Wu et al. (2013) identified 8 SNPs in milking buffaloes that were significantly associated with milk yield, but none of these SNPs was associated with this trait in the present study.
Figure 1. Manhattan graph of the genomic association with milk yield by chromosome.

10261
©FUNPEC-RP www.funpecrp.com.brGenetics and Molecular Research 13 (4): 10256-10268 (2014)
GWAS for milk production traits in buffalo
Figure 3. Manhattan graph of the genomic association for fat yield by chromosome.
Figure 2. Manhattan graph of the genomic association for protein yield by chromosome.
Figure 4. Manhattan graph of the genomic association for protein percentage by buffaloes.
10262
©FUNPEC-RP www.funpecrp.com.brGenetics and Molecular Research 13 (4): 10256-10268 (2014)
G.C. Venturini et al.
Our results indicate that a large number of SNPs influences yield traits in buffaloes. Similarly, in dairy cattle, numerous SNPs are related to these traits, as established by Meredith et al. (2012) in Holstein-Friesian cows in Ireland. These authors identified 370, 370, and 385 SNPs that were significantly associated with milk, fat, and protein yield. In the present study, the BTA20 and BTA22 chromosomes, which are homologous to BBU19 and BBU21, respec-tively, were present in the greatest numbers of significant SNP markers (P < 0.01) for the 3 yield traits (MY305, PY305, and FY305). These 2 chromosomes each contain a total of 30, 30, and 31 SNPs related to milk, protein, and fat yield, respectively. Furthermore, the chromosomes with the lowest number of significant SNPs (P < 0.01) were BTA19 and BTA27, corresponding to BBU3p and BBU1p, respectively, each containing only 6, 6, and 7 SNPs related to milk, pro-
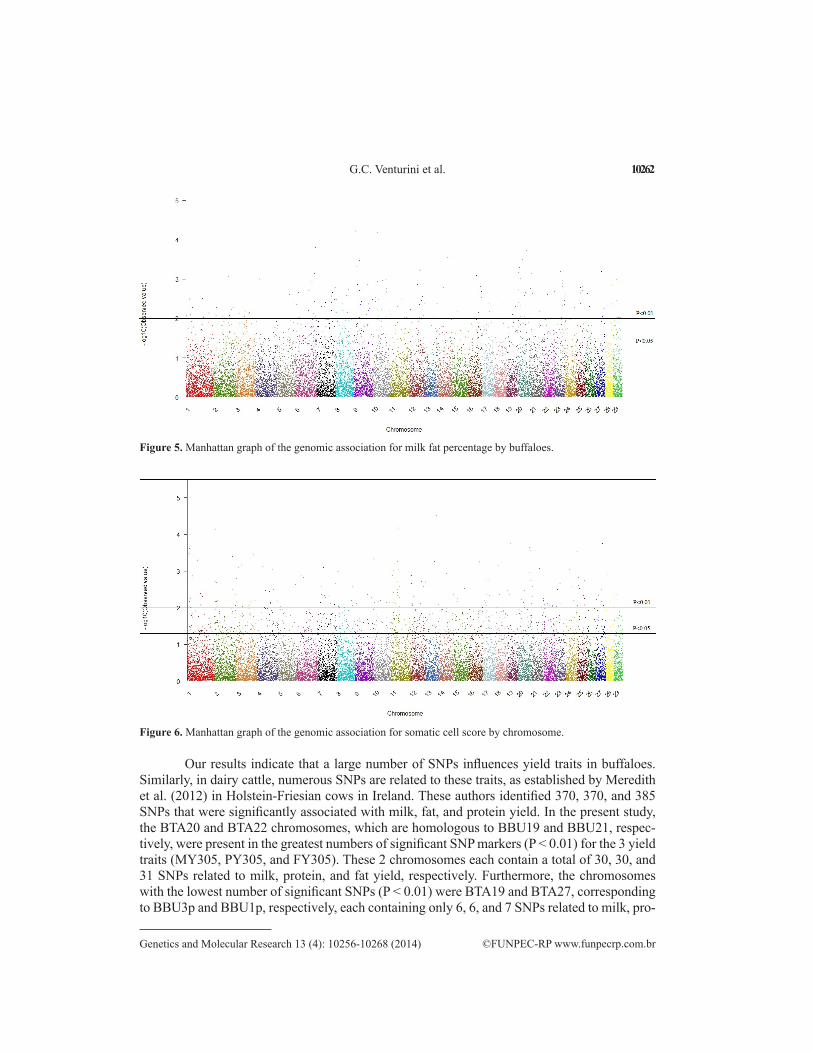
Figure 5. Manhattan graph of the genomic association for milk fat percentage by buffaloes.
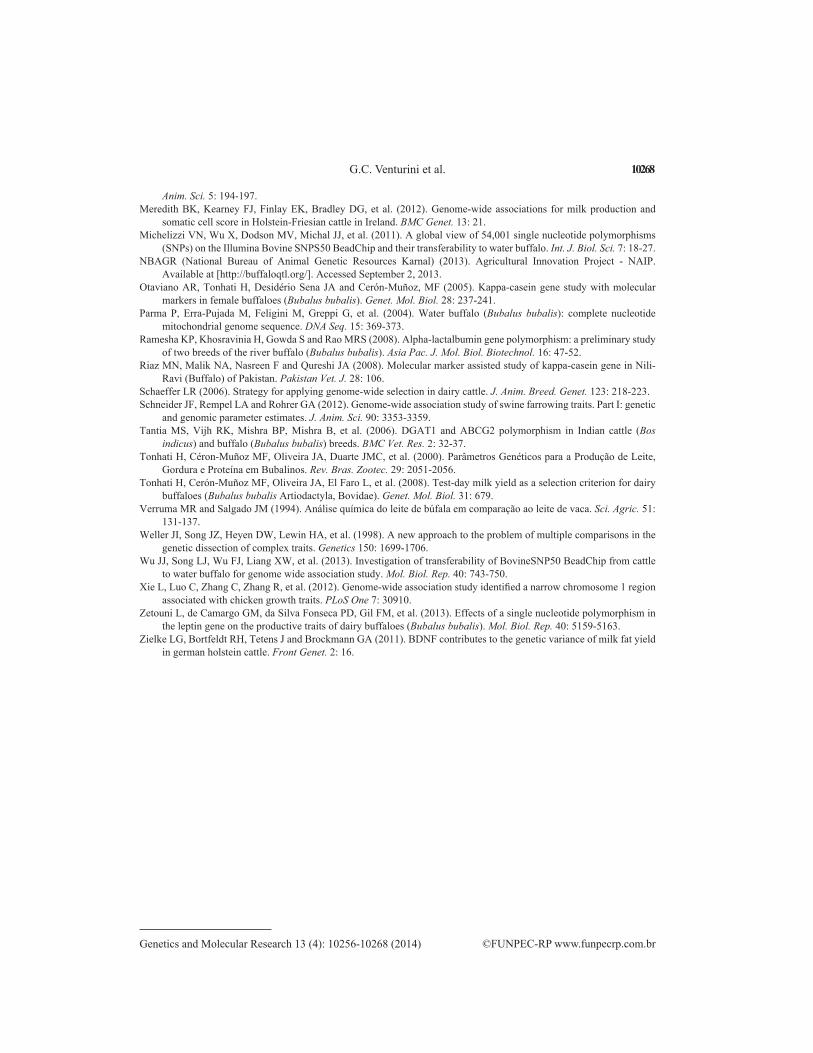
Figure 6. Manhattan graph of the genomic association for somatic cell score by chromosome.

10263
©FUNPEC-RP www.funpecrp.com.brGenetics and Molecular Research 13 (4): 10256-10268 (2014)
GWAS for milk production traits in buffalo
tein, and fat yield, respectively. In Danish Jersey dairy cows, Mai et al. (2010) detected a total of 98 SNPs significantly associated with milk yield on BTA27 using the BovineSNPS50 Bead-Chip. The small number of SNPs found on BTA27 in the present study indicates that although there is chromosomal similarity with cattle, the MY305 trait is influenced by different genomic regions in buffaloes, and that the SNPs may be fixed on BTA27 for buffaloes.
For %P and %F, the number of significant SNPs was also high but lower than that observed by Meredith et al. (2012) in dairy cattle, which was 229 and 216, respectively. The existence of SNPs significantly associated with these traits can be used in selective breeding of animals to produce high-quality milk, resulting in a better mozzarella cheese, which is the main product of buffalo milk. In this study, the chromosomes with the highest number of significant SNPs were BTA20 and BTA22, each containing 31 SNPs, and BTA19 and BTA27 with the lowest number, each containing 7 SNPs. Meredith et al. (2012) reported that most significant SNPs for milk traits, including %P and %F, were also found in BTA20. In dairy cattle, the BTA14 typically contains many SNPs that are strongly associated with milk traits, and are mainly close to the DGAT1 gene (Cole et al., 2011; Meredith et al., 2012), which has been suggested to be the primary gene affecting fat and milk yield (Grisart et al., 2002). In this study, BTA14 showed 21 significant SNPs associated with %F (P < 0.01); however, they were not the strongest associations for this trait. The number of significant SNPs on BTA14 for the other traits was even lower than for %F. This can be explained because the K232A, a poly-morphism considered to be a quantitative trait nucleotide in dairy cattle, does not segregate in buffaloes (Tantia et al., 2006).
For SCS, the largest number of significant SNPs at 1% was identified on BTA2 (14 SNPs) and BTA11 (16 SNPs), while the smallest number at that level was found on BTA26 and BTA29, each with only 1 significant SNP. However, at a significance level of 5%, the number of SNPs on BTA2 increased to 58. Cole et al. (2011) found a larger number of signifi-cant SNPs for SCS on BTA2 (11 SNPs), BTA7 (13 SNPs), and BTA16 (11 SNPs). Addition-ally, in a study by Meredith et al. (2012), of the 1529 SNPs analyzed, only 9 were significant for SCS. According to these authors, the small number of significant SNPs for this trait may be related to inherent problems of the phenotype, resulting in reduced association detection power. Table 2 presents a summary of the SNPs identified to have a significant association with 3 or 4 traits (Figure 7).
Figure 7. Relationship between SNPs and traits. Colored boxes contain the number of SNPs for each trait (MY = milk yield; PY = protein yield; FY = fat yield; PP = protein percentage; FP = fat percentage; SCS = somatic cell score). The white boxes show the number of SNPs significantly associated with more than 1 trait. The black, red, and green lines represent the number of SNPs significantly associated with 2, 3, and 4 characteristics, respectively.

10264
©FUNPEC-RP www.funpecrp.com.brGenetics and Molecular Research 13 (4): 10256-10268 (2014)
G.C. Venturini et al.
Table 2. Summary of SNPs identified to have a significant association with 3 or 4 traits.
Traita SNP BTA Positionb Nearest genes Allele
FY, MY, PY rs43437978 1 14379994 Between LOC100847925 and NCAM2 [A/C]FY, MY, PY rs137173232 1 15684151 Within LOC101904189 [C/T]FY, MY, PY rs136275783 1 16933095 Between TRNAC-GCA and TMPRSS15 [C/T]MY, PY, SCS rs109306874 1 109558181 Between LOC101901911 and MFSD1 [C/T]MY, PY, SCS rs135592668 1 127950541 Within TFDP2 [C/T]FY, MY, PY rs134022992 1 132143793 Between DZIP1L and CLDN18 [A/C]FY, MY, PY rs43275385 1 142588827 Between LOC101902044 and LOC101907727 [C/T]MY, PY, SCS rs110949265 2 90784615 Within CDK15 [A/G]FY, MY, PY rs136210465 2 92958299 Between ICOS and LOC101903301 [A/C]FY, MY, PY rs133293221 3 3889359 Between LMX1A and PBX1 [A/G]FY, MY, PY rs109027149 3 4131794 Between LMX1A and PBX1 [A/C]FY, MY, PY rs110963023 3 21874154 Between GJA8 and GJA5 [A/G]MY, PY, SCS rs109047719 3 54285171 Between GBP5 and LOC512486 [A/G]FY, MY, PY rs109200576 3 69554270 Within SLC44A5 [A/G]FY, MY, PY rs42422428 4 7959622 Within CDK14 [C/T]FY, MY, PY rs135096651 4 85983830 Within KCND2 [C/T]MY, PY, SCS rs109463863 4 99326320 Within LOC101902963 [A/G]FY, MY, PY rs110534108 4 105324609 Within TMEM178B [A/C]FY, MY, PY rs29010249 5 41521945 Within SLC2A13 [C/T]FY, MY, PY rs42393904 5 89568937 Within PDE3A [C/T]FY, MY, PY rs135470643 5 94463839 Within STRAP [C/T]FY, MY, PY rs109561595 5 103531563 Within PEX5 [C/T]FY, MY, PY rs133677804 6 38235112 Between SPP1 and MEPE [A/G]FY, MY, PY rs41654988 6 82416284 Between LOC101904978 and LOC100337226 [C/T]FY, MY, PY, SCS rs135755654 7 968325 Within LOC100848388 [A/C]MY, PY, SCS rs133745641 7 15064262 Within LOC787383 [A/G]MY, PY, SCS rs41656886 7 16277606 Within LOC101907575 [C/T]MY, PY, SCS rs134480433 7 31571872 Within CSNK1G3 [C/T]FY, MY, PY rs109197142 7 31763867 Within CEP120 [A/C]FP, MY, PY rs109293607 7 97364558 Within RHOBTB3 [A/G]FY, MY, PY rs134960541 8 24775262 Within SLC24A2 [A/G]FY, MY, PY rs133985548 8 34550426 Between LOC101904752 and LOC101904882 [A/G]FY, MY, PP rs132925552 8 35287943 Within LOC101904827 [A/G]FY, MY, PY rs43548927 8 45549903 Between FXN and TJP2 [C/T]FY, MY, PY rs110049283 8 48482796 Within C8H9orf85 [C/T]FY, MY, PY rs135898479 8 52262391 Within PCSK5 [A/G]FY, MY, PY, SCS rs42672728 8 89277018 Between LOC100336643 and LOC101903044 [A/G]FY, MY, PY rs134484124 9 8146802 Within BAI3 [A/G]FY, MY, PY rs135173753 9 13308743 Within SLC17A5 [C/T]FY, MY, PY rs137577358 9 96732066 Between EZR and RSPH3 [C/T]FP, MY, PY rs110550868 10 17788258 Within LRRC49 [C/T]FY, MY, PY rs135730708 10 36212636 Between CHST14 and C10H15orf57 [C/T]FY, MY, PY rs41663009 11 9385008 Between LOC101903987 and TACR1 [A/T]FY, MY, PY rs135750699 11 49066004 Between LOC100300483 and LOC616323 [A/G]FY, MY, PY rs109684958 11 77961760 Within APOB [A/G]FY, MY, PY rs109092556 11 92749440 Within TTLL11 [A/G]FY, MY, PY rs136655257 11 92950202 Within TTLL11 [C/T]FY, MY, PY rs134257720 12 5022925 Between LOC101903521 and PCDH17 [A/G]FY, MY, PY rs133054567 12 8598728 Between LOC101903582 and LOC101905933 [A/G]FY, MY, PY rs110003033 12 18740085 Between LOC101903925 and FNDC3A [G/T]FY, MY, PY rs135093454 12 24111232 Within TRPC4 [A/G]FY, MY, PY rs132873062 12 29860141 Between HSPH1 and LOC101906564 [A/G]FY, MY, PY rs43698055 12 49798434 Between LOC101906107 and LOC101907044 [C/T]FY, MY, PY rs110817008 12 50461875 Between LOC101907044 and TBC1D4 [A/G]FY, MY, PY rs110033298 12 51303337 Between LMO7 and LOC101902043 [C/T]FY, MY, PY rs110923461 12 54045655 Between EDNRB and POU4F1 [C/T]FY, MY, PY rs42476166 12 58629822 Between LOC782305 and TRNAC-GCA [C/T]FY, MY, PY rs43136089 12 72300227 Within LOC100337069 [C/T]MY, PY, SCS rs135974209 12 72691813 Between LOC530803 and LOC100337108 [C/T]FP, MY, PY rs110822690 12 79608691 Within SLC15A1 [G/T]FY, MY, PY rs135894770 12 83309527 Between LOC101907090 and LOC100336939 [C/T]FY, MY, PY rs134555254 12 85587789 Within LOC101907090 [C/T]
Continued on next page

10265
©FUNPEC-RP www.funpecrp.com.brGenetics and Molecular Research 13 (4): 10256-10268 (2014)
GWAS for milk production traits in buffalo
Table 2. Continued.
Traita SNP BTA Positionb Nearest genes Allele
FY, MY, PY rs109459785 12 88068269 Within MYO16 [A/G]FY, MY, PY rs136087625 13 24316133 Within ARMC3 [C/T]FY, MY, PY rs133498713 13 55950796 Within CDH4 [C/T]FY, MY, PY, SCS rs41708939 13 72473830 Between PTPRT and LOC101901917 [A/G]FY, MY, PY rs132705079 13 76579547 Within ZMYND8 [C/T]FY, MY, PY rs110438672 14 16312069 Between LOC783462 and TRIB1 [A/T]FY, MY, PY rs134901382 14 49491234 Between SLC30A8 and AARD [A/G]FY, MY, PY rs133584285 14 72330522 Between RAD54B and GEM [C/T]FY, MY, PY rs379091691 15 23570442 Between LOC100847772 and NCAM1 [A/G]FY, MY, PY rs134634450 15 34083678 Within C15H11orf63 [C/T]FY, MY, PY rs134110499 15 45616874 Within OVCH2 [A/G]FY, MY, PY rs136632034 15 45677285 Between PPFIBP2 and LOC531779 [G/T]FY, MY, PY rs133144332 15 51504336 Within LOC785574 [C/T]FY, MY, PY rs133619699 15 54696961 Within POLD3 [C/T]FY, MY, PY rs110179700 16 20588611 Between USH2A and ESRRG [C/T]FY, MY, PY rs41802238 16 38379570 Within KIFAP3 [G/T]FY, MY, PY rs136000595 16 46646103 Within LOC100848595 [A/G]FY, MY, PY rs137070918 16 53817802 Within KAZN [C/T]FY, MY, PY rs110894442 16 53926177 Within KAZN [C/T]FY, MY, PY rs109639913 16 64227592 Within CACNA1E [A/G]FY, MY, PY rs136919579 16 67868936 Between IVNS1ABP and LOC101904548 [C/T]FY, MY, PY rs41627700 16 76279318 Between LOC101908007 and TRNAW-CCA [C/T]FY, MY, PY rs42309699 17 8588106 Between LOC101903379 and TRNAC-GCA [C/T]FY, MY, PY rs136445948 17 40785548 Between LOC101904594 and RPS27 [A/G]FY, MY, PY rs109209365 17 59953742 Between KSR2 and NOS1 [C/T]FY, MY, PY rs41641162 17 60289891 Within TESC [A/G]FY, MY, PY rs133576641 17 60317109 Within TESC [A/G]FY, MY, PY rs136580174 17 60456518 Within RNFT2 [C/T]FY, MY, PY rs109585346 18 23943227 Between LPCAT2 and TRNAF-GAA [C/T]FY, MY, PY, SCS rs110964263 18 30202732 Between LOC785976 and LOC101903335 [C/T]FY, MY, PY rs135416534 19 26346342 Between WSCD1 and NLRP1 [G/T]FY, MY, PY rs109015477 20 5689843 Within HMP19 [C/T]FY, MY, PY rs42552377 20 38949062 Between LOC101907576 and PRLR [A/G]FP, MY, PY rs42375254 20 53124993 Between LOC781924 and CDH18 [A/G]FY, MY, PY rs137509412 20 54634401 Between LOC781394 and LOC781508 [C/T]FY, MY, PY rs137406593 20 55031281 Between LOC101905305 and LOC784462 [A/G]FY, MY, PY rs41955304 20 61899885 Within CTNND2 [C/T]FY, MY, PY rs135487373 20 69925848 Between LOC100847985 and LOC101907411 [A/G]MY, PY, SCS rs132911517 21 9246456 Between LOC101907768 and LOC782362 [A/G]FY, MY, PY rs110880724 21 17434061 Within LOC100300175 [C/T]FY, MY, PY rs109929238 21 63986548 Between LOC101905545 and LOC100847341 [C/T]FY, MY, PY rs41996463 22 5080479 Between MIR1814B and LOC100140865 [A/G]FY, MY, PY rs137067188 22 35502731 Within MAGI1 [C/T]FY, MY, PY rs110705879 22 40180970 Within LOC100847295 [A/G]FY, MY, PY rs110136061 22 40183216 Within LOC100847295 [A/G]FY, MY, PY rs42228969 22 41907855 Within FHIT [A/G]FY, MY, PY rs132798979 22 42047912 Within FHIT [A/C]FY, MY, PY rs132790503 22 42141919 Between FHIT and LOC101906556 [C/T]FY, MY, PY rs110278307 22 44742047 Within ARHGEF3 [A/G]FY, MY, PY rs133168024 22 47390650 Between LOC101903208 and LOC782954 [A/G]FY, MY, PY rs108970230 22 48858472 Within NT5DC2 [A/C]FY, MY, PY rs109560518 22 61258859 Between ALDH1L1 and LOC101905897 [A/G]FY, MY, PY rs136791625 23 22085517 Between C23H6orf141 and RHAG [A/G]FY, MY, PY rs137558731 24 16494539 Between LOC783699 and TRNAK-UUU [C/T]FY, MY, PY rs135034948 24 16964732 Between LOC783699 and TRNAK-UUU [A/G]FY, MY, PY rs132888279 24 27728348 Between TRNAS-GGA and LOC101904604 [A/G]FY, MY, PY rs137211587 24 38507920 Within DLGAP1 [C/T]FY, MY, PY rs135377476 24 40275084 Within ARHGAP28 [A/G]FY, MY, PY rs137773433 24 45523260 Between LOC101903366 and SLC14A2 [A/G]FY, MY, PY rs136056070 24 53900956 Between LOC101905900 and LOC101905958 [C/T]FY, MY, PY rs135142529 26 5851757 Between LOC613570 and MBL2 [A/C]
Continued on next page

10266
©FUNPEC-RP www.funpecrp.com.brGenetics and Molecular Research 13 (4): 10256-10268 (2014)
G.C. Venturini et al.
A total of 118 SNPs were related to the 3 yield traits (MY305, FY305, PY305) at 1% significance. Ten SNPs were related to MY305, FY305, PY305, and SCS at 1% significance. Four SNPs were related to %F, MY305, and PY305, of which rs109293607, rs110550868, and rs110822690 were located on the RHOBTB3, LRRC49, and SLC15A1 genes, respectively, and rs42375254 was between the LOC781924 and CDH18 genes. One SNP (rs132925552) was related to %P and MY305 and FY305, located on an uncharacterized gene named LOC101904827.
A total of 4 SNPs (rs135755654, rs42672728, rs41708939, and rs110964263) were identified to have a significant effect on 4 of the traits simultaneously (yield traits and SCS).
After applying Bonferroni multiple-comparison correction (P < 3.16 x 10⁻⁶), only the milk yield trait had 2 significant SNPs, located on BTA15 and BTA20, which are homologous to BBU16 and BBU19, respectively. No SNPs were significantly associated with other traits after this correction. The significant SNPs for milk yield after Bonferroni’s correction were rs133144332 on BTA15 and rs137406593 on BTA20. These SNPs may affect the productive traits. This correction aims to reduce problems of multiple tests and false-positives. For SNP positions in the bovine genome, rs133144332 was located within a pseudo gene (LOC785574) and 12 kb upstream of the OR52B4 (olfactory receptor, family 52, subfamily B, member 4) transcription start site. The OR52B4 gene may influence feed intake and milk production in this herd. It may also be linked to major histocompatibility complex genes in the immune system. The animals choose their sexual partners according to the alleles from major histocompatibility complex genes. A larger number of differences is preferred as it guarantees genetic variability in the offspring to face infection diseases. The perception of the major histocompatibility com-plex alleles is captured by the olfactory system. The intensive use of artificial insemination may indicate the importance of this gene. BTA15 was suggested to have an SNP stringer associated with milk and fat yield by Zielke et al. (2011). The SNPs described by these authors were close to the brain-derived neurotrophic factor gene and 8 Mb away from rs133144332.
In this study, the BTA20 contained the largest number of significant SNPs (P < 0.01) and the most significant SNPs for milk yield. Chromosome 20 contains the growth hormone receptor gene, which influences lactation, but rs137406593 is located quite far from the growth hormone receptor gene, suggesting the participation of other genes in the same chromosome on this trait. rs1377406593 is located between 2 genes with unknown function, LOC784462 (aurora kinase B-like) and LOC101905305 (uncharacterized).
According with Kim et al. (2011), Bonferroni’s correction is conservative and presents
Traita SNP BTA Positionb Nearest genes Allele
FY, MY, PY rs135475459 26 38712148 Between LOC101902040 and FAM204A [C/T]FY, MY, PY rs109720878 26 40086416 Within LOC101905098 [C/T]FY, MY, PY rs133129209 26 45761602 Within FANK1 [A/G]FY, MY, PY rs42377290 26 48853131 Between LOC101903468 and LOC101903522 [A/G]FY, MY, PY rs109870686 27 12509477 Within ODZ3 [C/T]FY, MY, PY rs110793767 27 13487815 Between LOC101903882 and LOC101907167 [A/G]FY, MY, PY rs133005688 27 29035235 Between DUSP26 and LOC101903926 [C/T]FY, MY, PY rs42136038 28 15018920 Within FAM13C [A/G]FY, MY, PY rs134416594 28 38625846 Between NRG3 and LOC101901969 [A/G]FY, MY, PY rs109806568 29 35423224 Within NTM [G/T]
Table 2. Continued.
aMY = milk yield; PY = protein yield; FY = fat yield; PP = protein percentage; FP = fat percentage; SCS = somatic cell score. bThe position was assigned according to the Bos taurus UMD 3.1 assembly in base pairs.

10267
©FUNPEC-RP www.funpecrp.com.brGenetics and Molecular Research 13 (4): 10256-10268 (2014)
GWAS for milk production traits in buffalo
a high level of restriction, limiting the identification of markers associated with productive traits.In many situations with multiple tests, the FDR with more appropriate correction cri-
terion could be least conservative (Weller et al., 1998). In this study, the FDR values found for the MY305, PY305, FY305, %P, %F, and SCS traits were: 35% (452), 35% (449), 82% (192), 111% (142), 98% (161), and 95% (166), respectively (P < 0.01).
CONCLUSIONS
In the present study, a total of 1562 SNP markers were found to affect the production and/or quality of milk. These results show the transferability of the 770k chip for studying buffalo. Additionally, the use of high-density bovine chips is useful for genomic studies of buffaloes, after which functional SNP markers in buffaloes can be found that affect productive traits. Although an extensive genome homology was described between cattle and buffalo, the exact chromosomal position of SNP markers associated with these economic important traits in buffalo could be determined using buffalo genome sequencing. Therefore, additional stud-ies are necessary to clarify the role of these SNPs in buffalo.
Supplementary material
REFERENCES
Ahamad S, Gaucher I, Rousseau F, Beaucher E, et al. (2008). Effects of acidification on physic-chemical characteristics of buffalo milk: A comparison with cow’s milk. Food Chem. 106: 11-17.
Amaral ME, Grant JR, Riggs PK, Stafuzza NB, et al. (2008). A first generation whole genome RH map of the river buffalo with comparison to domestic cattle. BMC Genomics 9: 631.
Benjamini Y and Hochberg Y (1995). Controlling the false discovery rate: A pratical and powerful approach to multiple testing. J. R. Statist. Soc. 57: 289-300.
Cole JB, Wiggans GR, Ma L, Sonstegard TS, et al. (2011). Genome-wide association analysis of thirty-one production, health, reproduction and body conformation traits in contemporary U.S. Holstein cows. BMC Genomics 12: 408-424.
Cribiu EP, Di Bernardino D, Di Meo GP, Eggen A, et al. (2001). International system for chromosome nomenclature of domestic bovids (ISCNDB 2000). Cytogenet. Cell Genet. 92: 283-299.
Dabdoub A and Shook G (1984). Phenotypic relationships among milk yield, somatic cell count, and clinical mastitis. J. Dairy Sci. 67 (Suppl 1): 163-164.
Di Meo GP, Perucatti A, Floriot S, Hayes H, et al. (2008). An extended river buffalo (Bubalus bubalis, 2n = 50) cytogenetic map: assignment of 68 autosomal loci by FISH-mapping and R-banding and comparison with human chromosomes. Chromosome Res. 16: 827-837.
Feligini M, Bonizzi I, Buffoni JN, Cosenza G, et al. (2009). Identification and quantification of alphaS1, alphaS2, beta, and kappa-caseins in water buffalo milk by reverse phase-high performance liquid chromatography and mass spectrometry. J. Agric. Food Chem. 57: 2988-2992.
Gil FM, de Camargo GM, Pablos de Souza FR, Cardoso DF, et al. (2013). Polymorphisms in the ghrelin gene and their associations with milk yield and quality in water buffaloes. J. Dairy Sci. 96: 3326-3331.
Grisart B, Coppieters W, Farnir F, Karim L, et al. (2002). Positional candidate cloning of a QTL in dairy cattle: identification of a missense mutation in the bovine DGAT1 gene with major effect on milk yield and composition. Genome Res. 12: 222-231.
Illumina (2010). BovineHD Genotyping BeadChip. Available at [http://www.illumina.com/Documents/%5Cproducts%5Cdatasheets%5Cdatasheet_bovineHD.pdf]. Accessed October 15, 2013.
Kim Y, Ryu J, Woo J, Kim JB, et al. (2011). Genome-wide association study reveals five nucleotide sequence variants for carcass traits in beef cattle. Anim. Genet. 42: 361-365.
Mai MD, Sahana G, Christiansen FB and Guldbrandtsen B (2010). A genome-wide association study for milk production traits in Danish Jersey cattle using a 50K single nucleotide polymorphism chip. J. Anim. Sci. 88: 3522-3528.
Meignanalakshmi S and Nainar AM (2009). PCR-RFLP analysis of beta-lactoglobulin gene in Murrah buffaloes. J. Vet.
10268
©FUNPEC-RP www.funpecrp.com.brGenetics and Molecular Research 13 (4): 10256-10268 (2014)
G.C. Venturini et al.
Anim. Sci. 5: 194-197.Meredith BK, Kearney FJ, Finlay EK, Bradley DG, et al. (2012). Genome-wide associations for milk production and
somatic cell score in Holstein-Friesian cattle in Ireland. BMC Genet. 13: 21.Michelizzi VN, Wu X, Dodson MV, Michal JJ, et al. (2011). A global view of 54,001 single nucleotide polymorphisms
(SNPs) on the Illumina Bovine SNPS50 BeadChip and their transferability to water buffalo. Int. J. Biol. Sci. 7: 18-27.NBAGR (National Bureau of Animal Genetic Resources Karnal) (2013). Agricultural Innovation Project - NAIP.
Available at [http://buffaloqtl.org/]. Accessed September 2, 2013.Otaviano AR, Tonhati H, Desidério Sena JA and Cerón-Muñoz, MF (2005). Kappa-casein gene study with molecular
markers in female buffaloes (Bubalus bubalis). Genet. Mol. Biol. 28: 237-241.Parma P, Erra-Pujada M, Feligini M, Greppi G, et al. (2004). Water buffalo (Bubalus bubalis): complete nucleotide
mitochondrial genome sequence. DNA Seq. 15: 369-373.Ramesha KP, Khosravinia H, Gowda S and Rao MRS (2008). Alpha-lactalbumin gene polymorphism: a preliminary study
of two breeds of the river buffalo (Bubalus bubalis). Asia Pac. J. Mol. Biol. Biotechnol. 16: 47-52.Riaz MN, Malik NA, Nasreen F and Qureshi JA (2008). Molecular marker assisted study of kappa-casein gene in Nili-
Ravi (Buffalo) of Pakistan. Pakistan Vet. J. 28: 106.Schaeffer LR (2006). Strategy for applying genome-wide selection in dairy cattle. J. Anim. Breed. Genet. 123: 218-223.Schneider JF, Rempel LA and Rohrer GA (2012). Genome-wide association study of swine farrowing traits. Part I: genetic
and genomic parameter estimates. J. Anim. Sci. 90: 3353-3359.Tantia MS, Vijh RK, Mishra BP, Mishra B, et al. (2006). DGAT1 and ABCG2 polymorphism in Indian cattle (Bos
indicus) and buffalo (Bubalus bubalis) breeds. BMC Vet. Res. 2: 32-37.Tonhati H, Céron-Muñoz MF, Oliveira JA, Duarte JMC, et al. (2000). Parâmetros Genéticos para a Produção de Leite,
Gordura e Proteína em Bubalinos. Rev. Bras. Zootec. 29: 2051-2056.Tonhati H, Cerón-Muñoz MF, Oliveira JA, El Faro L, et al. (2008). Test-day milk yield as a selection criterion for dairy
buffaloes (Bubalus bubalis Artiodactyla, Bovidae). Genet. Mol. Biol. 31: 679.Verruma MR and Salgado JM (1994). Análise química do leite de búfala em comparação ao leite de vaca. Sci. Agric. 51:
131-137.Weller JI, Song JZ, Heyen DW, Lewin HA, et al. (1998). A new approach to the problem of multiple comparisons in the
genetic dissection of complex traits. Genetics 150: 1699-1706.Wu JJ, Song LJ, Wu FJ, Liang XW, et al. (2013). Investigation of transferability of BovineSNP50 BeadChip from cattle
to water buffalo for genome wide association study. Mol. Biol. Rep. 40: 743-750.Xie L, Luo C, Zhang C, Zhang R, et al. (2012). Genome-wide association study identified a narrow chromosome 1 region
associated with chicken growth traits. PLoS One 7: 30910.Zetouni L, de Camargo GM, da Silva Fonseca PD, Gil FM, et al. (2013). Effects of a single nucleotide polymorphism in
the leptin gene on the productive traits of dairy buffaloes (Bubalus bubalis). Mol. Biol. Rep. 40: 5159-5163.Zielke LG, Bortfeldt RH, Tetens J and Brockmann GA (2011). BDNF contributes to the genetic variance of milk fat yield
in german holstein cattle. Front Genet. 2: 16.