identification of single nucleotide polymorphisms in the ... · pdf fileidentification of...
TRANSCRIPT

©FUNPEC-RP www.funpecrp.com.brGenetics and Molecular Research 14 (3): 11377-11388 (2015)
Identification of single nucleotide polymorphisms in the ASB15 gene and their associations with chicken growth and carcass traits
Y.C. Wang1,2, R.R. Jiang2, X.T. Kang2,3, Z.J. Li2, R.L. Han2, J. Geng2, J.X. Fu2, J.F. Wang1 and J.P. Wu1
1College of Animal Science and Technology, Gansu Agricultural University, Lanzhou, China2College of Animal Husbandry and Veterinary Engineering, Henan Agricultural University, Zhengzhou, China3Henan Research Center of Breeding Resources for Poultry, Zhengzhou, China
Corresponding author: J.P. WuE-mail: [email protected]
Genet. Mol. Res. 14 (3): 11377-11388 (2015)Received February 17, 2015Accepted May 4, 2015Published September 25, 2015DOI http://dx.doi.org/10.4238/2015.September.25.5
ABSTRACT. ASB15 is a member of the ankyrin repeat and suppressor of cytokine signaling box family, and is predominantly expressed in skeletal muscle. In the present study, an F2 resource population of Gushi chickens crossed with Anka broilers was used to investigate the genetic effects of the chicken ASB15 gene. Two single nucleotide polymorphisms (SNPs) (rs315759231 A>G and rs312619270 T>C) were identified in exon 7 of the ASB15 gene using forced polymerase

11378Y.C. Wang et al.
©FUNPEC-RP www.funpecrp.com.brGenetics and Molecular Research 14 (3): 11377-11388 (2015)
chain reaction-restriction fragment length polymorphism and DNA sequencing. One was a missense SNP (rs315759231 A>G) and the other was a synonymous SNP (rs312619270 T>C). The rs315759231 A>G polymorphism was significantly associated with body weight at birth, 12-week body slanting length, semi-evisceration weight, evisceration weight, leg muscle weight, and carcass weight (P < 0.05). The rs312619270 T>C polymorphism was significantly associated with body weight at birth, 4, 8, and 12-week body weight, 8-week shank length, 12-week breast bone length, 8 and 12-week body slanting length, breast muscle weight, and carcass weight (P < 0.05). Our results suggest that the ASB15 gene profoundly affects chicken growth and carcass traits.
Key words: Chicken; ASB15 gene; Single nucleotide polymorphism; Growth and carcass traits
INTRODUCTION
The ankyrin repeat and suppressor of cytokine signaling (SOCS) box (ASB) family of proteins function as a substrate recognition subunit in a subset of Elongin-Cullin-SOCS (ECS) E3 ubiquitin ligases (Andresen et al., 2014). The different SOCS box-containing proteins have variable N-terminal sequences that encode for domains that mediate protein-protein interac-tions and determine substrate recognition by ECS ligases (Kamura et al., 2004). Depending on the nature of such domains, ECSs can be divided into subfamilies, such as the SOCS, which exhibit an SH2 domain, and the larger ASB, which have 18 members that display ankyrin repeats at their N termini (Kile et al., 2001). ASB family members function in multiple biologi-cal processes related to cell growth (Guibal et al., 2002), tissue development (Kohroki et al., 2001; Guibal et al., 2002), and insulin signaling (Wilcox et al., 2004).
ASB15 is a member of the ASB gene family, and is predominantly expressed in skeletal muscle (Hilton et al., 1998; Kile et al., 2000; McDaneld and Spurlock, 2008). ASB15 is rapidly downregulated in response to β-adrenergic receptor agonists (McDaneld et al., 2004; Spurlock et al., 2006). In C2C12 myoblasts, ASB15 causes delayed differentiation and altered protein synthesis, and local overexpression of ASB15 in skeletal muscle in vivo stimulates a significant increase in muscle fiber diameter (McDaneld et al., 2006). ASB15 plays a role in early myoblast differentiation, and its effects may be mediated in part by the PI3K/Akt signal transduction pathway. As an ASB family member, ASB15 should function in skeletal muscle growth (Mc-Daneld et al., 2006); however, no evidence of such a role has been found in chickens.
An important goal in the production of meat animals is to increase muscle growth. Therefore, the purpose of this study (based on the roles of the ASB family as described above) was to examine whether associations exist between single nucleotide polymorphisms (SNPs) in the ASB15 gene and growth and carcass traits in chickens, in order to identify a possible candidate gene that affects meat production in chickens.
11379SNP analysis affecting growth and carcass on chicken ASB15
©FUNPEC-RP www.funpecrp.com.brGenetics and Molecular Research 14 (3): 11377-11388 (2015)
MATERIAL AND METHODS
Resource population
An F2 resource population as previously described (Han et al., 2010) was used in this study. Gushi (G) chickens (24 hens and two roosters), which is a slow-growing Chinese breed, and Anka (A) broilers (12 hens and four roosters), which is a fast-growing broiler, were hy-bridized. The F2 population consisted of four crossed families (A-roosters mated with G-hens) and three reciprocal families (G-roosters mated with A-hens). To build the F2 population, nine F1 females were selected from each of seven families (six unrelated rooster families and one half-sib). In total, 63 F1 females were mated with seven F1 males from seven families. The resource population was established over two hatches that occurred at two-week intervals, and included 42 grandparents, 70 F1 parents, and 836 F2 chickens. All of the chickens were reared under the same conditions, with free access to food and water.
Phenotypic measurements
The growth traits analyzed were body weight (BW) and body size indices, including shank length (SL), breastbone length (BBL), and body slanting length (BSL). BW was record-ed every 2 weeks, from birth to slaughter. SL, BBL, and BSL were measured every 4 weeks.
In total, 836 F2 chickens were slaughtered at the age of 84 days. The carcass traits measured were semi-eviscerated weight (SEW), eviscerated weight (EW), breast muscle weight (BMW), leg muscle weight (LMW), and carcass weight (CW). Blood samples were collected and separated by centrifugation at 3000 g for 15 min at 4°C. Serum samples were frozen at -80°C until use.
DNA samples and DNA pool for sequencing
Genomic DNA samples were extracted from the serum using the phenol-chloroform method. The same number of DNA samples from 100 F2 individuals was pooled and diluted to a working concentration of 50 ng/μL. The pooled DNA was then sent to Taihe Gene Biotech-nology Co. Ltd (Beijing) for sequencing, using eight pairs of primers designed according to the ASB15 gene sequence (Table 1).
Forced polymerase chain reaction-restriction fragment length polymorphism (PCR-RFLP)
In order to amplify 172-bp and 182-bp fragments in exon 7, which contained an rs315759231 A>G mutation and an rs312619270 T>C mutation, two primer pairs were designed according to the sequencing results, and a previously reported gene sequence of the chicken ASB15 gene (NC_006088). Primer P1 (F1, 5'-GGCTATCTTGGATGATCACATTTCGA-3'; R1, 5'-GTTACCACCTCTCACTGCCAC-3') was designed to amplify the 172-bp fragment that contained rs315759231 A>G. Primer P2 (F2, 5'-GCTGAATCATGGATATAATGTGCAG-3'; R2, 5'-GGCTAACGGAAAGAAGAAAG-3') was designed to amplify the 182-bp fragment that contained rs312619270 T>C. To create AsuII (TT/CGAA) and PvuII (CAG/CTG)

11380Y.C. Wang et al.
©FUNPEC-RP www.funpecrp.com.brGenetics and Molecular Research 14 (3): 11377-11388 (2015)
restriction sites for genotyping, a point mismatch was introduced into the forward primers of P1 and P2, respectively.
Following optimization, PCRs were performed in a total volume of 25 μL using 50 ng DNA, primers (1 μM each), and 12 μL Taq Master Mix (CWBIO, Beijing, China). The PCR profile was as follows: 5 min at 94°C (denaturation), 32 cycles at 94°C for 30 s, 60°C (P1) or 58°C (P2) for 30 s, and 72°C for 30 s, with a final extension at 72°C for 10 min.
The PCR products were digested by restriction enzymes (AsuII for rs315759231 A>G and PvuII for rs312619270 T>C) overnight at 37°C. The digested products were separated by electrophoresis on 2.0% agarose gel that was stained with ethidium bromide. Different geno-types of these two SNPs were confirmed by sequencing.
Statistical analysis
All of the data were analyzed using the SPSS 22.0 software. A linear mixed model procedure was used to analyze the relationship between the two SNPs and the related eco-nomic traits of the F2 resource population. Both additive and dominance effects were also estimated for the traits identified as having significant SNP associations using the REG proce-dure, where the additive effect was estimated as 1, 0, and -1 for AA (CC), AG (TC), and GG (TT), respectively, and the dominance effect was estimated as 1 and -1 for the homozygote and heterozygote, respectively. The statistical model used was as follows:
Yijklm = μ + Gi + Sj + Hk + fl + e
where Yijklm represents the measurement of a trait, μ is the overall population mean, Gi is the fixed effect of genotype (i = 3), Sj is the fixed effect of sex (j = 2), Hk is the fixed effect of hatch (k = 2), fl is the random effect of family (l = 7), and eijklm is the random error. The least squares method was used to investigate the effects of genotypes of ASB15 polymorphisms on the target traits. Significance was set at P < 0.05, and Bonferroni tests were conducted in order to control for multiple comparisons.
Population genetic indices, including heterozygosity (HE), effective number of alleles (NE), and the polymorphism information content (PIC) were calculated according to Nei’s methods (Nei and Roychoudhury, 1974) in PopGene (version 1.3.1) (Yeh et al., 1999).
Tests for linkage disequilibrium (LD) were performed using the SHEsis software plat-form (http://analysis.bio-x.cn/SHEsisMain.htm). Dꞌ and r2 are the most commonly used mea-sures of LD; r2 > 0.33 is indicative of strong linkage disequilibrium (Ardlie et al., 2002). If r2 > 0.33, haplotypes were constructed on the basis of the two SNPs in all of the experimental animals, using the SHEsis program.
RESULTS
SNP identification and genotyping
The chicken ASB15 gene is composed of nine exons, which code for a protein with 588 amino acids. Firstly, we cloned and sequenced a 9389-bp fragment, which included the entire coding region and the intron sequences of the ASB15 gene. Eight pairs of prim-
(Equation 1)

11381SNP analysis affecting growth and carcass on chicken ASB15
©FUNPEC-RP www.funpecrp.com.brGenetics and Molecular Research 14 (3): 11377-11388 (2015)
ers were then designed to detect SNPs by DNA pool sequencing in the nine exons and introns (Table 1). Six SNPs in the introns and two SNPs in the seventh exon were identi-fied (Figure 1). Finally, we selected the two SNPs in the seventh exon for the next step. The SNPs rs315759231 A>G and rs312619270 T>C were confirmed using the forced PCR-RFLP method. The former was a missense mutation from Asn to Ser, and the latter was a synonymous mutation.
Position Name Primer (5'-3') Size (bp) Tm (°C) Notes
1-484 E1 F: ATGACGGATGAAAGCGAAG 484 58.0 Exon1, intron1 R: TGAGTGATGCCAGGGAGGT1432-2452 E2-3 F: ACTTTTGTTGTGGGGGCTG 1021 62.0 Exon2-3, intron2-3 R: GTAGTGAGGTGGGGGTCGG 2194-3472 E4 F: ACTCAGTCCAACCATTCACCC 1279 60.0 Exon4, intron4 R: TCCCAAAGAAATCATCCAAAA 4793-5622 E5 F: TGTTTTTATTGTTGCTTTTCC 829 57.5 Exon5, intron5 R: TATGTAGGTCCCTCCTTGATT 5544-6504 E6 F: TTCCTACACTTCCATAATCCA 961 59.0 Intron5, exon6, intron6 R: AAGAAAATGACCATCACACAG 6428-7167 E7 F: GGTGCTTCTGTGTTAGGATTTT 740 56.0 Exon7 R: GGCTAACGGAAAGAAGAAAGTG 7475-8010 E8 F: TCAAACCTGTCAAGAGGAAT 536 57 Exon8, intron8 R: CAGTGGCAACAGGTAAAGA 8680-9389 E9 F: TTAGTGTTAGTGTCATGGGC 709 56.0 Exon9, intron8 R: CTATTCTAAATGTATCTCTTTTCCA
Table 1. Primer pair sequences and characteristics of the chicken ASB15 gene.
Figure 1. Single nucleotide polymorphism positions in the chicken ASB15 gene.
Three genotypes were detected from each of the two SNPs. The 172-bp PCR prod-ucts that were digested into two fragments (146 and 26 bp) were marked AA, undigested (172 bp) fragments were marked GG, and those that were digested into three fragments (172, 146, and 26 bp) were marked AG (Figure 2). The 182-bp PCR products were marked CC (157 and 25 bp), TT (182 bp), and CT (182, 157, and 25 bp) (Figure 3). Although the 26-bp and 25-bp fragments were too short to be visible on 2.0% agarose gel stained with ethidium bromide, three genotypes were confirmed by sequencing the corresponding PCR products (Figures 4 and 5). For the rs315759231 A>G site, the frequencies of alleles A and G were 0.491 and 0.509, respectively. The genotype frequencies of AA, AG, and GG were 0.221, 0.576, and 0.203, respectively (Table 2). The frequencies of alleles A and G were almost same, and the AA genotype frequency was approximately the same as the GG geno-type frequency. For rs312619270 T >C, the allele frequencies of T and C were 0.747 and 0.253, respectively, and the genotype frequencies of TT, TC, and CC were 0.581, 0.332, and 0.087, respectively. Allele T was dominant in the F2 population, and the TT genotype was more frequent than the other genotypes.

11382Y.C. Wang et al.
©FUNPEC-RP www.funpecrp.com.brGenetics and Molecular Research 14 (3): 11377-11388 (2015)
Figure 2. Agarose gel electrophoresis (2.0%) showing AsuII-restriction fragment length polymorphism fragments of the ASB15 gene polymerase chain reaction amplification products.
Figure 3. Agarose gel electrophoresis (2.0%) showing the PvuII-restriction fragment length polymorphism fragments of the ASB15 gene polymerase chain reaction amplification products.
Locus Genotypic and allelic frequencies HE NE PIC
rs315759231 GG AG AA A G 0.203 0.576 0.221 0.491 0.509 0.499 1.999 0.375rs312619270 TT CT CC T C 0.581 0.332 0.087 0.747 0.253 0.378 1.608 0.307HE = gene heterozygosity; NE = number of allele; PIC = polymorphism information content.
Table 2. Genotypic and allelic frequencies (%), and related genetic parameters.

11383SNP analysis affecting growth and carcass on chicken ASB15
©FUNPEC-RP www.funpecrp.com.brGenetics and Molecular Research 14 (3): 11377-11388 (2015)
Figure 5. DNA sequencing files of TT, CT, and CC genotypes.
Figure 4. DNA sequencing files of AA, AG, and GG genotypes.
Diversity analysis and linkage disequilibrium
The genetic characteristics (HE, NE, and PIC) of the F2 population are presented in Table 2. The value of HE was approximately 0.5 for rs315759231 and rs312619270, and the NE approached 2; the PIC values were 0.375 and 0.306, respectively. PIC values greater than 0.50 were indicative of high levels of polymorphism, between 0.50 and 0.25 of intermediate levels of polymorphism, and lower than 0.25 of low levels of polymorphism. The F2 popula-tion exhibited intermediate levels of genetic diversity at these two SNPs. These results reflect a low overall level of genetic diversity of the chicken gene in the analyzed population. Genetic diversity is essential for species conservation, and the potential improvement of production traits in selected breeds.
The values of D' and r2 of the two SNPs were 0.115 and 0.004, respectively; as r2 < 0.33, the SNPs were not in linkage disequilibrium.
SNP associations with growth and carcass traits
A total of 17 growth traits and five carcass traits were used in an analysis of associa-tion. Regarding the growth traits, the rs315759231 A>G polymorphism was only significantly associated with BW0 and BSL12 (Table 3). A significant dominant effect on BW0 was found, while the additive effect was significant on BSL12 (Table 5). The rs312619270 T>C polymor-

11384Y.C. Wang et al.
©FUNPEC-RP www.funpecrp.com.brGenetics and Molecular Research 14 (3): 11377-11388 (2015)
phism was significantly associated with BW0, 4, 8, 12, and SL8, BBL12, BSL8, and BSL12 (Table 4); the CT individuals had significantly higher values of these traits than those with CC and TT genotypes.
Regarding the carcass traits, the rs315759231 A>G polymorphism was significantly associated with SEW, EW, LMW, and CW. The values of these traits in the AA genotype were significantly higher than those in the GG and AG genotypes (Table 3). Values of SEW, EW, LMW, and CW were higher in the AA genotype than in the GG and AG genotypes. The rs312619270 T>C polymorphism was only significantly associated with BMW and CW; trait values in the CT genotype were higher than those in the TT and CC genotypes. Both the dominant and additive effects were significant for weight (except BW0), SL8, BBL12, BSL8, BSL12, and BMW (Table 6).
DISCUSSION
Tremendous progress has been achieved in the fields of genetics and genomics over the last two decades (Gheyas and Burt, 2013). SNPs are by far the most commonly used tools for detecting DNA sequence variations. Although the vast majority of SNPs are found in noncoding regions of the genome, and most that are found in coding regions do not change gene products in deleterious ways, they are thought to be the basis for much of the genetic variation found in
Trait Genotype P value
GG (149) AG (422) AA (162)
Growth traits BW0 (g) 30.925 ± 0.454b 30.304 ± 0.419ab 31.240 ± 0.449a 0.000 BW2 (g) 120.765 ± 2.812 122.525 ± 2.522 122.965 ± 2.787 0.515 BW4 (g) 317.135 ± 7.913 321.102 ± 7.323 325.386 ± 7.846 0.247 BW6 (g) 558.694 ± 14.736 559.896 ± 13.579 571.554 ± 14.599 0.278 BW8 (g) 804.623 ± 20.589 812.688 ± 18.739 835.888 ± 20.354 0.062 BW10 (g) 1100.295 ± 26.620 1110.925 ± 24.474 1131.061 ± 26.423 0.196 BW12 (g) 1335.878 ± 30.202 1350.352 ± 27.357 1383.184 ± 29.896 0.067 SL0 (cm) 2.578 ± 0.012 2.574 ± 0.009 2.593 ± 0.011 0.127 SL4 (cm) 5.469 ± 0.075 5.497 ± 0.054 5.543 ± 0.073 0.685 SL8 (cm) 7.876 ± 0.061 7.912 ± 0.038 7.988 ± 0.059 0.372 SL12 (cm) 9.345 ± 0.082 9.395 ± 0.067 9.455 ± 0.081 0.373 BBL4 (cm) 6.181 ± 0.065 6.210 ± 0.055 6.248 ± 0.064 0.505 BBL8 (cm) 8.905 ± 0.081 8.880 ± 0.066 8.985 ± 0.079 0.281 BBL12 (cm) 10.937 ± 0.049 10.996 ± 0.080 11.004 ± 0.092 0.652 BSL4 (cm) 11.311 ± 0.099 11.385 ± 0.083 11.488 ± 0.098 0.138 BSL8 (cm) 1 6.132 ± 0.108 16.257 ± 0.077 16.295 ± 0.105 0.400 BSL12 (cm) 19.643 ± 0.117b 19.776 ± 0.089ab 19.955 ± 0.114a 0.046Carcass traits SEW (g) 1086.655 ± 26.317b 1 098.473 ± 24.017ab 1128.924 ± 25.991a 0.041 EW (g) 903.108 ± 23.999b 919.915 ± 22.176ab 943.985 ± 23.740a 0.024 BMW (g) 68.507 ± 2.585 70.238 ± 2.386 71.956 ± 2.555 0.110 LMW (g) 97.158 ± 3.014b 99.308 ± 2.785ab 101.826 ± 2.986a 0.049 CW (g) 1195.165 ± 29.04b 1211.406 ± 26.722ab 1247.964 ± 28.747a 0.031a,bMeans within a row of each SNP site with no common superscript were significantly different (P < 0.05); bold numbers indicate significant differences. BW0, BW2, BW4, BW6, BW8, BW10, and BW12 represent body weight at 0, 4, 8, and 12 weeks of age; SL4, SL8, and SL12 represent shank length at 4, 8, and 12 weeks of age; BBL4, BBL8, and BBL12 represent breast bone length at 4, 8, and 12 weeks of age; BSL4, BSL8, and BSL12 represent body slanting length at 4, 8, and 12 weeks of age; SEW, semi-evisceration weight; EW, evisceration weight; BMW, breast muscle weight; LMW, leg muscle weight; CW, carcass weight.
Table 3. Relationships between rs315759231 A>G single nucleotide polymorphisms (SNPs) and chicken growth and carcass traits.

11385SNP analysis affecting growth and carcass on chicken ASB15
©FUNPEC-RP www.funpecrp.com.brGenetics and Molecular Research 14 (3): 11377-11388 (2015)
humans and animals (Kwok, 2003). The function of SNPs is a hot topic of debate for geneticists (Rao and Zhang, 2007). Among farm animals, the chicken has emerged as an important model organism, in fields as diverse as embryological development, immunology, oncology, virology, evolution, genetics, and genomics, and particularly as a model for other avian species. Studies of chicken SNPs have mainly focused on important economic characteristics, such as growth (Amills et al., 2003; Wang et al., 2011; Liu et al., 2012; Xie et al., 2012; Ahsan et al., 2013; Jin et al., 2013), carcass characteristics (Fang et al., 2010; Uemoto et al., 2011; Lu et al., 2012; Boschiero et al., 2013; Sun et al., 2013), egg quality (Bennett et al., 2006; Fatemi et al., 2012), fatness (Nie et al., 2010; Han et al., 2012), reproduction (Tang et al., 2010; Moonen and Vil-lamor, 2011; Liu et al., 2012), and disease resistance (Legarra et al., 2011; Meydan et al., 2011).
a,bMeans within a row of each SNP site with no common superscript were significantly different (P < 0.05); bold numbers indicate significant differences. BW0, BW2, BW4, BW6, BW8, BW10, and BW12 represent body weight at 0, 4, 8, and 12 weeks of age; SL4, SL8, and SL12 represent shank length at 4, 8, and 12 weeks of age; BBL4, BBL8, and BBL12 represent breast bone length at 4, 8, and 12 weeks of age; BSL4, BSL8, and BSL12 represent body slanting length at 4, 8, and 12 weeks of age; SEW, semi-evisceration weight; EW, evisceration weight; BMW, breast muscle weight; LMW, leg muscle weight; CW, carcass weight.
SNP Trait Genotype P value
TT (441) CT (252) CC (66)
rs312619270 Growth traits BW0 (g) 30.560 ± 0.566ab 30.942 ± 0.486a 29.983 ± 0.47b 0.027T>C BW2 (g) 121.475 ± 2.432 124.301 ± 2.570 121.229 ± 3.280 0.169 BW4 (g) 317.188 ± 6.336b 327.011 ± 6.68a 325.779 ± 8.187ab 0.033 BW6 (g) 556.124 ± 12.300 568.690 ± 12.956 565.124 ± 15.874 0.229 BW8 (g) 804.461 ± 16.014b 832.264 ± 17.043a 820.168 ± 22.182ab 0.042 BW10 (g) 1100.614 ± 20.902 1131.654 ± 22.209 1114.304 ± 28.241 0.086 BW12 (g) 1338.955 ± 23.176b 1379.751 ± 24.845a 1351.119 ± 32.806ab 0.048 SL0 (cm) 2.576 ± 0.011 2.584 ± 0.012 2.598 ± 0.016 0.211 SL4 (cm) 5.497 ± 0.063 5.494 ± 0.071 5.407 ± 0.105 0.643 SL8 (cm) 7.852 ± 0.043b 8.002 ± 0.051a 7.981 ± 0.088ab 0.016 SL12 (cm) 9.355 ± 0.053 9.468 ± 0.060 9.435 ± 0.092 0.091 BBL4 (cm) 6.193 ± 0.053 6.249 ± 0.058 6.257 ± 0.080 0.375 BBL8 (cm) 8.896 ± 0.064 8.948 ± 0.071 8.868 ± 0.104 0.570 BBL12 (cm) 10.918 ± 0.064b 11.128 ± 0.105a 11.080 ± 0.072ab 0.008 BSL4 (cm) 11.325 ± 0.083 11.550 ± 0.124 11.490 ± 0.091 0.057 BSL8 (cm) 16.123 ± 0.061b 16.403 ± 0.077a 16.385 ± 0.144ab 0.006 BSL12 (cm) 19.707 ± 0.067b 19.908 ± 0.081a 19.821 ± 0.14ab 0.048 Carcass traits SEW (g) 1090.872 ± 20.696 1122.278 ± 22.016 1097.838 ± 28.316 0.076 EW (g) 911.268 ± 19.188 939.342 ± 20.266 918.281 ± 25.384 0.063 BMW (g) 69.114 ± 2.076b 72.688 ± 2.184a 69.700 ± 2.733ab 0.018 LMW (g) 98.669 ± 2.584 100.972 ± 2.704 99.233 ± 3.313 0.299 CW (g) 1199.710 ± 22.337b 1242.634 ± 23.713a 1213.363 ± 30.354ab 0.015
Table 4. Relationships between rs312619270 T>C single nucleotide polymorphisms (SNPs) and chicken growth and carcass traits.
Traits Additive effective Dominance effective
a ± SE P value d ± SE P value
BW0 0.237 ± 0.150 0.114 0.401 ± 0.098 0.000BSL12 0.124 ± 0.063 0.047 0.010 ± 0.042 0.801SEW 14.790 ± 9.024 0.102 0.000 ± 0.075 0.993EW 14.726 ± 7.762 0.058 -0.117 ± 0.074 0.113LMW 1.665 ± 0.969 0.086 -0.606 ± 0.643 0.346CW 0.223 ± 0.112 0.048 -4.201 ± 6.409 0.512
Table 5. Estimated additive and dominance effects for the rs315759231 A>G.
11386Y.C. Wang et al.
©FUNPEC-RP www.funpecrp.com.brGenetics and Molecular Research 14 (3): 11377-11388 (2015)
Traits Additive effective Dominance effective
a ± SE P value d ± SE P value
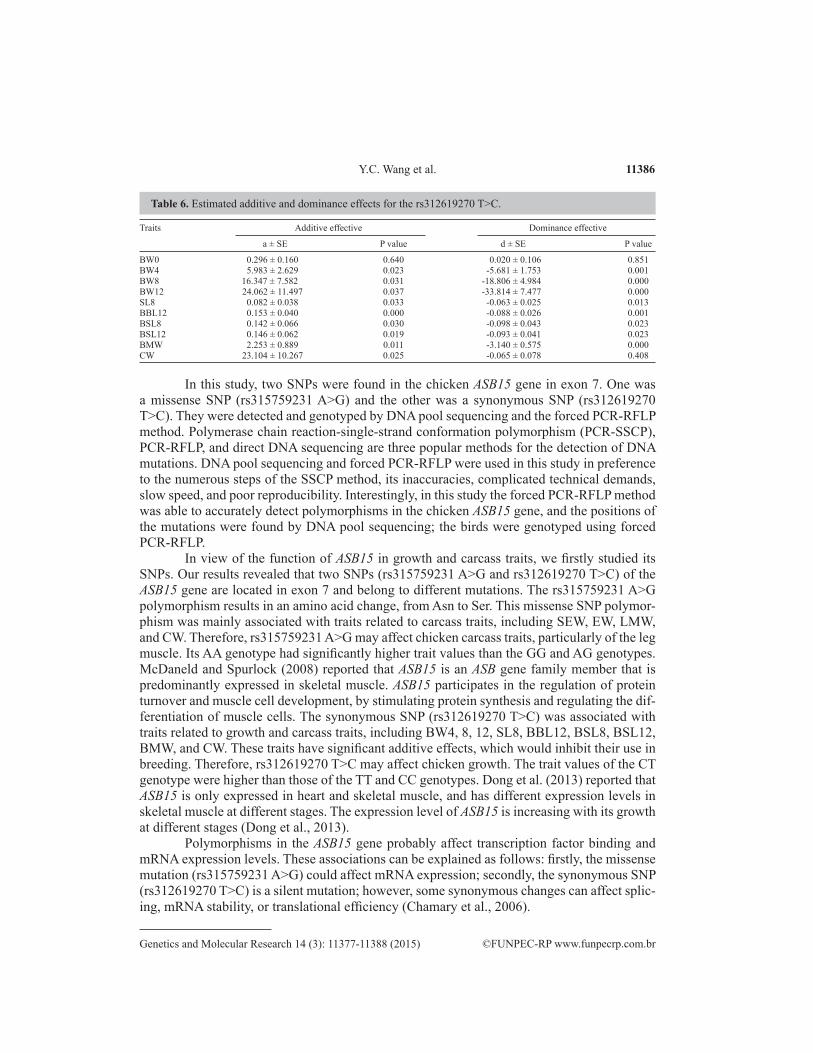
BW0 0.296 ± 0.160 0.640 0.020 ± 0.106 0.851BW4 5.983 ± 2.629 0.023 -5.681 ± 1.753 0.001BW8 16.347 ± 7.582 0.031 -18.806 ± 4.984 0.000BW12 24.062 ± 11.497 0.037 -33.814 ± 7.477 0.000SL8 0.082 ± 0.038 0.033 -0.063 ± 0.025 0.013BBL12 0.153 ± 0.040 0.000 -0.088 ± 0.026 0.001BSL8 0.142 ± 0.066 0.030 -0.098 ± 0.043 0.023BSL12 0.146 ± 0.062 0.019 -0.093 ± 0.041 0.023BMW 2.253 ± 0.889 0.011 -3.140 ± 0.575 0.000CW 23.104 ± 10.267 0.025 -0.065 ± 0.078 0.408
Table 6. Estimated additive and dominance effects for the rs312619270 T>C.
In this study, two SNPs were found in the chicken ASB15 gene in exon 7. One was a missense SNP (rs315759231 A>G) and the other was a synonymous SNP (rs312619270 T>C). They were detected and genotyped by DNA pool sequencing and the forced PCR-RFLP method. Polymerase chain reaction-single-strand conformation polymorphism (PCR-SSCP), PCR-RFLP, and direct DNA sequencing are three popular methods for the detection of DNA mutations. DNA pool sequencing and forced PCR-RFLP were used in this study in preference to the numerous steps of the SSCP method, its inaccuracies, complicated technical demands, slow speed, and poor reproducibility. Interestingly, in this study the forced PCR-RFLP method was able to accurately detect polymorphisms in the chicken ASB15 gene, and the positions of the mutations were found by DNA pool sequencing; the birds were genotyped using forced PCR-RFLP.
In view of the function of ASB15 in growth and carcass traits, we firstly studied its SNPs. Our results revealed that two SNPs (rs315759231 A>G and rs312619270 T>C) of the ASB15 gene are located in exon 7 and belong to different mutations. The rs315759231 A>G polymorphism results in an amino acid change, from Asn to Ser. This missense SNP polymor-phism was mainly associated with traits related to carcass traits, including SEW, EW, LMW, and CW. Therefore, rs315759231 A>G may affect chicken carcass traits, particularly of the leg muscle. Its AA genotype had significantly higher trait values than the GG and AG genotypes. McDaneld and Spurlock (2008) reported that ASB15 is an ASB gene family member that is predominantly expressed in skeletal muscle. ASB15 participates in the regulation of protein turnover and muscle cell development, by stimulating protein synthesis and regulating the dif-ferentiation of muscle cells. The synonymous SNP (rs312619270 T>C) was associated with traits related to growth and carcass traits, including BW4, 8, 12, SL8, BBL12, BSL8, BSL12, BMW, and CW. These traits have significant additive effects, which would inhibit their use in breeding. Therefore, rs312619270 T>C may affect chicken growth. The trait values of the CT genotype were higher than those of the TT and CC genotypes. Dong et al. (2013) reported that ASB15 is only expressed in heart and skeletal muscle, and has different expression levels in skeletal muscle at different stages. The expression level of ASB15 is increasing with its growth at different stages (Dong et al., 2013).
Polymorphisms in the ASB15 gene probably affect transcription factor binding and mRNA expression levels. These associations can be explained as follows: firstly, the missense mutation (rs315759231 A>G) could affect mRNA expression; secondly, the synonymous SNP (rs312619270 T>C) is a silent mutation; however, some synonymous changes can affect splic-ing, mRNA stability, or translational efficiency (Chamary et al., 2006).
11387SNP analysis affecting growth and carcass on chicken ASB15
©FUNPEC-RP www.funpecrp.com.brGenetics and Molecular Research 14 (3): 11377-11388 (2015)
In conclusion, the SNPs rs315759231A>G and rs312619270 T>C were identified in the seventh exon of the chicken ASB15 gene. The rs315759231 polymorphism was significant-ly related to SEW, EW, LMW, and CW, and the rs312619270 polymorphism was significantly related to BW and body measurements. Therefore, the ASB15 gene probably has a profound effect on growth and carcass traits in the chicken. These SNPs can assist researchers in select-ing optimal strains and phenotypes for further experiments, because growth and carcass traits are important characteristics in the poultry industry. Our analyses also provide a basis for the further functional annotation of ASB15. ASB15 may be a good candidate gene to improve growth and carcass traits in the chicken, but further research is required to confirm this.
Conflicts of interest
The authors declare no conflict of interest.
ACKNOWLEDGMENTS
Research supported by the Agricultural Research Outstanding Talents and Innovation Team of the Ministry of Agriculture of China and Earmarked Fund for Modern Agro-Industry Technology Research System (#CARS-41-K04) and Program for Innovation Research Team of Ministry of Education (#IRT1236).
REFERENCES
Ahsan M, Li X, Lundberg AE, Kierczak M, et al. (2013). Identification of candidate genes and mutations in QTL regions for chicken growth using bioinformatic analysis of NGS and SNP-chip data. Front. Genet. 4: 226.
Amills M, Jimenez N, Villalba D, Tor M, et al. (2003). Identification of three single nucleotide polymorphisms in the chicken insulin-like growth factor 1 and 2 genes and their associations with growth and feeding traits. Poultr. Sci. 82: 1485-1493.
Andresen CA, Smedegaard S, Sylvestersen KB, Svensson C, et al. (2014). Protein interaction screening for the ankyrin repeats and suppressor of cytokine signaling (SOCS) box (ASB) family identify Asb11 as a novel endoplasmic reticulum resident ubiquitin ligase. J. Biol. Chem. 289: 2043-2054.
Ardlie K G, Lunetta KL, and Seielstad M (2002). Testing for population subdivision and association in four case-control studies. Am. J. Hum. Genet. 71: 304-311.
Bennett AK, Hester PY and Spurlock DE (2006). Polymorphisms in vitamin D receptor, osteopontin, insulin-like growth factor 1 and insulin, and their associations with bone, egg and growth traits in a layer-broiler cross in chickens. Anim. Genet. 37: 283-286.
Boschiero C, Jorge EC, Ninov K, Nones K, et al. (2013). Association of IGF1 and KDM5A polymorphisms with performance, fatness and carcass traits in chickens. J. Appl. Genet. 54: 103-112.
Chamary JV, Parmley JL and Hurst LD (2006). Hearing silence: non-neutral evolution at synonymous sites in mammals. Nat. Rev. Genet. 7: 98-108.
Dong X, Zhong T, Xu T, Xia Y, et al. (2013). Evaluating coverage of exons by HapMap SNPs. Genomics 101: 20-23.Fang M, Nie Q, Luo C, Zhang D, et al. (2010). Associations of GHSR gene polymorphisms with chicken growth and
carcass traits. Mol. Biol. Rep. 37: 423-428.Fatemi SA, Mehrabani-Yeganeh H, Nejati-Javaremi A and Niknafs Sh (2012). Association of neuropeptide Y and
gonadotropin-releasing hormone receptor gene SNPs with breeding value for growth and egg production traits in Mazandaran native chickens. Genet. Mol. Res. 11: 2539-2547.
Gheyas AA and Burt DW (2013). Microarray resources for genetic and genomic studies in chicken: a review. Genesis 51: 337-356.
Guibal FC, Moog-Lutz C, Smolewski P, Di Gioia Y, et al. (2002). ASB-2 inhibits growth and promotes commitment in myeloid leukemia cells. J. Biol. Chem. 277: 218-224.
Han R, Wei Y, Kang X, Chen H, et al. (2012). Novel SNPs in the PRDM16 gene and their associations with performance traits in chickens. Mol. Biol. Rep. 39: 3153-3160.

11388Y.C. Wang et al.
©FUNPEC-RP www.funpecrp.com.brGenetics and Molecular Research 14 (3): 11377-11388 (2015)
Han RL, Lan XY, Zhang LZ, Ren G, et al. (2010). A novel single-nucleotide polymorphism of the visfatin gene and its associations with performance traits in the chicken. J. Appl. Genet. 51: 59-65.
Hilton DJ, Richardson RT, Alexander WS, Viney EM, et al. (1998). Twenty proteins containing a C-terminal SOCS box form five structural classes. Proc. Natl. Acad. Sci. 95: 114-119.
Jin S, Chen S, Li H, Lu Y, et al. (2013). Polymorphisms in the transforming growth factor Beta3 gene and their associations with feed efficiency in chickens. Poultr. Sci. 92: 1745-1749.
Kamura T, Maenaka K, Kotoshiba S, Matsumoto M, et al. (2004). VHL-box and SOCS-box domains determine binding specificity for Cul2-Rbx1 and Cul5-Rbx2 modules of ubiquitin ligases. Genes Dev. 18: 3055-3065.
Kile BT, Viney EM, Willson TA, Brodnicki TC, et al. (2000). Cloning and characterization of the genes encoding the ankyrin repeat and SOCS box-containing proteins Asb-1, Asb-2, Asb-3 and Asb-4. Gene 258: 31-41.
Kile BT, Metcalf D, Mifsud S, Di Rago L, et al. (2001). Functional analysis of Asb-1 using genetic modification in mice. Mol. Cell Biol. 21: 6189-6197.
Kohroki J, Fujita S, Itoh N, Yamada Y, et al. (2001). ATRA-regulated Asb-2 gene induced in differentiation of HL-60 leukemia cells. FEBS Lett. 505: 223-228.
Kwok P-Y (2003). Single nucleotide polymorphisms: methods and protocols. Humana Press, Totowa, USA.Legarra A, Calenge F, Mariani P, Velge P, et al. (2011). Use of a reduced set of single nucleotide polymorphisms for
genetic evaluation of resistance to Salmonella carrier state in laying hens. Poultr. Sci. 90: 731-736.Liu W, Yu Y, Li G, Tang S, et al. (2012). Single-nucleotide polymorphisms in the promoter of the growth hormone-
releasing hormone receptor gene are associated with growth and reproduction traits in chickens. Anim. Genet. 43: 564-569.
Lu Y, Chen SR, Liu WB, Hou ZC, et al. (2012). Polymorphisms in Wnt signaling pathway genes are significantly associated with chicken carcass traits. Poultr. Sci. 91: 1299-1307.
McDaneld TG and Spurlock DM (2008). Ankyrin repeat and suppressor of cytokine signaling (SOCS) box-containing protein (ASB) 15 alters differentiation of mouse C2C12 myoblasts and phosphorylation of mitogen-activated protein kinase and Akt. J. Anim. Sci. 86: 2897-2902.
McDaneld TG, Hancock DL and Moody DE (2004). Altered mRNA abundance of ASB15 and four other genes in skeletal muscle following administration of beta-adrenergic receptor agonists. Physiol. Genomics 16: 275-283.
McDaneld TG, Hannon K and Moody DE (2006). Ankyrin repeat and SOCS box protein 15 regulates protein synthesis in skeletal muscle. Am. J. Physiol. Regul. Integr. Comp. Physiol. 290: R1672-1682.
Meydan H, Yildiz MA, Dodgson JB and Cheng HH (2011). Allele-specific expression analysis reveals CD79B has a cis-acting regulatory element that responds to Marek’s disease virus infection in chickens. Poultry Sci. 90: 1206-1211.
Moonen RM and Villamor E (2011). Developmental changes in mesenteric artery reactivity in embryonic and newly hatched chicks. J. Comp. Physiol. B 181: 1063-1073.
Nei M and Roychoudhury AK (1974). Sampling Variances of heterozygosity and genetic distance. Genetics 76: 379-390.Nie QH, Fang MX, Xie L, Shen X, et al. (2010). Associations of ATGL gene polymorphisms with chicken growth and fat
traits. J. Appl. Genet. 51: 185-191.Rao YS and Zhang XQ (2007). Single nucleotide polymorphisms and fine mapping QTL in chickens. Yi Chuan 29: 393-
398.Spurlock DM, McDaneld TG and McIntyre LM (2006). Changes in skeletal muscle gene expression following clenbuterol
administration. BMC Genomics 7: 320.Sun G, Li M, Li H, Tian Y, et al. (2013). Molecular cloning and SNP association analysis of chicken PMCH gene. Mol.
Biol. Rep. 40: 5049-5055.Tang S, Sun D, Ou J, Zhang Y, et al. (2010). Evaluation of the IGFs (IGF1 and IGF2) genes as candidates for growth, body
measurement, carcass, and reproduction traits in Beijing You and Silkie chickens. Anim. Biotechnol. 21: 104-113.Uemoto Y, Sato S, Ohtake T, Sato S, et al. (2011). Ornithine decarboxylase gene is a positional candidate gene affecting
growth and carcass traits in F(2) intercross chickens. Poultr. Sci. 90: 35-41.Wang QG, Guan TZ, Wang SZ, Zhang H, et al. (2011). Association between chicken A-FABP gene polymorphisms and
growth and body composition traits. Yi Chuan 33: 153-162.Wilcox A, Katsanakis KD, Bheda F and Pillay TS (2004). Asb6, an adipocyte-specific ankyrin and SOCS box protein,
interacts with APS to enable recruitment of elongins B and C to the insulin receptor signaling complex. J. Biol. Chem. 279: 38881-38888.
Xie L, Luo C, Zhang C, Zhang R, et al. (2012). Genome-wide association study identified a narrow chromosome 1 region associated with chicken growth traits. PLoS One 7: e30910.
Yeh JJ, Marsh DJ, Zedenius J, Dwight T, et al. (1999). Fine-structure deletion mapping of 10Q22-24 identifies regions of loss of heterozygosity and suggests that sporadic follicular thyroid adenomas and follicular thyroid carcinomas develop along distinct neoplastic pathways. Gene. Chromosome. Cancer 26: 322-328.