assessment of pollutants in water and sediment samples in ... · solved oxygen (do) total dissolved...
TRANSCRIPT
Journal of Environmental Protection, 2012, 3, 1428-1441 http://dx.doi.org/10.4236/jep.2012.311161 Published Online November 2012 (http://www.SciRP.org/journal/jep)
Assessment of Pollutants in Water and Sediment Samples in Lake Chad, Baga, North Eastern Nigeria
Joseph Clement Akan*, Mohammed Taha Abbagambo, Zaynab Muhammad Chellube, Fanna Inna Abdulrahman
Department of Chemistry, University of Maiduguri, Maiduguri, Nigeria. Email: *[email protected] Received August 20th, 2012; revised September 21st, 2012; accepted October 18th, 2012
ABSTRACT
The purpose of this research is to determine the levels of some physicochemical parameters in water and sediment sam-ples from Kwantan turare in Lake Chad, Baga, Borno State, Nigeria. Water samples were collected from five point des-ignated as S1 to S5 for the determination of biochemical oxygen demand (BOD), chemical oxygen demand (COD), dis-solved oxygen (DO) total dissolved solid (TDS), total suspended solid (TSS) anions and trace element. Sediment sam-ples were also collected for the determination of heavy metals and total organic carbon (TOC). These parameters were determined using approved standard procedures. The levels of heavy metals in the water and sediment samples were determined using atomic absorption spectrophotometer (AAS). The concentrations of DO, BOD, COD, TSS, TDS, TOC, nitrite, nitrate, Phosphate, Sulphate, and Chloride in the water samples from the five sampling point were higher than the WHO limits for the protection of fish and other aquatic life. The concentrations of Fe, Mn, Cu, Cd, Pb, Ni and Co in the water samples were higher than the WHO guideline limits, indicating severed pollution of this portion of Lake Chad. This high level of heavy metals in the water samples is expected owing to runoff of wastewater from agricultural activities within the study area. However, the concentrations of all the metals in the sediment samples were higher than the recommended values stipulated by WHO; indicating that the sediment samples from this portion of Lake Chad were also polluted by heavy metals. Results of Analysis of variance (ANOVA) revealed that the concentrations of all the pa-rameters studied were statistically significant among the sampling points. The prolonged presence of heavy metals in the water and sediment samples from this portion of Lake Chad give course for concern with time. The results of the study implies that continuous monitoring has to be carried out to ascertain the long-term impact of anthropogenic inputs to take remedial measures so as to ensure the health of aquatic life. Keywords: Physicochemical; Water; Sediment; Kwantan Turare; Baga; Lake Chad
1. Introduction
The impairment of water quality due to introduction of pollutants is a problem faced by most industrial cities around the world. The uncontrolled dissemination of waste effluents to large water bodies has negatively af-fected both water quality and aquatic life [1]. Most of our water resources are gradually becoming polluted due to the addition of foreign materials from the surroundings. These include organic matter of plant and animal origin, land surface washing, and industrial and sewage effluents [1]. Rapid urbanization and industrialization with im-proper environmental planning often lead to discharge of industrial and sewage effluents into lakes. The lakes have a complex and fragile ecosystem, as they do not have a self-cleaning ability and therefore readily accumulate pollutants [1].
Many of the sediments in our rivers, lakes, and oceans have been contaminated by pollutants. Some of these pollutants are directly discharged by industrial plants and municipal sewage treatment plants, others come from polluted runoff in urban and agricultural areas, and some are the result of historical contamination. Contaminated sediments can threaten creatures in the benthic environ-ment, exposing worms, crustaceans and insects to haz-ardous concentrations of toxic chemicals. Some kinds of toxic sediments kill benthic organisms, reducing the food available to larger animals such as fish. Some contami-nants in the sediment are taken up by benthic organisms in a process called bioaccumulation. When larger ani-mals feed on these contaminated organisms, the toxins are taken into their bodies, moving up the food chain in increasing concentrations in a process known as biomag-nification. As a result, fish and shellfish, waterfowl, freshwater and marine mammals may accumulate haz- *Corresponding author.
Copyright © 2012 SciRes. JEP

Assessment of Pollutants in Water and Sediment Samples in Lake Chad, Baga, North Eastern Nigeria 1429
ardous concentrations of toxic chemicals. Contaminated sediments do not always remain at the
bottom of a water body. Anything that stirs up the water, such as dredging, can resuspend sediments. Resuspen-sion may mean that all of the animals in the water, and not just the bottom-dwelling organisms, will be directly exposed to toxic contaminants. Different aquatic organ-isms often respond to external contamination in different ways, where the quantity and form of the element in wa-ter, sediment, or food will determine the degree of accu-mulation [1]. The region of accumulation of heavy met-als within fish varies with the route of uptake, heavy metals and species of fish concerned. Their potential use as biomonitors is therefore significant in the assessment of bioaccumulation and biomagnification of contaminants within the ecosystem. Many dangerous chemical elements, if released into the environment, accumulate in the soil and sediments of water bodies. The lower aquatic organ-isms absorb and transfer them through the food chain to higher trophic levels, including fish. Under acidic condi-tions, the free divalent ions of many metals may be ab-sorbed by fish gills directly from the water. Hence, con-centrations of heavy metals (HM) in the organs of fish are determined primarily by the level of pollution of the water and food under certain conditions, chemical ele-ments accumulated in the silt and bottom sediments of water bodies can migrate back into the water, i.e. silt can become a secondary source of heavy metal pollution.
Lake Chad is situated at the southern fringe of the Sa-hara desert, east of the Sahel region between 12˚20 and 14˚20 latitude North; 13˚ and 15˚20 longitude East. Con-sidered as a Ramsar site of world importance because of its biodiversity, Lake Chad is a freshwater reserve with only 5 percent of salt content and it is bordered by Cam-eroon, Niger, Nigeria and Chad. Its depth varies between 1.5 and 10.5 metres and it is about 215 metres above sea level, with apparently no outlet (endoreic lake). Nigeria controls a substantial geographical area of lake Chad, which is shares with the Chad Republic, and to a lesser extent Cameroon and Niger. The lake is overseen by a Lake Chad Basin Commission, formed by these countries, which Nigeria joined in 1962. The affluents of lake Chad within Nigeria consist of the Komadugu Yobe river from Yobe state and the Ngadda and Yedseram river systems from Borno State. The Lake Chad basin is polluted by textiles and tanneries effluents in the upstream parts of the Basin (particularly in Kano and Maroua). These in-dustries contribute to pollution of the Lake. Wastewater discharges from settlements along the Chari-Logone and Komadugu-Yobe River courses particularly from abat-toirs, hotels and hospitals are also contribute to microbial and chemical pollution. Diamonds are essentially the main mineral exploited in Chad, with mining activity on the border and gold mining in the regions of Tandjile and Mayo Kebi (Republic of Chad, 2003). The waste
from this mining has a potential for to pollute the Chad basin.
Agricultural activities within the area also causes pol-lution in the Lake Chad Basin, however, there is a possi-ble pollution threat to water by agrochemicals used in agriculture, especially during periods of low flow and high temperatures. In Chad, the quantities of pesticides used are between 500 to 1000 m3 per year. The cotton industry uses the largest amounts of insecticides, in 1999 and 2000 4.5 m3 were used by Republic of Chad in 2003. The type of insecticides currently used in Chad and is considered as highly toxic and high enough concentra-tions can lead to mortalities, thus reducing the abundance and diversity of vertebrate and invertebrate organisms as well as the flora of wetlands. The organophosphate in-secticide, monocrotophos, has been banned in other re-gions of the world due to it killing birds, it is still used extensively in the cotton industries of Chad [2]. Herbi-cides can kill non-intended plants after entering aquatic systems decreasing the diversity of wetland flora. Pesti-cides can be potentially detrimental to migratory birds and there have been studies expressing concern for spe-cies in West Africa [2-4]. In the upper parts of the Logone Basin upstream of Bongor, there are also sig-nificant amounts of pesticides used in the cotton indus-tries. The lakes can be contaminated by agro-chemicals by the return flow of waters and also run-off and percola-tion from the irrigated fields [2,5]. The SCIP project in northern Nigeria extracts water from Lake Chad, which is applied to the irrigated fields with agro-chemicals. Surface and ground flows carry these chemicals directly into the Lake. There is an inadequate pollution regulatory framework in the Chad basin and the Lake is therefore vulnerable to increases pollution. Hence, the need for this study.
2. Materials and Methods
2.1. Sampling Area
Sampling was from the Kwatan Turare region of Lake Chad, Baga, Borno State, Nigeria (Figure 1). Water and sediment samples from Kwatan Turare were collected for analyses.
2.2. Sampling Points
Water and sediment samples were collected from five point designated as S1 to S5. Samples were collected at the point of Kwatan Turare (S1); 1 Km from Kwatan Turare point (S2); 2 Km from Kwatan Turare point (S3); and 4 Km away from Kwatan Turare point (S4); 6Km from Kwatan Turare point (S5).
2.3. Sample Collection
Water samples were collected in plastic containers pre-
Copyright © 2012 SciRes. JEP
Assessment of Pollutants in Water and Sediment Samples in Lake Chad, Baga, North Eastern Nigeria
Copyright © 2012 SciRes. JEP
1430
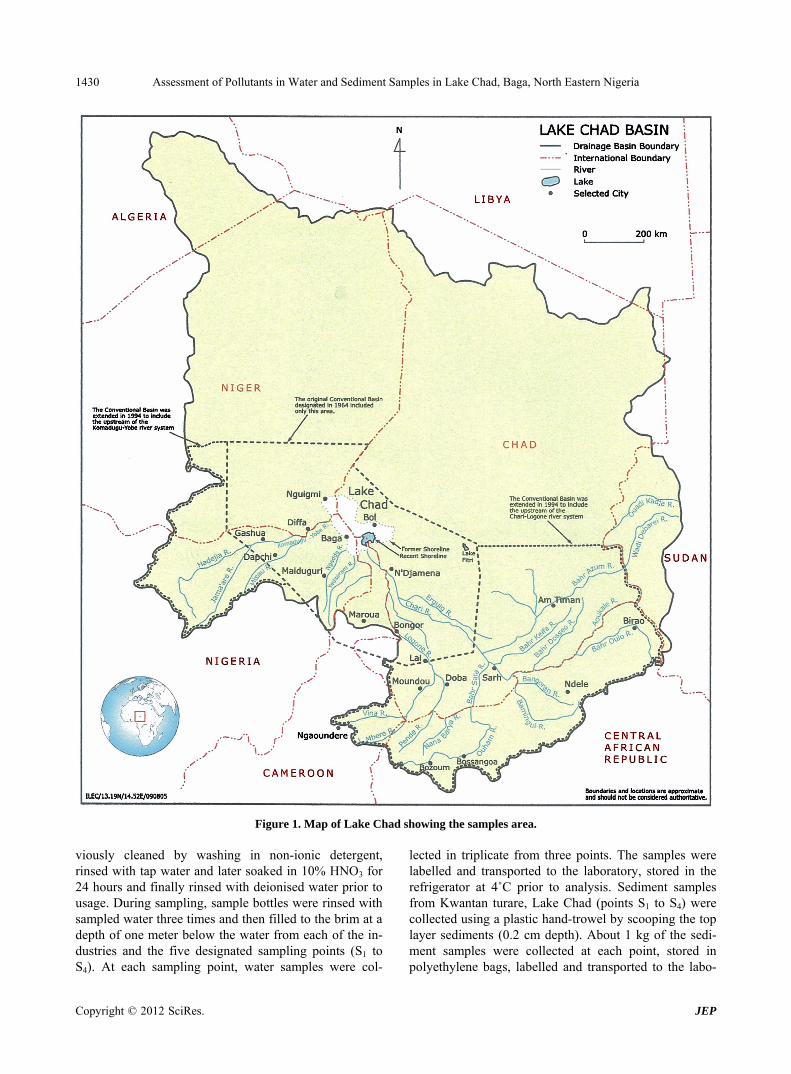
Figure 1. Map of Lake Chad showing the samples area. viously cleaned by washing in non-ionic detergent, rinsed with tap water and later soaked in 10% HNO3 for 24 hours and finally rinsed with deionised water prior to usage. During sampling, sample bottles were rinsed with sampled water three times and then filled to the brim at a depth of one meter below the water from each of the in-dustries and the five designated sampling points (S1 to S4). At each sampling point, water samples were col-
lected in triplicate from three points. The samples were labelled and transported to the laboratory, stored in the refrigerator at 4˚C prior to analysis. Sediment samples from Kwantan turare, Lake Chad (points S1 to S4) were collected using a plastic hand-trowel by scooping the top layer sediments (0.2 cm depth). About 1 kg of the sedi-ment samples were collected at each point, stored in polyethylene bags, labelled and transported to the labo-
Assessment of Pollutants in Water and Sediment Samples in Lake Chad, Baga, North Eastern Nigeria 1431
ratory for storage in freezers awaiting analysis.
2.4. Digestion of Water Samples for Heavy Metal Determination
Water samples were digested as follows: 100 cm3 of the sample was transferred into a beaker and 5 ml concen-trated HNO3 will be added. The beaker with the content was placed on a hot plate and evaporated down to about 20 mL. The beaker was cooled and another 5 ml concen-trated HNO3 was added. The beaker was covered with a watch glass and returned to the hot plate. The heating will continue, and then small portion of HNO3 was added until the solutions appear light coloured and clear. The beaker and watch glass was washed with distilled water and the sample filtered to remove some insoluble materi-als that could clog the atomizer. The volume was ad-justed to 100 cm3 with distilled water [6].
2.5. Digestion of Sediment Samples for Heavy Metal Determination
Sediment samples were air dried in the laboratory, any crumbs found in the sediment were removed and mixed uniformly by coning, pulverized and quartering. Sedi-ments were be sieved through a 2 mm sieve to remove coarse particles. Each of the sieve sediment samples were divided into two portions. One half was used for total organic carbon (TOC) determination. The other half was prepared for elemental analysis. Two grammes of the sediment samples were weighed out into acid washed glass beaker. Sediment samples were digested by the addition of 20 cm3 of aqua regia (mixture of HCl and HNO3, ratio 3:1) and 10cm3 of 30% H2O2. The H2O2 was added in small portions to avoid any possible overflow leading to loss of material from the beaker. The beaker will be covered with watch a glass, and heated over a hot plate at 90˚C for two hours.
The beaker wall and watch glass was washed with dis-tilled water and the sample was filtered out to separate the insoluble solid from the supernatant liquid. The vol-ume was adjusted to 100 cm3 with distilled water. Blank solution was handled as detailed for the samples. All samples and blanks were stored in plastic containers.
2.6. Elemental Analysis of Samples
Determination of Cu, Zn, Co, Mn, Fe, Cr, Cd, Ni and Pb was made directly on each final solution using Perkin- Elmer AAnalyst 300 Atomic Absorption Spectroscopy (AAS).
2.7. Calibration Solution
Standard solution of each sample Cu, Zn, Co, Mn, Fe, Cr, Cd, Ni and Pb was prepared according to Sc 2000 manu-
facturer procedure for Atomic absorption spectroscopy to be used. A known 1000 mg/L concentration of the metal solution was prepared from their salts.
2.8. Determination of Total Organic Carbon in the Sediment Samples
Determination of total organic carbon (TOC) was carried out according to the method described by [7]. The dried sediment samples were finely pulverized and 0.2 gram- mes each was weighed into 500 ml conical flasks, 10 ml of 0.5 M K2Cr2O7 was added and swirled gently. Con-centrated H2SO4 (20 ml) was added with care directly into the suspension. The mixture was swirled gently and allowed to stand for about 40 minutes. 200 ml of distilled water was added, followed by careful addition of 10ml concentrated H3PO4. The mixture was allowed to cool, and three drops of ferroin indicator was added. The con-tents were then titrated with 0.25 M FAS to wine-red end point. A blank titration was carried out using the same procedure as above but without sediment sample. The %TOC of the sediments was obtained using the follow-ing expression [7]
b sV V M 1.38%TOC
W
where Vb = Volume of FAS for Blank; Vs = Volume of FAS for sample; M = Morality of FAS; W = Weight of the sample in gramme.
2.9. Determination of Physical Parameters in Water Samples
Physical parameters (pH, Eh, DO, TDS, conductivity and temperature) determination was carried out according to UNEPA/APHA. All field equipment were checked and calibrated according to the manufacturer’s specifications. The pH meter were calibrated using [8] buffers of pH 4.0, 7.0 and 10.0; Total dissolved solid (TDS) and conductiv-ity meter were calibrated using the potassium chloride solution provided by the manufacturer [8]. Dissolved oxygen (DO) meter was also calibrated prior to meas-urement with the appropriate traceable calibration solu-tion of 5% HCl in accordance with the manufacturers in- struction. In-situ measurements for some of the parame-ters pH, Eh and temperature (˚C) were measured using pH Electrode meter. Dissolved oxygen was measured with Jenway Model 9070 waterproof DO meter while TDS and conductivity were determined by using a C0150 conductivity meter.
2.10. Determination of Anions Total Suspended Solid in Water Samples
The DR/2010 HACH Portable Data Logging Spectro-
Copyright © 2012 SciRes. JEP
Assessment of Pollutants in Water and Sediment Samples in Lake Chad, Baga, North Eastern Nigeria 1432
photometer for determination of sulphate, nitrate, nitrite and phosphate was checked for malfunctioning by pass-ing standard solutions of all the parameters to be meas-ured; Blank samples (deionized water) were passed be-tween every five measurements of water samples to check for any eventual contamination or abnormal re-sponse of equipment.
The concentration of phosphate in the samples were determined using the ascorbic acid reduction method (code 3633-sec) by reacting it with added reagent con-taining ammonium molybdate and antimony potassium tartrate in an acid medium with a dilute solution H3PO4 to form antimony-phosphomolybdate complex. The com-plex was reduced to an intense blue coloured orthor-phosphate complex by ascorbic acid [8].
Nitrate was determined by the cadmium metal method [8]. The cadmium metal in the added reagent reduces all nitrate in the sample to nitrite. While sulphate was deter-mined by Sulfa Ver Standard [8].
2.11. Determination of Chloride
Chloride (Cl–) level was carried out according to the method described by [7]. 100 ml of the surface water sample was measured into a 250 ml conical flask and the pH was adjusted to 8 with 1 M NaOH. One ml of K2CrO4 indicator was then added and titrated with AgNO3 solu-tion. A blank titration was carried out using distilled wa-ter.
2.12. Determination of Total Suspended Solids (TSS)
A known amount of water sample was filtered through a pre weighed filter paper. The filter paper was then dried at 103˚C - 105˚C. TSS was determined by using the fol-lowing formula [9].
final wt initial wt 1000TSS mg l
Amount of sample taken
2.13. Chemical Oxygen Demand (COD)
Determination of chemical oxygen demand was carried out according to the method described by [7]. 0.4 g HgSO4, 20 ml of water sample, 2 ml sulphuric acid and 10 ml of standard K2Cr2O7 solution and some glass beads was placed into a reflux with gentle swirling, 30 ml of Ag2SO4 reagent was slowly added, and refluxed for about two hours and cooled. The condenser was then washed with distilled water into Erlenmeyer flask and diluted to 150 ml with distilled water. The solution was allowed to cool to room temperature. The solution was then titrated with standard ferrous ammonium sulphate (FAS) using ferroin indicator.
The blank titration was carried out as above but using distilled water in place of the sample. The COD of the water sample was calculated from the following expres-sion.
b sV V M 16000COD mg l
ml of sample
where Vb = Volume of FAS for Blank; Vs = Volume of FAS for sample; M = Morality of FAS.
2.14. Biological Oxygen Demand (BOD)
The procedure for the collection of samples for BOD test follows the same steps used for dissolved oxygen, with one important difference. At each sampling point, a sec-ond sample was collected in a BOD bottle and delivered to the laboratory for dissolved oxygen (DO) testing after five days incubation period at 20˚C. Amber coloured bottle was used to prevent photosynthesis.
The BOD5 was computed by subtracting the DO after five days incubation from the DO measured on collection of samples at point in mg/L.
BOD5 = DOi – DOf or
i fDo Do vol of BOD bottle
vol of water sample
2.15. Data Handling
Data collected were subjected to One-way analysis of variance (ANOVA), and were used to assess whether samples varied significantly between sampling points, possibilities less than 0.05 (p < 0.05) were considered statistically significant.
3. Results
Concentrations of Heavy Metals
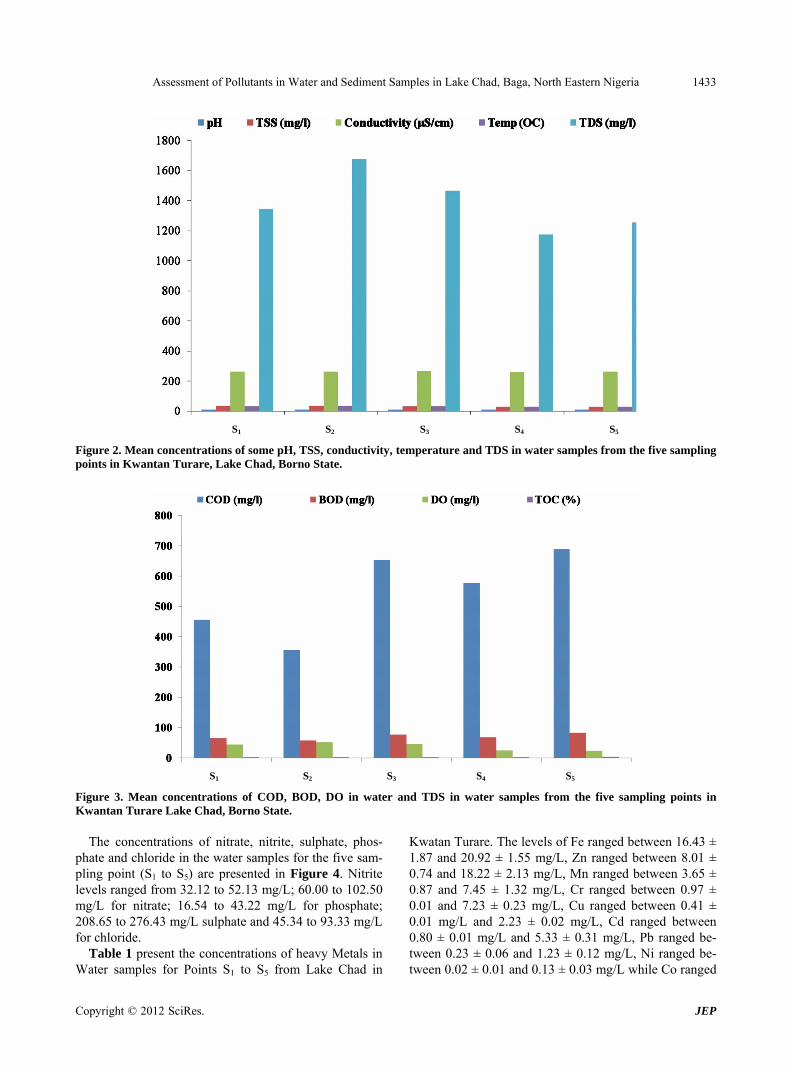
The concentrations of some physicochemical parameters in water samples from the five sampling point in Lake Chad, Kwantan Turare are presented in Figure 2. The levels of pH ranged from 8.10 to 9.71; 29.10 to 35.00 OC for Temperature; 261.0 to 265.0 µS/cm for conductivity; 53.32 to 65.34 mg/L for TSS and 1176.00 to 1678.02 mg/L for TDS.
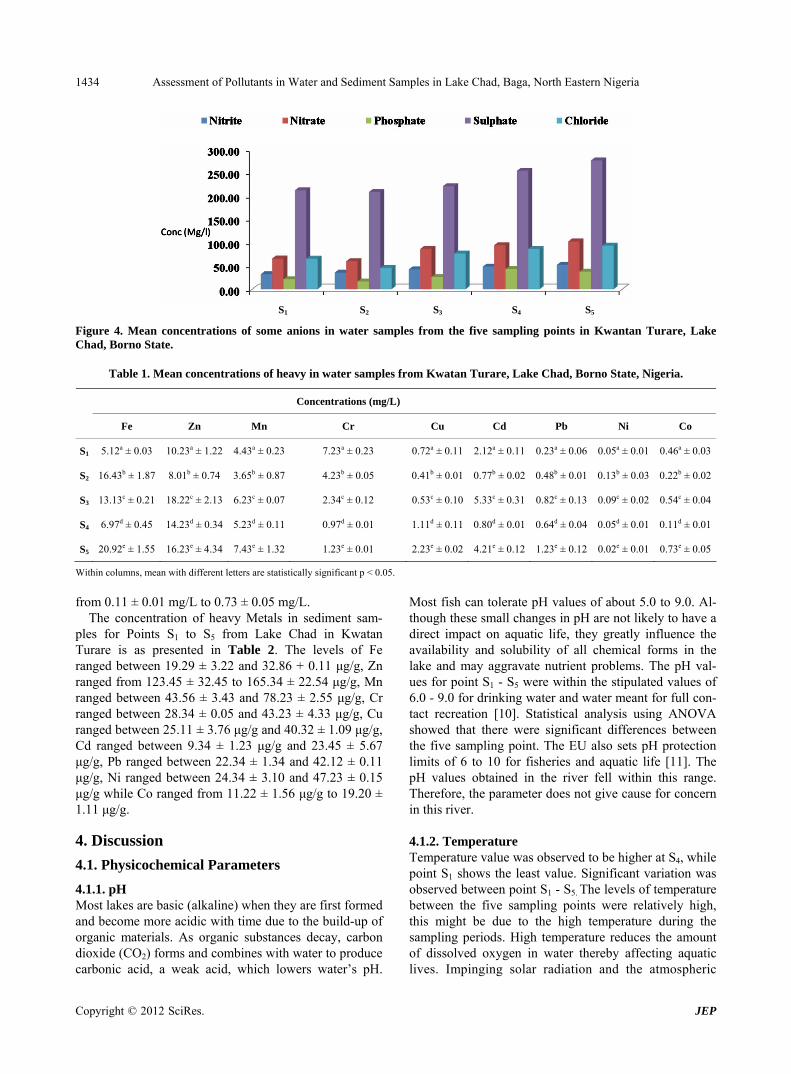
Figure 3 present the mean concentrations of some or-ganic pollutant indicator in water samples from the five sampling point in Lake Chad, Kwantan Turare. The con-centrations of COD for the five sampling point ranged between 353.00 and 689 mg/L; 57.87 to 83.66 mg/L BOD; DO ranged from 26.01 to 52.00 mg/L. The per-centage of TOC in the sediment samples for point S1 to
5 ranged from 2.33 to 4.65%. S
Copyright © 2012 SciRes. JEP
Assessment of Pollutants in Water and Sediment Samples in Lake Chad, Baga, North Eastern Nigeria
Copyright © 2012 SciRes. JEP
1433
S1 S2 S3 S4 S5
Figure 2. Mean concentrations of some pH, TSS, conductivity, temperature and TDS in water samples from the five sampling points in Kwantan Turare, Lake Chad, Borno State.
S1 S2 S3 S4 S5
Figure 3. Mean concentrations of COD, BOD, DO in water and TDS in water samples from the five sampling points in Kwantan Turare Lake Chad, Borno State.
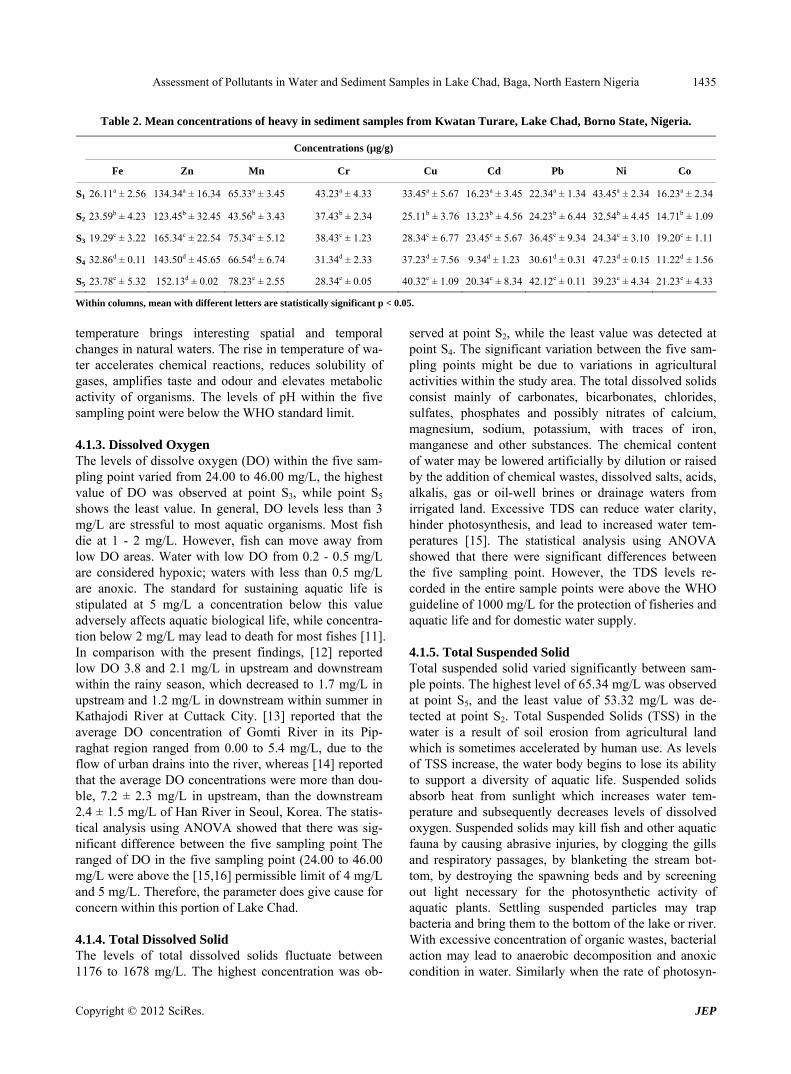
The concentrations of nitrate, nitrite, sulphate, phos-phate and chloride in the water samples for the five sam-pling point (S1 to S5) are presented in Figure 4. Nitrite levels ranged from 32.12 to 52.13 mg/L; 60.00 to 102.50 mg/L for nitrate; 16.54 to 43.22 mg/L for phosphate; 208.65 to 276.43 mg/L sulphate and 45.34 to 93.33 mg/L for chloride.
Table 1 present the concentrations of heavy Metals in Water samples for Points S1 to S5 from Lake Chad in
Kwatan Turare. The levels of Fe ranged between 16.43 ± 1.87 and 20.92 ± 1.55 mg/L, Zn ranged between 8.01 ± 0.74 and 18.22 ± 2.13 mg/L, Mn ranged between 3.65 ± 0.87 and 7.45 ± 1.32 mg/L, Cr ranged between 0.97 ± 0.01 and 7.23 ± 0.23 mg/L, Cu ranged between 0.41 ± 0.01 mg/L and 2.23 ± 0.02 mg/L, Cd ranged between 0.80 ± 0.01 mg/L and 5.33 ± 0.31 mg/L, Pb ranged be- tween 0.23 ± 0.06 and 1.23 ± 0.12 mg/L, Ni ranged be- ween 0.02 ± 0.01 and 0.13 ± 0.03 mg/L while Co ranged t
Assessment of Pollutants in Water and Sediment Samples in Lake Chad, Baga, North Eastern Nigeria 1434
S1 S2 S3 S4 S5
Figure 4. Mean concentrations of some anions in water samples from the five sampling points in Kwantan Turare, Lake Chad, Borno State.
Table 1. Mean concentrations of heavy in water samples from Kwatan Turare, Lake Chad, Borno State, Nigeria.
Concentrations (mg/L)
Fe Zn Mn Cr Cu Cd Pb Ni Co
S1 5.12a ± 0.03 10.23a ± 1.22 4.43a ± 0.23 7.23a ± 0.23 0.72a ± 0.11 2.12a ± 0.11 0.23a ± 0.06 0.05a ± 0.01 0.46a ± 0.03
S2 16.43b ± 1.87 8.01b ± 0.74 3.65b ± 0.87 4.23b ± 0.05 0.41b ± 0.01 0.77b ± 0.02 0.48b ± 0.01 0.13b ± 0.03 0.22b ± 0.02
S3 13.13c ± 0.21 18.22c ± 2.13 6.23c ± 0.07 2.34c ± 0.12 0.53c ± 0.10 5.33c ± 0.31 0.82c ± 0.13 0.09c ± 0.02 0.54c ± 0.04
S4 6.97d ± 0.45 14.23d ± 0.34 5.23d ± 0.11 0.97d ± 0.01 1.11d ± 0.11 0.80d ± 0.01 0.64d ± 0.04 0.05d ± 0.01 0.11d ± 0.01
S5 20.92e ± 1.55 16.23e ± 4.34 7.43e ± 1.32 1.23e ± 0.01 2.23e ± 0.02 4.21e ± 0.12 1.23e ± 0.12 0.02e ± 0.01 0.73e ± 0.05
Within columns, mean with different letters are statistically significant p < 0.05.
from 0.11 ± 0.01 mg/L to 0.73 ± 0.05 mg/L.
The concentration of heavy Metals in sediment sam-ples for Points S1 to S5 from Lake Chad in Kwatan Turare is as presented in Table 2. The levels of Fe ranged between 19.29 ± 3.22 and 32.86 + 0.11 μg/g, Zn ranged from 123.45 ± 32.45 to 165.34 ± 22.54 μg/g, Mn ranged between 43.56 ± 3.43 and 78.23 ± 2.55 μg/g, Cr ranged between 28.34 ± 0.05 and 43.23 ± 4.33 μg/g, Cu ranged between 25.11 ± 3.76 μg/g and 40.32 ± 1.09 μg/g, Cd ranged between 9.34 ± 1.23 μg/g and 23.45 ± 5.67 μg/g, Pb ranged between 22.34 ± 1.34 and 42.12 ± 0.11 μg/g, Ni ranged between 24.34 ± 3.10 and 47.23 ± 0.15 μg/g while Co ranged from 11.22 ± 1.56 μg/g to 19.20 ± 1.11 μg/g.
4. Discussion
4.1. Physicochemical Parameters
4.1.1. pH Most lakes are basic (alkaline) when they are first formed and become more acidic with time due to the build-up of organic materials. As organic substances decay, carbon dioxide (CO2) forms and combines with water to produce carbonic acid, a weak acid, which lowers water’s pH.
Most fish can tolerate pH values of about 5.0 to 9.0. Al-though these small changes in pH are not likely to have a direct impact on aquatic life, they greatly influence the availability and solubility of all chemical forms in the lake and may aggravate nutrient problems. The pH val-ues for point S1 - S5 were within the stipulated values of 6.0 - 9.0 for drinking water and water meant for full con-tact recreation [10]. Statistical analysis using ANOVA showed that there were significant differences between the five sampling point. The EU also sets pH protection limits of 6 to 10 for fisheries and aquatic life [11]. The pH values obtained in the river fell within this range. Therefore, the parameter does not give cause for concern in this river.
4.1.2. Temperature Temperature value was observed to be higher at S4, while point S1 shows the least value. Significant variation was observed between point S1 - S5. The levels of temperature between the five sampling points were relatively high, this might be due to the high temperature during the sampling periods. High temperature reduces the amount of dissolved oxygen in water thereby affecting aquatic ives. Impinging solar radiation and the atmospheric l
Copyright © 2012 SciRes. JEP
Assessment of Pollutants in Water and Sediment Samples in Lake Chad, Baga, North Eastern Nigeria 1435
Table 2. Mean concentrations of heavy in sediment samples from Kwatan Turare, Lake Chad, Borno State, Nigeria.
Concentrations (µg/g)
Fe Zn Mn Cr Cu Cd Pb Ni Co
S1 26.11a ± 2.56 134.34a ± 16.34 65.33a ± 3.45 43.23a ± 4.33 33.45a ± 5.67 16.23a ± 3.45 22.34a ± 1.34 43.45a ± 2.34 16.23a ± 2.34
S2 23.59b ± 4.23 123.45b ± 32.45 43.56b ± 3.43 37.43b ± 2.34 25.11b ± 3.76 13.23b ± 4.56 24.23b ± 6.44 32.54b ± 4.45 14.71b ± 1.09
S3 19.29c ± 3.22 165.34c ± 22.54 75.34c ± 5.12 38.43c ± 1.23 28.34c ± 6.77 23.45c ± 5.67 36.45c ± 9.34 24.34c ± 3.10 19.20c ± 1.11
S4 32.86d ± 0.11 143.50d ± 45.65 66.54d ± 6.74 31.34d ± 2.33 37.23d ± 7.56 9.34d ± 1.23 30.61d ± 0.31 47.23d ± 0.15 11.22d ± 1.56
S5 23.78e ± 5.32 152.13d ± 0.02 78.23e ± 2.55 28.34e ± 0.05 40.32e ± 1.09 20.34e ± 8.34 42.12e ± 0.11 39.23e ± 4.34 21.23e ± 4.33
Within columns, mean with different letters are statistically significant p < 0.05.
temperature brings interesting spatial and temporal changes in natural waters. The rise in temperature of wa-ter accelerates chemical reactions, reduces solubility of gases, amplifies taste and odour and elevates metabolic activity of organisms. The levels of pH within the five sampling point were below the WHO standard limit.
4.1.3. Dissolved Oxygen The levels of dissolve oxygen (DO) within the five sam-pling point varied from 24.00 to 46.00 mg/L, the highest value of DO was observed at point S3, while point S5 shows the least value. In general, DO levels less than 3 mg/L are stressful to most aquatic organisms. Most fish die at 1 - 2 mg/L. However, fish can move away from low DO areas. Water with low DO from 0.2 - 0.5 mg/L are considered hypoxic; waters with less than 0.5 mg/L are anoxic. The standard for sustaining aquatic life is stipulated at 5 mg/L a concentration below this value adversely affects aquatic biological life, while concentra-tion below 2 mg/L may lead to death for most fishes [11]. In comparison with the present findings, [12] reported low DO 3.8 and 2.1 mg/L in upstream and downstream within the rainy season, which decreased to 1.7 mg/L in upstream and 1.2 mg/L in downstream within summer in Kathajodi River at Cuttack City. [13] reported that the average DO concentration of Gomti River in its Pip-raghat region ranged from 0.00 to 5.4 mg/L, due to the flow of urban drains into the river, whereas [14] reported that the average DO concentrations were more than dou-ble, 7.2 ± 2.3 mg/L in upstream, than the downstream 2.4 ± 1.5 mg/L of Han River in Seoul, Korea. The statis-tical analysis using ANOVA showed that there was sig-nificant difference between the five sampling point. The ranged of DO in the five sampling point (24.00 to 46.00 mg/L were above the [15,16] permissible limit of 4 mg/L and 5 mg/L. Therefore, the parameter does give cause for concern within this portion of Lake Chad.
4.1.4. Total Dissolved Solid The levels of total dissolved solids fluctuate between 1176 to 1678 mg/L. The highest concentration was ob-
served at point S2, while the least value was detected at point S4. The significant variation between the five sam-pling points might be due to variations in agricultural activities within the study area. The total dissolved solids consist mainly of carbonates, bicarbonates, chlorides, sulfates, phosphates and possibly nitrates of calcium, magnesium, sodium, potassium, with traces of iron, manganese and other substances. The chemical content of water may be lowered artificially by dilution or raised by the addition of chemical wastes, dissolved salts, acids, alkalis, gas or oil-well brines or drainage waters from irrigated land. Excessive TDS can reduce water clarity, hinder photosynthesis, and lead to increased water tem-peratures [15]. The statistical analysis using ANOVA showed that there were significant differences between the five sampling point. However, the TDS levels re-corded in the entire sample points were above the WHO guideline of 1000 mg/L for the protection of fisheries and aquatic life and for domestic water supply.
4.1.5. Total Suspended Solid Total suspended solid varied significantly between sam-ple points. The highest level of 65.34 mg/L was observed at point S5, and the least value of 53.32 mg/L was de-tected at point S2. Total Suspended Solids (TSS) in the water is a result of soil erosion from agricultural land which is sometimes accelerated by human use. As levels of TSS increase, the water body begins to lose its ability to support a diversity of aquatic life. Suspended solids absorb heat from sunlight which increases water tem-perature and subsequently decreases levels of dissolved oxygen. Suspended solids may kill fish and other aquatic fauna by causing abrasive injuries, by clogging the gills and respiratory passages, by blanketing the stream bot-tom, by destroying the spawning beds and by screening out light necessary for the photosynthetic activity of aquatic plants. Settling suspended particles may trap bacteria and bring them to the bottom of the lake or river. With excessive concentration of organic wastes, bacterial action may lead to anaerobic decomposition and anoxic condition in water. Similarly when the rate of photosyn-
Copyright © 2012 SciRes. JEP
Assessment of Pollutants in Water and Sediment Samples in Lake Chad, Baga, North Eastern Nigeria 1436
thesis is low, then oxygen concentration become low and CO2 concentration become higher [17]. From the results of this study, the levels of TSS in the entire sample points exceeded the WHO guidelines of 50 mg/L for the protection of fisheries and aquatic life [11].
4.1.6. Biochemical Oxygen Demand Biochemical oxygen demand (BOD) of 83.66 mg/L was significantly higher at point S5, while point S2 shows the least concentration. The variations in the levels of BOD between the five sampling point might be due the run-off from agricultural activities within this area of study. Biochemical Oxygen Demand is a measure of the quan-tity of oxygen consumed by microorganisms during the decomposition of organic matter. Natural sources of or-ganic matter include plant decay and leaf fall. However, plant growth and decay may be unnaturally accelerated when nutrients and sunlight are overly abundant due to human influence. If there is a large quantity of organic waste in the water supply, there will also be a lot of bac-teria present working to decompose this waste. Oxygen consumed in the decomposition process robs other aquatic organisms of the oxygen they need to live. In this case, the demand for oxygen will be high (due to all the bacteria) so the BOD level will be high. As the waste is consumed or dispersed through the water, BOD levels will begin to decline. When BOD levels are high, dis-solved oxygen (DO) levels decrease because the bacteria are consuming the oxygen that is available in the water. Since less dissolved oxygen is available in the water, fish and other aquatic organisms may not survive. Generally, the BOD levels recorded in the entire sampling points were higher than the EU guidelines of 3.0 to 6.0 mg/L (BOD) for the protection of fisheries and aquatic life and for domestic water supply [11]. Such increased is an in-dication of wastewater discharges from settlements along the Chari-Logone and Komadugu-Yobe River courses particularly from abattoirs, hotels and hospitals into the Lake, and also from surface and ground flows that carry chemicals directly from agricultural field into the Lake [2].
4.1.7. Chemical Oxygen Demand Chemical oxygen demand (COD) of 689.00 mg/L was observed at point S5, while point S2 shows the least value of 356.00 mg/L. The COD levels observed in the present study are in consistence with the findings of earlier in-vestigators [18]. [19] also reported many fold increase of COD in downstream which ranged between 662 and 366 mg/L than upstream in summer, and decreased to 74 and 180 mg/L in rainy season in Vrishabhavathy River, Ban-galore. The chemical oxygen demand (COD) is the amount of oxygen consumed to completely chemically oxidize the organic water constituents to inorganic end
products. COD is an important, rapidly measured vari-able for the approximate determination of the organic matter content of water samples. Some water samples may contain substances that are difficult to oxidize. The least value detected at point S2 did exceed the WHO limit of 200 mg/L. The increasing trend in COD concen- tration in the five sampling point when compared to the WHO standard value is an indication of wastewater dis- charges from settlements along the Chari-Logone and Komadugu-Yobe River courses particularly from abat- toirs, hotels and hospitals into the lake, and also from surface and ground flows that carry chemicals directly from agricultural field into the Lake [2].
4.2. Concentrations of Anions
4.2.1. Nitrate Nitrate levels in the five sampling point fluctuate be-tween 60.00 and 102.50 mg/L. while that of nitrite ranged between 32.12 and 52.13 mg/L. The highest ni-trate value was observed at point S5, while point S2 shows the least value. Nitrate, a compound of nitric acid, is the most highly oxidized form of nitrogen found in aquatic environment. It is an essential nutrient for many photosynthetic autotrophs and in some instances, func-tions as a growth-limiting nutrient. It is used by algae and other aquatic plants to form plant protein which, in turn, can be used by animals to form animal protein. Nitrate is a major ingredient of farm fertilizer and is necessary for plant uptake and is essential to plant growth [20]. When it rains, varying nitrate amounts wash from farmland in to water body. Nitrates stimulate the growth of plankton that provides food for fish. This may increase the fish population. However, if algae grow too wildly, oxygen levels will be reduced and fish will die. Levels of NO3
reported in the present study also corroborates to the findings of [21] who reported average NO3 level of 58 ± 20 mg/L in the Piracicaba River in Brazil; [22] also re-ported NO3 levels in downstream and upstream of the Osun River Nigeria between 20 and 14 mg/L. [20] re-ported the levels of NO3 in the downstream and upstream fluctuate between 24 ± 1.0 and 21 ± 2.0 mg/L, of the upper Thames basin, in southern England. [23] reported average NO3 being more than two times higher in the downstream than upstream of Notwane River in south- eastern Botswana. [12] reported that NO3 concentration varied from 14 to 126 mg/L in Kathajodi River and 173 ± 6.1 and 155 ± 9 mg/L in winter and rainy reason respec-tively. [24] reported NO3 levels in winter and summer seasons were 5 and 9 mg/L in the Yamuna River in Haryana. The nitrate water quality guideline established by CCME for the protection of aquatic life is 13 mg/L. The overall nitrate levels observed in the entire sampling points exceeded the WHO limit of 45 mg/L.
Copyright © 2012 SciRes. JEP
Assessment of Pollutants in Water and Sediment Samples in Lake Chad, Baga, North Eastern Nigeria 1437
4.2.2. Phosphate The highest concentration of phosphate was observed at point S4, while point S2 shows the least concentration. Phosphates are mostly from fertilizers, pesticides, indus-try, and cleaning compounds. Natural sources include phosphate-containing rocks and solid or liquid wastes. The element phosphorus is necessary for plant and ani-mal growth. Nearly all fertilizers contain phosphates. Phosphates stimulate the growth of plankton and water plants that provide food for fish. This may increase the fish population and improve the waterway’s quality of life. If too much phosphate is present, algae grow wildly, choke the waterway, and use up large amounts of oxygen. Many fish and aquatic organisms may die. The huge ag-ricultural activities couple with the used of fertilizer, pes-ticides and other agrochemical within the study area might have been responsible for the levels of phosphate in the water samples. In waters, phosphorus is often bio-logically unavailable as it binds readily to particles. Soluble phosphorus which is available for uptake is called phosphate. In comparison with the present find-ings, [22] reported that PO4 levels fluctuate between 0.46 and 0.59 mg/L in the upstream and downstream of the Osun river, Nigeria. [23] reported that the average PO4 level in treated sewage in the downstream and upstream was 3.65 mg/L in Notwane River in south-eastern Bot-swana. Phosphates is not harmful to people or animals unless they are present in very high concentrations. The levels of phosphate in the entire water sampling points exceeded the WHO maximum permissible limit of 5 mg/L phosphate [10].
4.2.3. Sulphate Sulphate concentrations in the five sampling point ranged between 208.65 and 276.43 mg/L. Point S2 showed the lowest concentration, while the highest level of sulphate was observed at point S5. The results of the present study fell above the works of [25], who reported SO4 concen-trations in winter and summer between 39 and 58 mg/L in the Pinios River in Greece. [12] reported that SO4 were 122 ± 22 mg/L in winter and fluctutate between 103 ± 18 and 116 ± 11 mg/L in rainy and summer season, Kathajodi River in Cuttack City. [26] reported that SO4 being many fold higher in non-monsoon season than that of the monsoon (5 and 104 mg/L) in the Periyar River in Kerela. [27] reported that the average SO4 concentrations in downstream and upstream fluctuate between 112 and 182 mg/L in Llobregat River in Spain. [24] in their study reported that the concentrations of SO4 in the down-stream and upstream ranged between 14 and 80 mg/L in Yamuna River, Delhi. [20] reported that SO4 in the downstream and upstream were 18 ± 3 and 15 ± 2 mg/L in the Upper Thames Basin, Southern England. The lev-els of sulphate in the water samples in the entire sam-
pling points were above the 200 mg/L WHO maximum permissible levels [10]. The levels of chloride in water samples from the five sampling points exceeded the 30 mg/L WHO maximum permissible levels for drinking water [10].
4.3. Heavy Metals
4.3.1. Iron (Fe) The highest concentration of Fe (20.92 ± 1.55 mg/L) in the water samples was detected at point S5, while the least value of 5.12 ± 0.03 mg/L was observed at point S1. For sediment samples, point S4 shows the highest con-centration of 32.86 ± 0.11 mg/L, and the least value of 19.29 ± 3.22 mg/L was detected at point S3. Iron concen-tration was generally high in the entire sample analyzed. Although, iron is one of the essential elements in human nutrition, however, their presence at elevated concentra-tion in aquatic ecosystems, poses serious pollution and health problems. Toxicity of iron in humans has been found to bring about vomiting, cardiovascular collapse and diarrhea, while iron deficiency may lead to failure of blood clotting. Statistical analysis using Anova showed that, there was significant variation in the levels of Fe from points S1 to S5. According to WHO guideline value and maximum contaminant levels of 0.30 mg/L (water) and 15 µg/g (sediment) for Fe is acceptable. Above 0.3 mg/L and 15 µg/g might lead to pollution of the aquatic environment. From the result of this study, the concen-trations of iron in water and sediment samples exceeded the guideline limits indicating severe pollution of this porion of Lake Chad.
4.3.2. Zinc (Zn) The level of Zn in the water samples was highest at point S3, when compared to other points. The concentration of Zn in the sediment samples was significantly higher at point S3, while point S2 shows the least value. Zn plays a biochemical role in the life processes of all aquatic plants and animals; therefore, they are essential in the aquatic environment in trace amounts. Zinc is used in a number of alloys including brass and bronze, batteries, fungicides and pigments. Zinc is an essential growth element for plants and animals but at elevated levels it is toxic to some species of aquatic life [28]. In addition, Zn is in-volved in a variety of enzyme systems which contribute to energy metabolism, transcription and translation. Zinc is also potentially hazardous and excessive concentra-tions in soil lead to phytotoxicity as it is a weed killer [29,30]. Zinc is used in galvanizing steel and iron prod-ucts. Zinc carbonates are used as pesticides [29]. The concentrations of Zn in this portion of Lake Chad was observed to be higher than the permissible limits of 5 mg/L (water) and 123 µg/g (sediment) set by [31,32].
Copyright © 2012 SciRes. JEP
Assessment of Pollutants in Water and Sediment Samples in Lake Chad, Baga, North Eastern Nigeria 1438
4.3.3. Manganese (Mn) Mn concentration in water samples from the five sam-pling point was observed to be higher at point S5 (7.43 ± 1.32 mg/L), while point S2 shows the least value of 3.65 ± 0.87 mg/L. For sediment samples, point S5 shows the highest concentration (78.23 ± 2.55 µg/g), and the lowest value was detected at point S2 (43.56 ± 3.43). Manganese compounds are used in fertilizers, varnish and fungicides and as livestock feeding supplements. Manganese can be adsorbed onto soil; the extent of adsorption depends on the organic content and cation exchange capacity of the soil. It can also bioaccumulate in lower organisms (e.g., phytoplankton, algae, mollusks and some fish) but not in higher organisms; biomagnifications in food chains is not expected to be very significant [30]. The concentrations of Mn within the five sampling point from this portion of Lake Chad exceeded the permissible limit of 0.05 mg/L (water) and 30 μg/g (sediment) set by [28,32]
4.3.4. Chromium (Cr) The concentrations of Cr in the sediment samples from the five sampling point were higher than that of water samples. The highest concentration of 43.23 ± 4.33 µg/g was observed in the sediment sample from point S1. In aquatic environment, Cr is one of the bio-chemically active transition metals. Weathering of the earth crust is the primary and natural source of the chromium in the surface water. Though an essential trace nutrient and a vital component for the glucose tolerance factor, chro-mium toxicity damages the liver, lungs and causes organ hemorrhages [33]. Chromium compounds are used as pigments, mordents and dyes in the textiles and as the tanning agent in leather. Anthropogenic sources of emis-sion of Cr in the surface waters are from municipal wastes, laundry chemicals, paints, leather, road run off due to tire wear, corrosion of bushings, brake wires, ra-diators [34]. Agricultural runoff is the main anthropo-genic source of these toxic heavy metals in this portion of Lake Chad. The concentrations of Cr in water samples from this portion of Lake Chad was found to be higher than the permissible limits of 0.1 mg/L set by [28,34]. According to WHO guideline value for sediment, the concentration of 25 μg/g, Cr is acceptable [6]. The Cr concentrations in sediment samples did exceed this limit, indicating pollution of this portion of Lake Chad.
4.3.5. Copper (Cu) The levels of Cu in the water samples fluctuate between 0.41 ± 0.01 μg/g and 2.23 ± 0.02 μg/g. Point S5 shows the highest value, while the least values was observed at point S2. The highest value of Cu in the sediment sam-ples was observed at point S4 (40.32 ± 1.09 µg/g), while the least concentration of 25.11 ± 3.76 µg/g was detected at point S2. Copper is widely used in electrical wiring,
roofing, various alloys, pigments, cooking utensils, pip-ing and in the chemical industry. Copper is present in amunitions, alloys (brass, bronze) and coatings. Copper compounds are used as or in fungicides, algicides, insec-ticides and wood preservatives and in electroplating, azo dye manufacture, engraving, lithography, petroleum re-fining and pyrotechnics. Copper compounds can be added to fertilizers and animal feeds as a nutrient to sup-port plant and animal growth. Copper compounds are also used as food additives [30]. In addition, copper salts are used in water supply systems to control biological growths in reservoirs and distribution pipes and it forms a number of complexes in natural waters with inorganic and organic ligands [28]. Copper is an essential sub-stance to human life, however, in high concentrations, it can cause anaemia, liver and kidney damage, stomach and intestinal irritation [35]. Copper is generally remobi-lised with acid-base ion exchange or oxidation mecha-nism [36]. The copper concentrations in the water sam-ples in this portion of Lake Chad was found to be higher than the permissible limit of 0.05 mg/L set by [28]. The levels of copper in the sediment samples from the five sampling point were also above the [28] standard values of 25 μg/g for the survivor of aquatic organism.
4.3.6. Cadmium (Cd) The concentrations of Cd in the water samples fluctuate between 0.77 ± 0.02 μg/g and 4.21 ± 0.02 μg/g, and that of sediment samples did ranged between 9.34 ± 1.23 μg/g and 23.45 ± 5.67 μg/g. Cd values in the water sam-ples was highest at point S3, while point S4 shows the least value. Higher concentration of cadmium is ex-tremely toxic to fish population. Its effects on the growth rate have been observed even for concentrations between 0.005 and 0.01 mg/L [37].The highest levels of Cd ob-tained in water samples relative to the amount in sedi-ment in this area of study might be due to agricultural runoff, where fertilizers, pesticides and other agro-chemical are used in addition to possible release of sedi-ment bound metal. Apart from natural sources, other probable sources of this metal in surface water include leaching from Ni-Cd based batteries [38], runoff from agricultural soils where phosphate fertilizers are used [39] and other metal wastes. The levels of cadmium in the water samples from the five sampling point were above the [28] standard values of 0.01 mg/L for the survival of aquatic organism. The levels of cadmium in the sediment samples from the five sampling point were also above the [28] standard value of 6 μg/g.
4.3.7. Lead (Pb) The concentrations of Pb in the water samples ranged between 0.23 ± 0.06 and 1.23 ± 0.12 μg/g, while for sediment samples it did ranged between 22.34 ± 1.34 and
Copyright © 2012 SciRes. JEP
Assessment of Pollutants in Water and Sediment Samples in Lake Chad, Baga, North Eastern Nigeria 1439
42.12 ± 0.11 μg/g. The concentration of Pb in the water samples from this portion of Lake Chad exceeded the permissible limit of 0.05 mg/L set by [28,32]. The levels of lead in the analyzed sediment samples showed that the limiting value set by USEPA of 10 μg/g was exceeded. The level of Pb in the water samples from this portion of Lake Chad might be attributed to heavy agricultural run-off which contains fertilizers, agrochemicals and pesti-cides [40].
4.3.8. Nickel (Ni) Nickel concentrations in the water samples ranged be-tween 0.05 ± 0.01 and 0.13 ± 0.03 μg/g, while that of sediment ranged between 24.34 ± 3.10 and 47.23 ± 0.15 μg/g. Nickel is not a significant or widespread contami-nant in most of the fresh waters; only anthropogenic es-pecially industrial pollution being the prime contributor and may increase the levels of nickel in surface water [41]. The concentration of Ni in the water samples in this portion of Lake Chad exceeded the permissible limit of 0.01 mg/L set by [28]. [37] reported that the concentra-tion of nickel in Lake Vanada water results from indus-trial and urban activities and may accumulate in many types of fishes. The high concentration of Ni in the water samples from this portion of Lake Chad could be from agricultural runoff, which may carry higher concentra-tions of this metal, which arise from anthropogenic ac-tivities such as use of chemical fertilizers and pesticides in agriculture land [42]. The WHO guideline value of 20 μg/g showed that the nickel limiting levels in the sedi-ment samples was exceeded; indicating that the sediment samples were contaminated by nickel.
4.3.9. Cobalt (Co) Cobalt is an essential element which could be introduced anthropogenically into aquatic ecosystem as runoff from industrial and agricultural activities. The levels of copper in the sediment samples exceeded the WHO guideline value of 2.00 mg/L. The toxicity of potentials of copper are quite low compared to other heavy metals. However, exposure to very high doses could cause severe health effect.
Generally, the high concentrations of heavy metals in the water and sediment samples from this portion of Lake Chad is an indication of the discharges of wastewater from settlements along the Chari-Logone and Ko-madugu-Yobe River courses particularly from abattoirs, hotels and hospitals into the lake, and also from surface and ground flows that carry chemicals directly from ag-ricultural field into the Lake (Keith and Plowes, 1997). The textiles and tanneries effluents in the upstream parts of the Basin (particularly in Kano and Maroua into the Lake Chad basin might also be responsible for the high concentrations of the study metals.
5. Conclusion
Based on the results of this study, it was observed that the levels of COD, BOD, TSS, TDS, DO, nitrite, nitrate, phosphate, sulphate in the water samples exceeded the WHO standard limits with exception of pH and tempera-ture. It was also observed that the levels of all the metals in the water samples exceeded the WHO limits. However, the concentrations of all the metals in the sediment sam-ples exceeded the recommended values stipulated by WHO; indicating that the sediment samples from this portion of Lake Chad were contaminated by heavy met-als. The prolonged presence of heavy metals in the sedi-ment samples from this portion of Lake Chad might af-fect aquatic life. The results of the study implies that continuous monitoring has to be carried out to ascertain the long-term impact of anthropogenic inputs to take remedial measures so as to ensure the health of aquatic life.
REFERENCES [1] B. Abida, S. Harikrishna, K. Irfanulla, M. Ramaiah, K.
Veena and K. Vinutha, “Analysis of Flouride Level in Water and Fish Species of Sankey, Bellandur and Madi- vala Lakes of Bangalore. Rasayan,” Journal of Chemistry, Vol. 1, No. 3, 2008, pp. 596-601.
[2] J. O. Keith and D. C. H. Plowes, “Considerations of Wildlife Resources and Land Use in Chad,” USAID Technical, Paper 47, 1997.
[3] I. F. Balk and J. H. Koeman., “Future Hazards of Pesti-cide Use with Special Reference to West Africa and Southeast Asia,” IUCN Commission on Ecology, Paper No. 6. IUCN, Gland, Switzerland, 1984
[4] W. C. Mullié, P. J. Verwey, A. G. Berends, J. W. Everts, F. Sene and J. H. Koeman, “The Impact of Pesticides on Palearctic Migratory Birds in the Western Sahel,” ICBP Technical, 1991, Cambridge, pp. 37-61.
[5] R. P. Richards and D. B. Baker, “Pesticide Concentration Patterns in Agricultural Drainage Networks in the Lake Erie Basin,” Environmental Toxicology and Chemistry, Vol. 12, No. 1, 1992, pp. 13-26. doi:10.1002/etc.5620120104
[6] M. Radojevic and V. N. Bashkin, “Practical Environ-mental Analysis,” The Royal Society of Chemistry, Cam-bridge, 1999, p. 466.
[7] C. M. A. Ademoroti, “Standard Method for water and Effluents Analysis,” Foludex Press Ltd., Ibadan, 1996, pp. 22-23,44-54,111-112.
[8] HACH, “Water Analysis Handbook,” 3rd Edition, HACH Company, Loveland, 1997.
[9] R. Anon, “Standard Methods of Water and Wastewater Examination,” 18th Edition, American Public Health As-sociation, Washintong DC, 1992, pp. 2-172.
[10] DAWF, “South Africa Water Quality Guideline 1: Do-mestic Water Use,” 2nd Edition, Department of Water Affairs and Forestry, Pretoria, 1996.
Copyright © 2012 SciRes. JEP

Assessment of Pollutants in Water and Sediment Samples in Lake Chad, Baga, North Eastern Nigeria 1440
[11] D. Chapman, “Assessment of Injury to Fish Populations: Clark Fork River NPL Sites, Montana,” In: J. Lipton, Ed., Aquatic Resources Injury Assessment Report, Upper Clark Fork Riverm Basin, Montana Natural Resource Damage Assessment Program, Helena, Mont, 1993.
[12] J. Das and B. C. Acharya, “Hydrology and Assessment of Lotic Water Quality in Cuttack City, India,” Water, Air, and Soil Pollution, Vol. 150, 2003, pp. 163-175. doi:10.1023/A:1026193514875
[13] K. P. Singh, A. Malik and S. Minha, “Water Quality and Apportionment of Pollution Sources of Gomti River (In-dia) Using Multivariate Statistical Techniques—Case Study,” Analytica Chimica Acta, Vol. 538, No. 1-2, 2005, pp. 355-374. doi:10.1016/j.aca.2005.02.006
[14] H. Chang, “Spatial and Temporal Variations of Water Quality in the Han River and Its Tributaries, 1993-2002,” Water, Air, and Soil Pollution, Vol. 161, No. 1-4, 2005, pp. 267-284. doi:10.1007/s11270-005-4286-7
[15] USEPA, “Volunteer Lake Monitoring: A Methods Man-ual,” EPA 440/4-91-002, Office of Water US Environ-mental Protection Agency, Washington DC, 1999.
[16] WHO, “World Health Organization Standard for Drink-ing Water,” Guidelines for Drinking Water Quality, Vol. 1, Recommendation, France, WHO, 2002, 181 p.
[17] J. C. Akan, E. A. Moses and V. O. Ogugbuaja, “Deter- mination of Pollutant Levels in Mario Jose Tannery Ef- fluents from Kano Metropolis, Nigeria,” Journal of Ap- plied Science, Vol. 7, No. 4, 2007, pp. 527-530. doi:10.3923/jas.2007.527.530
[18] M. Cotman, J. Zagorc-Koncan and A. Drolc, “Study of Impacts of Treated Wastewater to the Krka River, Slove-nia,” Water Science and Technology, Vol. 44, No. 6, 2001, pp. 47-54.
[19] M. V. Ahipathy and E. T. Puttaiah, “Ecological Charac-teristics of Vrishabhavathy River in Banglore (India),” Environmental Geology, Vol. 49, No. 8, 2006, pp. 1217- 1222. doi:10.1007/s00254-005-0166-0
[20] P. Helen, M. Neal, J. Alison, H. Linda and H. Wickham, “Water Quality of Treated Sewage Effluent in a Rural Area of the Upper Thames Basin, Southern England, and the Impacts of Such Effluents on Riverrine Phosphorus Concentrations,” Journal of Hydrology, Vol. 304, No. 4, 2005, pp. 103-117.
[21] A. Luiza, V. Alex, L. Reynaldo, B. Plinio and P. B. De Camargo, “Effects of Sewage on the Chemical Composi-tion of Piracicaba River Brazil,” Water, Air, and Soil Pollution, Vol. 110, 1999, pp. 67-79.
[22] A. A. Olajire and F. E. Imeokparia, “Water Quality As- sessment of Osun River: Studies on Inorganic Nutrients,” Environmental Monitoring and Assessment, Vol. 69, No. 1, 2001, pp. 17-28. doi:10.1023/A:1010796410829
[23] N. Mladenov, K. Strzepek and O. M. Serumola, “Water Quality Assessment and Modeling of an Effluentdomi- nated Stream, the Notwane River, Botswana,” Environ- mental Monitoring and Assessment, Vol. 109, No. 1-3, 2005, pp. 97-121. doi:10.1007/s10661-005-5842-8
[24] K. Ravindra, M. Ameena, R. Monika and A. Kaushik, “Seasonal Variations in Physoico-Chemical Characteris-
tics of River Yamuna in Haryana and Its Ecological Best Design Use,” Journal of Environmental Monitoring, Vol. 5, No. 3, 2005, pp. 419-426. doi:10.1039/b301723k
[25] K. Fytianos, A. Siumka, G. A. Zachariadis and S. Beltsios, “Assessment of the Quality Characteristics of Pinios River, Greece,” Water, Air, and Soil Pollution, Vol. 136, 2001, pp. 317-327. doi:10.1023/A:1015299130443
[26] K. Maya, K. N. Babu, D. Pabdmalal and P. Seralathan, “Hydrochemistry and Dissolved Nutrient Flux of Two Small Catchments Rivers, South-Western India,” Journal of Chemical Ecology, Vol. 23, No. 1, 2007, pp. 13-27. doi:10.1080/02757540601084029
[27] G. Fernandez and P. Moro, “Annual Performance of a Full Scale Activated-Sludge Plant, Biotic Components and New Criteria for Process Assessment,” Bioresource Technology, Vol. 38, 1991, pp. 7-14.
[28] WHO, “World Health Organization standard for Drinking Water,” Guidelines for Drinking Water Quality, Vol. 1, Recommendation, France, WHO, 2004, 181 p.
[29] B. Anglin-Brown, A. Armour-Brown and G. C. Lalor, “Heavy Metal Pollution in Jamaica 1: Survey of Cad-mium, Lead and Zinc Concentrations in the Kintyre and Hope Flat Districts,” Environmental Geochemistry and Health, Vol. 17, 1995, pp. 51-56.
[30] S. A. Abbasi, N. Abbasi and R. Soni, “Heavy Metals in the Environment,” Mittal Publications, Delhi, 1998, p. 314.
[31] CPCB, “Central Pollution Control Board, Review of Wa-ter Quality Objectives, Requirements and Zoning and Classification for Indian Water Bodies,” Government of India, Delhi, 2000, pp. 11-17.
[32] USEPA, “Risk Assessment: Technical Background In-formation,” 2002. http://www.epa.gov./reg3hwmd/risk
[33] E. J. O’Flaherty, “Chromium Toxicokinetics,” In: R. A. Goyer and M. G. Clerian, Eds., Toxicology of Metals: Biochemical Aspects, Springer-Verlag, Heidelberg, 1995, pp. 315-328.
[34] S. Dixit and S. Tiwari, “Impact Assessment of Heavy Metal Pollution of Shahpura Lake, Bhopal, India,” Inter-national Journal of Environmental Research, Vol. 2, No. 1, 2008, pp. 37-42.
[35] J. R. Turnland, “Copper Nutrition, Bioavailabilty and Influence of Dietary Factors,” Journal of American Die- tetic Association, Vol. 1, 1988, pp. 303-308.
[36] A. J. L. Gomez, I. Giráldez, D. Sánchez-rodas and E. Morales, “Comparison of the Feasibility of Three Extrac- tion Procedures for Trace Metal Partitioning in Sediments from South West Spain,” Science of the Total Environ- ment, Vol. 246, No. 2-3, 2000, pp. 271-283. doi:10.1016/S0048-9697(99)00468-4
[37] W. J. Green, D. E. Canfield, G. F. Lee and R. A. Jones, “Mn, Fe, Cu and Cd Distribution and Residence Times in Closed Basin Lake Vanada (Wright Vally, Antatica),” Hydrobiologia, Vol. 134, No. 3, 1986, pp. 237-248. doi:10.1007/BF00008492
[38] M. Hutton, R. L. Chaney, C. R. Krishna, M. Murti, A. Olade and A. L. Page, “Groups Report,” In: T. C. Hut-
Copyright © 2012 SciRes. JEP
Assessment of Pollutants in Water and Sediment Samples in Lake Chad, Baga, North Eastern Nigeria
Copyright © 2012 SciRes. JEP
1441
chinson and K. M. Meena, Eds., Lead, Mercury, Cad-mium and Arsenic in the Environment, John Wiley, New York, 1999, pp. 35-41.
[39] M. Stoeppler, “Cadmium,” In: E. Merian, Ed., Metals and Their Compounds in the Environment: Occurrence, Anal- ysis and Biological Relevance, CCH, New York, 1991, pp. 803-851.
[40] I. M. Banat, E. S. Hassan, M. S. El-Shahawi and A. H. Abu-Hilal, “Postgulf-War Assessment of Nutrients, Hea- vy Metal Ions, Hydrocarbons, and Bacterial Pollution Levels in the United Arab Emirates Coastal Waters,” En- vironment International, Vol. 24, No. 2, 1998, pp. 109-
116. doi:10.1016/S0160-4120(97)00127-X
[41] R. Srikanth, A. M. Rao, C. S. Kumar and A. Khanum, “Lead, Cadmium, Nickel, and Zinc Contamination of Ground Water around Hussain Sagar Lake, Hyderabad, India,” Bulletin of Environmental Contamination and Toxicology, Vol. 50, No. 1, 1993, pp. 138-143. doi:10.1007/BF00196552
[42] N. Rajmohan and L. Elango, “Distribution of Iron, Man- ganese, Zinc and Atrazine in Groundwater in Parts of Palar and Cheyyar River Basins, SouthIndia,” Environ- mental Monitoring and Assessment, Vol. 107, No. 1-3, 2005, pp. 115-131. doi:10.1007/s10661-005-5307-0