assessment of empirical equations for the compression index of fine grained soils in missouri
DESCRIPTION
ARTICLETRANSCRIPT
ORIGINAL PAPER
Assessment of empirical equations for the compression indexof fine-grained soils in Missouri
Site Onyejekwe • Xin Kang • Louis Ge
Received: 10 February 2014 / Accepted: 7 August 2014
� Springer-Verlag Berlin Heidelberg 2014
Abstract The use of correlations and empirical relation-
ships in geotechnical engineering provides a fast, cost-
effective means of predicting the value of a parameter
based on the values of certain other, possibly more easily
determined, parameters. The correlation between two or
more soil properties has been found to be dependent in
varying degrees on soil type, the testing method used to
obtain the numerical value of the parameter itself and the
homogeneity of the soil. Many empirical correlations
among soil properties have been published. These corre-
lations, based on widely sourced data, may not be appro-
priate for local situations. Hence, there is a need for
correlations that are based on local data. This paper eval-
uated the validity of published empirical equations for the
index of fine-grained soils in Missouri, USA. Four indices
were used in the assessment including the root mean square
error, the ratio of the estimated to laboratory-determined
compression index, the ranking index and the ranking
distance. Results reveal the overall best correlations for the
Southeast Region and ‘‘Other Regions’’ of Missouri are
given by Azzouz et al. (Soils Found 16:19–29, 1976).
Keywords Fine-grained soils � Compression Index �Index properties � Correlations � Ranking distance �Ranking Index � RMSE
Introduction
Correlations and empirical relationships are used exten-
sively in geotechnical engineering. The use of correla-
tions and empirical relationships provides a fast, cost-
effective means of predicting the value of a parameter
based on the values of some other, possibly more easily
determined, parameters provided that the appropriate
correlations are employed. Generally, the more easily
obtained parameters are correlated to the difficult-to-
obtain parameters. The correlation between two or more
soil properties has been found to be dependent in varying
degrees on soil type, the testing method used to obtain
the numerical value of the parameter itself and the
homogeneity of the soil (Uzielli et al. 2007). Many cor-
relations between soil properties have been published. A
publication by Kulhawy and Mayne (1990) presents over
50 such correlations.
Knowledge of the consolidation properties of a soil is
important in geotechnical design, particularly as they relate
to settlement of structures. These properties are determined
from the standard consolidation test, i.e., incremental
loading test (ASTM D2435-11 2011) or constant rate of
strain test (ASTM D4186-12 2012). The incremental
loading test is the predominantly test method used. Using
either test method, consolidation properties are usually
determined in terms of the compression index, Cc and the
coefficient of consolidation, Cv. Cc is used to predict the
magnitude of settlement and Cv, a rate parameter, is used to
predict the rate of settlement (i.e., time required for an
S. Onyejekwe
Road Sector Development Team, Federal Ministry of Works,
Abuja, Nigeria
e-mail: [email protected]
X. Kang
Department of Civil, Architectural, and Environmental
Engineering, Missouri University of Science and Technology,
Rolla, MO 65409, USA
e-mail: [email protected]
L. Ge (&)
Department of Civil Engineering, National Taiwan University,
Taipei, Taiwan
e-mail: [email protected]
123
Bull Eng Geol Environ
DOI 10.1007/s10064-014-0659-8
amount of settlement to occur). However, the cost of
consolidation testing is relatively high compared to other
common engineering tests and may be considered cost-
prohibitive for very small projects. Hence it is cost effec-
tive to develop correlations between consolidation prop-
erties and other easily obtained properties, like the index
properties.
In view of the cost implications of the consolidation test,
investigators have correlated the consolidation properties
of soils and other easily and cheaply obtained properties,
like the index properties. Skempton (1944) presented the
first well-known correlation between Cc and liquid limit,
LL for remolded soils:
Cc ¼ 0:007 ðLL� 10Þ ð1Þ
Many correlations between consolidation properties and
index properties have been developed by several investi-
gators based upon this first correlation (e.g., Cozzolino
Table 1 Some correlations
between index properties and
consolidation parameters
NC normally consolidated
* Identifier for correlationsreviewed in this paper
Correlation * Applicability References
Cc = 0.01wn A All clays Koppula (1981)
Cc = 0.01(wn - 7.549) B Clays Rendon-Herrero (1983)
Cc = 0.0115wn C Organic silt and clays Bowles (1979)
Cc = 0.01(wn - 5) D All clays Azzouz et al. (1976)
Cc = 0.006(LL - 9) E All clays with LL \ 100 % Azzouz et al. (1976)
Cc = 0.008(LL - 12) F All clays Sridharan and Nagaraj (2000)
Cc = 0.009(LL - 10) G All clays Terzaghi and Peck (1967)
Cc = 0.063(LL - 10) Egyptian clay Mahmoud and Abdrabbo(1990)
Cc = 0.048(LL - 10) Brazilian clays Bowles (1979)
Cc = 0.007(LL - 10) Remoulded clays Skempton (1944)
Cc = 0.0046(LL - 9) Brazilian clays Cozzolino (1961)
Cc = 0.009(LL - 10) NC clays Terzaghi and Peck (1967)
Cc = 0.009(LL - 8) Osaka Bay clay Tsuchida (1991)
Cc = 0.009LL Tokio Bay clay Tsuchida (1991)
Cc = 0.008(LL - 12) All clays Sridharan and Nagaraj (2000)
Cc = 0.007(SI ? 18) All clays Sridharan and Nagaraj (2000)
Cc = 0.014(PI ? 3.6) H All clays Sridharan and Nagaraj (2000)
Cc = PI/74 I All Clays Wroth and Wood (1978)
Cc = 0.29(e0 - 0.27) J Inorganic soils Hough (1957)
Cc = 0.35(e0 - 0.5) K Organic soils Hough (1957)
Cc = 0.156e0 ? 0.0107 L All clays Bowles (1979)
Cc = 1.15(e - e0) All clays Nishida (1956)
Cc = 0.29(e0 - 0.27) Inorganic soils Hough (1957)
Cc = 0.35 (e0 - 0.5) Organic soils Hough (1957)
Cc = 0.246 ? 0.43 (e0 - 0.25) Motley clays: Sao Paulo,Brazil
Cozzolino (1961)
Cc = 1.21 ? 1.055 (e0 ? 1.87) Lowland of Santos, Brazil Cozzolino (1961)
Cc = 0.75(e0 - 0.5) Soils with low plasticity Sowers (1970)
Cc = 0.208e0 ? 0.0083 Chicago clays Bowles (1979)
Cc = 0.156e0 ? 0.0107 All clays Bowles (1979)
Cc = 0.2343(LL/100) Gs M All clays Nagaraj and Murty (1985)
Cc = 0.2926(LL/100) Gs N All clays Nagaraj and Murty (1985)
Cc = 0.5 Gs(PI/100) O All Clays Wroth and Wood (1978)
Cc = 0.009wn ? 0.005LL P All Clays Koppula (1981)
Cc = 0.037(e0 ? 0.003LL - 0.34) Q Clays: Greece, parts of USA Azzouz et al. (1976)
Cc = -0.156 ? 0.411e0
? 0.00058LLR All Clays Al-Khafaji and Andersland
(1992)
Cc = 0.048(e0 ? 0.001wn - 0.25) Clays: Greece, parts of USA Azzouz et al. (1976)
Cc = 0.37(e0 ? 0.003LL? 0.0004wn - 0.34)
Clays: Greece, parts of USA Azzouz et al. (1976)
S. Onyejekwe et al.
123
1961; Terzaghi and Peck 1967; Azzouz et al. 1976; Ogawa
and Matsumoto 1978; Bowles 1979, 1996; Mahmoud and
Abdrabbo 1990; Carrier 1985; Sridharan and Nagaraj
2000). The compressibility characteristics of a soil can be
correlated to other soil properties such as natural water
content (wn), dry unit weight of soil (d), natural void ratio
(e0), liquid limit (LL), plastic limit (PL), plasticity index
(PI), liquidity index (LI), activity (ACT), the passing per-
centage of 2 lm fines and the specific gravity of soil par-
ticles (Gs), among others; hence, numerous correlations
between consolidation properties and these and other
properties have been developed. The choice of the property
for correlation seems to be dependent on the test soil, test
conditions (including the data availability) and type of
analyses executed. Azzouz et al. (1976) presented several
correlations between Cc and Cr and index properties.
Investigators such as Giasi et al. (2003), Sridharan and
Nagaraj (2000), Ozer et al. (2008) and others present
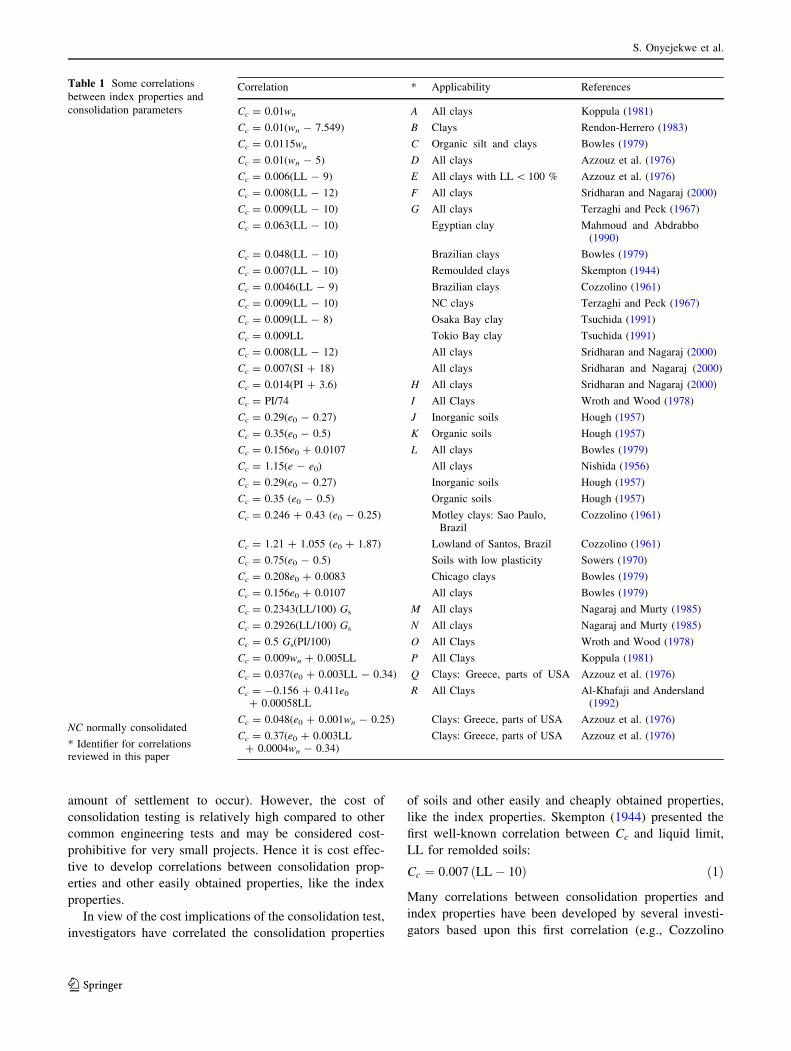
several correlations between Cc and index properties. Some
of these correlations are presented in Table 1.
The rather large number of correlations and the
equally large number of different parameters considered
in these correlations indicates variability exists when
these correlations are used. This may be due to corre-
lations being developed based on site-specific data and/or
widely sourced data. Hence, the use of these correlations
may not result in efficient, cost-effective outcomes in a
local situation. Consequently, this paper assesses the
validity of some of these correlations between the
compression index and index properties for fine-grained
soils in Missouri.
Data
Data for this study were obtained principally from the
Missouri Transportation Geotechnics Research Program
(MTGRP) and Missouri Department of Transportation
(MoDOT) geotechnical database. Data was obtained from
laboratory tests on undisturbed samples from five loca-
tions: North Kansas City (Clay County); Warrensburg
(Johnson County); New Florence (Montgomery County);
St. Charles (St. Charles County); and Hayti (Pemiscot
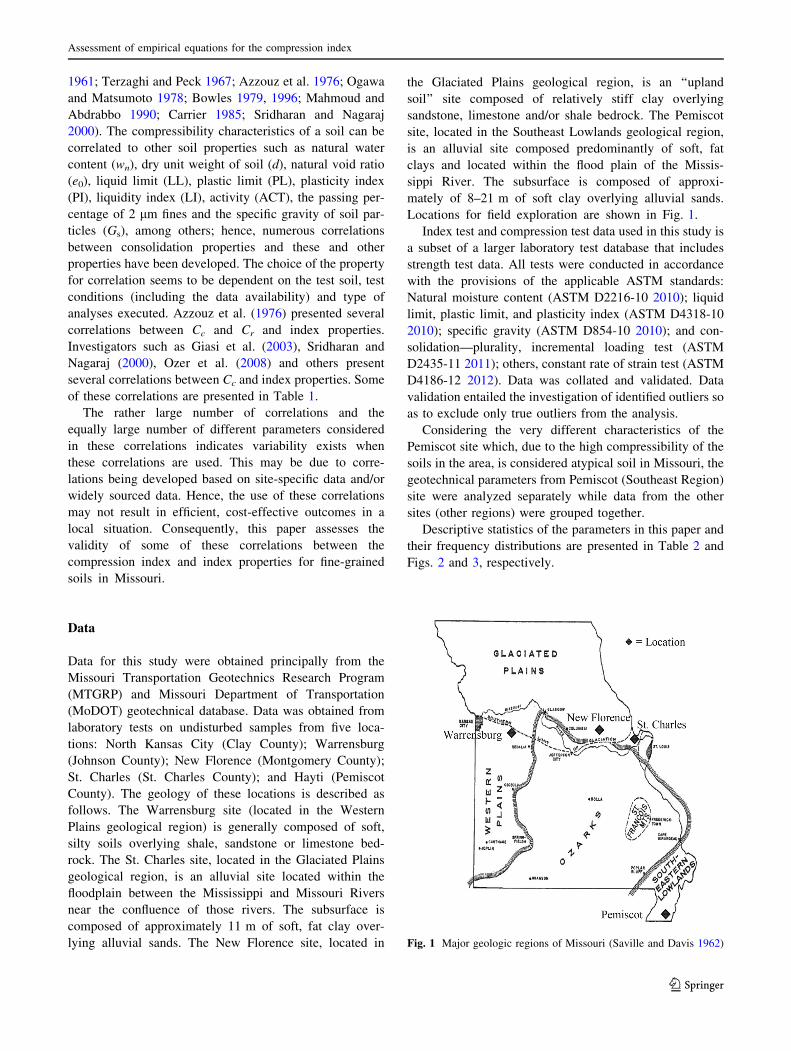
County). The geology of these locations is described as
follows. The Warrensburg site (located in the Western
Plains geological region) is generally composed of soft,
silty soils overlying shale, sandstone or limestone bed-
rock. The St. Charles site, located in the Glaciated Plains
geological region, is an alluvial site located within the
floodplain between the Mississippi and Missouri Rivers
near the confluence of those rivers. The subsurface is
composed of approximately 11 m of soft, fat clay over-
lying alluvial sands. The New Florence site, located in
the Glaciated Plains geological region, is an ‘‘upland
soil’’ site composed of relatively stiff clay overlying
sandstone, limestone and/or shale bedrock. The Pemiscot
site, located in the Southeast Lowlands geological region,
is an alluvial site composed predominantly of soft, fat
clays and located within the flood plain of the Missis-
sippi River. The subsurface is composed of approxi-
mately of 8–21 m of soft clay overlying alluvial sands.
Locations for field exploration are shown in Fig. 1.
Index test and compression test data used in this study is
a subset of a larger laboratory test database that includes
strength test data. All tests were conducted in accordance
with the provisions of the applicable ASTM standards:
Natural moisture content (ASTM D2216-10 2010); liquid
limit, plastic limit, and plasticity index (ASTM D4318-10
2010); specific gravity (ASTM D854-10 2010); and con-
solidation—plurality, incremental loading test (ASTM
D2435-11 2011); others, constant rate of strain test (ASTM
D4186-12 2012). Data was collated and validated. Data
validation entailed the investigation of identified outliers so
as to exclude only true outliers from the analysis.
Considering the very different characteristics of the
Pemiscot site which, due to the high compressibility of the
soils in the area, is considered atypical soil in Missouri, the
geotechnical parameters from Pemiscot (Southeast Region)
site were analyzed separately while data from the other
sites (other regions) were grouped together.
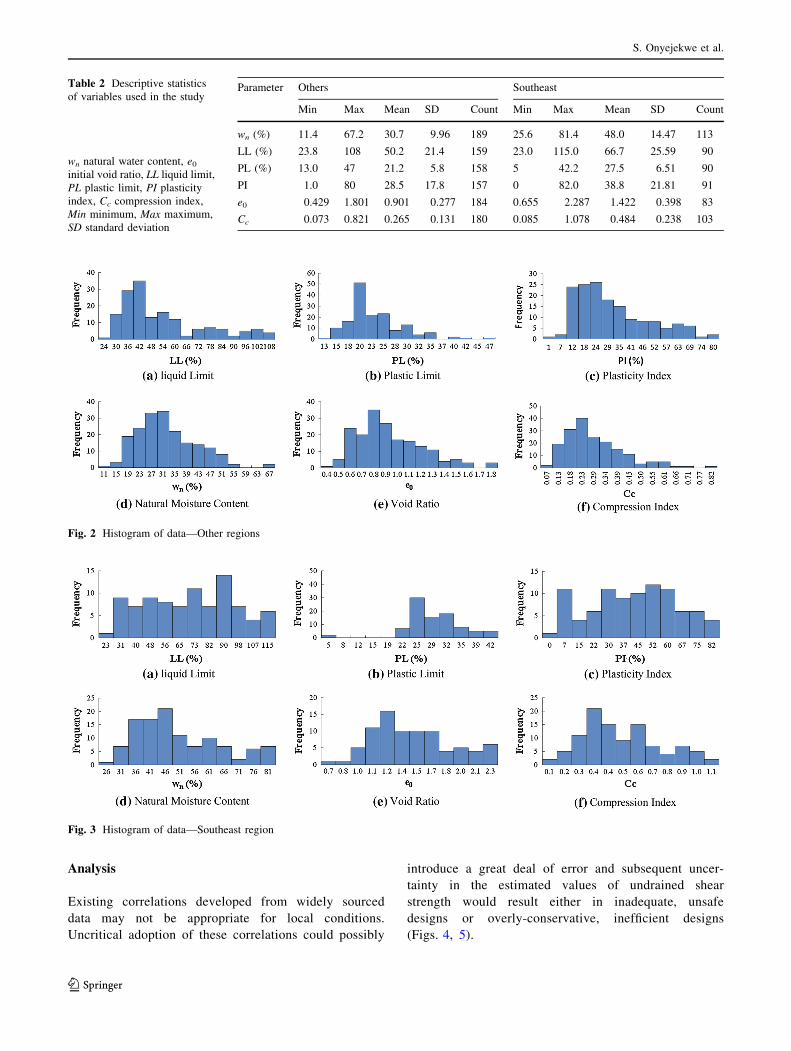
Descriptive statistics of the parameters in this paper and
their frequency distributions are presented in Table 2 and
Figs. 2 and 3, respectively.
Fig. 1 Major geologic regions of Missouri (Saville and Davis 1962)
Assessment of empirical equations for the compression index
123
Analysis
Existing correlations developed from widely sourced
data may not be appropriate for local conditions.
Uncritical adoption of these correlations could possibly
introduce a great deal of error and subsequent uncer-
tainty in the estimated values of undrained shear
strength would result either in inadequate, unsafe
designs or overly-conservative, inefficient designs
(Figs. 4, 5).
Fig. 2 Histogram of data—Other regions
Fig. 3 Histogram of data—Southeast region
Table 2 Descriptive statistics
of variables used in the study
wn natural water content, e0
initial void ratio, LL liquid limit,
PL plastic limit, PI plasticity
index, Cc compression index,
Min minimum, Max maximum,
SD standard deviation
Parameter Others Southeast
Min Max Mean SD Count Min Max Mean SD Count
wn (%) 11.4 67.2 30.7 9.96 189 25.6 81.4 48.0 14.47 113
LL (%) 23.8 108 50.2 21.4 159 23.0 115.0 66.7 25.59 90
PL (%) 13.0 47 21.2 5.8 158 5 42.2 27.5 6.51 90
PI 1.0 80 28.5 17.8 157 0 82.0 38.8 21.81 91
e0 0.429 1.801 0.901 0.277 184 0.655 2.287 1.422 0.398 83
Cc 0.073 0.821 0.265 0.131 180 0.085 1.078 0.484 0.238 103
S. Onyejekwe et al.
123
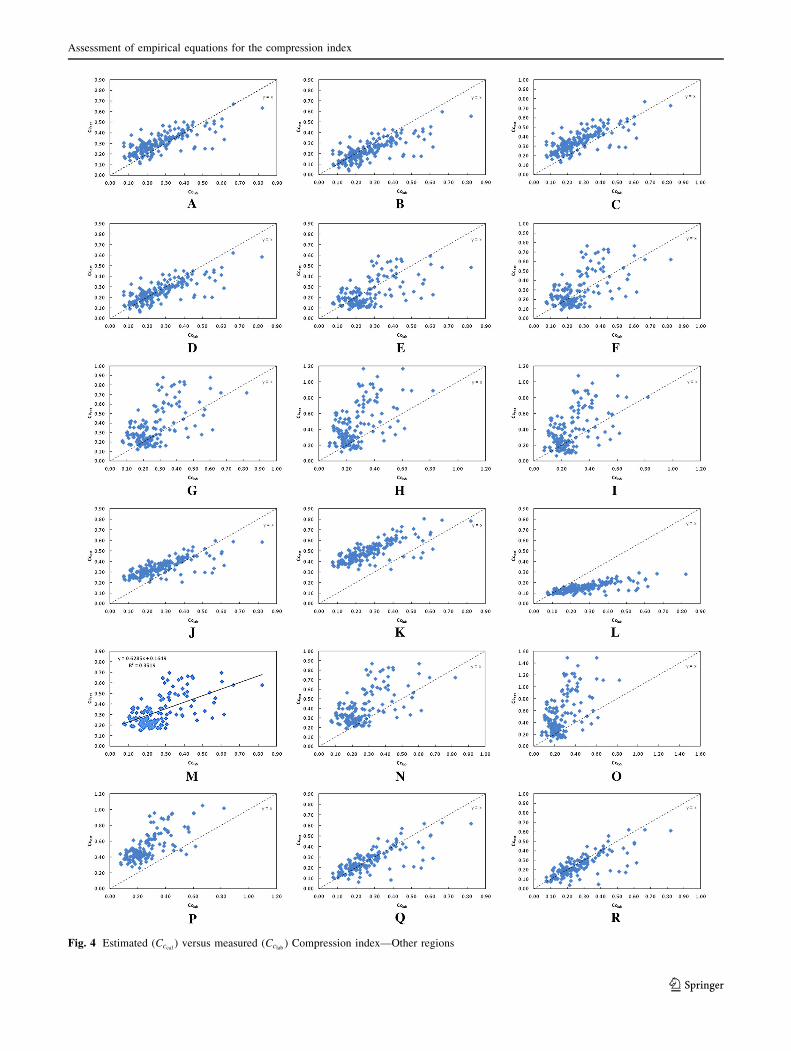
Fig. 4 Estimated (Cccal) versus measured (Cclab
) Compression index—Other regions
Assessment of empirical equations for the compression index
123
Analysis in this paper is focused on assessing the
uncertainty associated with applying the existing correla-
tions to the data on fine-grained soils from Missouri.
Uncertainty in geotechnical properties can be formally
grouped into two classes: aleatory and epistemic uncer-
tainty (Lacasse and Nadim 1996; Whitman 1996; DNV
2007). Aleatory uncertainty represents the natural ran-
domness of a property and hence is a function of the spatial
variability of the soil property. Epistemic uncertainty
results from lack of information and shortcomings in
measurement and/or calculation; for example, systematic
error resulting from factors such as the methods of property
measurement, quantity of available data and modeling
errors. Analysis in this case is aimed at model-related
epistemic uncertainty.
Table 1 shows a preponderance of linear correlations
based on the value of a single index property. Some of the
most commonly used correlations are those based on liquid
limit, one of the most easy-to-obtain index properties.
Compressibility and liquid limit of a soil can be correlated
in that they both relate to the nature and mineralogical
composition of the soil. LL, the moisture content at which a
soil becomes a semi-solid, is a measure of the quantity of
water attracted by the soil particles. Compressibility is
related to the size of its constituent particles and hence its
mineralogy.
The reliability of LL-based correlations has been ques-
tioned by some investigators (Cherubini 1991; Al-Khafaji
and Andersland 1992; Sridharan and Nagaraj 2000). Soils
having the same liquid limit but different plastic and
shrinkage limits have been shown to have a different
compressibility (Sridharan and Nagaraj 2000). It is
expected that the liquid limit does not fully represent the
plasticity characteristics of soil. In order to use a more
representative plasticity parameter and improve the reli-
ability, investigators have developed correlations based on
the plasticity (Wroth and Wood 1978; Sridharan and
Nagaraj 2000) and shrinkage (Sridharan and Nagaraj 2000)
indices. The shrinkage index (SI) is the difference between
the shrinkage limit and the liquid limit (SI = SL–LL).
Sridharan and Nagaraj (2000) showed that the shrinkage
index yields the best correlation with compressibility
characteristics. However, the SI was not determined in this
study.
Table 1 also shows a number of correlations based on
initial void ratio (e0). The initial void ratio is generally used
to define the compressibility of a soil. The initial void ratio
is representative of the in situ state of the soil and also
describes the structure of the soil through its geologic
history. Unlike the void ratio, liquid limit and plasticity
properties do not take into account the stress history of the
soil. Hence, an ideal correlation between Cc and index
properties will include parameters that account for both the
soils’ initial state and soil type; i.e., the ideal correlation is
a multi-parameter correlation. This is particularly true for
undisturbed samples.
Several multi-parameter correlations are presented in
Table 1. Correlations that are based on multiple regressions
are more accurate in estimating the compression index
(Azzouz et al. 1976; Sridharan and Nagaraj 2000; Giasi
et al. 2003). However, in order to obtain reliable multiple
parameter regression-based correlations the variables con-
sidered must be absolutely independent of each other and
the physical significance of the mathematical operation
must be taken into consideration (Li and White 1993;
Cherubini and Giasi 2000; Giasi et al. 2003). Hence, cor-
relations such as those that contain e0 and cd, e0 and wn are
unreliable as those parameters are related and not
independent.
Considering the foregoing, a number of single-parame-
ter (wn, LL, PL, e0) and multi-parameter (LL, Gs; PI, Gs;
wn, LL; e0, LL) correlations were selected for review.
Single-parameter correlations were selected on the basis of
their being in popular use. Multi-parameter correlations
were selected on the basis of the independence of their
constituent parameters. Correlations for review were also
selected on the basis of their applicability. Most of the
selected correlations are applicable to all clays. Two cor-
relations applicable to organic clays were selected due to
the organic nature of the soils in the southeast region of
Missouri.
The validity of the selected correlations was assessed on
the basis of four criteria: root mean square error (RMSE);
the first (mean) and second moment (standard deviation)
statistics of the ratio of the estimated to laboratory-deter-
mined compression index, K; ranking index; and ranking
distance. Descriptions of these criteria are listed as follows.
RMSE is the square root of the average the squared
difference between the values calculated using a correla-
tion and the corresponding observed values determined
from laboratory tests. Errors in RMSE are squared before
they are averaged; consequently, relatively high weight is
given to large errors. This means the RMSE is most useful
when large errors are particularly undesirable. The RMSE
has been used by investigators (e.g., Alvarez Grima and
Babuska 1999; Finol et al. 2001; Gokceoglu 2002; Yılmaz
2006; Ozer et al. 2008) to evaluate the performance of
empirical equations. RMSE is determined using the fol-
lowing formulae:
RMSE ¼ffiffiffiffiffiffiffiffiffiffiffiffiffiffiffiffiffiffiffiffiffiffiffiffiffiffiffiffiffiffiffiffiffiffiffiffiffiffiffi
1
n
X
n
1
ðCcest� Cclab
Þ2s
ð2Þ
where n is the number of data points, Cccalis the com-
pression index calculated from empirical equations, Cclabis
the compression index determined directly from laboratory
S. Onyejekwe et al.
123
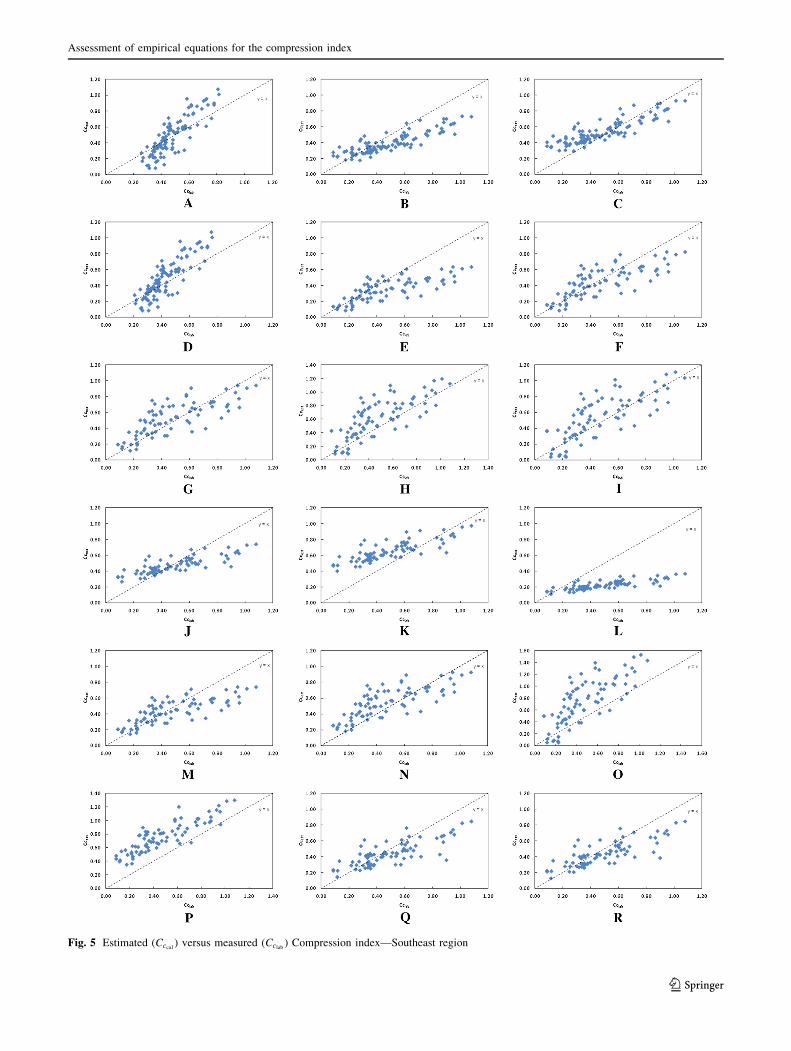
Fig. 5 Estimated (Cccal) versus measured (Cclab
) Compression index—Southeast region
Assessment of empirical equations for the compression index
123
tests. The lower the RMSE value, the better the model
performance.
The first (mean) and second moment (standard devia-
tion) statistics of the ratio of the estimated compression
index to the laboratory-determined compression index is
denoted by K, which is determined using the formulae:
K ¼ Cccal
Cclab
ð3Þ
where Cccalis the predicted compression index and Cclab
is
the laboratory-determined compression index. The accu-
racy of a method is its ability to predict the laboratory-
determined compression index; it is represented by the
mean of K (Briaud and Tucker 1988; Cherubini and Orr
2000; Giasi et al. 2003). The precision of a method refers to
the scatter around the mean; it is quantified by the standard
deviation of K (Briaud and Tucker 1988; Cherubini and Orr
2000; Giasi et al. 2003). Theoretically, K ranges from a
minimum of 0 to a maximum of infinity with an optimum
value of one. This results in a nonsymmetric distribution of
K around the mean, which does not give an equal weight of
underprediction and overprediction (Briaud and Tucker
1988). The first and second moment statistics of K have
been used by several investigators (e.g., Titi and Abu-
Farsakh 1999; Abu-Farsakh and Titi 2004; Cherubini and
Orr 2000; Orr and Cherubini 2003; Cherubini and Giasi
2000; Giasi et al. 2003) to evaluate the performance of
empirical equations.
The ranking index (RI) is one of the two methods pro-
posed by Briaud and Tucker (1988) to alleviate the prob-
lem of nonsymmetrical distribution of K data. The other
being presenting the results for all methods in the form of
log normal distribution curves. Hence, with RI it is possible
to express an overall judgment on the quality of a corre-
lation while taking into consideration the mean value and
the standard deviation of all the K data. The ranking index
is determined using the formulae (Briaud and Tucker
1988):
RI ¼ lðln½K�Þ
�
�
�
�
�
�þ sðln½K�Þ ð4Þ
where l and s represent the mean and standard deviation of
the series of analyzed data, respectively. RI has been used
by several investigators (e.g., Briaud and Tucker 1988;
Cherubini and Orr 2000; Orr and Cherubini 2003; Cheru-
bini and Giasi 2000; Giasi et al. 2003) to evaluate the
performance of empirical equations.
Ranking distance (RD), proposed by Cherubini and Orr
(2000), is another method of expressing an overall judg-
ment on the quality of a calculation method that takes into
consideration the mean value and the standard deviation of
all the K data. RD represents, on a plot with mean (l)
values on the x axis and standard deviation (s) on the y axis,
the distance of the point representing a computation using a
particular correlation from the point representing the
optimum condition (l = 1 and s = 0). RD is determined
using the formulae (Cherubini and Orr 2000):
RD ¼ffiffiffiffiffiffiffiffiffiffiffiffiffiffiffiffiffiffiffiffiffiffiffiffiffiffiffiffiffiffiffiffiffiffiffiffiffiffiffiffiffi
ð1� lðKÞÞ2 þ ðsðKÞÞ2q
ð5Þ
where l and s represent the mean and standard deviation of
the series of analyzed data respectively. RD and RI provide
a different evaluation of the suitability of a given correla-
tion equation to fit a measured value (Cherubini and Orr
2000). For correlation equations where the precision,
indicated by the standard deviation, mean value and the
accuracy are similar, RD gives a better result than RI, while
for those that are either very accurate or very precise RI
gives the best result. RD gives equal weight to accuracy
and precision. RD has been used by several investigators
(Cherubini and Orr 2000; Cherubini and Giasi 2000; Orr
and Cherubini 2003; Giasi et al. 2003) to evaluate the
performance of empirical equations.
Results and discussion
A summary of the results of the RMSE, K, RI and RD
analysis for the ‘‘Other Regions’’ and Southeast Region of
Missouri are presented in Tables 3 and 4, respectively. The
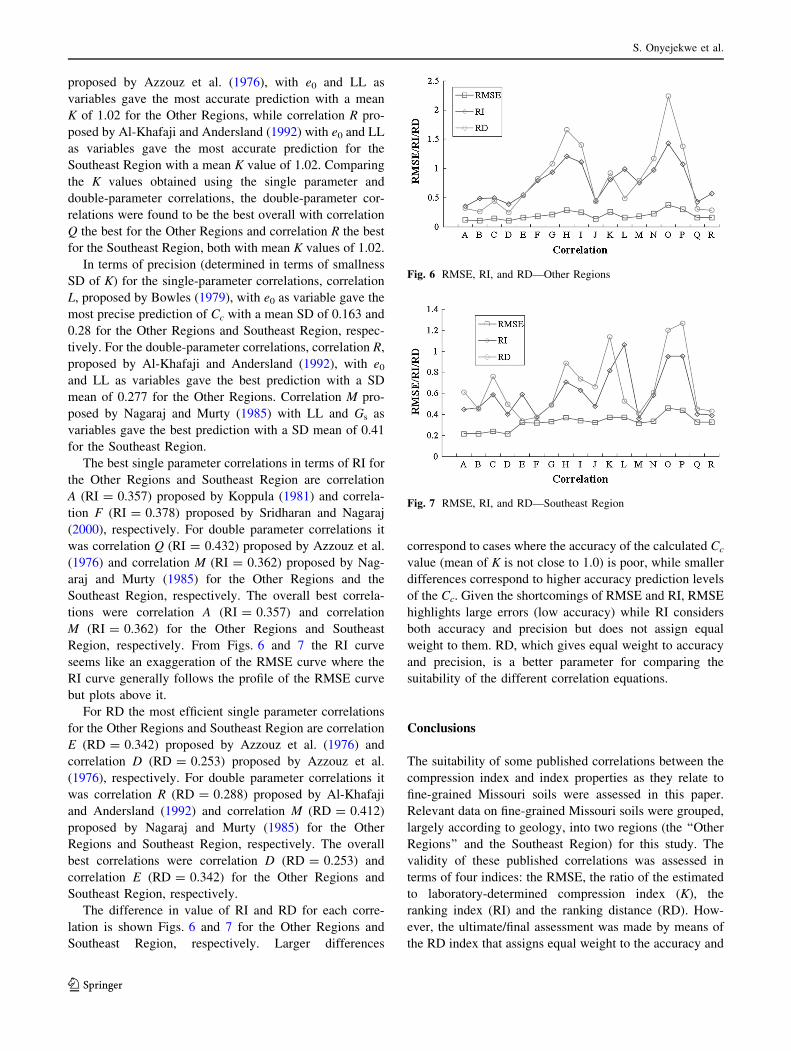
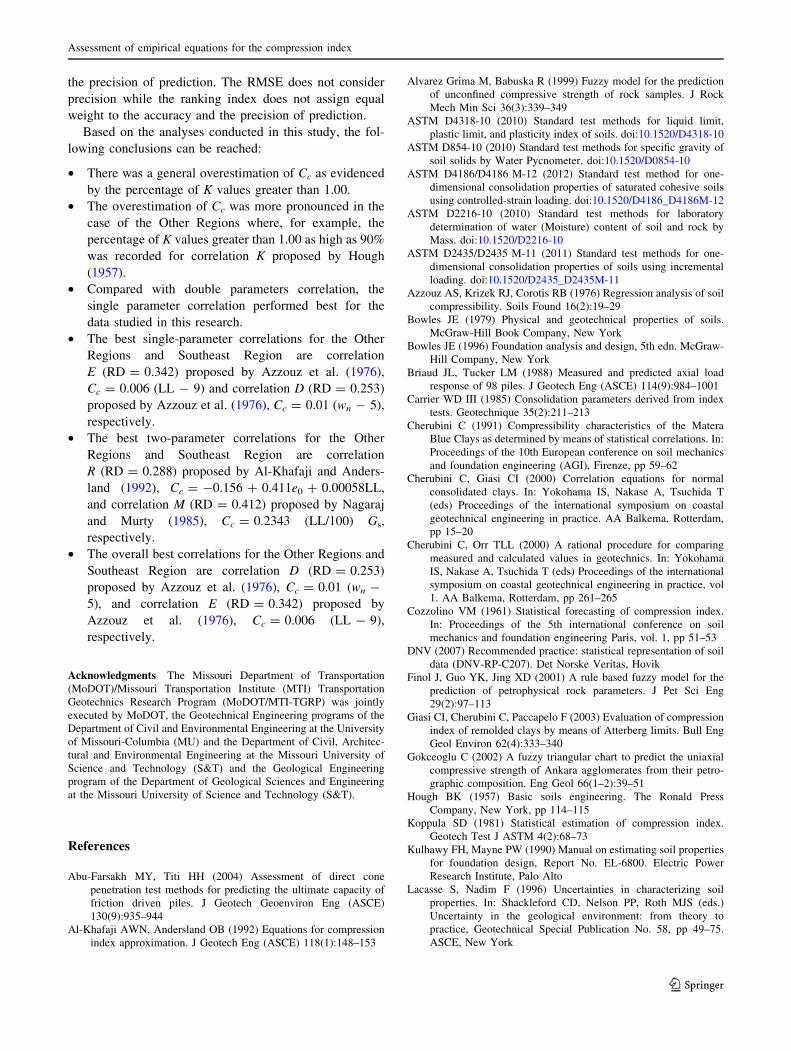
results of the RMSE, RI and RD analysis for the Other
Regions and Southeast Region are presented graphically in
Figs. 6 and 7, respectively.
In terms of RMSE, for the single-parameter correlations,
correlation D, proposed by Azzouz et al. (1976), with wn as
variables gave the best performance with RMSE of 0.107
and 0.213 for the Other Regions and Southeast Region, as
shown by the K values in Tables 3 and 4, respectively.
Among the double-parameter correlations, correlation Q,
proposed by Azzouz et al. (1976), with e0 and LL as
variables gave the best performance with RMSE of 0.159
for Other Regions. Correlation M proposed by Nagaraj and
Murty (1985) with LL and Gs as variables gave the best
performance with RMSE of 0.317 for the Southeast
Region. The overall best performing correlation was cor-
relation D for Other Regions (RMSE = 0.107) and the
Southeast Region (RMSE = 0.213).
There was a general overestimation (K [ 1) of Cc par-
ticularly for the Other Regions; eight out of twelve single
parameter correlations and four out of six double parameter
correlations had over 50 % of the K values greater than 1.
Correlation K had the highest mean K value (over 90 %
were larger than 1) while over 70 % of the K values (mean)
in correlations A, C, J, N and P were greater than 1. A
similar overestimation, but of a lower magnitude, was
observed for the Southeast Region where four out of twelve
S. Onyejekwe et al.
123
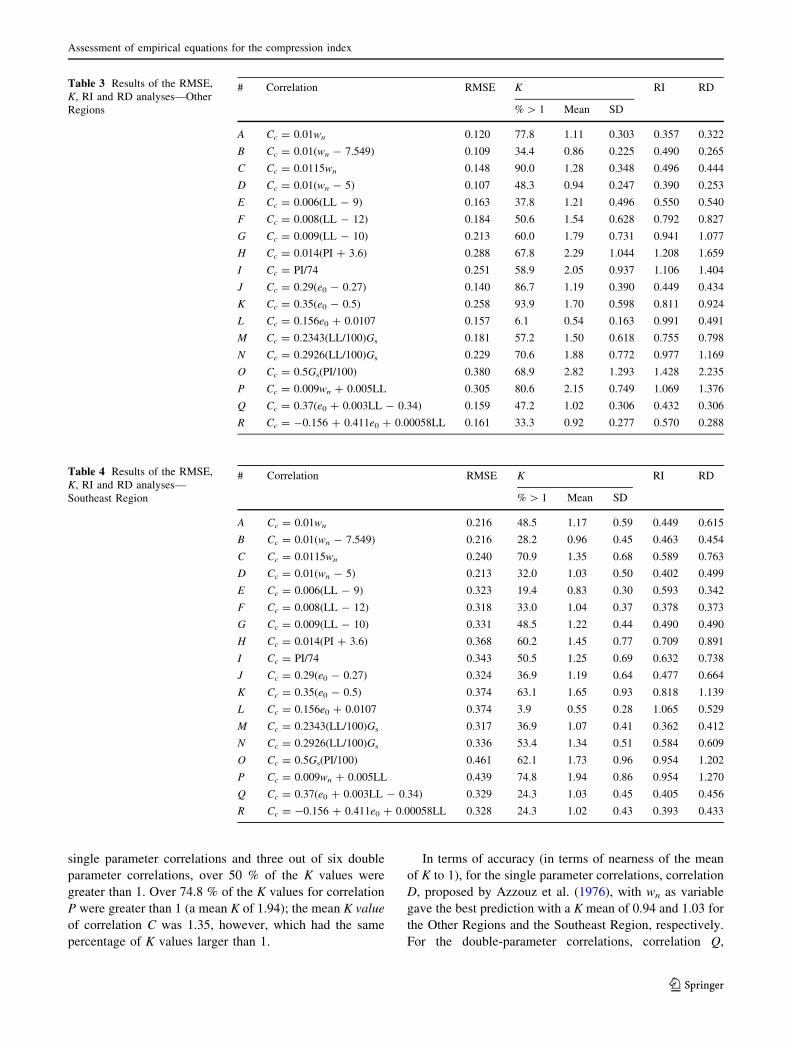
single parameter correlations and three out of six double
parameter correlations, over 50 % of the K values were
greater than 1. Over 74.8 % of the K values for correlation
P were greater than 1 (a mean K of 1.94); the mean K value
of correlation C was 1.35, however, which had the same
percentage of K values larger than 1.
In terms of accuracy (in terms of nearness of the mean
of K to 1), for the single parameter correlations, correlation
D, proposed by Azzouz et al. (1976), with wn as variable
gave the best prediction with a K mean of 0.94 and 1.03 for
the Other Regions and the Southeast Region, respectively.
For the double-parameter correlations, correlation Q,
Table 3 Results of the RMSE,
K, RI and RD analyses—Other
Regions
# Correlation RMSE K RI RD
% [ 1 Mean SD
A Cc = 0.01wn 0.120 77.8 1.11 0.303 0.357 0.322
B Cc = 0.01(wn - 7.549) 0.109 34.4 0.86 0.225 0.490 0.265
C Cc = 0.0115wn 0.148 90.0 1.28 0.348 0.496 0.444
D Cc = 0.01(wn - 5) 0.107 48.3 0.94 0.247 0.390 0.253
E Cc = 0.006(LL - 9) 0.163 37.8 1.21 0.496 0.550 0.540
F Cc = 0.008(LL - 12) 0.184 50.6 1.54 0.628 0.792 0.827
G Cc = 0.009(LL - 10) 0.213 60.0 1.79 0.731 0.941 1.077
H Cc = 0.014(PI ? 3.6) 0.288 67.8 2.29 1.044 1.208 1.659
I Cc = PI/74 0.251 58.9 2.05 0.937 1.106 1.404
J Cc = 0.29(e0 - 0.27) 0.140 86.7 1.19 0.390 0.449 0.434
K Cc = 0.35(e0 - 0.5) 0.258 93.9 1.70 0.598 0.811 0.924
L Cc = 0.156e0 ? 0.0107 0.157 6.1 0.54 0.163 0.991 0.491
M Cc = 0.2343(LL/100)Gs 0.181 57.2 1.50 0.618 0.755 0.798
N Cc = 0.2926(LL/100)Gs 0.229 70.6 1.88 0.772 0.977 1.169
O Cc = 0.5Gs(PI/100) 0.380 68.9 2.82 1.293 1.428 2.235
P Cc = 0.009wn ? 0.005LL 0.305 80.6 2.15 0.749 1.069 1.376
Q Cc = 0.37(e0 ? 0.003LL - 0.34) 0.159 47.2 1.02 0.306 0.432 0.306
R Cc = -0.156 ? 0.411e0 ? 0.00058LL 0.161 33.3 0.92 0.277 0.570 0.288
Table 4 Results of the RMSE,
K, RI and RD analyses—
Southeast Region
# Correlation RMSE K RI RD
% [ 1 Mean SD
A Cc = 0.01wn 0.216 48.5 1.17 0.59 0.449 0.615
B Cc = 0.01(wn - 7.549) 0.216 28.2 0.96 0.45 0.463 0.454
C Cc = 0.0115wn 0.240 70.9 1.35 0.68 0.589 0.763
D Cc = 0.01(wn - 5) 0.213 32.0 1.03 0.50 0.402 0.499
E Cc = 0.006(LL - 9) 0.323 19.4 0.83 0.30 0.593 0.342
F Cc = 0.008(LL - 12) 0.318 33.0 1.04 0.37 0.378 0.373
G Cc = 0.009(LL - 10) 0.331 48.5 1.22 0.44 0.490 0.490
H Cc = 0.014(PI ? 3.6) 0.368 60.2 1.45 0.77 0.709 0.891
I Cc = PI/74 0.343 50.5 1.25 0.69 0.632 0.738
J Cc = 0.29(e0 - 0.27) 0.324 36.9 1.19 0.64 0.477 0.664
K Cc = 0.35(e0 - 0.5) 0.374 63.1 1.65 0.93 0.818 1.139
L Cc = 0.156e0 ? 0.0107 0.374 3.9 0.55 0.28 1.065 0.529
M Cc = 0.2343(LL/100)Gs 0.317 36.9 1.07 0.41 0.362 0.412
N Cc = 0.2926(LL/100)Gs 0.336 53.4 1.34 0.51 0.584 0.609
O Cc = 0.5Gs(PI/100) 0.461 62.1 1.73 0.96 0.954 1.202
P Cc = 0.009wn ? 0.005LL 0.439 74.8 1.94 0.86 0.954 1.270
Q Cc = 0.37(e0 ? 0.003LL - 0.34) 0.329 24.3 1.03 0.45 0.405 0.456
R Cc = -0.156 ? 0.411e0 ? 0.00058LL 0.328 24.3 1.02 0.43 0.393 0.433
Assessment of empirical equations for the compression index
123
proposed by Azzouz et al. (1976), with e0 and LL as
variables gave the most accurate prediction with a mean
K of 1.02 for the Other Regions, while correlation R pro-
posed by Al-Khafaji and Andersland (1992) with e0 and LL
as variables gave the most accurate prediction for the
Southeast Region with a mean K value of 1.02. Comparing
the K values obtained using the single parameter and
double-parameter correlations, the double-parameter cor-
relations were found to be the best overall with correlation
Q the best for the Other Regions and correlation R the best
for the Southeast Region, both with mean K values of 1.02.
In terms of precision (determined in terms of smallness
SD of K) for the single-parameter correlations, correlation
L, proposed by Bowles (1979), with e0 as variable gave the
most precise prediction of Cc with a mean SD of 0.163 and
0.28 for the Other Regions and Southeast Region, respec-
tively. For the double-parameter correlations, correlation R,
proposed by Al-Khafaji and Andersland (1992), with e0
and LL as variables gave the best prediction with a SD
mean of 0.277 for the Other Regions. Correlation M pro-
posed by Nagaraj and Murty (1985) with LL and Gs as
variables gave the best prediction with a SD mean of 0.41
for the Southeast Region.
The best single parameter correlations in terms of RI for
the Other Regions and Southeast Region are correlation
A (RI = 0.357) proposed by Koppula (1981) and correla-
tion F (RI = 0.378) proposed by Sridharan and Nagaraj
(2000), respectively. For double parameter correlations it
was correlation Q (RI = 0.432) proposed by Azzouz et al.
(1976) and correlation M (RI = 0.362) proposed by Nag-
araj and Murty (1985) for the Other Regions and the
Southeast Region, respectively. The overall best correla-
tions were correlation A (RI = 0.357) and correlation
M (RI = 0.362) for the Other Regions and Southeast
Region, respectively. From Figs. 6 and 7 the RI curve
seems like an exaggeration of the RMSE curve where the
RI curve generally follows the profile of the RMSE curve
but plots above it.
For RD the most efficient single parameter correlations
for the Other Regions and Southeast Region are correlation
E (RD = 0.342) proposed by Azzouz et al. (1976) and
correlation D (RD = 0.253) proposed by Azzouz et al.
(1976), respectively. For double parameter correlations it
was correlation R (RD = 0.288) proposed by Al-Khafaji
and Andersland (1992) and correlation M (RD = 0.412)
proposed by Nagaraj and Murty (1985) for the Other
Regions and Southeast Region, respectively. The overall
best correlations were correlation D (RD = 0.253) and
correlation E (RD = 0.342) for the Other Regions and
Southeast Region, respectively.
The difference in value of RI and RD for each corre-
lation is shown Figs. 6 and 7 for the Other Regions and
Southeast Region, respectively. Larger differences
correspond to cases where the accuracy of the calculated Cc
value (mean of K is not close to 1.0) is poor, while smaller
differences correspond to higher accuracy prediction levels
of the Cc. Given the shortcomings of RMSE and RI, RMSE
highlights large errors (low accuracy) while RI considers
both accuracy and precision but does not assign equal
weight to them. RD, which gives equal weight to accuracy
and precision, is a better parameter for comparing the
suitability of the different correlation equations.
Conclusions
The suitability of some published correlations between the
compression index and index properties as they relate to
fine-grained Missouri soils were assessed in this paper.
Relevant data on fine-grained Missouri soils were grouped,
largely according to geology, into two regions (the ‘‘Other
Regions’’ and the Southeast Region) for this study. The
validity of these published correlations was assessed in
terms of four indices: the RMSE, the ratio of the estimated
to laboratory-determined compression index (K), the
ranking index (RI) and the ranking distance (RD). How-
ever, the ultimate/final assessment was made by means of
the RD index that assigns equal weight to the accuracy and
Fig. 6 RMSE, RI, and RD—Other Regions
Fig. 7 RMSE, RI, and RD—Southeast Region
S. Onyejekwe et al.
123
the precision of prediction. The RMSE does not consider
precision while the ranking index does not assign equal
weight to the accuracy and the precision of prediction.
Based on the analyses conducted in this study, the fol-
lowing conclusions can be reached:
• There was a general overestimation of Cc as evidenced
by the percentage of K values greater than 1.00.
• The overestimation of Cc was more pronounced in the
case of the Other Regions where, for example, the
percentage of K values greater than 1.00 as high as 90%
was recorded for correlation K proposed by Hough
(1957).
• Compared with double parameters correlation, the
single parameter correlation performed best for the
data studied in this research.
• The best single-parameter correlations for the Other
Regions and Southeast Region are correlation
E (RD = 0.342) proposed by Azzouz et al. (1976),
Cc = 0.006 (LL - 9) and correlation D (RD = 0.253)
proposed by Azzouz et al. (1976), Cc = 0.01 (wn - 5),
respectively.
• The best two-parameter correlations for the Other
Regions and Southeast Region are correlation
R (RD = 0.288) proposed by Al-Khafaji and Anders-
land (1992), Cc = -0.156 ? 0.411e0 ? 0.00058LL,
and correlation M (RD = 0.412) proposed by Nagaraj
and Murty (1985), Cc = 0.2343 (LL/100) Gs,
respectively.
• The overall best correlations for the Other Regions and
Southeast Region are correlation D (RD = 0.253)
proposed by Azzouz et al. (1976), Cc = 0.01 (wn -
5), and correlation E (RD = 0.342) proposed by
Azzouz et al. (1976), Cc = 0.006 (LL - 9),
respectively.
Acknowledgments The Missouri Department of Transportation
(MoDOT)/Missouri Transportation Institute (MTI) Transportation
Geotechnics Research Program (MoDOT/MTI-TGRP) was jointly
executed by MoDOT, the Geotechnical Engineering programs of the
Department of Civil and Environmental Engineering at the University
of Missouri-Columbia (MU) and the Department of Civil, Architec-
tural and Environmental Engineering at the Missouri University of
Science and Technology (S&T) and the Geological Engineering
program of the Department of Geological Sciences and Engineering
at the Missouri University of Science and Technology (S&T).
References
Abu-Farsakh MY, Titi HH (2004) Assessment of direct cone
penetration test methods for predicting the ultimate capacity of
friction driven piles. J Geotech Geoenviron Eng (ASCE)
130(9):935–944
Al-Khafaji AWN, Andersland OB (1992) Equations for compression
index approximation. J Geotech Eng (ASCE) 118(1):148–153
Alvarez Grima M, Babuska R (1999) Fuzzy model for the prediction
of unconfined compressive strength of rock samples. J Rock
Mech Min Sci 36(3):339–349
ASTM D4318-10 (2010) Standard test methods for liquid limit,
plastic limit, and plasticity index of soils. doi:10.1520/D4318-10
ASTM D854-10 (2010) Standard test methods for specific gravity of
soil solids by Water Pycnometer. doi:10.1520/D0854-10
ASTM D4186/D4186 M-12 (2012) Standard test method for one-
dimensional consolidation properties of saturated cohesive soils
using controlled-strain loading. doi:10.1520/D4186_D4186M-12
ASTM D2216-10 (2010) Standard test methods for laboratory
determination of water (Moisture) content of soil and rock by
Mass. doi:10.1520/D2216-10
ASTM D2435/D2435 M-11 (2011) Standard test methods for one-
dimensional consolidation properties of soils using incremental
loading. doi:10.1520/D2435_D2435M-11
Azzouz AS, Krizek RJ, Corotis RB (1976) Regression analysis of soil
compressibility. Soils Found 16(2):19–29
Bowles JE (1979) Physical and geotechnical properties of soils.
McGraw-Hill Book Company, New York
Bowles JE (1996) Foundation analysis and design, 5th edn. McGraw-
Hill Company, New York
Briaud JL, Tucker LM (1988) Measured and predicted axial load
response of 98 piles. J Geotech Eng (ASCE) 114(9):984–1001
Carrier WD III (1985) Consolidation parameters derived from index
tests. Geotechnique 35(2):211–213
Cherubini C (1991) Compressibility characteristics of the Matera
Blue Clays as determined by means of statistical correlations. In:
Proceedings of the 10th European conference on soil mechanics
and foundation engineering (AGI), Firenze, pp 59–62
Cherubini C, Giasi CI (2000) Correlation equations for normal
consolidated clays. In: Yokohama IS, Nakase A, Tsuchida T
(eds) Proceedings of the international symposium on coastal
geotechnical engineering in practice. AA Balkema, Rotterdam,
pp 15–20
Cherubini C, Orr TLL (2000) A rational procedure for comparing
measured and calculated values in geotechnics. In: Yokohama
IS, Nakase A, Tsuchida T (eds) Proceedings of the international
symposium on coastal geotechnical engineering in practice, vol
1. AA Balkema, Rotterdam, pp 261–265
Cozzolino VM (1961) Statistical forecasting of compression index.
In: Proceedings of the 5th international conference on soil
mechanics and foundation engineering Paris, vol. 1, pp 51–53
DNV (2007) Recommended practice: statistical representation of soil
data (DNV-RP-C207). Det Norske Veritas, Hovik
Finol J, Guo YK, Jing XD (2001) A rule based fuzzy model for the
prediction of petrophysical rock parameters. J Pet Sci Eng
29(2):97–113
Giasi CI, Cherubini C, Paccapelo F (2003) Evaluation of compression
index of remolded clays by means of Atterberg limits. Bull Eng
Geol Environ 62(4):333–340
Gokceoglu C (2002) A fuzzy triangular chart to predict the uniaxial
compressive strength of Ankara agglomerates from their petro-
graphic composition. Eng Geol 66(1–2):39–51
Hough BK (1957) Basic soils engineering. The Ronald Press
Company, New York, pp 114–115
Koppula SD (1981) Statistical estimation of compression index.
Geotech Test J ASTM 4(2):68–73
Kulhawy FH, Mayne PW (1990) Manual on estimating soil properties
for foundation design, Report No. EL-6800. Electric Power
Research Institute, Palo Alto
Lacasse S, Nadim F (1996) Uncertainties in characterizing soil
properties. In: Shackleford CD, Nelson PP, Roth MJS (eds.)
Uncertainty in the geological environment: from theory to
practice, Geotechnical Special Publication No. 58, pp 49–75.
ASCE, New York
Assessment of empirical equations for the compression index
123
Li KS, White W (1993) Use and misuses of regression analysis and
curve fitting in geotechnical engineering. In: Li KS, Lo SCR
(eds) Probabilistic methods in geotechnical engineering. AA
Balkema, Rotterdam, pp 145–152
Mahmoud MA, Abdrabbo FM (1990) Correlations between index
tests and compressibility of egyptian clays. Soils Found
30(2):128–132
Nagaraj TS, Murty BRS (1985) Prediction of the preconsolidation
pressure and recompression index of soils. Geotech Test J ASTM
8(4):199–202
Nishida Y (1956) A brief note on compression index of soil. J Soil
Mech Found Div, ASCE 82(SM3):1–14
Ogawa F, Matsumoto K (1978) Correlation of the mechanical and
index properties of soils in harbour districts. Rep Port Harb Res
Inst 17(3):3–89 (in Japanese)
Orr TLL, Cherubini C (2003) Use of the ranking distance as an index
for assessing the accuracy and precision of equations for the
bearing capacity of piles and at-rest earth pressure coefficient.
Can Geotech J 40:1200–1207
Ozer M, Isik NS, Orhan M (2008) Statistical and neural network
assessment of the compression index of clay-bearing soils. Bull
Eng Geol Environ 67:537–545
Rendon-Herrero O (1983) Universal compression index equation.
Closure J Geotech Eng Div ASCE 109(5):755–761
Saville VB, Davis WC (1962) Geology and soils manual. Missouri
State Highway Commission, Jefferson City
Skempton AW (1944) Notes on the compressibility of clays. Q J Geol
Soc Lond 100:119–135
Sowers GB (1970) Introductory soil mechanics and foundations, 3rd
edn. The Macmillan Company, Collier-Macmillan Limited,
London, p 102
Sridharan A, Nagaraj HB (2000) Compressibility behavior of
remolded, fine-grained soils and correlation with index proper-
ties. Can Geotech J 37:712–722
Terzaghi K, Peck RB (1967) Soil mechanics in engineering practice,
2nd edn. Wiley, New York, p 73
Titi HH, Abu-Farsakh MY (1999) Evaluation of bearing capacity of
piles from cone penetration test data. Louisiana Transportation
Research Center, Baton Rouge
Tsuchida T (1991) A new concept of e * logp relationship for clays.
In: Proceedings of the 9th Asian regional conference on soil
mechanics and foundation engineering, Bangkok, Thailand,
pp. 87–90
Uzielli M, Lacasse S, Nadim F, Phoon KK (2007) Soil variability
analysis for geotechnical practice. In: Tan TS, Phoon KK, Hight
DW, Leroueil S (eds) Characterization and engineering proper-
ties of natural soils. Taylor and Francis, London, pp 1653–1752
Whitman RV (1996) Organizing and evaluating uncertainty in
geotechnical engineering. In: Shackleford CD, Nelson PP, Roth
MJS (eds.) Uncertainty in the geological environment: from
theory to practice, Geotechnical Special Publication No. 58,
pp 1–28. ASCE, New York
Wroth CP, Wood DM (1978) The correlation of index properties with
some basic engineering properties of soils. Can Geotech J
15:137–145
Yılmaz I (2006) Indirect estimation of the swelling percent and a new
classification of soils depending on liquid limit and cation
exchange capacity. Eng Geol 85(3–4):295–301
S. Onyejekwe et al.
123