assessing the environmental model based on a …845596/fulltext01.pdf · assessing the...
TRANSCRIPT

Assessing the environmental sustainability of an apparel supply
chain -the development of a conceptual
model based on a comparative study of preferred tools and actual
practices
M a d e l e i n e B a r å s
Master of Science Thesis Stockholm /2015/


Master of Science Thesis STOCKHOLM /2015/
Assessing the environmental sustainability of an apparel supply chain
-the development of a conceptual model based on a comparative study of preferred tools and actual practices
Supervisor: Rafael Laurenti Examiner: Monika Olsson
Madeleine Barås
PRESENTED AT
INDUSTRIAL ECOLOGY ROYAL INSTITUTE OF TECHNOLOGY

TRITA-IM-EX 2015:18 Industrial Ecology, Royal Institute of Technology www.ima.kth.se

v
Acknowledgements Many have contributed to the creation of this master thesis, but some deserve a bit more attention. First of all, I would like to thank my supervisor for contributing with valuable feedback and support throughout this process. I have deeply appreciated it and I am most grateful for the time you have out into this project. Secondly, thank you to all stakeholders who provided valuable feedback and Company X for allowing me to gain insight to your routines and processes. Without you, this thesis would not have been possible to complete. Lastly, thank you to my boyfriend, sister and sister in law, for putting up with me, particularly in the end of this process. I imagine your struggle was harder than mine in between moments.

vi
Abstract The apparel and textile industry is one of the largest in the world and is characterised by complex, global supply chains, water and chemical intensive processes as well as environmentally harmful raw material extraction and production. Because of this, environmental sustainability has become a key issue for the businesses in recent years. With this in mind, and considering an increasing demand for textile and apparel goods, the industry is in urgent need of improving the environmental footprint of its products. However, lack of transparency and available data throughout apparel supply chains decrease chances of producing accurate sustainability assessments, which in turn obstruct improvement measures. Moreover, companies often lack the in-‐house competence required to manage and create strategies for sustainability assessments. In this study an overview of an apparel supply chain is provided, highlighting phases, sub phases, input and environmental indicators. Appropriate tools for assessing the environmental sustainability of such a supply chain are inventoried and examined. Based on a case study, a literature review and a stakeholder opinion assessment, misalignments between actual practices within an apparel company and recommended practices of the researcher and stakeholder communities are uncovered. These identified misalignments enabled the development of a conceptual model, aiming at facilitating the process of developing an environmental sustainability assessment strategy within an apparel company. Key words: Apparel industry, environmental sustainability assessment, environmental footprints, supply chain management
vii
Sammanfattning Klädindustrin, en av världens största industrier, är ofta hårt kritiserad för sin negativa miljöpåverkan. Kemikalie-‐ och vattenintensiva produktionsprocesser samt resurskrävande råmaterialtillverkning orsakar allvarliga utsläpp och trycket från konsumenter och lagstiftare är hårt för att säkerställa att textil-‐ och klädkonsumtionen blir mer hållbar för både människa och miljö. Trots att problemen är erkända och att forskare kommit långt med arbetet om hur man ska utvärdera hållbarheten av klädindustrins produkter, ligger industrin efter vad gäller att implementera verktyg och utvärderingsprocesser som kan bidra till en mer hållbar produktion. Ofta används extern kompetens för att tillgodose vissa behov, men den interna kompetensen brister. Utöver detta är industrin beroende av komplexa leverantörskedjor som är svåra att utvärdera från ett miljömässigt hållbarhetsperspektiv. Komplexiteten bidrar till minskad transparens och problem med datainsamling. Denna studie syftar till att minska gapet mellan forskare och industri vad gäller hållbarhetsutvärderingar av leverantörskedjor inom klädindustrin. Detta är tänkt att åstadkommas genom att jämföra processer för miljömässig hållbarhetsutvärdering på ett globalt klädföretag med processer och verktyg som rekommenderas av forskare och intressenter. Metoder som applicerats för att åstadkomma detta är en fallstudie, en intressentanalys samt en litteraturstudie. Genom att applicera de olika metoderna ovan har rekommendationer gällande olika processer och verktyg identifierats, vilket resulterade i att fem olika footprint-‐metoder kunde lyftas fram som specifikt applicerbara inom klädindustrin. Vidare tillfrågades olika intressenter om dessa metoder, för att på så vis kunna identifiera eventuella skillnader i rekommendationer mellan forskare och intressenter. Den mest signifikanta skillnaden utgjordes av vilka faser av leverantörskedjan som ansågs mest komplex att utvärdera. Forskare anser att tillverkningsfasen är förhållandevis okomplex, medan intressenterna lyfte fram den fasen som en av de mest komplexa. Det framkom även att fallstudieföretaget inte applicerade de rekommenderade footprint-‐metoderna i någon större utsträckning eller enligt en tydlig strategi. Med bakgrund av detta utvecklades en modell med syfte att underlätta för företag inom klädbranschen att utvärdera sina leverantörskedjor från ett miljömässigt hållbarhetsperspektiv. Modellen är uppdelad i fyra steg och möjliggör för företag att utföra en riskbedömning över de olika faserna i leverantörskedjan, samt prioritera vilka faser som kräver vidare åtgärder. Prioriteringen gör det därefter möjligt för företag att konkretisera vilka kompetensbehov som finns och huruvida dessa ska kompletteras med extern kompetens. Med bakgrund av detta är förhoppningen att modellen ska minska kunskapsgapet mellan industri och forskare, genom att tillåta företag att stegvis bygga upp sin kompetens inom området och således ta mer ansvar för sin leverantörskedja.

viii
Table of Contents
1 Introduction ................................................................................................................. 1 1.1 Background to the problem area ............................................................................... 1 1.2 Aim and objectives .......................................................................................................... 3
2 Methodology ................................................................................................................. 4 2.1 Applied methods for data collection and analysis ............................................... 5 2.1.1 Case study and product selection ...................................................................................... 5 2.1.2 Literature study ........................................................................................................................ 6 2.1.3 Stakeholder opinion assessment ....................................................................................... 6
2.2 Method for analysis and development of the conceptual model ..................... 7 2.2.1 Identifying misalignments between researchers and company .......................... 7 2.2.2 Analysis of Stakeholder opinion assessment ............................................................... 7
2.3 System boundaries and delimitations ...................................................................... 8 3 Literature review ........................................................................................................ 9 3.1 The apparel supply chain and its environmental indicators ............................ 9 3.2 Evaluating the environmental sustainability of a textile product ................ 12 3.2.1 Various footprints and their distinctions .................................................................... 13
4 Results ......................................................................................................................... 17 4.1 Highlights from the stakeholder opinion assessment ...................................... 17 4.2 Findings from the case study ..................................................................................... 18 4.2.1 The supply chain of the cotton shirt .............................................................................. 18
4.3 Main findings from the literature review .............................................................. 19 4.3.1 Supply chain phases and compatible assessment tools ........................................ 19
5 Analysis ....................................................................................................................... 23 5.1 The applicability of identified footprints in the apparel supply chain ....... 23 5.2 Comparing Company X applications with preferred methods ...................... 24 5.3 A conceptual model for developing assessment strategies ............................ 26
6 Conclusion .................................................................................................................. 28
7 Recommendations for further studies ............................................................. 30 References ........................................................................................................................ 31
Appendices ........................................................................................................................... i Appendix 1 – Checklist for case study interview .............................................................. i Appendix 2 – Questionnaire of stakeholder opinion assessment .............................. ii Appendix 3 – Responses of stakeholder opinion assessment ................................. viii
1
1 Introduction
1.1 Background to the problem area
The textile and apparel (clothing) industry is recurrently criticised for being environmentally and socially unsustainable. Media, the researcher community and NGO’s frequently highlight poor working conditions and unethical treatment of animals, as well as problems of environmental pollution from refinement and manufacturing processes (Paraschiv et. al, 2015; Allwood et al., 2006; Greenpeace, 2011). According to Allwood et al. (2006) the most significant environmental issues of the textile industry include energy use, toxic chemical use, release of polluted wastewater and production of solid wastes. Thiry (2011) and Paraschiv et al. (2015) state that the production of apparel goods requires large quantities of fresh water and energy, and that approximately 30-‐35 percent of the global chemical use pass through the textile industry every year. This causes severe pollution when released into receiving environments (Thiry, 2011). Furthermore, the textile industry is estimated to be the fifth largest contributor to greenhouse gases (GHG) in the US (WWF, 2013) and accounts for 2-‐3 percent of GHG emissions in Sweden from a consumption perspective (Naturvårdsverket & Kemikalieinspektionen, 2010). Moreover, from a global exporting perspective, and considering expected development of the textile industry in terms of growth, forecasts generally point towards increasing levels of production and consumption (Morris, 2011). In a vast study by the European Commission, which investigated the 12 most significant consumption categories in the world from an environmental impact perspective, the ‘clothing and footwear’ category was named the fourth most significant (after ‘food and beverage consumption’, ‘transport’ and ‘housing’) (Tukker, 2006). The study was based on seven independent studies which all compared the 12 categories according to parameters such as GWP, eutrophication, Eco toxicity and expenditure; All seven studies ranked ‘clothing and footwear’ on fourth place. In addition, in the report “International Trade statistics 2014” the World Trade Organization (2014) estimated the global export of ‘clothing’ in 2013 to be worth 460 billion USD, which is an increase of 9 percept compared to 2010. Hence, the ’clothing’ category is the second largest export category in the world, only out-‐rivalled by ‘integrated circuits and electronic components’. In the category of ‘other textiles’ (estimated to be worth 306 billion USD), an increase of 8 percent was noticed (WTO, 2014). And with a growing global population and middle class, forecasts regarding the textile and apparel industry all point in one direction; the demand for clothing and footwear will increase (Morris, 2011). According to Morris (2011) the global fibre consumption will correspond to 89.3 million tonnes in 2020 compared to 72.5 million tonnes in 2010 (an increase of 16.8 million tonnes). The above-‐mentioned challenges and circumstances emphasize the fact that in order to satisfy the textile demand of a larger share of people with less impact, the need for more sustainable solutions is not possible to exaggerate (Muthu, 2014). But in order to decrease negative impact, researchers and companies must understand what causes the environmental burdens of a product or process. Obtaining this knowledge will benefit

2
society and, from an industry perspective, increasing the knowledge regarding environmental footprints can entail some desirable effects. For example, it can allow a company to highlight wasteful and possibly harmful processes. This in turn enables pinpointed investments towards this problem area, which can result in: more efficient processes, less waste, decreased pollution and increased control over product flows. Possessing this knowledge can also facilitate communication with stakeholders, increase transparency in the supply chain and decrease vulnerability from possible threats (such as hazardous leakages etc.) (Muthu, 2014). However, the environmental burdens of products in the apparel and textile industries have been proven difficult to estimate, mostly due to lack of relevant data and of transparency in textile supply chains (Chapman, 2010; Muthu 2014). The scientific community has a rather clear idea of what indicators to evaluate, as well as what methods to use for assessments (Muthu, 2014; Čuček et al., 2012; Herva et al., 2011). Yet, the commercial and industrial community have just started to grasp the advantages of assessing the environmental sustainability of their business, and many companies lack the competence required to perform such assessments (Muthu, 2014). Consequently, there is reason to suspect that there is not yet an alignment between researchers and practitioners in terms of performing sustainability assessments. Thus, the purpose of this study is to decrease misalignment between the research and apparel industry in terms of environmental sustainability assessments of an apparel supply chain. This is to be achieved by investigating sustainability assessment tools recommended by the research community and stakeholders for application within the apparel industry. The findings are thereafter cross-‐referenced with strategies and tools applied within an apparel company. Based on the cross-‐reference analysis, a conceptual model aimed at facilitating the development of strategies regarding the environmental sustainability assessment of an apparel supply chain is developed.
3
1.2 Aim and objectives
The aim of this study is to produce a conceptual model for developing strategies on how to assess the environmental sustainability of an apparel supply chain. In order to attain this aim, the following four objectives are set:
1. Determine one product and its respective supply chain within an apparel company for further analysis.
2. Identify which methods and tools are suitable to assess the environmental
sustainability of such a supply chain.
3. Investigate how the findings from objective two are approached within the apparel company, highlighting possible misalignments between the apparel industry and research community.
4. Based on objective three, develop a conceptual model for conducting
environmental sustainability assessment strategies for apparel supply chains.
4
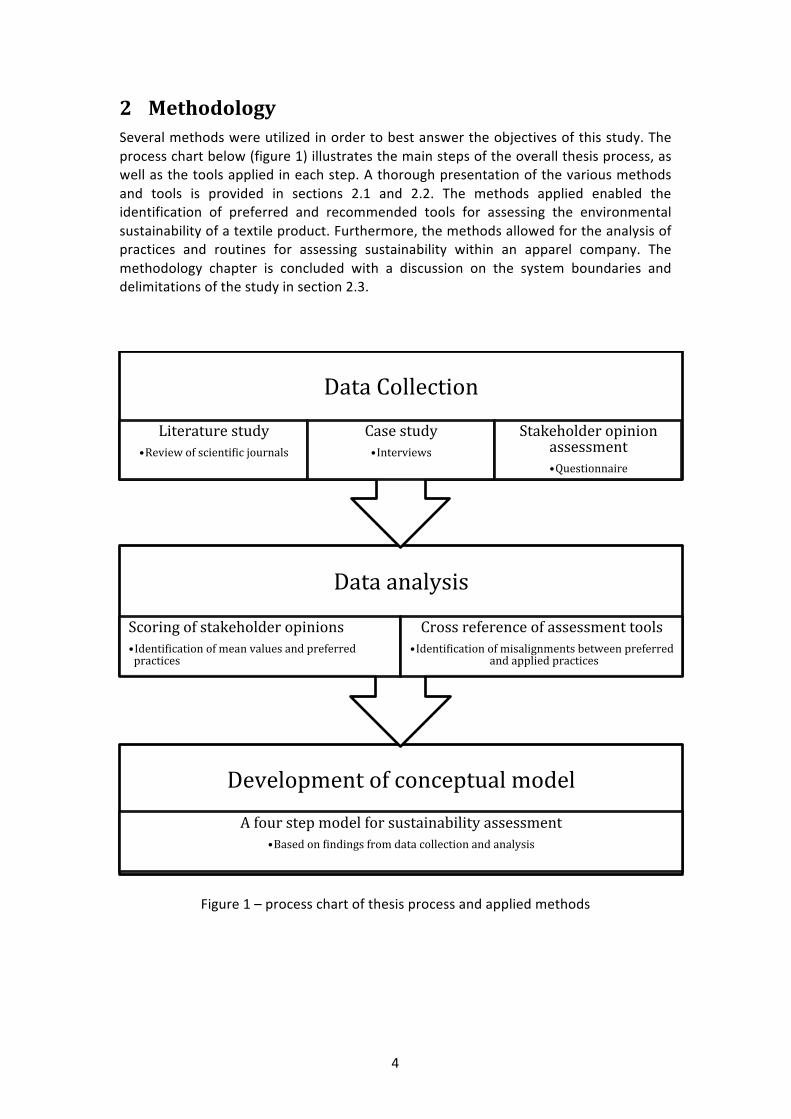
2 Methodology Several methods were utilized in order to best answer the objectives of this study. The process chart below (figure 1) illustrates the main steps of the overall thesis process, as well as the tools applied in each step. A thorough presentation of the various methods and tools is provided in sections 2.1 and 2.2. The methods applied enabled the identification of preferred and recommended tools for assessing the environmental sustainability of a textile product. Furthermore, the methods allowed for the analysis of practices and routines for assessing sustainability within an apparel company. The methodology chapter is concluded with a discussion on the system boundaries and delimitations of the study in section 2.3.
Figure 1 – process chart of thesis process and applied methods
Development of conceptual model
A four step model for sustainability assessment • Based on Lindings from data collection and analysis
Data analysis
Scoring of stakeholder opinions • IdentiLication of mean values and preferred practices
Cross reference of assessment tools • IdentiLication of misalignments between preferred
and applied practices
Data Collection
Literature study • Review of scientiLic journals
Case study • Interviews
Stakeholder opinion assessment • Questionnaire
5
2.1 Applied methods for data collection and analysis
2.1.1 Case study and product selection
A case study was performed at a global apparel company, hereafter named as ‘Company X’. Company X sells a wide range of products comprising underwear, apparel (clothes), accessories and interior design products. The main offer, apparel, is divided into four main categories: 1. Men, 2. Women, 3. Kids, and, 4. Accessories. In categories one, two and three, products range from footwear and outerwear to shirts and pants. Category four includes belts, scarves and bags. The case study consisted of semi-‐structured interviews with employees at the company, the CSR manager and the Project manager of logistics. The aims of this case study were twofold: (i) to identify a product suitable for further investigation; and (ii) to collect information regarding the supply chain setup of that product. One objective was also to gather data on processes and regulations about sustainability assessments, which would allow for an analysis of how the company regulates and assesses parameters concerning environmental sustainability. The interviews were conducted using a checklist, which covered various topics for discussion, as well as some questions for initiating a certain topic. The questions were concentrated on processes regarding sustainability evaluation of products, supply chain management, product composition and the supply chain structure of the selected product. The checklist and interview questions can be found in appendix 1. By constructing the interview in this manner, the interviewees were given the possibility to describe the supply chain setup without having to be limited by closed questions. Hence, the interview process was of an adaptive nature where irrelevant questions were excluded and new questions were added spontaneously. A total of three meetings were realized. The first meeting was focused on introducing the project and determining which product to analyse. The remaining two meetings were centred on conducting interviews according to the checklist. From the introductory meeting it was concluded that the product of choice had to fulfil three requirements:
• Be of significance to the company in terms of sales volume. A product without a significant demand from consumers, risks being eliminated from the assortment range in future collections, which would decrease the relevancy of this study.
• Have stable future material availability and demand. It would be of little
significance to analyse a product made of a material with uncertain prospects of availability and demand, due to the risks of the product being excluded from future collections.
• Preferably be available in collections for both men and women (the main target
groups).

6
Considering the requirements for selecting the product of interest, category one (Men) and two (Women) were concluded to be the most relevant. These categories represent the largest shares of the company’s total turnover and include many key garments. The key garments are unlikely to be excluded from collections and are considered to have a secure material availability (Company X – Appendix 1, 2015). In order to delimit the selection further, all products that were not offered to both men and women were excluded, resulting in the selection of a cotton shirt and its respective supply chain for further analysis.
2.1.2 Literature study
The investigated literature was focused on routines, tools and processes for assessing environmental sustainability regarding textile and apparel products. Also, the general structures and environmental indicators of apparel supply chains were investigated. By highlighting recommendations and preferred methods for assessing the environmental sustainability of supply chains, a scientific context could be provided for the thesis. This also supplied a review of state of the art tools and up to date practices. Information was found using scientific databases such as Google scholar, KTHB primo and Science direct. Search strings included: “environmental sustainability analysis of textile products”, “LCA case studies of textile products”, “Environmental analysis of apparel products”, “apparel supply chains”, “Sustainable apparel supply chains”, “Environmental footprints in the apparel industry” and “Footprints and textile products”. Also, websites of branch organisations, NGO’s, government agencies and stakeholders of the apparel industry were utilized as sources for material.
2.1.3 Stakeholder opinion assessment
‘Stakeholders’ can be defined as individuals and organisations that are either able to influence, or can be influenced by, a decision (Kordas, 2014). According to Quist and Vergragt (2006) there are four societal groups usually considered in a stakeholder analysis; companies, research bodies, government and public interest groups and the public. Assessing stakeholder opinions can provide industry specific insights and knowledge, as well as acknowledgement and validation to a concerned topic (Quist and Vergragt, 2006). Regarding this thesis, it was considered valuable to capture possible misalignments between stakeholders and researchers concerning sustainability assessments, since stakeholders may influence internal practices of companies and can provide for new insights regarding the suitability of various assessment methods (Quist and Vergragt, 2006) The stakeholder opinions assessment (SOA) process involved several steps including: (i) determining key stakeholder groups and at least one representative from each group (ii) formulation and revision of written questions including: (iia) questions formulated in such a way that the answer could be ranked 1-‐3, where 1 corresponded to the most important or highly ranked alternative, and thus be quantitatively evaluated and, (iib) questions formulated in such a way that the answer could be chosen from a number of different given alternatives, followed by a possibility for the respondent to further describe his/her opinion in written text, and therafter be qualitatively evaluated, (iii)

7
distribution of the questions by e-‐mail to the representatives of the key stakeholder group, and finally, (iv) processing of answers. Based on the societal groups identified by Quist and Vergragt (2006), the following stakeholder groups were identified:
• Consumers • Producers • NGO’s • Policy makers (political institution) and/or Governmental Organizations • Branch organizations • Research institutes • Consultancy companies
One representative from each stakeholder group was selected, resulting in a total of seven respondents. All respondents but one responded within the given time limit and hence, the results of the SOA are based on the answer of six respondents. Two of the selected respondents asked to be anonymous and thus, in order to reduce the risk of readers being able to deduce which respondent answered in a certain way, all respondents were treated anonymously. The questions revolved around preferred method and important aspects to consider when assessing the environmental sustainability of textile products, identified in the literature review. It was found that some methods could be deemed more suitable than others when considering apparel products, which affected the selection of alternatives available to the respondents in the questionnaire. The complete questionnaire can be found in appendix 2.
2.2 Method for analysis and development of the conceptual model
2.2.1 Identifying misalignments between researchers and company
In order to compare the preferred practices among researchers and stakeholders with actual practices of Company X, a cross-‐referencing approach was utilized. The purpose of this approach was to i) identify and compare general supply chain phases of the apparel industry with the actual supply chain structure of Company X ii) determine what tools for environmental sustainability assessment are compatible for evaluating the identified supply chain phases and iii) determine if any of these tools are applied by Company X. The cross-‐referencing process made it possible to highlight misalignments between preferred practices and actual practices, which in turn realized the possibility of developing a conceptual model for environmental sustainability assessments within an apparel supply chain.
2.2.2 Analysis of Stakeholder opinion assessment
Regarding the questions where respondents were asked to rank their alternatives from 1 to 3, the responses were analysed using a point system. A score of 1 (i.e. the top preference of the respondent) equalled five points, score 2 equalled three points and score 3 equalled one point. However, in order to balance the scoring according to how

8
often an alternative was chosen, the total score of one alternative was divided by the number of respondents choosing the named alternative, allowing for the identification of a mean value. By doing this, the risk of overestimating an alternative was reduced. The scoring process and calculations can be found in appendix 3.
2.3 System boundaries and delimitations
Company X is a global apparel company with markets and suppliers all over the world. The supply chain structure is complex, as is typical for the industry (Muthu, 2014). Therefore, setting the geographical system boundary of this study to include only European suppliers and markets would be problematic, since products are often produced in one part of the world, yet sold in another. Consequently, setting a geographical boundary would risk eliminating some part of the supply chain of the selected product. With this in mind, the system boundary for this study was determined according to the product chosen for analysis with no regard to geographical limitations. This allowed for a more detailed and realistic study. Moreover, in order to delimit the scope and manage the timeline of this thesis project, the identified supply chain of Company X is based on one of their product flows (the cotton shirt). As mentioned previously, Company X offers a wide range of products and these are not all managed the same way, from a supply chain and logistics perspective. Therefore, including only one product could possibly make it difficult to draw conclusions regarding the entire supply chain of Company X, and for other apparel supply chains as well. However, from Company X’s perspective, the supply chain setup of the shirt is a relatively new concept that is likely to be applied for other products. Thus, it is of interest to subject the supply chain structure of the shirt to sustainability assessments in order to produce material for future decision-‐making. In addition, from the literature review, it was determined that even though products are treated differently in terms of logistics and lead times, the supply chain phases do not vary much, which enables the possibility of drawing general conclusion for the apparel industry. Another limitation, or weakness, of the study is that of the questionnaire sent out to the various stakeholders. Since the stakeholder groups included a range of respondents with various professional backgrounds, the knowledge regarding assessing environmental impacts of textile products varies. Because of this, the questions were of a general and high-‐level format. Thus, there was room for subjective interpretation in some questions. However, all respondents were given the option to further explain their answers, which some did. Yet, a recommendation would be to conduct follow up-‐interviews with the respondents (if further studies were to be conducted). This would allow for a review of answers with the respondents in person, and a possibility to further investigate the motivations behind the responses. That would be useful if one wishes to analyse variations in stakeholder opinions and the reasons for these differences of opinion.
9
3 Literature review In this section, all findings from the literature review are presented, beginning with an overview of a general apparel supply chain and environmental indicators. This is followed by a section concerning processes and tools for assessing the environmental sustainability of apparel supply chains. The main findings are thereafter summarised in section 4.3.
3.1 The apparel supply chain and its environmental indicators
In a study by Caniato et al. (2012), the connection between supply chain management and environmental management was addressed. Supply chain management concerns the planning and structuring of activities and processes required to provide a customer with a product. This includes sourcing of materials, procurements, managing partner and supplier relationships, as well as logistics services (Canadian Supply Chain Sector Council, 2015). Caniato et al., (2012) highlight that because supply chain officers have insight regarding company structures, supplier agreements and product components, they are also suitable for managing the environmental sustainability of a company. However, the apparel supply chain is often complex, with various suppliers, agents and wholesalers involved. This is particularly the case for companies that use independent subcontractors for manufacturing, since such contractors often produce a wide range of products for several different buyers (Styles et al., 2012). In those cases, even if data is available, determining the environmental impact per product (impact allocation) is an issue. Moreover, companies that buy finished goods often experience difficulties trying to trace various inputs and raw materials beyond the main manufacturer (Muthu, 2014; Caniato et al., 2012; Styles et al., 2012). Yet, such companies are still often held responsible for the environmental impact of their overall supply chain, even that of their subcontractors and including 2nd and 3rd tier suppliers (Caniato, 2012). In addition, the environmental impacts of consumers’ activities, and how consumers choose to dispose of a product, are usually very problematic to assess. This is because these activities depend on various factors that are beyond the control of manufacturers and retailers, such as washing habits of consumers and possible options for disposal in various countries. For example, some countries only use incineration as end-‐of-‐life treatment, whereas other countries might offer infrastructure for collection of reusable products and recycling of materials (Muthu, 2014; Caniato et al., 2012). The complexity of apparel supply chains causes lack of transparency and restricts the possibilities of obtaining valuable data. This in turn can risk undermining the result of a sustainability assessment (Muthu, 2014). However, despite the lack of transparency in individual cases, the general phases of a textile supply chain, as well as general inputs, are known and can be summarized according to Table 1. The table conveys six main phases of an apparel supply chain including: Raw material harvesting, raw material processing, manufacturing, transport and distribution, use and waste. The main phases are further allocated into sub phases (processes) that together constitute a cradle-‐to-‐grave perspective (Muthu, 2014; Herva et al., 2011; Gardetti & Torres, 2013). The sub phases vary depending on the raw material and the processes required to produce a finished fabric. Moreover, the process inputs can occur in several of the various sub

10
phases. For example, transports are utilized between subcontractors, not only from manufacturer to customer, and packaging is usually required for all types of transports. Thus, the process inputs are not presented in any particular order of appearance. Table 1 – A general apparel supply chain structure, its sub phases and process inputs
(Herva et al., 2011; Muthu, 2014; Gardetti & Torres, 2013)
Supply chain phase Sub phase (Included processes) Process inputs
1. Raw material harvesting phase
Raw material preparation Direct and indirect land usage for fibre production, production facilities and landfills Pesticides, fertilizers, chemicals and other additives Water for processing and cooling Machines and inventories in manufacturing facilities Packaging materials Energy for production and transportation
2. Raw material processing phase
Raw material to fibre conversion
Yarn preparation
Grey fabric preparation
Finished fabric preparation
3. Manufacturing phase Apparel manufacturing, including cutting, sewing and washing
4. Transport and distribution phase
Boat, air, train or truck transports to warehouse or retailer
5. Use phase Wearing and washing habits of consumers
6. Waste phase
Recycling
Reuse
Landfill/Incineration

11
Moreover, some key environmental indicators associated with the apparel supply chain are presented in Table 2. As is the case regarding process inputs, the indicators can emerge in several instances throughout the supply chain (Muthu, 2014). However, with general phases, processes, inputs and indicators identified, there is a possibility to pinpoint which tools for sustainability assessment are appropriate for each phase of the supply chain. Hence, mapping the supply chain of a product and investigating where the most significant indicators occur, enables companies to develop more advanced sustainability management strategies for their supply chains (Caniato et al, 2012; Muthu, 2014).
Table 2 -‐ Environmental indicators of a textile supply chain (Muthu, 2014)
Indicator
Treatment and discharge of effluents
Extraction of raw materials -‐ sources and production methods
Production of chemicals, other materials and auxiliaries for production and manufacturing
Energy production processes and utilisations -‐ sources and quantities
Water sources, quantities and processes for cooling and/or heating
Over consumption and production
Emissions to air, water and land
Production of solid waste and disposal
Transportation of materials, semi-‐finished and finished goods
12
3.2 Evaluating the environmental sustainability of a textile product
‘Sustainability’ is a wide concept, and adding the term ‘environmental’ before it achieves rather little in terms of delimitation and elimination of subjective interpretations. However, some significant points regarding evaluating environmental sustainability at a corporate level, brought forward by Herva et al. (2011), facilitate in underlining the focus of this study. Firstly, environmental sustainability indicators can be divided into four categories. Those are (i) Indicators of Energy and Material Flows, (ii) Indicators with a Territorial Dimension, (iii) Indicators of LCA (Life Cycle Assessment), and (iv) indicators of Environmental Risk Assessment (Herva et al., 2011). Secondly, these four categories comprise the main contributors affecting the sustainability of a textile product (or process), which correspond well with the environmental indicators of textile supply chains presented in Table 2. The contributors include:
• Energy use per unit of economic value-‐added • Type of energy source and intensity of the source • Material use (or resource depletion) • Fertilizers or pesticides used • Chemical use • Freshwater use • Packaging material use • Waste and pollutants generated into air, soil and water • Land use and yield of the land • Environmental impacts of products, processes and services (including transports) • An analysis of risk to human health and the environment
(Herva et al. 2011; Muthu 2014)
As a way of managing and assessing the many factors affecting the environmental sustainability of a product, various footprint methods have emerged. One of the most common, the ecological footprint, was developed by Rees in 1992 (Čuček et al., 2011). Other footprints include the water footprint (developed by Hoekstra and Hung in 2002) and the carbon footprint, which was defined by Høgevold in 2003 and developed as a continuation of the Global Warming Potential (GWP). Those three footprints, i.e. the ecological, carbon and water footprints, together form the “footprint family” (Čuček et al., 2012; Galli et al. 2012). The United States Environmental Protection Agency (EPA) (2014) adds the material footprint and nitrogen footprint to the group of most common footprints and collectively names them ‘environmental footprints’. This is further defined as “an accounting tool that measures human demand on ecosystem services required to support a certain level, and type of, consumption by an individual, product, or population” (EPA, 2014). This definition is somewhat narrow based on how diversified various footprints are. Depending on the purpose of the analysis and considering the eleven contributors stated above, some footprints are more appropriate than others for assessing a certain environmental indicator (Čuček et al., 2012, Herva et al., 2011; Galli et al., 2012; Muthu 2014).

13
Considering the four categories of environmental sustainability indicators brought forward by Herva et al. (2011) (presented above), indicators can include a territorial dimension, have a substance flow or risk assessment approach or include a life cycle perspective. Moreover, the result of a footprint analysis can be either a form of life cycle assessment (LCA), although not as comprehensive as a traditional LCA, focused on a set indicator (e.g., carbon dioxide or energy emissions). Or, it can be a specific analysis delimited by a geographical system boundary, e.g. the ecological footprint of a town or factory. Regarding footprints defined by a geographical system boundary (e.g. ecological, material and to some extent water footprints) the data is often aggregated and based on statistics of that particular area. This data can be found in various databases provided by organisations such as United Nations International Energy Agency and the Intergovernmental Panel on Climate Change (Herva et al., 2011). Concerning footprint analysis based on set indicators, the data can consist of observations and data collections performed by the researcher, but also available LCA databases (EPA, 2014; Herva et al., 2011; Čuček et al., 2012). It is worth noting that no particular software is promoted for evaluating footprints, but that there are a number of options available (EPA, 2014). Because of the relatively rapid development of numerous footprints in the past decades, there was a need to single out those appropriate for evaluating production processes, products and supply chains of the apparel industry. Based on the four categories of environmental sustainability indicators stated by Herva et al. (2011), the selected footprints cover the assessment of all four categories. Distinctions, limitations, strengths and other variations between relevant footprints are accounted for in section 3.2.1 below.
3.2.1 Various footprints and their distinctions
Ecological footprint
The ecological footprint takes planetary (or other geographical) boundaries in consideration and defines how much bio capacity is required in order to support a certain activity (consumption) (Galli et al., 2012; EPA 2014). Thus, the tool allows for analyses and comparison between different societal lifestyles and their impact on ecological systems (Chambers et.al, 2014). Results are expressed in global hectares (i.e. the ecological production estimated for an area) or physical hectares. An example of an application of the ecological footprint analysis is the “Living planet report” produced by the WWF (2014) stating that current global human activities require 1,5 planets in terms of resources. Moreover, Muthu (2014) argues that the ecological footprint is suitable for application within the textile industry. The tool is often promoted since it combines several indicators that are normally investigated individually, such as land use and consumption of natural resources (Galli et al., 2012). Another positive aspect is that the data derives from various sources and databases that are continuously updated. Additionally, the footprint allows for benchmarking between regions and has proven to be a valuable tool for public communications, contributing to its popularity (Galli et al, 2012). Critique against the
14
ecological footprint includes issues with data aggregation and the use of assumptions, poor data collection (for some regions) and difficulties of setting system boundaries (EPA, 2014). Moreover, the ecological footprint includes regenerative capacities, but not non-‐regenerative (such as abiotic environments), and only gives an instant (or yesterday’s) picture of a situation; i.e. it does not consider technological advancements and future scenarios (Moffatt, 2000; Galli et al., 2012).
Carbon footprint
The carbon footprint, considered by EPA (2014) as the most developed of all footprint methodologies, is centred on the investigation of greenhouse gas (GHG) emissions of e.g. a city, product or production process (EPA, 2014; Herva et al., 2011). According to Galli et al., (2012), the sum of all emissions related to a country’s consumption equals the carbon footprint of named country (including imports but not exports). The footprint comprises both direct and indirect GHG emissions and it is usually expressed in terms of a single unit indicator, such as kg when considering only carbon emissions. However, if several GHG emissions are included in the analysis, the result is expressed as CO2e (the mass of CO2 equivalent), e.g., CO2e per dollar or production unit. The CO2e is calculated by multiplying the emissions of each greenhouse gas by their respective 100 year global warming potential (GWP), where GWP represents the quantities of GHGs that contribute to global warming and climate change (Herva et al., 2012). The most significant greenhouse gases, defined in the Kyoto protocol, are CO2, CH4, N2O, HFC, PFC, and SF6 (Galli et al., 2012). Because carbon footprints comprise both direct and indirect emissions, the results are categorized according to scope one, two and three. Scope one concerns direct GHG emissions from fuel combustion in vehicles and facilities. Scope two and three deals with indirect emissions from purchased electricity as well as other indirect GHG emissions (such as waste disposal, outsourced activities and business travel) (Muthu, 2014; Galli et al., 2012). As with the ecological footprint, Muthu (2014) deems the carbon footprint as applicable within the textile industry. However, as with all tools there are weaknesses and concerning the carbon footprint, those include delimitations in ability to track and analyse overall human impact on the environment. Also, worth noting is that the carbon footprint only considers human demand, in contrary to the ecological footprint, that considers both human demand and natural supply. Hence, as a single tool it is not sufficient for measuring overall environmental sustainability, but that is perhaps not the purpose of the footprint either. Some strengths of the tool include: a strong communicative tool, consistency with standards developed for economic and environmental accounting and comprehensive data availability (Galli et al., 2012; Muthu, 2014). Another footprint, not mentioned previously in this study, is the energy footprint. This is often associated with the carbon footprint since the result of the analysis is often expressed in CO2e (EPA, 2014). The analysis estimates total energy consumed within a set system boundary and the amount of GHG emitted as an effect of the consumption (Office of Energy efficiency and renewable energy, 2014). In this study, the energy footprint is considered as synonymous with the carbon footprint.

15
Material footprint
A material footprint analysis is defined by a set system boundary and investigates material input and waste generation within that system e.g. within a region or production facility. The result is often expressed as estimations of direct material input within a system or direct material consumption (Bringezu et. al, 2003; EPA, 2014). There are numerous indicators and tools for analysing material inputs and outputs, however, on a corporate level, Herva et al., (2011) argues that a material flow analysis (MFA), substance flow analysis (SFA) and material input per unit service (MPIS) are most appropriate. This is because they allow for the consideration of indirect material flows and have been found suitable for managing sustainable material handling. Analysing inputs and outputs of a manufacturing procedure allows for the identification of wasteful processes, which enables for implementation of reduction measures. However, a significant weakness is the poor differentiation between various materials that are used in a process, e.g. the effect of including one kg of unhazardous material compared to one kg of highly hazardous material in a production process. Therefore, the material footprint is not appropriate for analysing the environmental impact of a product in terms of material choice, but is a strong tool for assessing material throughput, quantities and waste. Moreover, the material footprint can be weak in terms of data collection when dealing with large system boundaries, which causes the use of assumptions and generic data.
Chemical footprint
Though the material footprint is restricted in terms of assessing the potential harmfulness of various materials and producing a risk assessment, this is where the chemical footprint has an advantage. The purpose of the chemical footprint is to give an indication of the potential risk of a material, substance or product. It takes into consideration various properties of a substance including: human and ecological hazardousness, exposure potential throughout the life cycle of the substance, as well as an inventory of the materials or chemicals consumed (Čuček et al., 2012). Hence, the chemical and material footprints are quite complementary to each other and suitable for integration (Herva et al., 2011). The system boundary and scope of a chemical footprint depends on the desired outcome. It can vary in system boundary from assessing single units to comprehensive evaluations of a company’s total offer. Moreover, it can include a complete life cycle or delimited phases of a production process (Hitchcock et al., 2012). The flexible nature of the chemical footprint allows for application within numerous industries, and considering the chemically intensive processes of the apparel industry, the chemical footprint is arguably a significant tool for assessing the sustainability of an apparel supply chain. However, due to the lack of transparency in apparel supply chains, data collection is problematic (Muthu, 2014; Hitchcock et al., 2012).
Water footprint
Lastly, water footprints measure total volumes of freshwater consumed and polluted within a system boundary (both direct and indirect use) (Čuček et al., 2012; EPA, 2014).

16
It can be an indicator of required volume to sustain a population or process and is usually categorized according to internal footprints (consumption within an area) and external footprints (consumption outside an area). The result of a water footprint is usually expressed as volumes consumed or polluted per unit of time or functional unit (Galli et al., 2011). Furthermore, water is classified as blue, green and grey water depending on the level of pollution, where blue corresponds to fresh water from surface and groundwater, green is fresh water from soil deriving from rainwater and grey is polluted water or the amount of freshwater required to dilute contaminations and meet water quality standards (Čuček et al., 2012; EPA, 2014). Strengths of the water footprint include a deeper understanding for water management and wide system perspective, since it accounts for both internal and external use of a system. Hence, it is considered as a complement to the ecological footprint regarding water resources, since the ecological footprint lacks in overall system perspectives. For example, the ecological footprint does not take into account trade routes between countries (system boundaries) and can therefore be misleading in estimations of actual resources required to supply a certain activity. The water footprint is considered to be a form of substance flow analysis and thus have similar weaknesses to other footprints of that type, e.g. material footprints. For example, the water footprint does not estimate environmental impacts of the water consumption, but is regarded as more of an inventory tool. In addition, there is a lack of reliable data (Herva et al., 2011). However, the water footprint is considered highly relevant for the apparel industry because of water intensive production processes that require assessment and improvement (Muthu, 2014).

17
4 Results In this section, the main findings from the stakeholder opinion assessment, case study and literature review are presented. These findings are further discussed in section 5.
4.1 Highlights from the stakeholder opinion assessment
The stakeholder opinion assessment provided valuable feedback regarding what parameters to consider when analysing the environmental footprint of a textile product. All stakeholders but one responded to the questionnaire, meaning that a total of six questionnaires were collected and analysed. For a complete overview of responses, as well as ranking of answers, see appendix 3. In the appendix, some questions in section 1 (questions 1-‐5) have been excluded in order to ensure the anonymity of the stakeholders. The main findings can be summarised accordingly: All of the respondents believed in an increase in textile consumption until the year of 2020, which was in line with the projections described in the introduction. Furthermore, the materials ranked as the most environmentally unsustainable (environmentally intensive) included viscose, cotton and fur. It is known that cotton production requires large amounts of pesticides, fertilizers and water, as well as chemicals for further treatments such as dyeing (Muthu, 2014). Furthermore, fur is a controversial material due to the many alarms on unfair animal treatment within production facilities. Viscose is not as criticised as cotton or fur in the media. Perhaps this is because it is usually produced using wood pulp, which is considered a renewable resource. However, it is not uncommon for viscose to contain cotton fibres, and the raw material refinement process is chemically intensive (CIRFS, 2015). Also, the cutting of trees can lead to severe deforestation (Green choices, 2015). Conclusively, the fact that cotton is considered one of the most unsustainable raw materials among the stakeholders increases the relevancy of this study. Moreover, regarding the apparel supply chain, respondents ranked the waste, manufacturing and raw material processing phases as the most unsustainable (environmentally intensive). Concerning assessments of environmental sustainability of apparel supply chains, the stakeholders considered the manufacturing, harvesting, waste and use phases as the most complex to analyse. Material processing came close to top three as well. Only ‘transportation’ did not receive any points at all, indicating that assessing the transportation and distribution phase is not considered as complex compared to other phases Considering available footprint tools for sustainability assessment of apparel products, the ecological, carbon and water footprints were deemed the most relevant footprints. Lastly, when asked about what was considered most important in order to ensure a reliable result when assessing the environmental sustainability of an apparel product, the respondents ranked ‘transparency in the supply chain’ as the single most important factor. This alternative was given highest mark by all respondents, confirming one of the prerequisites that this study is based upon.

18
4.2 Findings from the case study
4.2.1 The supply chain of the cotton shirt
Being a key garment within Company X, the shirt is not as vulnerable to fluctuations in demand, compared to other products that are more sensitive to fashion trends. Because of this, it is possible for the company to store rather large quantities of the shirt and ship on demand. Hence, the supply chain of the shirt is relatively stable and can be considered an ‘lean’ supply chain, compared to other apparel supply chains that require a higher responsiveness to fluctuating trends, and thus are defined as ‘agile’ supply chains (Muthu, 2014; Company X – Appendix 1, 2015; Mason-‐Jones et al., 2010). Moreover, Company X does not own any factories, but buys the shirt in a finished state from an independent supplier. The shirt is composed of 100 percent cotton and is produced by an apparel supplier located in China. It is the supplier’s responsibility to manage the sourcing of materials. After manufacturing, the shirt is shipped by boat to Europe, where it is stored in a distribution centre. From the distribution centre, the shirt can be shipped to markets all over the world. The method of shipment from the DC varies depending on where the receiving country is located. Regarding unsold garments, Company X includes outlets in their business model, and products that are not sold via first hand retailers and wholesalers are transferred to the outlet markets. Garments that are deemed to have lost their market value are transferred to the second hand market. This is coordinated by a charity organisation that collects the unsold garments (CSR responsible and Project Manager of Logistics 2015 at Company X, 2015). There is however, no preferred method of disposal for garments that are no longer wearable, considering the many receiving markets of Company X. Regarding environmental assessments, Company X relies on external competence for conducting these. There is no set strategy or plan for which part of the supply chain is to be subjected to an assessment, or when to perform assessments. Historic assessments include carbon footprint analysis and assessments of chemical use, although not specifically concerning the cotton shirt or an entire supply chain. Moreover, the company relies on supplier agreements and internal codes of conducts for ensuring that suppliers oblige to local laws and regulations regarding indicators such as chemical use. In addition, Company X utilises partnerships in organisations such as BSCI that coordinates and facilitates audits of suppliers regarding working conditions, and to some extent environmental indicators.

19
4.3 Main findings from the literature review
4.3.1 Supply chain phases and compatible assessment tools
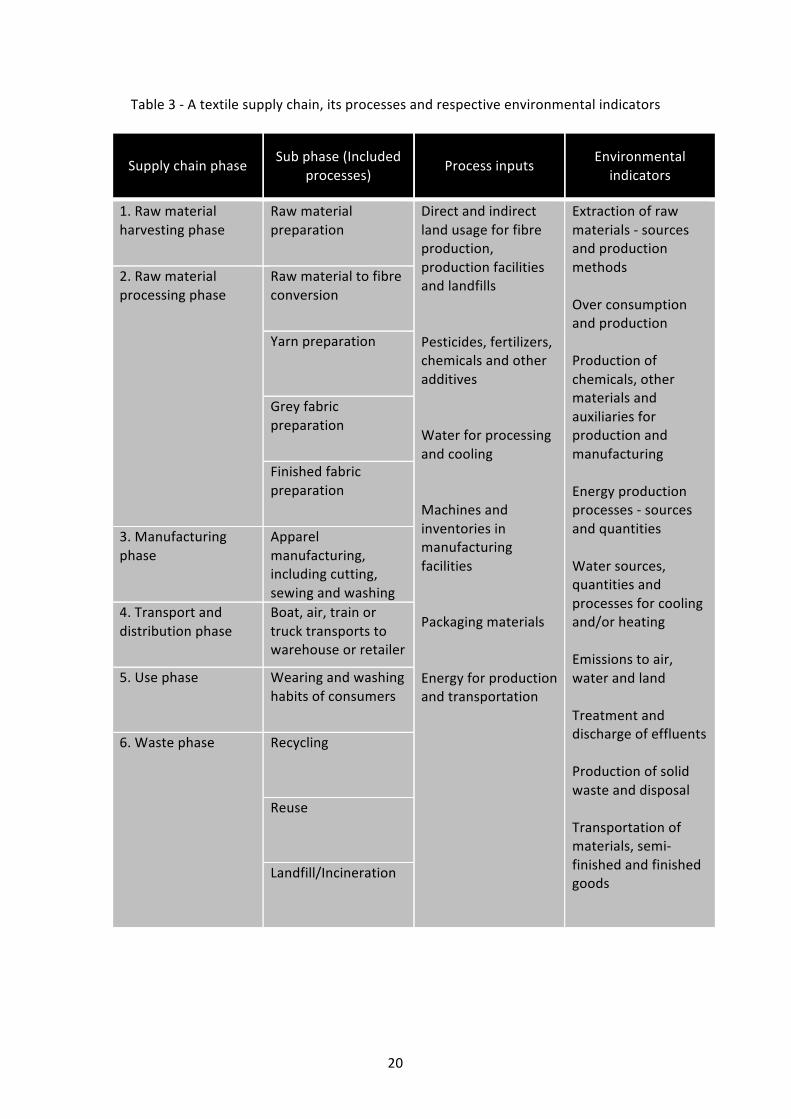
As presented in the literature review, an apparel supply chain is comprised of some general features, which include main phases, sub-‐processes, process inputs and environmental indicators. These features are explained further and summarised in Table 3 below. Worth noting is that phases 1 and 2 are considered challenging to estimate in terms of environmental sustainability due to lack of transparency, specifically in cases where independent subcontractors are utilized (Muthu, 2014). In addition, phases 5 and 6 are complex to assess because waste generation and material recycling is dependent on infrastructures for waste management that vary for each country (market). Hence, in order to perform an accurate assessment, a company must know how much of the products are landfilled, incinerated or recycled in each market (Muthu, 2014; Caniato et al., 2012). With this in mind, phases 3 and 4 are regarded the most promising ones in terms of collecting data and performing comprehensive sustainability assessments. Furthermore, several of the identified environmental indicators and process inputs can emerge more than once in the various processes throughout the supply chain. It is therefore problematic to appoint a certain phase of the supply chain as the main source. However, since the footprints investigated have flexible system boundaries and are not exclusively applicable to either one of the supply chain phases, the problem of allocating the indicators is not considered to be an issue of great significance for this study.
20
Table 3 -‐ A textile supply chain, its processes and respective environmental indicators
Supply chain phase Sub phase (Included processes)
Process inputs Environmental indicators
1. Raw material harvesting phase
Raw material preparation
Direct and indirect land usage for fibre production, production facilities and landfills Pesticides, fertilizers, chemicals and other additives Water for processing and cooling Machines and inventories in manufacturing facilities Packaging materials Energy for production and transportation
Extraction of raw materials -‐ sources and production methods Over consumption and production Production of chemicals, other materials and auxiliaries for production and manufacturing Energy production processes -‐ sources and quantities Water sources, quantities and processes for cooling and/or heating Emissions to air, water and land Treatment and discharge of effluents Production of solid waste and disposal Transportation of materials, semi-‐finished and finished goods
2. Raw material processing phase
Raw material to fibre conversion
Yarn preparation
Grey fabric preparation
Finished fabric preparation
3. Manufacturing phase
Apparel manufacturing, including cutting, sewing and washing
4. Transport and distribution phase
Boat, air, train or truck transports to warehouse or retailer
5. Use phase Wearing and washing habits of consumers
6. Waste phase Recycling
Reuse
Landfill/Incineration

21
Moreover, in Table 4, an overview of the main highlights regarding purpose, system boundaries, as well as strengths and weaknesses of the various footprint tools is provided. It was found that a common weakness for all tools were lack of reliable data and hence, the use of generic data and assumptions. As argued in the introduction and the literature review, this is an effect of the lack of transparency in apparel supply chains. In addition, when considered separately as tools for assessing the environmental sustainability of a supply chain, none of the footprints offer a comprehensive enough scope to cover all of the identified environmental indicators. Yet, when integrated and applied within a well-‐defined system boundary, the footprints offer several possibilities for sustainability assessments of an apparel supply chain. The applicability of each footprint is further analysed in section 5.1.

22
Table 4 – The determined assessment tools and their main attributes
Footprint/ Applications
Ecological footprint
Carbon footprint
Material footprint
Water footprint
Chemical footprint
System boundary
Product and regional level
Product and regional level
Product level Product and regional level
Product and regional level
Purpose
Estimate the resources required, as well as the effect on bio capacity, to supply the overall demand of customers
Estimate the total carbon footprint of all processes necessary to produce and transport the product
Estimate the environmental impact of material choices and amount of raw materials used
Estimate the environmental impact of water usage within raw material processing and manufacturing
Estimate the environmental impact of chemical use and how this corresponds to the choice of raw material
Strengths
Strong communi-‐cative tool Considers both demand and supply
Strong communi-‐cative tool Available data Consistency with standards
Allows for identification of wasteful processes and reduction measures
Allows for identification of wasteful processes and reduction measures Complement to the ecological footprint Considers both internal and external consumption
Considers the environmental impact of the consumption Highly relevant for the apparel industry
Weaknesses
Difficulties of determining system boundaries Lack of data for some regions
Narrow scope Lack of data
Does not consider environmental impact of the consumption Lack of data
Does not consider environmental impact of the consumption Lack of data
Lack of data
23
5 Analysis In this section the applicability of the identified footprints in the apparel supply chain is determined. This is followed by a brief analysis of misalignments between Company X’s applied methods and preferred methods of stakeholders and research community. The section is concluded with a suggestion for a conceptual model aimed at decreasing misalignments and facilitating strategy management regarding environmental sustainability assessment of apparel supply chains.
5.1 The applicability of identified footprints in the apparel supply chain
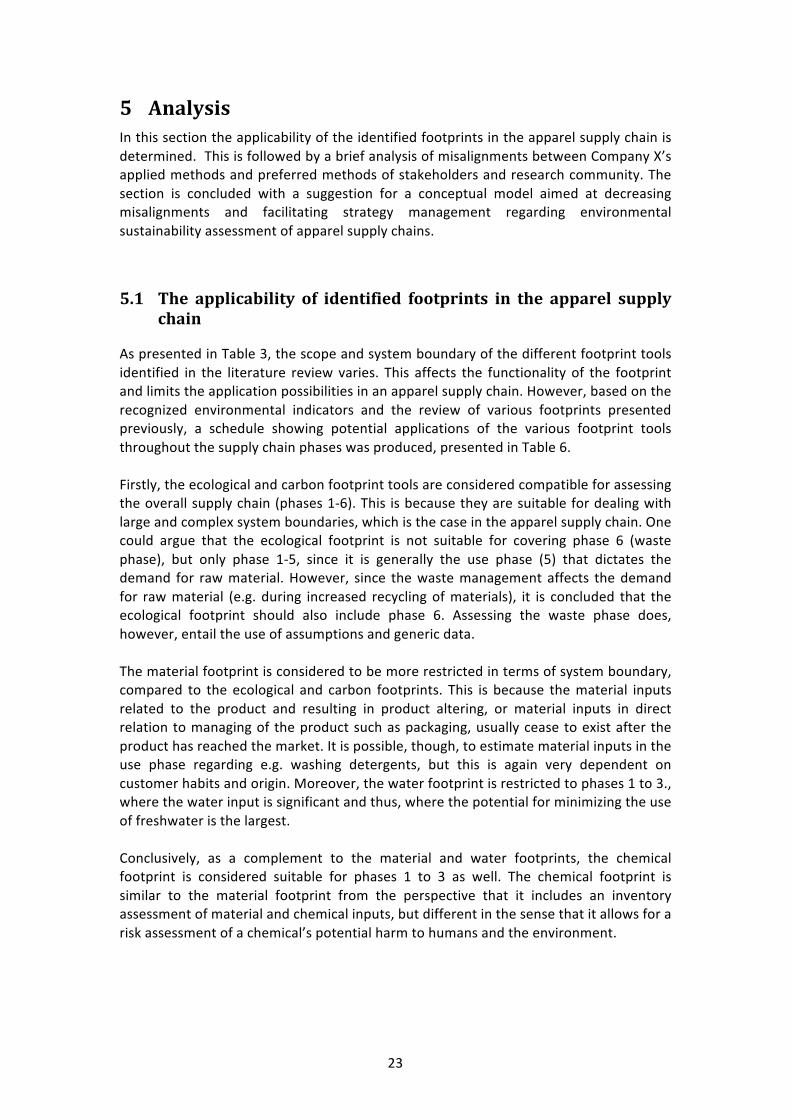
As presented in Table 3, the scope and system boundary of the different footprint tools identified in the literature review varies. This affects the functionality of the footprint and limits the application possibilities in an apparel supply chain. However, based on the recognized environmental indicators and the review of various footprints presented previously, a schedule showing potential applications of the various footprint tools throughout the supply chain phases was produced, presented in Table 6. Firstly, the ecological and carbon footprint tools are considered compatible for assessing the overall supply chain (phases 1-‐6). This is because they are suitable for dealing with large and complex system boundaries, which is the case in the apparel supply chain. One could argue that the ecological footprint is not suitable for covering phase 6 (waste phase), but only phase 1-‐5, since it is generally the use phase (5) that dictates the demand for raw material. However, since the waste management affects the demand for raw material (e.g. during increased recycling of materials), it is concluded that the ecological footprint should also include phase 6. Assessing the waste phase does, however, entail the use of assumptions and generic data. The material footprint is considered to be more restricted in terms of system boundary, compared to the ecological and carbon footprints. This is because the material inputs related to the product and resulting in product altering, or material inputs in direct relation to managing of the product such as packaging, usually cease to exist after the product has reached the market. It is possible, though, to estimate material inputs in the use phase regarding e.g. washing detergents, but this is again very dependent on customer habits and origin. Moreover, the water footprint is restricted to phases 1 to 3., where the water input is significant and thus, where the potential for minimizing the use of freshwater is the largest. Conclusively, as a complement to the material and water footprints, the chemical footprint is considered suitable for phases 1 to 3 as well. The chemical footprint is similar to the material footprint from the perspective that it includes an inventory assessment of material and chemical inputs, but different in the sense that it allows for a risk assessment of a chemical’s potential harm to humans and the environment.

24
Table 6 – Overview of relevant footprint tools and their applicability within an apparel supply chain.
Footprint/ Supply chain phase
Ecological footprint
Carbon footprint
Material footprint
Water footprint
Chemical footprint
1. Raw material harvesting X X X X X
2. Raw material processing X X X X X
3. Manufacturing phase X X X X X
4. Transport and distribution phase
X X X
5. Use phase X X
6. Waste phase X X
5.2 Comparing Company X applications with preferred methods
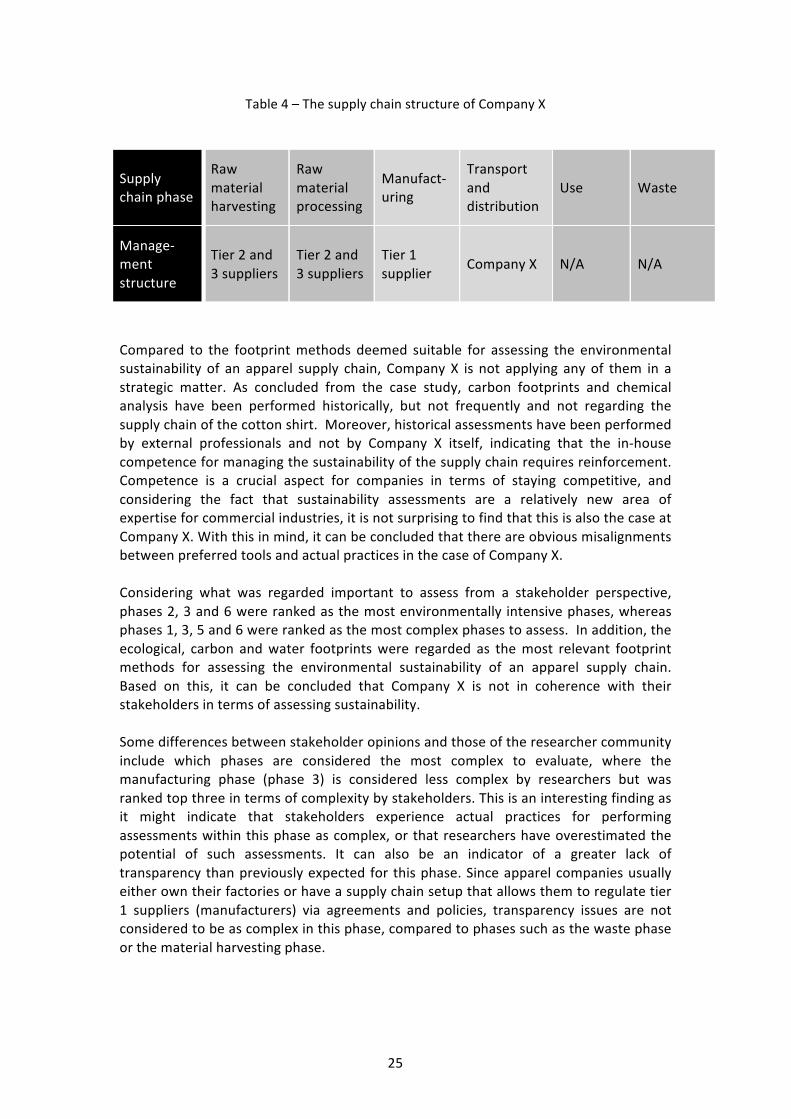
Compared to the general phases of an apparel supply chain, the supply chain of Company X corresponds rather well, as can be concluded from Table 4. However, since the company utilises a subcontractor for production of the shirt and sourcing of raw materials, there is limited control and insight to tier 2 and tier 3 suppliers, i.e. raw material providers and raw material processors (corresponding to supply chain phases 1 and 2). As illustrated in Table 4, the darker grey shades of the supply chain of Company X indicate which phases Company X has limited insight to and hence, limited control over. The manufacturing and transport phases (in light grey) are those that Company X has insight to, and thus in theory, are able to influence, either via supplier agreements for regulating business terms, or internal management processes. The table clearly illustrates the issues of poor transparency in the supply chain.
25
Table 4 – The supply chain structure of Company X
Supply chain phase
Raw material harvesting
Raw material processing
Manufact-‐uring
Transport and distribution
Use Waste
Manage-‐ ment structure
Tier 2 and 3 suppliers
Tier 2 and 3 suppliers
Tier 1 supplier
Company X N/A N/A
Compared to the footprint methods deemed suitable for assessing the environmental sustainability of an apparel supply chain, Company X is not applying any of them in a strategic matter. As concluded from the case study, carbon footprints and chemical analysis have been performed historically, but not frequently and not regarding the supply chain of the cotton shirt. Moreover, historical assessments have been performed by external professionals and not by Company X itself, indicating that the in-‐house competence for managing the sustainability of the supply chain requires reinforcement. Competence is a crucial aspect for companies in terms of staying competitive, and considering the fact that sustainability assessments are a relatively new area of expertise for commercial industries, it is not surprising to find that this is also the case at Company X. With this in mind, it can be concluded that there are obvious misalignments between preferred tools and actual practices in the case of Company X. Considering what was regarded important to assess from a stakeholder perspective, phases 2, 3 and 6 were ranked as the most environmentally intensive phases, whereas phases 1, 3, 5 and 6 were ranked as the most complex phases to assess. In addition, the ecological, carbon and water footprints were regarded as the most relevant footprint methods for assessing the environmental sustainability of an apparel supply chain. Based on this, it can be concluded that Company X is not in coherence with their stakeholders in terms of assessing sustainability. Some differences between stakeholder opinions and those of the researcher community include which phases are considered the most complex to evaluate, where the manufacturing phase (phase 3) is considered less complex by researchers but was ranked top three in terms of complexity by stakeholders. This is an interesting finding as it might indicate that stakeholders experience actual practices for performing assessments within this phase as complex, or that researchers have overestimated the potential of such assessments. It can also be an indicator of a greater lack of transparency than previously expected for this phase. Since apparel companies usually either own their factories or have a supply chain setup that allows them to regulate tier 1 suppliers (manufacturers) via agreements and policies, transparency issues are not considered to be as complex in this phase, compared to phases such as the waste phase or the material harvesting phase.

26
5.3 A conceptual model for developing assessment strategies
The analysis of applied practices and preferred methods above indicates that some factors regarding the assessment of an apparel supply chain require comprehensive strategies. These include increased transparency, creating inventories of material inputs and outputs, risk assessments and creating an in-‐house competence bank. Based on this, as well as the review of various footprint methods, a conceptual model for developing strategies for environmental sustainability assessments of an apparel supply chain was developed. The model is presented in figure 2. The model includes four steps where the first three steps comprise an analysis of the supply chain including: inputs, outputs, environmental indicators and transparency issues. By performing the first three steps, a company can produce a risk assessment including: a) an analysis of where transparency is limited concerning processes, input and outputs and b) an investigation of significant weaknesses in terms of environmental harmfulness. This in turn allows a company to rank the various phases and sub-‐processes based on the above-‐mentioned risks, and with respect to individual challenges and prerequisites of the company in question. Moreover, ranking the phases permits the creation of a prioritisation scheme between them, allowing a company to plan and allocate resources (human and financial resources) more efficiently. Conclusively, the fourth step involves determining an actual strategy for sustainability assessment of the weakest parts of the supply chain (identified in the previous steps), possibly by applying the footprint methods identified for the various supply chain phases in this study. Thus, a structured approach for sustainability assessment and resource allocation is developed, depending on where the need is currently the greatest. Thereafter, should in-‐house competence be deemed insufficient after having set the strategy and allocated the resources, it can be complemented with external expertise. By approaching sustainability assessments according to the model, a business can gradually improve in-‐house competence regarding sustainability assessments, and misalignments between research community and industry can be decreased.

27
Figure 2 – Conceptual model for determining strategies for environmental sustainability
assessments

28
6 Conclusion Based on the objectives set up in the initial phase of this study, the following can be concluded:
Objective 1 -‐ Determine one product and its respective supply chain within an apparel company for further analysis.
The product chosen for analysis was a cotton shirt. The shirt is a significant product in terms of sales volume, market share and material availability for Company X. According to findings from the literature review, the supply chain structure of the cotton shirt is comparable to the structure of a general apparel supply chain. The phases of the supply chain include: Raw material harvesting, raw material processing, manufacturing, transport and distribution, use and waste.
Objective 2 -‐ Determine which methods and tools are suitable to assess the environmental sustainability of such a supply chain.
Several tools and methods for evaluating the environmental sustainability of an apparel supply chain have been investigated. Based on an extensive literature review and a stakeholder opinion assessment, it is concluded that appropriate tools for assessing an apparel supply chain include:
• Ecological footprint • Carbon footprint • Material footprint • Chemical footprint • Water footprint
When considered separately, these tools are limited and are not suitable for assessing the overall environmental sustainability of an apparel supply chain, but if integrated and applied in a complementary manner, they cover all phases of the supply chain.
Objective 3 -‐ Investigate how the findings from objective two are approached within the apparel company, highlighting possible misalignments between the apparel industry and research community.
Results indicate that the tools identified in objective 2 are not utilized strategically in Company X. The company relies on external competence for assessing sustainability, but in regards to the supply chain of the cotton shirt, there is no strategy for what to assess and when to assess it. An example of an earlier sustainability tool applied within the company is that of a carbon footprint analysis. That was, however, not performed in relation to the cotton shirt. With this in mind, it can be concluded that there is a misalignment between Company X and the researcher and stakeholder communities in terms of assessing the environmental sustainability of an apparel supply chain.
29
Objective 4 -‐ Based on objective three, develop a conceptual model for conducting environmental sustainability assessment strategies of an apparel supply chain.
By analysing and highlighting the misalignments between Company X and the researcher and stakeholder communities, it could be concluded that increased transparency, inventories of material inputs and outputs, risk assessments as well as in-‐house competence are significant factors when assessing the environmental sustainability of apparel supply chains. Therefore, based on these factors, a conceptual model aimed at facilitating the development of sustainability assessment strategies was designed. The aim of this study was to produce a conceptual model for developing strategies on how to assess the environmental sustainability of an apparel supply chain. This was based on a purpose of trying to achieve a decrease in the misalignment between researchers and apparel industry in terms of conducting environmental sustainability assessments. Divided into four steps, the model introduces a practical approach for generating a risk assessment and a prioritisation scheme, which allows for resource allocation and competence reinforcement regarding sustainability assessments within an apparel company. Hence, the misalignments between researchers and the apparel industry can hopefully be decreased.
30
7 Recommendations for further studies A finding of this study that did not correlate to the identified objectives included the complexity of determining who is responsible for the environmental indicators of a supply chain when there are various companies involved in the production. Is it the company buying the product, the manufacturer or the even the consumer that is responsible for the possible environmentally harmful effects of consumption? By determining relationships between companies and encouraging cooperation, transparency can increase, allowing for improved sustainability of apparel supply chains. It is therefore recommended that relationships between companies in complex supply chains be further analysed and suggestions for improved cooperation are developed. Moreover, it was found that stakeholders considered the manufacturing phase as complex in terms of sustainability assessments, whereas the same phase was deemed not as complex by researchers. This should be further investigated in order to delimit the possibility of it being a coincidence.

31
References
Allwood, J.M. et al., 2006. Well Dressed? The Present and Future Sustainability of Clothing and Textiles in the United Kingdom, Cambridge. Available at: http://www.ifm.eng.cam.ac.uk/uploads/Resources/Other_Reports/UK_textiles.pdf [Accessed April 21, 2015]. Bringezu, S., Schütz, H., & Moll, S. (2003). Rationale for and interpretation of economy-‐wide materials flow analysis and derived indicators. Journal of Industrial Ecology, 7(2), 43-‐64. Canadian Supply Chain Sector Council, 2015. SUPPLY CHAIN DEFINITIONS. Available at: http://www.supplychaincanada.org/en/supply-‐chain [Accessed April 26, 2015]. Caniato, F. et al., 2012. Environmental sustainability in fashion supply chains: An exploratory case based research. International Journal of Production Economics, 135(2), pp.659–670. Available at: http://www.sciencedirect.com/science/article/pii/S0925527311002659 [Accessed December 18, 2014]. Chambers, N., Simmons, C., & Wackernagel, M. (2014). Sharing nature's interest: ecological footprints as an indicator of sustainability. Routledge. Chapman, A. (2010). Mistra Future Fashion–Review of Life Cycle Assessments of Clothing. Aylesbury: Oakdene Hollins Research & Consulting. CIRFS: European Man-‐Made Fibres Association, 2015. Viscose. Man made fibres. Available at: http://www.cirfs.org/manmadefibres/fibrerange/Viscose.aspx [Accessed May 29, 2015]. Čuček, L., Klemeš, J.J. & Kravanja, Z., 2012. A Review of Footprint analysis tools for monitoring impacts on sustainability. Journal of Cleaner Production, 34, pp.9–20. Available at: http://www.sciencedirect.com/science/article/pii/S0959652612001126 [Accessed Feb 13, 2015]. Galli, A., Wiedmann, T., Ercin, E., Knoblauch, D., Ewing, B., & Giljum, S. (2012). Integrating ecological, carbon and water footprint into a “footprint family” of indicators: definition and role in tracking human pressure on the planet. Ecological Indicators, 16, 100-‐112. Available at: http://www.sciencedirect.com/science/article/pii/S1470160X11001889 [Accessed March 23, 2015]. Gardetti, M.A. & Torres, A.L. eds., 2013. Sustainability in Fashion and Textiles: Values, Design, Production and Consumption. In Sustainability in Fashion and Textiles: Values, Design, Production and Consumption. Greenleaf Publishing Limited, pp. 1–20. Available at: http://www.greenleaf-‐publishing.com/content/pdfs/fashion_intro.pdf [Accessed April 21, 2015].
32
Greenpeace, 2011. Dirty Laundry, Available at: http://www.greenpeace.org/international/Global/international/publications/toxics/Water 2011/dirty-‐laundry-‐12pages.pdf [Accessed May 21, 2015]. Green Choices, Green Choices -‐ Environmental impacts of clothing. 2015. Available at: http://www.greenchoices.org/green-‐living/clothes/environmental-‐impacts [Accessed June 8, 2015]. Herva, M. et al., 2011. Review of corporate environmental indicators. Journal of Cleaner Production, 19(15), pp.1687–1699. Available at: http://www.sciencedirect.com/science/article/pii/S0959652611001892 [Accessed April 17, 2015]. Hitchcock, K., Panko, J. & Scott, P., 2012. Incorporating chemical footprint reporting into social responsibility reporting. Integrated Environmental Assessment and Management, 8(2), pp.386–388. Available at: http://www.ncbi.nlm.nih.gov/pubmed/22431357 [Accessed April 20, 2015]. Kordas, O., 2014. Transdisciplinary research (TdR). Stakeholder analysis (Online via KTH intranet Bilda) Department of sustainable development, environmental science and engineering Industrial ecology. Available at: https://bilda.kth.se/courseId/11398/node.do?id=22377262&ts=1410165896101&u=2071328892 [Accessed March 21, 2015]. Moffatt, I. (2000). Ecological footprints and sustainable development. Ecological economics, 32(3), 359-‐362. Morris, D., 2011. The Fibres, Textiles and Textile Manufacturing Industries, 1970 – 2020: Some Observations. In 80th International Wool Textile Organisation Congress. Hangzhou, People’s Republic of China: CIRFS. Available at: http://www.iwto.org/uploaded/events/2011_hangzhou/02_Morris_Paper_on_The_Fibers_textiles_and_textile_manufacturing_industries_1970-‐2020.pdf [Accessed February 13, 2015]. Mason-‐Jones, R., Naylor, B. & Towill, D.R., 2010. Lean, agile or leagile? Matching your supply chain to the marketplace. International Journal of Production Research, 38(17), pp.4061–4070. Available at: http://www.tandfonline.com/doi/abs/10.1080/00207540050204920 [Accessed May 27, 2015]. Muthu, S. S. (2014). Assessing the environmental impact of textiles and the clothing supply chain. Elsevier. Naturvårdsverket & Kemikalieinspektionen, 2010. Den svenska konsumtionens globala miljöpåverkan, Available at: http://www.naturvardsverket.se/Miljoarbete-‐i-‐samhallet/Miljoarbete-‐i-‐Sverige/Uppdelat-‐efter-‐omrade/Avfall/Avfallsforebyggande-‐program/Textil/# [Accessed May 12, 2015].
33
Office of Energy efficiency and renewable energy, 2014. MANUFACTURING ENERGY AND CARBON FOOTPRINTS (2010 MECS). Available at: http://energy.gov/eere/amo/manufacturing-‐energy-‐and-‐carbon-‐footprints-‐2010-‐mecs [Accessed March 12, 2015]. Paraschiv, D., Tudor, C. & Petrariu, Ra., 2015. The Textile Industry and Sustainable Development: A Holt–Winters Forecasting Investigation for the Eastern European Area. Sustainability, 7, pp.1280–1291. Available at: file:///Users/kontrollanvandare/Downloads/sustainability-‐07-‐01280.pdf [Accessed March 21, 2015]. Quist, J. & Vergragt, P., 2006. Past and future of backcasting: The shift to stakeholder participation and a proposal for a methodological framework. Futures, 38(9), pp.1027–1045. Available at: https://bilda.kth.se/courseId/11398/node.do?id=22379139&ts=1410186439597&u=20713288 2 [Accessed May 20, 2015]. Styles, D., Schoenberger, H. & Galvez-‐Martos, J.-‐L., 2012. Environmental improvement of product supply chains: proposed best practice techniques, quantitative indicators and benchmarks of excellence for retailers. Journal of environmental management, 110, pp.135–50. Available at: http://www.sciencedirect.com/science/article/pii/S0301479712002800 [Accessed March 9, 2015]. Thiry, M.C., 2011. Staying alive: Making textiles sustainable. AATCC Review, 11 (6), pp. 26–32. Available at: http://www.aatcc.org/media/read/documents/sustain1111.pdf [Accessed February 13, 2015]. Tukker, A., 2006. Environmental Impact of Products (EIPRO), Available at: http://ec.europa.eu/environment/ipp/pdf/eipro_report.pdf. [Accessed February 13, 2015]. United States Environmental Protection Agency, 2014. Environmental Footprint Analysis | Sustainability Analytics | Research | US EPA. Available at: http://www.epa.gov/sustainability/analytics/environmental-‐footprint.htm [Accessed February 12, 2015]. World Trade Organization, 2014. International Trade Statistics 2014, Available at: http://www.wto.org/english/res_e/statis_e/its2014_e/its2014_e.pdf [Accessed February 14, 2015]. WWF, 2014. Living Planet report 2014, Available at: file:///Users/kontrollanvandare/Downloads/wwf_lpr2014_low_res.pdf [Accessed May 1, 2015].
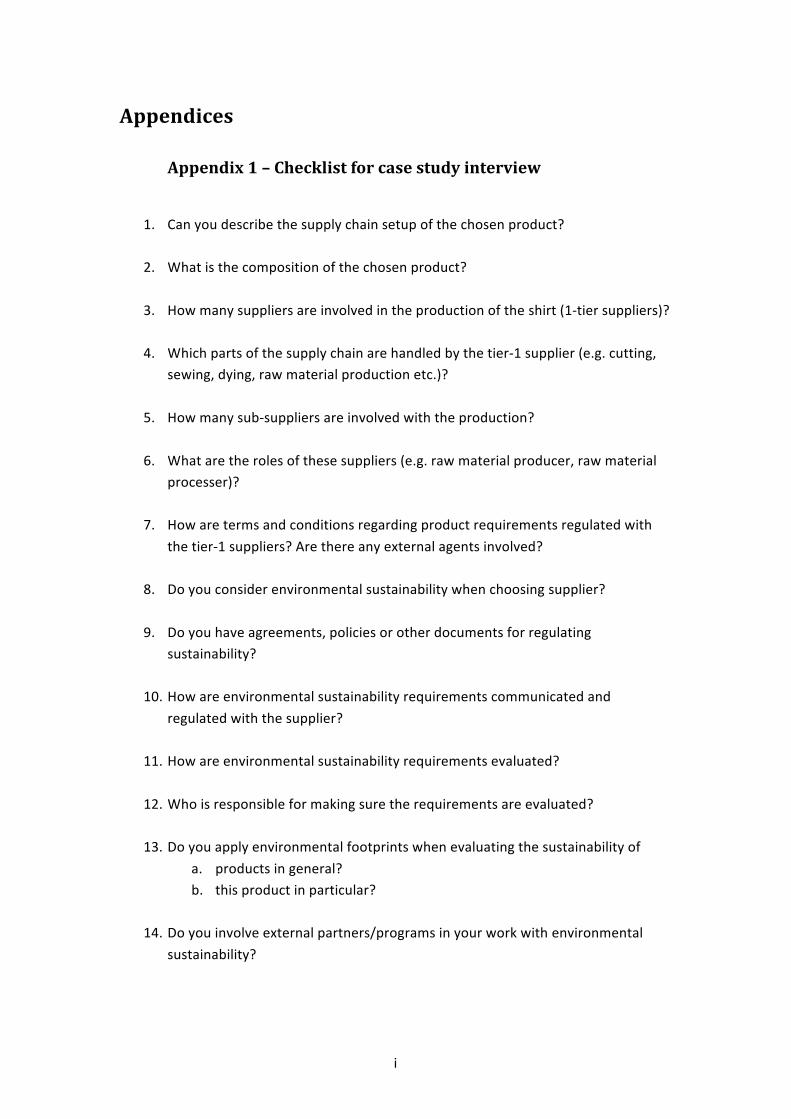
i
Appendices
Appendix 1 – Checklist for case study interview
1. Can you describe the supply chain setup of the chosen product?
2. What is the composition of the chosen product?
3. How many suppliers are involved in the production of the shirt (1-‐tier suppliers)?
4. Which parts of the supply chain are handled by the tier-‐1 supplier (e.g. cutting,
sewing, dying, raw material production etc.)?
5. How many sub-‐suppliers are involved with the production?
6. What are the roles of these suppliers (e.g. raw material producer, raw material processer)?
7. How are terms and conditions regarding product requirements regulated with
the tier-‐1 suppliers? Are there any external agents involved?
8. Do you consider environmental sustainability when choosing supplier?
9. Do you have agreements, policies or other documents for regulating sustainability?
10. How are environmental sustainability requirements communicated and
regulated with the supplier?
11. How are environmental sustainability requirements evaluated?
12. Who is responsible for making sure the requirements are evaluated?
13. Do you apply environmental footprints when evaluating the sustainability of a. products in general? b. this product in particular?
14. Do you involve external partners/programs in your work with environmental
sustainability?
ii
Appendix 2 – Questionnaire of stakeholder opinion assessment
General Information
I am writing a master thesis about environmental sustainability analysis of
textile products for the department of Industrial Ecology at KTH. I would like
your help to perform a stakeholder opinion assessment about what
parameters that are important to consider for such an analysis. In order to
achieve this, I have produced this questionnaire with a total of 15 questions
for you to answer. It will take approximately 5-10 minutes to complete.
If you do not recognize some of the technical terms in the questionnaire, or for
some other reason cannot answer a question, please answer “other” where
possible.
Your answers will be treated with the utmost respect. If you wish for you, or
the organization you are representing, to be anonymous in the report, please
mark the box below with an X.
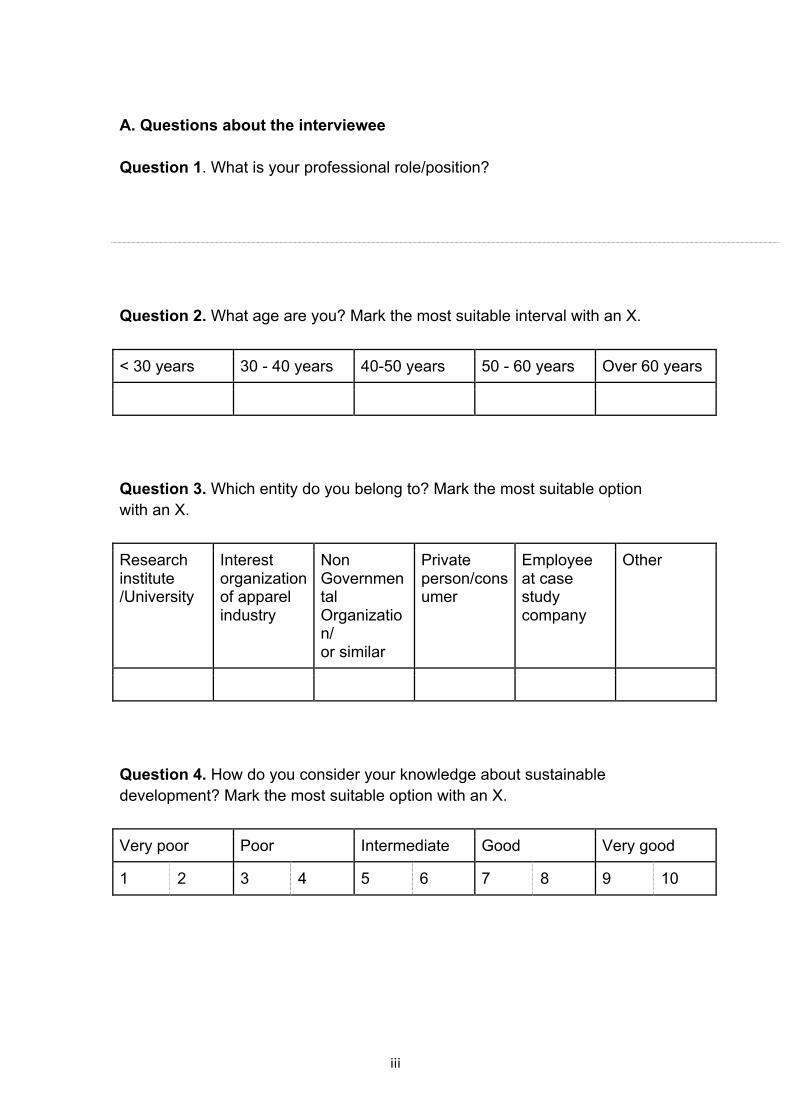
iii
A. Questions about the interviewee Question 1. What is your professional role/position? Question 2. What age are you? Mark the most suitable interval with an X.
< 30 years 30 - 40 years 40-50 years 50 - 60 years Over 60 years
Question 3. Which entity do you belong to? Mark the most suitable option with an X.
Research institute /University
Interest organization of apparel industry
Non Governmental Organization/ or similar
Private person/consumer
Employee at case study company
Other
Question 4. How do you consider your knowledge about sustainable development? Mark the most suitable option with an X.
Very poor Poor Intermediate Good Very good
1 2 3 4 5 6 7 8 9 10
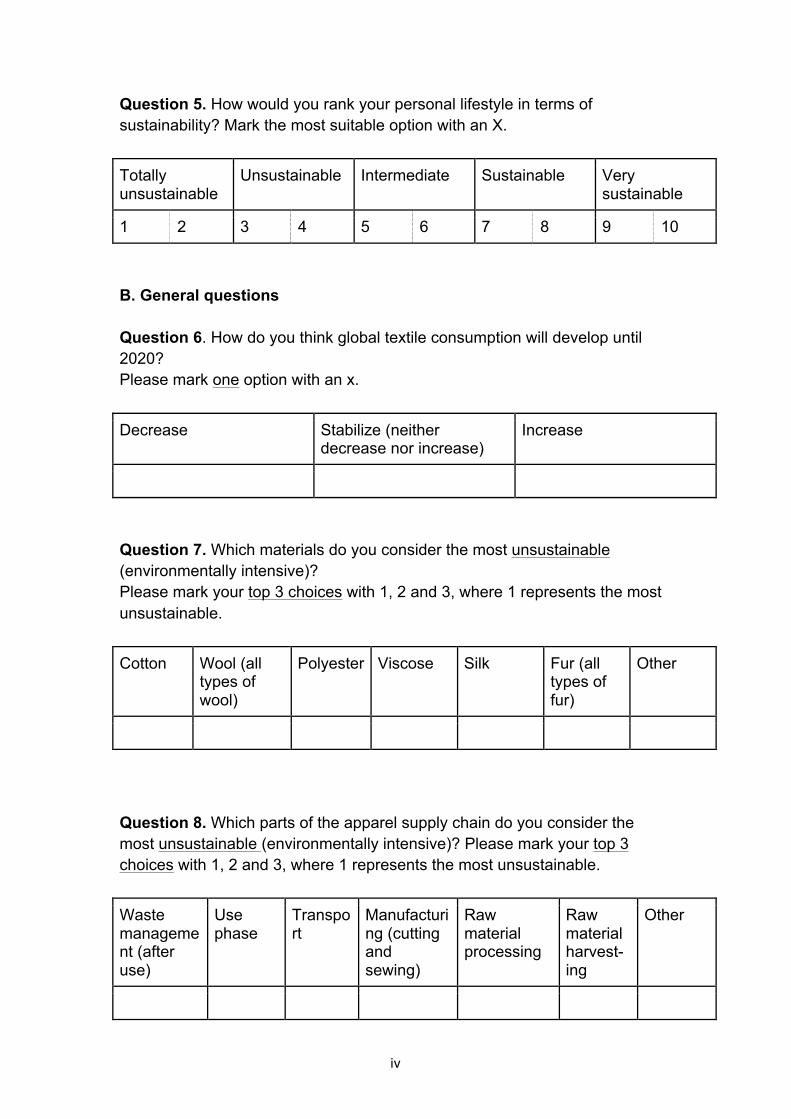
iv
Question 5. How would you rank your personal lifestyle in terms of sustainability? Mark the most suitable option with an X.
Totally unsustainable
Unsustainable Intermediate Sustainable Very sustainable
1 2 3 4 5 6 7 8 9 10 B. General questions Question 6. How do you think global textile consumption will develop until 2020? Please mark one option with an x.
Decrease Stabilize (neither decrease nor increase)
Increase
Question 7. Which materials do you consider the most unsustainable (environmentally intensive)? Please mark your top 3 choices with 1, 2 and 3, where 1 represents the most unsustainable.
Cotton Wool (all types of wool)
Polyester Viscose Silk Fur (all types of fur)
Other
Question 8. Which parts of the apparel supply chain do you consider the most unsustainable (environmentally intensive)? Please mark your top 3 choices with 1, 2 and 3, where 1 represents the most unsustainable.
Waste management (after use)
Use phase
Transport
Manufacturing (cutting and sewing)
Raw material processing
Raw material harvest-ing
Other

v
Question 9. Which sectors do you think will have the biggest influence in achieving a more sustainable apparel industry? Please mark your top 3 choices with 1, 2 and 3, where 1 represents the option with the biggest influence.
Political sector
Private companies
Non Governmental Organization/ or similar
Research institutes and/or Universities
Consumers Other
C. Questions related to the thesis work Question 10. When analyzing the overall sustainability of a textile product, do you consider the economic, social or environmental sustainability to be of greatest importance? Please mark one option with an x.
Economic Social Environmental Neither, they are all equally important
No opinion
Question 11. Regarding the environmental sustainability of a textile product, which footprint do you consider the most relevant to analyze? Please mark your top 3 choices with 1, 2 and 3, where 1 represents the most relevant.
Material footprint
Water footprint
Carbon footprint
Energy footprint
Ecological footprint
Other/no opinion
If you chose ‘other’, please state which one:

vi
Question 12. Regarding the environmental sustainability of a textile product, which supply chain phase do you consider the most important to analyze? Please mark your top 3 choices with 1, 2 and 3, where 1 represents the most important.
Waste phase (after use)
Use phase
Transport
Manufacturing (cutting and sewing)
Raw material processing
Raw material harvesting
All options are equally important
Other/no opinion
If you chose ‘other’, please state which one: Question 13. Regarding the environmental sustainability of a textile product, which supply chain phase do you consider the most difficult to analyze in terms of obtaining information? Please mark your top 3 choices with 1, 2 and 3, where 1 represents the most difficult.
Waste phase (after use)
Use phase
Trans-port
Manu-facturing (cutting and sewing)
Raw material process-ing
Raw material harvest-ing
All options are equally important
Other/no opinion
If you chose ‘other’, please state which one:

vii
Question 14. When analyzing the environmental sustainability of a textile product, which factors do you consider most important in order to secure a reliable result? Please mark your top 3 choices with 1, 2 and 3, where 1 represents the most important.
Accessible databases for comparison of data (such as Life Cycle Assessment databases, i.e. GABI)
Collecting your own data and minimizing assumpt-ions
Using standards for analysis, such as ISO or Global Reporting Initiative
Transparency in the supply chain
Certifications and markings
Other/no opinion
If you chose ‘other’, please state which one: Finally, if you have any thoughts or comments connected to the questions above, please feel free to add them below. Thank you for your contribution.
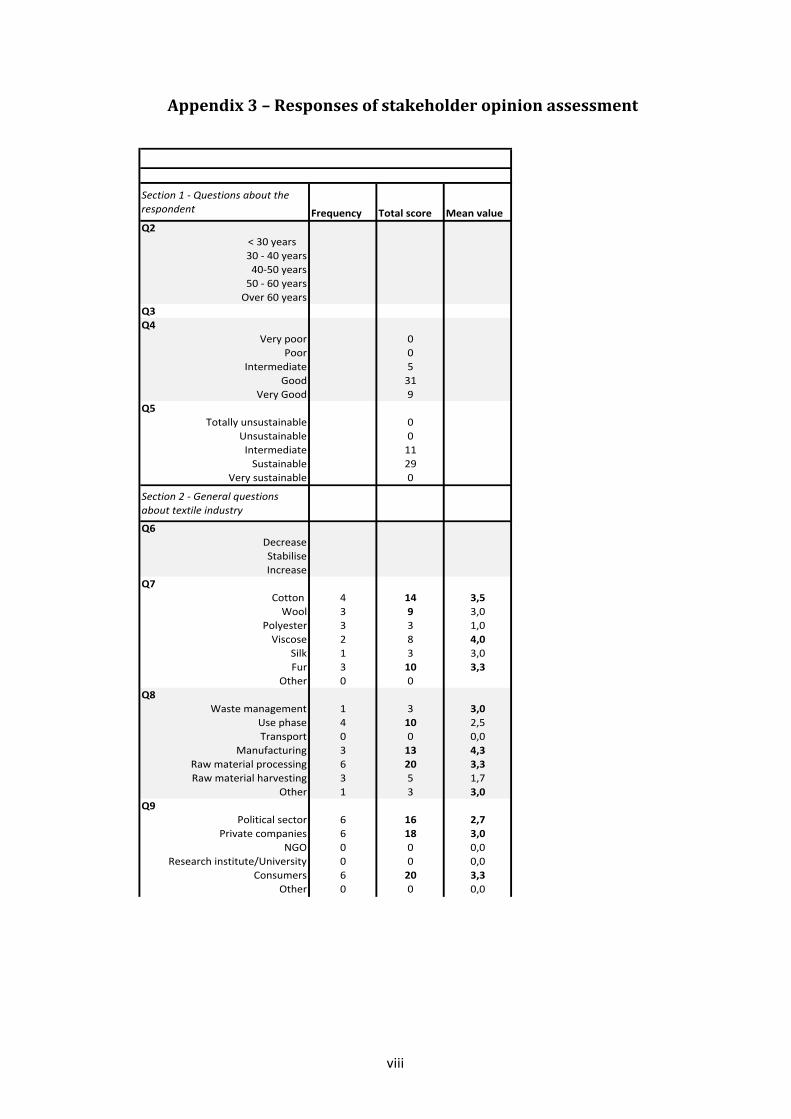
viii
Appendix 3 – Responses of stakeholder opinion assessment
Section(1(*(Questions(about(the(respondent Frequency Total.score Mean.valueQ2
<"30"years""""
30"*"40"years
40*50"years
50"*"60"years
Over"60"years
Q3Q4
Very"poor 0
Poor 0
Intermediate 5
Good 31
Very"Good 9
Q5Totally"unsustainable 0
Unsustainable 0
Intermediate 11
Sustainable 29
Very"sustainable 0
Section(2(*(General(questions(about(textile(industry
Q6Decrease
Stabilise
Increase
Q7Cotton" 4 14 3,5Wool 3 9 3,0
Polyester 3 3 1,0
Viscose 2 8 4,0Silk 1 3 3,0
Fur 3 10 3,3Other 0 0
Q8Waste"management 1 3 3,0
Use"phase 4 10 2,5
Transport 0 0 0,0
Manufacturing 3 13 4,3Raw"material"processing 6 20 3,3Raw"material"harvesting 3 5 1,7
Other 1 3 3,0Q9
Political"sector 6 16 2,7Private"companies 6 18 3,0
NGO 0 0 0,0
Research"institute/University 0 0 0,0
Consumers 6 20 3,3Other 0 0 0,0

ix
Section(3(*(Questions(related(to(thesis(workQ10
Economic 0 0 0,0Social 0 0 0,0
Environmental 3 15 5,0All2are2equally2important 3 15 5,0
No2opinion 0 0 0,0Q11
Material2footprint 2 4 2,0Water2footprint 4 10 2,5Carbon2footprint 2 8 4,0Energy2footprint 3 5 1,7
Ecological2footprint 4 18 4,5Other/no2opinion 1 5 5,0
Q12Waste2phase 4 12 3,0
Use2phase 3 5 1,7Transport 1 3 3,0
Manufacturing 3 11 3,7Raw2material2processing 6 20 3,3Raw2material2harvesting 1 3 3,0
All2options2are2equally2important 0 0 0,0Other/no2opinion 0 0 0,0
Q13Waste2phase 3 9 3,0
Use2phase 3 9 3,0Transport 0 0 0,0
Manufacturing 4 14 3,5Raw2material2processing 6 16 2,7Raw2material2harvesting 2 6 3,0
All2options2are2equally2important 0 0 0,0Other/no2opinion 0 0 0,0
Q14Accessible2databases 5 13 2,6
Collecting2your2own2data 5 9 1,8Using2standards 1 3 3,0Transparency 5 25 5,0
Certifications2and2other2markings 3 4 1,3Other/no2opinion 0 0 0,0
Q15-.-General-comments