environmental publication 2014 02 - a model for … · environmental publication 2014/02 – a...
TRANSCRIPT
A model for assessing unconsented or permitted water use in the Bay of Plenty region Environmental Publication 2014/02 ISSN: 1175-9372 (Print) ISSN: 1179-9471 (Online) May 2014 Bay of Plenty Regional Council 5 Quay Street PO Box 364 Whakatane 3158 NEW ZEALAND Prepared by Janine Barber, Senior Environmental Scientist


Environmental Publication 2014/02 – A model for assessing unconsented or permitted water use in the Bay of Plenty region i
Acknowledgements
Thanks to district council staff:
• Peter Bahrs, Tauranga City Council.
• Paul Van den Berg, Western Bay of Plenty District Council.
• Santha Gunasantha, Leilani Salanguit and Chrissy Seabourne, Whakatāne District Council for the supply of invaluable data from urban water supply schemes.
Thanks to Regional Council staff:
• Ben Banks and Mark Lumsden; Land Management Group.
• Steve Pickles; Pollution Prevention.
• Jonathan Freeman model developer.
• Rachel Medwin model reviewer.
Many thanks to Ed Brown and Waikato Regional Council for providing a method that could be adapted to the Bay of Plenty region.

Environmental Publication 2014/02 – A model for assessing unconsented or permitted water use in the Bay of Plenty region iii
Executive summary
Councils have a responsibility to manage water resources. Part of this management relates to allocation. The Proposed National Environmental Statement (NES) on Ecological Flow and Water Levels requires allocation limits to be set for water bodies. The difficulty councils face is that not all allocation can be quantified. If water is allocated under resource consent it can be tracked and monitored, however there is allocation authorised under the Resource Management Act (RMA) and the Bay of Plenty Regional Council’s Regional Water and Land Plan (WLP) that cannot. The impact of these unknown and unquantified water takes cannot be assessed due to lack of record. Therefore to quantify permitted takes, as authorised under RMA and WLP, a model has been developed to provide potential volumes that these rules allow.
The RMA allows for water to be taken for reasonable domestic and stock water use provided that the use does not or is not likely to have an adverse effect on the environment. The WLP rules allow small takes for any purpose such as dairy shed wash-down, horticultural spray makeup, irrigations of garden/small glasshouse operations, domestic and stock water needs.
The total volume of water actually used under the RMA and WLP is unknown, nor are the cumulative effects of such takes on a water body. A model has been developed to quantify the potential volumes of water provided for under these provisions for each surface water catchment in the Bay of Plenty region. Therefore the results of the model provide the potential total permitted take if all of these permitted provisions were exercised to their fullest simultaneously. This is an unrealistic stance, but is as the rules are written.
The model has been audited an found to be consistent with the provisions of the RMA and WLP, and that the data sets used are reasonable for calculating water use in this region.


Environmental Publication 2014/02 – A model for assessing unconsented or permitted water use in the Bay of Plenty region v
Contents
Acknowledgements i
Executive summary iii
Part 1: Project outline 1
1.1 Introduction 1
Part 2: The model and data used 3
1.1 Introduction 3
1.2 Model aims and objectives 3
1.3 Assessment of domestic use estimates 3
1.4 Assessment of stock use estimates 4
1.5 Dairy shed wash-down/cooling water 6
Part 3: Model development calculations 7
1.6 Spatial techniques (GIS) applied to estimates of population and stock 7
Part 4: Permitted take rule calculations scenario 9
1.7 Outline 9
1.8 Spatial techniques (GIS) applied to estimate the worst case scenarios 9
1.9 Spreadsheet processing 11
Part 5: Running the model 13
1.10 What the model does 13
1.11 How the model is set out 13
1.12 How the model works 13
1.13 Running the model 16
1.14 Possible future scenarios 16
1.15 Model sensitivity 16

Environmental Publication 2014/02 - A model for assessing unconsented or vi permitted water use in the Bay of Plenty region
Part 6: Discussion of model results 19
Part 7: Conclusion 21
Part 8: References 23
Appendix 1 – Estimated domestic water use per catchment based on population, household, address and consent data (Master spreadsheet A2:N167) 29
Appendix 2 – Stock drinking water requirements (Aquas, 2007) + dairy shed use 39
Appendix 2.2 – AgriBaseTM estimated stock numbers (Master spreadsheet O2:AB164) 41
Appendix 2.3 – Land use classification from LCDB2 (outside of AgriBaseTM) areas 49
Appendix 2.4 – Estimated stock water use from LCDB2, outside AgriBaseTM areas (Master spreadsheet AK2:AS164 51
Appendix 2.5 – Stock water use covered by consent (Master spreadsheet AC2:AL164) 59
Appendix 3.1 - Dairy shed water use (Aquas 2007) 69
Appendix 4 - Model estimates of potential permitted water use 73
Appendix 5 – Permitted water use application background to report85

Environmental Publication 2014/02 – A model for assessing unconsented or permitted water use in the Bay of Plenty region 1
Part 1: Project outline
1.1 Introduction
Bay of Plenty Regional Council is reviewing Chapter 5 Water Quantity and Allocation of the Regional Water and Land Plan (WLP). The surface water and groundwater resources can be quantified, as can the allocation for consented water takes, however the permitted takes are not quantified. To better understand the potential water volume available as allocation to permitted takes a model has been developed based on the permitted provisions of RMA and WLP.
1.1.1 Unconsented and permitted activities
Section 14(3)(b) of the Resource Management Act permits water use for certain activities without the need to obtain a resource consent. This allows for water to be taken for reasonable domestic and stock water use provided that the use does not or is not likely to have an adverse effect on the environment.
This provision is qualitative rather than quantitative. The term ‘reasonable’ is not quantified. To estimate the potential volume of the water resources used under this provision, a volume needed to be determined for the model. This was done by using set water use figures for domestic consumption and that of stock.
The permitted rules in the WLP are quantitative, specifying the amount of water that can be taken without resource consent:
Rule 38 Permitted - Take and Use of Groundwater up to 35 m3/day per property.
Rule 41 Permitted - Take and Use of Surface Water up to 15 m3/day per property.
The intent of both WLP rules is to allow small takes for any purpose such as dairy shed wash-down, horticultural spray makeup, irrigations of garden/small glasshouse operations, domestic and stock water needs. The WLP rules do not exclude a use.
For our region the potential volume of water used under the RMA provision and the permitted rules of the WLP is unknown. These water takes form part of the over-all allocation of water, so need to be understood and determined. To aid with this calculation a spreadsheet model has been developed to calculate the potential volume of water taken by these provisions for each catchment in the Bay of Plenty region.
1.1.2 Model overview
A spreadsheet (the model) has been developed that calculates potential permitted water use within a catchment for both domestic supply, stock watering and dairy shed wash down. The model follows a similar model developed by Waikato Regional Council (Technical Report 2007/47).
The model methodology loosely follows that of Waikato Regional Council however water use has been adapted to the Bay of Plenty conditions based on regional plan rules and/or water use figures supplied by Bay of Plenty district councils, and other relevant land use parties.

Environmental Publication 2014/02 – A model for assessing unconsented or 2 permitted water use in the Bay of Plenty region
The approach staff have adopted attempts to calculate the number of people (households) from census and typical water use per person from other data sources, use typical stock drinking water data from Aquas 2007 report, and stock numbers from AgriBaseTM (2010) (dairy, beef, sheep, deer) per surface water catchment. The water use has then been calculated by multiplying the activity and its water needs together.
The model focuses on rural (non-municipal/non-urban) permitted water take and use. This assumes that urban populations and consented water takes would have their domestic and stock water needs met by resource consent.
There are two parts to the model. The estimated water required to meet reasonable domestic and stock watering needs as allowed under the RMA (assuming no adverse environmental effects); and the estimated permitted use against the permitted allocation of the WLP (15 m3/day surface water and 35 m3/day groundwater). For WLP the worst case scenario for each catchment would be the maximum (50 m3/day) use of the permitted water take by each property within the catchment.
The model provides a reasonable first assessment of the potential situation of permitted abstraction from ground and surface water resources within the Bay of Plenty catchments. These are set out in Part 2 of this report.
Environmental Publication 2014/02 – A model for assessing unconsented or permitted water use in the Bay of Plenty region 3
Part 2: The model and data used
1.1 Introduction
The model is contained in the MASTER tab of the Master permitted takes model spreadsheet (Objective ID A1058481). MASTER contains the worked model data. All research and working for the model have been done within the workbook, so that tabs contain information that may not be used in the model but have informed the research for the model. Tables in this report and appendices are created from this workbook.
1.2 Model aims and objectives
• To develop a method for estimating potential water use by permitted takes in the Bay of Plenty by the following users:
Domestic water use in non-urban areas (Appendix 1).
Typical stock drinking water for dairy, beef, sheep, deer, other large stock and other small stock (Appendix 2).
Dairy shed wash down water (Appendix 3).
• Outline how the model works and how it could be run in the future (Part 3, 4 and 5 of this report).
• To calculate and establish a worst case scenario for each catchment, based on the assumption that all land properties within a catchment are taking their full water allowance (+50 m3/day) under the RMA and WLP permitted take rules (Appendix 4).
1.3 Assessment of domestic use estimates
There are different aspects to domestic water use that staff have considered in creating the permitted takes model. These are discussed below.
1.3.1 People per household
The Census 2006 data has been used to gain estimates of the average number of people living in a household within each catchment of the Bay of Plenty region. The census data is in mesh blocks, these mesh blocks do not correspond to catchment boundaries and as such some interpolation of the data has been done using the mapping tool ArcMap, in order to gain the most accurate estimate of population per catchment as possible.
1.3.2 Households per catchment
Two methods were used to estimate the number of households per catchment:
Census 2006
Population estimates from Census 2006 data. Due to the fact that the meshblocks are a different shape and area to catchments they had to be proportioned out, this process will have introduced some errors.

Environmental Publication 2014/02 – A model for assessing unconsented or 4 permitted water use in the Bay of Plenty region
Address point
The assumption has been made that each address point represents a household with a standard population size. The appropriate population size for each catchment was based on meshblock estimates (Census 2006) of people per household for that catchment.
For the model the address point data has been applied as the estimate of population, this provides a worst case scenario compared with the census data calculations.
1.3.3 Household water use estimates
A literature review was conducted. Comparisons were made between domestic use values used by the Bay of Plenty Regional Council’s Guide to the On-Site Effluent Treatment Regional Plan (EBOP, 2006); Horizons Regional Council; Ministry of Health document on household water supply (MOH, 2006); and data provided by Western Bay of Plenty District Council and Tauranga City Council on water use within their districts. From this data a range of 180 litres/person/day to 300 litres/ person/day was considered to be most appropriate for use in the model. The table below shows the figures applied in the model.
Domestic water use Average daily demand (ADD)
Peak daily demand (PDD)
Units litres/person/day
Per person (all ages) 180 300 l/p/d
1.3.4 Properties with consented takes
It has been assumed that properties where there is a consented water take, the household water needs are accounted for within the consent and not from permitted takes. All non-industrial surface and groundwater water consents were identified and the assumption was then made that each consent would be supplying at least one household, equivalent to an average population of 2.8 people/household, Brown et.al. (2007). Thus permitted takes have been taken as zero for properties that have a consented water take. This was done to minimise double counting of water.
1.3.5 Urban areas
Water supply to urban areas falls under the consented takes category, as such all urban areas where town supply is available have been removed from the model.
1.4 Assessment of stock use estimates
For stock water use estimates there are various aspects of water use that need to be considered in creating the permitted takes model. These are discussed below.
1.4.1 Water use requirements for various types of stock
Staff have reviewed Bay of Plenty Regional Council (BOPRC) information and discussed values with consent and compliance staff who suggest that the figures devised by Aquas (2007) for Horizons Regional Council are considered appropriate for application in the Bay of Plenty region. Both the Average Daily Demand (ADD) and Peak Daily Demand (PDD) figures have been applied to provide an upper and a lower range of potential permitted water use.

Environmental Publication 2014/02 – A model for assessing unconsented or permitted water use in the Bay of Plenty region 5
The table below lists the stock water use figures as applied in the model. The stock has been grouped slightly differently to Aquas (2007), the model includes only dairy, beef, deer, sheep, large stock and small stock. Dairy, beef, deer and sheep were considered to be the primary stock in the Bay of Plenty accessing permitted water takes. All other stock was grouped into either large or small stock units.
Stock Average daily demand (ADD)
Peak daily demand (PDD)
Units litres/head/day
Dairy cattle:
Milking cow 45 70 l/h/d
Beef cattle:
Mature beef cattle, herd replacement stock and bulls
30 55 l/h/d
Sheep:
Ewes, hoggets and rams 3 4.5 l/h/d
Deer:
Hinds and stags (all ages) 6 12 l/h/d
All other large stock 30 55 l/h/d
All other small stock 3 4.5 l/h/d
The large stock group includes horses, donkeys and camelids; these have been assigned the same water allowance as beef. The small stock group includes dogs, poultry and goats; these have been assigned the same water allowance as sheep.
1.4.2 Livestock numbers in the Bay of Plenty
Livestock numbers have been obtained from the AgriBaseTM dataset as at August 2010. AgriBaseTM has been compiled by grouping farm stock numbers according to land ownership not catchment. In cases where a single landowner/farm has parcels in adjacent catchments, stock numbers have been split proportional to the area of land in each catchment. Not all dairy farmers in the region subscribe to AgriBaseTM, so there are dairy farms that are not identified within the AgriBaseTM data set.
1.4.3 Stock numbers for non AgriBaseTM land areas
Stock numbers in areas not covered by AgriBaseTM have been calculated from an estimate of the land use area (high or low producing grassland), obtained from LCDB2 (LINZ, 2001). Land use data for the Bay of Plenty region was last captured in 1996 and was considered out of date for use in this model.
Bay of Plenty land management staff suggest that it is reasonable to assume that high producing exotic grassland is dairy and low producing exotic grassland and shrub land is beef, deer or sheep.
The New Zealand Dairy Statistics suggest an average stocking rate of 2.83 cows/ha for dairy cows (LIC 2009). Fleming (2003) suggests a range of between 7 and 22 stocking units per hectare, equivalent to between 1.16 and 3.6 units for beef animals per hectare. BOPRC land management staff suggest that a figure of 15 stocking units or 2.6 beef animals/ha is appropriate for the Bay of Plenty region.
To work out stock water use for non-AgriBaseTM land areas average stocking rates for dairy and beef were used in the calculations; 2.8 head/ha for dairy and 2.6 head/ha for cattle beef. Using these figures produces reasonable results, but

Environmental Publication 2014/02 – A model for assessing unconsented or 6 permitted water use in the Bay of Plenty region
discretion is needed as high producing grassland is not always dairy, particularly for East Cape catchments.
1.5 Dairy shed wash-down/cooling water
Dairy shed use of 70 litres/cow/day was considered reasonable (Aquas, 2007) and has been used within the model. A lower figure of 55 litres/cow/day applied by BOPRC consents staff for dairy shed use was considered an underestimate, mostly due to an increasing trend in dairy shed water use. It was suggested that a figure of up to 70 litres/cow/day would not be uncommon for a rotary dairy shed.

Environmental Publication 2014/02 – A model for assessing unconsented or permitted water use in the Bay of Plenty region 7
Part 3: Model development calculations
1.6 Spatial techniques (GIS) applied to estimates of population and stock
The following summarises the GIS techniques used to develop the model and outlines some of the possible losses introduced through using this process.
1.6.1 Livestock data
• Sum the number of dairy cows, beef cattle, sheep and deer per surface water catchment based on AgriBaseTM data captured up to August 2010.
• Subtract stock numbers from catchment estimates that fall on properties with current water use consents (excluding municipal and or industrial water takes). AgriBaseTM stock numbers are then split proportional to the area represented by the spilt polygon.
• Identify the catchment area not covered by AgriBaseTM.
• Using LCDB2, LINZ (2001), estimate the area per catchment covered by high and low producing exotic grassland.
• Calculate permitted water use per catchment by applying the ADD and PDD figures from Appendix 4.
1.6.2 Population data
• Clip meshblocks to catchments and proportion population according to the percentage of meshblock in each catchment. Remove urban areas and calculate catchment population.
• Sum the number of households per property from address data and convert to a catchment population estimate by multiplying household numbers by household population density on a catchment by catchment basis; assuming each address point represents one household.
• Calculate the number of electricity supply points per catchment and convert to an estimate of population by, multiplying electricity supply points by household population density on a catchment by catchment basis, assuming that each electricity supply point represents one household.
• Calculate the number of households supplied by current consented takes and subtract the number of people from catchment estimates. Current consented takes exclude municipal and industrial water takes. This calculation assumes that each consent supplies at least one household with a population density equivalent to the meshblock household density for that catchment.
1.6.3 Other uses and possible losses
The model deals with the major land use practices and water uses occurring in the Bay of Plenty that are considered to be high users of the permitted provisions (domestic, stock and dairy). Other uses not calculated for in the model include; irrigation of sports grounds, small scale horticultural practices, other urban environments and leakage (loss) from the system (infrastructure).

Environmental Publication 2014/02 – A model for assessing unconsented or 8 permitted water use in the Bay of Plenty region
Horticultural practices of between 0.3 ha (15 m3/day from surface water) and 0.7 ha (35 m3/day from ground water) would fall within the permitted takes category at an irrigation application rate of 5 mm per day. These land uses are considered to be somewhat minor for the Bay of Plenty region as most horticultural developments are substantial and require resource consent for their water use. Therefore these takes were not calculated for in the model due to difficulty with identifying such small scale land use and/or location of use.
Environmental Publication 2014/02 – A model for assessing unconsented or permitted water use in the Bay of Plenty region 9
Part 4: Permitted take rule calculations scenario
1.7 Outline
Prediction of the worst case scenario for the Bay of Plenty under the current permitted takes allowance has been estimated; that all properties within a catchment are taking their full permitted take allowance; that is +50 m3/day (surface and groundwater and RMA provisions). The WLP is written in a manner that allows +50 m3/day to be taken per property from water resources without resource consent.
The method used is as follows:
• Assess the ownership of parcels to determine ‘property’.
• Join adjacent parcels together where the owner is the same.
• Establish the number of parcels (property) in each catchment.
• Calculate possible water taken out of each catchment as a permitted take.
1.8 Spatial techniques (GIS) applied to estimate the worst case scenarios
• The layer called BOP.TL_Parcel_Title_Point was used; this layer provides a point for each parcel, except parcels such as road parcels, river parcels, railways. Each parcel point has the legal description and owner information attached. This data was then joined to the BOP.TL_PARCEL layer which then provided special parcels with owner information. Once this was done the urban areas defined by the model were clipped out.
• A file was then added to the data’s attribute table to define if it had an owner, three categories were used, ‘yes’ – a proprietor was named, ‘no’ – no proprietor identified, and ‘queen’ – for land owned by the crown (see Figure 1).
• After assessing the definition of the word property in the WLP (pg. 439, ‘the land described in a particular certificate of title, or a group of contiguous certificates of title owned or leased by the same owner or lease holder, or land which is designated as a road or reserve, or is Māori land.’), a dissolve was done in Arc to merge into one parcel each instance where a proprietor owned more than one parcel adjacent to each other. This was done to get the best estimate of properties within a catchment.
• The next step was to determine the catchment that each parcel was in, enabling the number of parcels within each catchment to be established. This was done by a union between the BOP.Catchment_BOPSurface layer and the processed properties layers. This data could then be exported into excel to be processed further.
1.8.1 Possible errors
There are a number of areas where under and over estimation of actual catchment data could have entered.

Environmental Publication 2014/02 – A model for assessing unconsented or 10 permitted water use in the Bay of Plenty region
• The parcel layer used does not have proprietor information for every property. The reason for this data being missing is partly due to information being progressively updated, or partly unknown. This data is updated every one to three months by VNZ (Verification New Zealand) and forwarded to our GIS team who update our records, for this reason the model may need the GIS processing updated before it is used in order to have the most up-to-date information. This problem will lead to some under-estimation of the number of properties within a catchment. A more detailed look at each catchment will identify if this is significant for that particular catchment.
Figure 1: GIS land owner status mapping example.
• Where a property is made up of more than one parcel and these parcels are separated from each other so as they have no touching boundaries, for example where a property is found on either side of a road, railway or waterway, in this situation the GIS processing will not have identified that the parcels should be counted as one property and so some over-estimation of property numbers will have occurred.
• If a group of parcels is run as one property but the individual parcels have different owner details this will introduce some over-estimation of property numbers within a catchment, for example a husband is named as owner of one parcel and the wife of the neighbouring parcel.
• Where a property is within more than one catchment the GIS processing will split the property into parts according to the catchment lines. This means that some properties will be counted more than once. This will lead to some over-estimation, since it is currently impossible to know which catchment they will take water from, or how much of their water they will take from each catchment, over-estimation in this case is considered the safest option.

Environmental Publication 2014/02 – A model for assessing unconsented or permitted water use in the Bay of Plenty region 11
1.9 Spreadsheet processing
Once the GIS processing was done to assign a catchment to each property the resulting information was exported into excel for further processing. The following steps were taken within excel:
• Properties with no owner information or that are crown owned were deleted. These areas include national parks, reserves, roads, railways and waterways. It was assumed that they would have no permitted take.
• Properties were sorted into their catchment groups and the number of properties within each catchment was calculated.
• This information was then put into the model.
• The number of consented takes for each catchment was taken off the total number of properties in each catchment, this resulting number was then multiplied by 50 to get the maximum permitted take volume per catchment in m3/day; 15 to get the maximum permitted surface water take volume per catchment; and 35 to get the maximum permitted groundwater take volume per catchment.
• As a comparison, the numbers defined in the model for addresses per catchment, and number of households per catchment, were also multiplied by 50; 15; and 35, to gauge the potential permitted m3/day from surface and groundwater; surface water only; and groundwater only respectively.
• The calculations and results are in the model spreadsheet titled ‘Master spreadsheet Permitted Takes Model 3 March 2012.xlsx’.


Environmental Publication 2014/02 – A model for assessing unconsented or permitted water use in the Bay of Plenty region 13
Part 5: Running the model
1.10 What the model does
The model takes inputted raw data, makes a series of calculations, outputting results that provide an estimate of how much water is potentially being taken under the permitted takes rule, all done on a surface water catchment by catchment basis. Note that all urban areas have been removed from the model as town supply water use is accounted for under consented water takes.
1.11 How the model is set out
The model is located within a spreadsheet, ‘Master spreadsheet Permitted Takes Model 3 March 2012.xlsx’. The model itself is held in the page titled ‘Master’ and contains the worst case scenario data and results. The other pages within the spreadsheet hold raw data, research data, tables for the report, calibration data and investigations.
The model itself is set out in sections. Firstly the catchments are set out vertically in the first three columns of the spreadsheet. From here across the sheet the data is set out as such, population and property statistics; number of consents held per catchment; calculated domestic water use; stock numbers and water requirement; calculated stock water use; non-AgriBaseTM land areas and calculation of stock water requirements. And finally summary data of potential water use requirements for each catchment under the permitted take rule.
Note further data is included in the spreadsheet page ‘Water Use BOP’, including the AgriBaseTM forestry, goats and small stock numbers (excluding goats), also the non-AgriBaseTM beef only calculations. If subsequent model adaptions make them necessary, then these data sets can be used.
1.12 How the model works
The model works on a surface water catchment by catchment basis, so all domestic and stock data has been broken up into the relevant catchments via GIS processing.
The model is run by entering sets of raw data for each catchment, there are four sets of raw data that need to be inputted into the model to enable acceptable results. This data is then processed via spreadsheet math formulas and results are outputted for each catchment. The details of each of the sets of data is outlined below, along with an explanation of the processing that takes place within the spreadsheet with the raw data.
1.12.1 Population statistics and domestic water use
There are two sets of data here:
• Data gathered from New Zealand census data (in this instance 2006 data) including number of households per catchment, and population per catchment.
• Data on the numbers of addresses per catchment (calculated via GIS).
The census data on population has been divided by the number of households to give an estimate of the number of people per household in the catchment.

Environmental Publication 2014/02 – A model for assessing unconsented or 14 permitted water use in the Bay of Plenty region
The number of addresses per catchment has been multiplied by the estimated number of people per household to get an estimation of population per catchment based on address point data. This is the data that is given the most credit and is therefore used further in the model, with the other population statistics kept for comparison purposes.
A third set of data called ‘# Properties’, shows the results of the GIS processing outlined in Part 4 of this report, and estimate of the number of properties with owners in the Bay of Plenty. This data feeds into the worst case scenario calculations at the end of the spreadsheet. This provides the potential water volumes per catchment that could be taken as permitted.
Electricity point data is available in ‘Water Use BOP’ spreadsheet tab, however it is considered to be unreliable compared to the other data sets and is not used further in the model.
1.12.2 AgriBaseTM stock water use
The data obtained through AgriBaseTM has been entered for each catchment, beef, dairy, deer, forestry, goat, sheep, large stock and small stock are all detailed in ‘Water Use BOP’ tab. Note that although the specific information for forestry and goats is included, the forestry information is not used in any model calculations and the goat information is added to the small stock numbers (see cell Z1 ‘Water Use BOP’) and applied to the ‘Master’ model this way.
Calculations of stock ADD and PDD have been done by taking the number of each stock type in each catchment and multiplying this by the relevant (ADD or PDD) water use requirements of that type of stock per day. This data has been sourced from the Aquas 2007 report page 23. For dairy, the shed washdown water per head has also been added to the drinking water per head. This data is linked to ‘Master’ from the ‘Regional Water Use’ tab of the spreadsheet.
The requirements for each stock type is then added together, then the stock water requirements accounted for through consented takes is subtracted to give the total (ADD or PDD) water requirements of stock within the catchment. The stock numbers are for the whole catchment and so the water requirements of stock on farms with consented takes is included in the number, which is why this needs to be subtracted to get an idea of the numbers taking water via permitted takes.
1.12.3 Consented takes stock water use
For each catchment the numbers of stock housed on farms where consented takes are active has been entered. The stock has been divided up into the same categories as the AgriBaseTM stock statistics. As has been done with the AgriBaseTM stock numbers, the consented stock ADD and PDD has been calculated.
This is important because the AgriBaseTM data includes farms taking water via permitted takes and those via consents. So the water requirements of properties with consented takes needs to be taken away from the catchment total in order to get the permitted takes water requirements.
Environmental Publication 2014/02 – A model for assessing unconsented or permitted water use in the Bay of Plenty region 15
1.12.4 Non-AgriBaseTM stock water use
Determine area
The raw data entered into the speadsheet in the Land Coverage – Non-AgriBaseTM section of the spreadsheet (High Producing Grassland, Low Producing Grassland, Land with no Livestock and AgriBaseTM Dairy) has been sourced from LINZ 2001 Land Cover Database. GIS calculations have been done to determine these numbers, this information is held in the GIS layer ‘BOP.Water_AgriBase_LCDB2_Catchments’.
Determine stocking rates
Two figures have been defined to determine the number of stock that high and low producing grassland can support:
• New Zealand Dairy Statistics suggest an average stocking rate of 2.83 cows/ha for dairy cows (LIC 2009).
• BOPRC land management staff suggest that a figure of 2.6 beef animals/ha is appropriate to the Bay of Plenty region.
The model uses a stocking rate of 2.8 dairy cows/ha for high producing grassland and 2.6 beef/ha for low producing grassland.
Determine water use
These figures are multiplied by the area of high or low producing grassland in the catchment to estimate the stock numbers for the areas not covered by AgriBaseTM data. The ADD and PDD stock drinking water requirements are also calculated to determine the amont of water used by stock for this area.
Calculation
The processed data in this section is calculated as follows:
(Area of high producing grassland * 2.8 stocking rate for dairy* the ADD/PDD for dairy drinking water and shed washdown requirements l/h/day) + (Area of low producing grassland * 2.6 stocking rate for beef * the ADD/PDD for beef drinking water requirements l/h/day)/(factors to account for units).
The figure ADD/PDD for AgriBaseTM and non-AgriBaseTM is then added to give the overall amount of water likely to be used in the catchment by stock (see column ‘Total stock water’).
1.12.5 Worst Case Scenario working
This section is found at the end of the ‘Master’ spreadsheet. The worst case for a catchment would be that the entire permitted water allowance was taken each day by all properties within the catchment. To estimate how much water this would be for each catchment the number of properties (defined by the GIS processing described in Section 4) has been multiplied by 15 (the max permitted take from surface water per property in m3/day), 35 (the max permitted take per property from ground water in m 3/day), and 50 (the total max permitted take per property in m3/day).
This has also been done for the number of addresses and the number of households for the purpose of comparison.
Environmental Publication 2014/02 – A model for assessing unconsented or 16 permitted water use in the Bay of Plenty region
1.13 Running the model
To run the model you will need the relevant sets of raw data for each catchment, there are four sets of raw data that need to be inputted into the model to enable acceptable results. This data is then processed via speadsheet math formulas and results are automatically outputted for each catchment.
The data you need in order to run the model is outlined below:
• Population statistics per catchment.
• AgriBaseTM stock numbers per catchment.
• Number of consented water takes per catchment.
• Number of stock on properties with consented takes per catchment.
• Areas of high producing and low producing grassland per catchment for locations not covered by AgriBaseTM data.
Much of this data will need to be gathered and processed in ArcGIS in order to arrange the data on a per catchment basis before it is able to be put into the model. See Part 3 and 4 of this report for details of GIS processing required.
1.14 Possible future scenarios
Possible model runs for future consideration:
• Horticulture, this needs to be considered carefully. It may be an increasing industry, how will this affect water needs, changing land use.
• Areas of forestry being converted to dairy, beef or sheep farming.
• Catchments where farm irrigation needs may be likely to increase.
• Increase in population in rural areas.
• Increased number of lifestyle blocks, population moving out of urban areas to rural.
1.15 Model sensitivity
Brown, et. al. (2007) ran a series of sensitivity tests on the Waikato Regional Council model in order to identify which parameters have the most influence on results. Considering that water use estimates for the Bay of Plenty have been based on similar figures to those of Waikato Regional Council, it is considred that the same sensitivities would apply.
Those parameters having the greatest influence on results require the greatest level of accuracy in order for the model to be applicable. Brown, et. al. (2007) suggests the model is most sensitive to changes in dairy numbers and people numbers. This is mostly due to their high requirement for water.
A large change in beef numbers, on the other hand had an insignificant effect. A 50% increase in beef stock resulted in a 1.5% increase in water use, while an equivalent increase in dairy water use resulted in a 31% increase in water use Brown, et al. (2007).
Environmental Publication 2014/02 – A model for assessing unconsented or permitted water use in the Bay of Plenty region 17
The accuracy of stock estimates for the Bay of Plenty model is limited by AgriBaseTM 2010 data and its associated accuracies. This data is supplied by the farmer but may change over time. Concerns of model accuracy should only be expected in those catchments with poor AgriBaseTM coverage. Stock water use has been substantially assessed by several parties and water use statistics appear to be sound. Long term, dairy modernisation may result in increased water use but may be associated with increased efficiencies.
People numbers have been based on address title points and a comparison with meshblock data provided. It would appear that address data points over-estimate population figures, however population estimates for rural areas are low and would only have an influence if large scale land conversions occurred. Such an undertaking would more than likely fall into the urban category and should therefore not affect the model.


Environmental Publication 2014/02 – A model for assessing unconsented or permitted water use in the Bay of Plenty region 19
Part 6: Discussion of model results
There are two allocation regimes to be considered:
• First the allocation allowed under the RMA for reasonable domestic use and stock watering (not quantified, but qualified as having no more than minor environmental impacts).
• Second the allocation allowed under the WLP for any purpose being quantified as 15 m3/day per property from surface water and 35 m3/day per property from groundwater, qualified as having no more than minor environmental impacts.
Water can be taken from any sources (groundwater, stream, lake, wetland) to supply these requirements.
The results of RMA allocation allowance and WLP allocation allowance are shown in Table 1 as Average Daily Demand (ADD) and Peak Daily Demand (PDD) in m3/day per greater catchment.
As it cannot be determined what resource the water is being taken from, it is not possible to assess the impact of the take on the resource. Therefore assessment of this figure against allocation can not be assessed for either surface water or groundwater. All that can be provided is the potential volume of water that can be taken from an area without Regional Council knowledge or any records kept, due to the fact that the take is allowed for under the RMA and WLP.
The model calculation for the RMA provision is based on the reasonable water use for the population and stock in a catchment. The model calculation for the WLP provisions are based on an allocated water use per property in a catchment. This data is shown in Appendix 4.1.
Table 1: Summary table estimating RMA and WLP potential permitted water use.
Greater catchment
RMA: total ADD m3/day
RMA: total PDD m3/day
WLP: 50 m3/ day/property
Total water allowance RMA+WLP
ADD m3/day
Total water allowance RMA+WLP PDD m3/day
Kaituna total 10642637 14642416 372550 11015187 15014966
Mōtū total 12638931 15939877 168200 12807131 16108077
Ōhiwa total 3702967 5058675 88600 3791567 5147275
Pongakawa total 4831799 6440846 85100 4916899 6525946
Rangitāiki total 15809907 21460292 275650 16085557 21735942
Tauranga total 9868145 14541571 499700 10367845 15041271
Waioeka total 4973591 6242721 86850 5060441 6329571
Waitahanui total 2011489 2866585 49350 2060839 2915935
Whakatāne total 7380662 10197376 104900 7485562 10302276
Total 71860129 97390358 1730900 73591029 99121258
The model does not calculate actual use as this information is not available. This information is not required for permitted activities. The model results are based on the assumption that the permitted provisions of the RMA and WLP are exercised to their fullest potential.

Environmental Publication 2014/02 – A model for assessing unconsented or permitted water use in the Bay of Plenty region 21
Part 7: Conclusion
The body of work contained in this report attempts to quantify water use, governed by Section 14(3)(b) RMA and Rules 38 and 41 WLP. The NES requires allocation to be set for water resources, therefore to implement this council needs to be able to quantify allocation to support permitted takes. The cumulative effect of permitted and consented allocation is unknown. There is concern that permitted use may result in an adverse effect on the environment and resource users.
One of the consequences of the way permitted takes are written is a substantial lack of knowledge with regards to the number, water source and volume of these takes within a catchment. Mostly due to there being no requirements for landowners to submit any information to Council. The permitted takes model, described in this report, is based on an assessment of those uses permitted by Section 14(3)(b) RMA and Rules 38 and 41 WLP.
BOPRC hold information for dairy discharge consents, providing some indication of dairy numbers, and have a good understanding of stocking densities for all livestock, however individual farm practices result in a high degree of variability and the potential for error. AgriBaseTM (2010), produced by AsureQuality, provides detailed information on an individual farm basis, with regards to whole of farm land use practices. AgriBaseTM describes 70% of the land area in the Bay of Plenty and includes stock numbers for primary stock land use in the Bay of Plenty i.e. dairy, beef, sheep and deer. Only 6% of the land area carrying stock, in the remaining land area, is not described by the AgriBaseTM dataset. Consequently water use in these areas had little bearing on water budgets in the majority of the Bay of Plenty catchments.
Domestic water use and human populations are adequately described by Census 2006 and or address location data. Use of address data figures in the model appears to be slightly conservative. Water use figures applied by the model, as per stock water use have been substantially researched and adopted at national, regional and district council level across New Zealand.
The results, presented on a surface water catchment basis, and available from the BOPRC’s GIS data store, provide insight into ADD and PDD for the major water uses (domestic and stock water). The ADD and PDD figures provide for fluctuation in seasonal water use and/or land use practice.
The model would benefit from ‘ground truthing’ against a catchment field survey of permitted takes to provide greater certainty around the results of the model.
The model presented here is the first step in assessing the quantity of water used by permitted takes from a catchment. Like all models, lumped catchment calculations do not describe the variability that may exist between individual domestic household use and or individual farm design and operating efficiencies. The model requires some thought surrounding its appropriateness in the catchment in which allocation is being considered.


Environmental Publication 2014/02 – A model for assessing unconsented or permitted water use in the Bay of Plenty region 23
Part 8: References
AgriBaseTM, 2010. AsureQuality – Independent Quality Assurance, AgriBaseTM Data Environment Bay of Plenty Regional Council – July 2010. Auckland, New Zealand.
Aquas, 2007: Reasonable Stock Water Requirements – Guidelines for Resource Consent Applications. Technical Report for Horizons Regional Council – December 2007.
Banks, B (2011). Land Management Officer, Bay of Plenty Regional Council, May 2011.
Brown, E. Clements, B and Haigh, A. 2007: A Model for Assessing the Magnitude of Unconsented Surface Water Use in the Waikato Region. Environment Waikato Technical Report 2007/47. ISSN 1172-4005.
Census, 2006. Statistics New Zealand, GIS Datasets supplied to the Bay of Plenty Regional Council. http://www.stats.govt.nz/Census/2006CensusHomePage.aspx (April, 2011).
DBH, 2007: Building Code Review Consultation, Department of Building and Housing, Wellington, New Zealand. http://wwwdbh.govt.nz (April 2011).
EBOP, 2006. Dealing with your wastewater – A guide to the On-Site Effluent Treatment Regional Plan 2006. 628.543. Bay of Plenty, 17574 and 17575.
Fleming, P.2003: Farm Technical Manual. Lincoln University, Farm Management Group, Christchurch New Zealand.
HRC, 2006. Assessments of the Proposed Water-Use Guidelines for Public Water Supplies: Technical report prepared for Horizons Regional Council by Aquas Consultants Ltd.
LIC, 2009: New Zealand Dairy Statistic 2008-2009, Livestock Improvement Corporation; and
LINZ, 2001. Land Cover Database, LCDB2 produced by Land Information New Zealand. www.linz.govt.nz.
Lumsden, M. (2011). Land Management Officer - Bay of Plenty Regional Council, May 2011.
TCC, 2011: Water – How we use it and how to use less, Tauranga City Council, Tauranga, New Zealand. http://www.tauranga.govt.nz/sustainable-living/water.aspx (15 March 2011).
MoH, 2006. Household Water Supplies: The Selection, Operation and Maintenance of Individual Household Water Supplies. Ministry of Health, Wellington, New Zealand.
MoED, 2006. Future Trends in Water Use. Ministry for Economic Development, Wellington, New Zealand. http://www.med.govt.nz/templates/MultipageDocumentPage____12538.aspx#P2589_61514 (11 March 2011).
Mackay, D (2011). Water Management – Consents Officer, April 2011.
Pickles, S (2011) Pollution Prevention Team Leader, Bay of plenty Regional Council, April 2011.


Appendices

Appendix 1: Domestic water use


Environmental Publication 2014/02 – A model for assessing unconsented or permitted water use in the Bay of Plenty region 29
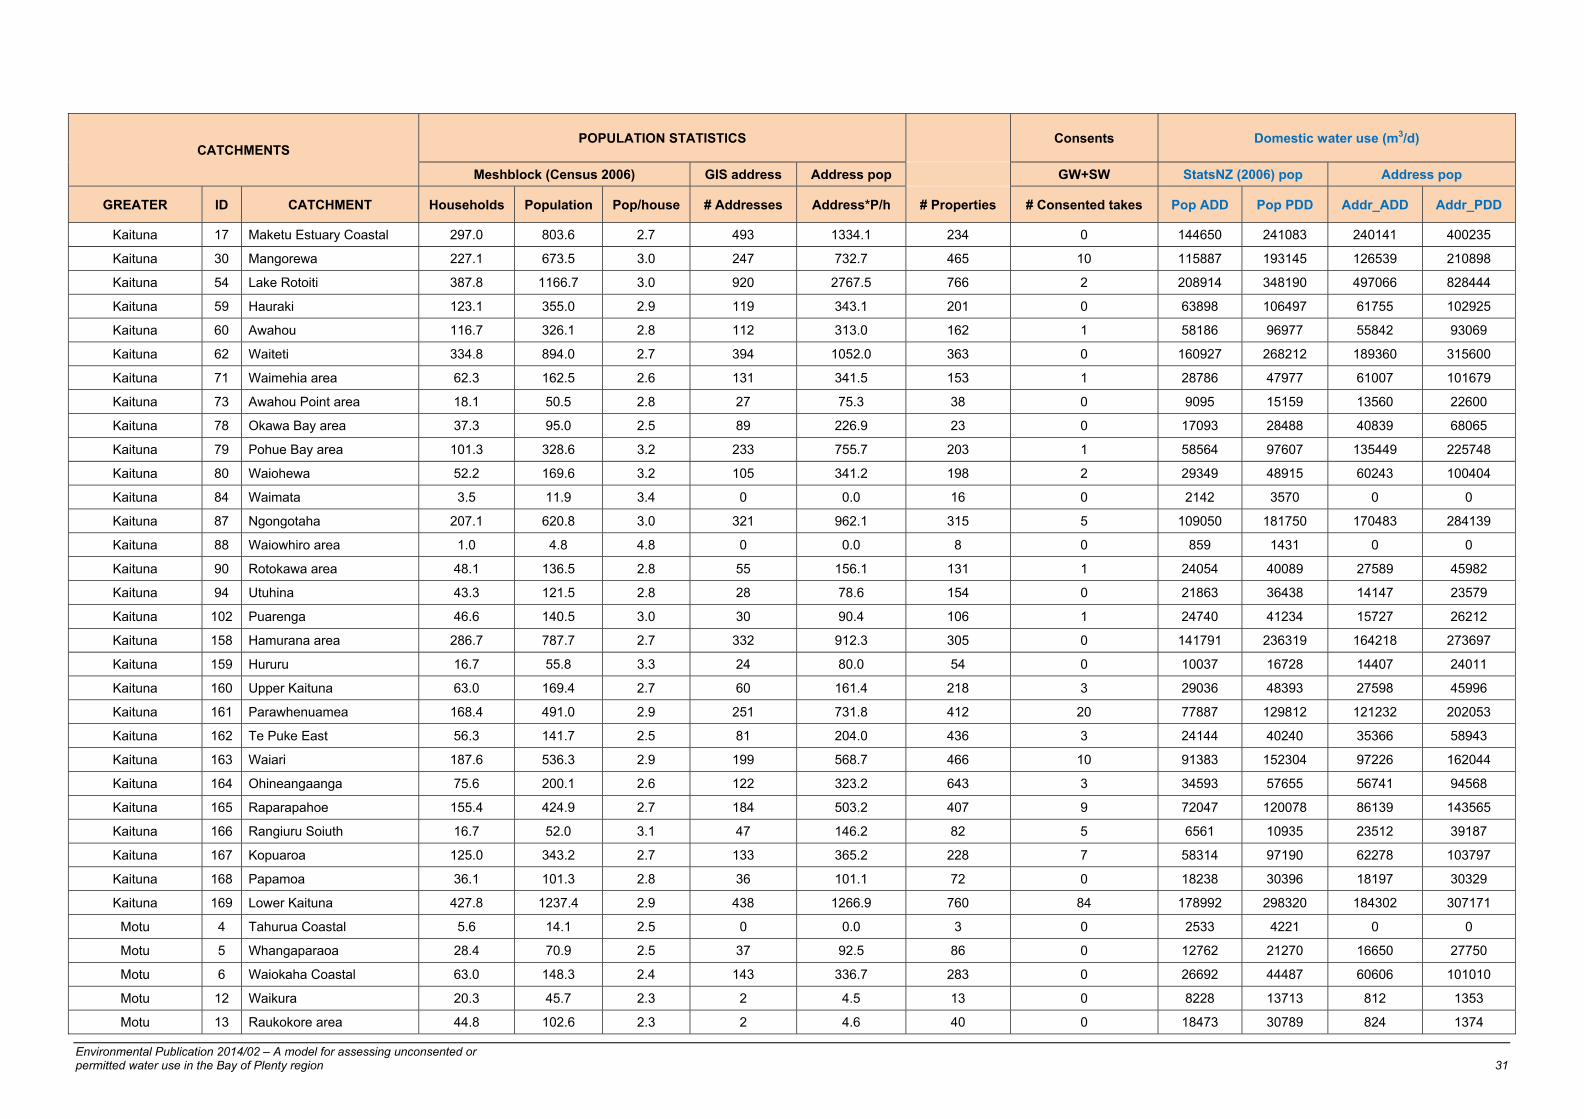
Appendix 1 – Estimated domestic water use per catchment based on population, household, address and consent data (Master spreadsheet A2:N167)

Environmental Publication 2014/02 – A model for assessing unconsented or permitted water use in the Bay of Plenty region 31
CATCHMENTS POPULATION STATISTICS Consents Domestic water use (m3/d)
Meshblock (Census 2006) GIS address Address pop GW+SW StatsNZ (2006) pop Address pop
GREATER ID CATCHMENT Households Population Pop/house # Addresses Address*P/h # Properties # Consented takes Pop ADD Pop PDD Addr_ADD Addr_PDD
Kaituna 17 Maketu Estuary Coastal 297.0 803.6 2.7 493 1334.1 234 0 144650 241083 240141 400235
Kaituna 30 Mangorewa 227.1 673.5 3.0 247 732.7 465 10 115887 193145 126539 210898
Kaituna 54 Lake Rotoiti 387.8 1166.7 3.0 920 2767.5 766 2 208914 348190 497066 828444
Kaituna 59 Hauraki 123.1 355.0 2.9 119 343.1 201 0 63898 106497 61755 102925
Kaituna 60 Awahou 116.7 326.1 2.8 112 313.0 162 1 58186 96977 55842 93069
Kaituna 62 Waiteti 334.8 894.0 2.7 394 1052.0 363 0 160927 268212 189360 315600
Kaituna 71 Waimehia area 62.3 162.5 2.6 131 341.5 153 1 28786 47977 61007 101679
Kaituna 73 Awahou Point area 18.1 50.5 2.8 27 75.3 38 0 9095 15159 13560 22600
Kaituna 78 Okawa Bay area 37.3 95.0 2.5 89 226.9 23 0 17093 28488 40839 68065
Kaituna 79 Pohue Bay area 101.3 328.6 3.2 233 755.7 203 1 58564 97607 135449 225748
Kaituna 80 Waiohewa 52.2 169.6 3.2 105 341.2 198 2 29349 48915 60243 100404
Kaituna 84 Waimata 3.5 11.9 3.4 0 0.0 16 0 2142 3570 0 0
Kaituna 87 Ngongotaha 207.1 620.8 3.0 321 962.1 315 5 109050 181750 170483 284139
Kaituna 88 Waiowhiro area 1.0 4.8 4.8 0 0.0 8 0 859 1431 0 0
Kaituna 90 Rotokawa area 48.1 136.5 2.8 55 156.1 131 1 24054 40089 27589 45982
Kaituna 94 Utuhina 43.3 121.5 2.8 28 78.6 154 0 21863 36438 14147 23579
Kaituna 102 Puarenga 46.6 140.5 3.0 30 90.4 106 1 24740 41234 15727 26212
Kaituna 158 Hamurana area 286.7 787.7 2.7 332 912.3 305 0 141791 236319 164218 273697
Kaituna 159 Hururu 16.7 55.8 3.3 24 80.0 54 0 10037 16728 14407 24011
Kaituna 160 Upper Kaituna 63.0 169.4 2.7 60 161.4 218 3 29036 48393 27598 45996
Kaituna 161 Parawhenuamea 168.4 491.0 2.9 251 731.8 412 20 77887 129812 121232 202053
Kaituna 162 Te Puke East 56.3 141.7 2.5 81 204.0 436 3 24144 40240 35366 58943
Kaituna 163 Waiari 187.6 536.3 2.9 199 568.7 466 10 91383 152304 97226 162044
Kaituna 164 Ohineangaanga 75.6 200.1 2.6 122 323.2 643 3 34593 57655 56741 94568
Kaituna 165 Raparapahoe 155.4 424.9 2.7 184 503.2 407 9 72047 120078 86139 143565
Kaituna 166 Rangiuru Soiuth 16.7 52.0 3.1 47 146.2 82 5 6561 10935 23512 39187
Kaituna 167 Kopuaroa 125.0 343.2 2.7 133 365.2 228 7 58314 97190 62278 103797
Kaituna 168 Papamoa 36.1 101.3 2.8 36 101.1 72 0 18238 30396 18197 30329
Kaituna 169 Lower Kaituna 427.8 1237.4 2.9 438 1266.9 760 84 178992 298320 184302 307171
Motu 4 Tahurua Coastal 5.6 14.1 2.5 0 0.0 3 0 2533 4221 0 0
Motu 5 Whangaparaoa 28.4 70.9 2.5 37 92.5 86 0 12762 21270 16650 27750
Motu 6 Waiokaha Coastal 63.0 148.3 2.4 143 336.7 283 0 26692 44487 60606 101010
Motu 12 Waikura 20.3 45.7 2.3 2 4.5 13 0 8228 13713 812 1353
Motu 13 Raukokore area 44.8 102.6 2.3 2 4.6 40 0 18473 30789 824 1374
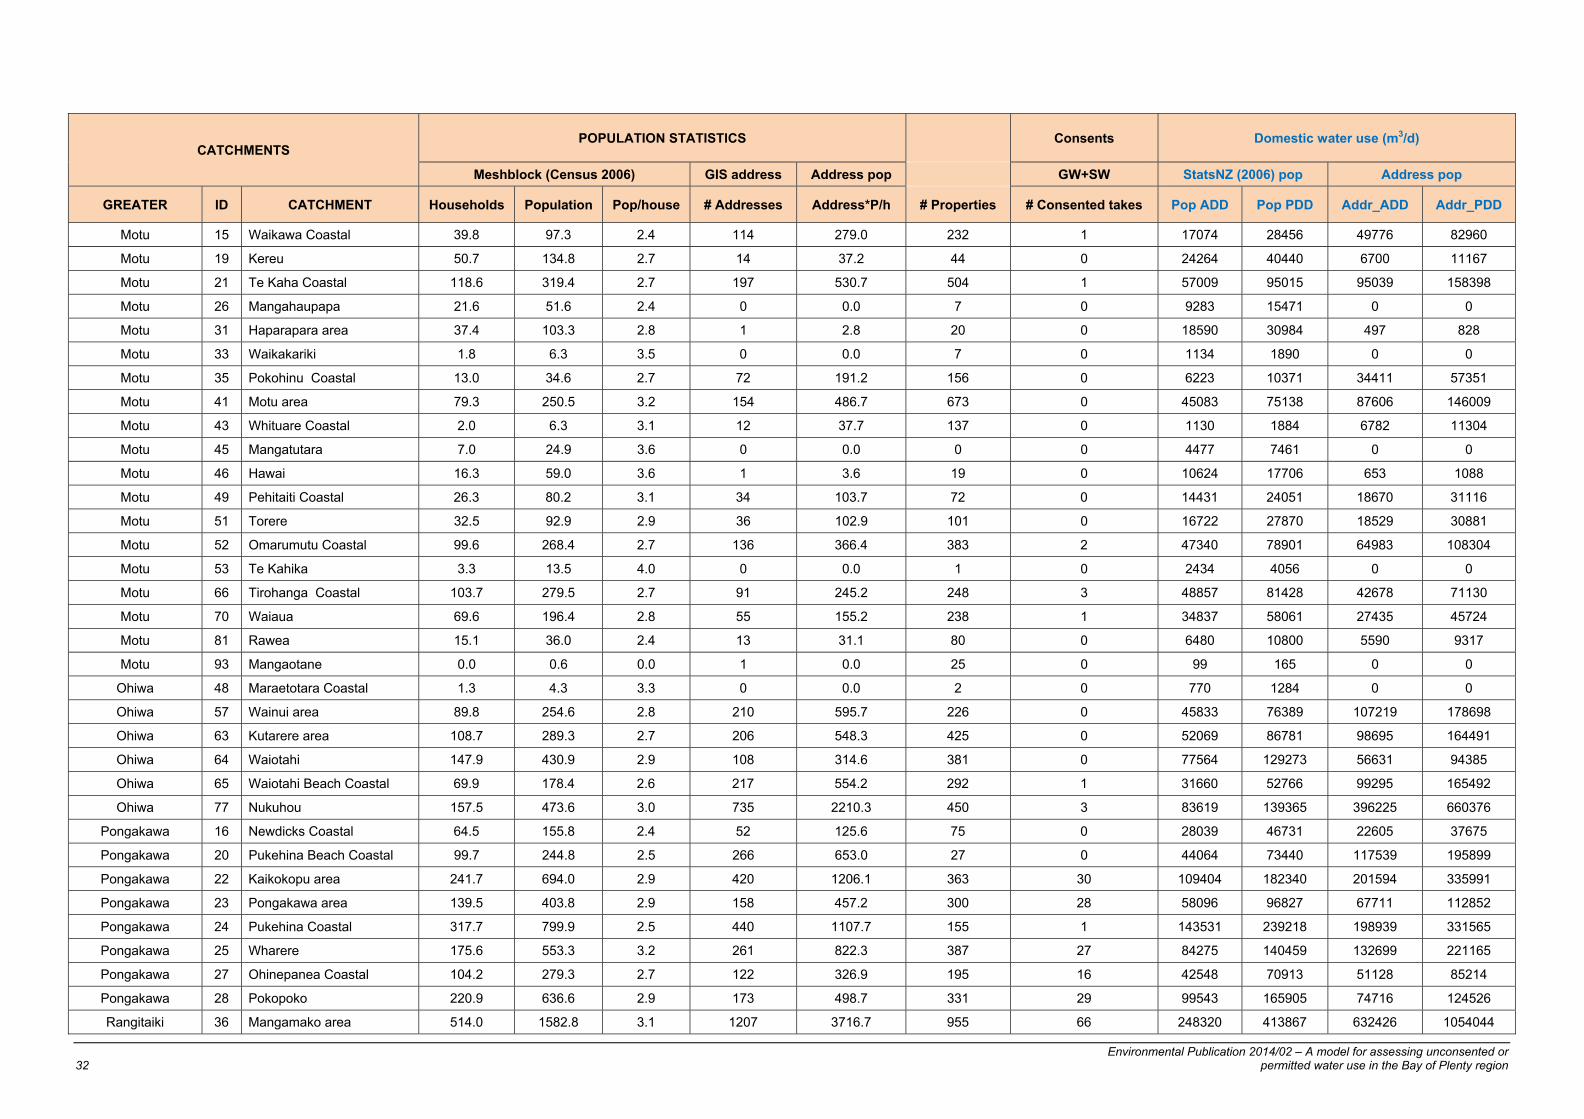
Environmental Publication 2014/02 – A model for assessing unconsented or 32 permitted water use in the Bay of Plenty region
CATCHMENTS POPULATION STATISTICS Consents Domestic water use (m3/d)
Meshblock (Census 2006) GIS address Address pop GW+SW StatsNZ (2006) pop Address pop
GREATER ID CATCHMENT Households Population Pop/house # Addresses Address*P/h # Properties # Consented takes Pop ADD Pop PDD Addr_ADD Addr_PDD
Motu 15 Waikawa Coastal 39.8 97.3 2.4 114 279.0 232 1 17074 28456 49776 82960
Motu 19 Kereu 50.7 134.8 2.7 14 37.2 44 0 24264 40440 6700 11167
Motu 21 Te Kaha Coastal 118.6 319.4 2.7 197 530.7 504 1 57009 95015 95039 158398
Motu 26 Mangahaupapa 21.6 51.6 2.4 0 0.0 7 0 9283 15471 0 0
Motu 31 Haparapara area 37.4 103.3 2.8 1 2.8 20 0 18590 30984 497 828
Motu 33 Waikakariki 1.8 6.3 3.5 0 0.0 7 0 1134 1890 0 0
Motu 35 Pokohinu Coastal 13.0 34.6 2.7 72 191.2 156 0 6223 10371 34411 57351
Motu 41 Motu area 79.3 250.5 3.2 154 486.7 673 0 45083 75138 87606 146009
Motu 43 Whituare Coastal 2.0 6.3 3.1 12 37.7 137 0 1130 1884 6782 11304
Motu 45 Mangatutara 7.0 24.9 3.6 0 0.0 0 0 4477 7461 0 0
Motu 46 Hawai 16.3 59.0 3.6 1 3.6 19 0 10624 17706 653 1088
Motu 49 Pehitaiti Coastal 26.3 80.2 3.1 34 103.7 72 0 14431 24051 18670 31116
Motu 51 Torere 32.5 92.9 2.9 36 102.9 101 0 16722 27870 18529 30881
Motu 52 Omarumutu Coastal 99.6 268.4 2.7 136 366.4 383 2 47340 78901 64983 108304
Motu 53 Te Kahika 3.3 13.5 4.0 0 0.0 1 0 2434 4056 0 0
Motu 66 Tirohanga Coastal 103.7 279.5 2.7 91 245.2 248 3 48857 81428 42678 71130
Motu 70 Waiaua 69.6 196.4 2.8 55 155.2 238 1 34837 58061 27435 45724
Motu 81 Rawea 15.1 36.0 2.4 13 31.1 80 0 6480 10800 5590 9317
Motu 93 Mangaotane 0.0 0.6 0.0 1 0.0 25 0 99 165 0 0
Ohiwa 48 Maraetotara Coastal 1.3 4.3 3.3 0 0.0 2 0 770 1284 0 0
Ohiwa 57 Wainui area 89.8 254.6 2.8 210 595.7 226 0 45833 76389 107219 178698
Ohiwa 63 Kutarere area 108.7 289.3 2.7 206 548.3 425 0 52069 86781 98695 164491
Ohiwa 64 Waiotahi 147.9 430.9 2.9 108 314.6 381 0 77564 129273 56631 94385
Ohiwa 65 Waiotahi Beach Coastal 69.9 178.4 2.6 217 554.2 292 1 31660 52766 99295 165492
Ohiwa 77 Nukuhou 157.5 473.6 3.0 735 2210.3 450 3 83619 139365 396225 660376
Pongakawa 16 Newdicks Coastal 64.5 155.8 2.4 52 125.6 75 0 28039 46731 22605 37675
Pongakawa 20 Pukehina Beach Coastal 99.7 244.8 2.5 266 653.0 27 0 44064 73440 117539 195899
Pongakawa 22 Kaikokopu area 241.7 694.0 2.9 420 1206.1 363 30 109404 182340 201594 335991
Pongakawa 23 Pongakawa area 139.5 403.8 2.9 158 457.2 300 28 58096 96827 67711 112852
Pongakawa 24 Pukehina Coastal 317.7 799.9 2.5 440 1107.7 155 1 143531 239218 198939 331565
Pongakawa 25 Wharere 175.6 553.3 3.2 261 822.3 387 27 84275 140459 132699 221165
Pongakawa 27 Ohinepanea Coastal 104.2 279.3 2.7 122 326.9 195 16 42548 70913 51128 85214
Pongakawa 28 Pokopoko 220.9 636.6 2.9 173 498.7 331 29 99543 165905 74716 124526
Rangitaiki 36 Mangamako area 514.0 1582.8 3.1 1207 3716.7 955 66 248320 413867 632426 1054044

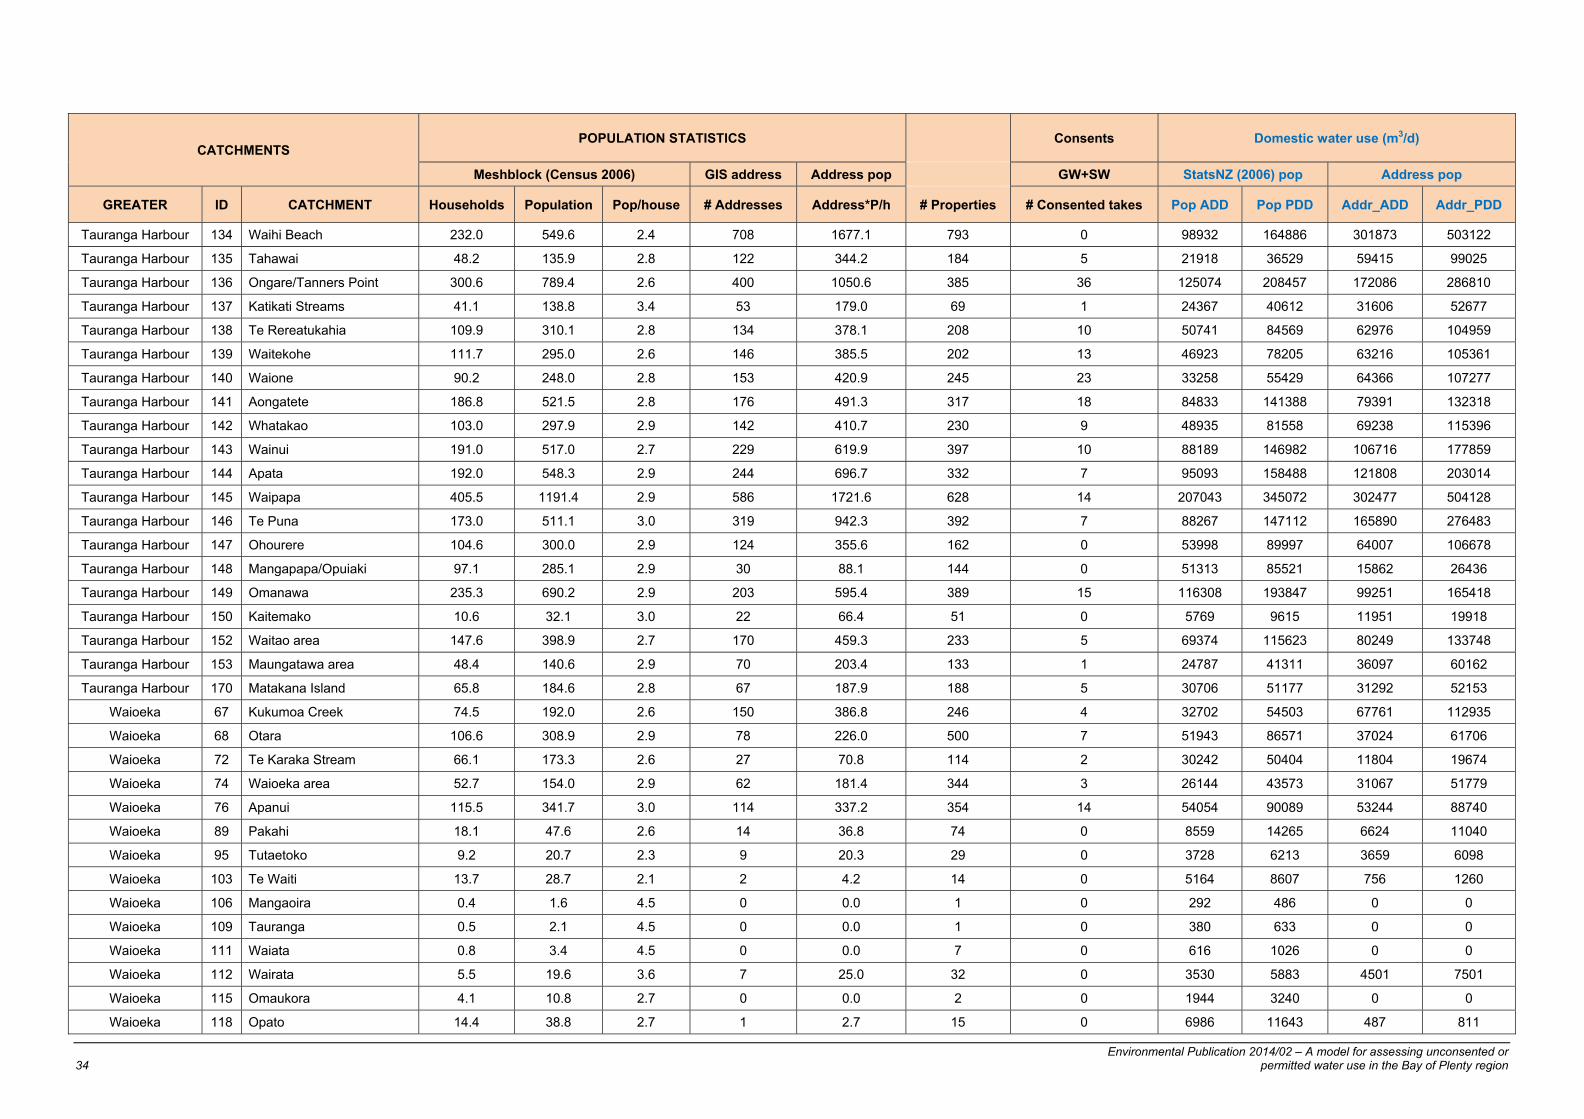
Environmental Publication 2014/02 – A model for assessing unconsented or permitted water use in the Bay of Plenty region 33
CATCHMENTS POPULATION STATISTICS Consents Domestic water use (m3/d)
Meshblock (Census 2006) GIS address Address pop GW+SW StatsNZ (2006) pop Address pop
GREATER ID CATCHMENT Households Population Pop/house # Addresses Address*P/h # Properties # Consented takes Pop ADD Pop PDD Addr_ADD Addr_PDD
Rangitaiki 42 Lower Tarawera area 1169.2 3461.4 3.0 2504 7413.2 2219 67 587341 978901 1298665 2164442
Rangitaiki 47 Waikamihi 37.6 110.6 2.9 89 261.7 96 0 19904 33174 47102 78503
Rangitaiki 50 Otakiri 11.5 30.3 2.6 48 126.6 41 1 4972 8287 22319 37198
Rangitaiki 61 Mangawiki 56.6 158.0 2.8 154 429.9 151 9 23915 39859 72867 121445
Rangitaiki 83 Waikanapiti 25.4 82.7 3.3 31 101.0 214 0 14886 24810 18175 30292
Rangitaiki 92 Lake Okataina 35.1 110.0 3.1 2 6.3 21 0 19795 32991 1129 1881
Rangitaiki 99 Mangate 0.0 0.1 0.0 0 0.0 5 0 22 36 0 0
Rangitaiki 100 Mangawhio 0.2 0.6 3.5 2 7.0 12 0 101 168 1260 2100
Rangitaiki 101 Lake Okareka 174.6 433.7 2.5 282 700.5 172 1 77621 129368 125642 209403
Rangitaiki 104 Lake Tarawera 141.9 380.8 2.7 524 1406.0 346 1 68057 113429 252601 421002
Rangitaiki 105 Waiaute 12.2 37.7 3.1 2 6.2 23 0 6793 11322 1115 1858
Rangitaiki 107 Lake Tikitapu 12.2 32.3 2.7 1 2.7 4 0 5819 9699 477 795
Rangitaiki 108 Lake Rotokakahi 5.1 12.6 2.5 3 7.5 21 0 2264 3774 1345 2242
Rangitaiki 113 Lake Rotomahana 41.9 120.1 2.9 66 189.2 95 0 21622 36036 34050 56750
Rangitaiki 114 Pokairoa 36.5 101.2 2.8 55 152.3 112 1 17716 29526 26918 44863
Rangitaiki 117 Lake Rerewhakaaitu 55.9 149.3 2.7 84 224.4 133 1 26384 43974 39903 66505
Rangitaiki 120 Okaro 6.3 18.8 3.0 5 14.9 17 0 3380 5634 2674 4457
Rangitaiki 126 Horomanga 111.6 341.1 3.1 272 831.4 210 22 49300 82166 137540 229233
Rangitaiki 130 Whirinaki 104.7 284.0 2.7 478 1297.3 201 6 48192 80321 230581 384302
Rangitaiki 131 Pouarua area 24.9 82.4 3.3 12 39.8 44 1 14237 23728 6566 10944
Rangitaiki 132 Otamatea 11.8 39.1 3.3 33 109.8 24 0 7045 11742 19770 32949
Rangitaiki 154 Waikowhewhe area 70.6 252.5 3.6 206 737.2 168 5 42227 70379 129484 215806
Rangitaiki 155 Kaingaroa area 215.9 674.7 3.1 371 1159.7 185 8 116950 194917 204248 340413
Rangitaiki 156 Wheao 27.9 85.5 3.1 88 269.9 223 1 14833 24721 48025 80042
Rangitaiki 157 Mangatiti area 4.2 12.9 3.1 23 70.3 11 0 2327 3879 12655 21091
Tauranga Harbour 1 Tuapiro 178.5 498.2 2.8 140 390.8 252 26 76617 127695 57282 95470
Tauranga Harbour 2 Uretara 187.9 522.5 2.8 279 775.9 308 5 91554 152591 137156 228594
Tauranga Harbour 3 Te Mania 62.9 163.6 2.6 457 1188.1 386 8 25710 42850 210114 350190
Tauranga Harbour 10 Oturu 99.0 306.7 3.1 228 706.3 177 1 54645 91075 126575 210959
Tauranga Harbour 11 Kopurererua 409.1 1235.0 3.0 627 1893.0 819 20 211428 352380 329863 549772
Tauranga Harbour 14 Waimapu 657.2 1918.8 2.9 985 2875.8 973 26 331717 552861 503986 839977
Tauranga Harbour 18 Wairoa 146.2 426.0 2.9 143 416.6 250 1 76156 126926 74472 124120
Tauranga Harbour 58 Wairoa 528.7 1548.1 2.9 803 2351.2 972 14 271283 452138 415834 693057
Tauranga Harbour 133 Waiau 368.9 927.6 2.5 623 1566.5 457 2 166066 276777 281070 468449
Environmental Publication 2014/02 – A model for assessing unconsented or 34 permitted water use in the Bay of Plenty region
CATCHMENTS POPULATION STATISTICS Consents Domestic water use (m3/d)
Meshblock (Census 2006) GIS address Address pop GW+SW StatsNZ (2006) pop Address pop
GREATER ID CATCHMENT Households Population Pop/house # Addresses Address*P/h # Properties # Consented takes Pop ADD Pop PDD Addr_ADD Addr_PDD
Tauranga Harbour 134 Waihi Beach 232.0 549.6 2.4 708 1677.1 793 0 98932 164886 301873 503122
Tauranga Harbour 135 Tahawai 48.2 135.9 2.8 122 344.2 184 5 21918 36529 59415 99025
Tauranga Harbour 136 Ongare/Tanners Point 300.6 789.4 2.6 400 1050.6 385 36 125074 208457 172086 286810
Tauranga Harbour 137 Katikati Streams 41.1 138.8 3.4 53 179.0 69 1 24367 40612 31606 52677
Tauranga Harbour 138 Te Rereatukahia 109.9 310.1 2.8 134 378.1 208 10 50741 84569 62976 104959
Tauranga Harbour 139 Waitekohe 111.7 295.0 2.6 146 385.5 202 13 46923 78205 63216 105361
Tauranga Harbour 140 Waione 90.2 248.0 2.8 153 420.9 245 23 33258 55429 64366 107277
Tauranga Harbour 141 Aongatete 186.8 521.5 2.8 176 491.3 317 18 84833 141388 79391 132318
Tauranga Harbour 142 Whatakao 103.0 297.9 2.9 142 410.7 230 9 48935 81558 69238 115396
Tauranga Harbour 143 Wainui 191.0 517.0 2.7 229 619.9 397 10 88189 146982 106716 177859
Tauranga Harbour 144 Apata 192.0 548.3 2.9 244 696.7 332 7 95093 158488 121808 203014
Tauranga Harbour 145 Waipapa 405.5 1191.4 2.9 586 1721.6 628 14 207043 345072 302477 504128
Tauranga Harbour 146 Te Puna 173.0 511.1 3.0 319 942.3 392 7 88267 147112 165890 276483
Tauranga Harbour 147 Ohourere 104.6 300.0 2.9 124 355.6 162 0 53998 89997 64007 106678
Tauranga Harbour 148 Mangapapa/Opuiaki 97.1 285.1 2.9 30 88.1 144 0 51313 85521 15862 26436
Tauranga Harbour 149 Omanawa 235.3 690.2 2.9 203 595.4 389 15 116308 193847 99251 165418
Tauranga Harbour 150 Kaitemako 10.6 32.1 3.0 22 66.4 51 0 5769 9615 11951 19918
Tauranga Harbour 152 Waitao area 147.6 398.9 2.7 170 459.3 233 5 69374 115623 80249 133748
Tauranga Harbour 153 Maungatawa area 48.4 140.6 2.9 70 203.4 133 1 24787 41311 36097 60162
Tauranga Harbour 170 Matakana Island 65.8 184.6 2.8 67 187.9 188 5 30706 51177 31292 52153
Waioeka 67 Kukumoa Creek 74.5 192.0 2.6 150 386.8 246 4 32702 54503 67761 112935
Waioeka 68 Otara 106.6 308.9 2.9 78 226.0 500 7 51943 86571 37024 61706
Waioeka 72 Te Karaka Stream 66.1 173.3 2.6 27 70.8 114 2 30242 50404 11804 19674
Waioeka 74 Waioeka area 52.7 154.0 2.9 62 181.4 344 3 26144 43573 31067 51779
Waioeka 76 Apanui 115.5 341.7 3.0 114 337.2 354 14 54054 90089 53244 88740
Waioeka 89 Pakahi 18.1 47.6 2.6 14 36.8 74 0 8559 14265 6624 11040
Waioeka 95 Tutaetoko 9.2 20.7 2.3 9 20.3 29 0 3728 6213 3659 6098
Waioeka 103 Te Waiti 13.7 28.7 2.1 2 4.2 14 0 5164 8607 756 1260
Waioeka 106 Mangaoira 0.4 1.6 4.5 0 0.0 1 0 292 486 0 0
Waioeka 109 Tauranga 0.5 2.1 4.5 0 0.0 1 0 380 633 0 0
Waioeka 111 Waiata 0.8 3.4 4.5 0 0.0 7 0 616 1026 0 0
Waioeka 112 Wairata 5.5 19.6 3.6 7 25.0 32 0 3530 5883 4501 7501
Waioeka 115 Omaukora 4.1 10.8 2.7 0 0.0 2 0 1944 3240 0 0
Waioeka 118 Opato 14.4 38.8 2.7 1 2.7 15 0 6986 11643 487 811

Environmental Publication 2014/02 – A model for assessing unconsented or permitted water use in the Bay of Plenty region 35
CATCHMENTS POPULATION STATISTICS Consents Domestic water use (m3/d)
Meshblock (Census 2006) GIS address Address pop GW+SW StatsNZ (2006) pop Address pop
GREATER ID CATCHMENT Households Population Pop/house # Addresses Address*P/h # Properties # Consented takes Pop ADD Pop PDD Addr_ADD Addr_PDD
Waioeka 124 Te Pato 0.5 2.2 4.5 0 0.0 3 0 394 657 0 0
Waioeka 127 Tataweka 0.1 0.5 4.3 0 0.0 1 0 92 153 0 0
Waioeka 129 Koranga 0.0 0.1 4.3 19 82.3 30 0 23 39 14820 24700
Waitahanui 29 Otamarakau Coastal 3.2 10.2 3.2 11 35.1 32 0 1832 3054 6319 10531
Waitahanui 32 Waitahanui 71.0 204.4 2.9 137 394.6 172 14 29530 49217 63768 106280
Waitahanui 34 Hauone Coastal 45.2 129.3 2.9 202 578.2 99 5 20692 34487 101504 169173
Waitahanui 37 Pikowai Coastal 20.1 50.8 2.5 100 252.5 77 1 8684 14474 44989 74981
Waitahanui 38 Ruataniwha Coastal 1.4 3.2 2.3 33 74.9 20 0 576 960 13481 22468
Waitahanui 39 Mimiha Coastal 60.6 155.0 2.6 202 516.7 186 0 27891 46485 93001 155001
Waitahanui 40 Ohinekoao Coastal 21.6 57.0 2.6 67 176.7 39 0 10267 17112 31803 53005
Waitahanui 55 Lake Rotoehu 55.6 166.0 3.0 129 384.8 119 0 29873 49788 69259 115432
Waitahanui 69 Lake Rotoma 64.7 173.2 2.7 397 1062.5 263 0 31183 51972 191252 318753
Whakatane 44 Whakatane Area 545.9 1720.6 3.2 1243 3917.8 819 19 298921 498202 694427 1157378
Whakatane 56 Waioho 102.7 320.3 3.1 260 810.8 189 4 55405 92342 143691 239485
Whakatane 82 Waimana 291.7 935.0 3.2 877 2811.2 506 2 167146 278577 504860 841433
Whakatane 91 Oromoeroa 214.2 794.6 3.7 758 2811.7 405 2 141689 236148 504768 841281
Whakatane 116 Kanihi 0.0 0.0 0.0 0 0.0 1 0 0 0 0 0
Whakatane 119 Waiiti 1.2 3.7 3.1 2 6.1 7 0 673 1122 1104 1839
Whakatane 121 Ohora 7.7 26.4 3.4 0 0.0 1 0 4748 7914 0 0
Whakatane 122 Tauranga 10.3 35.4 3.4 13 44.7 23 0 6376 10626 8039 13398
Whakatane 123 Ohane 0.8 2.9 3.6 0 0.0 1 0 515 858 0 0
Whakatane 125 Upper Whakatane 88.9 279.7 3.1 412 1296.5 162 0 50350 83916 233367 388946
Whakatane 128 Waikare 5.6 11.2 2.0 0 0.0 11 0 2020 3366 0 0
Totals 17095.9 49088.7 29945 86634.1 35478 860.00 8387060 13978433 15145234 25242056
Average 2.9
Max 4.8
Min 0.0

Appendix 2: Stock water use


Environmental Publication 2014/02 – A model for assessing unconsented or permitted water use in the Bay of Plenty region 39
Appendix 2 – Stock drinking water requirements (Aquas, 2007) + dairy shed use
Farming enterprise Type of animal
Average daily demand (ADD)
litres/head/day
Peak daily demand (PDD)
litres/head/day
Dairy
Milking cow 45 70
Dry stock 30 45
Dairy shed use 70 70
Beef Mature beef cattle, herd replacement stock and bulls
30 55
Sheep Ewes, hoggets and rams 3 4.5
Deer Hinds and stags (all ages) 6 12
Horses Working horses 55 70
Grazing horses 35 50
Goats Milking goats 5 10
Dry goats 3.5 7
Pigs
Mature pigs 11 18
Brood sows 22 35
Pigs up to 120 kg 7 11
Poultry
*all figures are for litres/100 birds/day
Layer and breeder hens 30* 45*
Non-laying hens and chickens 18* 29*
Turkeys 55* 70*
NB: Green shaded data used in model.


Environmental Publication 2014/02 – A model for assessing unconsented or permitted water use in the Bay of Plenty region 41
Appendix 2.2 – AgriBaseTM estimated stock numbers (Master spreadsheet O2:AB164)


Environmental Publication 2014/02 – A model for assessing unconsented or permitted water use in the Bay of Plenty region 43
CATCHMENTS STOCK NUMBERS (AgriBaseTM)
RMA stock water use (m3/d)
RMA stock water use + WLP shed (m3/d)
RMA stock water use (m3/d)
RMA stock water use + WLP shed (m3/d)
Apply beef Apply sheep ADD PDD ADD PDD ADD PDD ADD PDD
GREATER ID CATCHMENT BEEF DAIRY DEER SHEEP LARGE_STOCK SMALL_STOCKStock ADD
Stock PDD
Stock + shed ADD
Stock+ shed PDD Stock ADD
Stock PDD
Stock + shed ADD
Stock+ shed PDD
Kaituna 17 Maketu Estuary Coastal 27 161 0 0 0 2 8061 12764 19331 24034 8061 12764 19331 24034
Kaituna 30 Mangorewa 3169 7925 3053 11041 161 693 507117 822737 1061867 1377487 507117 822737 1061867 1377487
Kaituna 54 Lake Rotoiti 907 56 7 5849 20 43 48048 81503 51968 85423 48048 81503 51968 85423
Kaituna 59 Hauraki 529 1734 208 916 205 112 104382 168872 225762 290252 104382 168872 225762 290252
Kaituna 60 Awahou 626 2583 366 737 133 5636 160119 255225 340929 436035 160119 255225 340929 436035
Kaituna 62 Waiteti 1408 4700 884 4470 175 372 278820 448462 607820 777462 278820 448462 607820 777462
Kaituna 71 Waimehia area 721 690 214 849 108 708 61872 103465 110172 151765 61872 103465 110172 151765
Kaituna 73 Awahou Point area 16 12 443 65 0 5 3888 7351 4728 8191 3888 7351 4728 8191
Kaituna 78 Okawa Bay area 0 0 0 0 0 0 0 0 0 0 0 0 0 0
Kaituna 79 Pohue Bay area 175 0 177 160 21 94 7704 14047 7704 14047 7704 14047 7704 14047
Kaituna 80 Waiohewa 430 0 22 2228 13 109 20433 35146 20433 35146 20433 35146 20433 35146
Kaituna 84 Waimata 32 0 0 262 0 1 1749 2944 1749 2944 1749 2944 1749 2944
Kaituna 87 Ngongotaha 1868 2689 912 11558 163 473 217974 356178 406204 544408 217974 356178 406204 544408
Kaituna 88 Waiowhiro area 63 0 0 495 4 1 3498 5917 3498 5917 3498 5917 3498 5917
Kaituna 90 Rotokawa area 791 0 12 4041 66 115 38250 65981 38250 65981 38250 65981 38250 65981
Kaituna 94 Utuhina 1311 0 682 5218 28 1073 63135 110139 63135 110139 63135 110139 63135 110139
Kaituna 102 Puarenga 928 2269 115 4834 2 54 75042 121533 233872 280363 75042 121533 233872 280363
Kaituna 158 Hamurana area 344 801 923 2729 33 415 62325 102029 118395 158099 62325 102029 118395 158099
Kaituna 159 Hururu 519 1688 1122 2876 10 140 107610 174291 225770 292451 107610 174291 225770 292451
Kaituna 160 Upper Kaituna 732 1078 346 3949 31 417 61350 97278 136810 172738 61350 97278 136810 172738
Kaituna 161 Parawhenuamea 606 1211 40 1510 1726 313 73020 116988 157790 201758 73020 116988 157790 201758
Kaituna 162 Te Puke East 119 0 0 121 4 14 4095 7373 4095 7373 4095 7373 4095 7373
Kaituna 163 Waiari 1579 1131 519 1649 26 194 105507 178483 184677 257653 105507 178483 184677 257653
Kaituna 164 Ohineangaanga 1541 1776 1221 3521 246 51 108192 185686 232512 310006 108192 185686 232512 310006
Kaituna 165 Raparapahoe 1238 1169 530 2725 27 2645 98691 162679 180521 244509 98691 162679 180521 244509
Kaituna 166 Rangiuru Soiuth 55 266 0 96 9 25 1200 1978 19820 20598 1200 1978 19820 20598
Kaituna 167 Kopuaroa 606 4877 0 762 37 69 221940 349410 563330 690800 221940 349410 563330 690800
Kaituna 168 Papamoa 120 1890 0 260 8 23 89739 140614 222039 272914 89739 140614 222039 272914
Kaituna 169 Lower Kaituna 1067 10566 74 658 37 239 419889 658910 1159509 1398530 419889 658910 1159509 1398530
Motu 4 Tahurua Coastal 182 16 0 621 2 3 8112 14048 9232 15168 8112 14048 9232 15168
Motu 5 Whangaparaoa 1061 744 0 2599 19 25 73752 123288 125832 175368 73752 123288 125832 175368
Motu 6 Waiokaha Coastal 1549 1060 0 9059 111 129 125064 206846 199264 281046 125064 206846 199264 281046
Motu 12 Waikura 2 0 0 0 0 1 63 115 63 115 63 115 63 115
Motu 13 Raukokore area 294 0 0 126 1 19 9285 16878 9285 16878 9285 16878 9285 16878

Environmental Publication 2014/02 – A model for assessing unconsented or 44 permitted water use in the Bay of Plenty region
CATCHMENTS STOCK NUMBERS (AgriBaseTM)
RMA stock water use (m3/d)
RMA stock water use + WLP shed (m3/d)
RMA stock water use (m3/d)
RMA stock water use + WLP shed (m3/d)
Apply beef Apply sheep ADD PDD ADD PDD ADD PDD ADD PDD
GREATER ID CATCHMENT BEEF DAIRY DEER SHEEP LARGE_STOCK SMALL_STOCKStock ADD
Stock PDD
Stock + shed ADD
Stock+ shed PDD Stock ADD
Stock PDD
Stock + shed ADD
Stock+ shed PDD
Motu 15 Waikawa Coastal 689 0 0 347 39 27 22962 41723 22962 41723 22962 41723 22962 41723
Motu 19 Kereu 542 0 0 200 21 21 17553 31960 17553 31960 17553 31960 17553 31960
Motu 21 Te Kaha Coastal 403 30 0 40 38 30 14790 26670 16890 28770 14790 26670 16890 28770
Motu 26 Mangahaupapa 0 0 0 0 0 0 0 0 0 0 0 0 0 0
Motu 31 Haparapara area 5 0 0 0 2 1 213 390 213 390 213 390 213 390
Motu 33 Waikakariki 0 0 0 0 0 0 0 0 0 0 0 0 0 0
Motu 35 Pokohinu Coastal 319 11 0 0 23 16 10803 19652 11573 20422 10803 19652 11573 20422
Motu 41 Motu area 17 295 11 2 0 4 13869 21744 34519 42394 13869 21744 34519 42394
Motu 43 Whituare Coastal 127 0 0 30 9 12 4206 7669 4206 7669 4206 7669 4206 7669
Motu 45 Mangatutara 0 0 0 0 0 0 0 0 0 0 0 0 0 0
Motu 46 Hawai 135 151 0 0 2 6 10923 18132 21493 28702 10923 18132 21493 28702
Motu 49 Pehitaiti Coastal 90 438 0 0 6 29 22677 36071 53337 66731 22677 36071 53337 66731
Motu 51 Torere 106 229 0 0 4 19 13662 22166 29692 38196 13662 22166 29692 38196
Motu 52 Omarumutu Coastal 780 2161 2 272 84 146 123585 199146 274855 350416 123585 199146 274855 350416
Motu 53 Te Kahika 0 0 0 0 0 0 0 0 0 0 0 0 0 0
Motu 66 Tirohanga Coastal 950 1974 332 1547 28 197 122445 198210 260625 336390 122445 198210 260625 336390
Motu 70 Waiaua 478 2309 128 548 108 92 124173 198276 285803 359906 124173 198276 285803 359906
Motu 81 Rawea 895 131 0 2671 100 148 44202 76581 53372 85751 44202 76581 53372 85751
Motu 93 Mangaotane 513 0 0 3291 4 6 25401 43272 25401 43272 25401 43272 25401 43272
Ohiwa 48 Maraetotara Coastal 0 0 0 0 0 0 0 0 0 0 0 0 0 0
Ohiwa 57 Wainui area 1140 1259 155 338 77 332 96105 159940 184235 248070 96105 159940 184235 248070
Ohiwa 63 Kutarere area 928 882 200 1906 93 381 78381 130587 140121 192327 78381 130587 140121 192327
Ohiwa 64 Waiotahi 2144 6030 92 1315 90 715 345012 555209 767112 977309 345012 555209 767112 977309
Ohiwa 65 Waiotahi Beach Coastal 329 1173 0 132 5 441 64524 103059 146634 185169 64524 103059 146634 185169
Ohiwa 77 Nukuhou 4764 7688 366 6464 940 1009 541113 888838 1079273 1426998 541113 888838 1079273 1426998
Pongakawa 16 Newdicks Coastal 20 262 0 1 0 1 12396 19449 30736 37789 12396 19449 30736 37789
Pongakawa 20 Pukehina Beach Coastal 0 0 0 0 0 0 0 0 0 0 0 0 0 0
Pongakawa 22 Kaikokopu area 781 7471 18 774 74 176 305628 481224 828598 1004194 305628 481224 828598 1004194
Pongakawa 23 Pongakawa area 2954 12965 72 5423 72 3901 454605 726131 1362155 1633681 454605 726131 1362155 1633681
Pongakawa 24 Pukehina Coastal 72 2532 0 0 6 27 116361 181652 293601 358892 116361 181652 293601 358892
Pongakawa 25 Wharere 1705 10992 392 2484 47 530 336012 535664 1105452 1305104 336012 535664 1105452 1305104
Pongakawa 27 Ohinepanea Coastal 411 4057 0 444 27 145 128142 201538 412132 485528 128142 201538 412132 485528
Pongakawa 28 Pokopoko 3799 3092 1203 7979 78 721 90438 166202 306878 382642 90438 166202 306878 382642
Rangitaiki 36 Mangamako area 2059 24346 255 385 345 817 962115 1515685 2666335 3219905 962115 1515685 2666335 3219905

Environmental Publication 2014/02 – A model for assessing unconsented or permitted water use in the Bay of Plenty region 45
CATCHMENTS STOCK NUMBERS (AgriBaseTM)
RMA stock water use (m3/d)
RMA stock water use + WLP shed (m3/d)
RMA stock water use (m3/d)
RMA stock water use + WLP shed (m3/d)
Apply beef Apply sheep ADD PDD ADD PDD ADD PDD ADD PDD
GREATER ID CATCHMENT BEEF DAIRY DEER SHEEP LARGE_STOCK SMALL_STOCKStock ADD
Stock PDD
Stock + shed ADD
Stock+ shed PDD Stock ADD
Stock PDD
Stock + shed ADD
Stock+ shed PDD
Rangitaiki 42 Lower Tarawera area 4721 30111 165 770 663 195470 1707723 2675240 3815493 4783010 1707723 2675240 3815493 4783010
Rangitaiki 47 Waikamihi 782 1623 10 2718 14 59 105306 170007 218916 283617 105306 170007 218916 283617
Rangitaiki 50 Otakiri 516 1091 0 735 5 25 28257 48158 104627 124528 28257 48158 104627 124528
Rangitaiki 61 Mangawiki 879 2001 433 1275 30 196 77934 129588 218004 269658 77934 129588 218004 269658
Rangitaiki 83 Waikanapiti 11 0 0 0 1 1 363 665 363 665 363 665 363 665
Rangitaiki 92 Lake Okataina 165 0 224 743 0 9 8550 15147 8550 15147 8550 15147 8550 15147
Rangitaiki 99 Mangate 0 0 0 0 0 0 0 0 0 0 0 0 0 0
Rangitaiki 100 Mangawhio 5 0 0 1 0 0 153 280 153 280 153 280 153 280
Rangitaiki 101 Lake Okareka 315 0 285 3032 4 6 -2880 -3525 -2880 -3525 0 0 0 0
Rangitaiki 104 Lake Tarawera 1192 0 1907 11813 7 63 59766 104110 59766 104110 59766 104110 59766 104110
Rangitaiki 105 Waiaute 88 363 0 14 4 4 19149 30551 44559 55961 19149 30551 44559 55961
Rangitaiki 107 Lake Tikitapu 19 0 0 273 0 0 1389 2274 1389 2274 1389 2274 1389 2274
Rangitaiki 108 Lake Rotokakahi 358 0 105 2655 0 5 19350 32920 19350 32920 19350 32920 19350 32920
Rangitaiki 113 Lake Rotomahana 1109 4393 87 13226 17 80 271905 430361 579415 737871 271905 430361 579415 737871
Rangitaiki 114 Pokairoa 558 3941 2454 1981 16 83 198825 320267 474695 596137 198825 320267 474695 596137
Rangitaiki 117 Lake Rerewhakaaitu 182 4912 784 878 7 56 228393 358922 572233 702762 228393 358922 572233 702762
Rangitaiki 120 Okaro 178 233 51 1091 4 20 19584 31932 35894 48242 19584 31932 35894 48242
Rangitaiki 126 Horomanga 324 12546 109 354 3080 244 495006 794719 1373226 1672939 495006 794719 1373226 1672939
Rangitaiki 130 Whirinaki 347 1354 160 4526 60 45 74697 119111 169477 213891 74697 119111 169477 213891
Rangitaiki 131 Pouarua area 2826 2859 0 33507 7 35 -52179 -86141 147951 113989 0 0 147951 113989
Rangitaiki 132 Otamatea 2957 6051 8381 16428 2 21 94248 167883 517818 591453 94248 167883 517818 591453
Rangitaiki 154 Waikowhewhe area 965 926 0 555 117 143 50937 87978 115757 152798 50937 87978 115757 152798
Rangitaiki 155 Kaingaroa area 1156 4534 1679 5232 41 149 183276 296078 500656 613458 183276 296078 500656 613458
Rangitaiki 156 Wheao 660 779 355 963 35 59 44022 75006 98552 129536 44022 75006 98552 129536
Rangitaiki 157 Mangatiti area 2225 0 11007 21610 1 20 197712 351849 197712 351849 197712 351849 197712 351849
Tauranga Harbour 1 Tuapiro 1196 187 417 845 94 217 51600 91719 64690 104809 51600 91719 64690 104809
Tauranga Harbour 2 Uretara 562 1078 69 558 43 163 69237 112808 144697 188268 69237 112808 144697 188268
Tauranga Harbour 3 Te Mania 504 407 0 1027 71 133 22002 36966 50492 65456 22002 36966 50492 65456
Tauranga Harbour 10 Oturu 143 1 0 124 6 50 5037 9048 5107 9118 5037 9048 5107 9118
Tauranga Harbour 11 Kopurererua 1778 1351 2810 3268 126 603 145038 247965 239608 342535 145038 247965 239608 342535
Tauranga Harbour 14 Waimapu 4259 2391 473 6787 166 72546 470925 756319 638295 923689 470925 756319 638295 923689
Tauranga Harbour 18 Wairoa 1823 1456 1625 10406 57 434 164190 273600 266110 375520 164190 273600 266110 375520
Tauranga Harbour 58 Wairoa 3354 1309 1255 12235 190 1237 212358 360745 303988 452375 212358 360745 303988 452375
Tauranga Harbour 133 Waiau 119 66 22 108 10 33 7395 12614 12015 17234 7395 12614 12015 17234

Environmental Publication 2014/02 – A model for assessing unconsented or 46 permitted water use in the Bay of Plenty region
CATCHMENTS STOCK NUMBERS (AgriBaseTM)
RMA stock water use (m3/d)
RMA stock water use + WLP shed (m3/d)
RMA stock water use (m3/d)
RMA stock water use + WLP shed (m3/d)
Apply beef Apply sheep ADD PDD ADD PDD ADD PDD ADD PDD
GREATER ID CATCHMENT BEEF DAIRY DEER SHEEP LARGE_STOCK SMALL_STOCKStock ADD
Stock PDD
Stock + shed ADD
Stock+ shed PDD Stock ADD
Stock PDD
Stock + shed ADD
Stock+ shed PDD
Tauranga Harbour 134 Waihi Beach 31 0 0 57 4 2 1227 2191 1227 2191 1227 2191 1227 2191
Tauranga Harbour 135 Tahawai 410 208 122 466 36 134 23559 40195 38119 54755 23559 40195 38119 54755
Tauranga Harbour 136 Ongare/Tanners Point 266 498 0 90 14 70 30600 49725 65460 84585 30600 49725 65460 84585
Tauranga Harbour 137 Katikati Streams 10 186 0 0 0 2 8676 13579 21696 26599 8676 13579 21696 26599
Tauranga Harbour 138 Te Rereatukahia 323 471 0 116 20 177 17895 30630 50865 63600 17895 30630 50865 63600
Tauranga Harbour 139 Waitekohe 709 658 22 307 30 175 16365 31181 62425 77241 16365 31181 62425 77241
Tauranga Harbour 140 Waione 183 619 0 163 8 103 31716 50262 75046 93592 31716 50262 75046 93592
Tauranga Harbour 141 Aongatete 735 1218 324 557 162 476 85653 141097 170913 226357 85653 141097 170913 226357
Tauranga Harbour 142 Whatakao 852 539 127 1969 34 721 57489 96472 95219 134202 57489 96472 95219 134202
Tauranga Harbour 143 Wainui 1317 0 1110 1751 129 663 48114 87071 48114 87071 48114 87071 48114 87071
Tauranga Harbour 144 Apata 893 118 148 2212 53 346 40089 69813 48349 78073 40089 69813 48349 78073
Tauranga Harbour 145 Waipapa 1733 575 292 1590 126 1121 86790 149889 127040 190139 86790 149889 127040 190139
Tauranga Harbour 146 Te Puna 1665 999 197 3032 60 682 107523 181433 177453 251363 107523 181433 177453 251363
Tauranga Harbour 147 Ohourere 947 915 380 3797 30 395 75711 126204 139761 190254 75711 126204 139761 190254
Tauranga Harbour 148 Mangapapa/Opuiaki 223 119 118 2229 6 90 19890 32777 28220 41107 19890 32777 28220 41107
Tauranga Harbour 149 Omanawa 1101 2044 3 2558 81 358 135756 220423 278836 363503 135756 220423 278836 363503
Tauranga Harbour 150 Kaitemako 241 0 2 11 1 19 7362 13469 7362 13469 7362 13469 7362 13469
Tauranga Harbour 152 Waitao area 1484 2 401 3142 1030 240 87222 156911 87362 157051 87222 156911 87362 157051
Tauranga Harbour 153 Maungatawa area 315 150 0 465 22 121 14778 24862 25278 35362 14778 24862 25278 35362
Tauranga Harbour 170 Matakana Island 282 2381 0 30 39 27 103680 163238 270350 329908 103680 163238 270350 329908
Waioeka 67 Kukumoa Creek 665 2988 1 641 77 694 160725 255981 369885 465141 160725 255981 369885 465141
Waioeka 68 Otara 914 4782 1 1273 35 133 166617 266061 501357 600801 166617 266061 501357 600801
Waioeka 72 Te Karaka Stream 378 1052 72 104 24 92 58842 94390 132482 168030 58842 94390 132482 168030
Waioeka 74 Waioeka area 441 1668 1 668 32 194 91842 146666 208602 263426 91842 146666 208602 263426
Waioeka 76 Apanui 1387 5054 7 1837 57 136 10263 26761 364043 380541 10263 26761 364043 380541
Waioeka 89 Pakahi 287 0 0 97 15 9 9378 17087 9378 17087 9378 17087 9378 17087
Waioeka 95 Tutaetoko 96 164 1 100 12 34 11028 18035 22508 29515 11028 18035 22508 29515
Waioeka 103 Te Waiti 24 0 0 48 1 1 897 1596 897 1596 897 1596 897 1596
Waioeka 106 Mangaoira 0 0 0 0 0 0 0 0 0 0 0 0 0 0
Waioeka 109 Tauranga 0 0 0 0 0 0 0 0 0 0 0 0 0 0
Waioeka 111 Waiata 9 0 19 33 5 0 633 1147 633 1147 633 1147 633 1147
Waioeka 112 Wairata 484 0 21 1090 29 25 18861 33485 18861 33485 18861 33485 18861 33485
Waioeka 115 Omaukora 175 0 0 574 1 5 7017 12286 7017 12286 7017 12286 7017 12286
Waioeka 118 Opato 109 0 119 516 8 4 5784 10203 5784 10203 5784 10203 5784 10203

Environmental Publication 2014/02 – A model for assessing unconsented or permitted water use in the Bay of Plenty region 47
CATCHMENTS STOCK NUMBERS (AgriBaseTM)
RMA stock water use (m3/d)
RMA stock water use + WLP shed (m3/d)
RMA stock water use (m3/d)
RMA stock water use + WLP shed (m3/d)
Apply beef Apply sheep ADD PDD ADD PDD ADD PDD ADD PDD
GREATER ID CATCHMENT BEEF DAIRY DEER SHEEP LARGE_STOCK SMALL_STOCKStock ADD
Stock PDD
Stock + shed ADD
Stock+ shed PDD Stock ADD
Stock PDD
Stock + shed ADD
Stock+ shed PDD
Waioeka 124 Te Pato 0 0 0 0 0 0 0 0 0 0 0 0 0 0
Waioeka 127 Tataweka 0 0 0 0 0 0 0 0 0 0 0 0 0 0
Waioeka 129 Koranga 0 0 0 0 0 0 0 0 0 0 0 0 0 0
Waitahanui 29 Otamarakau Coastal 6 309 0 19 0 1 14145 22050 35775 43680 14145 22050 35775 43680
Waitahanui 32 Waitahanui 1842 4435 599 5933 50 203 174753 282519 485203 592969 174753 282519 485203 592969
Waitahanui 34 Hauone Coastal 731 3519 0 1789 18 69 42945 71220 289275 317550 42945 71220 289275 317550
Waitahanui 37 Pikowai Coastal 1821 667 0 2223 13 63 71085 120495 117775 167185 71085 120495 117775 167185
Waitahanui 38 Ruataniwha Coastal 110 41 0 211 0 4 5790 9888 8660 12758 5790 9888 8660 12758
Waitahanui 39 Mimiha Coastal 2615 1263 477 4078 61 599 154008 262361 242418 350771 154008 262361 242418 350771
Waitahanui 40 Ohinekoao Coastal 374 0 6 677 2 50 13497 24024 13497 24024 13497 24024 13497 24024
Waitahanui 55 Lake Rotoehu 118 856 26 1488 4 12 46836 73692 106756 133612 46836 73692 106756 133612
Waitahanui 69 Lake Rotoma 470 24 137 4061 0 26 28263 47566 29943 49246 28263 47566 29943 49246
Whakatane 44 Whakatane Area 3658 17636 309 3997 3780 959 650943 1041502 1885463 2276022 650943 1041502 1885463 2276022
Whakatane 56 Waioho 3866 5450 78 4561 84 280 378645 621297 760145 1002797 378645 621297 760145 1002797
Whakatane 82 Waimana 3854 10610 238 2079 151 636 585573 944449 1328273 1687149 585573 944449 1328273 1687149
Whakatane 91 Oromoeroa 1063 4567 30 333 143 137 186405 299925 506095 619615 186405 299925 506095 619615
Whakatane 116 Kanihi 0 0 0 0 0 0 0 0 0 0 0 0 0 0
Whakatane 119 Waiiti 5 0 0 0 11 4 492 898 492 898 492 898 492 898
Whakatane 121 Ohora 0 0 0 0 0 0 0 0 0 0 0 0 0 0
Whakatane 122 Tauranga 40 0 0 0 42 22 2526 4609 2526 4609 2526 4609 2526 4609
Whakatane 123 Ohane 0 0 0 0 0 0 0 0 0 0 0 0 0 0
Whakatane 125 Upper Whakatane 660 0 70 4564 200 156 40380 69380 40380 69380 40380 69380 40380 69380
Whakatane 128 Waikare 36 0 0 0 38 0 2220 4070 2220 4070 2220 4070 2220 4070
Totals 128004 304318 55421 349851 17404 306842 16191978 26276195 37494238 47578455 16191978 26276195 37494238 47578455
NB: It is assumed that water use is covered by consent, therefore no permitted takes are calculated for in these catchments.

Environmental Publication 2014/02 – A model for assessing unconsented or permitted water use in the Bay of Plenty region 49
Appendix 2.3 – Land use classification from LCDB2 (outside of AgriBaseTM) areas
LCDB2NAME
Afforestation (imaged, post LCDB 1)
Afforestation (not imaged)
Alpine Grass-/Herbfield
Alpine Gravel and Rock
Broadleaved Indigenous Hardwoods
Built-up Area
Coastal Sand and Gravel
Deciduous Hardwoods
Dump
Estuarine Open Water
Fernland
Forest Harvested
Gorse and Broom
Grey Scrub
Herbaceous Freshwater Vegetation
Herbaceous Saline Vegetation
High Producing Exotic Grassland
Indigenous Forest
Lake and Pond
Landslide
Low Producing Grassland
Major Shelterbelts
Mangrove
Manuka and or Kanuka
Matagouri
Mixed Exotic Shrubland
Orchard and Other Perennial Crops
Other Exotic Forest
Pine Forest - Closed Canopy
Pine Forest - Open Canopy
River
River and Lakeshore Gravel and Rock
Environmental Publication 2014/02 – A model for assessing unconsented or 50 permitted water use in the Bay of Plenty region
LCDB2NAME
Short-rotation Cropland
Sub Alpine Shrubland
Surface Mine
Tall Tussock Grassland
Transport Infrastructure
Urban Parkland/ Open Space
Vineyard
KEY: High producing grassland
Low producing grassland and shrublands No livestock Remove

Environmental Publication 2014/02 – A model for assessing unconsented or permitted water use in the Bay of Plenty region 51
Appendix 2.4 – Estimated stock water use from LCDB2, outside AgriBaseTM areas (Master spreadsheet AK2:AS164

Environmental Publication 2014/02 – A model for assessing unconsented or permitted water use in the Bay of Plenty region 53
CATCHMENTS Land coverage – Non-AgriBaseTM AgriBaseTM Non-AgriBaseTM beef and dairy (RMA)
Non-AgriBaseTM Beef and dairy (RMA+WLP)
(ha) (ha) (ha) (ha) (m3/d) (m3/d) (m3/d) (m3/d) (%)
GREATER ID CATCHMENT High
producing grassland
Low producing grassland
Land with no livestock
AgriBaseTM
dairy Beef/dairy ADD Beef/dairy PDD Beef/dairy ADD Beef/dairy PDD
AgriBaseTM land coverage
Kaituna 17 Maketu Estuary Coastal 56 2 9 88.32 7196 11237 18146 22187 57.00
Kaituna 30 Mangorewa 487 0 1213 16691.34 61359 95451 156785 190877 90.75
Kaituna 54 Lake Rotoiti 587 13 8031 3670.10 75003 116964 190040 232000 29.83
Kaituna 59 Hauraki 96 0 15 1227.03 12047 18740 30786 37479 91.72
Kaituna 60 Awahou 141 0 202 2497.43 17760 27626 45386 55252 87.91
Kaituna 62 Waiteti 687 6 796 5332.40 87055 135540 221797 270282 78.17
Kaituna 71 Waimehia area 169 2 18 750.91 21381 33301 54407 66327 79.97
Kaituna 73 Awahou Point area 34 0 1 92.92 4329 6735 11064 13469 72.38
Kaituna 78 Okawa Bay area 0 0 45 28.37 38 59 97 118 38.76
Kaituna 79 Pohue Bay area 78 0 42 265.29 9769 15196 24965 30392 68.98
Kaituna 80 Waiohewa 238 1 164 808.96 30018 46711 76625 93318 66.75
Kaituna 84 Waimata 4 0 73 121.69 471 733 1204 1466 61.34
Kaituna 87 Ngongotaha 307 0 627 6561.80 38720 60231 98951 120462 87.53
Kaituna 88 Waiowhiro area 2 0 7 222.23 226 351 576 702 96.24
Kaituna 90 Rotokawa area 167 0 138 1254.19 21016 32691 53706 65382 80.47
Kaituna 94 Utuhina 119 12 783 3446.84 15963 25095 39320 48452 79.04
Kaituna 102 Puarenga 339 16 3087 2923.52 43991 68773 110504 135286 45.93
Kaituna 158 Hamurana area 197 7 97 1282.60 25438 39727 64132 78421 80.98
Kaituna 159 Hururu 84 0 588 2095.25 10537 16391 26929 32783 75.71
Kaituna 160 Upper Kaituna 235 6 1974 3612.63 30045 46873 76017 92845 61.99
Kaituna 161 Parawhenuamea 240 0 422 2465.53 30241 47042 77283 94084 78.83
Kaituna 162 Te Puke East 10 0 148 537.88 1215 1889 3104 3779 77.35
Kaituna 163 Waiari 378 2 2164 4556.32 47831 74445 122003 148618 64.17
Kaituna 164 Ohineangaanga 86 0 156 1841.73 10773 16758 27531 33516 88.40
Kaituna 165 Raparapahoe 124 1 637 4534.11 15646 24353 39899 48606 85.61
Kaituna 166 Rangiuru Soiuth 28 0 71 314.68 3523 5480 9003 10960 76.08
Kaituna 167 Kopuaroa 223 1 75 2696.50 28146 43812 71772 87437 90.03
Kaituna 168 Papamoa 82 9 15 665.88 10937 17198 26911 33172 86.33
Kaituna 169 Lower Kaituna 893 4 663 4407.35 112793 175540 287778 350525 73.87
Motu 4 Tahurua Coastal 79 3 211 550.70 10266 16044 25817 31595 65.22
Motu 5 Whangaparaoa 3005 2069 9845 3292.76 540049 884903 1129098 1473951 18.08
Motu 6 Waiokaha Coastal 304 0 1282 4641.16 38323 59613 97936 119227 74.53
Motu 12 Waikura 3128 6 3060 4402.87 394503 613793 1007495 1226785 41.55
Environmental Publication 2014/02 – A model for assessing unconsented or 54 permitted water use in the Bay of Plenty region
CATCHMENTS Land coverage – Non-AgriBaseTM AgriBaseTM Non-AgriBaseTM beef and dairy (RMA)
Non-AgriBaseTM Beef and dairy (RMA+WLP)
(ha) (ha) (ha) (ha) (m3/d) (m3/d) (m3/d) (m3/d) (%)
GREATER ID CATCHMENT High
producing grassland
Low producing grassland
Land with no livestock
AgriBaseTM
dairy Beef/dairy ADD Beef/dairy PDD Beef/dairy ADD Beef/dairy PDD
AgriBaseTM land coverage
Motu 13 Raukokore area 72 6 7163 1862.68 9571 15021 23723 29172 20.46
Motu 15 Waikawa Coastal 135 0 1664 3370.53 17068 26550 43618 53100 65.20
Motu 19 Kereu 68 162 11677 2309.88 21125 36364 34364 49604 16.25
Motu 21 Te Kaha Coastal 483 0 3072 693.74 60836 94636 155455 189255 16.33
Motu 26 Mangahaupapa 169 0 1095 14340.78 21348 33208 54556 66417 91.90
Motu 31 Haparapara area 20 0 4942 7884.75 2517 3916 6434 7832 61.38
Motu 33 Waikakariki 0 0 3855 3.89 0 0 0 0 0.10
Motu 35 Pokohinu Coastal 201 0 1277 308.22 25351 39435 64786 78870 17.25
Motu 41 Motu area 20335 39 25913 31139.50 2565280 3991276 6551004 7977001 40.22
Motu 43 Whituare Coastal 30 0 241 147.29 3827 5962 9735 11869 35.17
Motu 45 Mangatutara 0 0 103 10552.54 0 0 0 0 99.03
Motu 46 Hawai 22 0 3525 3835.43 2725 4239 6965 8479 51.95
Motu 49 Pehitaiti Coastal 106 6 379 462.07 13837 21644 34694 42501 48.50
Motu 51 Torere 86 0 1214 6058.45 10856 16887 27744 33775 82.33
Motu 52 Omarumutu Coastal 578 7 635 1600.00 73409 114345 186740 227676 56.72
Motu 53 Te Kahika 0 0 43 13180.89 0 0 0 0 99.67
Motu 66 Tirohanga Coastal 153 1 172 2445.13 19333 30095 49284 60046 88.26
Motu 70 Waiaua 306 7 511 8796.25 39189 61120 99259 121190 91.42
Motu 81 Rawea 264 18 1329 21718.72 34642 54286 86304 105947 93.09
Motu 93 Mangaotane 2942 28 7988 7334.92 372862 580608 949512 1157258 40.10
Ohiwa 48 Maraetotara Coastal 0 0 0 65.16 0 0 0 0 100.00
Ohiwa 57 Wainui area 402 0 1163 2122.97 50692 78855 129547 157709 57.56
Ohiwa 63 Kutarere area 195 6 197 1787.85 24961 38948 63118 77105 81.82
Ohiwa 64 Waiotahi 523 21 685 13527.39 67560 105554 170072 208065 91.67
Ohiwa 65 Waiotahi Beach Coastal 59 0 31 552.24 7447 11584 19030 23167 85.97
Ohiwa 77 Nukuhou 763 3 1203 8351.17 96294 149849 245760 299315 80.92
Pongakawa 16 Newdicks Coastal 55 12 10 147.55 7795 12377 18506 23089 65.90
Pongakawa 20 Pukehina Beach Coastal 4 0 20 37.56 491 764 1256 1529 61.24
Pongakawa 22 Kaikokopu area 234 0 78 2995.05 29543 45956 75499 91912 90.54
Pongakawa 23 Pongakawa area 459 1 1925 10878.91 57920 90127 147857 180063 82.02
Pongakawa 24 Pukehina Coastal 74 0 5 927.39 9382 14594 23976 29188 92.13
Pongakawa 25 Wharere 500 0 96 5494.04 62987 97980 160968 195961 90.22
Pongakawa 27 Ohinepanea Coastal 181 0 47 1869.11 22806 35476 58282 70952 89.14

Environmental Publication 2014/02 – A model for assessing unconsented or permitted water use in the Bay of Plenty region 55
CATCHMENTS Land coverage – Non-AgriBaseTM AgriBaseTM Non-AgriBaseTM beef and dairy (RMA)
Non-AgriBaseTM Beef and dairy (RMA+WLP)
(ha) (ha) (ha) (ha) (m3/d) (m3/d) (m3/d) (m3/d) (%)
GREATER ID CATCHMENT High
producing grassland
Low producing grassland
Land with no livestock
AgriBaseTM
dairy Beef/dairy ADD Beef/dairy PDD Beef/dairy ADD Beef/dairy PDD
AgriBaseTM land coverage
Pongakawa 28 Pokopoko 799 8 1630 7714.98 101329 157794 257992 314457 76.00
Rangitaiki 36 Mangamako area 1244 78 4560 27854.06 162863 255027 406769 498934 82.56
Rangitaiki 42 Lower Tarawera area 2001 29 11315 20668.22 254297 396192 646405 788300 60.77
Rangitaiki 47 Waikamihi 76 0 206 1923.02 9557 14867 24424 29733 87.22
Rangitaiki 50 Otakiri 64 0 139 678.72 8119 12630 20750 25260 76.92
Rangitaiki 61 Mangawiki 185 0 1179 3532.86 23342 36309 59651 72618 72.14
Rangitaiki 83 Waikanapiti 33 0 542 2662.93 4116 6403 10520 12807 82.25
Rangitaiki 92 Lake Okataina 8 2 1528 4387.91 1195 1904 2796 3506 74.04
Rangitaiki 99 Mangate 0 0 1194 1604.86 0 0 0 0 57.34
Rangitaiki 100 Mangawhio 7 4 4007 1105.45 1165 1906 2448 3190 21.58
Rangitaiki 101 Lake Okareka 22 2 399 1277.93 2923 4584 7262 8923 75.13
Rangitaiki 104 Lake Tarawera 82 261 6487 7479.97 30639 53308 46674 69342 52.27
Rangitaiki 105 Waiaute 53 259 10161 954.31 26833 47342 37206 57714 8.35
Rangitaiki 107 Lake Tikitapu 8 0 275 368.76 959 1492 2450 2983 56.65
Rangitaiki 108 Lake Rotokakahi 13 0 1278 632.49 1654 2573 4228 5147 32.89
Rangitaiki 113 Lake Rotomahana 165 88 1653 6297.67 27746 45076 60178 77508 76.76
Rangitaiki 114 Pokairoa 357 10 2104 10660.11 45810 71481 115827 141498 81.18
Rangitaiki 117 Lake Rerewhakaaitu 134 4 863 2654.75 17160 26774 43403 53017 72.62
Rangitaiki 120 Okaro 17 0 25 341.58 2181 3393 5574 6786 88.89
Rangitaiki 126 Horomanga 227 0 857 18978.06 28568 44439 73007 88878 94.60
Rangitaiki 130 Whirinaki 302 9 2931 48588.70 38788 60540 97984 119736 93.74
Rangitaiki 131 Pouarua area 70 169 2182 21298.59 22007 37886 35786 51665 89.79
Rangitaiki 132 Otamatea 85 24 861 10442.91 12517 19981 29132 36596 91.50
Rangitaiki 154 Waikowhewhe area 314 76 16464 8901.34 45544 72499 107133 134088 34.56
Rangitaiki 155 Kaingaroa area 555 58 705 69027.94 74414 117007 183163 225756 98.13
Rangitaiki 156 Wheao 49 0 1483 22442.00 6161 9584 15746 19169 93.61
Rangitaiki 157 Mangatiti area 21 0 18 20469.91 2688 4182 6858 8353 99.81
Tauranga Harbour 1 Tuapiro 425 0 279 4484.07 53487 83202 136689 166404 86.44
Tauranga Harbour 2 Uretara 201 0 174 2623.31 25268 39306 64574 78612 87.52
Tauranga Harbour 3 Te Mania 321 0 159 840.18 40483 62973 103455 125946 63.62
Tauranga Harbour 10 Oturu 79 0 60 213.84 9924 15437 25361 30874 60.71
Tauranga Harbour 11 Kopurererua 475 2 1424 4097.73 60008 93386 153126 186504 68.31
Tauranga Harbour 14 Waimapu 788 1 2365 6099.47 99401 154643 253920 309162 65.91

Environmental Publication 2014/02 – A model for assessing unconsented or 56 permitted water use in the Bay of Plenty region
CATCHMENTS Land coverage – Non-AgriBaseTM AgriBaseTM Non-AgriBaseTM beef and dairy (RMA)
Non-AgriBaseTM Beef and dairy (RMA+WLP)
(ha) (ha) (ha) (ha) (m3/d) (m3/d) (m3/d) (m3/d) (%)
GREATER ID CATCHMENT High
producing grassland
Low producing grassland
Land with no livestock
AgriBaseTM
dairy Beef/dairy ADD Beef/dairy PDD Beef/dairy ADD Beef/dairy PDD
AgriBaseTM land coverage
Tauranga Harbour 18 Wairoa 462 8 2124 8690.09 58875 91764 149444 182333 77.01
Tauranga Harbour 58 Wairoa 570 0 442 4878.73 71826 111730 183556 223460 82.82
Tauranga Harbour 133 Waiau 469 0 112 2140.33 59134 91987 151121 183973 78.65
Tauranga Harbour 134 Waihi Beach 63 0 163 1684.28 7923 12324 20247 24649 88.19
Tauranga Harbour 135 Tahawai 181 0 76 918.10 22767 35415 58182 70830 78.12
Tauranga Harbour 136 Ongare/Tanners Point 176 0 250 998.86 22117 34404 56521 68808 70.13
Tauranga Harbour 137 Katikati Streams 37 0 40 187.86 4694 7301 11995 14602 70.79
Tauranga Harbour 138 Te Rereatukahia 103 0 220 1556.80 12940 20129 33069 40258 82.83
Tauranga Harbour 139 Waitekohe 96 0 253 1801.92 12081 18792 30873 37585 83.76
Tauranga Harbour 140 Waione 106 0 114 606.05 13384 20819 34203 41638 73.34
Tauranga Harbour 141 Aongatete 199 0 231 4238.27 25139 39107 64233 78201 90.77
Tauranga Harbour 142 Whatakao 216 2 245 2424.36 27315 42529 69593 84806 83.98
Tauranga Harbour 143 Wainui 337 0 595 2906.19 42462 66059 108473 132070 75.72
Tauranga Harbour 144 Apata 182 0 80 947.63 22933 35674 58607 71348 78.34
Tauranga Harbour 145 Waipapa 442 0 412 2788.90 55722 86679 142401 173358 76.55
Tauranga Harbour 146 Te Puna 290 0 107 1730.97 36559 56869 93428 113739 81.34
Tauranga Harbour 147 Ohourere 154 0 804 2095.17 19420 30209 49630 60419 68.63
Tauranga Harbour 148 Mangapapa/Opuiaki 108 0 6326 9989.67 13651 21235 34885 42469 60.82
Tauranga Harbour 149 Omanawa 261 12 3067 5173.70 33855 52921 85078 104144 60.77
Tauranga Harbour 150 Kaitemako 72 0 12 151.91 9032 14049 23081 28099 64.53
Tauranga Harbour 152 Waitao area 202 5 673 2122.82 25839 40312 65377 79849 70.69
Tauranga Harbour 153 Maungatawa area 39 3 70 924.15 5156 8087 12804 15735 89.22
Tauranga Harbour 170 Matakana Island 330 7 4259 1383.66 42111 65651 106807 130347 23.14
Waioeka 67 Kukumoa Creek 214 0 47 1450.95 26974 41960 68934 83919 84.76
Waioeka 68 Otara 719 17 728 2123.23 91971 143437 232960 284426 59.19
Waioeka 72 Te Karaka Stream 263 0 71 835.89 33149 51566 84711 103128 71.44
Waioeka 74 Waioeka area 416 102 542 8356.48 60404 96177 141968 177740 88.74
Waioeka 76 Apanui 419 0 117 2433.49 52843 82200 135044 164401 81.94
Waioeka 89 Pakahi 669 8 3146 10203.74 84877 132203 215946 263272 72.74
Waioeka 95 Tutaetoko 34 0 505 5364.46 4290 6674 10964 13348 90.87
Waioeka 103 Te Waiti 38 2 360 9127.79 4869 7613 12225 14969 95.80
Waioeka 106 Mangaoira 0 0 2 1809.15 0 0 0 0 99.88
Waioeka 109 Tauranga 0 0 54 2343.97 32 59 32 59 97.74
Environmental Publication 2014/02 – A model for assessing unconsented or permitted water use in the Bay of Plenty region 57
CATCHMENTS Land coverage – Non-AgriBaseTM AgriBaseTM Non-AgriBaseTM beef and dairy (RMA)
Non-AgriBaseTM Beef and dairy (RMA+WLP)
(ha) (ha) (ha) (ha) (m3/d) (m3/d) (m3/d) (m3/d) (%)
GREATER ID CATCHMENT High
producing grassland
Low producing grassland
Land with no livestock
AgriBaseTM
dairy Beef/dairy ADD Beef/dairy PDD Beef/dairy ADD Beef/dairy PDD
AgriBaseTM land coverage
Waioeka 111 Waiata 0 8 1056 2889.76 652 1195 652 1195 73.08
Waioeka 112 Wairata 339 26 2217 13493.19 44776 70221 111238 136683 83.93
Waioeka 115 Omaukora 1 0 33 2272.03 123 192 316 384 98.54
Waioeka 118 Opato 71 0 1170 11385.28 8886 13822 22707 27644 90.18
Waioeka 124 Te Pato 0 0 502 3215.85 0 0 0 0 86.51
Waioeka 127 Tataweka 0 0 4806 10239.88 3 4 6 8 68.06
Waioeka 129 Koranga 7905 39 3208 2114.02 999014 1554863 2548328 3104177 15.94
Waitahanui 29 Otamarakau Coastal 16 0 1 71.41 1978 3077 5055 6154 81.42
Waitahanui 32 Waitahanui 287 0 3737 7513.90 36132 56205 92337 112410 65.12
Waitahanui 34 Hauone Coastal 103 4 16 2276.38 13227 20660 33324 40758 94.90
Waitahanui 37 Pikowai Coastal 84 3 872 2054.02 10852 16949 27353 33450 68.15
Waitahanui 38 Ruataniwha Coastal 0 1 2 310.57 103 180 154 231 99.08
Waitahanui 39 Mimiha Coastal 404 2 617 5781.81 51078 79491 130331 158744 84.97
Waitahanui 40 Ohinekoao Coastal 49 7 27 848.33 6788 10717 16460 20389 91.07
Waitahanui 55 Lake Rotoehu 193 0 1324 3396.04 24361 37895 62255 75789 69.12
Waitahanui 69 Lake Rotoma 24 0 1356 1376.49 3061 4761 7821 9522 49.94
Whakatane 44 Whakatane Area 885 1 1488 15685.32 111542 173527 284949 346934 86.86
Whakatane 56 Waioho 196 0 75 10091.26 24658 38357 63015 76714 97.39
Whakatane 82 Waimana 1035 6 2917 15137.07 130848 203675 333639 406467 79.27
Whakatane 91 Oromoeroa 1129 37 8149 6626.56 145151 226585 366492 447925 41.57
Whakatane 116 Kanihi 27 7 971 5809.37 3874 6170 9095 11391 85.26
Whakatane 119 Waiiti 36 0 5486 3696.42 4549 7076 11624 14151 40.10
Whakatane 121 Ohora 0 0 348 6299.74 0 0 0 0 94.76
Whakatane 122 Tauranga 85 12 12199 9336.85 11663 18411 28303 35051 43.16
Whakatane 123 Ohane 163 121 4168 2287.38 30022 49332 61990 81300 33.94
Whakatane 125 Upper Whakatane 268 48 18503 26000.31 37535 59423 90126 112014 58.01
Whakatane 128 Waikare 17 6 10277 4063.49 2566 4116 5859 7409 28.29
Totals 72388.93 4053.72 310191.27 894654.29 9437195 14767912 23625426 28956143 11361.70

Environmental Publication 2014/02 – A model for assessing unconsented or permitted water use in the Bay of Plenty region 59
Appendix 2.5 – Stock water use covered by consent (Master spreadsheet AC2:AL164)


Environmental Publication 2014/02 – A model for assessing unconsented or permitted water use in the Bay of Plenty region 61
CATCHMENTS Estimated stock numbers covered by consent Consented Stock Water Use (RMA) Consented Stock Water Use (RMA+WLP)
Apply beef Apply sheep (m3/d) (m3/d) (m3/d) (m3/d)
GREATER ID CATCHMENT BEEF DAIRY DEER SHEEP LARGE_STOCK SMALL_STOCK Consented_ ADD Consented_PDD Consented_ ADD Consented_PDD
Kaituna 17 Maketu Estuary Coastal 0 0 0 0 0
Kaituna 30 Mangorewa 5 60 0 10 1 6 2928 4602 7128 8802
Kaituna 54 Lake Rotoiti 0 0 0 0 0 0 0 0 0 0
Kaituna 59 Hauraki 0 0 0 0 0
Kaituna 60 Awahou 0 0 33 0 0 1 201 401 201 401
Kaituna 62 Waiteti 0 0 0 0 0
Kaituna 71 Waimehia area 0 0 0 0 0 1 3 5 3 5
Kaituna 73 Awahou Point area 0 0 0 0 0
Kaituna 78 Okawa Bay area 0 0 0 0 0
Kaituna 79 Pohue Bay area 0 0 0 0 0
Kaituna 80 Waiohewa 0 0 0 0 0
Kaituna 84 Waimata 0 0 0 0 0
Kaituna 87 Ngongotaha 46 0 24 1310 2 4 5526 8841 5526 8841
Kaituna 88 Waiowhiro area 0 0 0 0 0
Kaituna 90 Rotokawa area 0 0 0 0 0
Kaituna 94 Utuhina 0 0 0 0 0
Kaituna 102 Puarenga 317 1,271 0 1,200 0 4 70317 111823 159287 200793
Kaituna 158 Hamurana area 0 0 0 0 0
Kaituna 159 Hururu 0 0 0 0 0
Kaituna 160 Upper Kaituna 611 0 0 2293 0 5 25224 43946 25224 43946
Kaituna 161 Parawhenuamea 196 0 40 67 1693 11 57144 104726 57144 104726
Kaituna 162 Te Puke East 0 0 0 0 0 0 0 0 0 0
Kaituna 163 Waiari 11 41 0 0 0 2 2181 3484 5051 6354
Kaituna 164 Ohineangaanga 0 950 0 0 20 10 43380 67645 109880 134145
Kaituna 165 Raparapahoe 250 0 0 1,190 2 8 11154 19251 11154 19251
Kaituna 166 Rangiuru Soiuth 50 251 0 85 0 1 13053 20707 30623 38277
Kaituna 167 Kopuaroa 126 345 0 0 0 1 19308 31085 43458 55235
Kaituna 168 Papamoa 0 0 0 0 0
Kaituna 169 Lower Kaituna 351 1,764 177 72 15 66 91836 146355 215316 269835
Motu 4 Tahurua Coastal 0 0 0 0 0
Motu 5 Whangaparaoa 0 0 0 0 0
Motu 6 Waiokaha Coastal 0 0 0 0 0
Motu 12 Waikura 0 0 0 0 0
Motu 13 Raukokore area 0 0 0 0 0

Environmental Publication 2014/02 – A model for assessing unconsented or 62 permitted water use in the Bay of Plenty region
CATCHMENTS Estimated stock numbers covered by consent Consented Stock Water Use (RMA) Consented Stock Water Use (RMA+WLP)
Apply beef Apply sheep (m3/d) (m3/d) (m3/d) (m3/d)
GREATER ID CATCHMENT BEEF DAIRY DEER SHEEP LARGE_STOCK SMALL_STOCK Consented_ ADD Consented_PDD Consented_ ADD Consented_PDD
Motu 15 Waikawa Coastal 0 0 0 0 0
Motu 19 Kereu 0 0 0 0 0
Motu 21 Te Kaha Coastal 0 0 0 0 0
Motu 26 Mangahaupapa 0 0 0 0 0
Motu 31 Haparapara area 0 0 0 0 0
Motu 33 Waikakariki 0 0 0 0 0
Motu 35 Pokohinu Coastal 0 0 0 0 0
Motu 41 Motu area 0 0 0 0 0
Motu 43 Whituare Coastal 0 0 0 0 0
Motu 45 Mangatutara 0 0 0 0 0
Motu 46 Hawai 0 0 0 0 0
Motu 49 Pehitaiti Coastal 0 0 0 0 0
Motu 51 Torere 0 0 0 0 0
Motu 52 Omarumutu Coastal 24 0 0 0 4 2 846 1549 846 1549
Motu 53 Te Kahika 0 0 0 0 0
Motu 66 Tirohanga Coastal 50 0 213 20 3 7 2949 5593 2949 5593
Motu 70 Waiaua 0 0 0 0 0
Motu 81 Rawea 0 0 0 0 0
Motu 93 Mangaotane 0 0 0 0 0
Ohiwa 48 Maraetotara Coastal 0 0 0 0 0
Ohiwa 57 Wainui area 0 0 0 0 0
Ohiwa 63 Kutarere area 0 0 0 0 0
Ohiwa 64 Waiotahi 0 0 0 0 0
Ohiwa 65 Waiotahi Beach Coastal 0 0 0 0 0 0 0 0 0 0
Ohiwa 77 Nukuhou 19 0 0 0 0 4 582 1063 582 1063
Pongakawa 16 Newdicks Coastal 0 0 0 0 0
Pongakawa 20 Pukehina Beach Coastal 0 0 0 0 0
Pongakawa 22 Kaikokopu area 146 1216 0 18 0 7 59175 93263 144295 178383
Pongakawa 23 Pongakawa area 651 4,838 0 0 6 3528 248004 390671 586664 729331
Pongakawa 24 Pukehina Coastal 0 0 0 0 0 0 0 0 0 0
Pongakawa 25 Wharere 246 4,764 0 34 16 80 222582 348403 556062 681883
Pongakawa 27 Ohinepanea Coastal 158 1,431 0 0 4 25 69330 109193 169500 209363
Pongakawa 28 Pokopoko 793 3,737 714 308 15 239 198330 317060 459920 578650
Rangitaiki 36 Mangamako area 161 4,555 0 40 16 102 210711 329224 529561 648074
Environmental Publication 2014/02 – A model for assessing unconsented or permitted water use in the Bay of Plenty region 63
CATCHMENTS Estimated stock numbers covered by consent Consented Stock Water Use (RMA) Consented Stock Water Use (RMA+WLP)
Apply beef Apply sheep (m3/d) (m3/d) (m3/d) (m3/d)
GREATER ID CATCHMENT BEEF DAIRY DEER SHEEP LARGE_STOCK SMALL_STOCK Consented_ ADD Consented_PDD Consented_ ADD Consented_PDD
Rangitaiki 42 Lower Tarawera area 466 4,220 99 129 45 64097 398502 613710 693902 909110
Rangitaiki 47 Waikamihi 0 0 0 0 0
Rangitaiki 50 Otakiri 0 858 0 20 2 6 38748 60287 98808 120347
Rangitaiki 61 Mangawiki 14 1018 0 20 2 14 46392 72293 117652 143553
Rangitaiki 83 Waikanapiti 0 0 0 0 0
Rangitaiki 92 Lake Okataina 0 0 0 0 0
Rangitaiki 99 Mangate 0 0 0 0 0
Rangitaiki 100 Mangawhio 0 0 0 0 0
Rangitaiki 101 Lake Okareka 320 0 0 4500 5 8 23274 38161 23274 38161
Rangitaiki 104 Lake Tarawera 320 0 0 4500 5 8 23274 38161 23274 38161
Rangitaiki 105 Waiaute 0 0 0 0 0
Rangitaiki 107 Lake Tikitapu 0 0 0 0 0
Rangitaiki 108 Lake Rotokakahi 0 0 0 0 0
Rangitaiki 113 Lake Rotomahana 0 0 0 0 0
Rangitaiki 114 Pokairoa 0 370 0 0 0 2 16656 25909 42556 51809
Rangitaiki 117 Lake Rerewhakaaitu 19 0 0 1,750 0 1 5823 8925 5823 8925
Rangitaiki 120 Okaro 0 0 0 0 0
Rangitaiki 126 Horomanga 380 3,561 200 76 22 133 174132 274721 423402 523991
Rangitaiki 130 Whirinaki 0 282 45 1 3 21 13116 20544 32856 40284
Rangitaiki 131 Pouarua area 3700 2500 0 47500 10 50 366450 593025 541450 768025
Rangitaiki 132 Otamatea 3,700 2,500 0 47,500 10 50 366450 593025 541450 768025
Rangitaiki 154 Waikowhewhe area 4 549 0 0 15 4 25287 39493 63717 77923
Rangitaiki 155 Kaingaroa area 297 1635 17 8 7 20 82881 131500 197331 245950
Rangitaiki 156 Wheao 0 376 0 1 5 2 17079 26609 43399 52929
Rangitaiki 157 Mangatiti area 0 0 0 0 0
Tauranga Harbour 1 Tuapiro 30 0 0 77 0 24 1203 2105 1203 2105
Tauranga Harbour 2 Uretara 0 0 0 0 0 0 0 0 0 0
Tauranga Harbour 3 Te Mania 223 230 0 0 0 1 17043 28370 33143 44470
Tauranga Harbour 10 Oturu 0 0 0 0 0 0 0 0 0 0
Tauranga Harbour 11 Kopurererua 44 0 0 0 0 10 1350 2465 1350 2465
Tauranga Harbour 14 Waimapu 67 105 251 587 3 55 10257 17101 17607 24451
Tauranga Harbour 18 Wairoa 0 0 0 0 0
Tauranga Harbour 58 Wairoa 25 0 0 0 2 1 813 1490 813 1490
Tauranga Harbour 133 Waiau 0 0 0 0 0 0 0 0 0 0
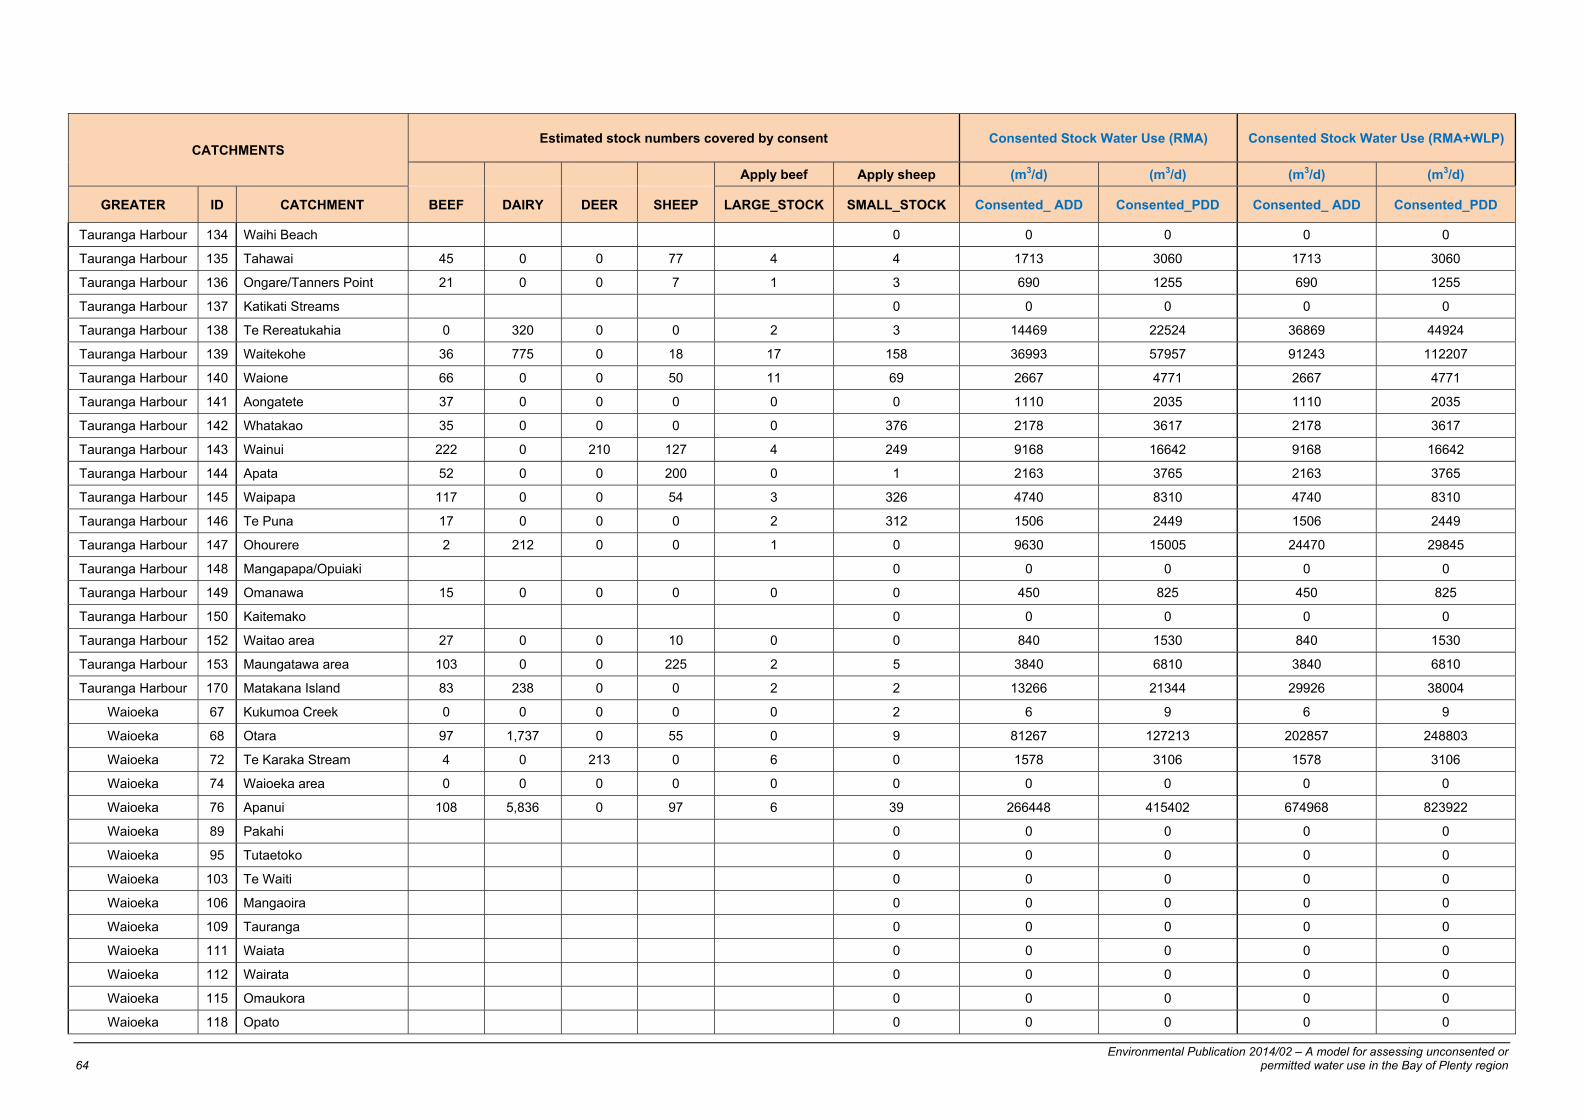
Environmental Publication 2014/02 – A model for assessing unconsented or 64 permitted water use in the Bay of Plenty region
CATCHMENTS Estimated stock numbers covered by consent Consented Stock Water Use (RMA) Consented Stock Water Use (RMA+WLP)
Apply beef Apply sheep (m3/d) (m3/d) (m3/d) (m3/d)
GREATER ID CATCHMENT BEEF DAIRY DEER SHEEP LARGE_STOCK SMALL_STOCK Consented_ ADD Consented_PDD Consented_ ADD Consented_PDD
Tauranga Harbour 134 Waihi Beach 0 0 0 0 0
Tauranga Harbour 135 Tahawai 45 0 0 77 4 4 1713 3060 1713 3060
Tauranga Harbour 136 Ongare/Tanners Point 21 0 0 7 1 3 690 1255 690 1255
Tauranga Harbour 137 Katikati Streams 0 0 0 0 0
Tauranga Harbour 138 Te Rereatukahia 0 320 0 0 2 3 14469 22524 36869 44924
Tauranga Harbour 139 Waitekohe 36 775 0 18 17 158 36993 57957 91243 112207
Tauranga Harbour 140 Waione 66 0 0 50 11 69 2667 4771 2667 4771
Tauranga Harbour 141 Aongatete 37 0 0 0 0 0 1110 2035 1110 2035
Tauranga Harbour 142 Whatakao 35 0 0 0 0 376 2178 3617 2178 3617
Tauranga Harbour 143 Wainui 222 0 210 127 4 249 9168 16642 9168 16642
Tauranga Harbour 144 Apata 52 0 0 200 0 1 2163 3765 2163 3765
Tauranga Harbour 145 Waipapa 117 0 0 54 3 326 4740 8310 4740 8310
Tauranga Harbour 146 Te Puna 17 0 0 0 2 312 1506 2449 1506 2449
Tauranga Harbour 147 Ohourere 2 212 0 0 1 0 9630 15005 24470 29845
Tauranga Harbour 148 Mangapapa/Opuiaki 0 0 0 0 0
Tauranga Harbour 149 Omanawa 15 0 0 0 0 0 450 825 450 825
Tauranga Harbour 150 Kaitemako 0 0 0 0 0
Tauranga Harbour 152 Waitao area 27 0 0 10 0 0 840 1530 840 1530
Tauranga Harbour 153 Maungatawa area 103 0 0 225 2 5 3840 6810 3840 6810
Tauranga Harbour 170 Matakana Island 83 238 0 0 2 2 13266 21344 29926 38004
Waioeka 67 Kukumoa Creek 0 0 0 0 0 2 6 9 6 9
Waioeka 68 Otara 97 1,737 0 55 0 9 81267 127213 202857 248803
Waioeka 72 Te Karaka Stream 4 0 213 0 6 0 1578 3106 1578 3106
Waioeka 74 Waioeka area 0 0 0 0 0 0 0 0 0 0
Waioeka 76 Apanui 108 5,836 0 97 6 39 266448 415402 674968 823922
Waioeka 89 Pakahi 0 0 0 0 0
Waioeka 95 Tutaetoko 0 0 0 0 0
Waioeka 103 Te Waiti 0 0 0 0 0
Waioeka 106 Mangaoira 0 0 0 0 0
Waioeka 109 Tauranga 0 0 0 0 0
Waioeka 111 Waiata 0 0 0 0 0
Waioeka 112 Wairata 0 0 0 0 0
Waioeka 115 Omaukora 0 0 0 0 0
Waioeka 118 Opato 0 0 0 0 0
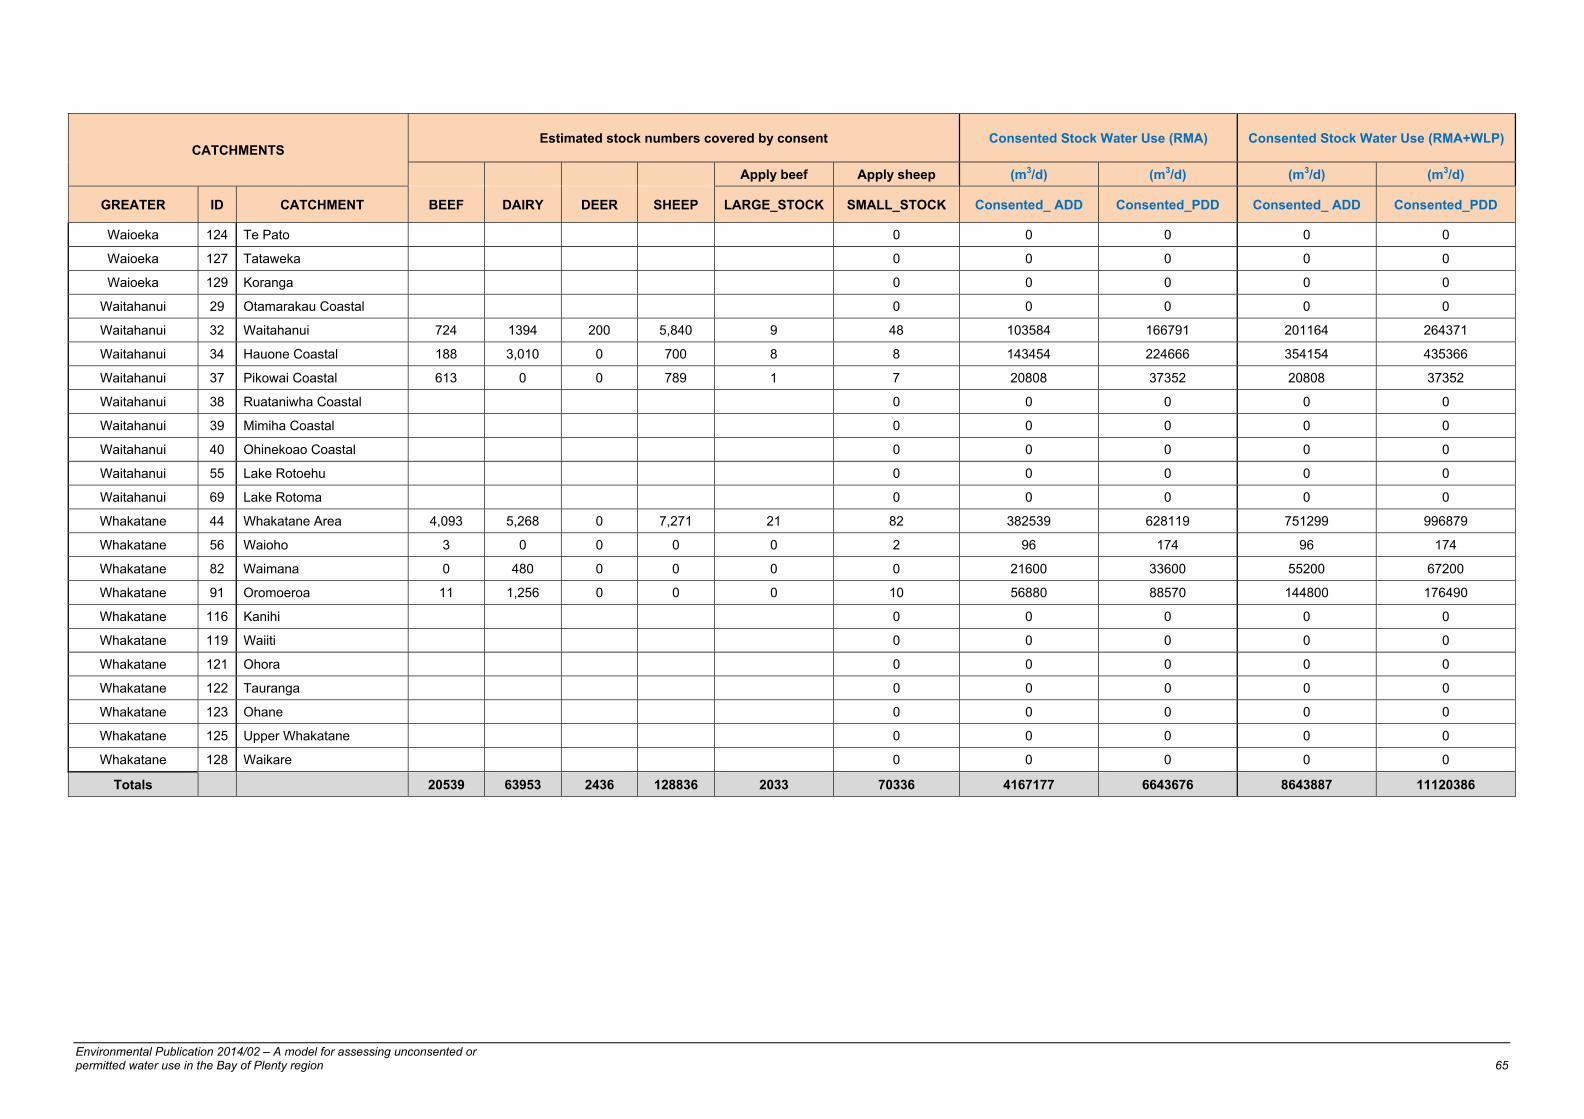
Environmental Publication 2014/02 – A model for assessing unconsented or permitted water use in the Bay of Plenty region 65
CATCHMENTS Estimated stock numbers covered by consent Consented Stock Water Use (RMA) Consented Stock Water Use (RMA+WLP)
Apply beef Apply sheep (m3/d) (m3/d) (m3/d) (m3/d)
GREATER ID CATCHMENT BEEF DAIRY DEER SHEEP LARGE_STOCK SMALL_STOCK Consented_ ADD Consented_PDD Consented_ ADD Consented_PDD
Waioeka 124 Te Pato 0 0 0 0 0
Waioeka 127 Tataweka 0 0 0 0 0
Waioeka 129 Koranga 0 0 0 0 0
Waitahanui 29 Otamarakau Coastal 0 0 0 0 0
Waitahanui 32 Waitahanui 724 1394 200 5,840 9 48 103584 166791 201164 264371
Waitahanui 34 Hauone Coastal 188 3,010 0 700 8 8 143454 224666 354154 435366
Waitahanui 37 Pikowai Coastal 613 0 0 789 1 7 20808 37352 20808 37352
Waitahanui 38 Ruataniwha Coastal 0 0 0 0 0
Waitahanui 39 Mimiha Coastal 0 0 0 0 0
Waitahanui 40 Ohinekoao Coastal 0 0 0 0 0
Waitahanui 55 Lake Rotoehu 0 0 0 0 0
Waitahanui 69 Lake Rotoma 0 0 0 0 0
Whakatane 44 Whakatane Area 4,093 5,268 0 7,271 21 82 382539 628119 751299 996879
Whakatane 56 Waioho 3 0 0 0 0 2 96 174 96 174
Whakatane 82 Waimana 0 480 0 0 0 0 21600 33600 55200 67200
Whakatane 91 Oromoeroa 11 1,256 0 0 0 10 56880 88570 144800 176490
Whakatane 116 Kanihi 0 0 0 0 0
Whakatane 119 Waiiti 0 0 0 0 0
Whakatane 121 Ohora 0 0 0 0 0
Whakatane 122 Tauranga 0 0 0 0 0
Whakatane 123 Ohane 0 0 0 0 0
Whakatane 125 Upper Whakatane 0 0 0 0 0
Whakatane 128 Waikare 0 0 0 0 0
Totals 20539 63953 2436 128836 2033 70336 4167177 6643676 8643887 11120386
Appendix 3: Dairy shed water use


Environmental Publication 2014/02 – A model for assessing unconsented or permitted water use in the Bay of Plenty region 69
Appendix 3.1 - Dairy shed water use (Aquas 2007)
Water use in the dairy shed
Source Water requirements
Aqualinc (2004a) 65 l/h/d – shed and yard requirements.
Aqualinc (2004b) Total use: 70 l/h/d.
Dexcel (2007a) Wash down water per cleaning event:
50 l/h/d (150 in herd); 48 l/h/d (250 in herd); 43 l/h/d (500 in herd).
Dexcel (2007b) 50 l/h/d but could range from 30 to 100 l/h/day (2 wash downs/day).
Dexcel (2007c) 70 l/cow/day.
NZSFA (2007) 70 l/h/d.
Lincoln Environmental (2003)
Estimates based on research/consultation:
Milk cooling: At upper ratio of cooling water to milk volume (3:1), peak cooling requirements approach 70 l/h/d. Average requirements are likely to be 40 to 50 l/p/d.
Plant washing: 3.5 to 5.5 l/h/d.
Yard wash down: 50 l/h/d adopted by ARC based on 1999 study of waste water on 20 farms in Franklin District. (Other research shows variability and range from 20 to 80 l/p/d.)
Fleming (2003) 70 l/h/d.


Appendix 4: Analysis


Environmental Publication 2014/02 – A model for assessing unconsented or permitted water use in the Bay of Plenty region 73
Appendix 4 - Model estimates of potential permitted water use

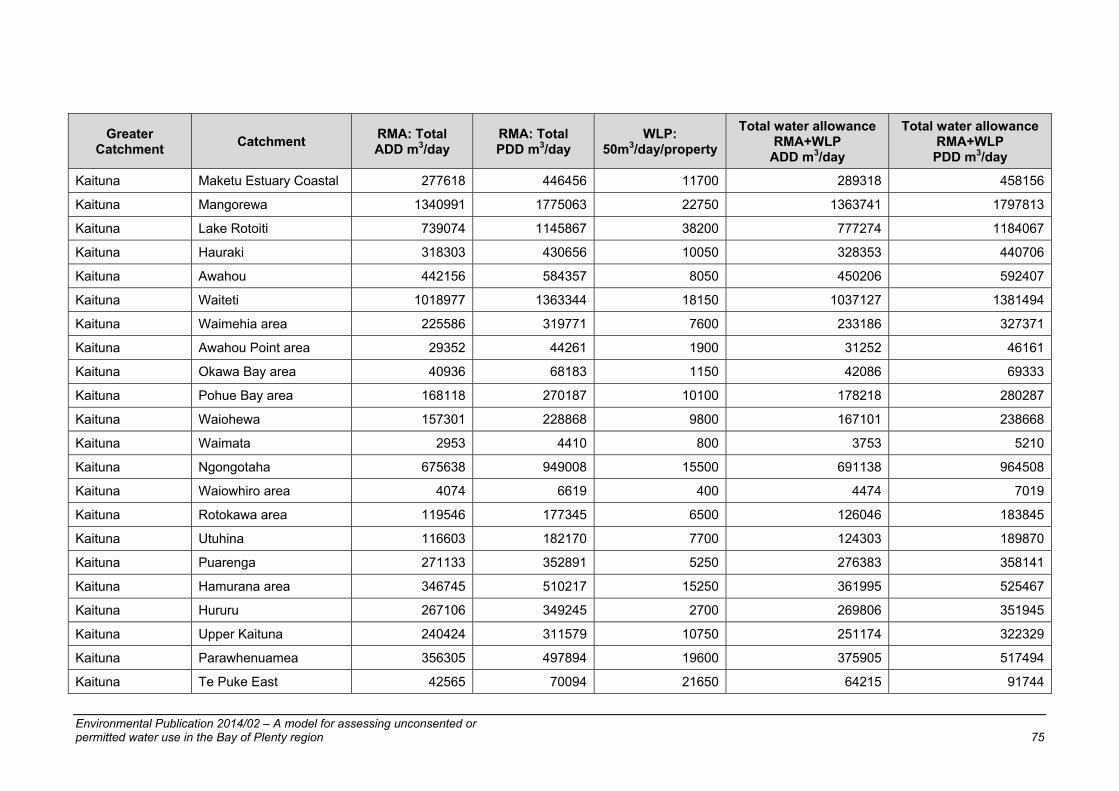
Environmental Publication 2014/02 – A model for assessing unconsented or permitted water use in the Bay of Plenty region 75
Greater Catchment
Catchment RMA: Total ADD m3/day
RMA: Total PDD m3/day
WLP: 50m3/day/property
Total water allowance RMA+WLP
ADD m3/day
Total water allowance RMA+WLP PDD m3/day
Kaituna Maketu Estuary Coastal 277618 446456 11700 289318 458156
Kaituna Mangorewa 1340991 1775063 22750 1363741 1797813
Kaituna Lake Rotoiti 739074 1145867 38200 777274 1184067
Kaituna Hauraki 318303 430656 10050 328353 440706
Kaituna Awahou 442156 584357 8050 450206 592407
Kaituna Waiteti 1018977 1363344 18150 1037127 1381494
Kaituna Waimehia area 225586 319771 7600 233186 327371
Kaituna Awahou Point area 29352 44261 1900 31252 46161
Kaituna Okawa Bay area 40936 68183 1150 42086 69333
Kaituna Pohue Bay area 168118 270187 10100 178218 280287
Kaituna Waiohewa 157301 228868 9800 167101 238668
Kaituna Waimata 2953 4410 800 3753 5210
Kaituna Ngongotaha 675638 949008 15500 691138 964508
Kaituna Waiowhiro area 4074 6619 400 4474 7019
Kaituna Rotokawa area 119546 177345 6500 126046 183845
Kaituna Utuhina 116603 182170 7700 124303 189870
Kaituna Puarenga 271133 352891 5250 276383 358141
Kaituna Hamurana area 346745 510217 15250 361995 525467
Kaituna Hururu 267106 349245 2700 269806 351945
Kaituna Upper Kaituna 240424 311579 10750 251174 322329
Kaituna Parawhenuamea 356305 497894 19600 375905 517494
Kaituna Te Puke East 42565 70094 21650 64215 91744
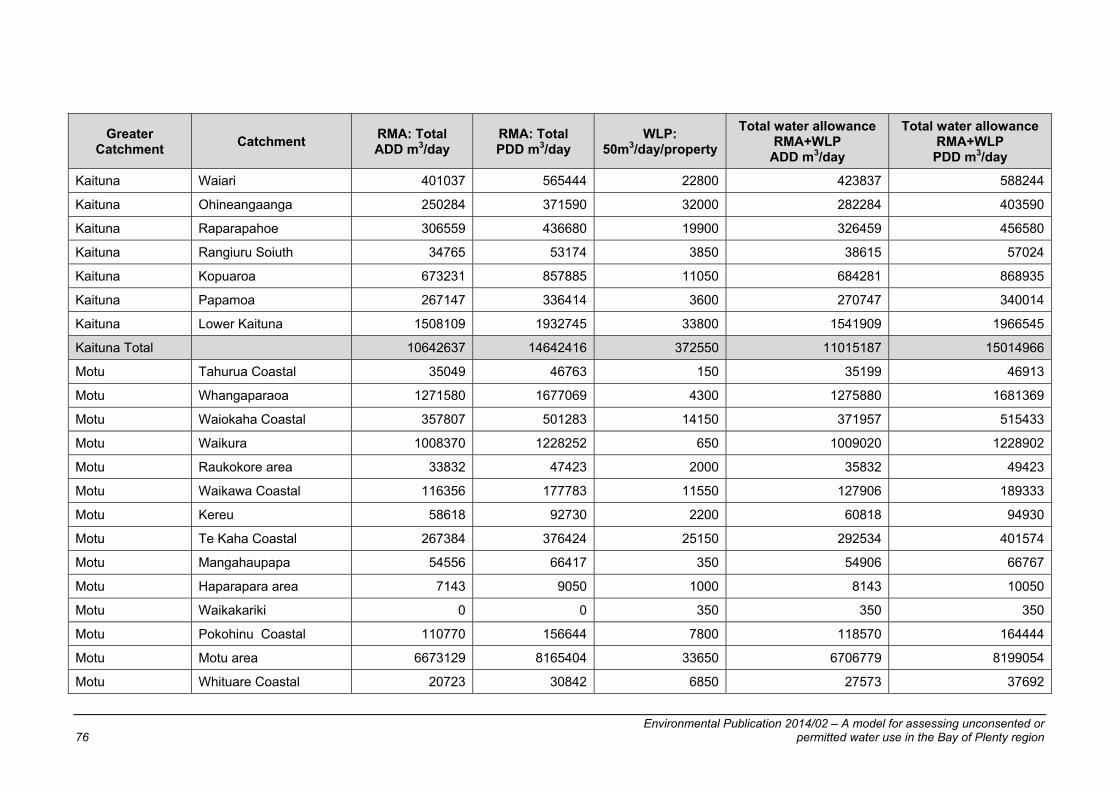
Environmental Publication 2014/02 – A model for assessing unconsented or 76 permitted water use in the Bay of Plenty region
Greater Catchment
Catchment RMA: Total ADD m3/day
RMA: Total PDD m3/day
WLP: 50m3/day/property
Total water allowance RMA+WLP
ADD m3/day
Total water allowance RMA+WLP PDD m3/day
Kaituna Waiari 401037 565444 22800 423837 588244
Kaituna Ohineangaanga 250284 371590 32000 282284 403590
Kaituna Raparapahoe 306559 436680 19900 326459 456580
Kaituna Rangiuru Soiuth 34765 53174 3850 38615 57024
Kaituna Kopuaroa 673231 857885 11050 684281 868935
Kaituna Papamoa 267147 336414 3600 270747 340014
Kaituna Lower Kaituna 1508109 1932745 33800 1541909 1966545
Kaituna Total 10642637 14642416 372550 11015187 15014966
Motu Tahurua Coastal 35049 46763 150 35199 46913
Motu Whangaparaoa 1271580 1677069 4300 1275880 1681369
Motu Waiokaha Coastal 357807 501283 14150 371957 515433
Motu Waikura 1008370 1228252 650 1009020 1228902
Motu Raukokore area 33832 47423 2000 35832 49423
Motu Waikawa Coastal 116356 177783 11550 127906 189333
Motu Kereu 58618 92730 2200 60818 94930
Motu Te Kaha Coastal 267384 376424 25150 292534 401574
Motu Mangahaupapa 54556 66417 350 54906 66767
Motu Haparapara area 7143 9050 1000 8143 10050
Motu Waikakariki 0 0 350 350 350
Motu Pokohinu Coastal 110770 156644 7800 118570 164444
Motu Motu area 6673129 8165404 33650 6706779 8199054
Motu Whituare Coastal 20723 30842 6850 27573 37692

Environmental Publication 2014/02 – A model for assessing unconsented or permitted water use in the Bay of Plenty region 77
Greater Catchment
Catchment RMA: Total ADD m3/day
RMA: Total PDD m3/day
WLP: 50m3/day/property
Total water allowance RMA+WLP
ADD m3/day
Total water allowance RMA+WLP PDD m3/day
Motu Mangatutara 0 0 0 0 0
Motu Hawai 29110 38269 950 30060 39219
Motu Pehitaiti Coastal 106701 140347 3600 110301 143947
Motu Torere 75964 102851 5050 81014 107901
Motu Omarumutu Coastal 526577 686396 19050 545627 705446
Motu Te Kahika 0 0 50 50 50
Motu Tirohanga Coastal 352587 467566 12250 364837 479816
Motu Waiaua 412497 526820 11850 424347 538670
Motu Rawea 145266 201014 4000 149266 205014
Motu Mangaotane 974913 1200529 1250 976163 1201779
Mōtū Total 12638931 15939877 168200 12807131 16108077
Ohiwa Maraetotara Coastal 0 0 100 100 100
Ohiwa Wainui area 421001 584477 11300 432301 595777
Ohiwa Kutarere area 301934 433923 21250 323184 455173
Ohiwa Waiotahi 993815 1279760 19050 1012865 1298810
Ohiwa Waiotahi Beach Coastal 264959 373827 14550 279509 388377
Nukuhou 1721258 2386688 22350 1743608 2409038
Ōhiwa Total 3702967 5058675 88600 3791567 5147275
Pongakawa Newdicks Coastal 71847 98552 3750 75597 102302
Pongakawa Pukehina Beach Coastal 118795 197428 1350 120145 198778
Pongakawa Kaikokopu area 1020572 1346976 16650 1037222 1363626
Pongakawa Pongakawa area 1239063 1587937 13600 1252663 1601537
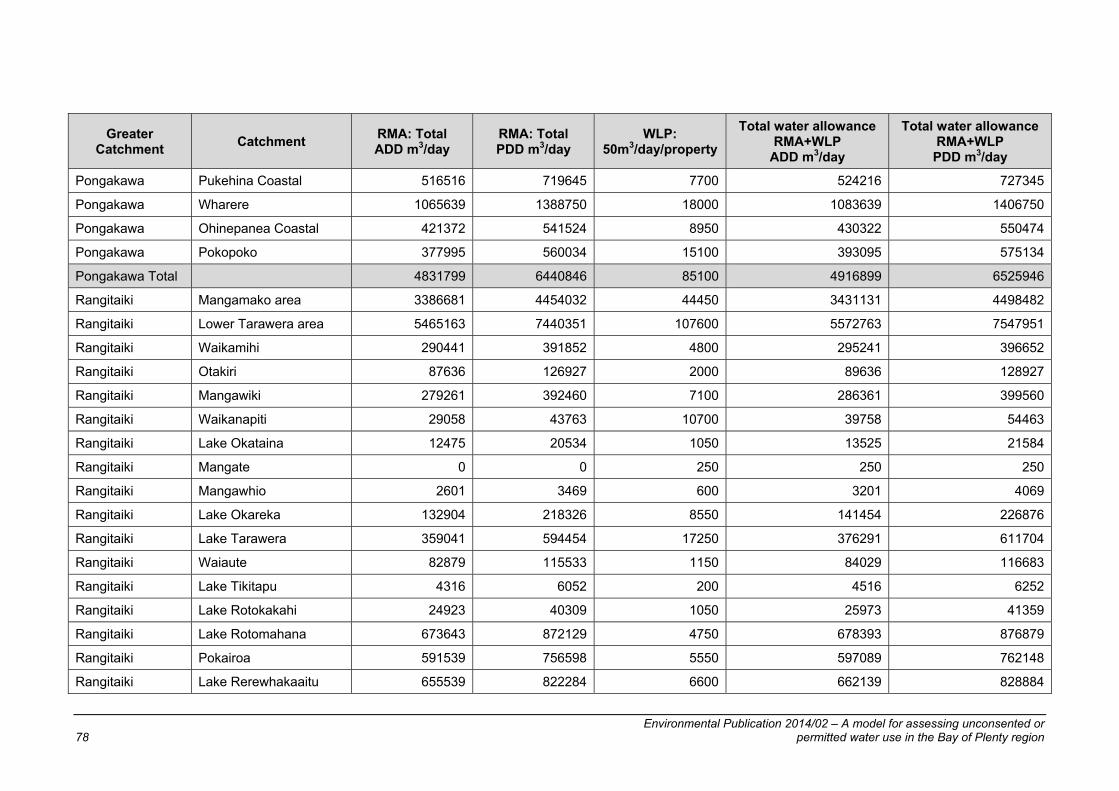
Environmental Publication 2014/02 – A model for assessing unconsented or 78 permitted water use in the Bay of Plenty region
Greater Catchment
Catchment RMA: Total ADD m3/day
RMA: Total PDD m3/day
WLP: 50m3/day/property
Total water allowance RMA+WLP
ADD m3/day
Total water allowance RMA+WLP PDD m3/day
Pongakawa Pukehina Coastal 516516 719645 7700 524216 727345
Pongakawa Wharere 1065639 1388750 18000 1083639 1406750
Pongakawa Ohinepanea Coastal 421372 541524 8950 430322 550474
Pongakawa Pokopoko 377995 560034 15100 393095 575134
Pongakawa Total 4831799 6440846 85100 4916899 6525946
Rangitaiki Mangamako area 3386681 4454032 44450 3431131 4498482
Rangitaiki Lower Tarawera area 5465163 7440351 107600 5572763 7547951
Rangitaiki Waikamihi 290441 391852 4800 295241 396652
Rangitaiki Otakiri 87636 126927 2000 89636 128927
Rangitaiki Mangawiki 279261 392460 7100 286361 399560
Rangitaiki Waikanapiti 29058 43763 10700 39758 54463
Rangitaiki Lake Okataina 12475 20534 1050 13525 21584
Rangitaiki Mangate 0 0 250 250 250
Rangitaiki Mangawhio 2601 3469 600 3201 4069
Rangitaiki Lake Okareka 132904 218326 8550 141454 226876
Rangitaiki Lake Tarawera 359041 594454 17250 376291 611704
Rangitaiki Waiaute 82879 115533 1150 84029 116683
Rangitaiki Lake Tikitapu 4316 6052 200 4516 6252
Rangitaiki Lake Rotokakahi 24923 40309 1050 25973 41359
Rangitaiki Lake Rotomahana 673643 872129 4750 678393 876879
Rangitaiki Pokairoa 591539 756598 5550 597089 762148
Rangitaiki Lake Rerewhakaaitu 655539 822284 6600 662139 828884

Environmental Publication 2014/02 – A model for assessing unconsented or permitted water use in the Bay of Plenty region 79
Greater Catchment
Catchment RMA: Total ADD m3/day
RMA: Total PDD m3/day
WLP: 50m3/day/property
Total water allowance RMA+WLP
ADD m3/day
Total water allowance RMA+WLP PDD m3/day
Rangitaiki Okaro 44142 59484 850 44992 60334
Rangitaiki Horomanga 1334503 1741780 9400 1343903 1751180
Rangitaiki Whirinaki 478302 698189 9750 488052 707939
Rangitaiki Pouarua area 42351 62608 2150 44501 64758
Rangitaiki Otamatea 391720 485998 1200 392920 487198
Rangitaiki Waikowhewhe area 313944 464262 8150 322094 472412
Rangitaiki Kaingaroa area 773617 1065176 8850 782467 1074026
Rangitaiki Wheao 136003 202426 11100 147103 213526
Rangitaiki Mangatiti area 217225 381294 550 217775 381844
Rangitāiki Total 15809907 21460292 275650 16085557 21735942
Tauranga Harbour Tuapiro 257458 366682 11300 268758 377982
Tauranga Harbour Uretara 346427 495473 15150 361577 510623
Tauranga Harbour Te Mania 347961 525491 18900 366861 544391
Tauranga Harbour Oturu 157043 250951 8800 165843 259751
Tauranga Harbour Kopurererua 722597 1078811 39950 762547 1118761
Tauranga Harbour Waimapu 1388851 2065477 47350 1436201 2112827
Tauranga Harbour Wairoa 490026 681973 12450 502476 694423
Tauranga Harbour Wairoa 903378 1368891 47900 951278 1416791
Tauranga Harbour Waiau 444206 669656 22750 466956 692406
Tauranga Harbour Waihi Beach 323347 529961 39650 362997 569611
Tauranga Harbour Tahawai 155716 224610 8950 164666 233560
Tauranga Harbour Ongare/Tanners Point 294067 440203 17450 311517 457653

Environmental Publication 2014/02 – A model for assessing unconsented or 80 permitted water use in the Bay of Plenty region
Greater Catchment
Catchment RMA: Total ADD m3/day
RMA: Total PDD m3/day
WLP: 50m3/day/property
Total water allowance RMA+WLP
ADD m3/day
Total water allowance RMA+WLP PDD m3/day
Tauranga Harbour Katikati Streams 65297 93878 3400 68697 97278
Tauranga Harbour Te Rereatukahia 124510 186418 9900 134410 196318
Tauranga Harbour Waitekohe 102265 165937 9450 111715 175387
Tauranga Harbour Waione 173615 242507 11100 184715 253607
Tauranga Harbour Aongatete 314537 436876 14950 329487 451826
Tauranga Harbour Whatakao 234049 334404 11050 245099 345454
Tauranga Harbour Wainui 263302 397001 19350 282652 416351
Tauranga Harbour Apata 228764 352434 16250 245014 368684
Tauranga Harbour Waipapa 571918 867625 30700 602618 898325
Tauranga Harbour Te Puna 436771 641585 19250 456021 660835
Tauranga Harbour Ohourere 238558 342511 8100 246658 350611
Tauranga Harbour Mangapapa/Opuiaki 78967 110012 7200 86167 117212
Tauranga Harbour Omanawa 463165 633065 18700 481865 651765
Tauranga Harbour Kaitemako 42394 61486 2550 44944 64036
Tauranga Harbour Waitao area 232987 370648 11400 244387 382048
Tauranga Harbour Maungatawa area 74179 111259 6600 80779 117859
Tauranga Harbour Matakana Island 391789 495747 9150 400939 504897
Tauranga Total 9868145 14541571 499700 10367845 15041271
Waioeka Kukumoa Creek 506580 661995 12100 518680 674095
Waioeka Otara 649750 825343 24650 674400 849993
Waioeka Te Karaka Stream 228997 290831 5600 234597 296431
Waioeka Waioeka area 381637 492945 17050 398687 509995

Environmental Publication 2014/02 – A model for assessing unconsented or permitted water use in the Bay of Plenty region 81
Greater Catchment
Catchment RMA: Total ADD m3/day
RMA: Total PDD m3/day
WLP: 50m3/day/property
Total water allowance RMA+WLP
ADD m3/day
Total water allowance RMA+WLP PDD m3/day
Waioeka Apanui 188288 253141 17000 205288 270141
Waioeka Pakahi 231948 291399 3700 235648 295099
Waioeka Tutaetoko 37131 48960 1450 38581 50410
Waioeka Te Waiti 13878 17825 700 14578 18525
Waioeka Mangaoira 0 0 50 50 50
Waioeka Tauranga 32 59 50 82 109
Waioeka Waiata 1285 2342 350 1635 2692
Waioeka Wairata 134599 177668 1600 136199 179268
Waioeka Omaukora 7333 12670 100 7433 12770
Waioeka Opato 28978 38658 750 29728 39408
Waioeka Te Pato 0 0 150 150 150
Waioeka Tataweka 6 8 50 56 58
Waioeka Koranga 2563148 3128877 1500 2564648 3130377
Waioeka Total 4973591 6242721 86850 5060441 6329571
Waitahanui Otamarakau Coastal 47149 60365 1600 48749 61965
Waitahanui Waitahanui 543728 714079 7900 551628 721979
Waitahanui Hauone Coastal 213403 316781 4700 218103 321481
Waitahanui Pikowai Coastal 190117 275616 3800 193917 279416
Waitahanui Ruataniwha Coastal 22295 35456 1000 23295 36456
Waitahanui Mimiha Coastal 465750 664516 9300 475050 673816
Waitahanui Ohinekoao Coastal 61760 97418 1950 63710 99368
Waitahanui Lake Rotoehu 238271 324834 5950 244221 330784

Environmental Publication 2014/02 – A model for assessing unconsented or 82 permitted water use in the Bay of Plenty region
Greater Catchment
Catchment RMA: Total ADD m3/day
RMA: Total PDD m3/day
WLP: 50m3/day/property
Total water allowance RMA+WLP
ADD m3/day
Total water allowance RMA+WLP PDD m3/day
Waitahanui Lake Rotoma 229016 377520 13150 242166 390670
Waitahanui Total 2011489 2866585 49350 2060839 2915935
Whakatane Whakatane Area 2496079 3411574 40000 2536079 3451574
Whakatane Waioho 966851 1318996 9250 976101 1328246
Whakatane Waimana 2133172 2901448 25200 2158372 2926648
Whakatane Oromoeroa 1289435 1820901 20150 1309585 1841051
Whakatane Kanihi 9095 11391 50 9145 11441
Whakatane Waiiti 13220 16889 350 13570 17239
Whakatane Ohora 0 0 50 50 50
Whakatane Tauranga 38869 53059 1150 40019 54209
Whakatane Ohane 61990 81300 50 62040 81350
Whakatane Upper Whakatane 363873 570340 8100 371973 578440
Whakatane Waikare 8079 11479 550 8629 12029
Whakatāne Total 7380662 10197376 104900 7485562 10302276
Total 71860129 97390358 1730900 73591029 99121258

Appendix 5:


Environmental Publication 2014/02 – A model for assessing unconsented or permitted water use in the Bay of Plenty region 85
Appendix 5 – Permitted water use application background to report
1.1 Permitted water use in New Zealand
Section 14(3)(b) of the Resource Management Act (RMA) permits water use for certain activities without the need to obtain a resource consent. This allows for water to be taken for reasonable domestic and stock water use provided that the use does not or is not likely to have an adverse effect on the environment.
1.2 Bay of Plenty region permitted water use
The Bay of Plenty Regional Water and Land Plan stipulates the following rules for permitted water takes:
• “Rule 38 Permitted – Take and Use of Groundwater” allows up to 35 m3/day/property.
• “Rule 41 Permitted – Take and Use of Surface Water” allows up to 15 m3/day/property.
The intent of both rules is to allow minor takes for any purpose that are unlikely to have adverse effects on the environment.
1.3 Quantify permitted take for model
Various parties throughout New Zealand have considered water use for their particular area of concern; dariy, horticulture, rural potable water supply, in an attempt to better quantify the volumes required for a particular use. A few of these estimations are include below, for further detailed information refer to Appendix ??? In Part 3 the figures decided upon for use in the model are discussed.
1.4 National recommendations for water use – non-urban domestic and stock water use
Domestic use
The Ministry of Health (MoH, 2006) recommends an average household requirement of 300 litres per person per day (l/p/d) for households sourcing their own water. The Department of Building and Housing recommends 250 l/p/d (DBH, 2007). The DBH study was based on an assessment of 12 residential homes on the Kapiti Coast (BRANZ, 2007) and suggested little variability for indoor use but up to a threefold increase for external use in summer compared to winter.
Stock use
Dairy Insight and Fonterra (2006) estimated dairy cow water use at 50 litres per cow per day (l/c/d) but this was dependent on the herd size and the type of dairy. The same document suggests a possible range of 30-100 l/c/d for dairy shed use.
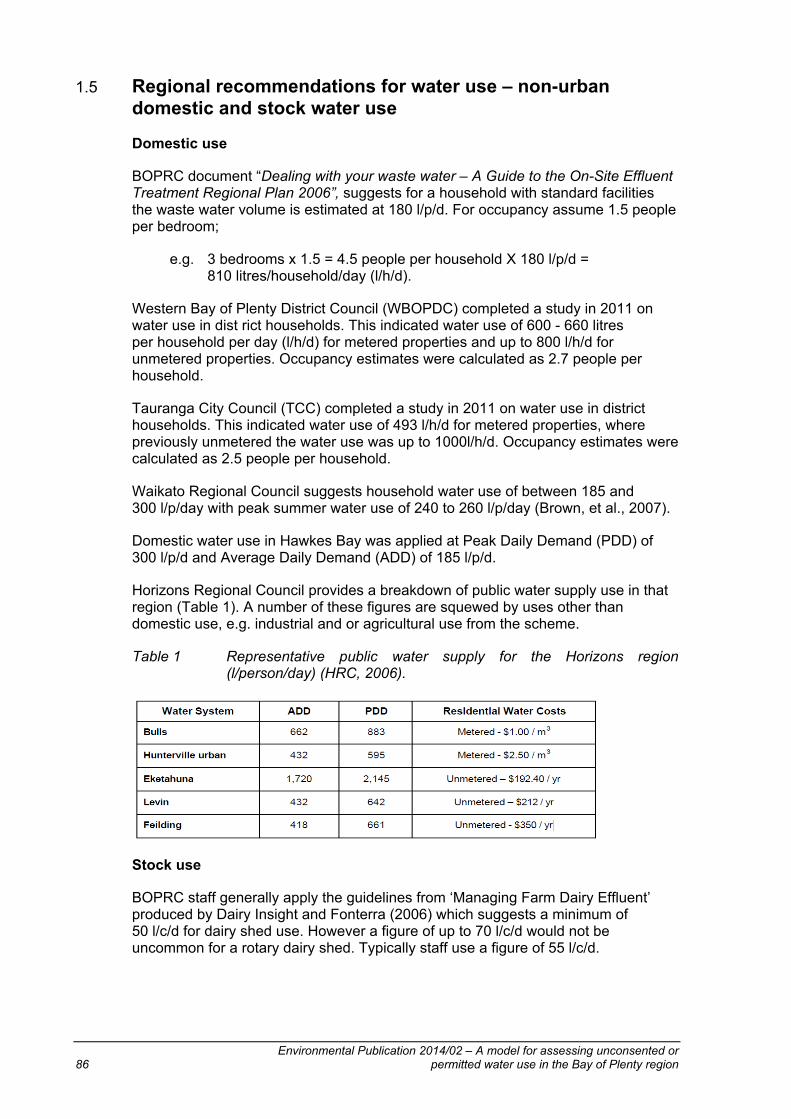
Environmental Publication 2014/02 – A model for assessing unconsented or 86 permitted water use in the Bay of Plenty region
1.5 Regional recommendations for water use – non-urban domestic and stock water use
Domestic use
BOPRC document “Dealing with your waste water – A Guide to the On-Site Effluent Treatment Regional Plan 2006”, suggests for a household with standard facilities the waste water volume is estimated at 180 l/p/d. For occupancy assume 1.5 people per bedroom;
e.g. 3 bedrooms x 1.5 = 4.5 people per household X 180 l/p/d = 810 litres/household/day (l/h/d).
Western Bay of Plenty District Council (WBOPDC) completed a study in 2011 on water use in dist rict households. This indicated water use of 600 - 660 litres per household per day (l/h/d) for metered properties and up to 800 l/h/d for unmetered properties. Occupancy estimates were calculated as 2.7 people per household.
Tauranga City Council (TCC) completed a study in 2011 on water use in district households. This indicated water use of 493 l/h/d for metered properties, where previously unmetered the water use was up to 1000l/h/d. Occupancy estimates were calculated as 2.5 people per household.
Waikato Regional Council suggests household water use of between 185 and 300 l/p/day with peak summer water use of 240 to 260 l/p/day (Brown, et al., 2007).
Domestic water use in Hawkes Bay was applied at Peak Daily Demand (PDD) of 300 l/p/d and Average Daily Demand (ADD) of 185 l/p/d.
Horizons Regional Council provides a breakdown of public water supply use in that region (Table 1). A number of these figures are squewed by uses other than domestic use, e.g. industrial and or agricultural use from the scheme.
Table 1 Representative public water supply for the Horizons region (l/person/day) (HRC, 2006).
Stock use
BOPRC staff generally apply the guidelines from ‘Managing Farm Dairy Effluent’ produced by Dairy Insight and Fonterra (2006) which suggests a minimum of 50 l/c/d for dairy shed use. However a figure of up to 70 l/c/d would not be uncommon for a rotary dairy shed. Typically staff use a figure of 55 l/c/d.

Environmental Publication 2014/02 – A model for assessing unconsented or permitted water use in the Bay of Plenty region 87
Waikato Regional Council use figures from Fleming (2003) as a reasonable estimate of stock water use. Stock use (in litres per head per day) was estimated as follows; 140 l/h/d for dairy cow shed and drinking, 45 l/h/d for beef cattle, 7l/h/d for deer and 3 l/h/d for sheep. Dairy use was identified as the most consumptive and greatest user and a likely maximum use of 70 l/c/d for drinking and 70 l/c/d for dairy shed use was adopted (Fleming, 2003). Both of these figures were considered by Waikato Regional Council (Brown et.al., 2007) to be an upper conservative estimate.
Horizons Regional Council adopted an approach recommended by Aquas Consultants (2007), which suggested a PDD of 70 l/c/d and ADD of 45 l/c/d for dairy cow drinking. Dairy shed use was applied at 70 l/c/d. PDD for sheep and beef was applied at 4.5 l/sheep/d and 55 l/animal/d respectively. Appendix 4 details the drinking water requirements for a range of stock uses (from Aquas 2007).
Hawkes Bay Regional Council has adopted the PDD and ADD approach outlined in Appendix 4 and proposed by Horizons Regional Council in 2007. Dairy shed use was based on an ADD of 50 l/c/d and a PDD of 70 l/c/d (Hawkes Bay Regional Council, 2011). For shed use 70 l/c/d was suggested as sufficient for up to 285 cows in order to meet permitted take requirements.