assessing storage value in electricity markets · european commission joint research centre...
TRANSCRIPT
Report EUR 26056 EN
2 0 1 3
Andreas ZUCKER – JRC IET
Timothée HINCHLIFFE – EDF R&D
Amanda SPISTO – JRC IET
A literature review
Assessing Storage Value in
Electricity Markets
Real options valuation
Financial mathematical models
Fundamental models
Deterministic modelling
Dynamic programming
Stochastic modelling
Simulation tool
Scenario toolEquilibrium toolTop-down tool
Bottom-up tool
Operation optimisation tools
Investment optimisation tools
Scenario trees
Price decomposition
Equilibrium model
Optimization model
Simulation model
Engineer models
System models
Linear problem
Non linear problem
Possible solving technique :
Dynamic Stochastic
Programming
Solving technique:
Linear pro
gramming (mixed
integer, quadratic
, etc.)
Thermal u
nits
- List of u
nits
- Efficiency, ra
nges, etc.
Non dispatchable
Productio
n
- Production profile
s for
wind, PV, ru
n of river, e
tc.
Load
- Profiles per s
cenario
Cost of c
ommodities
- Coal, gas, o
il, etc.
CO2 cost
Hydro pro
duction
- Inflows per s
cenario
System cost
-Including fix
ed and
variable costs
Hourly dispatch
Imports
& exports
Loss of loadUnits
revenues
+ Variable & fix operatin
g costs
+ Failure cost
- Subsidies, etc.
T = time horiz
on = ~1 year
t = time slice = ~ 10-100 p.y.
Many scenarios (e
.g.
based on historical years)
Failure cost
Etc.
T = time horiz
on = ~1 year
t = time slice = ~ 8760 p.y.
CO2 emissions
RES curtailm
ent
Etc.

European Commission
Joint Research Centre
Institute for Energy and Transport
Contact information
Andreas ZUCKER
Address: Joint Research Centre, P.O. Box 2, 1755 ZG Petten, The Netherlands
E-mail: [email protected]
Tel.: +31 224 56 5059
Fax: +31 224 56 5143
http://iet.jrc.ec.europa.eu/
http://www.jrc.ec.europa.eu/
This publication is a Reference Report by the Joint Research Centre of the European Commission.
Legal Notice
Neither the European Commission nor any person acting on behalf of the Commission
is responsible for the use which might be made of this publication.
Europe Direct is a service to help you find answers to your questions about the European Union
Freephone number (*): 00 800 6 7 8 9 10 11
(*) Certain mobile telephone operators do not allow access to 00 800 numbers or these calls may be billed.
A great deal of additional information on the European Union is available on the Internet.
It can be accessed through the Europa server http://europa.eu/.
JRC83688
EUR 26056 EN
ISBN 978-92-79-32362-1 (pdf)
ISBN 978-92-79-32363-8 (print)
ISSN 1831-9424 (online)
ISSN 1018-5593 (print)
doi: 10.2790/89242
Luxembourg: Publications Office of the European Union, 2013
© European Union, 2013
Reproduction is authorised provided the source is acknowledged.
Printed in The Netherlands
Table of content
1 INTRODUCTION .......................................................................................................................................................... 1
2 METHODOLOGY OF ELECTRICITY STORAGE ASSESSMENT ........................................................................ 3
2.1 MOTIVATION FOR STUDYING METHODOLOGY ............................................................................................................................. 3
2.2 OVERVIEW ON POWER SYSTEM MODELLING APPROACHES ....................................................................................................... 3
2.2.1 Preliminary definitions .................................................................................................................................................... 4
2.2.2 Model families ..................................................................................................................................................................... 6
2.2.3 Formulating of the problem .......................................................................................................................................... 6
2.2.4 Solving techniques ............................................................................................................................................................. 9
2.3 ENGINEERING MODELS ................................................................................................................................................................. 10
2.3.1 The price taker approach with perfect forecast ................................................................................................. 10
2.3.2 The price taker approach without perfect forecast (stochastic & dynamic modelling) ..................... 12
2.3.3 Modelling of hybrid storage systems ....................................................................................................................... 15
2.3.4 Services mutualisation .................................................................................................................................................. 15
2.4 SYSTEM MODELS ............................................................................................................................................................................ 16
2.4.1 Modelling storage in whole energy systems ......................................................................................................... 17
2.4.2 Market models ................................................................................................................................................................. 18
2.4.3 Network models............................................................................................................................................................... 24
2.4.4 Methods for island systems ......................................................................................................................................... 26
3 PROFITABILITY OF ELECTRICITY STORAGE .................................................................................................. 27
3.1 MOTIVATION FOR STUDYING STORAGE PROFITABILITY .......................................................................................................... 27
3.2 ENGINEERING STUDIES ................................................................................................................................................................. 29
3.2.1 Storage business model ................................................................................................................................................ 29
3.2.2 Technology scope ............................................................................................................................................................ 31
3.2.3 Pumped Hydro Storage ................................................................................................................................................ 31
3.2.4 Compressed Air Energy Storage ............................................................................................................................... 34
3.2.5 Batteries and flywheels ................................................................................................................................................ 37
3.2.6 Cross value chain engineering studies .................................................................................................................... 38
3.3 SYSTEM STUDIES ........................................................................................................................................................................... 41
3.3.1 Approaches and system boundaries ........................................................................................................................ 41
3.3.2 Quantification of benefits ............................................................................................................................................ 43
3.3.3 Further studies ................................................................................................................................................................. 46
4 IMPACT OF REGULATION ON ELECTRICITY STORAGE ............................................................................... 48
4.1 MOTIVATION FOR STUDYING THE REGULATION OF ELECTRICITY STORAGE ........................................................................ 48
4.2 NON MARKET RELATED REGULATION ........................................................................................................................................ 49
4.2.1 Grid fees .............................................................................................................................................................................. 49
4.2.2 Environmental regulation and public acceptance ............................................................................................ 49
4.3 POWER MARKET DESIGN .............................................................................................................................................................. 50
4.3.1 RES integration ............................................................................................................................................................... 50
4.3.2 Reserve market design .................................................................................................................................................. 50
4.4 OWNERSHIP AND RIGHT OF DISPATCH....................................................................................................................................... 52
4.4.1 Effects of storage ownership on social welfare ................................................................................................... 52
4.4.2 Non market driven storage dispatch and grid bottlenecks ............................................................................ 53
4.5 DIRECT FINANCIAL SUPPORT ....................................................................................................................................................... 54
4.5.1 Feed-in premiums or tariffs ........................................................................................................................................ 54
4.5.2 Capacity markets ............................................................................................................................................................ 54
5 CONCLUSION .............................................................................................................................................................. 56
5.1 METHODOLOGY AND MODELS ..................................................................................................................................................... 56
5.1.1 State of the art ................................................................................................................................................................. 56
5.1.2 Recommendations .......................................................................................................................................................... 57
5.2 STORAGE PROFITABILITY ............................................................................................................................................................ 58
5.2.1 State of the art ................................................................................................................................................................. 58
5.2.2 Recommendations .......................................................................................................................................................... 59
5.3 STORAGE REGULATION ................................................................................................................................................................ 60
5.3.1 State of the art ................................................................................................................................................................. 60
5.3.2 Recommendations .......................................................................................................................................................... 61
6 BIBLIOGRAPHY ......................................................................................................................................................... 62
Abbreviations
a Year (annum)
A-CAES Adiabatic Compressed Air Energy Storage
AUS Australia
BE Belgium
CAES Compressed Air Energy Storage
CAISO California Independent System Operator
CAPEX Capital expenditure
DE Germany
dena German Energy Agency (Deutsche Energie-Agentur)
DK Denmark
DP Dynamic Programming
DSO Distribution System Operator
EASE European Association for Storage of Energy
ENTSOE European Network of Transmission System Operators for Electricity
EPRI Electric Power Research Institute
ERCOT Electric Reliability Council of Texas
ES Spain
EURELECTRIC The Union of the Electricity Industry-Eurelectric
FR France
IE Ireland (Republic of)
ISO Independent System Operator (North America)
IT Italy
LP Linear Program
NYISO New York Independent System Operator
OPF Optimal Power Flow
PHS Pumped Hydro Storage
PJM PJM Interconnection LLC, originally Pennsylvania-New Jersey Interconnection
RES Renewable Energy Sources
RES-E Electricity from Renewable Energy Sources
RTO Regional Transmission Organization (North America)
SDP Stochastic Dynamic Programming
SP Stochastic Programming
T&D Transmission and Distribution
TR Turkey
TSO Transmission System Operator
UK United Kingdom
US United States

VDE Association for Electrical, Electronic and Information Technologies (Germany, Verband der Elektrotechnik, Elektronik und Informationstechnik)
WACC Weighted average cost of capital
WECC Western Electricity Coordinating Council (North America)
Table of figures Figure 1: A semantic jungle of power system modelling terminology................................................................................. 4
Figure 2: An overview of terms used to describe models and solving techniques – own depiction ......................... 5
Figure 3: From deterministic to stochastic models – based on Möst and Keles [8] ........................................................ 7
Figure 4: An example of mathematical techniques associated with one type of model (optimisation system models) – based on Foley et al. [10] ............................................................................................................................................... 10
Figure 5 : Schematic structure of an energy model ................................................................................................................. 17
Figure 6 : Illustration of the time resolution of a Times model – figures extracted from [58] ............................... 18
Figure 7 : Schematic structure of a power system model (example) ................................................................................ 19
Figure 8 : Schematic structure of a possible simplified system model ............................................................................. 23
Figure 9 : Schematic structure of a network model................................................................................................................. 25
Figure 10: Main business models for bulk electricity storage in a deregulated power system .............................. 29
Figure 11: Reserve market products (Europe) and typical storage technologies ....................................................... 30
Figure 12: PHS Engineering studies results ................................................................................................................................ 33
Figure 13: CAES Engineering studies results .............................................................................................................................. 35
Figure 14: Development of arbitrage net revenues for CAES and ACAES and gas prices between 2002 and 2009, elaboration on Drury et al. 2011 [19] ............................................................................................................................... 36
Figure 15: EPRI nomenclature for assessing storage value pools...................................................................................... 38
Figure 16: Cross value chain storage value pools, elaboration on EPRI 2010 [38], SANDIA 2010 [45] ............. 39
Figure 17: Value of storage identified by different system studies .................................................................................... 44
Executive Summary The economics of electricity storage are currently in the focus of research, by academics, utilities, potential investors as well as policy makers. The present document is the result of the analysis of more than 200 publications on that subject. It aims at presenting the “state of the art” regarding research on the economics of electricity storage. Three particular aspects are given attention to: the methodologies used, the profitability results obtained and the impact of regulation on storage economics.
Assessing the economics of storage generally implies developing and using models. Many researches use “engineering models”, assessing storage through market data, without assessing its impact on the system. These approaches require less data and less complex modelling than “system approaches” that are used to assess real investment projects, or study long term system evolutions. Both approaches are complementary, as one answers the question from an investor’s point of view, in a given regulatory context, and the other answers the question of the interest of storage to increase social welfare.
There is no universal answer on whether storage is a profitable investment or adds value to a system. Recent engineering studies seem pessimistic regarding the possibility to earn sufficient revenues in power and reserve markets in order to pay back the significant investments. A number of value pools have been identified in addition to arbitrage and reserve market case.
A comprehensive and consistent assessment of cross value chain value of storage has not yet been performed for many market situations; however publications on specific combinations can be found.
System studies provide an even larger bandwidth of results than engineering studies. While storage value has been identified in many cases, a negative impact is also possible if the deployment of storage requires additional investment in grid or generation assets.
All attempts at storage valuation require making assumptions on storage regulation. This may range from fees and technical rules, ownership questions or fundamental market regulation. Small technical issues can have a large impact on the viability of storage. As all current valuation frameworks for large scale storage originate in the deregulation of the power system, any change will have an impact on storage. Storage will thus be affected by the upcoming regulatory discussions emerging from the developments in the power system, such as market design and rules for RES integration or considerations on ownership and operation of storage devices.
This literature review also includes recommendations for further research. These should be regarded as a base for discussion.
1
1 Introduction This document summarises the results of a joint EDF R&D / JRC-IET research effort about energy storage. It provides a summary review of current literature on energy storage with particular attention to its technical and economic evaluation.
The motivation for the literature review originally resulted from the interest of both organisations in identifying relevant subjects to study in a joint project. As such, it is intended at providing information for decision makers and scientific advisers of both organisations as guidance for further research. It is also meant as a document summarising current issues in the field of electricity storage in Europe. The goal of this joint study is to identify the most relevant issues electricity storage is facing in the current European environment, in particular to:
Understand the current market environment for electricity storage including drivers and barriers to its deployment as well as the impact of technology developments
Identify the methodologies used for assessing storage value as defined by the fundamental assumptions, the problem definition and the solving strategies
Define the range of possible regulatory environments which could address the current challenges for electricity storage
Meeting these goals requires a critical review of previous studies that address the storage business case from different perspectives and that make use of different economic approaches. The key trends identified or possible controversies provide important input for future work. The authors thus aim at identifying literature providing evidence both supporting and contradicting hypotheses on the value of electricity storage.
In total, more than 200 publications were reviewed. These include work published by academic researchers, consultants as well as stakeholder financed studies carried out by either of the two previous groups. In some occasions, publications were the result of collaborations of several groups1. Also, we confront the study results with current stakeholder organisation's position papers.
The scope of the analysis is the European Union (EU). Studies from the US are also selectively included if deemed relevant to the European context. In particular, the wider regulatory variety of the US electricity markets makes these worth studying. Moreover, the analysis is focused on studies published during the last 10 years with a focus on more recent publications, taking into account the deregulation of power markets and the integration of significant quantities of renewable energy. The latest publications included in this review date from May 2013. The appendix provides a more detailed overview of the literature studied.
No restrictions were applied regarding the electricity value chain steps considered however studies on the application of generation and trading make up for a large share of the material reviewed. Transport and distribution issues are nevertheless addressed
1 E.g. the dena II grid study [49] was the result of collaboration between academics, consultants, TSOs published by a public private partnership.

2
by a number of recent publications. We addressed all technologies of electricity storage allowing a back to back conversion (thermal storage is therefore not considered here).
This report is structured in three parts defined by the aspects discussed with some publications analysed in more than one chapter:
A review on the methodologies used in the studies
The profitability of storage from different perspectives as seen by different studies
The impact of regulation on the storage business case
While the second chapter will likely be the starting point for the impatient reader interested in comparing numerical results, the other chapters are regarded as equally important by the authors in order to understand the framework within which storage operation, and consequently valuation, is possible.

3
2 Methodology of Electricity Storage Assessment
2.1 Motivation for studying methodology
A number of different mathematical models are applied when studying the interactions of the different parts of the electricity value chain and in particular power generation and trading. The analysis of the methods used in literature to investigate the role of storage is a way to have a clear view of what is available today, what has been used before, and what are the perspectives and coming trends. Our literature review of the methodologies used was mainly guided by the following three questions:
Are there generally accepted methodologies to assess the economics of electricity storage such as for example the methodologies used to study interconnections2?
What are the underlying hypotheses of the most frequently used mathematical models and how do they limit the results’ validity (as for example: perfect price forecast, marginal analysis implying that the storage device has no impact on the prices, etc.)?
Are there gaps in the subjects studied inherent to the complexity and inadequacy of models? Does the fact that some subjects are less often studied than others be related to the fact that the subject is new, or/and technically difficult to model (e.g. storage services mutualisation)?
Moreover, understanding the methodologies proposed in literature is also a good way to better understand our own models, as it allows us to evaluate both their adequacy to our needs (what can we do/not do with these models, are there good methods widely used that we could adopt?) and their results (can we benchmark them with others, and what are the differences?).
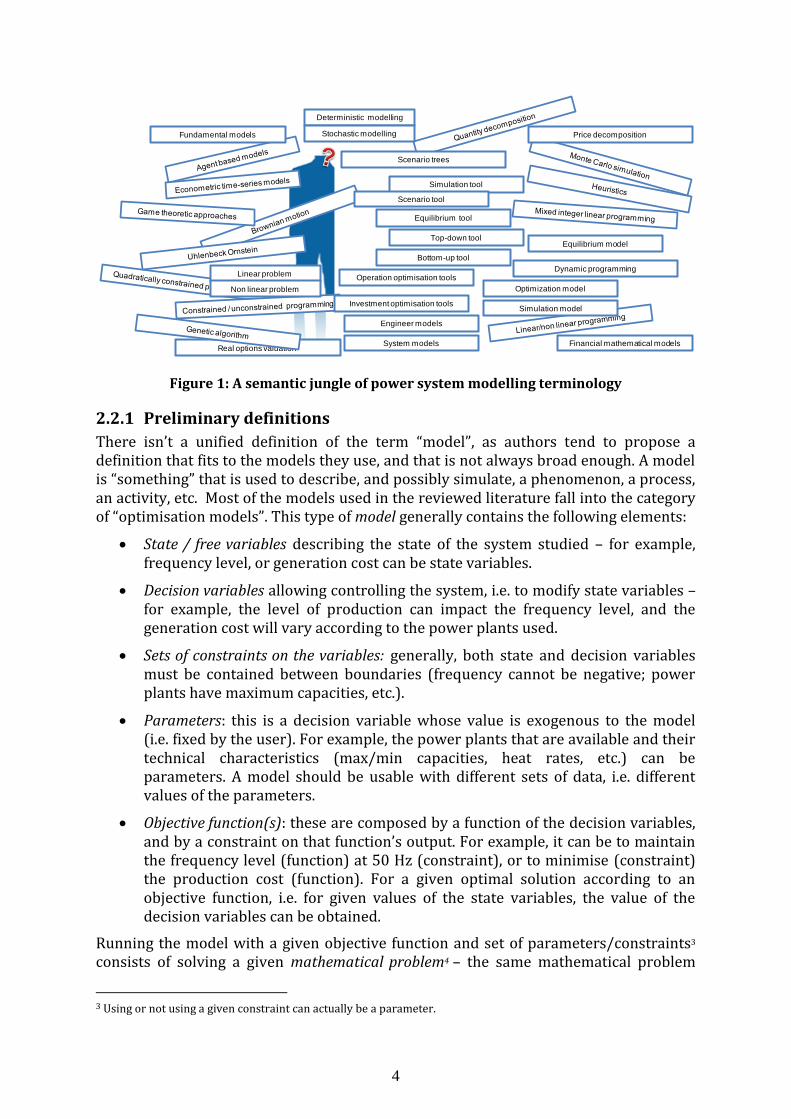
2.2 Overview on power system modelling approaches As stated above, analysing the methodologies used to assess the interest of storage is useful, particularly for stakeholders or investors who wish to have a better understanding of what models can and cannot tell them. However, in addition to the fact that power system modelling is a vast world, the language used to describe models and mathematical techniques often represent an important barrier for people not familiar with modelling. And as the terms are often used in many different ways by authors, not getting lost in such a semantic jungle is quite challenging.
Therefore, the objective of the following paragraphs is to provide a brief introduction to power system modelling, and to present some useful definitions and examples, in order to help the reader classifying and understanding models.
This is an ambitious task: power system modelling is a very vast world and it is not always possible to propose a common analysis framework for models dealing with very different subjects (from modelling voltage variations in grids to modelling the interactions between players in electricity markets for example). As a result, this report is only a first step in that direction and aims at creating a basis for discussion.
2 See e.g. ENTSO-E’s paper on cost benefits analysis [55]: there is a clear vision of the use of market model and network models to decide which interconnections need to be prioritized
4
Figure 1: A semantic jungle of power system modelling terminology
2.2.1 Preliminary definitions
There isn’t a unified definition of the term “model”, as authors tend to propose a definition that fits to the models they use, and that is not always broad enough. A model is “something” that is used to describe, and possibly simulate, a phenomenon, a process, an activity, etc. Most of the models used in the reviewed literature fall into the category of “optimisation models”. This type of model generally contains the following elements:
State / free variables describing the state of the system studied – for example, frequency level, or generation cost can be state variables.
Decision variables allowing controlling the system, i.e. to modify state variables – for example, the level of production can impact the frequency level, and the generation cost will vary according to the power plants used.
Sets of constraints on the variables: generally, both state and decision variables must be contained between boundaries (frequency cannot be negative; power plants have maximum capacities, etc.).
Parameters: this is a decision variable whose value is exogenous to the model (i.e. fixed by the user). For example, the power plants that are available and their technical characteristics (max/min capacities, heat rates, etc.) can be parameters. A model should be usable with different sets of data, i.e. different values of the parameters.
Objective function(s): these are composed by a function of the decision variables, and by a constraint on that function’s output. For example, it can be to maintain the frequency level (function) at 50 Hz (constraint), or to minimise (constraint) the production cost (function). For a given optimal solution according to an objective function, i.e. for given values of the state variables, the value of the decision variables can be obtained.
Running the model with a given objective function and set of parameters/constraints3 consists of solving a given mathematical problem4 – the same mathematical problem
3 Using or not using a given constraint can actually be a parameter.
Real options valuationFinancial mathematical models
Fundamental models
Deterministic modelling
Dynamic programming
Stochastic modelling
Simulation tool
Scenario tool
Equilibrium tool
Top-down tool
Bottom-up tool
Operation optimisation tools
Investment optimisation tools
Scenario trees
Price decomposition
Equilibrium model
Optimization model
Simulation model
Engineer models
System models
Linear problem
Non linear problem
5
could be solved by using different methods, whose complexity differ according to their capacity to deal with more or less complex objectives functions & constraints (linear/non-linear, deterministic/stochastic, etc.).
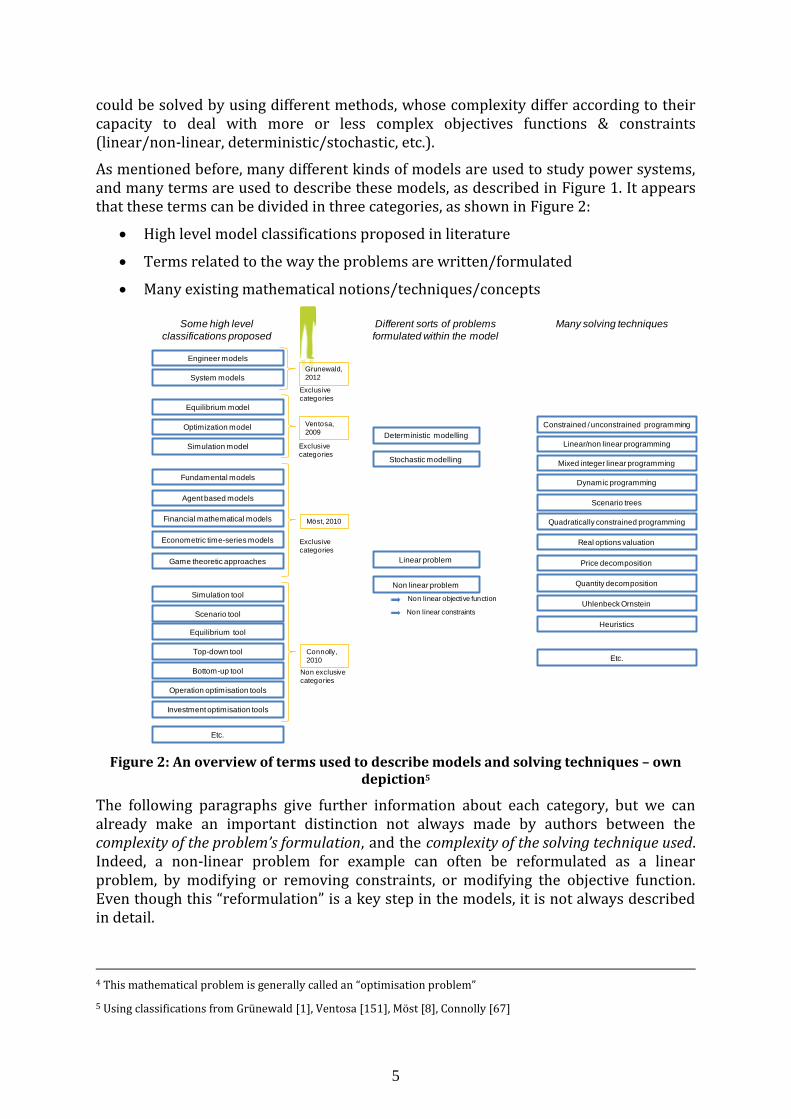
As mentioned before, many different kinds of models are used to study power systems, and many terms are used to describe these models, as described in Figure 1. It appears that these terms can be divided in three categories, as shown in Figure 2:
High level model classifications proposed in literature
Terms related to the way the problems are written/formulated
Many existing mathematical notions/techniques/concepts
Figure 2: An overview of terms used to describe models and solving techniques – own depiction5
The following paragraphs give further information about each category, but we can already make an important distinction not always made by authors between the complexity of the problem’s formulation, and the complexity of the solving technique used. Indeed, a non-linear problem for example can often be reformulated as a linear problem, by modifying or removing constraints, or modifying the objective function. Even though this “reformulation” is a key step in the models, it is not always described in detail.
4 This mathematical problem is generally called an “optimisation problem”
5 Using classifications from Grünewald [1], Ventosa [151], Möst [8], Connolly [67]
Agent based models
Financial mathematical models
Econometric time-series models
Fundamental models
Linear/non linear programming
Constrained / unconstrained programming
Deterministic modelling
Mixed integer linear programming
Game theoretic approaches
Dynamic programming
Stochastic modelling
Uhlenbeck Ornstein
Möst, 2010
Simulation tool
Scenario tool
Equilibrium tool
Top-down tool
Bottom-up tool
Operation optimisation tools
Investment optimisation tools
Exclusive
categories
Connolly,
2010
Non exclusive
categories
Quadratically constrained programming
Scenario trees
Some high level
classifications proposed
Many solving techniquesDifferent sorts of problems
formulated within the model
Real options valuation
Price decomposition
Quantity decomposition
Heuristics
Equilibrium model
Optimization model
Simulation model
Ventosa,
2009
Engineer models
System modelsGrunewald,
2012
Exclusive
categories
Exclusive
categories
Linear problem
Non linear objective function
Non linear constraints
Non linear problem
Etc.
Etc.
6
2.2.2 Model families
Many authors propose reviews of power systems models, with different scopes and objectives. A short overview of two of these reviews/classifications is proposed here.
One starting point to classify models can be the system boundary drawn around the storage, i.e. the level of detail with which the energy system surrounding the storage (grid, power system, entire energy system) is represented. In this sense, Grünewald et al. [1], [2] propose a very fundamental distinction between engineering and system models:
Engineering models focus on assessing extensively the techno-economic performance of one specific technology, in a given system context. Generally, these models are used by studies that focus on the control and optimisation of a given storage asset. They aim at assessing, in a given context, how the asset should be monitored and how profitable it would be.
System models focus on the behaviour of an entire energy system (be it national, European, regional, etc.) and seek feasible and least cost solutions (that bring value to the system as a whole) under certain constraints, for example min cost, or carbon emission targets. These models aim at providing insights on the overall benefits provided by storage, i.e. how storage can help reducing the costs of electricity.
As Grünewald et al. [1] highlight, neither class of model is generally sufficient to give a clear picture to the policy maker – engineering models being very precise, but often case specific, and system models being very inclusive, but still unable to adequately represent all the constraints. The advantages of the developments of high performance computing might be offset by the fact that system models are getting more and more complex6. Bearing that distinction in mind, the authors stress the interest of developing more system models, focusing on the "system value" of storage.
2.2.3 Formulating of the problem
When stating that a model is deterministic/probabilistic, or linear/non-linear, what is described is not the way the problem is solved, i.e. how the solution of the optimal solution is found, but the way the problem is formulated. As these terms are used in nearly all models’ description, we propose here a reminder of their definition.
Linear vs non-linear problems
Non linearity can appear either in the objective functions or in the constraints. A typical class of non-linear problems are modified price-taker models7 in which the effect of a dispatch decisions on prices is taken into account, often by a linear relationship
6 Note that not all models are either an engineering or a system model: for example, a model simulating & comparing the different options available to integrate distributed energy resources, and face the tension/congestion issues (namely, grid reinforcement, selective curtailment, storage, voltage control, etc.) could be considered as a system model in that its objective is to find the optimum design to reduce costs, satisfying the operational constraints. But it is unlikely that this model will be able to give precise insights at a national level, given the diversity of distribution networks – it has to be applied for each existing context, which would therefore classify this model as an engineering one. This example highlights the limit of the classification proposed.
7 A price taker approach uses prices as exogenous inputs, and does not modify them.
7
between power and price making the objective function quadratic in the power, e.g. by dena [3], He et al. [4], Sioshansi et al. [5].8
In the constraints, a non-linearity can appear if a constraint involves, for example, the product of two variables (e.g. I < 5 A, U < 220 V, U*I < 1000 AV). An example for this is given by Benitez et al. [6] in a nonlinear constrained optimisation program of an electrical grid. In this case, the non-linearity results from the representation of hydro generation with the power rating being depending on the volume of water in the reservoir. This leads to quadratic constraints in an otherwise linear problem.
Deterministic vs stochastic problems
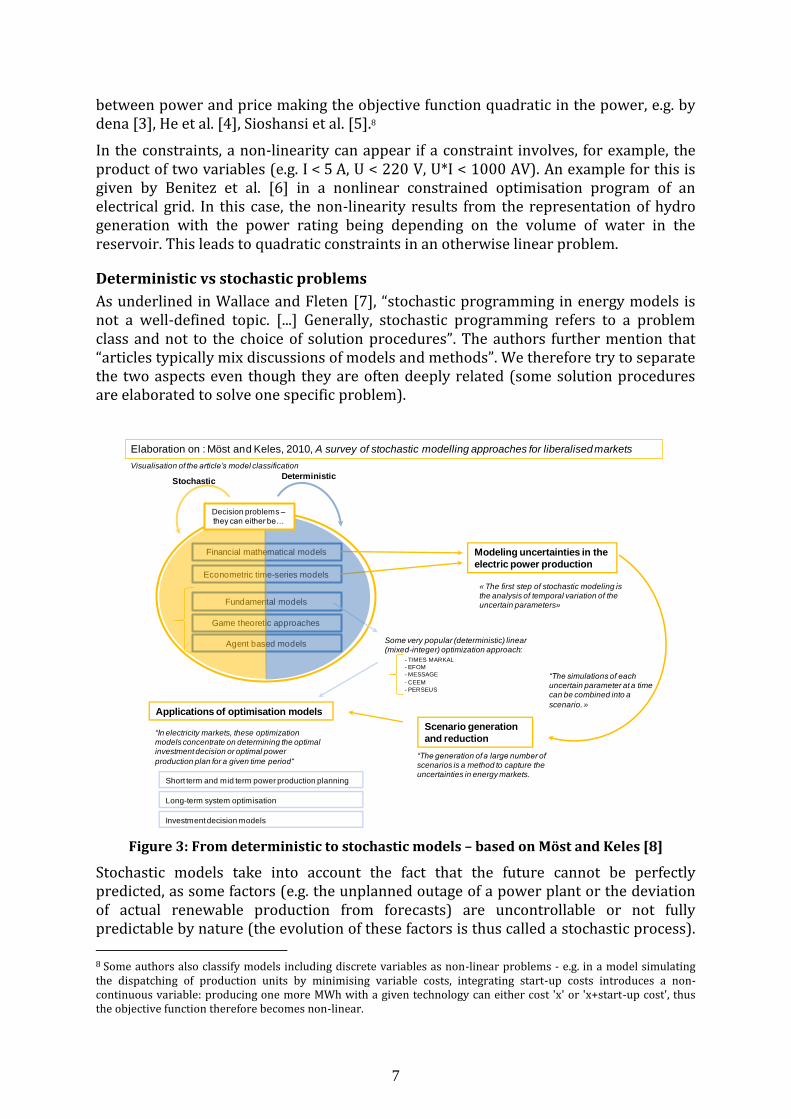
As underlined in Wallace and Fleten [7], “stochastic programming in energy models is not a well-defined topic. [...] Generally, stochastic programming refers to a problem class and not to the choice of solution procedures”. The authors further mention that “articles typically mix discussions of models and methods”. We therefore try to separate the two aspects even though they are often deeply related (some solution procedures are elaborated to solve one specific problem).
Figure 3: From deterministic to stochastic models – based on Möst and Keles [8]
Stochastic models take into account the fact that the future cannot be perfectly predicted, as some factors (e.g. the unplanned outage of a power plant or the deviation of actual renewable production from forecasts) are uncontrollable or not fully predictable by nature (the evolution of these factors is thus called a stochastic process).
8 Some authors also classify models including discrete variables as non-linear problems - e.g. in a model simulating the dispatching of production units by minimising variable costs, integrating start-up costs introduces a non-continuous variable: producing one more MWh with a given technology can either cost 'x' or 'x+start-up cost', thus the objective function therefore becomes non-linear.
Elaboration on : Möst and Keles, 2010, A survey of stochastic modelling approaches for liberalised markets
Agent based models
Financial mathematical models
Econometric time-series models
Fundamental models
Game theoretic approaches
DeterministicStochastic
Some very popular (deterministic) linear (mixed-integer) optimization approach:
- TIMES MARKAL
- EFOM
- MESSAGE
- CEEM
- PERSEUS
Modeling uncertainties in the
electric power production
« The first step of stochastic modeling is the analysis of temporal variation of the uncertain parameters»
“The simulations of each uncertain parameter at a time can be combined into a
scenario.»
Scenario generation
and reduction
“The generation of a large number of scenarios is a method to capture the uncertainties in energy markets.
Applications of optimisation models
“In electricity markets, these optimization models concentrate on determining the optimal investment decision or optimal power
production plan for a given time period“
Short term and mid term power production planning
Long-term system optimisation
Investment decision models
Visualisation of the article’s model classification
Decision problems –they can either be…
8
In real life, decisions are not made with a perfect view of the future, and the operator has to act according to a pre-defined strategy or policy. The point of stochastic modelling is to propose such strategies9, which implies representing stochastic processes.
Therefore, a stochastic modelling approach generally implies 2 steps: first, an optimisation is carried to provide strategies at all the future possible states of the system; then, a second step consists of applying this strategy to a given scenario (decisions/actions at every time step). Deterministic approaches on the other hand directly provide decisions, without the need to define a strategy.
The objective function of a stochastic approach will be:
{ ( ) ( ) }
Or more generally (to include multi stage problems)
{ ( ) ( ( ) ) }
Where
{
( )
In other words, the objective is to minimise the expectation of value on the different scenarios. ( ) reflects the fact that in mutli stages problems, decision at time “t = t0” takes into account the uncertainties not only in t, but also in t > t0.
While the objective function of a deterministic approach will be, for each scenario:
{ ( ( ) )}
Where
{
( )
In other words, the objective is to minimise the objective function for each scenario (and then possibly take the expectation, min, max, etc. over all the scenarios). Here, ( ) reflects the fact that decisions are made with a perfect knowledge of the future.
In order to establish a strategy, scenarios describing possible realisations of a random parameter (ω) need to be constructed (e.g. wind forecasts). The simulation of random parameters and the construction of the scenarios is a full part of a stochastic modelling approach, as indicated by Möst and Keles [8], in a survey of stochastic modelling approaches for liberalised markets. The authors distinguish 3 “fields” where stochastic methods are used.
Stochastic processes for commodity prices
Scenario generation and reduction
Stochastic optimising models for investments decisions.
9 “Another fact, dear to all stochastic programmers, is his pointing out that while deterministic multi period optimization yields decisions for all periods, a stochastic approach only yields policies or strategies” [7].

9
In particular, they describe how these models should interact in a coherent modelling approach, as depicted in Figure 3. Financial models and/or econometric models can be used to model uncertainties, then scenarios can be developed (prices paths, wind forecast, etc.), to be fed in fundamental models, either deterministic or stochastic10. Möst and Keles note that it is possible to use in parallel a deterministic model on many scenarios; this is also a way to take into account the fact that the future is not perfectly known, and some authors classify this kind of approach as "stochastic".
The advantage of stochastic approaches is that these allow quantifying the “value of information”, by comparing results obtained with more or less uncertainty (for example, different qualities of wind prediction). However, the accuracy is not guaranteed since it depends on the choice and quality of the scenarios elaborated.
2.2.4 Solving techniques
When it comes to determine the behaviour of a system given a particular set of input variables, some form of optimisation will generally be performed, except for “simulation models” in which algorithms are used.
One definition [9] describes the optimisation process as follows: “Mathematical optimisation is the branch of computational science that seeks to answer the question 'What is best?' for problems in which the quality of any answer can be expressed as a numerical value. Such problems arise in all areas of business, physical, chemical and biological sciences, engineering, architecture, economics, and management. The range of techniques available to solve them is nearly as wide".
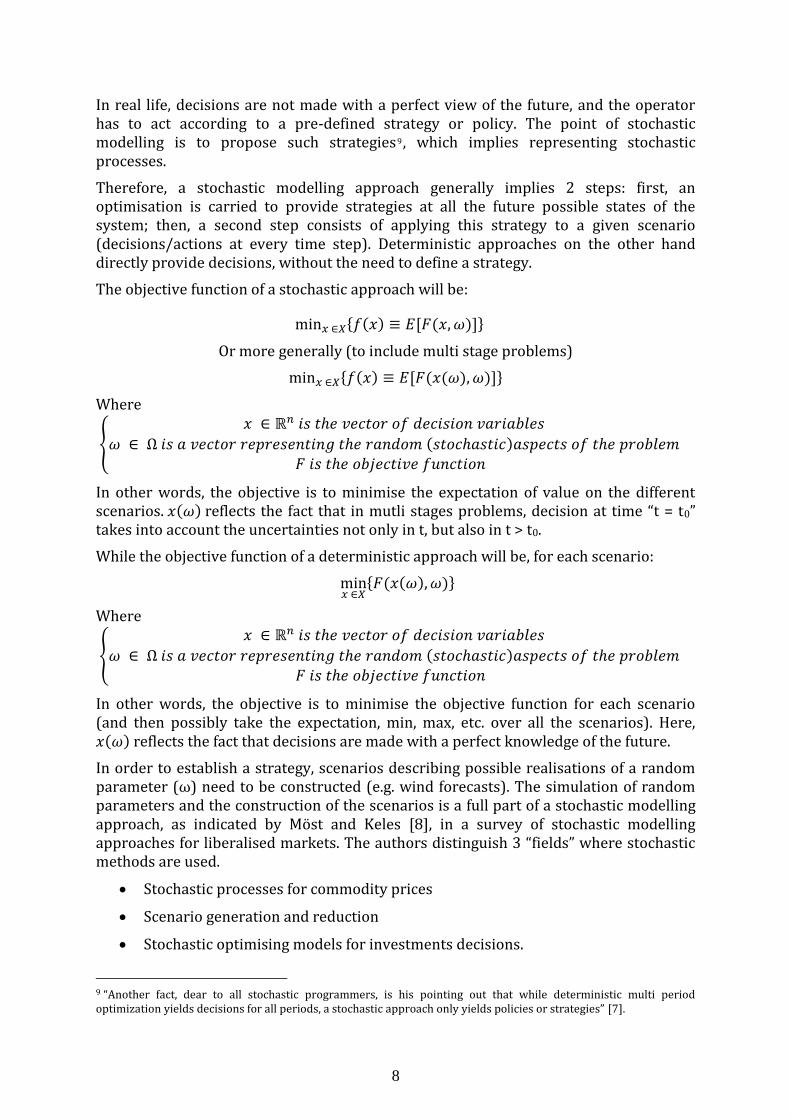
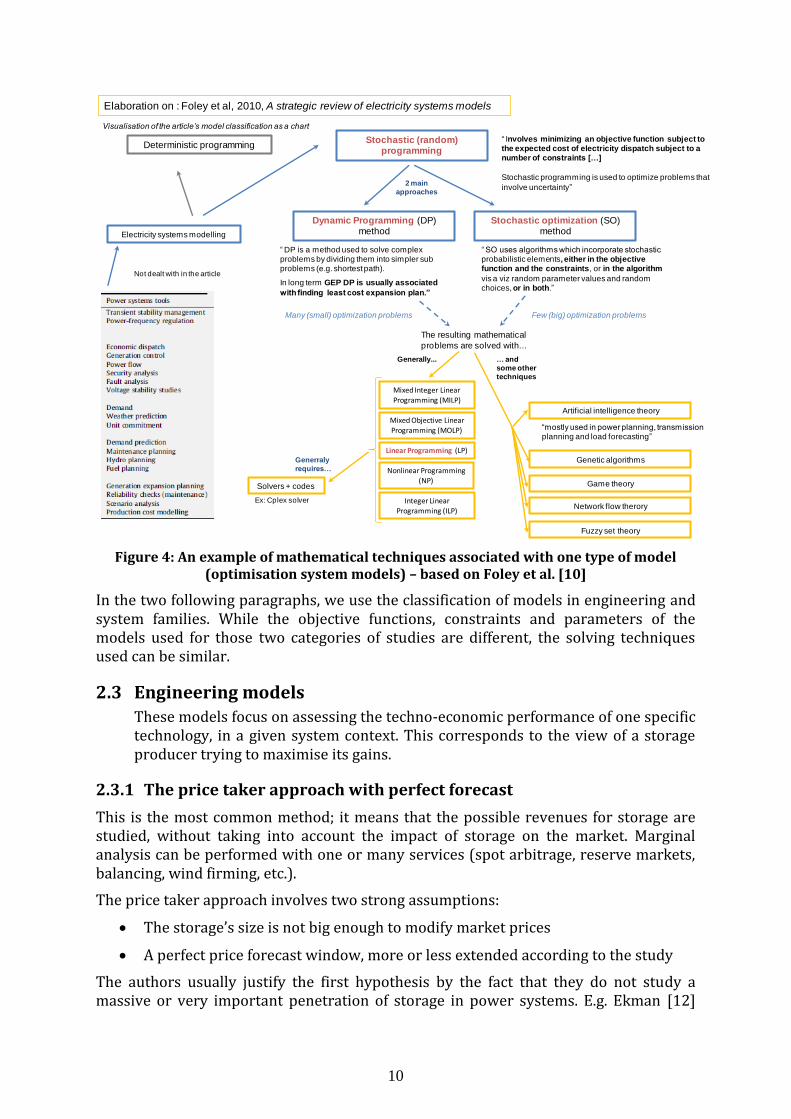
For stochastic models, the challenge lies in the number of possible combinations. The mathematical problem resulting the model formulation can therefore be intractable – hence, methods such as dynamic programming and stochastic optimisation are used, as described in Figure 4, that gives an overview of some of the most widely used mathematical techniques to solve stochastic optimisation problems based on Foley et al. [10].
The term “stochastic programming” refers to a family of stochastic approaches, used with computers (“programming”). The two main techniques used are “dynamic programming” and “stochastic optimisation” (also named “stochastic programming”, or “multi-stage stochastic programming”). We do not provide a detailed presentation of these techniques. These two approaches each have pros and cons, linked to the computational requirements needed (calculation time, memory needed). The important parameters include the length of the optimisation window (number of time steps) and the number of stochastic parameters (prices, wind prediction, load, etc.)11. The interested reader can refer to Kleywegt and Shapiro 2000 [11], Wallace and Fleten [7] for more detail on these methods.
Finally, the resulting mathematic problem can be solved with techniques such as linear programming (generally with a solver) or alternative approaches such as genetic algorithms.
10 See Figure 6 for a depiction of deterministic fundamental model, and Figure 7 for a depiction of stochastic fundamental models.
11 Haesen [31] and Mokrian and Stephen [30] provide good examples on how these parameters impact the results.
10
Figure 4: An example of mathematical techniques associated with one type of model (optimisation system models) – based on Foley et al. [10]
In the two following paragraphs, we use the classification of models in engineering and system families. While the objective functions, constraints and parameters of the models used for those two categories of studies are different, the solving techniques used can be similar.
2.3 Engineering models
These models focus on assessing the techno-economic performance of one specific technology, in a given system context. This corresponds to the view of a storage producer trying to maximise its gains.
2.3.1 The price taker approach with perfect forecast
This is the most common method; it means that the possible revenues for storage are studied, without taking into account the impact of storage on the market. Marginal analysis can be performed with one or many services (spot arbitrage, reserve markets, balancing, wind firming, etc.).
The price taker approach involves two strong assumptions:
The storage’s size is not big enough to modify market prices
A perfect price forecast window, more or less extended according to the study
The authors usually justify the first hypothesis by the fact that they do not study a massive or very important penetration of storage in power systems. E.g. Ekman [12]
Stochastic optimization (SO) method
Dynamic Programming (DP) method
Stochastic (random) programming
Elaboration on : Foley et al, 2010, A strategic review of electricity systems models
2 main
approaches
Electricity systems modelling
“ DP is a method used to solve complex problems by dividing them into simpler sub problems (e.g. shortest path).
In long term GEP DP is usually associated
with finding least cost expansion plan.”
“ SO uses algorithms which incorporate stochastic probabilistic elements, either in the objective function and the constraints, or in the algorithm
vis a viz random parameter values and random choices, or in both.”
“mostly used in power planning, transmission planning and load forecasting”
“ Involves minimizing an objective function subject to the expected cost of electricity dispatch subject to a number of constraints […]
Stochastic programming is used to optimize problems that
involve uncertainty”
Mixed Integer Linear
Programming (MILP)
Mixed Objective Linear
Programming (MOLP)
Linear Programming (LP)
Nonlinear Programming (NP)
Integer Linear Programming (ILP)
Generally...
Genetic algorithms
Game theory
Fuzzy set theory
… and
some other
techniques
Network flow therory
Deterministic programming
Not dealt with in the article
Artificial intelligence theory
Visualisation of the article’s model classification as a chart
Solvers + codes
Generraly
requires…
Ex: Cplex solver
Many (small) optimization problems
The resulting mathematical
problems are solved with...
Few (big) optimization problems
11
highlights “that this simple analysis does not take into account the effect that an electricity storage system would have on the power price, i.e. it is assumed that the installation is marginal and does not exert any influence on the price level”.
Some authors take price effects into account with the help of feedback functions, in particular if the object of study is the benefit of a particular storage for power prices (e.g. dena [3], Sioshansi et al. [13]) or the strategic behaviour of market participants (Sioshansi. [14] or Schill et al. [15]). So far, only a few authors have studied the critical storage size (compared to that of the system) that would forbid any marginal analysis. He et al. [16], perform a numerical analysis of arbitrage using real market bids data of the French day-ahead market in 2009 thus taking the market clearing explicitly into account12.
The second hypothesis (perfect foresight) has been given more attention in literature, and its impact is well known. E.g. He et al. [17] state that “the main limit of this kind of valorisation is the fact that the model assumes perfect foresight of market price. The global profit obtained from the model is therefore overestimated as compared to what can be captured in reality”. Several authors perform sensitivity analysis: Barthust et al. [18]13, Sioshansi et al. [13], Drury et al. [19], Connolly et al. [20] by reducing the perfect forecast window, or using back-casting techniques i.e. defining a dispatch strategy with historical data, and applying it to the future. These analyses, still based on deterministic approaches, indicate that around 80 % of the value with long term perfect forecast could realistically be gained with real operational strategies, by using more or less complex methods.
Perfect foresight would however be applicable if a storage would not be dispatched by traders. He et al. [16] propose a coupling of the electricity storage with electricity markets, i.e. "letting the market operator perform a centralized optimization to decide the optimal allocation of storage resources over the time and among different actors”14. This however implies a strong hypothesis on the future of storage regulation.
In the current environment, the perfect market foresight could be challenged by the increasing production from renewable energy sources leading to an increasing volatility of power prices. Some authors explicitly address this increasing volatility by studying the provision of reserve power along with arbitrage, as for example Deb et al. [21] Walawalkar et al. [22], Fraunhofer [23], Drury et al. [19] and He et al. [17]. The main limit of these analyses is that they do not fully take into account the uncertain interactions between providing energy and ancillary services as remarked by Xi et al. [24], which means that they tend to overestimate the value of storage.
Some authors compare the suitability of different technologies or combinations thereof. PNNL [25], Kazempour et al. [26] propose a comparison of PHPs and different batteries. Drury et al. [19] and Fraunhofer [23] compare the performances of diabatic and adiabatic CAES. Most of these studies do not take grid tariffs into account, even though it
12 The approach requires the availability of the power market bidding curves for each time step, or sufficient data to replicate these curves (e.g. size and variable costs of all the biding units).
13 “It was assumed in this paper that the arbitrage prices were known 24 h in advance in a rolling window and the balancing prices known at market closure. These authors’ prior experience has shown that in certain market conditions, up to 80% of the full-knowledge value can be obtained using primitive statistical price forecasting techniques.”
14 As for market coupling for interconnection capacities

12
presents little modelling complexity and it can have a strong impact on storage profitability, as highlighted by dena [27] or Nekrassov et al. [28].
It should be noted though that only a few studies are based on extensive datasets (as discussed in the chapter on storage profitability of this report), even though these models’ simplicity poses no hurdle.
In conclusion, deterministic & price takers models are still used for an important range of studies, due to their simplicity of use and design. Such approaches are also used in investment decision processes as the AEEG, the Italian regulator, uses an approach close to a price taker with perfect forecast in order to rank storage pilot projects [29].
2.3.2 The price taker approach without perfect forecast (stochastic & dynamic modelling)
In recent years, a number of authors worked on non-deterministic approaches, or scenario based deterministic approaches. The objective is to propose realistic dispatching strategies without a perfect forecast assumption, i.e. facing uncertainty on the price levels, and also potentially on other parameters such as wind forecasts, gas prices, demand levels, etc. We separate here the studies dealing with hybrid system (wind + storage, often with transmission or other quite specific constraints) from stand-alone storage capturing value on different markets.
The driver for developing such models, mentioned by all the authors thereafter cited, is that the perfect forecast approach (or deterministic approach) might not be appropriate in increasingly volatile markets. Thus authors propose approaches based on stochastic programming, (stochastic) dynamic programming, Monte Carlo simulation, etc.
It should be noted however that to our knowledge, and with regard to the articles reviewed here, few authors propose a clear view of how their models15 could help stakeholders improve their valuations of storage. So far, most of the studies proposing actual results (see the profitability chapter) are based on deterministic methods. Therefore, it would be interesting to provide answers to questions such as:
What are the benefits of increasing the models complexity? How different are the results than with simpler methods?
Are simpler methods, such as the one described above, still relevant? Can they be improved with a better knowledge of their limits thanks to punctual more complex modelling?
Can the model be used on large sets of data? Or can it be used only on restricted cases, in order to highlight one specific aspect?
It seems difficult, to provide answers to these questions. We will therefore limit our present analysis to an introduction to some of the approaches used.
Mokrian and Stephen [30] propose a series of models aiming at maximising the storage profits on intraday arbitrage. The authors first state that the existing approaches “rely on deterministic prices – Where the volatility is specifically mentioned, the models once again optimize over a given historical price profile [...]. None of them model what the plant would do in an actual market setting using forward looking, dynamic strategies”.
15 Some of which are more proofs of concept than re-usable models.
13
Therefore, they propose and compare three different approaches: a first “linear programming” model is introduced, then a “dynamic programming model” (DP) and finally a “stochastic programming model” (SP). The results of the three models to estimate the revenues of storage on an intra-day market are then compared. Based on this research, Haesen et al. [31] propose a summary of the pros and cons of DP and SP solving techniques:
“SP divides the time horizon in several stages. At each stage operation is optimized based on several price expectation trends and the expected optimal value for future time stages, introducing recourse in the problem formulation (a scenario tree). The more stages are introduced, the more profit can be captured at the cost of higher computational requirements.
DP on the other hand has no limitation on the number of stages, but does need to limit the number of operation possibilities (actions) at each stage to overcome the ‘curse of dimensionality’ [3]. A basic prerequisite for DP optimality is that optimization of future actions is not depending on information of the past, i.e. choosing the optimal operation is purely forward looking16. […] It may not be compatible with power exchange rules in which day-ahead bids are placed.”
The authors do not conclude on the respective merits of DP and SP approaches. The results for both methods are indeed different than those obtained with a LP approach with expected prices, and the differences seem to vary in the 3 different price paths simulated. It would be interesting to have quantification of these variations, and of how they could influence investment decisions. An important limitation of this work is that it only concerns intraday arbitrage, as decisions need to be taken during the day. As of today however, the most liquid and relevant markets are still the day-ahead markets.
In their conclusion, the authors point out several practical results that contradict other previous studies (with regard to storage capacity (MWh), storage efficiency, and time horizon for the optimisation). However, some further work would be interesting to fully assess the interest of their research, and how it could be further used17.
Xi and Sioshansi [24] note that the existing literature did not address well enough three issues:
Most studies do not co-optimise multiple storage uses. Multi stream valuation is often proposed, but through the use of strong hypotheses without real co-optimisation of the revenues,
The effects of price and system uncertainty are often neglected in storage analyses, and
Most storage analyses focus on utility scale storage, even though smaller scale storage is becoming an attractive option.
Therefore, the authors propose a “stochastic dynamic programming model for co-optimisation of distributed energy storage”. Their paper [24] proposes a very clear
16 In other words, prices can only be simulated through a Markov process, i.e. futures prices estimates will not use the prices seen during the previous hour, but only the hour when the new prediction is made, which is an important limitation.
17 The authors also mention the fact that their framework is amenable to multiple revenues (but no further published work is available to our knowledge)

14
presentation of the model18 and of the assumptions used, which could allow replicating their approach. The problem is solved in two stages19. A use case combining up to four services (arbitrage, regulation, distribution relief and back-up) is then studied, using 2009 PJM data over one week. The main conclusion of the authors concerns the occurrence of trade-off between services when they are jointly optimised. It is not said however if this modelling approach can be used to study multiple markets over a larger time scale, i.e. if their approach is applicable to larger use cases.
Keles et al. [32] , while also stating that “none of the [previous] approaches takes into account the price dynamics of a long period and their stochastic volatility” use a different modelling approach. It consists of a deterministic optimisation model, and on a financial mathematical model : the core of the model is still based on an optimisation problem with a perfect price forecast, but the optimisation is done on 1000 prices paths (Monte Carlo simulation), generated via a stochastic process. Keles et al. [32] conclude by stressing the fact that gas and CO2 prices should also be modelled using stochastic processes. Also, the authors note that “ongoing and further future work should concentrate on the formulation of a stochastic optimization model instead of the time-consuming Monte Carlo simulation with 1000 optimizing runs, which takes nearly eight hours for this single plant evaluation [...]. A scenario tree can be generated out of the 1000 price paths and incorporated into a stochastic optimization model or stochastic dynamic programming model. In this case it is not necessary to run the optimization model thousands of times, and it can be run with a smaller dimension due to the reduced stochastic tree”.
In a similar approach, Grünewald [2] proposes an analysis over 6 years, also with non-historical prices, as in Keles et al. [32]. In this case, the price paths are constructed with a model providing hourly electricity prices, with a simplified representation of a competitive electricity market20. On a second step, a deterministic optimisation problem is used to perform arbitrage. With this method, Grünewald then performs several interesting analyses, as the impact of more wind production for storage, or on the interest of a capacity market mechanism. The two last examples indicate that this method could be extended to the study of large use cases (though with high computational time).
Finally, Qin et al. [33] note that the control and optimisation of storage in a spot market could in theory be assessed through “naive Monte Carlo approach, [...] but that the important number of scenarios needed would imply very high computational time” as already stressed before. Therefore, the authors review other numerical approaches such as scenario selection, approximate dynamic programming, and parametric linear programming. Then an analytical solution is proposed for the storage operation problem – this work seems interesting and innovative, as the optimal control rule consist only “in comparing the current price with a pre calculated threshold value to decide how to buy and to sell”. More work is needed on such approaches, as analytical
18 Parameters, state variables, decision (action) variables, exogenous variables, state-transition function, constraints and objective function.
19 First, discretization of exogenous and state variables allows solving the discretized SDP using backward induction, then a mixed-integer program in which the value of the true SDP is approximated
20 The model uses rather detailed data, for the demand profiles and renewable production) – according to the demand addressed to the thermal parc, prices are high or low (if wind production increases, prices are more volatile).
15
approaches generally require strong hypotheses (e.g. uncertainties can be modelled through Gaussian laws).
In conclusion, Monte Carlo approaches are used by modellers as a pragmatic intermediary between more complex mathematical models, and deterministic approaches on historical prices
2.3.3 Modelling of hybrid storage systems
Another sub category of models is used in studies proposing strategies to optimise the dispatch of a storage jointly with an intermittent energy resource, such as wind or solar. These models are often extensions of the price taker approaches described above, generally with one more stochastic variable (such as wind). The attention of these studies often resides in either the wind forecasting technique, or in the consideration of specific constraints (limited cable size, local load to satisfy, etc.).
A few typical examples of such papers are Korpas et al. 2003 [34], Howell et al. 2009 [35], Arsie et at [36], Barton and Infield [37], Deb [21], EPRI [38], Garcia Gonzales [39], Hessami [40]. Very specific constraints are also studied by Denholm and Sioshansi [41] (interest of storage for limiting the size of a cable between a wind farm and the grid, and analysis of the trade-off between fewer arbitrage possibilities and fewer grid cost) and by Loisel et al. [42] [43].
2.3.4 Services mutualisation
As described in Chapter 3 of this report, providing only one service with a storage device can be unprofitable in most market situations. A number of authors therefore study how to deliver more than one service in order to construct profitable business models for storage. This is challenging from both the technical point of view (how to dispatch storage according to different objective functions?) and from the economical point of view, as mutualisation services generally imply a trade-off, and the investor needs to optimise the storage operation. Also, regulatory issues might need to be addressed the storage is to deliver services to different segments of the unbundled energy system as described in Chapter 4 of this report.
For bulk storage, typical combinations studied are arbitrage combined with reserve power (Drury et al. [19], Fraunhofer [23], Walawalkar [22], Sioshansi et al. [5]) and arbitrage combined with congestion management (e.g. Black and Strbac [44], Denholm et al. [41], Loisel et al. [42]). An exhaustive list of services including some possible combinations is identified by EPRI [38] and SANDIA [45].
Even more combinations seem possible for distributed storage. Delille et al. [46] [47] systematically derive a matrix (the dimensions being the location of the storage in the grid and the services) of possible use cases. A list of more than twenty services is established, along with the potential storage technologies suited to deliver the services and a list of the places where a storage device could be located on distribution grids. Combining lists and matrices allows proposing possible services combinations for a given technology at a given place. This work focused mainly on distribution applications, but could be expanded to the whole power system. The applications are not valued in this work, but the matrices can be used to rank use cases to model.
Loevenbruck [48] studies the effect of competitive requests on a storage device. Two sets of services are assessed: (i) voltage smoothing, investment deferral and arbitrage, (ii) primary frequency regulation, grid investment deferral and arbitrage as another.
16
The interest of this research is that the values obtained with the different services are not calculated separately: one service is prioritised, and the others are provided taking into account one more constraint (the use of storage for the main service).
He et al. [4] propose a novel business model for aggregating the values of electricity storage, through a system of three successive auctions that allow different actors to use storage, with a given profile. The model itself therefore consists of three sequential optimisation problems, each integrating as constraints the utilisation curve proposed by the formerly accepted auctions. It uses a simple price taker approach for each of the auctions thus the auctions themselves are not modelled21. In another paper, He et al. [17] also focus on services mutualisation, with a multi-stream value assessment on the French energy market – the three services provided concern three different time horizons (year ahead, day ahead and intraday), which also allows to perform three successive optimisation problems. This work could be compared with other models using a co-optimisation of the services, instead of a sequential process.
2.4 System models
System studies usually aim at finding a least cost solution for the supply of energy services under a number of constraints which could be policies (e.g. RES-E targets, climate goals, the possibility of using nuclear energy) or infrastructure limitations. The system benefits are determined by comparing model sensitivities with different storage penetrations. System models typically do not aim at modelling an individual actor’s behaviour22.
A number of factors are exogenous to a system model such as demand, commodity prices; possibly those exogenous variables are themselves the output of other models. The power generation portfolio might be either exogenously given such as assumed by Connolly [20] for the Irish system or result from an optimisation model (e.g. the studies by dena on transport grids [49] and on RES Integration [50], Strbac et al. [51]). The regional scope varies between one country, larger regions (e.g. 2050 Roadmap [52], EURELECTRIC PowerChoices [53]) or the world energy system (e.g. IEA World Energy Outlook [54] 23).
Thus, system studies significantly vary in the sector boundaries, in their objectives and in their structure. The following cases can be distinguished:
Energy system models (modelling the energy system – TIMES models often fall in this category)
Market models (as defined by ENTSO-E [55]) – these correspond to models focusing on the demand–supply-equilibrium, and generally use simplified assumptions for representing the grid (often “single node” representations)
Network models (as defined by ENTSO-E [55] – these correspond to models focusing on networks management, and generally focusing on a restricted number of time steps
21 This could be subject to further research,
22 They assume that if there is a market, then there is perfect competition, and that therefore actors will behave in the way that their interest brings a benefit to the system
23 As none of the widely known regional system studies provide sufficient details on their respective modelling of storage, they are not further discussed within this report.
17
Other system approaches (distribution network studies, islanded systems)
The boundary between market and network models is not always clear. Ideally, a “power system model” should be both a market and a network model, and some studies give insights on both the generation and networks needs with a single model, as for example Strbac et al. 2012 [51], VDE 2012 [56].
2.4.1 Modelling storage in whole energy systems
Energy system models are typically used for studying national, regional or global energy policy options. They represent a country's or region's entire energy system including power generation, transport, industry and heating, possibly over longer time periods including the decommissioning and replacement of assets.
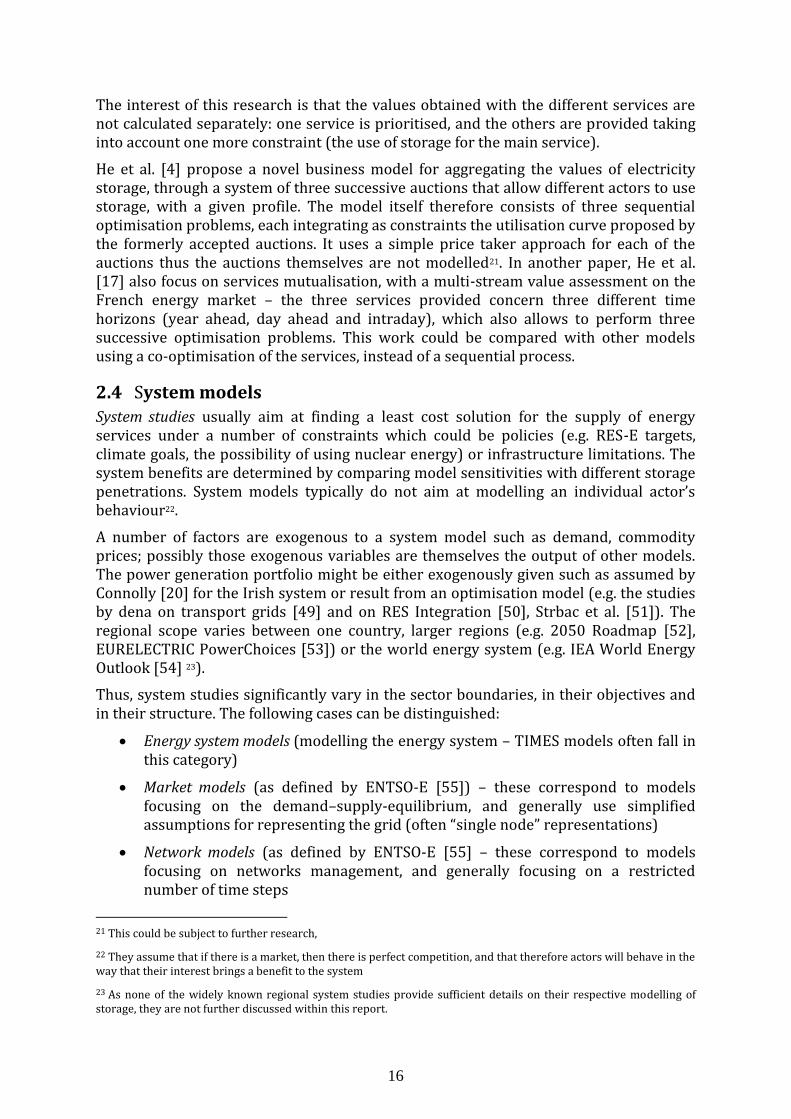
Figure 5 provides a schematic illustration of what an energy system model can be, and of the solving method of these models (generally, a deterministic optimisation is carried, for one or several scenarios, through the help of mixed integer linear programming).
Figure 5 : Schematic structure of an energy model
In the context of energy storage, these approaches allow studying cross sector impacts such as between electricity generation and heat (e.g. thermal storage heat pumps) or mobility (E-vehicles). However, so far, these tools include little possibility to model storage.
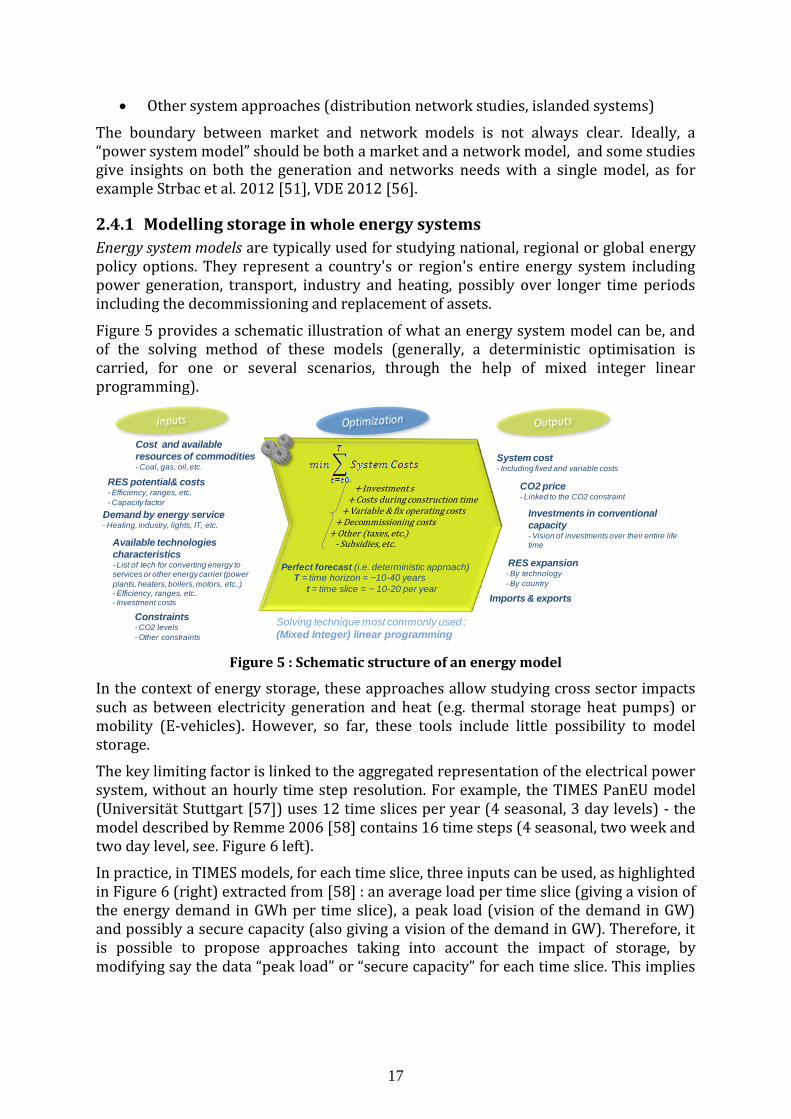
The key limiting factor is linked to the aggregated representation of the electrical power system, without an hourly time step resolution. For example, the TIMES PanEU model (Universität Stuttgart [57]) uses 12 time slices per year (4 seasonal, 3 day levels) - the model described by Remme 2006 [58] contains 16 time steps (4 seasonal, two week and two day level, see. Figure 6 left).
In practice, in TIMES models, for each time slice, three inputs can be used, as highlighted in Figure 6 (right) extracted from [58] : an average load per time slice (giving a vision of the energy demand in GWh per time slice), a peak load (vision of the demand in GW) and possibly a secure capacity (also giving a vision of the demand in GW). Therefore, it is possible to propose approaches taking into account the impact of storage, by modifying say the data “peak load” or “secure capacity” for each time slice. This implies
Available technologies
characteristics- List of tech for converting energy to services or other energy carrier (power
plants, heaters, boilers, motors, etc..)- Efficiency, ranges, etc.- Investment costs
Solving technique most commonly used :
(Mixed Integer) linear programming
RES potential& costs- Efficiency, ranges, etc.
- Capacity factor
Demand by energy service- Heating, industry, lights, IT, etc.
Cost and available
resources of commodities- Coal, gas, oil, etc.
Constraints- CO2 levels
- Other constraints
+ Investment s + Costs during construction time
+ Variable & fix operating costs + Decommissioning costs
+ Other (taxes, etc.)- Subsidies, etc.
System cost- Including fixed and variable costs
Investments in conventional
capacity- Vision of investments over their entire life time
CO2 price- Linked to the CO2 constraint
RES expansion- By technology
- By country
Imports & exports
Perfect forecast (i.e. deterministic approach)T = time horizon = ~10-40 years
t = time slice = ~ 10-20 per year
18
using strong assumptions defined beforehand, and is the main limitation of “energy models” when studying storage, as pointed out by Grünewald [1]24.
Figure 6 : Illustration of the time resolution of a Times model – figures extracted from [58]
Of the studies reviewed, only Connolly [20] uses an energy system model, however without fully modelling the non-electricity sectors.
2.4.2 Market models
Market models aim at optimising parts or the whole of the power generation value chain i.e. power generation, trade transmission, distribution and possibly end use of electricity.
Models for generation scheduling and power flow can be coupled including storage in one or several value chain steps, but the objective of these models is not to provide detailed analyses of the network (see next section). Thus, the level of detail for a power flow calculation varies between studies, from a few regions with some interconnection capacity as used by Strbac et al. [51] (this work also includes a simplified representation of the distribution level) to a detailed node by node grid flow calculation, e.g. by VDE [56]. On the distribution and end use level, power flows and storage dispatch are usually modelled making assumptions of some "average region" rather than for every node (dena 2012 [59], Strbac 2012 [51]) and often analyse only one snapshot (peak demand or peak day). The "downstream" benefits of storage thus always represent some aggregated value for e.g. a representative customer while the "upstream" benefits can be quantified for a particular asset as e.g. in [3].
These models can be very complex, non-linear and non-continuous, according to the constraints that are taken into account. The number of variables can increase rapidly, leading to high computational time, often requiring some HPC25 capacity, particularly in stochastic approaches using a high number of scenarios to represent the uncertainty of wind, load, outages, etc. The amount of data needed is also an important challenge.
24 “System models, such as MARKAL, Energy Technologies Institute (ETI) ESME model or the DECC2050 accounting framework, do attempt to include storage. However, they fail to represent storage adequately due to their lack of temporal resolution or limited ability to capture balancing requirements with respect to alternative balancing options”. In other words, they do not represent the contribution of storage to short term flexibility (intra-day and intra-hourly balancing).
25 High Performance Computing
19
Thus, not many studies follow an approach consisting of representing large interconnected systems, from technical constraints of the power plants to the consumption, and including some form of storage.
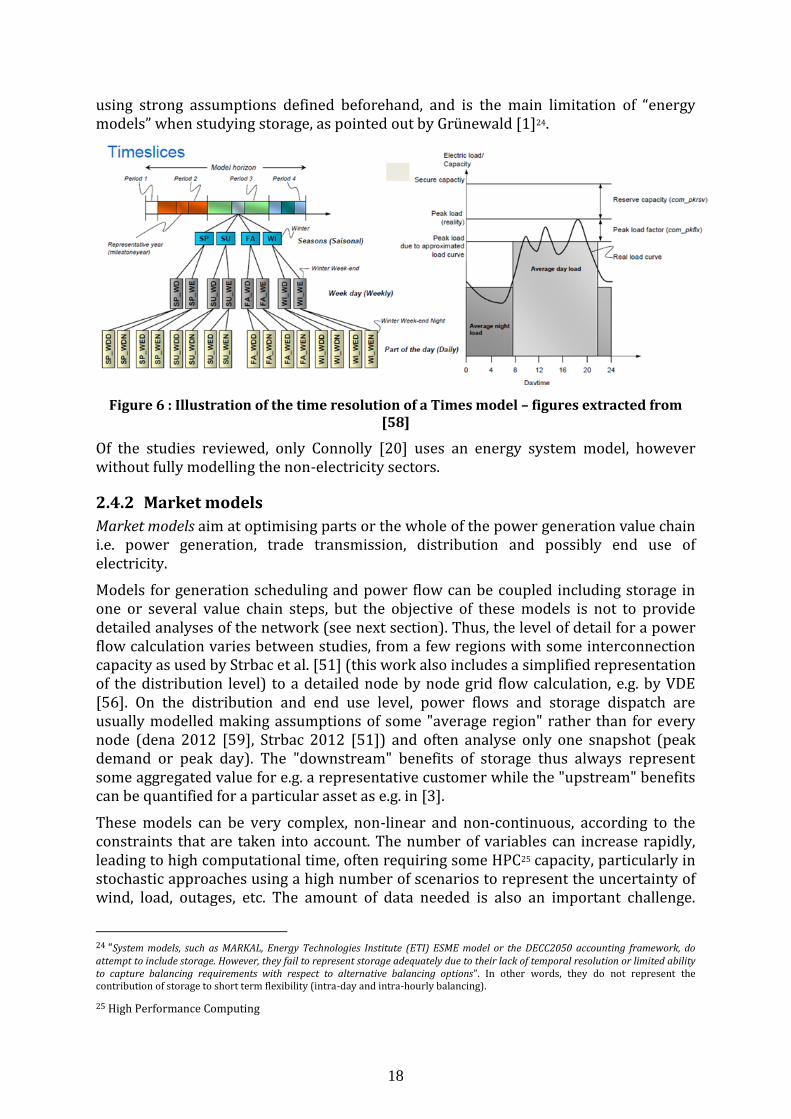
Figure 7 proposes an example of how a power system model can be structured. The grid representation is not shown explicitly here, as it can vary from one model to another. Also, investments (generation & network) are not endogenously modelled in the example, as this feature is not encountered in all models. Two main differences compared with the energy system models previously introduced can appear.
Firstly, power system models can include a form of stochastic modelling – as explained in chapter 2.2.3. This implies using scenarios (e.g. based on historical production profiles), and then elaborating a strategy to face the uncertainties of each scenario, as indicated below in the step 1 “optimisation” (thus the objective function is to minimise the system costs expectation for all scenarios)26. The second step of the model generally consists of a well-known linear optimisation, more or less complex according to the constraints modelled.
Secondly, the time resolution is much higher, hourly or lower. This allows studying properly the variations of load and non-dispatchable production.
Figure 7 : Schematic structure of a power system model (example)
The studies using such models can have two objectives: assessing real project, or analysing the implication of future changes on the system (ex: more renewable production). The following paragraphs present each aspect more into detail.
26 In practice, “elaborating a strategy” generally corresponds to “calculating water values”. Pöyry [153] follows a two-step approach: a first model (BID) calculates water values while a second one (Zephir) realises the dispatch. The SDDP [154] model is used to represent systems with a large number of hydro plants (using stochastic dual dynamic programming). Another example is the continental model developed by EDF [62].
Possible solving technique :
Dynamic Stochastic
Programming
Solving technique:
Linear programming (mixed
integer, quadratic, etc.)
Thermal units- List of units
- Efficiency, ranges, etc.
Non dispatchable
Production- Production profiles for wind, PV, run of river, etc.
Load - Profiles per scenario
Cost of commodities- Coal, gas, oil, etc.
CO2 cost
Hydro production- Inflows per scenario
System cost-Including fixed and
variable costs
Hourly dispatch
Imports & exports
Loss of load
Units revenues
+ Variable & fix operating costs + Failure cost- Subsidies, etc.
T = time horizon = ~1 yeart = time slice = ~ 10-100 p.y.
Many scenarios (e.g.
based on historical years)
Failure cost
Etc. T = time horizon = ~1 yeart = time slice = ~ 8760 p.y.
CO2 emissions
RES curtailment
Etc.
20
Assessing real storage projects
Among the actors following such an approach, TSOs might be the most prominent to be cited, as they to assess the need for network re-enforcement and interconnections. Both network models (providing for a few chosen hours optimal power flows respecting the N-1 security rule, and estimating the costs of re-dispatching when the network is saturated) and market models (simulating one or many year with an hourly resolution, and a simplified representation of the network, with interconnected copper-plate zones) are used. Utilities also use market models to evaluate the economics of their investment projects which requires to understand the evolution of the power markets, but utility led analysis (along with the models used) present a high strategic interest, and are therefore rarely published.
The models developed and used by TSOs are thus better suited for providing a public reference. But as storage is generally not a regulated asset, little information is available on the modelling of storage in their models. Recently though, the European Commission has asked ENTSO-E to provide a detailed presentation of the “Cost Benefit Analysis” methodology that will be used to select projects within the PCI framework27 [55] - the methodology should apply to all infrastructure projects, including storage, and an annex specifically deals with it. Both the Florence School of Regulation (THINK 2013 [60]) and the European Association for Storage of Energy (EASE 2013 [61]) commented on this document. From the modelling point of view, EASE 2013 mentions two points that are particularly relevant in our analysis.
Firstly, EASE insists on the fact that existing market and network models do not always include a proper representation of storage, and that therefore the modelling approach and assumptions that will be used by ENTSO-E for storage should be well detailed28.
Secondly, EASE notes that “the [gross] socio economic welfare proposed does not include the system cost diminutions linked to the avoided fixed costs in generation”. In other words, the modelling approach used by ENTSO-E so far does not include an endogenous investment module, even though the impact of storage (and of interconnections) on the need for thermal power is important (see for example Strbac et al. 2012 [51] for storage’s impact on thermal capacity need, and Rebours 2010 [62] for interconnections).
Therefore, some more development of these market and networks models should come in future years, to better deal with storage and improve the assessment of its value for the system. The review by Foley et al. 2010 [10] on electrical system models concludes that “a clear challenge for electricity systems models is the proper consideration of ancillary services, the grid and energy storage systems such as PHES and CAES” and that some well-established system model developers are now working to integrate storage29.
27 Project of Common Interest - The document presents the general method adopted to calculate the indicators that the European Commission will use to rate projects. This methodology is also the one used to provide the Ten Year Network Development Plans (TYNDP)
28 “EASE is well aware that modelling storage in market and network models can be challenging – the modelling assumptions made can have a strong impact on the results. In particular, the results obtained with deterministic approach can be very different than those obtained with a stochastic approach. […] The models used to perform the CBA should be described in details, in order to allow stakeholders understanding the results […].Storage can provide more services than interconnections. In particular, services linked to ancillary services and power quality should be taken into account in the CBA approach – there again, the associated features in the models should be described in detail.”
29 For example: “Currently, EMCAS is being expanded to include energy storage” [10]
21
This development could profit from an in depth exchange between stakeholders, in order to share good practices and ideas – this literature review intends to serve as a contribution to this.
Assessing the impact of storage on evolving and future energy systems
These studies often focus on a specific country and use a rather limited number of scenarios to represent the uncertainty of load and renewable generation. The models used are not always described in detail in the publications, as they can be quite complex – it is therefore often difficult to understand and fully appreciate all the results. The interest of studying these models, in addition to those used by the TSOs, is that some of them have features that are not used so far in TSO’s models such as e.g. the endogenous capability to make investment decisions Also, academic studies often focus on more extreme scenarios than TSOs, as for example systems with 100 % RES supply – the models used for this kind of studies might be specific.
Studies providing endogenous investment modules are particularly interesting, as they can predict the evolution of systems under given circumstances (e.g. commodity prices, CO2 caps, RES targets) as opposed to normative scenarios (such as a 100% RES system). This task is complex, as optimal states can be defined for production, transmission, storage, etc. The number of variables can therefore be very high, and the computational time also.
The model in Swider [63] minimises costs, as a function of available generation and transmission capacity, primary energy prices, plant characteristics and demand. Constraints such as reduced efficiency for part loaded power plants and start-up costs are taken into account. Swider underlines that his model takes into account three aspects often not considered: “endogenous investment in selected thermal technologies and CAES, stochastic representation of wind power technology and reserve requirements based on a given reliability margin”. This model has been applied to a use case based on the German power system, over 20 years. Interconnections are not taken into account, and therefore not optimised.
Strbac et al. [51] propose a model seemingly quite similar, on a broader study and based on the extension of a former model (presented in Black et al. [64]). The authors indicate that their model takes into account all the segments of the electricity value chain, from production to distribution, and endogenously makes investments in transmission, distribution, interconnections, generation and storage. Different years are simulated (2020, 2030, 2050), and a stochastic representation of wind is used, based on Howell et al. 2009 [35]. Grünewald et al. [1], describing the model used by Strbac et al. [51], state that “for the first time, the system value of storage, expressed as the savings potential in capital and operating costs across the system, can be estimated numerically”, whereas previous “system models” failed to represent storage adequately due to “their lack of temporal resolution or limited ability to capture balancing requirements”. The term “adequately” used by Grünewald here could be subject to discussion, as what is an adequate representation of storage is still an unsettled question. There is still, for example, no clear vision to what are the boundaries of storage, whether it can be used simultaneously to provide many services to all the electricity value chain stakeholders, or rather if it should be restricted to one (or some few selected) service(s) at a time. Furthermore, the representation proposed by Strbac et al. also uses assumptions reducing its “adequacy” as e.g.:
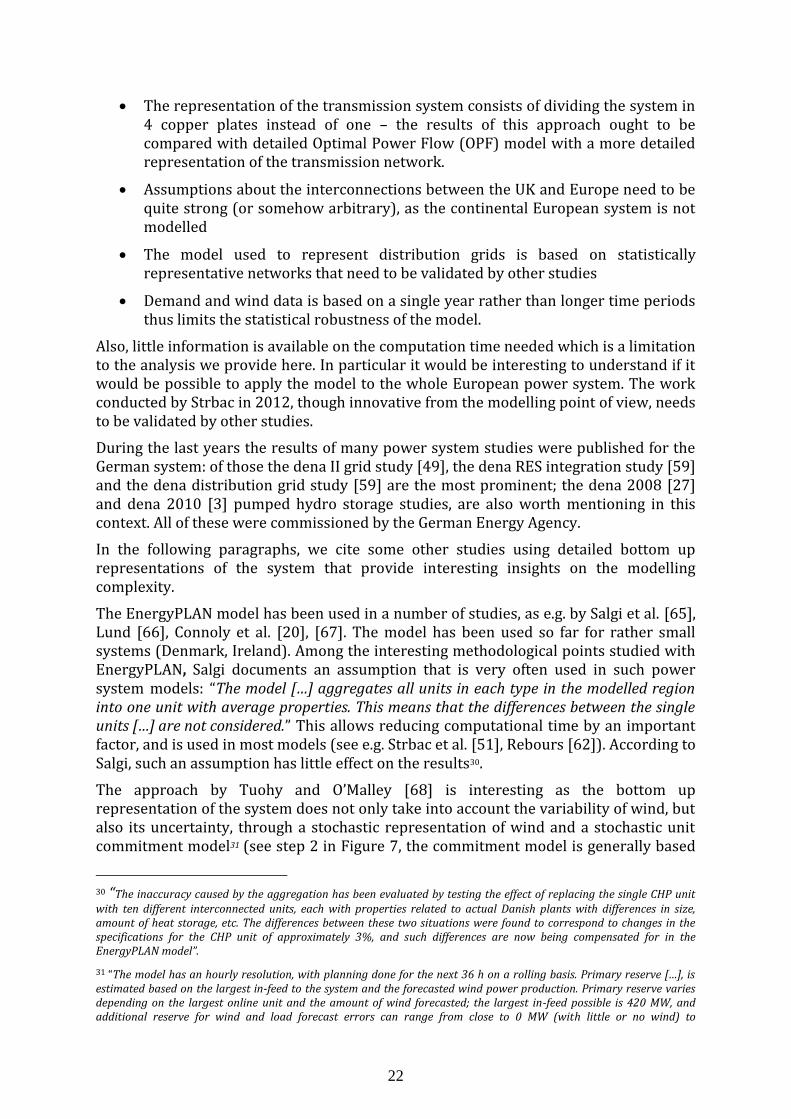
22
The representation of the transmission system consists of dividing the system in 4 copper plates instead of one – the results of this approach ought to be compared with detailed Optimal Power Flow (OPF) model with a more detailed representation of the transmission network.
Assumptions about the interconnections between the UK and Europe need to be quite strong (or somehow arbitrary), as the continental European system is not modelled
The model used to represent distribution grids is based on statistically representative networks that need to be validated by other studies
Demand and wind data is based on a single year rather than longer time periods thus limits the statistical robustness of the model.
Also, little information is available on the computation time needed which is a limitation to the analysis we provide here. In particular it would be interesting to understand if it would be possible to apply the model to the whole European power system. The work conducted by Strbac in 2012, though innovative from the modelling point of view, needs to be validated by other studies.
During the last years the results of many power system studies were published for the German system: of those the dena II grid study [49], the dena RES integration study [59] and the dena distribution grid study [59] are the most prominent; the dena 2008 [27] and dena 2010 [3] pumped hydro storage studies, are also worth mentioning in this context. All of these were commissioned by the German Energy Agency.
In the following paragraphs, we cite some other studies using detailed bottom up representations of the system that provide interesting insights on the modelling complexity.
The EnergyPLAN model has been used in a number of studies, as e.g. by Salgi et al. [65], Lund [66], Connoly et al. [20], [67]. The model has been used so far for rather small systems (Denmark, Ireland). Among the interesting methodological points studied with EnergyPLAN, Salgi documents an assumption that is very often used in such power system models: “The model […] aggregates all units in each type in the modelled region into one unit with average properties. This means that the differences between the single units […] are not considered.” This allows reducing computational time by an important factor, and is used in most models (see e.g. Strbac et al. [51], Rebours [62]). According to Salgi, such an assumption has little effect on the results30.
The approach by Tuohy and O’Malley [68] is interesting as the bottom up representation of the system does not only take into account the variability of wind, but also its uncertainty, through a stochastic representation of wind and a stochastic unit commitment model31 (see step 2 in Figure 7, the commitment model is generally based
30 “The inaccuracy caused by the aggregation has been evaluated by testing the effect of replacing the single CHP unit with ten different interconnected units, each with properties related to actual Danish plants with differences in size, amount of heat storage, etc. The differences between these two situations were found to correspond to changes in the specifications for the CHP unit of approximately 3%, and such differences are now being compensated for in the EnergyPLAN model”.
31 “The model has an hourly resolution, with planning done for the next 36 h on a rolling basis. Primary reserve […], is estimated based on the largest in-feed to the system and the forecasted wind power production. Primary reserve varies depending on the largest online unit and the amount of wind forecasted; the largest in-feed possible is 420 MW, and additional reserve for wind and load forecast errors can range from close to 0 MW (with little or no wind) to
23
on a deterministic optimisation). This work highlights the importance of a good representation of reserves in such models. Similarly, Black et al. [44], in studies on the UK system, focus on the provision of reserves with storage.
“Simplified” representation of electrical systems
Most of the system models require a large amount of detailed data describing all elements of the system (e.g. power plants, nodes of the power grid, geographically disaggregated generation and demand) and as a result of the complexity, long calculation times. The studies are therefore often only applicable to a rather limiter perimeter (e.g. a specific country). Some authors use models allowing studying very large perimeters, both geographical and temporal. These approaches could be classified as “simplified”, as they require less data (mainly power demand and RES production) and are based on strong assumptions (no unit commitment module, copperplates, very few conventional technologies, little constraints considered, etc.).
Figure 8 : Schematic structure of a possible simplified system model
For example, Nyamdash et al. [69] uses three input parameters: 2006 Irish system marginal prices, demand profiles and wind generation data. Perfect forecast of wind and load are assumed, and the operation of storage is purely price driven. The information is used to build a net load duration curve. The optimal mix to satisfy the load is then derived from duration curves, with varying amounts of wind and storage. By comparing cases with and without storage, the benefits for the system are quantified in a rather simple way.
Heide et al. [70] [71] and other related papers use a similar approach but without the use of market prices to deduce the use of storage, and on a larger scale, as they study a European system with 100 % RES production. Europe is represented as a copper plate, with a given annual consumption (3130 TWh/a, 8 years of data of load factors); RES production is modelled in detail, with a 47 km x 48 km resolution, hourly data. 2020 targets are used for a rough distribution of wind & PV for countries, and enough wind and/or solar is added to produce enough energy to meet the load. The need for storage and/or back-up capacity is then estimated, by comparing for each hour the difference between load and RES production, as illustrated in Figure 8. The required storage capacity is estimated with different level of RES production, up to an over production of 50 % (the RES annual production amounts to 150 % of the annual energy
approximately 100 MW”
RES hourly production profiles
Demand hourly profiles
Thermal back
up needed
Perfect forecast (i.e. deterministic approach)T = time horizon = ~1 year
t = time slice = ~ 8760
Storage levels
Many scenarios (e.g.
based on historical years)
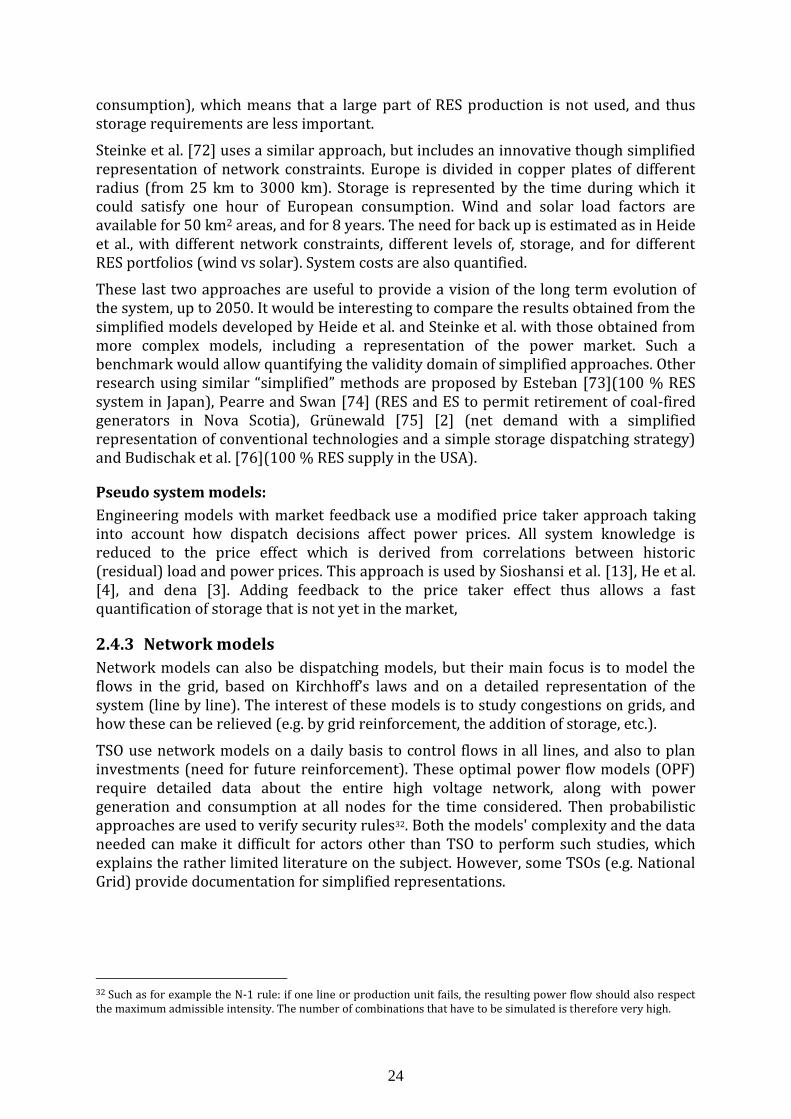
24
consumption), which means that a large part of RES production is not used, and thus storage requirements are less important.
Steinke et al. [72] uses a similar approach, but includes an innovative though simplified representation of network constraints. Europe is divided in copper plates of different radius (from 25 km to 3000 km). Storage is represented by the time during which it could satisfy one hour of European consumption. Wind and solar load factors are available for 50 km2 areas, and for 8 years. The need for back up is estimated as in Heide et al., with different network constraints, different levels of, storage, and for different RES portfolios (wind vs solar). System costs are also quantified.
These last two approaches are useful to provide a vision of the long term evolution of the system, up to 2050. It would be interesting to compare the results obtained from the simplified models developed by Heide et al. and Steinke et al. with those obtained from more complex models, including a representation of the power market. Such a benchmark would allow quantifying the validity domain of simplified approaches. Other research using similar “simplified” methods are proposed by Esteban [73](100 % RES system in Japan), Pearre and Swan [74] (RES and ES to permit retirement of coal-fired generators in Nova Scotia), Grünewald [75] [2] (net demand with a simplified representation of conventional technologies and a simple storage dispatching strategy) and Budischak et al. [76](100 % RES supply in the USA).
Pseudo system models:
Engineering models with market feedback use a modified price taker approach taking into account how dispatch decisions affect power prices. All system knowledge is reduced to the price effect which is derived from correlations between historic (residual) load and power prices. This approach is used by Sioshansi et al. [13], He et al. [4], and dena [3]. Adding feedback to the price taker effect thus allows a fast quantification of storage that is not yet in the market,
2.4.3 Network models
Network models can also be dispatching models, but their main focus is to model the flows in the grid, based on Kirchhoff’s laws and on a detailed representation of the system (line by line). The interest of these models is to study congestions on grids, and how these can be relieved (e.g. by grid reinforcement, the addition of storage, etc.).
TSO use network models on a daily basis to control flows in all lines, and also to plan investments (need for future reinforcement). These optimal power flow models (OPF) require detailed data about the entire high voltage network, along with power generation and consumption at all nodes for the time considered. Then probabilistic approaches are used to verify security rules32. Both the models' complexity and the data needed can make it difficult for actors other than TSO to perform such studies, which explains the rather limited literature on the subject. However, some TSOs (e.g. National Grid) provide documentation for simplified representations.
32 Such as for example the N-1 rule: if one line or production unit fails, the resulting power flow should also respect the maximum admissible intensity. The number of combinations that have to be simulated is therefore very high.
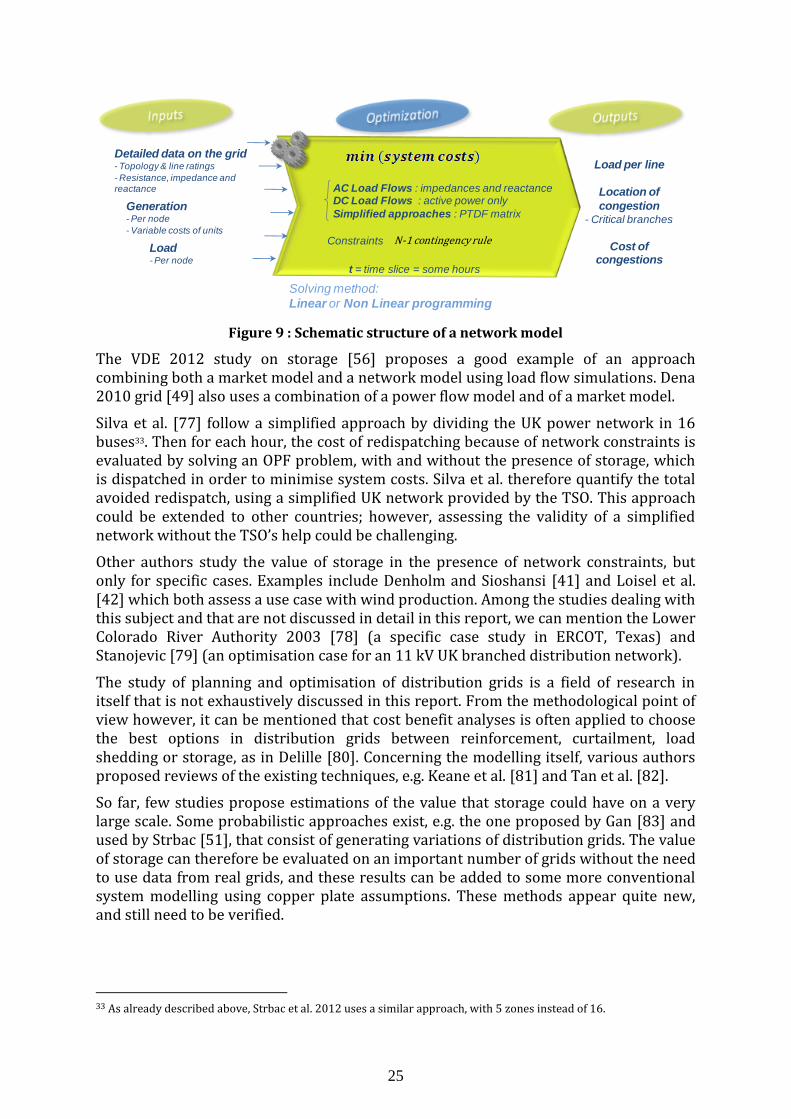
25
Figure 9 : Schematic structure of a network model
The VDE 2012 study on storage [56] proposes a good example of an approach combining both a market model and a network model using load flow simulations. Dena 2010 grid [49] also uses a combination of a power flow model and of a market model.
Silva et al. [77] follow a simplified approach by dividing the UK power network in 16 buses33. Then for each hour, the cost of redispatching because of network constraints is evaluated by solving an OPF problem, with and without the presence of storage, which is dispatched in order to minimise system costs. Silva et al. therefore quantify the total avoided redispatch, using a simplified UK network provided by the TSO. This approach could be extended to other countries; however, assessing the validity of a simplified network without the TSO’s help could be challenging.
Other authors study the value of storage in the presence of network constraints, but only for specific cases. Examples include Denholm and Sioshansi [41] and Loisel et al. [42] which both assess a use case with wind production. Among the studies dealing with this subject and that are not discussed in detail in this report, we can mention the Lower Colorado River Authority 2003 [78] (a specific case study in ERCOT, Texas) and Stanojevic [79] (an optimisation case for an 11 kV UK branched distribution network).
The study of planning and optimisation of distribution grids is a field of research in itself that is not exhaustively discussed in this report. From the methodological point of view however, it can be mentioned that cost benefit analyses is often applied to choose the best options in distribution grids between reinforcement, curtailment, load shedding or storage, as in Delille [80]. Concerning the modelling itself, various authors proposed reviews of the existing techniques, e.g. Keane et al. [81] and Tan et al. [82].
So far, few studies propose estimations of the value that storage could have on a very large scale. Some probabilistic approaches exist, e.g. the one proposed by Gan [83] and used by Strbac [51], that consist of generating variations of distribution grids. The value of storage can therefore be evaluated on an important number of grids without the need to use data from real grids, and these results can be added to some more conventional system modelling using copper plate assumptions. These methods appear quite new, and still need to be verified.
33 As already described above, Strbac et al. 2012 uses a similar approach, with 5 zones instead of 16.
Solving method:
Linear or Non Linear programming
Generation- Per node
- Variable costs of units
Load- Per node
Load per line
Location of
congestion- Critical branches
Cost of congestions
t = time slice = some hours
Detailed data on the grid- Topology & line ratings
- Resistance, impedance and reactance
N-1 contingency ruleConstraints
AC Load Flows : impedances and reactance DC Load Flows : active power only
Simplified approaches : PTDF matrix

26
2.4.4 Methods for island systems
A number of studies concern the value of storage for small autonomous electricity networks. There are usually no markets in islanded systems as for practical reasons derogations were allowed by most legislations regarding deregulation and unbundling requirements. As a result, most island studies fall in the category of system models. Island power systems are also considered as a test case for the deployment of both RES-E and storage by the power industry as described by EURELCTRIC [84].
Examples of island studies include Kaldellis et al. ( [85] and previous work), Kapsalli et al. [86], Lobato et al. [87] (economic assessment of providing primary reserve with energy storage in isolated systems), Carapellucci et al. [88] (modelling and optimisation of an energy generation island with renewable and H2).
In such systems, specific constraints need to be taken into account, such as low levels of inertia that would require levels of ancillary services not needed on large interconnected systems. Delille et al. [89] provides a good example of how storage could provide a form of virtual inertia – a detailed model of an islanded system is used, and the impact of a unit failure on frequency is assessed through dynamic simulations
27
3 Profitability of Electricity Storage
3.1 Motivation for studying storage profitability
The purpose of this chapter is to provide an overview of the current studies on the profitability of storage investments and of their findings, along with identifying gaps and issues for further research activities. Storage has been a full part of power systems for a long time, as it was originally developed along with base-load generation However, the renewed interest in storage of the last years comes from two major trends: breakthroughs in storage technologies and increasing shares of RES generation. These drivers led utilities, researchers and policy makers to look at storage under a new perspective34.
The growing share of intermittent renewable generation in the power system increases the need for flexibility options thus potentially for storage. Changes in the generation portfolio (e.g. the decommissioning of nuclear and coal power stations) might also impact the flexibility of the system. .A number of studies assesses the future market size for electricity storage resulting from RES-E additions, e.g. PNNL [25].
At the same time, the appearance of new technologies suggests that specific investment cost of storage could go down. Adiabatic CAES and electrochemical storage (Li-ion, NaS batteries, etc.) are in the focus of many R&D projects.
In addition to these two drivers, the deregulation of the power industry increased the need to study the economics of energy storage. Markets were created on which storage can generate revenues, but boundaries were also created (e.g. regulated vs. deregulated activities), making it more complex to determine the value of storage. Therefore, a need to understand the “new” business cases for storage emerged.
The results obtained in storage profitability studies are of relevance to three broad groups of stakeholders:
Storage investors
Policymakers
Researchers or consultants
Most of the published literature comes from the last group but is motivated or commissioned by either potential investors (in case of the CAES study by Fraunhofer [23] which was financed by German utilities) or somehow serves as policy support (e.g. dena distribution grid study [59]),. Academics and consultants involved in energy systems R&D typically explore options for future energy systems, develop scenarios and possible pathways in the continuous transformation of energy system or consider the interaction between technology, business and regulation. The perspective of the two potential client stakeholders slightly differs.
Storage investors or developers of technology aim at understanding revenue streams over the economic life of the investment in support of the decision making. Uncertainty of future earnings is often referred to as one of the main barriers to technology deployment and further development (see e.g. in the EU Commissions Public
34 Other motivations for the investment in power storage can be occasionally found e.g. in China and India where storage is also regarded as an alternative to provide peak power in a system with a large coal and nuclear share, as discussed by e.g. Ming et al. [124], Sivakumar et al. [152])
28
Consultation on Generation Adequacy, Capacity Mechanisms and the Internal Market in Electricity [90], ENDESA 2012 [91]. The perspective of policy makers and regulators is different. They are in charge to set fair and harmonised rules across the value chain segments of the power system and have to understand their rulings' implications for all market participants.
A possible classification of storage studies can be done with respect to the boundary drawn around the object studied. In this report we distinguish between two approaches. Firstly there are those studies that assess the techno-economic effects produced directly by the storage investment on the economic and financial situation of the investor. In this case the profitability of the investment could also be derived by analysing the balance sheet of the investor all along the economic life of the storage project, if this was available. Secondly there are studies evaluating the "extended" net benefits of a specific storage project by addressing system effects (that can be attributed unambiguously to the storage operation). Most of those studies take into account only part of the power system value chain (see Table 3), while some attempt at a more ambitious goal by including benefits on the entire power system. From this categorisation two broad families of studies can be identified, as already introduced in Chapter 2 of this report.
Engineering studies ask if the investment on a specific storage project would be adequately remunerated from an investor's point of view. This approach aims at maximizing the investor's profit under specific technical constraints. The investor's profit is given by the difference between storage revenues and the fixed and variable costs of the investment. Constraints exist in the form of e.g. the efficiency of charging and discharging the storage, ramping rates, minimum and maximum reservoir levels or grid connection constraints. Further differentiation can be made by the number of services, provided by storage in the model. The system around the storage interacts through price signals, demand and possible technical constraints like a maximum power rating of a grid connection. Engineering studies are discussed in the first part of this chapter.
System studies aim at identifying the economic benefits of adding storage to the power system as a whole. In this case, the objective function is given by total system costs which are minimised. Total system costs are considered in this approach as storage is embedded in the system and affects system costs directly and indirectly through its influence on market signals (commodity prices, power demand and supply, etc.) and system infrastructure operation (e.g. grid connections at transmission and distribution levels). Further differentiation is possible with regard to the system boundaries which can range from a region's power plant portfolio to an entire energy system including industry, the heating sector and transport. The second part of this chapter is dedicated to system studies.
Engineering studies often confine the economic value of a storage device to only one of its possible applications (e.g. power market arbitrage); this could lead to underestimation of the potential of the storage.
On the other hand, the challenge faced by system studies is the comprehensive identification of benefits and beneficiaries of storage services. In only one of the studies reviewed (Denholm et al. 2013 [92]), both a system and engineering study methodology is applied to the same case leading to significantly different results.
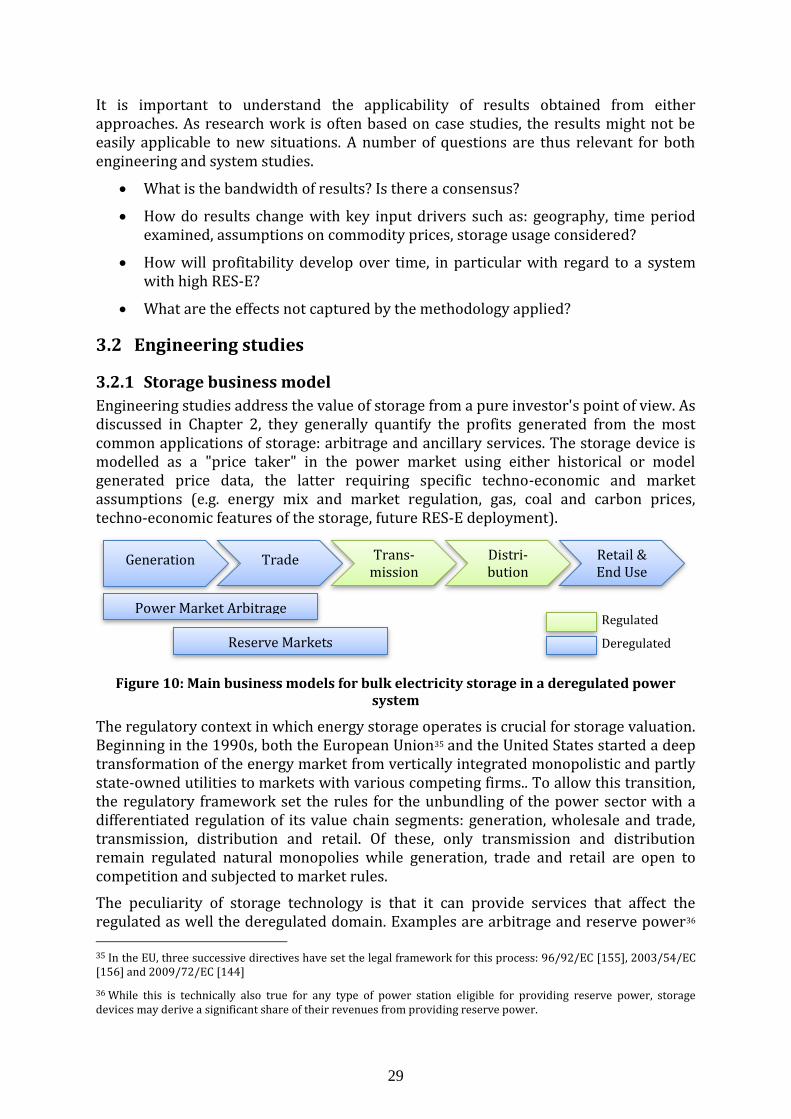
29
It is important to understand the applicability of results obtained from either approaches. As research work is often based on case studies, the results might not be easily applicable to new situations. A number of questions are thus relevant for both engineering and system studies.
What is the bandwidth of results? Is there a consensus?
How do results change with key input drivers such as: geography, time period examined, assumptions on commodity prices, storage usage considered?
How will profitability develop over time, in particular with regard to a system with high RES-E?
What are the effects not captured by the methodology applied?
3.2 Engineering studies
3.2.1 Storage business model
Engineering studies address the value of storage from a pure investor's point of view. As discussed in Chapter 2, they generally quantify the profits generated from the most common applications of storage: arbitrage and ancillary services. The storage device is modelled as a "price taker" in the power market using either historical or model generated price data, the latter requiring specific techno-economic and market assumptions (e.g. energy mix and market regulation, gas, coal and carbon prices, techno-economic features of the storage, future RES-E deployment).
Figure 10: Main business models for bulk electricity storage in a deregulated power system
The regulatory context in which energy storage operates is crucial for storage valuation. Beginning in the 1990s, both the European Union35 and the United States started a deep transformation of the energy market from vertically integrated monopolistic and partly state-owned utilities to markets with various competing firms.. To allow this transition, the regulatory framework set the rules for the unbundling of the power sector with a differentiated regulation of its value chain segments: generation, wholesale and trade, transmission, distribution and retail. Of these, only transmission and distribution remain regulated natural monopolies while generation, trade and retail are open to competition and subjected to market rules.
The peculiarity of storage technology is that it can provide services that affect the regulated as well the deregulated domain. Examples are arbitrage and reserve power36 35 In the EU, three successive directives have set the legal framework for this process: 96/92/EC [155], 2003/54/EC [156] and 2009/72/EC [144]
36 While this is technically also true for any type of power station eligible for providing reserve power, storage devices may derive a significant share of their revenues from providing reserve power.
Retail & End Use
Trans-mission
Generation Trade Distri-bution
Power Market Arbitrage
Reserve Markets
Regulated
Deregulated
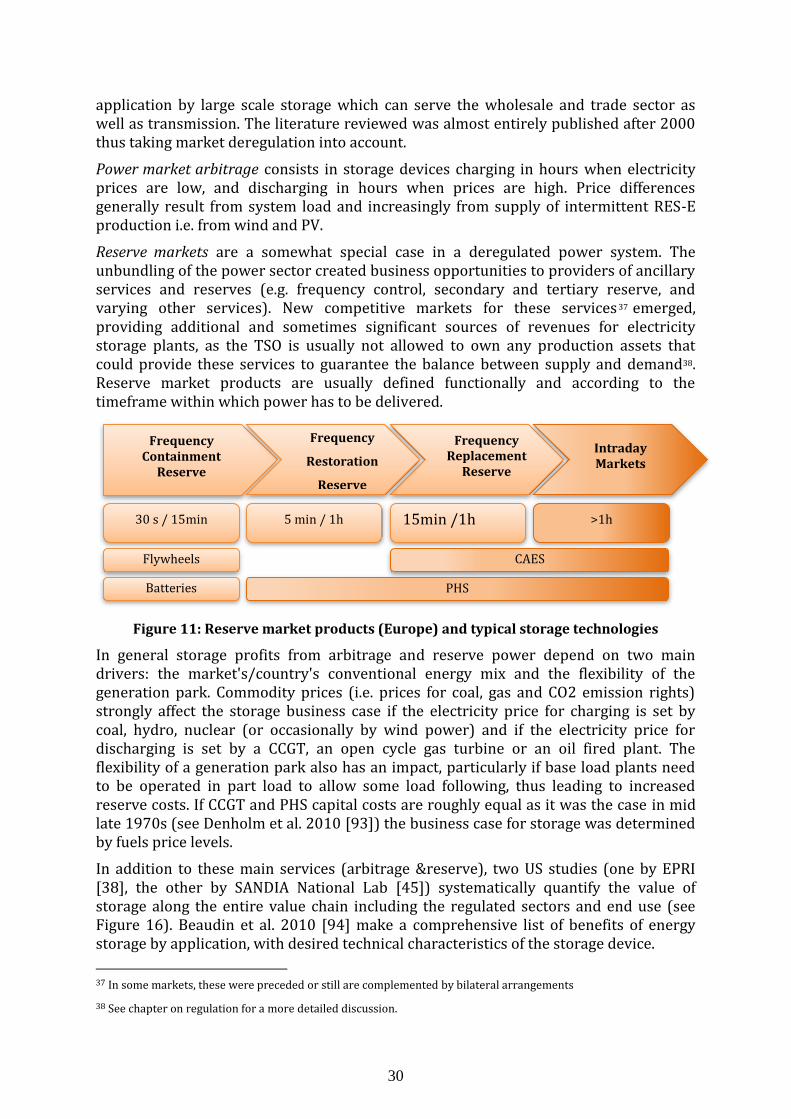
30
application by large scale storage which can serve the wholesale and trade sector as well as transmission. The literature reviewed was almost entirely published after 2000 thus taking market deregulation into account.
Power market arbitrage consists in storage devices charging in hours when electricity prices are low, and discharging in hours when prices are high. Price differences generally result from system load and increasingly from supply of intermittent RES-E production i.e. from wind and PV.
Reserve markets are a somewhat special case in a deregulated power system. The unbundling of the power sector created business opportunities to providers of ancillary services and reserves (e.g. frequency control, secondary and tertiary reserve, and varying other services). New competitive markets for these services 37 emerged, providing additional and sometimes significant sources of revenues for electricity storage plants, as the TSO is usually not allowed to own any production assets that could provide these services to guarantee the balance between supply and demand38. Reserve market products are usually defined functionally and according to the timeframe within which power has to be delivered.
Figure 11: Reserve market products (Europe) and typical storage technologies
In general storage profits from arbitrage and reserve power depend on two main drivers: the market's/country's conventional energy mix and the flexibility of the generation park. Commodity prices (i.e. prices for coal, gas and CO2 emission rights) strongly affect the storage business case if the electricity price for charging is set by coal, hydro, nuclear (or occasionally by wind power) and if the electricity price for discharging is set by a CCGT, an open cycle gas turbine or an oil fired plant. The flexibility of a generation park also has an impact, particularly if base load plants need to be operated in part load to allow some load following, thus leading to increased reserve costs. If CCGT and PHS capital costs are roughly equal as it was the case in mid late 1970s (see Denholm et al. 2010 [93]) the business case for storage was determined by fuels price levels.
In addition to these main services (arbitrage &reserve), two US studies (one by EPRI [38], the other by SANDIA National Lab [45]) systematically quantify the value of storage along the entire value chain including the regulated sectors and end use (see Figure 16). Beaudin et al. 2010 [94] make a comprehensive list of benefits of energy storage by application, with desired technical characteristics of the storage device.
37 In some markets, these were preceded or still are complemented by bilateral arrangements
38 See chapter on regulation for a more detailed discussion.
Frequency Replacement
Reserve
Frequency Containment
Reserve
Frequency
Restoration
Reserve
Intraday Markets
30 s / 15min 5 min / 1h 15min /1h >1h
CAES
PHS
Flywheels
Batteries
31
3.2.2 Technology scope
Figure 11shows particular reserve products provided by certain storage technologies. Batteries and flywheels are mainly used for primary reserve (also frequency control in the US) due their fast reaction capability and their (in general) limited storage capacity as e.g. in several projects on European Islands as described in a report by EURELECTRIC [84]. Due to the relatively slow reaction time, CAES is usually not able to participate in secondary reserve while PHS is providing secondary reserve in some countries.
This report focuses mainly on bulk storage: Pumped Hydro Storage (PHS) and Compressed Air Electricity Storage (CAES). These are the only electricity storage technologies that are or could be deployed in the range of several hundreds of MW today.
The results of the engineering studies are presented by technology in a first step, given different investment costs, variable costs and income streams. Though both technologies are suited for providing arbitrage and reserve power, there are differences in the value drivers.
PHS incurs almost no variable costs other than the costs for the power purchased for pumping water into the reservoir. CAES in the so-called diabatic version also consumes natural gas and might require emission certificates.
The round trip efficiency of PHS is usually higher than CAES allowing arbitrage between lower power prices differences thus during a larger number of hours. Also, self-discharge is higher for CAES, in particular in the adiabatic case39.
Investment costs and the certainty with which these are known differ between mature PHS, diabatic CAES deployed only twice on a global scale, and not yet deployed adiabatic CAES.
Less mainstream storage technologies like batteries (especially NaS, Pb-acid and Li-ion) and flywheels are usually considered for distributed deployment and in small island power grids, which are both outside the scope of this literature study. However, references to recent studies have been included where these technologies are proposed for the transmission grid (PNNL 2012 [25], Walawalkar 2007 [22]). A separate section discusses the results the studies by EPRI [38] and SANDIA [45] which derive cross sector value pools in a technology neutral way.
3.2.3 Pumped Hydro Storage
Table 1 shows the main characteristic of pumped hydro engineering studies in terms of market, years and services. The studies are based on historic market data (from Europe, the US and Australia) except for Loisel et al. 2010 [42] and PNNL 2012 [25] which use market model generated prices. Revenue sources considered are power market arbitrage, reserve markets, capacity payments (where these exist) and other revenues.
The graphs in Figure 12 show the profitability figures of those studies providing data in sufficient detail to be represented in one graph. The bars in the diagram represent the ranges of annual gross margins found within one study. It is calculated as the difference between storage profits and variable plus fixed O&M costs per kW of installed (turbine) capacity. If a study does not explicitly state annual storage revenues, these are
39 Linked to the thermal storage.
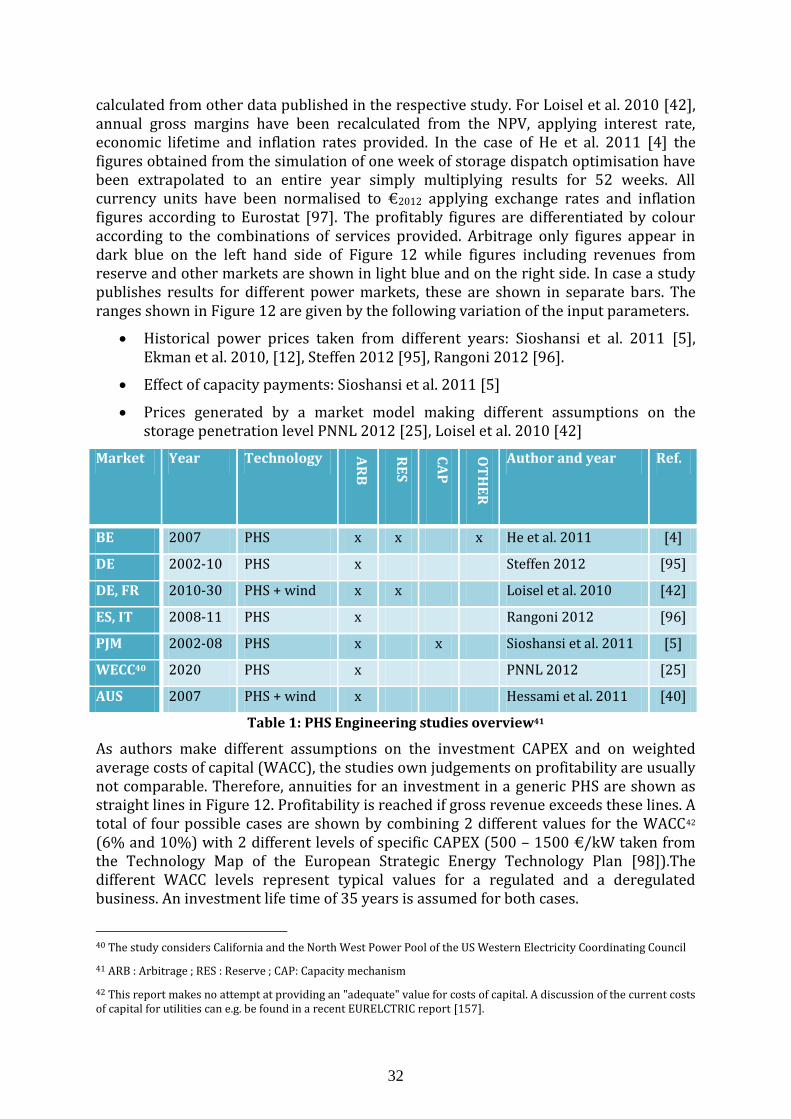
32
calculated from other data published in the respective study. For Loisel et al. 2010 [42], annual gross margins have been recalculated from the NPV, applying interest rate, economic lifetime and inflation rates provided. In the case of He et al. 2011 [4] the figures obtained from the simulation of one week of storage dispatch optimisation have been extrapolated to an entire year simply multiplying results for 52 weeks. All currency units have been normalised to €2012 applying exchange rates and inflation figures according to Eurostat [97]. The profitably figures are differentiated by colour according to the combinations of services provided. Arbitrage only figures appear in dark blue on the left hand side of Figure 12 while figures including revenues from reserve and other markets are shown in light blue and on the right side. In case a study publishes results for different power markets, these are shown in separate bars. The ranges shown in Figure 12 are given by the following variation of the input parameters.
Historical power prices taken from different years: Sioshansi et al. 2011 [5], Ekman et al. 2010, [12], Steffen 2012 [95], Rangoni 2012 [96].
Effect of capacity payments: Sioshansi et al. 2011 [5]
Prices generated by a market model making different assumptions on the storage penetration level PNNL 2012 [25], Loisel et al. 2010 [42]
Market Year Technology AR
B
RE
S
CA
P
OT
HE
R
Author and year Ref.
BE 2007 PHS x x x He et al. 2011 [4]
DE 2002-10 PHS x Steffen 2012 [95]
DE, FR 2010-30 PHS + wind x x Loisel et al. 2010 [42]
ES, IT 2008-11 PHS x Rangoni 2012 [96]
PJM 2002-08 PHS x x Sioshansi et al. 2011 [5]
WECC40 2020 PHS x PNNL 2012 [25]
AUS 2007 PHS + wind x Hessami et al. 2011 [40]
Table 1: PHS Engineering studies overview41
As authors make different assumptions on the investment CAPEX and on weighted average costs of capital (WACC), the studies own judgements on profitability are usually not comparable. Therefore, annuities for an investment in a generic PHS are shown as straight lines in Figure 12. Profitability is reached if gross revenue exceeds these lines. A total of four possible cases are shown by combining 2 different values for the WACC42 (6% and 10%) with 2 different levels of specific CAPEX (500 – 1500 €/kW taken from the Technology Map of the European Strategic Energy Technology Plan [98]).The different WACC levels represent typical values for a regulated and a deregulated business. An investment life time of 35 years is assumed for both cases.
40 The study considers California and the North West Power Pool of the US Western Electricity Coordinating Council
41 ARB : Arbitrage ; RES : Reserve ; CAP: Capacity mechanism
42 This report makes no attempt at providing an "adequate" value for costs of capital. A discussion of the current costs of capital for utilities can e.g. be found in a recent EURELCTRIC report [157].
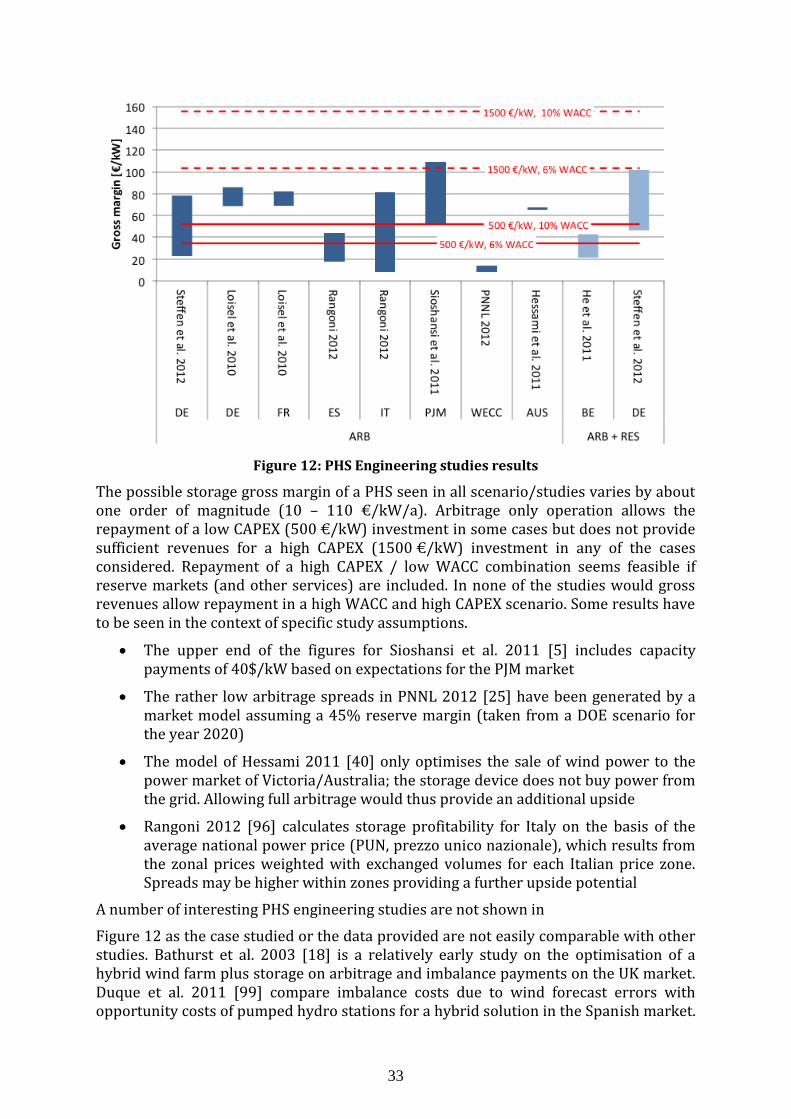
33
Figure 12: PHS Engineering studies results
The possible storage gross margin of a PHS seen in all scenario/studies varies by about one order of magnitude (10 – 110 €/kW/a). Arbitrage only operation allows the repayment of a low CAPEX (500 €/kW) investment in some cases but does not provide sufficient revenues for a high CAPEX (1500 €/kW) investment in any of the cases considered. Repayment of a high CAPEX / low WACC combination seems feasible if reserve markets (and other services) are included. In none of the studies would gross revenues allow repayment in a high WACC and high CAPEX scenario. Some results have to be seen in the context of specific study assumptions.
The upper end of the figures for Sioshansi et al. 2011 [5] includes capacity payments of 40$/kW based on expectations for the PJM market
The rather low arbitrage spreads in PNNL 2012 [25] have been generated by a market model assuming a 45% reserve margin (taken from a DOE scenario for the year 2020)
The model of Hessami 2011 [40] only optimises the sale of wind power to the power market of Victoria/Australia; the storage device does not buy power from the grid. Allowing full arbitrage would thus provide an additional upside
Rangoni 2012 [96] calculates storage profitability for Italy on the basis of the average national power price (PUN, prezzo unico nazionale), which results from the zonal prices weighted with exchanged volumes for each Italian price zone. Spreads may be higher within zones providing a further upside potential
A number of interesting PHS engineering studies are not shown in
Figure 12 as the case studied or the data provided are not easily comparable with other studies. Bathurst et al. 2003 [18] is a relatively early study on the optimisation of a hybrid wind farm plus storage on arbitrage and imbalance payments on the UK market. Duque et al. 2011 [99] compare imbalance costs due to wind forecast errors with opportunity costs of pumped hydro stations for a hybrid solution in the Spanish market.
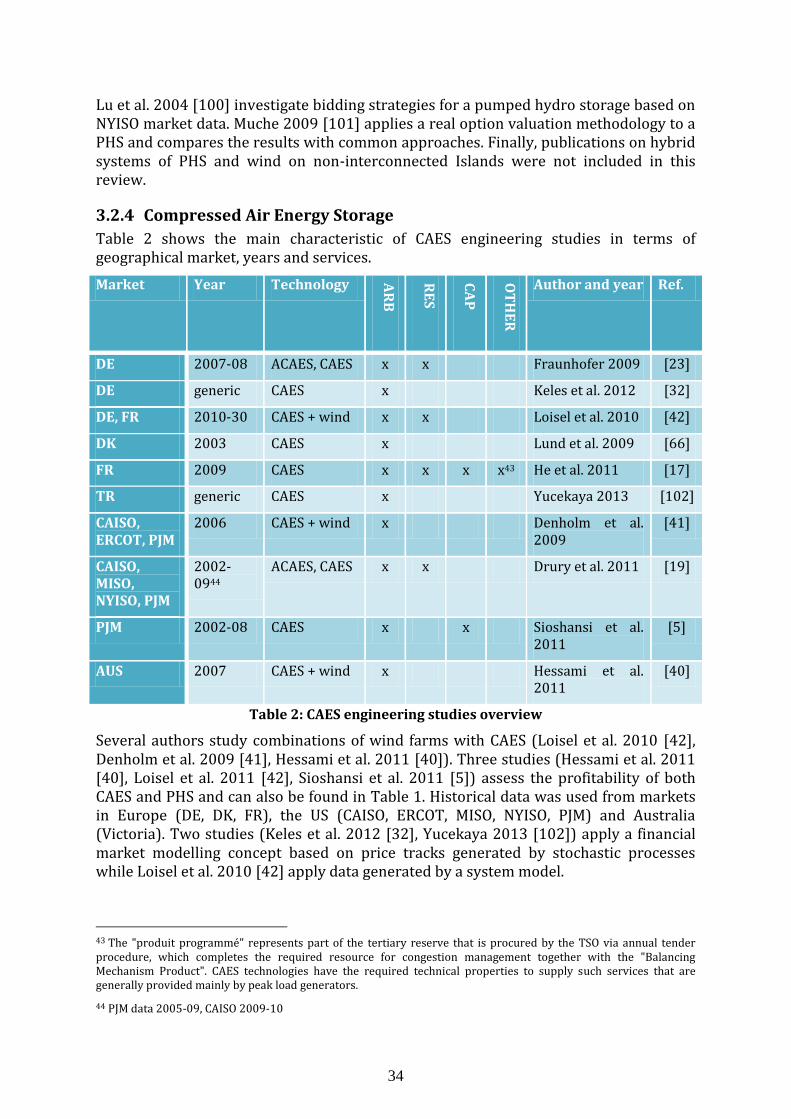
34
Lu et al. 2004 [100] investigate bidding strategies for a pumped hydro storage based on NYISO market data. Muche 2009 [101] applies a real option valuation methodology to a PHS and compares the results with common approaches. Finally, publications on hybrid systems of PHS and wind on non-interconnected Islands were not included in this review.
3.2.4 Compressed Air Energy Storage
Table 2 shows the main characteristic of CAES engineering studies in terms of geographical market, years and services.
Market Year Technology AR
B
RE
S
CA
P
OT
HE
R
Author and year Ref.
DE 2007-08 ACAES, CAES x x Fraunhofer 2009 [23]
DE generic CAES x Keles et al. 2012 [32]
DE, FR 2010-30 CAES + wind x x Loisel et al. 2010 [42]
DK 2003 CAES x Lund et al. 2009 [66]
FR 2009 CAES x x x x43 He et al. 2011 [17]
TR generic CAES x Yucekaya 2013 [102]
CAISO, ERCOT, PJM
2006 CAES + wind x Denholm et al. 2009
[41]
CAISO, MISO, NYISO, PJM
2002-0944
ACAES, CAES x x Drury et al. 2011 [19]
PJM 2002-08 CAES x x Sioshansi et al. 2011
[5]
AUS 2007 CAES + wind x Hessami et al. 2011
[40]
Table 2: CAES engineering studies overview
Several authors study combinations of wind farms with CAES (Loisel et al. 2010 [42], Denholm et al. 2009 [41], Hessami et al. 2011 [40]). Three studies (Hessami et al. 2011 [40], Loisel et al. 2011 [42], Sioshansi et al. 2011 [5]) assess the profitability of both CAES and PHS and can also be found in Table 1. Historical data was used from markets in Europe (DE, DK, FR), the US (CAISO, ERCOT, MISO, NYISO, PJM) and Australia (Victoria). Two studies (Keles et al. 2012 [32], Yucekaya 2013 [102]) apply a financial market modelling concept based on price tracks generated by stochastic processes while Loisel et al. 2010 [42] apply data generated by a system model.
43 The "produit programmé" represents part of the tertiary reserve that is procured by the TSO via annual tender procedure, which completes the required resource for congestion management together with the "Balancing Mechanism Product". CAES technologies have the required technical properties to supply such services that are generally provided mainly by peak load generators.
44 PJM data 2005-09, CAISO 2009-10
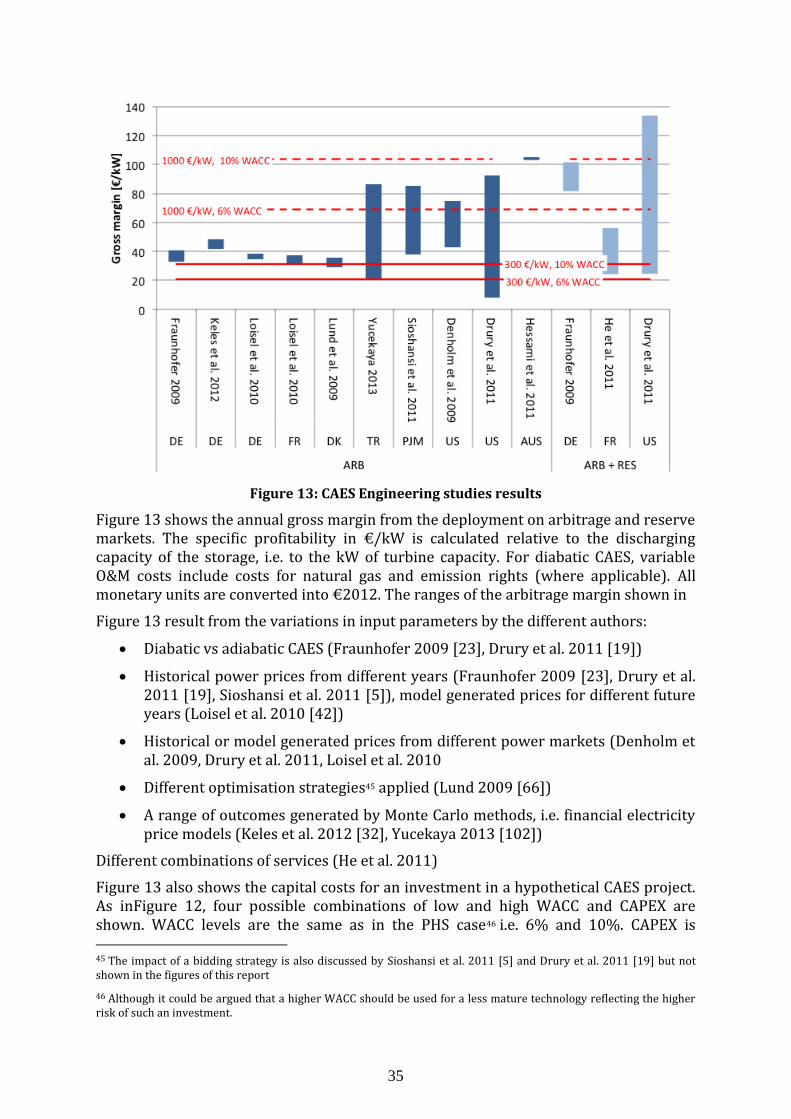
35
Figure 13: CAES Engineering studies results
Figure 13 shows the annual gross margin from the deployment on arbitrage and reserve markets. The specific profitability in €/kW is calculated relative to the discharging capacity of the storage, i.e. to the kW of turbine capacity. For diabatic CAES, variable O&M costs include costs for natural gas and emission rights (where applicable). All monetary units are converted into €2012. The ranges of the arbitrage margin shown in
Figure 13 result from the variations in input parameters by the different authors:
Diabatic vs adiabatic CAES (Fraunhofer 2009 [23], Drury et al. 2011 [19])
Historical power prices from different years (Fraunhofer 2009 [23], Drury et al. 2011 [19], Sioshansi et al. 2011 [5]), model generated prices for different future years (Loisel et al. 2010 [42])
Historical or model generated prices from different power markets (Denholm et al. 2009, Drury et al. 2011, Loisel et al. 2010
Different optimisation strategies45 applied (Lund 2009 [66])
A range of outcomes generated by Monte Carlo methods, i.e. financial electricity price models (Keles et al. 2012 [32], Yucekaya 2013 [102])
Different combinations of services (He et al. 2011)
Figure 13 also shows the capital costs for an investment in a hypothetical CAES project. As inFigure 12, four possible combinations of low and high WACC and CAPEX are shown. WACC levels are the same as in the PHS case46 i.e. 6% and 10%. CAPEX is 45 The impact of a bidding strategy is also discussed by Sioshansi et al. 2011 [5] and Drury et al. 2011 [19] but not shown in the figures of this report
46 Although it could be argued that a higher WACC should be used for a less mature technology reflecting the higher risk of such an investment.
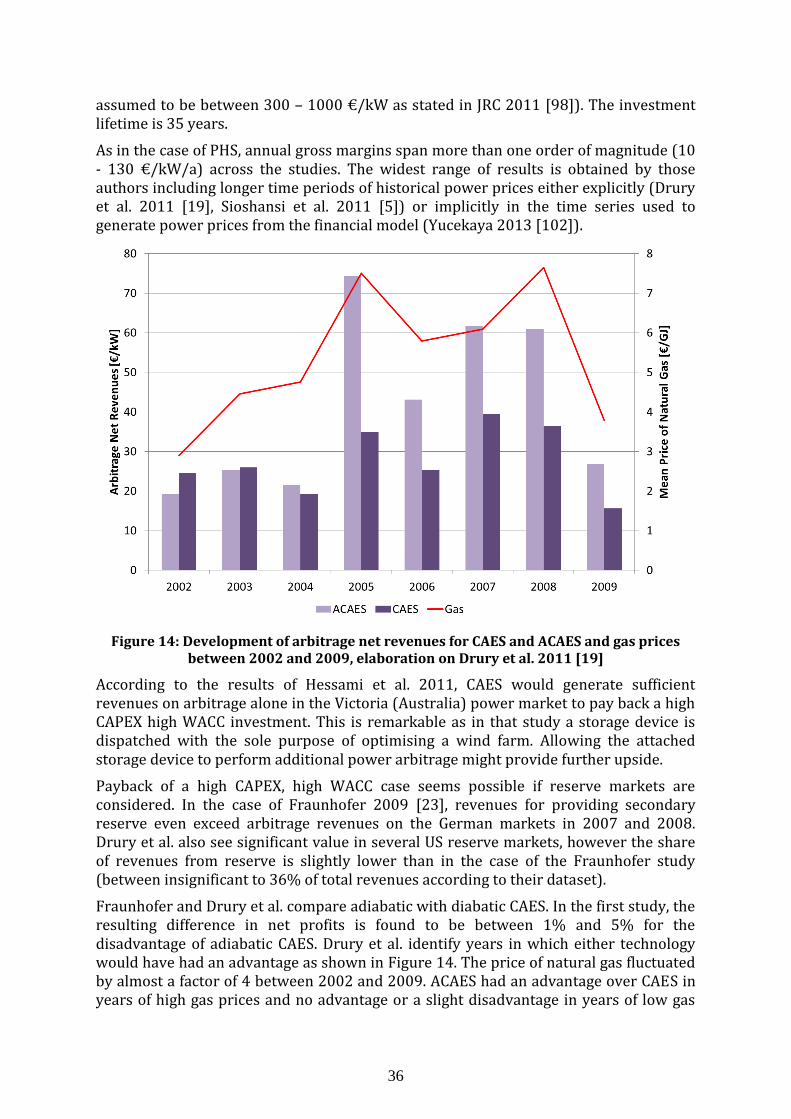
36
assumed to be between 300 – 1000 €/kW as stated in JRC 2011 [98]). The investment lifetime is 35 years.
As in the case of PHS, annual gross margins span more than one order of magnitude (10 - 130 €/kW/a) across the studies. The widest range of results is obtained by those authors including longer time periods of historical power prices either explicitly (Drury et al. 2011 [19], Sioshansi et al. 2011 [5]) or implicitly in the time series used to generate power prices from the financial model (Yucekaya 2013 [102]).
Figure 14: Development of arbitrage net revenues for CAES and ACAES and gas prices between 2002 and 2009, elaboration on Drury et al. 2011 [19]
According to the results of Hessami et al. 2011, CAES would generate sufficient revenues on arbitrage alone in the Victoria (Australia) power market to pay back a high CAPEX high WACC investment. This is remarkable as in that study a storage device is dispatched with the sole purpose of optimising a wind farm. Allowing the attached storage device to perform additional power arbitrage might provide further upside.
Payback of a high CAPEX, high WACC case seems possible if reserve markets are considered. In the case of Fraunhofer 2009 [23], revenues for providing secondary reserve even exceed arbitrage revenues on the German markets in 2007 and 2008. Drury et al. also see significant value in several US reserve markets, however the share of revenues from reserve is slightly lower than in the case of the Fraunhofer study (between insignificant to 36% of total revenues according to their dataset).
Fraunhofer and Drury et al. compare adiabatic with diabatic CAES. In the first study, the resulting difference in net profits is found to be between 1% and 5% for the disadvantage of adiabatic CAES. Drury et al. identify years in which either technology would have had an advantage as shown in Figure 14. The price of natural gas fluctuated by almost a factor of 4 between 2002 and 2009. ACAES had an advantage over CAES in years of high gas prices and no advantage or a slight disadvantage in years of low gas
37
prices. A number of interesting CAES engineering studies are not shown in Figure 13 as the case studied or the data provided are not easily comparable with other studies.
Arsie et al. 2007 [36]study a hybrid CAES / wind power plant in Italy. The number of wind farms to be added to an (existing) CAES is optimised. Marano et al. 2012 [103] apply the model of Arsie et al. to a very small hybrid CAES-wind-PV system with an installed turbine capacity of 1 MW located in Italy.
Fertig et al. 2011 [104] assess the possibility to deploy a CAES for the optimisation of wind power sales and the provision of reserve products on two possible regions of the ERCOT market. Apart from the year 2008, for which exceptional price spikes occurred, the addition of a CAES to a wind farm does not produce sufficient extra revenues to cover capital costs.
Gatzen 2008 [105] provides a very detailed theoretical framework of power market modelling and storage and conducts empirical case studies based on the profitability of adiabatic CAES on Western European power markets during 2003 -2005. By then, the Netherlands appeared to be the most attractive market for adiabatic CAES deployment while the Nordic market is unattractive due to low power price spreads.
Lund et al. 2009 [106] compare the system value of CAES with possible arbitrage and reserve market income in Western Denmark. The market valuation is similar to the author's other study of the same year [66].
Madlener et al. 2013 [107] study combinations of a 100 MW wind farm located in Northern Germany with centralised and decentralised CAES, the latter consisting of dispersed compressor attached to small wind farms feeding a centralised storage cavern. A turbine attached to the cavern is dispatched according to markets for spot and tertiary reserve47 .The decentralised configuration is slightly less profitable than the centralised approach.
Nyamdash et al. [69] compare three operating strategies for a hybrid wind-CAES plant on the Irish market (base-load, mid-load and peak load) implying a firm power capacity during consecutive blocks of hours. None of the three operating strategies proves capable of repaying the initial investment, with the mid-load strategy showing the best relative performance. Also, storage tends to decrease the CO2 savings related to wind deployment due to a higher utilisation of base load coal and peat plants.
Mauch et al. 2012 [108] assume a future market situation in which wind farms have to fulfil the same obligations as conventional generation with respect to dispatch and scheduling. In this scenario, a CAES mitigates commitment risk and shifts production to higher price periods (excluding ancillary services and pure arbitrage). Based on data from ERCOT and MISO for 2006-09, the investment cannot be recovered in the absence of subsidies.
3.2.5 Batteries and flywheels
Only a small number of engineering studies could be found on smaller scale storage technologies. Walawalkar et al. 2007 [22] considers NaS batteries for arbitrage and flywheels for frequency control in the NYISO market based on market data from 2002-04. The analysis indicates a strong economic case for deploying both technologies on
47 This fulfils the requirements given by the German RES energy law in order to store RES without losing a feed in tariff
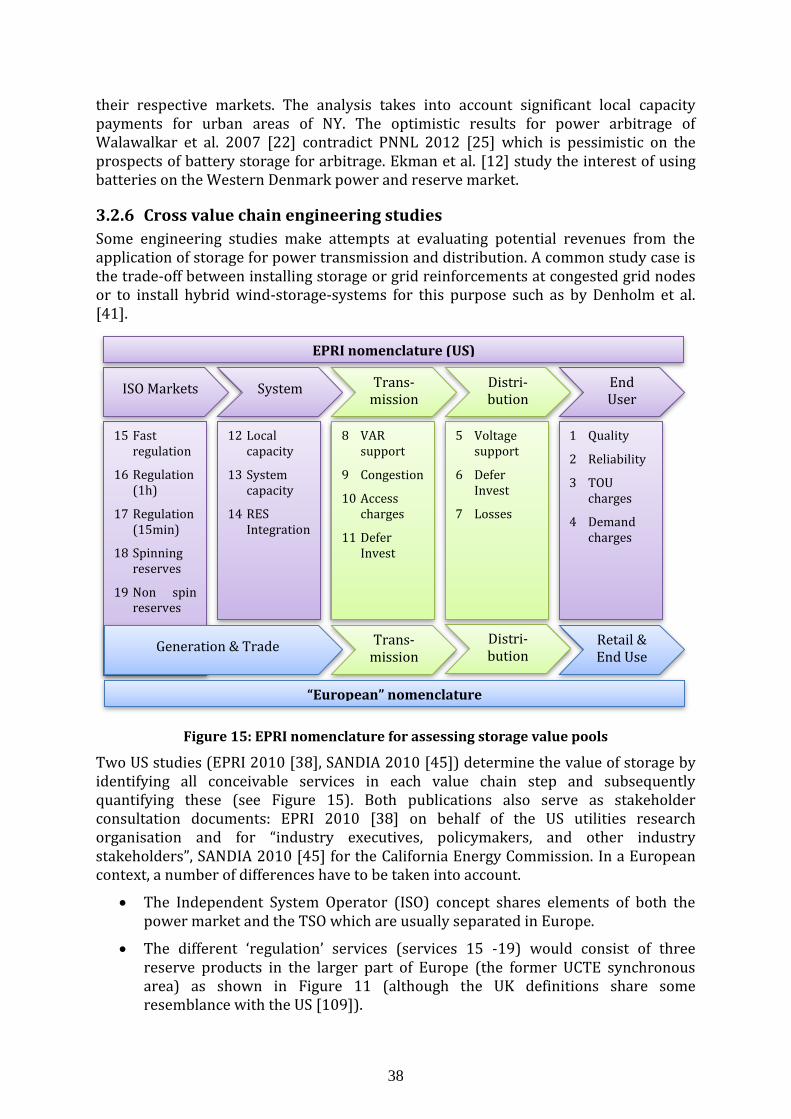
38
their respective markets. The analysis takes into account significant local capacity payments for urban areas of NY. The optimistic results for power arbitrage of Walawalkar et al. 2007 [22] contradict PNNL 2012 [25] which is pessimistic on the prospects of battery storage for arbitrage. Ekman et al. [12] study the interest of using batteries on the Western Denmark power and reserve market.
3.2.6 Cross value chain engineering studies
Some engineering studies make attempts at evaluating potential revenues from the application of storage for power transmission and distribution. A common study case is the trade-off between installing storage or grid reinforcements at congested grid nodes or to install hybrid wind-storage-systems for this purpose such as by Denholm et al. [41].
Figure 15: EPRI nomenclature for assessing storage value pools
Two US studies (EPRI 2010 [38], SANDIA 2010 [45]) determine the value of storage by identifying all conceivable services in each value chain step and subsequently quantifying these (see Figure 15). Both publications also serve as stakeholder consultation documents: EPRI 2010 [38] on behalf of the US utilities research organisation and for “industry executives, policymakers, and other industry stakeholders”, SANDIA 2010 [45] for the California Energy Commission. In a European context, a number of differences have to be taken into account.
The Independent System Operator (ISO) concept shares elements of both the power market and the TSO which are usually separated in Europe.
The different ‘regulation’ services (services 15 -19) would consist of three reserve products in the larger part of Europe (the former UCTE synchronous area) as shown in Figure 11 (although the UK definitions share some resemblance with the US [109]).
Retail & End Use
Trans-mission
12 Local capacity
13 System capacity
14 RES Integration
8 VAR support
9 Congestion
10 Access charges
11 Defer Invest
5 Voltage support
6 Defer Invest
7 Losses
15 Fast regulation
16 Regulation (1h)
17 Regulation (15min)
18 Spinning reserves
19 Non spin reserves
20 Black start
21 Arbitrage
End User
Trans-mission
ISO Markets
EPRI nomenclature (US)
System Distri-bution
1 Quality
2 Reliability
3 TOU charges
4 Demand charges
Generation & Trade Distri-bution
“European” nomenclature
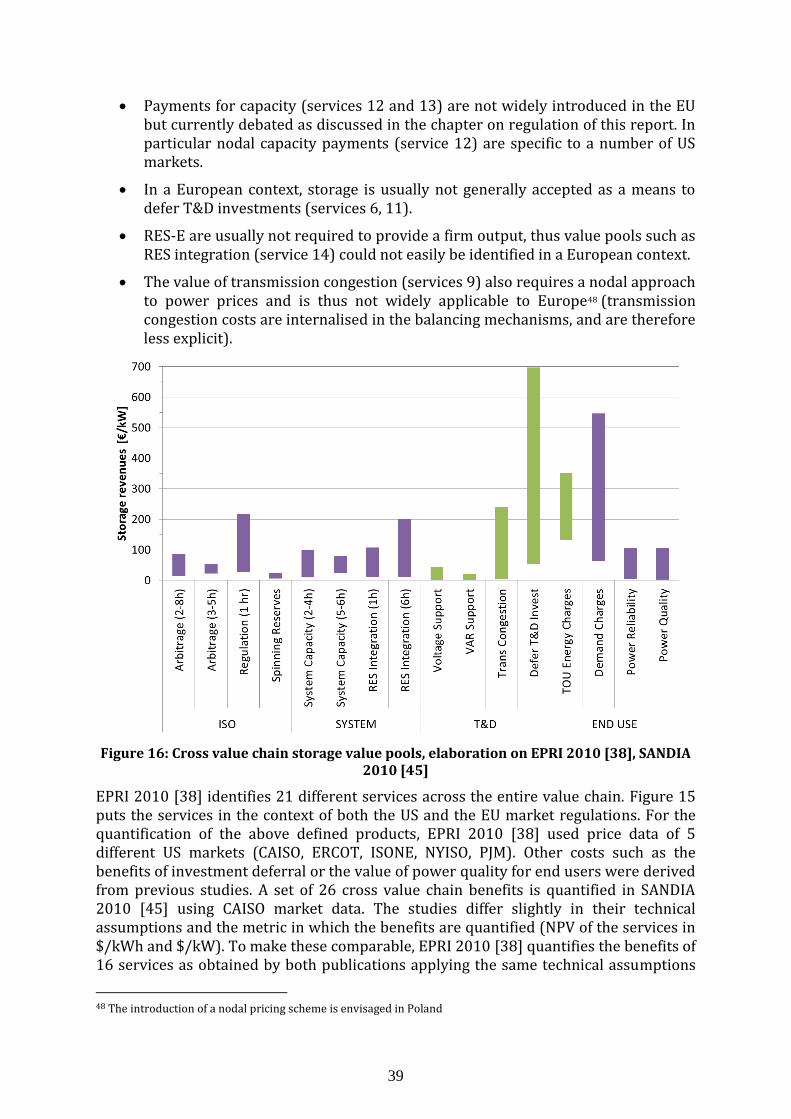
39
Payments for capacity (services 12 and 13) are not widely introduced in the EU but currently debated as discussed in the chapter on regulation of this report. In particular nodal capacity payments (service 12) are specific to a number of US markets.
In a European context, storage is usually not generally accepted as a means to defer T&D investments (services 6, 11).
RES-E are usually not required to provide a firm output, thus value pools such as RES integration (service 14) could not easily be identified in a European context.
The value of transmission congestion (services 9) also requires a nodal approach to power prices and is thus not widely applicable to Europe48 (transmission congestion costs are internalised in the balancing mechanisms, and are therefore less explicit).
Figure 16: Cross value chain storage value pools, elaboration on EPRI 2010 [38], SANDIA 2010 [45]
EPRI 2010 [38] identifies 21 different services across the entire value chain. Figure 15 puts the services in the context of both the US and the EU market regulations. For the quantification of the above defined products, EPRI 2010 [38] used price data of 5 different US markets (CAISO, ERCOT, ISONE, NYISO, PJM). Other costs such as the benefits of investment deferral or the value of power quality for end users were derived from previous studies. A set of 26 cross value chain benefits is quantified in SANDIA 2010 [45] using CAISO market data. The studies differ slightly in their technical assumptions and the metric in which the benefits are quantified (NPV of the services in $/kWh and $/kW). To make these comparable, EPRI 2010 [38] quantifies the benefits of 16 services as obtained by both publications applying the same technical assumptions
48 The introduction of a nodal pricing scheme is envisaged in Poland
40
and same metric. This data is shown in Figure 16 applying a conversion of the currency units into €2012. The bars show the range over both studies. Revenues from regulated services are shown in green, deregulated revenues in purple such as in Figure 15.
The arbitrage values shown in Figure 16 are clearly in the range of other US engineering studies (see Figure 13). The remarkably high storage value pools shown have to be seen in the context of some very specific assumptions.
Reserve market revenues ("regulation" in Figure 16) are significantly higher than e.g. assumed by Drury et al. 2011 [19] as both EPRI and SANDIA anticipate the introduction of "efficiency based remuneration" for storage leading to more than 100% higher payments.
The very high results for transmission grids have been obtained for a rather special case of mobile storage devices deferring T&D investments by several years. These mobile batteries are regularly redeployed assuming a constant need for this device somewhere.
Transmission congestion value is derived from financial transmission rights (FTR) determined at nodes with very high prices. This value pool requires the implementation of nodal pricing.
The system capacity value requires the existence of capacity markets and assumes constant high payments on these.
The value of 'RES integration' actually derives from avoided expenditures for reserve power and FTRs, which require the existence of a congested path and the existence of a nodal pricing system. SANDIA [45] quantifies the reserve costs assuming a one to one backing of a wind farm by a CCGT providing spinning reserve which might be more expensive than a provision of this from a portfolio.
End user benefits are based on value of lost load consideration of commercial customers.
The value pools may not necessarily add as they have not been optimised simultaneously. Thus it is not clear if conflicts may occur if storage should provide more than one service.
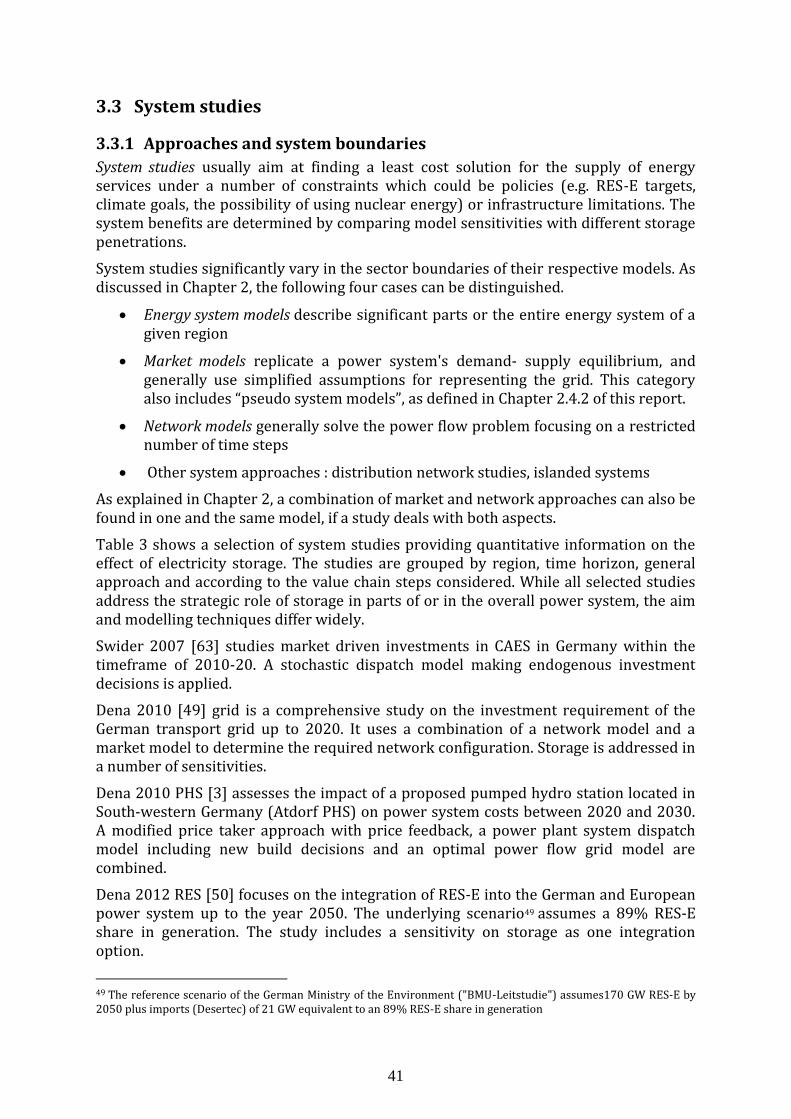
41
3.3 System studies
3.3.1 Approaches and system boundaries
System studies usually aim at finding a least cost solution for the supply of energy services under a number of constraints which could be policies (e.g. RES-E targets, climate goals, the possibility of using nuclear energy) or infrastructure limitations. The system benefits are determined by comparing model sensitivities with different storage penetrations.
System studies significantly vary in the sector boundaries of their respective models. As discussed in Chapter 2, the following four cases can be distinguished.
Energy system models describe significant parts or the entire energy system of a given region
Market models replicate a power system's demand- supply equilibrium, and generally use simplified assumptions for representing the grid. This category also includes “pseudo system models”, as defined in Chapter 2.4.2 of this report.
Network models generally solve the power flow problem focusing on a restricted number of time steps
Other system approaches : distribution network studies, islanded systems
As explained in Chapter 2, a combination of market and network approaches can also be found in one and the same model, if a study deals with both aspects.
Table 3 shows a selection of system studies providing quantitative information on the effect of electricity storage. The studies are grouped by region, time horizon, general approach and according to the value chain steps considered. While all selected studies address the strategic role of storage in parts of or in the overall power system, the aim and modelling techniques differ widely.
Swider 2007 [63] studies market driven investments in CAES in Germany within the timeframe of 2010-20. A stochastic dispatch model making endogenous investment decisions is applied.
Dena 2010 [49] grid is a comprehensive study on the investment requirement of the German transport grid up to 2020. It uses a combination of a network model and a market model to determine the required network configuration. Storage is addressed in a number of sensitivities.
Dena 2010 PHS [3] assesses the impact of a proposed pumped hydro station located in South-western Germany (Atdorf PHS) on power system costs between 2020 and 2030. A modified price taker approach with price feedback, a power plant system dispatch model including new build decisions and an optimal power flow grid model are combined.
Dena 2012 RES [50] focuses on the integration of RES-E into the German and European power system up to the year 2050. The underlying scenario49 assumes a 89% RES-E share in generation. The study includes a sensitivity on storage as one integration option.
49 The reference scenario of the German Ministry of the Environment ("BMU-Leitstudie") assumes170 GW RES-E by 2050 plus imports (Desertec) of 21 GW equivalent to an 89% RES-E share in generation
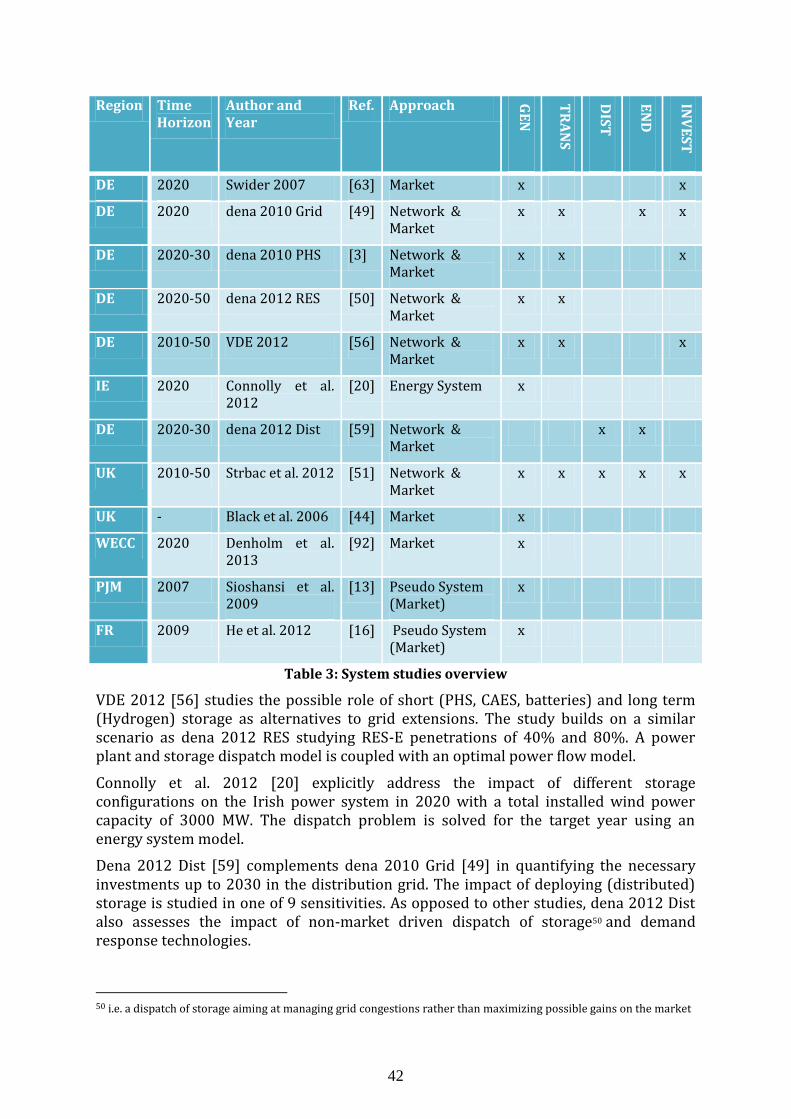
42
Region Time Horizon
Author and Year
Ref. Approach GE
N
TR
AN
S
DIS
T
EN
D
INV
ES
T
DE 2020 Swider 2007 [63] Market x x
DE 2020 dena 2010 Grid [49] Network & Market
x x x x
DE 2020-30 dena 2010 PHS [3] Network & Market
x x x
DE 2020-50 dena 2012 RES [50] Network & Market
x x
DE 2010-50 VDE 2012 [56] Network & Market
x x x
IE 2020 Connolly et al. 2012
[20] Energy System x
DE 2020-30 dena 2012 Dist [59] Network & Market
x x
UK 2010-50 Strbac et al. 2012 [51] Network & Market
x x x x x
UK - Black et al. 2006 [44] Market x
WECC 2020 Denholm et al. 2013
[92] Market x
PJM 2007 Sioshansi et al. 2009
[13] Pseudo System (Market)
x
FR 2009 He et al. 2012 [16] Pseudo System (Market)
x
Table 3: System studies overview
VDE 2012 [56] studies the possible role of short (PHS, CAES, batteries) and long term (Hydrogen) storage as alternatives to grid extensions. The study builds on a similar scenario as dena 2012 RES studying RES-E penetrations of 40% and 80%. A power plant and storage dispatch model is coupled with an optimal power flow model.
Connolly et al. 2012 [20] explicitly address the impact of different storage configurations on the Irish power system in 2020 with a total installed wind power capacity of 3000 MW. The dispatch problem is solved for the target year using an energy system model.
Dena 2012 Dist [59] complements dena 2010 Grid [49] in quantifying the necessary investments up to 2030 in the distribution grid. The impact of deploying (distributed) storage is studied in one of 9 sensitivities. As opposed to other studies, dena 2012 Dist also assesses the impact of non-market driven dispatch of storage50 and demand response technologies.
50 i.e. a dispatch of storage aiming at managing grid congestions rather than maximizing possible gains on the market
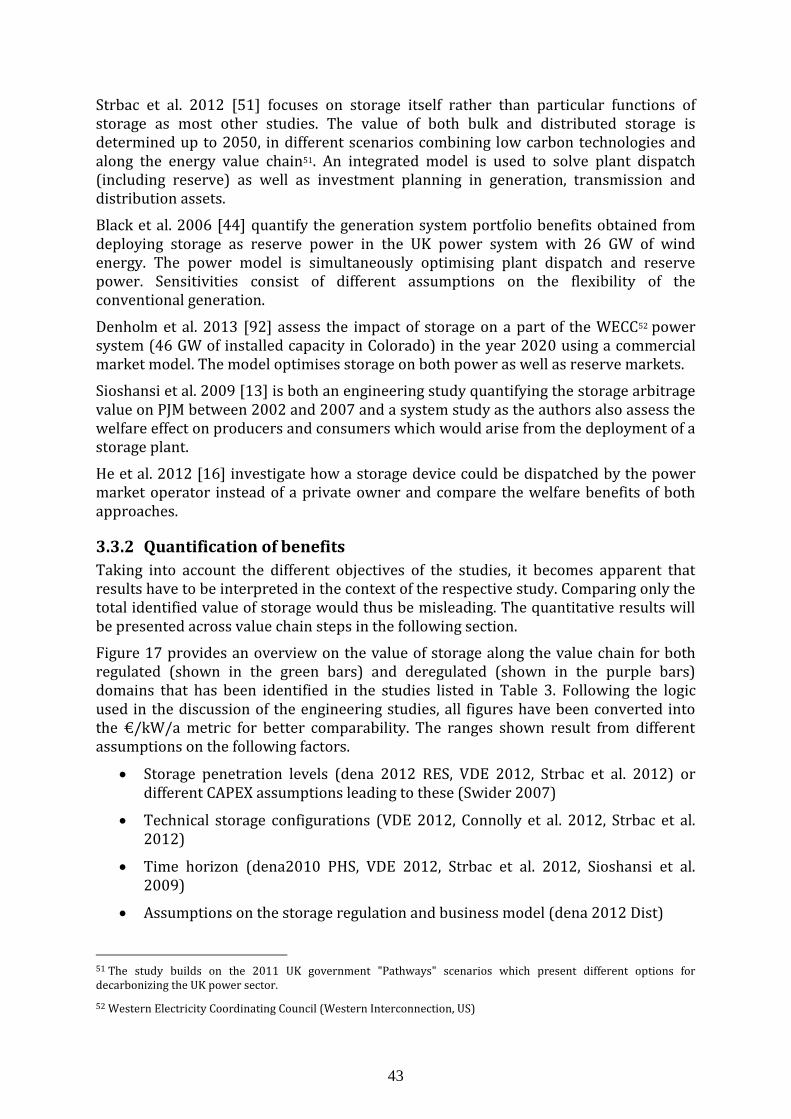
43
Strbac et al. 2012 [51] focuses on storage itself rather than particular functions of storage as most other studies. The value of both bulk and distributed storage is determined up to 2050, in different scenarios combining low carbon technologies and along the energy value chain51. An integrated model is used to solve plant dispatch (including reserve) as well as investment planning in generation, transmission and distribution assets.
Black et al. 2006 [44] quantify the generation system portfolio benefits obtained from deploying storage as reserve power in the UK power system with 26 GW of wind energy. The power model is simultaneously optimising plant dispatch and reserve power. Sensitivities consist of different assumptions on the flexibility of the conventional generation.
Denholm et al. 2013 [92] assess the impact of storage on a part of the WECC52 power system (46 GW of installed capacity in Colorado) in the year 2020 using a commercial market model. The model optimises storage on both power as well as reserve markets.
Sioshansi et al. 2009 [13] is both an engineering study quantifying the storage arbitrage value on PJM between 2002 and 2007 and a system study as the authors also assess the welfare effect on producers and consumers which would arise from the deployment of a storage plant.
He et al. 2012 [16] investigate how a storage device could be dispatched by the power market operator instead of a private owner and compare the welfare benefits of both approaches.
3.3.2 Quantification of benefits
Taking into account the different objectives of the studies, it becomes apparent that results have to be interpreted in the context of the respective study. Comparing only the total identified value of storage would thus be misleading. The quantitative results will be presented across value chain steps in the following section.
Figure 17 provides an overview on the value of storage along the value chain for both regulated (shown in the green bars) and deregulated (shown in the purple bars) domains that has been identified in the studies listed in Table 3. Following the logic used in the discussion of the engineering studies, all figures have been converted into the €/kW/a metric for better comparability. The ranges shown result from different assumptions on the following factors.
Storage penetration levels (dena 2012 RES, VDE 2012, Strbac et al. 2012) or different CAPEX assumptions leading to these (Swider 2007)
Technical storage configurations (VDE 2012, Connolly et al. 2012, Strbac et al. 2012)
Time horizon (dena2010 PHS, VDE 2012, Strbac et al. 2012, Sioshansi et al. 2009)
Assumptions on the storage regulation and business model (dena 2012 Dist)
51 The study builds on the 2011 UK government "Pathways" scenarios which present different options for decarbonizing the UK power sector.
52 Western Electricity Coordinating Council (Western Interconnection, US)
44
Figure 17: Value of storage identified by different system studies53
Generation benefits
Generation benefits consist of two parts: savings in CAPEX (as storage can replace investments in other flexible generation) and savings in variable OPEX (fuel and carbon emission rights not used)54. Only VDE 2012 and Strbac et al. 2012 explicitly capture the CAPEX benefits of storage while dena 2012 RES only reports benefits in aggregated form.
For 2030 and 2050, Strbac et al. [51] identify storage value for the generation value chain approximately one order of magnitude above the other studies; the study itself does not compare these numerical results to other research and thus does not provide an explanation for this deviation. Given that there is a high sensitivity of the results of simulation models to modelling assumptions and input data these differences will need to be analysed with a deeper knowledge of these aspects. However, the fact that this study considers the contribution of storage to services which assume a growing importance in the UK system (such as frequency regulation and reserves), combined with constraints related to emissions will partly explain these differences (see Silva 2010 [110] for more detail concerning the value of flexibility in the UK system with large wind penetration).
In dena 2012 RES [50] and Swider 2007 [63] the decreasing marginal benefit of adding storage can be clearly identified as no other parameter is varied. Denholm et al. 2013 [92] identify system value resulting from the use of storage for reserve power (high end of the range in Figure 17, the low end shows the arbitrage only case). Denholm et al. 2013 [92] also apply a price taker approach (as described in Sioshansi et al. 2009 [13])
53 Strbac et al., figures for the generation value chain step are for 2030
54 For Sioshansi 2009, the difference in consumer surplus is shown as a proxy for savings in (variable) OPEX
45
and find system benefits (resulting from lower power prices) of $28/kW (22 €/kW) i.e. 20% less than the lower end of the respective bar. The difference between these methods result from avoided start-up costs of fossil power stations. Furthermore, the authors also calculated the pure arbitrage revenues of 17$/kW (13 €/kW) which were only half of the generation system revenues. VDE 2012 [56] shows negative values for the generation CAPEX i.e. higher investments in power plants. These occur in all scenarios with using long term hydrogen storage and result from the efficiency losses of more than 50%. The positive end of the range results from scenarios, in which only short term (PHS, CAES, and battery) storage is deployed.
Variable cost savings show a mixed picture. The lower range of all studies is very similar which is remarkable given the differences between the power systems and the methodology. Huge differences exist regarding the upper ranges. The two German studies (VDE 2012 [56] and dena 2010 PHS [3]) show values in the same range as the historical data study by Sioshansi et al. 2009 [13] Both the Irish (Connolly et al. 2012 [20]) and UK (Black et al.2006 [44], Strbac et al. 2012 [51]) studies show significantly higher values. An explanation for the high values of Strbac could be very high costs of peaking units55.
Transmission and distribution benefits
Benefits for the transmission grid result from the possibility to avoid or defer investments. They are usually quantified by comparing the grid investment needs in the presence and in the absence of a particular storage project and thus require power flow calculations for transport grids and a statistical treatment for distribution grids. The results as shown in Figure 17 are mixed.
Dena 2010 Grid [3] shows a negative value of storage as the PHS projects considered56 are located in Southern Germany57 and require 400 km of grid enhancements. Strbac et al. 2012 [51] also see the possibility of storage causing extra costs (e.g. the addition of distributed storage in 2030 can lead to higher transmission investment) though in the longer term scenarios storage avoids grid investments. The study covers a wide range of scenarios as opposed to the singular sensitivity assessed in dena 2010 grid. The modelling approach using net transfer capacities between 5 regions might however be less accurate than the optimal power flow used in dena 2010 grid.
Dena 2012 Dist [59] identifies negative or positive value for distributed storage depending on how the unit is dispatched. Distributed storage actually increases grid invest costs by 35% if dispatched according to market signals. Grid invest costs can be reduced by 17% if storage is dispatched according to grid requirements. Strbac et al. only assume a dispatch of distributed storage according to grid needs and obtain positive values.
The value of storage for transmission and distribution grids is significantly lower than the high values for T&D invest deferrals as obtained using the methodologies if EPRI
55 On page 53 Strbac et al. [51] explain this by a high level of avoided curtailment of RES-E energy which has to be produced in very expensive CCS peaking plants in the absence of storage
56 Mainly the PHS project in Atdorf close to the borders between Germany, France and Switzerland
57 The scenarios with a massive addition of storage (BAS 050, BAS100) constructed with the aim of avoiding grid bottlenecks were not evaluated here. As the addition of storage did not lead to a significant reduction of bottlenecks, the study did not provide detailed data necessary for quantifying the (negative) value of storage in these scenarios...
46
[38] and SANDIA [45] shown in Figure 16. Also, a number of benefits proposed in those studies were not explicitly assessed, such as voltage and reactive power (VAR) support. Furthermore, the important value pool resulting from avoided transmission congestion in the form of FTR is restricted to markets with a nodal pricing scheme largely absent in Europe (except for Poland that might implement it [111]). Also, none of the reviewed studies identified benefits on the level of the end user as opposed to the EPRI and SANDIA studies.
Other value of storage
Some storage benefits are not addressed by the studies reviewed, possibly because of a lack of transparent markets, modelling complexities or because of unawareness of some benefits provided by storage.
The ability to black start a power system was not quantified by any of the system studies reviewed. However, EPRI [38] report a value based on Isenmonger 2007 [112] which is up to 50% of the possible arbitrage value.
VAR support for transport grids and voltage support for distribution grids is not explicitly quantified by system studies while EPRI and SANDIA both provide figures for this services as shown in Figure 16
Dena 2008 PHS [27] investigates the value of preventing a full blackout over Germany during the system disturbance on 4th November 2006 and the possibility to black-start the system in case a blackout would have happened.
3.3.3 Further studies
A number of system studies involving storage were identified in this literature study but are not shown in Table 3 and Figure 17 .The reasons are either a lack of quantitative information (e.g. data only available in not easily decipherable graphs or stated in metrics not easily convertible) or a methodology used not allowing conclusions on the system value of storage (e.g. if no scenarios with different storage deployment are available). Also, some studies focus primarily on the RES system integration rather than storage or do not address storage costs and benefits. We restrict the coverage of the following studies to a few comments.
Storage studies
Dena PHS 2008 [27] assesses the effect of grid fees on the storage deployment in Germany applying an integrated model for power and reserve markets. The report does however not present the total or marginal system value of storage.
Nyamdash et al. 2013 [113] study the impact of storage on the Irish generation system using a unit commitment model. Adding storage increases the production of peat plants and imports from the UK.
PNNL 2012 [25] apply system models to determine the level of storage required for meeting the growing flexibility needs of the US Western Interconnection, however the study does not quantify system benefits of storage. For this reason it is discussed in the section on engineering studies.
Tuohy et al. 2011 [68] find out that for low levels of wind on the Irish system, the positive impact of storage in reducing curtailment does not justify the investment in
47
storage, while this is the case for high wind generation. The methodology is similar to Connolly et al. 2012 [68].
RES integration and 100% RES studies
Budishak et al. 2012 [76] study RES-E penetration between 30% and 99.9% in the PJM system. The role of storage in the system is rather small, as only 9 to 72 h of storage is required to balance the system during 99.9% of the hours. The authors also find a difference in the system effects of centralised (batteries and hydrogen) and decentralised storage (electric vehicles): while system costs increase with RES-E levels in the case of centralised storage, they decrease in the presence of a massive E-vehicle deployment. The authors do however not show scenarios with different storage penetration levels so it is not possible to derive the marginal or total system benefits from the storage deployed.
Denholm et al. 2011 [114] study the storage required to allow very high wind penetration rates of 50%-80% in the ERCOT system. The study quantifies the relationship between wind penetration rates, storage deployment and wind energy curtailment. The storage value is however not quantified in this study.
GE Energy 2010 [115] investigates the operational impact of a 3% wind and 5% PV penetration in 5 Western US states. The value of PHS measured in terms of arbitrage benefits falls short of repaying capital costs. This study also considers concentrating solar power plants with attached thermal storage. Adding a 6 hour thermal storage raises revenues by 5-10% while further thermal storage does not significantly increase the value of a CSP.
Rasmussen et al. 2011 [116] determine the storage size needed for a 100% RES system in Europe depending on the level of balancing. The authors conclude that storing an average consumption for about 6h would reduce balancing needs by half. Going to a 100% RES system would require a 25 TWh seasonal (hydrogen) storage.
Rastler 2011 [117] is the first part of an on-going EPRI managed study on storage deployment in the US MISO system. Due to the models used, only the arbitrage value of storage was identified. The value of storage including ancillary services is to be investigated in the second phase using the PLEXOS tool.
Steinke et al. 2013 [118] systematically study the interdependence of grid and storage in a 100% RES system. A combination of 65% wind and 35% (of annual demand) would require a backup capacity of up to 40% of the load if no storage was present. Depending on the degree of interconnection, storage capacity between 30 days and 90 days is required to balance the system. Storage capacities might be further reduced by "oversupplying" RES by a factor of 130%. From an economical point of view, the optimum storage size differs by technology: approx. 1h for batteries, 4h for pumped hydro and 1 week for hydrogen, depending on the system costs saved. Oversizing the RES supply to levels above 100% however does not prove to be economic.
48
4 Impact of Regulation on Electricity Storage
4.1 Motivation for studying the regulation of electricity storage
Studying the impact of regulation is of fundamental interest to all stakeholders (researchers, policy makers, potential investors) as the very existence of markets can entirely depend on regulatory decisions. This is actually the case with regard to the deregulation of the European energy markets, the incentives schemes for renewable energy or the creation of balancing markets. The modification of a market's rules directly or indirectly affects the business case for storage. Rules specifying technical requirements for the participation in a market such as e.g. the requirements for tertiary reserve in Germany (Madlener et al. 2013 [107], VDE 2013 [119]) can have a direct effect on the storage business case. RES-E market integration mechanisms can indirectly affect the storage business case translated through power prices as described by Nicolosi 2011 [120]. The economic evaluation of storage in the energy system thus inherently implies assumptions on the regulatory context which have to be taken into account when comparing results obtained for different markets.
Anticipating regulatory decisions or evaluating the outcome of possible options for regulatory decisions on both energy storage as well as the energy system is itself a key subject of research. Aside from the uncertainty of the economic signals such as the volatility of commodity prices, unstable technology support policies or regulatory decisions can discourage investments and may represent a barrier to the market entry for new technologies.
One particular regulatory challenge originates from the fact that storage can provide a number of different services for both power generation (e.g. arbitrage) and for power transmission (e.g. avoiding congestion). Different regulation might thus apply depending on whether a storage application falls into the regulated or the unregulated domain of European power systems. The European regulatory context since the deregulation is described in detail in a report from the EU FP7 stoRE project [121]. Implications are also discussed in a report by THINK, another FP7 project [122]. An introduction to the regulatory situation of storage in the US is provided by Yang et al. 2011 [123], the current situation in China is described in Ming et al. 2013 [124].
Many non-academic publications on regulatory issues are driven by stakeholder interests such as position papers by EURELECTRIC [125]. Other studies have been published in the context of a regulatory decision making process such as dena PHS 2008 [27] which is financed and co-authored by a utility and made a strong statement against grid fees.
A number of publications addressing the regulation of distribution level storage, often related to smart grid technology were not systematically explored given the focus on large scale storage of this report. The regulatory literature on storage studies can be broadly divided into the following categories:
Non market related regulation
Power market design
Storage ownership and right of dispatch
Direct financial support
49
4.2 Non market related regulation
4.2.1 Grid fees
The common theme among this kind of studies is a very particular aspect of regulation that has an easily measurable impact on the profitability of a storage system. Examples are fees or technical requirements, which can establish a market entry barrier for a particular technology to provide a service. The income streams most affected by technical regulations are arbitrage and reserve markets. For this reason, fees are discussed first in this report, despite their rather subordinate regulatory nature.
A study commissioned by the German Energy Agency dena [27] on the introduction of grid fees for pumped hydro storage in Germany in 2008 shows how big an impact (negative for storage in this case) of an apparently minor regulatory detail can become. The profitability of the storage business model is not reduced by the fee to be paid for each trade but also by the reduction of the number of hours providing a sufficient spread for arbitrage. This study uses a model that simultaneously optimises dispatch on both power and reserve market. Dispatch of electricity storage connected the 110 kV level (which is DSOs in Germany) would be reduced by more than 60% if these were faced with grid fees of up to 18 €/MWh58. The study also concluded that pumped hydro plants located in Luxemburg and Switzerland with access to the German power market but not affected by German grid fees could even increase their dispatch. System costs may then rise by €95 m, while collected grid fees were roughly half that sum. With the amendment of the energy law in 2012 [126], new PHS or capacity extensions of existing PHS are now exempt from grid fees for 20 years and 10 years respectively. Some authors expect this measure to remove the barrier for deployment of new capacity (Steffen 2012 [95]).
Nekrassov et al. [28] study the effect of a grid fee on the profitability of a CAES operating on the French power market and conclude that grid fees of 6-7 €/MWh eradicate more than 20% of the arbitrage profits. The authors propose the introduction of hourly differentiated grid tariffs so that storage could profit from low or non-existent fees during off-peak hours, even though this would not solve the problem of arbitrage not providing sufficient revenues for breaking even with a CAES investment.
In a position paper, EURELECTRIC [125] asks for the removal of both double fees59 and the one way fees for charging applied in France and Germany on the basis that those were discriminatory as storage would not constitute final energy consumption. Similarly, EASE/EERA recommend that "the current levy structures (grid fees, taxes or similar) may not hinder or discriminate the integration of energy storage" [127].
4.2.2 Environmental regulation and public acceptance
The relevance of several fields of European law for PHS and CAES projects is assessed in a stoRE project report [128]. Case studies show the relevance of the Water Framework Directive [129], the Biodiversity and Natura 2000 legislation [130], [131] and the requirement for Environmental Impact Assessments [132], [133]. Very little experience
58 Grid access tariffs range between 9 €/MWh – 18 €/MWh depending on the voltage level the plant is connected to (220/380 kV or 110 kV respectively)
59 According to EURELECTRIC, eight Member States of the European Union (CZ, ES, IT, LT, PL, PT, SK, UK) do not impose grid fees to storage plants while three Member States (AT, BE, GR) and Norway apply fees for both charging and discharging of storage
50
exists with environmental licensing of PHS according to EU law as the majority of plants have been constructed before entry into force of this legislation. One proposed project for a PHS in Ireland failed due to its location in a Natura 2000 habitat. The same describes the resistance to the construction of new gas storage in Denmark because of possible degradation of the quality of surrounding waters due to brine from the excavation. Such concerns would also have to be addressed for the construction of the underground cavern of a CAES. The Water Framework Directive (WFD) is also identified as a potential threat to pumped hydro projects by EURELECTRIC [125] who ask for socio-economic assessments of storage benefits and the setting up of a joint DG Energy-DG Environment workgroup on this matter. Resistance and legal challenge from environmentalist groups are mentioned by Yang et al. [116] as a serious barrier in the US for Pumped Storage projects.
4.3 Power market design
4.3.1 RES integration
The increasing amount of RES-E supply on the power market influences the energy storage business case in several ways. The intermittency of RES-E can increase price volatility and demand for reserve power60. On the other hand, RES-E can also negatively affect the business case, e.g. if PV deployment leads to a disappearance of the mid-day price peak as described by stoRE [121] and thus a loss of arbitrage possibilities. According to the same report this trend might be reversed if even more PV deployment would lead to a mid-day price trough.
The mechanism with which RES producers are remunerated for the energy produced (e.g. by fixed feed in tariffs or by a market premium) impacts the dispatch in times of simultaneous high wind availability and low system load. Nicolosi [120] shows on the example of ERCOT in 2008 and 2009, that producers of wind energy sold their output even at negative prices, as long as these were overcompensated by a premium (the US federal production tax credit in this case). Only if prices fall below this level, would producers curtail the output. The author models the effects of a (hypothetical) market premium on the dispatch and investment decisions in Germany up to 2030 (where currently a feed-in-tariff is in place). The model makes investment decisions for both conventional power plants as well as for compressed air energy storage systems, based on expected revenues on power markets. Depending on the minimum price for which wind energy would still receive a premium (below which the wind farm operator would curtail due to lack of revenues), the installed CAES capacity in 2030 varies between 0 if no payment is received in case of negative prices and 40 GW if wind power is still remunerated at the current market floor price of -3000 EUR/MWh). The profitability of storage investments would thus rely very much on the continuity of regulation avoiding curtailment even at highly negative power prices.
4.3.2 Reserve market design
Technical specifications of power market products can also impact the playing field. The auctioning mechanism for reserve capacity can e.g. exclude some storage technologies if too restrictive. Madlener et al [134] conclude that 4h contracts make it unattractive for CAES to participate in the German market for minute (tertiary) reserve as this would
60 Quantifying the additional demand for reserve power was the goal of e.g. [25]
51
make it difficult for a CAES to trade on the spot market at the same time. The authors propose an introduction of hourly contracts that would allow the CAES to become profitable as they show in a subsequent paper [107]. Minimum bid size is identified as a hurdle for small distributed storage if pooling of different providers is not allowed as described in a study by VDE [119]. The minimum power output has subsequently been lowered to 1 MW for units providing primary or secondary reserve and to 5 MW for units providing tertiary reserve in Germany.
Whether storage could generate significant earnings from reserve markets also depends on the rules under which RES-E would participate on these and compete with storage. In one of the future scenarios for the German market, Nicolosi [120] assumes that wind turbines would be enabled to provide positive and negative reserve: positive reserve by constantly operating below the maximum capacity enabling them to ramp up on demand, negative reserve by curtailing output (provided they are on). If this was the case, the price for positive reserve could fall by 75% and the price for negative reserve to almost zero. The provision of ancillary services by RES-E is also the subject of the on-going REserviceS EU-FP7-project [135], [136].
As shown in a recent ENTSOE survey, regulation of ancillary markets differs widely within Europe [137]. Related to this, little cross border trade of ancillary services currently exists. The storage business case thus most often needs to be assessed on a national basis. However, the feasibility and implications of cross border balancing are addressed in the currently drafted ENTSOE Draft Network Code on Electricity Balancing [138] which is to specify the framework guidelines developed by the European Agency for the Cooperation of Network Regulators (ACER) [25]. An overview on the relevance of the on-going grid development of European grid codes is provided by stoRE [121].
In the US, regulatory decision making on reserve market design has allowed providers of fast acting technologies such as batteries and flywheels to participate in markets for primary reserve. Whether storage could participate in ancillary markets of deregulated US power systems remained uncertain up to 2007, as described in [123], [22] when FERC61 order 890 [139] was issued, requiring an inclusion of "non generating resources" in meeting grid reliability. In October 2011 FERC order 755 [140] was approved requiring the remuneration for primary reserve to consist of two parts:
A "capacity payment that includes the marginal unit’s opportunity costs "
A "payment for performance that reflects the quantity of frequency regulation service provided by a resource when the resource is accurately following the dispatch signal"
This “performance based regulation” (or pay-for-performance) aims at paying more to the resources able to provide faster and more accurate frequency regulation services - it is now being implemented by those US TSOs62 falling under FERC regulation. It should be noted that this regulatory approach might not be easily translated to European markets given the very different approach to frequency regulation as shown by Rebours et al. [109], [141]. The decentralised character of frequency control in Europe avoids quality problems created by a delayed response to a signal as in the US. In effect, US frequency control acts in much the same way as secondary control in Europe. No
61 Federal Energy Regulation Commission
62 This concerns PJM, NYISO, MISO, CAISO and ISO-NE while ERCOT is not submitted to FERC regulations
52
studies could be identified that were investigating the impact of such regulation in a European context.
4.4 Ownership and right of dispatch
The issue of ownership and right of access is closely linked to the question of efficient power markets, and thus related to the modelling of strategic behaviour as described in the chapter on methodology. The value streams affected are mainly portfolio optimisation and arbitrage as described in the chapter on profitability. A rather small number of academic articles was found on this subject (related purely to storage), while there is no shortage of position papers from industry associations on this topic.
The ownership of electricity storage is not homogeneous on a worldwide level. In the course of the liberalisation of the European power industry, pumped storage plants (and the only European compressed air storage plant at Huntorf, Germany) became non-regulated assets of the utilities generation portfolios and are dispatched as such according to power market signals. In China, new pumped hydro storages are owned by integrated/grid companies, comparable to regulated utilities (Ming et al. 2013 [124]).
Views on storage ownership clearly differ between EURELECTRIC and ENTSOE. The former claims that storage ownership should be a "competitive" business, and not a "regulated" one [125]. Furthermore, claims to TSO ownership should be regarded as "unjustified and incompatible with the unbundling provisions of the Third Energy Package". Remuneration of all services should be "under well functioning markets". EURELECTRIC also reiterated this position for distributed storage in a 2013 report [142] by proposing market models for aggregators that could enable distributed generation and storage resources to participate in the markets for energy and ancillary services. ENTSOE does not share EURELECTRIC's clear opinion on ownership. In their ten year network development plan [143], storage ownership by "private market operators" or "regulated operators" is regarded to be an open issue. ENTSOE proposes large scale demonstrations of storage to validate both "storage benefits" and "potential asset ownership solutions". According to stoRE [123] the "controversial regulation in Italy where the TSO has been allowed to own and operate batteries" could be regarded as a trigger to explicitly clarify the position of storage according to Article 9 (1) of the Electricity Directive [144].
4.4.1 Effects of storage ownership on social welfare
While most assessments of storage profitability work "in the box" of current regulation, some of the literature reviewed also discusses models deviating from current legislation. Some critique of generation portfolio ownership of storage can be found in the academic literature.
Sioshansi [14] studies the effect of storage ownership on the welfare distribution on the example of a market with two large power generating companies and two power retailers. If storage was owned by generators, these would tend to underutilise it while retailers would over utilise it with both approaches failing to maximise social welfare. In the absence of a perfectly competitive market, the authors recommend ownership by merchant operators. Independent merchant ownership would come relatively close to the social welfare maximization, which would be reached by shared ownership. Schill et al. [15] reaches similar conclusions for the German market and sees a danger of storage
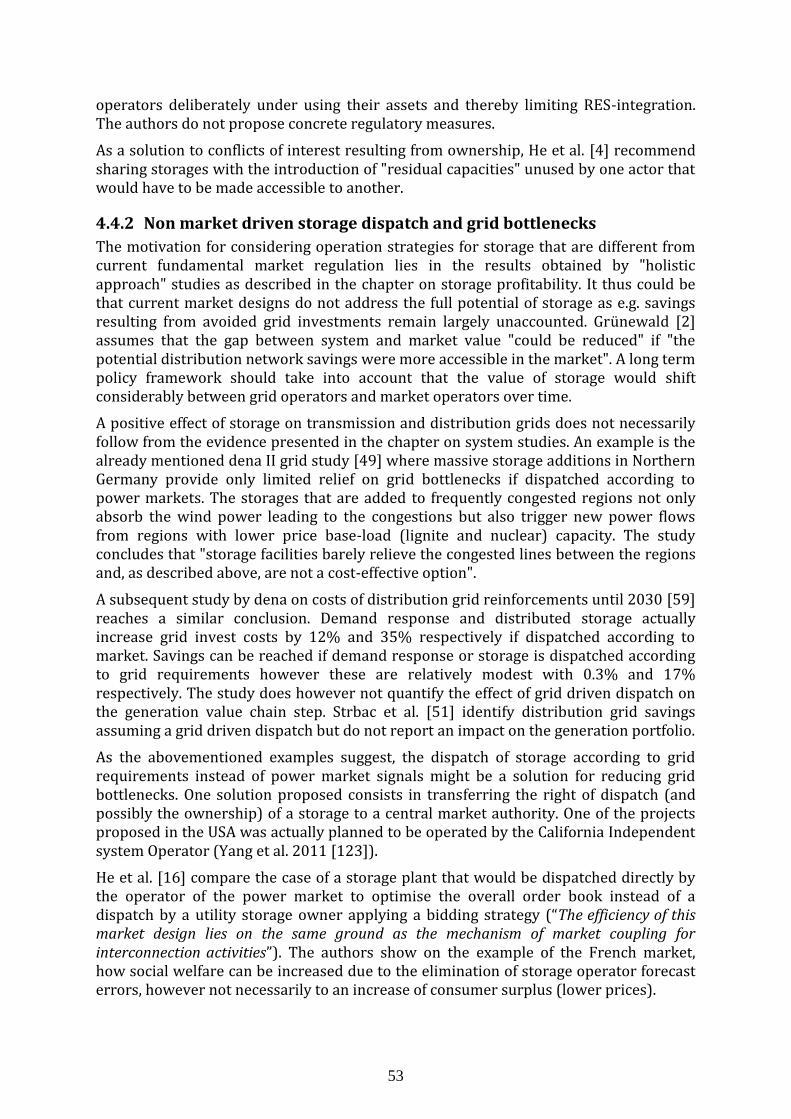
53
operators deliberately under using their assets and thereby limiting RES-integration. The authors do not propose concrete regulatory measures.
As a solution to conflicts of interest resulting from ownership, He et al. [4] recommend sharing storages with the introduction of "residual capacities" unused by one actor that would have to be made accessible to another.
4.4.2 Non market driven storage dispatch and grid bottlenecks
The motivation for considering operation strategies for storage that are different from current fundamental market regulation lies in the results obtained by "holistic approach" studies as described in the chapter on storage profitability. It thus could be that current market designs do not address the full potential of storage as e.g. savings resulting from avoided grid investments remain largely unaccounted. Grünewald [2] assumes that the gap between system and market value "could be reduced" if "the potential distribution network savings were more accessible in the market". A long term policy framework should take into account that the value of storage would shift considerably between grid operators and market operators over time.
A positive effect of storage on transmission and distribution grids does not necessarily follow from the evidence presented in the chapter on system studies. An example is the already mentioned dena II grid study [49] where massive storage additions in Northern Germany provide only limited relief on grid bottlenecks if dispatched according to power markets. The storages that are added to frequently congested regions not only absorb the wind power leading to the congestions but also trigger new power flows from regions with lower price base-load (lignite and nuclear) capacity. The study concludes that "storage facilities barely relieve the congested lines between the regions and, as described above, are not a cost-effective option".
A subsequent study by dena on costs of distribution grid reinforcements until 2030 [59] reaches a similar conclusion. Demand response and distributed storage actually increase grid invest costs by 12% and 35% respectively if dispatched according to market. Savings can be reached if demand response or storage is dispatched according to grid requirements however these are relatively modest with 0.3% and 17% respectively. The study does however not quantify the effect of grid driven dispatch on the generation value chain step. Strbac et al. [51] identify distribution grid savings assuming a grid driven dispatch but do not report an impact on the generation portfolio.
As the abovementioned examples suggest, the dispatch of storage according to grid requirements instead of power market signals might be a solution for reducing grid bottlenecks. One solution proposed consists in transferring the right of dispatch (and possibly the ownership) of a storage to a central market authority. One of the projects proposed in the USA was actually planned to be operated by the California Independent system Operator (Yang et al. 2011 [123]).
He et al. [16] compare the case of a storage plant that would be dispatched directly by the operator of the power market to optimise the overall order book instead of a dispatch by a utility storage owner applying a bidding strategy (“The efficiency of this market design lies on the same ground as the mechanism of market coupling for interconnection activities”). The authors show on the example of the French market, how social welfare can be increased due to the elimination of storage operator forecast errors, however not necessarily to an increase of consumer surplus (lower prices).
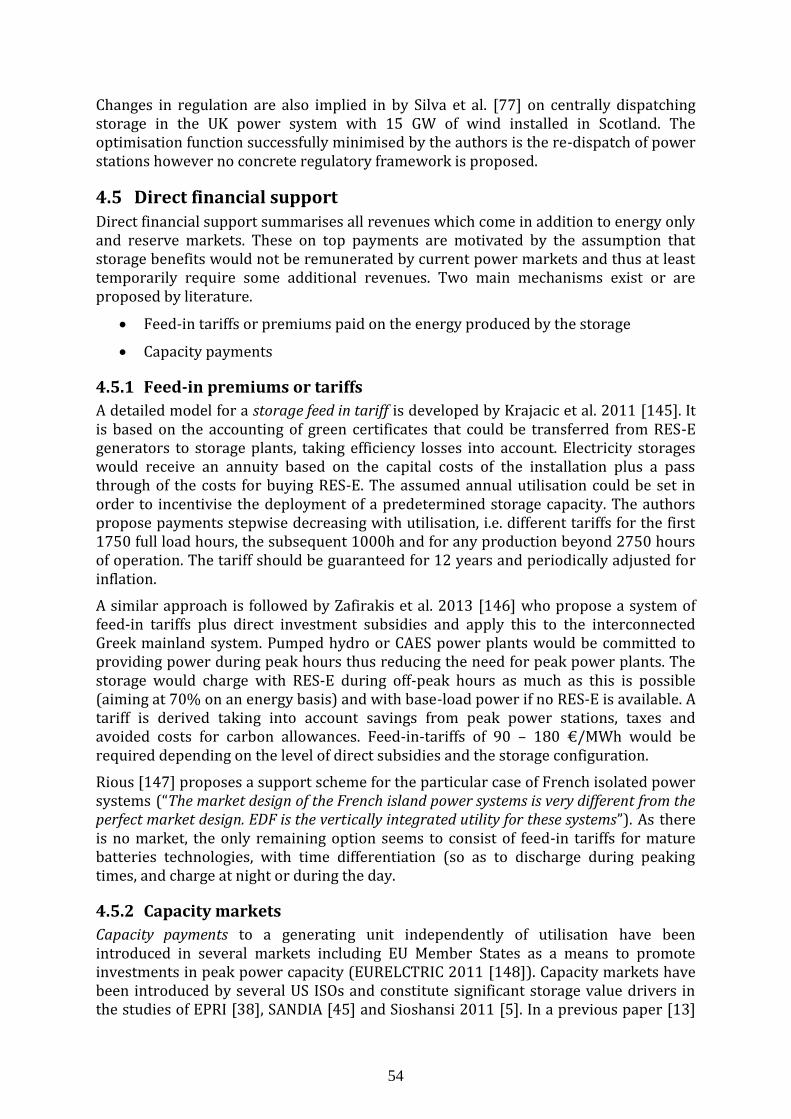
54
Changes in regulation are also implied in by Silva et al. [77] on centrally dispatching storage in the UK power system with 15 GW of wind installed in Scotland. The optimisation function successfully minimised by the authors is the re-dispatch of power stations however no concrete regulatory framework is proposed.
4.5 Direct financial support
Direct financial support summarises all revenues which come in addition to energy only and reserve markets. These on top payments are motivated by the assumption that storage benefits would not be remunerated by current power markets and thus at least temporarily require some additional revenues. Two main mechanisms exist or are proposed by literature.
Feed-in tariffs or premiums paid on the energy produced by the storage
Capacity payments
4.5.1 Feed-in premiums or tariffs
A detailed model for a storage feed in tariff is developed by Krajacic et al. 2011 [145]. It is based on the accounting of green certificates that could be transferred from RES-E generators to storage plants, taking efficiency losses into account. Electricity storages would receive an annuity based on the capital costs of the installation plus a pass through of the costs for buying RES-E. The assumed annual utilisation could be set in order to incentivise the deployment of a predetermined storage capacity. The authors propose payments stepwise decreasing with utilisation, i.e. different tariffs for the first 1750 full load hours, the subsequent 1000h and for any production beyond 2750 hours of operation. The tariff should be guaranteed for 12 years and periodically adjusted for inflation.
A similar approach is followed by Zafirakis et al. 2013 [146] who propose a system of feed-in tariffs plus direct investment subsidies and apply this to the interconnected Greek mainland system. Pumped hydro or CAES power plants would be committed to providing power during peak hours thus reducing the need for peak power plants. The storage would charge with RES-E during off-peak hours as much as this is possible (aiming at 70% on an energy basis) and with base-load power if no RES-E is available. A tariff is derived taking into account savings from peak power stations, taxes and avoided costs for carbon allowances. Feed-in-tariffs of 90 – 180 €/MWh would be required depending on the level of direct subsidies and the storage configuration.
Rious [147] proposes a support scheme for the particular case of French isolated power systems (“The market design of the French island power systems is very different from the perfect market design. EDF is the vertically integrated utility for these systems”). As there is no market, the only remaining option seems to consist of feed-in tariffs for mature batteries technologies, with time differentiation (so as to discharge during peaking times, and charge at night or during the day.
4.5.2 Capacity markets
Capacity payments to a generating unit independently of utilisation have been introduced in several markets including EU Member States as a means to promote investments in peak power capacity (EURELCTRIC 2011 [148]). Capacity markets have been introduced by several US ISOs and constitute significant storage value drivers in the studies of EPRI [38], SANDIA [45] and Sioshansi 2011 [5]. In a previous paper [13]
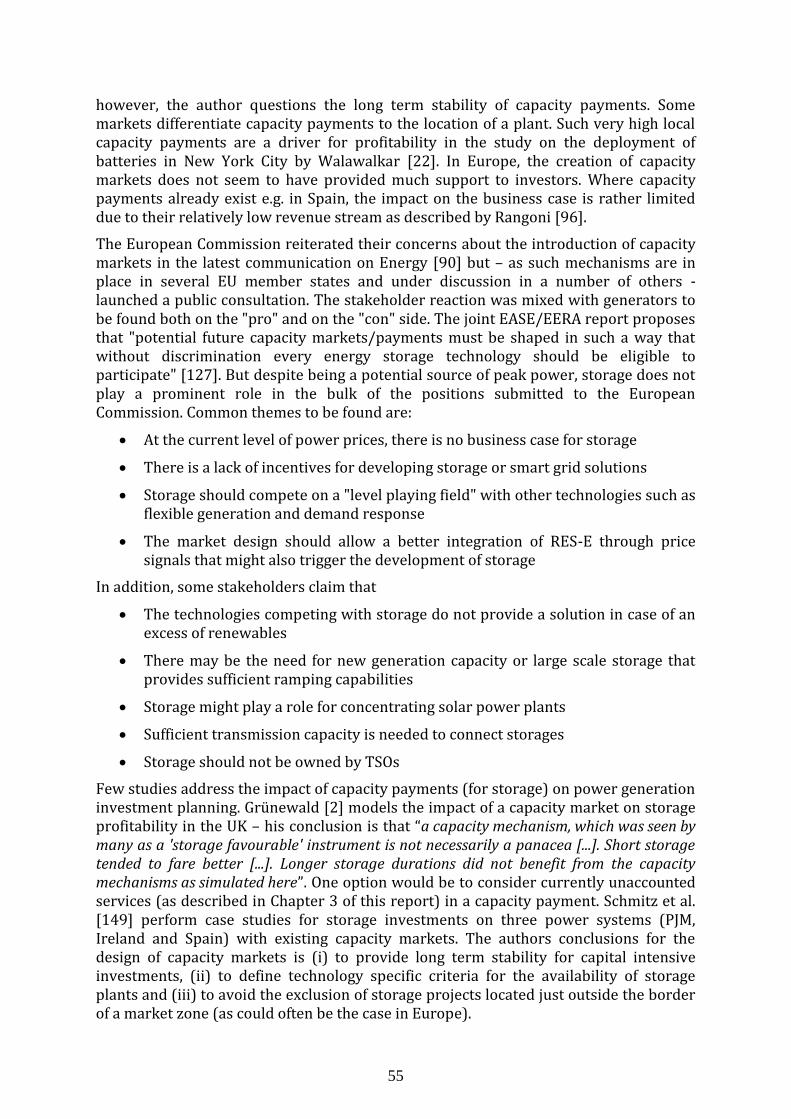
55
however, the author questions the long term stability of capacity payments. Some markets differentiate capacity payments to the location of a plant. Such very high local capacity payments are a driver for profitability in the study on the deployment of batteries in New York City by Walawalkar [22]. In Europe, the creation of capacity markets does not seem to have provided much support to investors. Where capacity payments already exist e.g. in Spain, the impact on the business case is rather limited due to their relatively low revenue stream as described by Rangoni [96].
The European Commission reiterated their concerns about the introduction of capacity markets in the latest communication on Energy [90] but – as such mechanisms are in place in several EU member states and under discussion in a number of others - launched a public consultation. The stakeholder reaction was mixed with generators to be found both on the "pro" and on the "con" side. The joint EASE/EERA report proposes that "potential future capacity markets/payments must be shaped in such a way that without discrimination every energy storage technology should be eligible to participate" [127]. But despite being a potential source of peak power, storage does not play a prominent role in the bulk of the positions submitted to the European Commission. Common themes to be found are:
At the current level of power prices, there is no business case for storage
There is a lack of incentives for developing storage or smart grid solutions
Storage should compete on a "level playing field" with other technologies such as flexible generation and demand response
The market design should allow a better integration of RES-E through price signals that might also trigger the development of storage
In addition, some stakeholders claim that
The technologies competing with storage do not provide a solution in case of an excess of renewables
There may be the need for new generation capacity or large scale storage that provides sufficient ramping capabilities
Storage might play a role for concentrating solar power plants
Sufficient transmission capacity is needed to connect storages
Storage should not be owned by TSOs
Few studies address the impact of capacity payments (for storage) on power generation investment planning. Grünewald [2] models the impact of a capacity market on storage profitability in the UK – his conclusion is that “a capacity mechanism, which was seen by many as a 'storage favourable' instrument is not necessarily a panacea [...]. Short storage tended to fare better [...]. Longer storage durations did not benefit from the capacity mechanisms as simulated here”. One option would be to consider currently unaccounted services (as described in Chapter 3 of this report) in a capacity payment. Schmitz et al. [149] perform case studies for storage investments on three power systems (PJM, Ireland and Spain) with existing capacity markets. The authors conclusions for the design of capacity markets is (i) to provide long term stability for capital intensive investments, (ii) to define technology specific criteria for the availability of storage plants and (iii) to avoid the exclusion of storage projects located just outside the border of a market zone (as could often be the case in Europe).
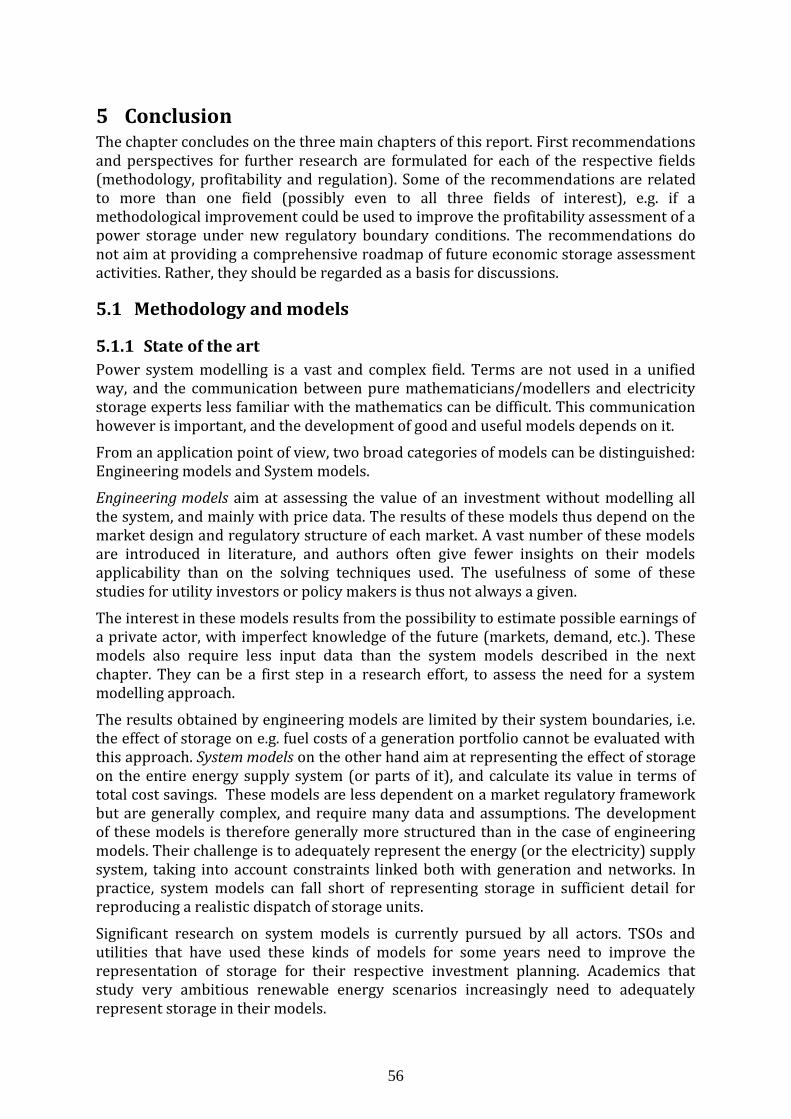
56
5 Conclusion The chapter concludes on the three main chapters of this report. First recommendations and perspectives for further research are formulated for each of the respective fields (methodology, profitability and regulation). Some of the recommendations are related to more than one field (possibly even to all three fields of interest), e.g. if a methodological improvement could be used to improve the profitability assessment of a power storage under new regulatory boundary conditions. The recommendations do not aim at providing a comprehensive roadmap of future economic storage assessment activities. Rather, they should be regarded as a basis for discussions.
5.1 Methodology and models
5.1.1 State of the art
Power system modelling is a vast and complex field. Terms are not used in a unified way, and the communication between pure mathematicians/modellers and electricity storage experts less familiar with the mathematics can be difficult. This communication however is important, and the development of good and useful models depends on it.
From an application point of view, two broad categories of models can be distinguished: Engineering models and System models.
Engineering models aim at assessing the value of an investment without modelling all the system, and mainly with price data. The results of these models thus depend on the market design and regulatory structure of each market. A vast number of these models are introduced in literature, and authors often give fewer insights on their models applicability than on the solving techniques used. The usefulness of some of these studies for utility investors or policy makers is thus not always a given.
The interest in these models results from the possibility to estimate possible earnings of a private actor, with imperfect knowledge of the future (markets, demand, etc.). These models also require less input data than the system models described in the next chapter. They can be a first step in a research effort, to assess the need for a system modelling approach.
The results obtained by engineering models are limited by their system boundaries, i.e. the effect of storage on e.g. fuel costs of a generation portfolio cannot be evaluated with this approach. System models on the other hand aim at representing the effect of storage on the entire energy supply system (or parts of it), and calculate its value in terms of total cost savings. These models are less dependent on a market regulatory framework but are generally complex, and require many data and assumptions. The development of these models is therefore generally more structured than in the case of engineering models. Their challenge is to adequately represent the energy (or the electricity) supply system, taking into account constraints linked both with generation and networks. In practice, system models can fall short of representing storage in sufficient detail for reproducing a realistic dispatch of storage units.
Significant research on system models is currently pursued by all actors. TSOs and utilities that have used these kinds of models for some years need to improve the representation of storage for their respective investment planning. Academics that study very ambitious renewable energy scenarios increasingly need to adequately represent storage in their models.
57
5.1.2 Recommendations
So far, few system models try to represent the entire electrical system, from distribution to generation planning. One important question modellers should ask themselves is if future modelling developments should focus on elaborating integrated system models, needing very high amounts of data, calculation capacities and very experienced users with a very broad knowledge of all the segments of the electrical sector, or if different families of system models should be used separately and coherently (market models, transmission network models, distribution models), in a more Cartesian way (as solving small problems is often easier than solving a unique but big one). Furthermore, as High Performance Calculation expands rapidly, researchers might be tempted to increase the models complexity, or the number of scenarios simulated. The interest of doing so should be carefully assessed (doubling calculation time for a 5 % increase in accuracy might not always be needed). Some of the simplified approaches introduced here are good examples of how models requiring relatively little data and calculation time allow performing interesting analyses.
Improve the modelling of reserve margins and power
Both power market arbitrage and power reserve (thus two very important sources of revenues for storage) strongly depend on costs of supplying electricity when system margins get “tight”. Units setting prices on the power marker could also be highly relevant for providing reserve. The way security margins and reserves are modelled in system models thus impacts the storage valuation. This becomes of particular importance in scenarios with high shares of intermittent RES-E, for which traditional methodologies for the estimation of reserve margins yet need to be validated. More studies are needed to understand the future needs for reserves, and the impact on storage.
Create simplified tools for generating price tracks
Arbitrage is the most studied service, and a number of authors created engineering models allowing studying it with historical prices. However, tomorrow’s prices might be very different from today’s, particularly with the introduction of more RES-E in the system. Yet, system studies to generate adequate price tracks require a significant amount of input data and careful usage by modellers, in particular with respect to reserve margins and price formation. One alternative approach to system models would be to further adapt financial market models (such as used by Yucekawa [102] and Keles et al. [32]) as these are able to quickly generate representative price tracks63.
Assess storage in the transmission grid with simplified models
Some studies are based on simplified representations of transmission grids (e.g. Silva et al. 2008 [77], dena grid 2010 [49]). The advantage clearly lies on avoiding data intensive and time-consuming OPF calculations, yet the validity of the results strongly depends on the calibration of the simplified approaches with more complex OPF models. It would be highly beneficial to better understand the range of applicability of simplified models.
63 It would be beneficial, if these models (i.e. their underlying stochastic processes) could be adapted so that price tracks could be generated for power systems with a very different cost structure or for different commodity (gas, coal, CO2) prices.
58
Better understand the role of storage for distribution grids
The role of storage for specific applications in distribution grids was not the main concern of this review. However, several system studies as well as the storage valuation studies by SANDIA [45] and EPRI [38] identified significant storage value in the distribution grid, but also very large variations in the numbers. It would be important to improve the understanding of the “system value” of distributed storage. Approaches such as used by Strabc et al. [51] and in dena 2012 dist [59] could be further validated and applied to new geographical regions.
5.2 Storage Profitability
5.2.1 State of the art
Except for a few examples, the engineering studies reviewed assess the deployment of Pumped Hydro Storage (PHS) or Compressed Air Energy Storage (CAES). The profitability of these technologies shows a bandwidth of about one order of magnitude between the different studies. Some tendencies can however be identified.
It seems unlikely for storage invests to break even on arbitrage alone.
Reserve markets are an attractive value pool that may prove essential for the profitability of storage.
The results obtained by different authors are very sensitive on the data used, resulting from a constantly changing commodity environment64. Therefore it seems surprising that many studies rely only on a few years of input data.
The application of financial models allows for the assessment storage within possible future commodity scenarios instead of historical price tracks.
Assessing storage cross value chain with engineering methods is sensitive on many ad hoc assumptions that might distort the results obtained.
The engineering study approach usually does not identify the value of storage for a utility's generation portfolio65.
Also, despite the huge impact as e.g. described in dena PHS 2008 [27], little attention is paid to grid fees.
There is no general agreement between system studies on the value of electricity storage across the value chain. The results range between a very high system value and negative values. The latter situation arises if storage is triggering the need for more investments in other assets e.g. new grid assets. This wide bandwidth of results can be expected given the very different study motivations, assumptions and modelling details. However, all studies agree at least on the following:
The lion's share of storage value is found in the generation segment. All studies find a positive value with respect to variable costs of generation.
64 Fertig et al. [104] show how using price data from only one exceptional year (2008 data from ERCOT) would suggest investments in otherwise unprofitable assets.
65 With the exception of He 2011 [4] who quantifies this effect
59
Negative generation values are only found for investment costs (CAPEX) and in the case of massive deployment of hydrogen storage. This is a direct consequence of this technology's currently low round trip efficiency.
The value (system costs diminution) for the generation segment is indeed higher than the arbitrage profits identifiable with the engineering study approach.
In the transport and distribution sectors, positive value can be found if investments in grid can be deferred or avoided by the deployment of storage.
However, storage deployment can also have a negative value for the grid if additional infrastructure investments are needed to integrate the storage.
As shown in Table 3 and discussed above, the scope of system studies varies significantly and as a result, a number of gaps emerge. Some issues have so far been only superficially addressed and could be a matter for future studies.
For Europe, no comprehensive cross value chain study on storage economics could be identified. EU wide system studies (e.g. EWI 2012 [150]) do not address storage in sufficient detail. First approaches are only found in studies on 100% RES-E systems such as by Steinke et al. [118], Rasmussen et al. [116].
In particular, the effect of storage on the grid is not studied systematically on a wider geographical scale.
The US RES-E integration studies by PNNL [25] and GE [115] only quantify a limited number of storage value pools. Most value drivers identified by the EPRI [38] and SANDIA [45] cross value chain studies are not verified by a system approach. In particular, no comprehensive system study quantifies the transmission related value pools that would result from nodal pricing.
Hydrogen storage is modelled as a storage technology only. The possibility to transport energy using hydrogen as an alternative to the power grid (the so called "power to gas" concept) is not assessed.
5.2.2 Recommendations
More systematic studies on services mutualisation for storage
There is a need for studies assessing the cumulated value of storage in a systematic way. This would require a comprehensive derivation of possible "mutualised" storage usage instead of currently often used ad hoc assumptions. The work proposed by Delille [46] for distribution applications, with matrices allowing to systematically listing the compatible services, could be extended with the quantification of those benefits. Assessing the value of mutualised storage would also be an important input to the on-going discussion on possible models for storage ownership.
More engineering studies on the impact of techno-economic parameters
The storage business case is strongly affected by technological parameters (e.g. CAPEX, round trip efficiencies). Yet, for less mature technologies (batteries, hydrogen), those parameters are still evolving. An in depth understanding of the economic consequences of achievable technological benefits would be very helpful for road mapping exercises and RD&D policy advice. In particular, the following questions seem worth studying in more detail.
60
The degree to which learning effects could drive down CAPEX and ultimately
drive storage investments.
The necessary improvements in round trip efficiency (or the efficiencies of
the individual components) for making hydrogen storage an economic
technology for seasonal storage of electricity.
The impact of techno-economic parameters on the competitive advantages of
CAES vs ACAES in a number of possible commodity price scenarios (e.g.
would cheap shale gas shift a decision to CAES, expensive gas to ACAES?).
Complement current system studies with "out of the box" scenarios
As described above, some recent system studies (such as the dena ii grid study [49], Strbac et al. 2012 [51], VDE 2012) have made an attempt at understanding the interactions between storage and the transport grid. Yet in all of these studies some key assumptions are defined by current regulatory practice or market realities while it would be interesting to look beyond such limitations. In particular:
Repeat the dena ii grid study [49] scenarios with massive storage addition
(or construct similar scenarios) but with alternative market designs such as
(i) nodal pricing scheme like in the US, (ii) smaller bidding zones, (iii) some
"central" form of storage dispatch, e.g. by the power market. It would be
interesting to compare the value of storage under such alternative market
designs with the result found in dena ii, i.e. a complete failure to provide any
value.
Repeat the VDE 2012 [56] study assessment on long term hydrogen storage
by also allowing the geographical transport of energy in the form of
hydrogen. This would allow assessing the benefits of such power to gas
concepts for the transport of energy over geographical distances in the
absence of or as an alternative to power lines.
Perform the above described studies in a more European context (e.g.
including all major North Sea countries).
5.3 Storage Regulation
5.3.1 State of the art
Regulation is key to the profitability of electricity storage operating in deregulated markets. As a result, the literature on this issue often originates from stakeholders or is at least influenced by stakeholder debates. The issues falling under the term "regulation" can be roughly divided into categories: (i) (technical) rules, (ii) market design, (iii) aspects of ownership unbundling, (iv) instruments providing direct financial support.
Grid fees have been identified as an obstacle to storage development and, given the diverging rules in different Member States, also as a potential threat to a level playing field. Environmental regulation and public acceptance may constitute a further barrier for storage deployment. These issues are regularly published forward by stakeholders.
61
The market integration of RES-E can be decisive about the prospects of electricity storage as this can strongly affect all value streams for storage, i.e. power prices, reserve market prices and needs. Yet, only a limited number of publications specifically address the implications of possible future RES-E market models for the profitability of storage. Also, none of the system studies reviewed in Chapter 3.3 of this report study the impact of different RES_E market mechanisms on storage valuation. More work would be required to better understand the robustness of electricity storage valuation studies with regard to market changes.
In Europe, a debate can be observed between the power generators (represented by EURELECTRIC) and some TSOs on the right of ownership. While some TSOs propose allowing ownership of storage and suggest the operation under regulated regimes, power generators strongly reject such ideas. No comprehensive study could yet be identified which quantifies the consequences of "storage re-regulation" for the European power markets.
Storage (as well as demand response management) also appears in the on-going discussion on whether European power systems need capacity markets. While some studies take capacity payments into account (in particular in the US, where such markets exist), little research exists regarding the long term outlook of such revenue streams and the impact on investment planning for power generation.
5.3.2 Recommendations
Study the impact of market designs for RES-E integration in more detail
There is a need to understand the quantitative of RES-E market integration on power prices as investigated by e.g. Nicolosi [120]. It would be highly beneficial to extend these studies to further markets and scenarios. Two questions are of particular interest.
How would different RES-E market integration options (premium vs feed-in
tariff) affect the deployment of storage? Also, if in the long term subsidies for
RES-E can be phased out, it would be interesting to study the effect on storage
investments during a transitory period from subsidised to non-subsidised
regimes.
If an obligation was put on RES-E to provide the system services (mainly
balancing) needed for their integration, would this lead to a deployment of
storage and if yes, to what degree? How would storage share the market for such
services with RES-E enabled to provide these?
Study the impact of capacity mechanisms on storage deployment
As this market mechanism can both directly and indirectly impact the storage business
case, it should be subject of dedicated studies. It would be important to understand the
net benefit of capacity payments if (i) storage directly profits from these but (ii) these
ensure a higher system margin leading to lower peak power prices.
62
6 Bibliography
[1] P. H. Grünewald, T. T. Cockerill, M. Contestabile and P. J. Pearson, The socio-technical transition of distributed electricity storage into future networks — System value and stakeholder views, Energy Policy, 2012.
[2] P. Grünewald, “Electricity storage in future GB networks - a market failure?,” in BIEE 9th Academic Conference, Oxford, 2012.
[3] dena (Deutsche Energie-Agentur), “Analyse der Notwendigkeit des Ausbaus von Pumpspeicherwerken und anderen Stromspeichern zur Integration der erneuerbaren Energien,” dena, 2010.
[4] X. He, E. Delarue, W. D’haeseleer and J.-M. Glachant, “A novel business model for aggregating the values of electricity storage,” Energy Policy, no. 39, pp. 1575-1585, 2011.
[5] R. Sioshansi, P. Denholm and T. Jenkin, “A comparative analysis of the value of pure and hybrid electricity storage,” Energy Economics, pp. 56-66, 2011.
[6] L. E. Benitez, P. C. Benitez and G. C. van Kooten, “The economics of wind power with energy storage,” Energy Economics, no. 30, p. 1973–1989, 2008.
[7] S. W. Wallace and S.-E. Fleten, “Stochastic Programming Models in Energy,” in Handbooks in OR & MS, Vol.10, Elsevier, 2003.
[8] D. Möst and D. Keles, “A survey of stochastic modelling approaches for liberalised electricity markets,” European Journal of Operational Research, no. 207, p. 543–556, 2010.
[9] H. Arsham, “University of Baltimore,” [Online]. Available: http://home.ubalt.edu/ntsbarsh/opre640a/partVIII.htm#ropintroduction.
[10] A. M. Foley, B. P. Gallachóir, J. Hur, R. Baldick and E. J. McKeogh, “A strategic review of electricity systems models,” Energy, no. 35, pp. 4522-4530, 2010.
[11] A. J. Kleywegt and A. Shapiro, “Stochastic Optimization Chapter 101,” Atlanta, Georgia, School of Industrial and Systems Engineering, Georgia Institute of Technology, 2000.
[12] C. K. Ekman and S. H. Jensen, “Prospects for large scale electricity storage in Denmark,” Energy Conversion and Management, no. 51, p. 1140–1147, 2010.
[13] R. Sioshansi, P. Denholm, T. Jenkin and J. Weiss, “Estimating the value of electricity storage in PJM: Arbitrage and somewelfare effects,” Energy Economics, no. 31, p. 269–277, 2009.
[14] R. Sioshansi, “Welfare Impacts of Electricity Storage and the Implications of Ownership,” The Energy Journal, 2010.
[15] W.-P. Schill and C. Kemfert, “Modeling strategic electricity storage: the case of pumped hydro storage in Germany,” DIW - Deutsches Institut fuer Wirtschaft, Berlin, 2010.
63
[16] X. He, E. Delarue, W. D'haeseleer and J.-M. Glachant, “Coupling electricity storage with electricity markets: a welfare analysis in the French market,” KU Leuven (Working Paper), 2012.
[17] X. He, R. Lecomte, A. Nekrassov, E. Delarue and E. Mercier, “Compressed Air Energy Storage multi-stream value assessment on the French energy market,” in PowerTech, IEEE, Trondheim, 2011.
[18] G. N. Bathurst and G. Strbac, “Value of combining energy storage and wind in short-term energy and balancing markets,” Electric Power Systems Research, no. 67, pp. 1-8, 2003.
[19] E. Drury, P. Denholm and R. Sioshansi, “The value of compressed air energy storage in energy and reserve markets,” Energy, pp. 4959-4973, 2011.
[20] D. Connolly, H. Lund, B. Mathiesen, E. Pican and M. Leahy, “The technical and economic implications of integrating fluctuating renewable energy using energy storage,” Renewable Energy, pp. 47-60, 2012.
[21] R. Deb, “Operating Hydroelectric Plants and Pumped Storage Units in a Competitive Environment,” The Electricity Journal, pp. 24-32, 2000.
[22] R. Walawalkar, J. Apt and R. Mancini, “Economics of electric energy storage for energy arbitrage and regulation in New York,” Energy Policy, no. 35, pp. 2258-2268, 2007.
[23] Fraunhofer, “Possible Developments of Market Conditions Determining the Economics of Large Scale Compressed Air Energy Storage (>100 MW),” Fraunhofer and Karlsruhe Insitute of, 2009.
[24] R. Sioshansi, X. Xi and V. Marano, “A Stochastic Dynamic Programming Model for Co-optimization of Distributed Energy Storage,” Energy Economics, no. Preprint, 2013.
[25] PNNL - Pacific Northwest National Laboratory, “National Assessment of Energy Storage for Grid Balancing and Arbitrage: Phase 1, WECC,” PNNL, Richland, Washington, 2012.
[26] S. J. Kazempour, M. P. Moghaddam, M. R. Haghifam and G. R. Yousefi, “Electric energy storage systems in a market-based economy: Comparison of emerging and traditional technologies,” Renewable Energy, no. 34, p. 2630–2639, 2009.
[27] dena (Deutsche Energie-Agentur), “Pumpspeicherstudie,” dena, 2008.
[28] A. Nekrassov, X. He and B. Prestat, “Efficiency analysis of incentive mechanisms for energy storage integration into electrical systems,” in IEEE PowerTech, Trondheim, 2011.
[29] M. Delfanti, M. Gallanti, E. Macchi and L. Mazzochi, “Relazione valutativa delle istanze di ammissione al trattamento incentivante ai sensi della Delibera 288/12/R/eel dell’Autorità per l’energia elettrica e il gas,” 2013.
[30] P. Mokrian and S. Moff, “A Stochastic Programming Framework for the Valuation of Electricity Storage,” Stanford University, 2006.
[31] E. Haesen, J. Driesen and R. Belmans, “Multi-objective Valuation of
64
Electricity Storage Services,” Preprint, 2007.
[32] D. Keles, R. Hartel, D. Möst and W. Fichtner, “Compressed-air energy storage power plant investments under uncertain electricity prices: an evaluation of compressed-air energy storage plants in liberalized energy markets,” The Journal of Energy Markets, vol. 5, no. 1, pp. 53-84, 2012.
[33] J. Qin, R. Sevlian, D. Varodayan and R. Rajagopal, “Optimal Electric Energy Storage Operation,” San Diego, Power and Energy Society General Meeting, 2012.
[34] M. Korpaas, A. T. Holen and R. Hildrum, “Operation and sizing of energy storage for wind power plants in a market system,” vol. Electrical power & energy systems, no. 25, 2003.
[35] S. D. Howell, P. W. Duck, A. Hazel, P. V. Johnson, H. Pinto, G. Strbac, N. Proudlove and M. Black, “A partial differential equation system for modelling stochastic storage in physical systems with applications to wind power generation,” vol. IMA Journal of Management Mathematics, no. 22, 2009.
[36] I. Arsie, V. Marano, M. Moran, G. Rizzo and G. Savino, “Optimal management of a wind/CAES power plant by means of neural network wind speed forecast,” Milan, 2007.
[37] J. P. Barton and D. G. Infield, “Energy Storage and Its Use With Intermittent Renewable Energy,” vol. TRANSACTIONS ON ENERGY CONVERSION, no. 19, 2004.
[38] EPRI , “Electricity Energy Storage Technology Options - A White Paper Primer on Applications, Costs and Benefits,” EPRI (ELECTRIC POWER RESEARCH INSTITUTE), Palo Alto, California, 2010.
[39] J. García-González, R. MoragaRuiz de la Muela, L. Matres Santos and A. Mateo González, “Stochastic Joint Optimization of Wind Generation and Pumped-Storage Units in an Electricity Market,” vol. TRANSACTIONS ON POWER SYSTEMS, no. 23, 2008.
[40] M.-A. Hessami, “Economic feasibility and optimisation of an energy storage system for Portland Wind Farm (Victoria, Australia),” Applied Energy, no. 88, p. 2755–2763, 2011.
[41] P. Denholm and R. Sioshansi, “The value of compressed air energy storage with wind in transmission-constrained electric power systems,” Energy Policy, p. 3149–3158, 2009.
[42] R. Loisel, A. Mercier, C. Gatzen, N. Elm and P. Hvroje, “Valuation framework for large scale electricity storage in ac ase with wind curtailment,” Energy Policy, no. 38, p. 7323–7337, 2010.
[43] R. Loisel, A. Mercier, C. Gatzen and N. Elms, “Market evaluation of hybrid wind-storage power systems in case of balancing responsibilities,” vol. Renewable and Sustainable Energy Reviews, no. 15, 2011.
[44] M. Black and G. Strbac, “Value of storage in providing balancing services for electricity generation systems with high wind penetration,” Journal of Power Sources, pp. 949-953, 2006.
65
[45] SANDIA, “Energy Storage for the Electricity Grid: Benefits and Market Potential Assessment Guide,” Sandia National Laboratories, Albuquerque, New Mexico, 2010.
[46] G. Delille, Contribution du Stockage à la Gestion Avancée des Systèmes Électriques, Approches Organisationnelles et Technico-économiques dans les Réseaux de Distribution, PhD Thesis, Ecole Centrale de Lille, 2010.
[47] G. Delille, B. François, G. Malarange and J.-L. Fraisse, “Energy storage systems in distribution grids: new assets to upgrade distribution networks abilities,” Prague, 2009.
[48] P. Loevenbruck, “MULTI-SERVICES STORAGE PLANT AT A DOMESTIC CUSTOMER’S PREMISES: EFFECT OF SIMULTANEOUS REQUESTS,” Stockholm, 10-13 June 2013.
[49] dena (Deutsche Energie-Agentur), “dena-Netzstudie II,” dena, Berlin, 2010.
[50] dena (Deutsche Energie-Agentur), “Integration der erneuerbaren Energien in den deutschen/europäischen Strommarkt,” dena, 2012.
[51] G. Strbac, “Strategic Assessment of the Role and Value of Energy Storage Systems in the UK Low Carbon Energy Future - Report for the Carbon Trust,” London, 2012.
[52] EUROPEAN COMMISSION, “Energy Roadmap 2050 - SEC(2011) 1565, 1566, 1569,” EUROPEAN COMMISSION, Brussels, 2011.
[53] EURELECTRIC, “Power Choices - Pathways to Carbon-Neutral Electricity in Europe by 2050,” EURELECTRIC, Brussels, 2011.
[54] International Energy Agency (IEA), “WORLD ENERGY OUTLOOK,” IEA, Paris, 2012.
[55] ENTSO-E, Guideline for Cost Benefit Analysis of Grid Developement Projects, December 2012.
[56] VDE, “Energiespeicher fuer die Energiewende - Speicherungsbedarf und Auswirkungen auf das Uebertragungsnetz fuer Szenarien bis 2050,” VDE, 2012.
[57] M. Blesl, The role of technologies and structural changes in the energy system of the EU 27 to achieve the long term greenhouse gas reduction target of 80 %, Sophia Antipolis, France: Institute of Energy Economics and the Rational Use of Energy, University of Stuttgart, 2012.
[58] U. Remme, Basic elements and equations of TIMES, Stuttgart: Institut für Energiewirtschaft und Rationelle Energieanwendung, Universität Stuttgart, 2006.
[59] dena (Deutsche Energie-Agentur), “Ausbau- und Innovationsbedarf der Stromverteilnetze in Deutschland bis 2030 (dena-Verteilnetzstudie),” dena, Berlin, 2012.
[60] THINK, “Cost Benefit Analysis in the Context of the Energy Infrastructure Package,” 7th Frawork programme - THINK Topic 10, January 2013.
[61] E. A. f. S. o. Energy, “EASE input to the methodology defining a Cost-Benefit Analysis for Energy Storage,” April 2013.
66
[62] Y. Rebours, M. Trotignon, V. Lavier, T. Derbanne and F. Meslier, “How Much Electric Interconnection Capacities are Needed within Western Europe?,” 2010.
[63] D. J. Swider, “Compressed Air Energy Storage in an Electricity System With Significant Wind Power Generation,” vol. TRANSACTIONS ON ENERGY CONVERSION, no. 22, 2007.
[64] M. Black, V. Silva, G. Strbac and D. Pudjianto, “DTI project, Value of Energy Storage in Balancing, Capacity & Transmission,” Imperial College, London, 2006.
[65] G. Salgi and H. Lund, “System behaviour of compressed-air energy-storage in Denmark with a high penetration of renewable energy sources,” vol. Applied Energy, no. 85, 2007.
[66] H. Lund, G. Salgi, B. Elmegaard and A. Andersen, “Optimal operation strategies of compressed air energy storage (CAES) on electricity spot markets with fluctuating prices,” Applied Thermal Engineering, no. 29, pp. 799-806, 2009.
[67] D. Connolly, H. Lund, P. Finn, B. Mathiesen and M. Leahy, “Practical operation strategies for pumped hydroelectric energy storage,” vol. Energy Policy, no. 39, 2011.
[68] A. Tuohy and M. O’Malley, “Pumped storage in systems with very high wind penetration,” Energy Policy, no. 39, pp. 1975-1974, 2011.
[69] B. Nyamdash, E. Denny and M. O'Malley, “The viability of balancing wind generation with large scale energy storage,” vol. Energy Policy, no. 38, 2009.
[70] D. Heide, L. von Bremen, M. Greiner, C. Hoffmann, M. Speckmann and S. Bofinger, “Seasonal optimal mix of wind and solar power in a future, highly renewable Europe,” vol. Renewable Energy, no. 35, 2010.
[71] D. Heide, M. Greiner, L. von Bremen and C. Hoffmann, “Reduced storage and balancing needs in a fully renewable European power system with excess wind and solar power generation,” Thiele centre for applied mathematics in natural science, 2011.
[72] F. Steinke, P. Wolfrum and C. Hoffmann, “Transport vs. Storage in a 100% Renewable Europe,” vol. Submitted to Renewable Energy, 2012.
[73] M. Esteban, Q. Zhang and A. Utama, “Estimation of the energy storage requirement of a future 100% renewable energy system in Japan,” vol. Energy Policy, no. 47, 2012.
[74] N. S. Pearre and L. G. Swan, “Renewable electricity and energy storage to permit retirement of coal-fired generators in Nova Scotia,” vol. Sustainable Energy Technologies and Assessments, 2013.
[75] P. Grünewald, T. Cockerill, M. Contestabile and P. Pearson, “The role of large scale storage in a GB low carbon energy future: Issues and policy challenges,” vol. Energy Policy, no. 39, 2011.
[76] C. Budishak, D. Sewell, H. Thomson, L. March, D. E. Veron and W. Kempton, “Cost-minimized combinations of wind power, solar and
67
electrochemical storage, powering the grid 99.9% of the time,” Journal of Power Sources, no. 225, pp. 60-74, 2013.
[77] V. Silva, V. Stanojevic, D. Pudjianto and G. Strbac, “Application of Storage to Release Electricity Network Capacity,” in CIGRE - Power System Networks for the 21st Century and Beyond, 2008.
[78] L. C. R. Authority, “Study of electric transmission in conjunction with energy storage technology,” Report for the Texas state energy conservation office, 2003.
[79] V. Stanojevic, V. Silva, D. Pudjanto, G. Strbac, P. Lang and D. Macleman, “Application of storage and demand side management to optimise existing network capacity,” Prague 20th International Conference on Electricity Distribution, 2009.
[80] G. Delille, “Analysis of the options to reduce the integration costs of renewable generation in the distribution networks. Part 2: a step towards advanced connection studies taking into account the alternatives to grid reinforcement,” 2013.
[81] A. Keane, L. Ochoa, C. Borges, G. Ault, A. Alarcon-rodriguez, R. Currie, F. Pilo, C. Dent and G. Harrisson, “State of the art techniques and challenges ahead for distributed generation planning and optimization,” vol. Transactions on Power Systems, 2012.
[82] W. Tan, M. Yusri, S. Majid and H. Rahman, “Optimal distributed renewable generation planning: a review of different approaches,” vol. Renewable and Sustainable energy reviews, 2010.
[83] C. Gan, P. Mancarella, D. Pudjanto and G. Strbac, “Statistical appraisal of economic design strategies of LV distribution networks,” vol. Electric Power Systems Research, no. vol 81, 2011.
[84] EURELECTRIC, “EU Islands: Towards a Sustainable Energy Future,” Eurelectric, Brussels, 2012.
[85] J. Kaldellis, D. Zafikaris and E. Kondili, “Optimum sizing of photovoltaic-energy storage systems for autonomous small islands,” vol. Electrical Power and Energy Systems, 2009.
[86] M. Kapsali, J. Anagnostopoulos and J. Kaldellis, “Wind powered pumped-hydro storage systems for remote islands: A complete sensitivity analysis based on economic perspectives,” vol. Applied Energy, 2012.
[87] E. Lobato, L. Rouco and L. Sigrist, “Economic assemssment of providing primary reserve services with energy storage systems in isolated systems”.
[88] R. Carapellucci and L. Giordano, “Modeling and optimization of an energy generation island based on renewable technologies and hydrogen storage systems,” vol. International Journal of Hydrogen Economy, 2011.
[89] G. Delille, B. François and G. Malarange, “Dynamic Frequency Control Support by energy storage to reduce the impact of Wind and Solar generation on isolated power systems,” vol. Transactions on Sustainable Energy, no. 3, 2012.
[90] European Commission - Directorate General Energy, Public Consultation:
68
Generation adequacy, capacity mechanisms and the internal market in electricity, 2012.
[91] C. M. Vilar, “Do we need special regulatory (and thus market) frameworks for storage? - The example of Spain,” in Grid scale energy storage, Brussels, 2012.
[92] P. Denholm, J. Jorgenson, M. Hummon, T. Jenkin, D. Palchak, B. Kirby, O. Ma and M. O'Malley, “The Value of Energy Storage for Grid Applications,” National Renewable Energy Laboratory (NREL), Golden, Colorado, 2013.
[93] P. Denholm, E. Ela, B. Kirby and M. Milligan, “The role of energy storage with renewable electricity generation,” National Renewable Energy Laboratory, Golden, Colorado, 2010.
[94] M. Beaudin, H. Zareipour, A. Schellenberglabe and W. Rosehart, “Energy storage for mitigating the variability of renewable electricity sources : An updated review,” Energy for Sustainable Development, no. 14, pp. 302-314, 2010.
[95] B. Steffen, “Prospects forpumped-hydrostorageinGermany,” Energy Policy, no. 45, pp. 420-429, 2012.
[96] B. Rangoni, “A contribution on electricity storage: The case of hydro-pumped storage appraisal and commissioning in Italy and Spain,” Utilities Policy, 2012.
[97] EUROSTAT, “HICP - inflation rate, Real effective exchange rate - 36 trading partners,” EUROSTAT, Brussels, 2012.
[98] JRC, “Technology Map of the European Strategic Energy Technology Plan (SET Plan),” Publications Office of the European Union, Luxembourg, 2011.
[99] Á. J. Duque, E. D. Castronuovo, I. Sánchez and J. Usaola, “Optimal operation of a pumped-storage hydro plant that compensates the imbalances of a wind power producer,” no. 81, p. 1767– 1777, 2011.
[100] N. Lu, J. H. Chow and A. A. Desrochers, “Pumped-Storage Hydro-Turbine Bidding Strategies in a Competitive Electricity Market,” IEEE TRANSACTIONS ON POWER SYSTEMS, vol. 19, pp. 834 - 841, 2004.
[101] T. Muche, “A real option-based simulation model to evaluate investments in pump storage plants,” Energy Policy, no. 37, pp. 4581-4682, 2009.
[102] A. Yucekaya, “The operationl economics of compressed air energy storage system under uncertainty,” Renewable and Sustainable Energy Reviews, no. 22, pp. 298 - 305, 2013.
[103] V. Marano, G. Rizzo and F. A. Tiano, “Application of dynamic programming to the optimal management of a hybrid power plant with wind turbines, photovoltaic panels and compressed air energy storage,” Applied Energy, no. 97, pp. 849-859, 2012.
[104] E. Fertig and J. Apt, “Economics of compressed air energy storage to integrate wind power : A case study in ERCOT,” Energy Policy, p. 2330–2342, 2011.
69
[105] C. Gatzen, The Economics of Power Storage, Oldenbourg Industrieverlag, 2008.
[106] H. Lund and G. Salgi, “The role of compressed air energy storage (CAES) in future sustainable energy systems,” Energy Conversion and Management, no. 50, pp. 1172-1179, 2009.
[107] R. Madlener and J. Latz, “Economics of centralized and decentralized compressed air energy storage for enhanced grid integration of wind power,” Applied Energy, no. 101, pp. 299-309, 2013.
[108] B. Mauch, P. M. S. Carvalho and J. Apt, “Can a wind farm with CAES survive in the day-ahead market?,” Energy Policy, no. 48, pp. 584-593, 2012.
[109] Y. Rebours, D. Kirschen, M. Trotignon and S. Rossignol, “A Survey of Frequency and Voltage Control AncillaryServices—Part I: Technical Features,” IEEE TRANSACTIONS ON POWER SYSTEMS, vol. 22, pp. 350-357, 2007.
[110] V. L. Fernandes de Paiva da Silva, “Value of flexibility in systems with large wind penetration,” Imperial College, London, 2010.
[111] T. Sikorski, “Redesign of Polish electricity market and its integration into single European market,” in 6th Market Design Conference, Stockholm, 2011.
[112] A. G. Isenmonger, “The viability of the Competitive Procurement of Black Start: Lessons from the RTOs,” The Electricity Journal, vol. 20, no. 8, pp. 60-67, 2007.
[113] B. Nyamdash and E. Denny, “The impact of electricity storage on wholesale electricity prices,” Energy policy, no. 58, pp. 6-16, 2013.
[114] P. Denholm and M. Hand, “Grid flexibility and storage required to achieve very high penetration of variable renewable electricity,” Energy Policy, no. 39, pp. 1817-1830, 2011.
[115] GE Energy, “Western Wind and Solar Integration Study,” National Renewable Energy Laboratory (NREL), Golden, Colorado, 2010.
[116] M. G. Rasmussen, G. B. Andreasen and M. Greiner, “Storage and balancing synergies in a fully or highly renewable pan-European power system,” Energy policy, no. 51, pp. 642-651, 2012.
[117] D. Rastler, “MISO Energy Storage Study Phase 1 Report,” EPRI, Palo Alto, CA, 2011.
[118] F. Steinke, P. Wolfrum and C. Hoffmann, “Grid vs. storage in a 100% renewable Europe,” Renewable Energy, no. 50, pp. 826-832, 2013.
[119] VDE, “Aktive Energienetze im Kontext der Energiewende,” VDE, Frankfurt am Main, 2013.
[120] M. Nicolosi, The Economics of Renewable Electricity Market Integration, Cologne: EWI, 2011.
[121] stoRE, “European Regulatory and Market Framework for Electricity Storage Infrastructure,” stoRE Project, 2013.
70
[122] J. Vasconcelos, S. Ruester, X. He, E. Chong and J.-M. Glachant, “Electricity Storage: How to Facilitate its Deployment and Operation in the EU,” Think Project, 2012.
[123] C.-J. Yang and R. B. Jackson, “Opportunities and barriers to pumped-hydro energy storage in the United States,” Renewable and Sustainable Energy Reviews, pp. 839-844, 2011.
[124] Z. Ming, Z. Kun and L. Daoxin, “Overall review of pumped-hydro energy storage in China: Status quo, operation mechanism and policy barriers,” RenewableandSustainableEnergyReviews, pp. 35-43, 2013.
[125] EURELECTRIC, “Europe Needs Hydro Pumped Storage: Five Recommendations,” EURELECTRIC, 2012.
[126] Bundesrepublik Deutschland, Gesetz über die Elektrizitäts- und Gasversorgung, Federal Republic of Germany, 2013.
[127] European Association for the Storage of Energy and European Energy Research Alliance, “Joint EASE/EERA recommendations for a European Energy Storage Technology Development Roadmap towards 2030,” EASE; EERA, 2013.
[128] stoRE, “Facilitating energy storage to allow high penetration of intermitent renewable energy,” stoRE project, 2012.
[129] European Parliament and Council, Directive 2000/60/EC - Establishing a framework for Community action in the field of water policy, 2000.
[130] European Council, DIRECTIVE 92/43/EEC - Conservation of natural habitats and of wild fauna and flora, 1999.
[131] European Parliament and Council, DIRECTIVE 2009/147/EC - On the conservation of wild birds, 2009.
[132] EUROPEAN PARLIAMENT AND COUNCIL, DIRECTIVE 2001/42/EC - On the assessment of the effects of certain plans and programmes on the environment, 2001.
[133] EUROPEAN PARLIAMENT AND COUNCIL, DIRECTIVE 2011/92/EU - On the assessment of the effects of certain public and private projects on the environment, 2011.
[134] R. Madlener and J. Latz, “Economics of centralized and decentralized compressed air energy storage for enhanced grid integration of wind power,” Applied Energy, 2011.
[135] 3E, EPIA, IWES, “Ancillary Services by Solar PV - Capabilities and Costs,” 2013.
[136] Fraunhofer IWES, DTU Wind Energy, EWEA, “Capabilities and costs for ancillary services provision by wind power plants,” 2013.
[137] ENTSOE, “Survey on Ancillary Services Procurement & Balancing market design,” 2012.
[138] ENTSOE, “ENTSO-E Draft Network Code on Electricity Balancing,” ENTSOE, 2013.
71
[139] UNITED STATES OF AMERICA FEDERAL ENERGY REGULATORY COMMISSION, Order No. 890-B - Preventing Undue Discrimination and Preference in Transmission Service, Washington, D.C., 2008.
[140] UNITED STATES OF AMERICA FEDERAL ENERGY REGULATORY COMMISSION, Order No. 755 - Frequency Regulation Compensation in the Organized Wholesale Power Markets, Washington DC, 2011.
[141] Y. Rebours, D. Kirschen, M. Trotignon and S. Rossignol, “A Survey of Frequency and Voltage Control Ancillary Services—Part II: Economic Features,” IEEE TRANSACTIONS ON POWER SYSTEMS, vol. 22, pp. 358-366, 2007.
[142] EURELECTRIC, “Active Distribution System Management - A key tool for the smooth integration of distibuted generartion,” EURELECTRIC, Brussels, 2013.
[143] ENTSOE, “Ten-Year Network Development Plan,” ENTSOE, Brussels, 2012.
[144] EUROPEAN PARLIAMENT AND COUNCIL, 2009/72/EC Common rules for the internal market in electricity and repealing Directive 2003/54/EC, 2009.
[145] G. Krajacic, N. Duic, A. Tsikalakis, M. Zoulias, G. Caralis, E. Panteri and M. da Graca Carvalho, “Feed-in tariffs for promotion of energy storage technologies,” Energy Policy, no. 39, p. 1410–1425, 2011.
[146] D. Zafirakis, K. Chalvatzis, G. Baiocchi and G. Daskalakis, “Modeling of financial incentives for investments in energy storage systems that promote the large-scale integration of wind energy,” Applied Energy, no. 105, pp. 138-154, 2013.
[147] V. Rious, “What Type(s) of Support Schemes for Storage in Island Power Systems?,” Reflexive Governance in the Public Interest - Institutional Frames for Markets, April 2010.
[148] EURELECTRIC, “RES Integration and Market Design - are Capacity Remuneration Mechanisms needed to ensure generation adequacy?,” EURELECTRIC, Brussels, 2011.
[149] K. Schmitz, B. Steffen and C. Weber, “Incentive or impediment? The impact of capacity mechanisms on storage plants,” European University Institute - Loyola de Palacio Programme on Energy Policy, 2013.
[150] EWI University of Cologne (on behalf of IEA), “Flexibility options in European electricity markets in high RES-E scenarios,” OECD/IEA, 2012.
[151] M. Ventosa, A. Baillo, A. Ramos and M. Rivier, “Electricity market modeling trends,” Energy Policy, no. 33, p. 897–913, 2005.
[152] N. Sivakumar, D. Das, N. P. Pahdy, A. R. Senthil Kumar and N. Bisoyi, “Status of pumped hydro-storage schemes and its future in India,” Renewable and Siustainable Energy Reviews, no. 19, pp. 208-213, 2013.
[153] Pöyry. [Online]. Available: http://www.poyry.com/bid3.
[154] PSR, [Online]. Available: http://www.psr-inc.com.br.

72
[155] European Parliament and Council, 96/92/EC Common rules for the internal market in electricity, 1996.
[156] European Parliament and Council, 2003/54/EC Common rules for the internal market in electricity and repealing Directive 96/92/EC, 2003.
[157] EURELECTRIC, “The financial situation of the electricity industry- economic and financial update,” EURELECTRIC, Brussels, 2012.

73
Acknowledgements We would like to thank the JRC and EDF reviewers of this document: Esthathios PETEVES, Christian THIEL, Marc TROTIGNON, Vera SILVA and Bruno PRESTAT.
We also would like to acknowledge the help and feed-back of a number of colleagues, among whom Gregory Fayet, Marion Steward, Xavier Mamo, Yannick Phulpin, Jerome Boujac, and many more.
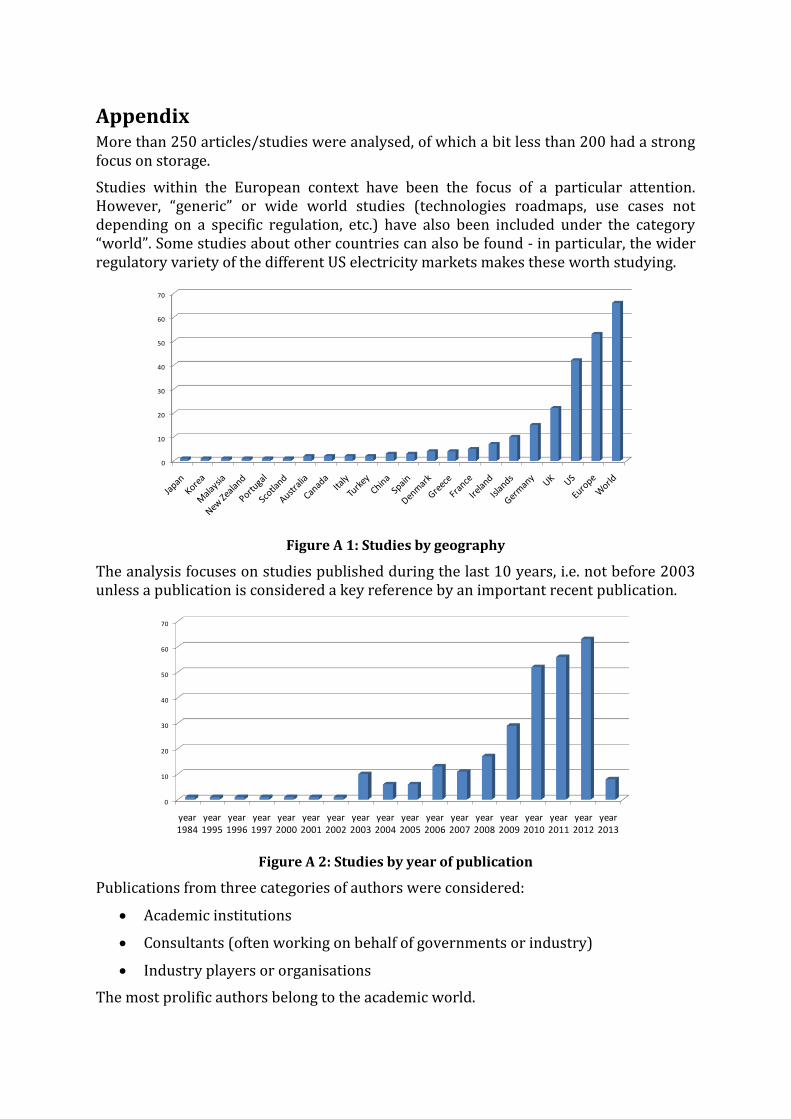
Appendix More than 250 articles/studies were analysed, of which a bit less than 200 had a strong focus on storage.
Studies within the European context have been the focus of a particular attention. However, “generic” or wide world studies (technologies roadmaps, use cases not depending on a specific regulation, etc.) have also been included under the category “world”. Some studies about other countries can also be found - in particular, the wider regulatory variety of the different US electricity markets makes these worth studying.
Figure A 1: Studies by geography
The analysis focuses on studies published during the last 10 years, i.e. not before 2003 unless a publication is considered a key reference by an important recent publication.
Figure A 2: Studies by year of publication
Publications from three categories of authors were considered:
Academic institutions
Consultants (often working on behalf of governments or industry)
Industry players or organisations
The most prolific authors belong to the academic world.
0
10
20
30
40
50
60
70
0
10
20
30
40
50
60
70
year 1984
year 1995
year 1996
year 1997
year 2000
year 2001
year 2002
year 2003
year 2004
year 2005
year 2006
year 2007
year 2008
year 2009
year 2010
year 2011
year 2012
year 2013
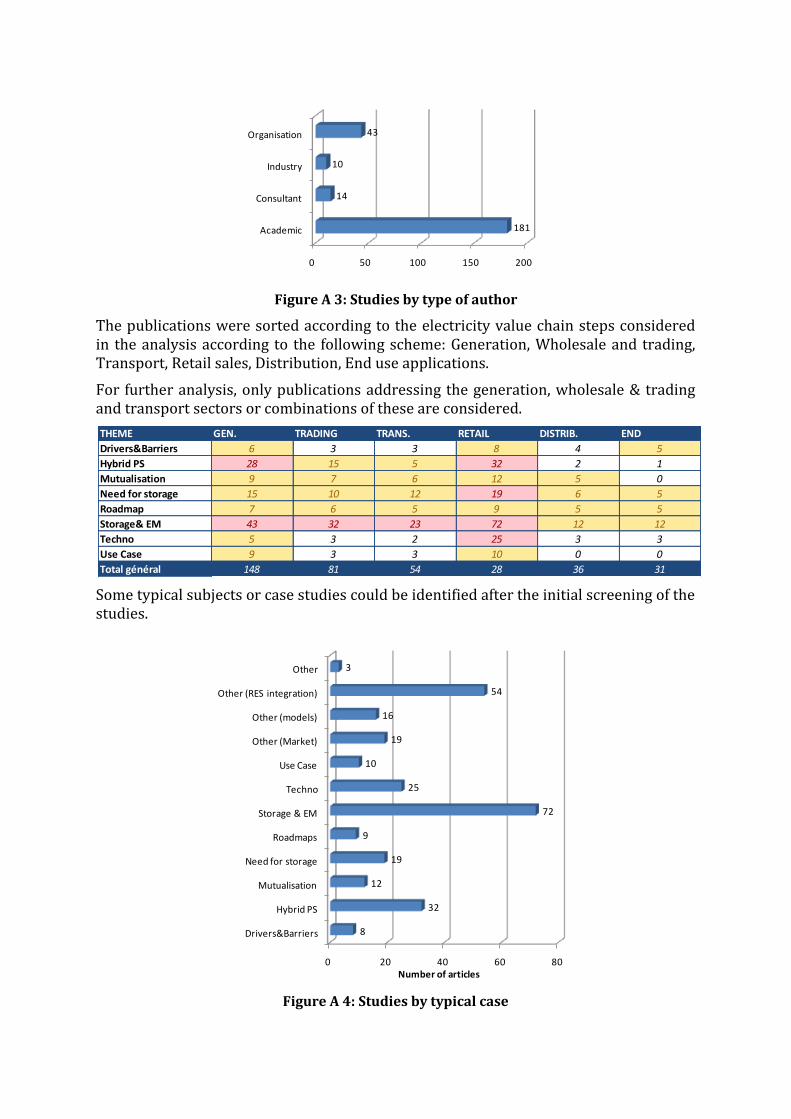
Figure A 3: Studies by type of author
The publications were sorted according to the electricity value chain steps considered in the analysis according to the following scheme: Generation, Wholesale and trading, Transport, Retail sales, Distribution, End use applications.
For further analysis, only publications addressing the generation, wholesale & trading and transport sectors or combinations of these are considered.
Some typical subjects or case studies could be identified after the initial screening of the studies.
Figure A 4: Studies by typical case
0 50 100 150 200
Academic
Consultant
Industry
Organisation
181
14
10
43
THEME GEN. TRADING TRANS. RETAIL DISTRIB. END
Drivers&Barriers 6 3 3 8 4 5
Hybrid PS 28 15 5 32 2 1
Mutualisation 9 7 6 12 5 0
Need for storage 15 10 12 19 6 5
Roadmap 7 6 5 9 5 5
Storage& EM 43 32 23 72 12 12
Techno 5 3 2 25 3 3
Use Case 9 3 3 10 0 0
Total général 148 81 54 28 36 31
0 20 40 60 80
Drivers&Barriers
Hybrid PS
Mutualisation
Need for storage
Roadmaps
Storage & EM
Techno
Use Case
Other (Market)
Other (models)
Other (RES integration)
Other
8
32
12
19
9
72
25
10
19
16
54
3
Number of articles


European Commission
EUR 26056 – Joint Research Centre – Institute for Energy and Transport
Title: Assessing Storage Value in Electricity Markets
Author(s): Andreas ZUCKER, Timothée HINCHLIFFE, Amanda SPISTO
Luxembourg: Publications Office of the European Union
2013 – 74 pp. – 21.0 x 29.7 cm
EUR – Scientific and Technical Research series – ISSN 1831-9424 (online), ISSN 1018-5593 (print)
ISBN 978-92-79-32362-1 (pdf)
ISBN 978-92-79-32363-8 (print)
doi: : 10.2790/89242
Abstract
This report summarises the results of joint EDF R&D / JRC-IET research effort on energy storage. It provides a summary review of
current literature on energy storage with particular attention to three broad topics: (i) the methodologies used for assessing storage
value as defined by the fundamental assumptions, the problem definition and the solving strategies, (ii) the current market
environment for electricity storage including drivers and barriers to deployment, the impact of technology developments, and (iii)
the range of possible regulatory environments which would address the current challenges of power storage.

z
As the Commission’s in-house science service, the Joint Research Centre’s mission is to provide EU
policies with independent, evidence-based scientific and technical support throughout the whole policy
cycle.
Working in close cooperation with policy Directorates-General, the JRC addresses key societal
challenges while stimulating innovation through developing new standards, methods and tools, and
sharing and transferring its know-how to the Member States and international community.
Key policy areas include: environment and climate change; energy and transport; agriculture and food
security; health and consumer protection; information society and digital agenda; safety and security
including nuclear; all supported through a cross-cutting and multi-disciplinary approach.
LD
-NA
-26
056
-EN
-N