assessing spatial variation of contaminants using … · assessing spatial variation of...
TRANSCRIPT
Assessing spatial variation of contaminants using Arc GIS: the case of Abou Ali River in North Lebanon
M. A. Massoud1, 2, M. El-Fadel3, M. D. Scrimshaw1 & J. N. Lester1 1Environmental Processes and Water Technology Research Group, Department of Environmental Science and Technology, Imperial College London, U.K. 2Department of Environmental Health, Faculty of Health Sciences, American University of Beirut 3Department of Civil and Environmental Engineering, American University of Beirut
Abstract
Several factors affect the concentration of contaminants in river water including, but not limited, to watershed characteristics, rainfall patterns, catchment hydrology, geology and soils, in addition to anthropogenic sources such as agricultural runoff and municipal and industrial discharges. Since surface water drains to one outlet in a watershed eventually reaching the estuary, upstream land-based activities affect the water quality at that point. This study assesses the land use impact on water quality in the Abou Ali River Basin and its coastal zone in North Lebanon, based on multiple indicators. The assessment was conducted at the end of the dry season in 2002 and 2003 and the end of the wet season in 2003 and 2004. The objectives of this research are to establish relationships among changes in contaminant concentrations in water emanating from land use and probable natural landscape influences. An approach based on the use of Geographic Information System techniques was used to investigate spatial variation of contaminant loads to Abou Ali River Basin and its associated coastal zone. Lower water quality was encountered in areas impacted by human activity, primarily urban locations. The worst water quality is apparent in the estuary area where the total pollution of the upstream flow accumulates exacerbated by local wastewater discharge. This assessment is of major importance towards developing an integrated multipurpose usage plan for the Abou Ali River as well as towards an integrated river basin and coastal zone management plan. Such integrated management plans have the potential to address many of the shortcomings in water resources management in the catchment and prevent further deterioration by anticipating and avoiding new impacts. Keywords: assessment, GIS, water quality, variation, Abou Ali River, Lebanon.
© 2005 WIT Press WIT Transactions on Ecology and the Environment, Vol 83, www.witpress.com, ISSN 1743-3541 (on-line)
River Basin Management III 593
1 Introduction
Most watersheds encompass various land uses such as residential and commercial development, recreational and agricultural activities, manufacturing and industrial processing and each has an impact on water quality (Albek [1], Massoud et al. [2]). Rivers can assimilate municipal and industrial wastewater discharges and runoff from agricultural land, and highways. Moreover, they frequently constitute the main water resources for inland areas for irrigation, drinking and industrial activities (Massoud et al. [3]). Hence, the availability of reliable information on water quality is essential for effective and efficient water management. Furthermore, in coastal regions, surface water ultimately drains to an estuary. Thus, upstream land-based activities affect the water quality at that point. Chemically or biologically contaminated rivers have negative impacts on coastal zone communities. Although water quality studies have been conducted at a basin level for the last two decades, most of these studies focus on areas in the vicinity of pollution sources or use mathematical models to estimate pollutant loading from non point sources (Payraudeau et al. [4], Liu et al. [5]). Considering the complex interactions between land use, rivers, and associated coastal zones, an integrated approach incorporating environmental, socio-economic, institutional, and legislative aspects is essential (Bhuyan et al. [6]).
2 Study area
The area of the Abou Ali River basin is estimated at 484 Km2 of which 97 percent is mountainous. The average annual discharge rate is 262 million m3
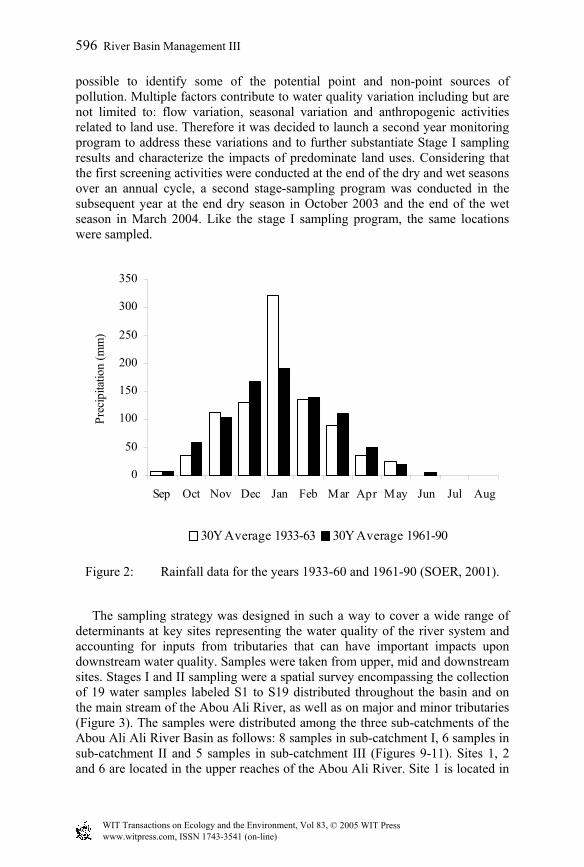
(SOER [7]). The river is 44.5 km-long and its basin encompasses nearly 236 towns and villages distributed among several administrative districts. The basin’s major urban complex is Tripoli, the second largest Lebanese city, with about 350,000 inhabitants. Historically, the region has been almost exclusively agricultural, but during the last three decades there has been a rapid increase in urban development at the expense of agriculture. The river crosses the coastal mountains in a narrow valley with steep profiles (1,850 m above sea level at the origin) and runs for approximately 3 Km passing through Tripoli on the flat coastal plain where an artificial, near rectangular concrete channel was constructed with vertical lateral retaining walls (~5 m high) to prevent flooding. A 3-D map of the river basin showing elevations above sea level is depicted in Figure 1. Populations along the river bank and in adjacent streets use the flood channel for wastewater discharge and rubbish disposal resulting in the accumulation of refuse on both sides of the channel (JICA and CDR [8]). The river basin and its coastal area are characterized by a Mediterranean climate with moderately warm and dry summer and autumn, and moderately cold, windy, and wet winter. Almost 80 to 90 percent of total precipitation occurs between November and March (Figure 2). Several complex systems of mountain ranges, with intervening valleys and plains lie within the basin. It is a complicated catchment with many side streams in addition to small and large tributaries that join the mainstream. On the basis of hydrology the catchment can
© 2005 WIT Press WIT Transactions on Ecology and the Environment, Vol 83, www.witpress.com, ISSN 1743-3541 (on-line)
594 River Basin Management III
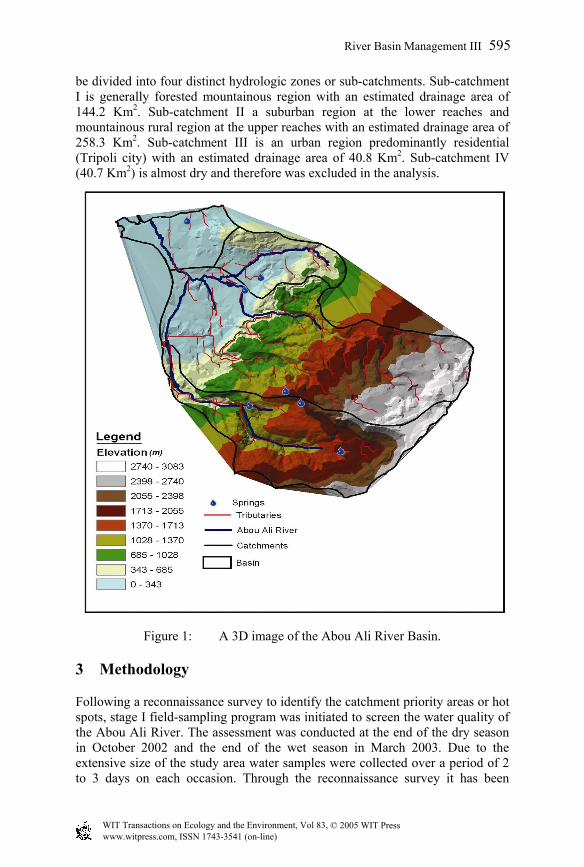
be divided into four distinct hydrologic zones or sub-catchments. Sub-catchment I is generally forested mountainous region with an estimated drainage area of 144.2 Km2. Sub-catchment II a suburban region at the lower reaches and mountainous rural region at the upper reaches with an estimated drainage area of 258.3 Km2. Sub-catchment III is an urban region predominantly residential (Tripoli city) with an estimated drainage area of 40.8 Km2. Sub-catchment IV (40.7 Km2) is almost dry and therefore was excluded in the analysis.
Figure 1: A 3D image of the Abou Ali River Basin.
3 Methodology
Following a reconnaissance survey to identify the catchment priority areas or hot spots, stage I field-sampling program was initiated to screen the water quality of the Abou Ali River. The assessment was conducted at the end of the dry season in October 2002 and the end of the wet season in March 2003. Due to the extensive size of the study area water samples were collected over a period of 2 to 3 days on each occasion. Through the reconnaissance survey it has been
© 2005 WIT Press WIT Transactions on Ecology and the Environment, Vol 83, www.witpress.com, ISSN 1743-3541 (on-line)
River Basin Management III 595
possible to identify some of the potential point and non-point sources of pollution. Multiple factors contribute to water quality variation including but are not limited to: flow variation, seasonal variation and anthropogenic activities related to land use. Therefore it was decided to launch a second year monitoring program to address these variations and to further substantiate Stage I sampling results and characterize the impacts of predominate land uses. Considering that the first screening activities were conducted at the end of the dry and wet seasons over an annual cycle, a second stage-sampling program was conducted in the subsequent year at the end dry season in October 2003 and the end of the wet season in March 2004. Like the stage I sampling program, the same locations were sampled.
Figure 2: Rainfall data for the years 1933-60 and 1961-90 (SOER, 2001).
The sampling strategy was designed in such a way to cover a wide range of determinants at key sites representing the water quality of the river system and accounting for inputs from tributaries that can have important impacts upon downstream water quality. Samples were taken from upper, mid and downstream sites. Stages I and II sampling were a spatial survey encompassing the collection of 19 water samples labeled S1 to S19 distributed throughout the basin and on the main stream of the Abou Ali River, as well as on major and minor tributaries (Figure 3). The samples were distributed among the three sub-catchments of the Abou Ali Ali River Basin as follows: 8 samples in sub-catchment I, 6 samples in sub-catchment II and 5 samples in sub-catchment III (Figures 9-11). Sites 1, 2 and 6 are located in the upper reaches of the Abou Ali River. Site 1 is located in
0
50
100
150
200
250
300
350
Sep Oct Nov Dec Jan Feb Mar Apr May Jun Jul Aug
Prec
ipita
tion
(mm
)
30Y Average 1933-63 30Y Average 1961-90
© 2005 WIT Press WIT Transactions on Ecology and the Environment, Vol 83, www.witpress.com, ISSN 1743-3541 (on-line)
596 River Basin Management III
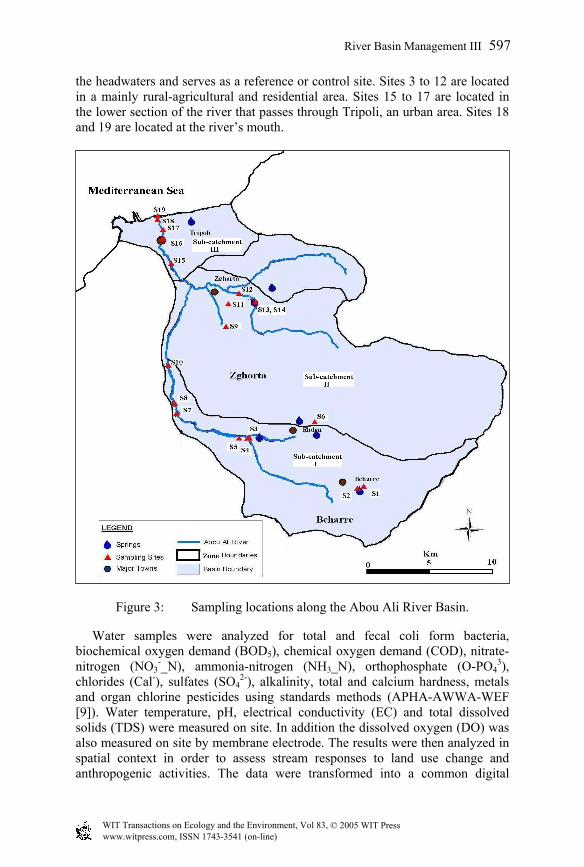
the headwaters and serves as a reference or control site. Sites 3 to 12 are located in a mainly rural-agricultural and residential area. Sites 15 to 17 are located in the lower section of the river that passes through Tripoli, an urban area. Sites 18 and 19 are located at the river’s mouth.
Figure 3: Sampling locations along the Abou Ali River Basin.
Water samples were analyzed for total and fecal coli form bacteria, biochemical oxygen demand (BOD5), chemical oxygen demand (COD), nitrate-nitrogen (NO3
-_N), ammonia-nitrogen (NH3_N), orthophosphate (O-PO43),
chlorides (Cal-), sulfates (SO42-), alkalinity, total and calcium hardness, metals
and organ chlorine pesticides using standards methods (APHA-AWWA-WEF [9]). Water temperature, pH, electrical conductivity (EC) and total dissolved solids (TDS) were measured on site. In addition the dissolved oxygen (DO) was also measured on site by membrane electrode. The results were then analyzed in spatial context in order to assess stream responses to land use change and anthropogenic activities. The data were transformed into a common digital
© 2005 WIT Press WIT Transactions on Ecology and the Environment, Vol 83, www.witpress.com, ISSN 1743-3541 (on-line)
River Basin Management III 597
format, projected onto a common coordinate system (Local Lebanese Lambert System) and analyzed using Argos 8.3. Since concentrations of nearly all metals and pesticides determined during the first year were below the detection limit, metal and pesticide analysis was discontinued thereafter.
4 Results and discussion
The results from this study showed that concentrations of most indicators at most sites were above natural background levels indicating human influence. Moreover, fecal and total coli form bacteria were detected at almost all sites indicating animal and/or human waste contamination. At the scale of the watershed, stream temperatures exhibited an increasing trend downstream due to lower elevation. The pH values were in the range typical of water bodies underlain by carbonate rocks (Korfball and Davies [10]) with moderately high alkalinity. The river is largely influenced by domestic sewage discharge followed by agricultural activities and wastes from slaughterhouses, pig farms, olive oil presses and recreational activities. The differences in topography among the sampling locations, actual volume of water in the stream and flow rate are additional important factors introducing changes to water quality. This may explain the generally higher levels of DO observed at the upstream tributaries. Higher levels of DO upstream correlated with the lowest temperatures as solubility of oxygen in water decreases with increasing temperature (Boor man [11]).The shallow, rapidly flowing and rocky nature of the Abou Ali River enhances aeration and hence saturation of water with DO. Besides, the lack of turbulent flow at certain sites such as the section of the river that crosses the City of Tripoli and higher temperatures renders the aeration process more difficult and may explain the observation of reduced values. Agricultural sites in the central areas of sub-catchments I and II correlated predominantly with elevated levels of NO3
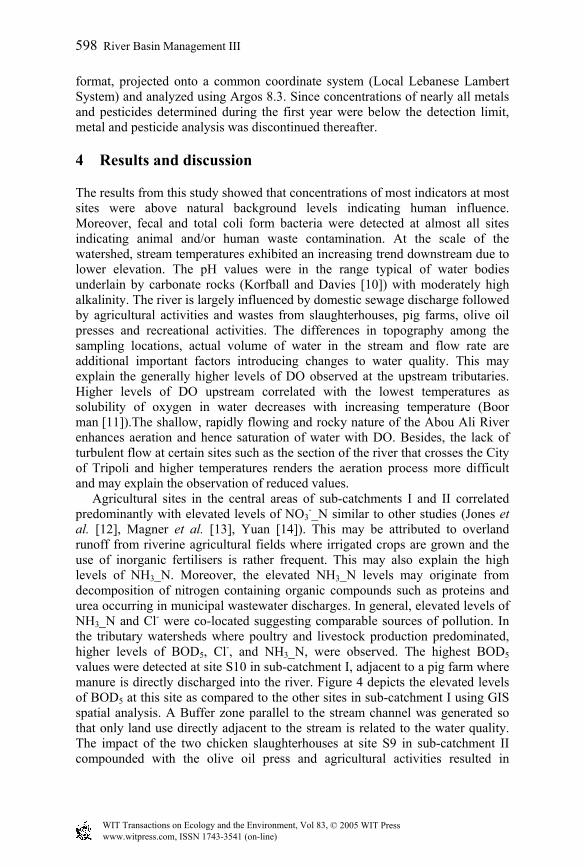
-_N similar to other studies (Jones et al. [12], Magner et al. [13], Yuan [14]). This may be attributed to overland runoff from riverine agricultural fields where irrigated crops are grown and the use of inorganic fertilisers is rather frequent. This may also explain the high levels of NH3_N. Moreover, the elevated NH3_N levels may originate from decomposition of nitrogen containing organic compounds such as proteins and urea occurring in municipal wastewater discharges. In general, elevated levels of NH3_N and Cl- were co-located suggesting comparable sources of pollution. In the tributary watersheds where poultry and livestock production predominated, higher levels of BOD5, Cl-, and NH3_N, were observed. The highest BOD5 values were detected at site S10 in sub-catchment I, adjacent to a pig farm where manure is directly discharged into the river. Figure 4 depicts the elevated levels of BOD5 at this site as compared to the other sites in sub-catchment I using GIS spatial analysis. A Buffer zone parallel to the stream channel was generated so that only land use directly adjacent to the stream is related to the water quality. The impact of the two chicken slaughterhouses at site S9 in sub-catchment II compounded with the olive oil press and agricultural activities resulted in
© 2005 WIT Press WIT Transactions on Ecology and the Environment, Vol 83, www.witpress.com, ISSN 1743-3541 (on-line)
598 River Basin Management III
marked deterioration of the water quality. Recreational activities appeared to be partly important in contributing to the spatial pattern of contamination.
Figure 4: Variation of BOD5 in sub-catchment I with site 10 exhibiting the
highest value.
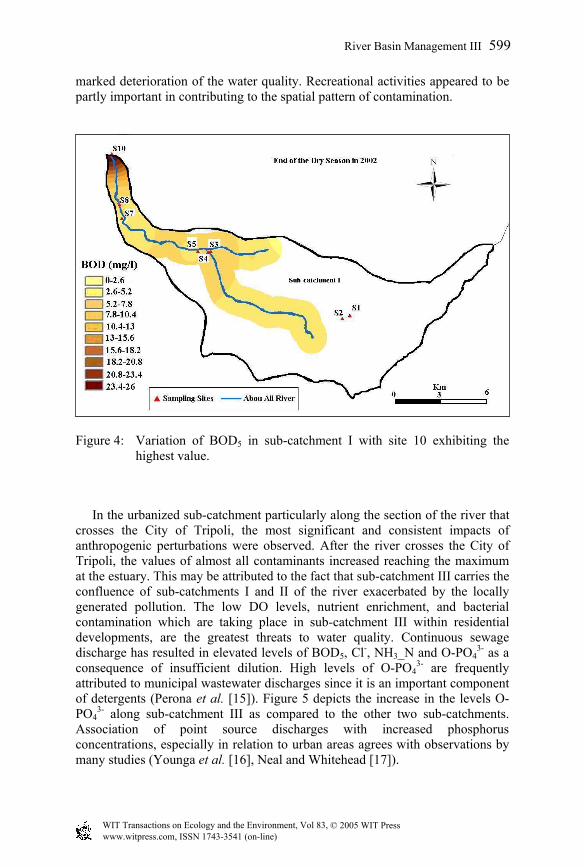
In the urbanized sub-catchment particularly along the section of the river that crosses the City of Tripoli, the most significant and consistent impacts of anthropogenic perturbations were observed. After the river crosses the City of Tripoli, the values of almost all contaminants increased reaching the maximum at the estuary. This may be attributed to the fact that sub-catchment III carries the confluence of sub-catchments I and II of the river exacerbated by the locally generated pollution. The low DO levels, nutrient enrichment, and bacterial contamination which are taking place in sub-catchment III within residential developments, are the greatest threats to water quality. Continuous sewage discharge has resulted in elevated levels of BOD5, Cl-, NH3_N and O-PO4
3- as a consequence of insufficient dilution. High levels of O-PO4
3- are frequently attributed to municipal wastewater discharges since it is an important component of detergents (Perona et al. [15]). Figure 5 depicts the increase in the levels O-PO4
3- along sub-catchment III as compared to the other two sub-catchments. Association of point source discharges with increased phosphorus concentrations, especially in relation to urban areas agrees with observations by many studies (Younga et al. [16], Neal and Whitehead [17]).
© 2005 WIT Press WIT Transactions on Ecology and the Environment, Vol 83, www.witpress.com, ISSN 1743-3541 (on-line)
River Basin Management III 599
Figure 5: Variation of O-PO43- concentrations along the three sub-catchments
of the Abou Ali River with increasing values in sub-catchment III highlighted.
5 Conclusion
• Consistently, the values of all water quality variables at the headwaters of the Abou Ali River Basin were the lowest as compared to the remaining sites.
• Concentrations of most indicators at almost all sites were above natural background levels indicating human influence.
• Point sources of pollution dominated by raw sewage are the most damaging followed by agriculture activities and poultry and livestock and to a lesser extent recreational activities.
• The concentrations of NO3-_N correlated strongly with agricultural activity
in the watershed. • NH3_N peaks were associated with nutrient influxes in streams with little to
no flow and very low dissolved oxygen content.
Sub-catchment III
© 2005 WIT Press WIT Transactions on Ecology and the Environment, Vol 83, www.witpress.com, ISSN 1743-3541 (on-line)
600 River Basin Management III
• Although non-point sources cannot entirely be discounted, the primary source of O-PO4
3- in the Abou Ali River particularly in sub-catchment III is more likely a result of raw sewage discharge.
Acknowledgement
Special thanks are extended to the United States Agency for International Development (USAID) for funding the laboratory analysis that was conducted at the Core Environmental Laboratory at the American University of Beirut.
References
[1] Albek, E., ‘Estimation of point and diffuse contaminant loads to Streams by non-parametric regression analysis of Monitoring data’, Water, Air, and Soil Pollution, 147, 229-243, 2003.
[2] Massoud, M., Scrimshaw, M.D. and Lester, J.N., ‘Qualitative assessment of the effectiveness of the Mediterranean Action Plan: Wastewater management in the Mediterranean Region’, Ocean and Coastal Management, 46, 875-899, 2003.
[3] Massoud, M., Scrimshaw, M.D. and Lester, J.N., ‘Integrated coastal zone and river basin management: a review of the literature, concepts and trends, for decision makers’, Water Policy, 6, 519-548, 2005.
[4] Payraudeau, S., Tournoud, F. and Picot, B., ‘Annual nutrients export modelling by analysis of land use and topographic information: Case of a small Mediterranean catchment’, Water Science and Technology, 44(2-3), 321-327, 2001.
[5] Liu, W.X., Coveney, R.M., and Chen, J.L., ‘Environmental quality assessment on a river system polluted by mining activities’, Applied Geochemistry, 18, 749-764, 2003.
[6] Bhuyan, S.J., Koelliker, K.J., Marzen, L.J. and Harrington, J.A., ‘An integrated approach for water quality assessment of a Kansas watershed’, Environmental Modelling and Software, 18, 473-484, 2003.
[7] SOER (State of the Environment Report), Ministry of Environment and the Lebanese Environment and Development Observatory, ECODIT, 52 pp, 2001.
[8] JICA (Japan International Cooperation Agency) and CDR (Council for development and Reconstruction), The study of environmental friendly integrated transportation plan for Greater Tripoli, 2001.
[9] APHA/AWWA/WEF, Standards Methods for the Examination of Water and Wastewater, 19th ed., American Public Health Association, Washington DC, 1998.
[10] Korfali, S.I. and Davies, B.E, ‘Total and extractable elements in Lebanese river sediments: dry season data’, Environmental Geochemistry and Health 22, 265-273, 2000.
© 2005 WIT Press WIT Transactions on Ecology and the Environment, Vol 83, www.witpress.com, ISSN 1743-3541 (on-line)
River Basin Management III 601
[11] Boorman, D.B., ‘LOIS in-stream water quality modelling. Part 1. Catchments and methods’, Science of the Total Environment 314-316, 379–395, 2003.
[12] Jones, K.B., Neale, A.C., Nash, M.S., van Remortel, R.D., Wickham, J.D., Riiters, K.H. and O’Neill, R.V., ‘Predicting nutrient and sediment loadings to streams from landscape metrics: a multiple watershed study from the United States Mid-Atlantic Region’, Landscape Ecology, 16, 301–312, 2001.
[13] Magner, J.A., Payne, G.A. and Steffen, L.J., ‘Drainage effects on stream nitrate-n and hydrology in south-central Minnesota (USA)’, Environmental Monitoring and Assessment, 91, 183–198, 2004.
[14] Yaun, L., ‘Using spatial interpolation to estimate stressor levels in un-sampled streams’, Environmental Monitoring and Assessment, 94, 23–38, 2004.
[15] Perona, E., Bonilla, I. and Mateo, P., ‘Spatial and temporal changes in water quality in a Spanish river’, Science of the Total Environment, 241, 75-90, 1999.
[16] Younga, K. Morseb, G.K.M. Scimshaw, M.D., Kinniburgh, J.H., Macleod, C.L. and Lester, J.N., ‘The relation between phosphorus and eutrophication in the Thames catchment, UK’, Science of the Total Environment. 228, 157-183, 1999.
[17] Neal, C. and Whitehead, P.G., ‘Water quality functioning of lowland permeable catchments: inferences from an intensive study of the River Kennet and upper River Thames: an introduction’, Science of the Total Environment, 282-283, 3-7, 2002.
© 2005 WIT Press WIT Transactions on Ecology and the Environment, Vol 83, www.witpress.com, ISSN 1743-3541 (on-line)
602 River Basin Management III