public disclosure authorized economic lebanon lebanon
TRANSCRIPT

Middle East and North Africa Region
Spring 2021
LEBANONECONOMICMONITOR
Lebanon Sinking (To the Top 3)
Pub
lic D
iscl
osur
e A
utho
rized
Pub
lic D
iscl
osur
e A
utho
rized
Pub
lic D
iscl
osur
e A
utho
rized
Pub
lic D
iscl
osur
e A
utho
rized

Lebanon Economic Monitor
Lebanon Sinking (To the Top 3)
Le Naufrage du Liban (Top 3 des pires crises mondiales)
Spring 2021
Global Practice for Macroeconomics, Trade & InvestmentMiddle East and North Africa Region
Document of the World Bank
لبنان يغرق )نحو أسوأ ثلاث أزمات عالمية(
LEBANON ECONOMICMONITOR
The DeliberateDepression
Middle East and North Africa Region
Fall 2020
1818 H Street, NWWashington, DC 20433


iii
TABLE OF CONTENTSAcronyms . . . . . . . . . . . . . . . . . . . . . . . . . . . . . . . . . . . . . . . . . . . . . . . . . . . . . . . . . . . . .viiPreface . . . . . . . . . . . . . . . . . . . . . . . . . . . . . . . . . . . . . . . . . . . . . . . . . . . . . . . . . . . . . . ixExecutive Summary . . . . . . . . . . . . . . . . . . . . . . . . . . . . . . . . . . . . . . . . . . . . . . . . . . . . . . xiالموجز . . . . . . . . . . . . . . . . . . . . . . . . . . . . . . . . . . . . . . . . . . . . . . . . . . . . . . . . . . . . . . xvRésumé . . . . . . . . . . . . . . . . . . . . . . . . . . . . . . . . . . . . . . . . . . . . . . . . . . . . . . . . . . . . . xix
1 . The Policy Context . . . . . . . . . . . . . . . . . . . . . . . . . . . . . . . . . . . . . . . . . . . . . . . . . . . . 1
2 . Recent Macro-Financial Developments . . . . . . . . . . . . . . . . . . . . . . . . . . . . . . . . . . . . . . . 3Output and Demand . . . . . . . . . . . . . . . . . . . . . . . . . . . . . . . . . . . . . . . . . . . . . . . . . . . . . . . . . . . . . . . . . . . . . . . . . . .3
Fiscal Developments . . . . . . . . . . . . . . . . . . . . . . . . . . . . . . . . . . . . . . . . . . . . . . . . . . . . . . . . . . . . . . . . . . . . . . . . . . .4
The External Sector . . . . . . . . . . . . . . . . . . . . . . . . . . . . . . . . . . . . . . . . . . . . . . . . . . . . . . . . . . . . . . . . . . . . . . . . . . . .9
Money and Banking . . . . . . . . . . . . . . . . . . . . . . . . . . . . . . . . . . . . . . . . . . . . . . . . . . . . . . . . . . . . . . . . . . . . . . . . . .11
3 . Global Crises Comparators: Looking for the Minimum . . . . . . . . . . . . . . . . . . . . . . . . . . . . . .19Per Capita Output . . . . . . . . . . . . . . . . . . . . . . . . . . . . . . . . . . . . . . . . . . . . . . . . . . . . . . . . . . . . . . . . . . . . . . . . . . . .21
Depreciation-Inflation . . . . . . . . . . . . . . . . . . . . . . . . . . . . . . . . . . . . . . . . . . . . . . . . . . . . . . . . . . . . . . . . . . . . . . . . .22
Fiscal . . . . . . . . . . . . . . . . . . . . . . . . . . . . . . . . . . . . . . . . . . . . . . . . . . . . . . . . . . . . . . . . . . . . . . . . . . . . . . . . . . . . . . .23
Debt . . . . . . . . . . . . . . . . . . . . . . . . . . . . . . . . . . . . . . . . . . . . . . . . . . . . . . . . . . . . . . . . . . . . . . . . . . . . . . . . . . . . . . . .24
External Position . . . . . . . . . . . . . . . . . . . . . . . . . . . . . . . . . . . . . . . . . . . . . . . . . . . . . . . . . . . . . . . . . . . . . . . . . . . . .24
Overall . . . . . . . . . . . . . . . . . . . . . . . . . . . . . . . . . . . . . . . . . . . . . . . . . . . . . . . . . . . . . . . . . . . . . . . . . . . . . . . . . . . . . .25
4 . Outlook and Risks . . . . . . . . . . . . . . . . . . . . . . . . . . . . . . . . . . . . . . . . . . . . . . . . . . . . .27The FX Subsidy . . . . . . . . . . . . . . . . . . . . . . . . . . . . . . . . . . . . . . . . . . . . . . . . . . . . . . . . . . . . . . . . . . . . . . . . . . . . . .28
Large Scale Interruptions to Vital Public Services . . . . . . . . . . . . . . . . . . . . . . . . . . . . . . . . . . . . . . . . . . . . . . . . .28
Special Focus I: FX Subsidy Reform in the Deliberate Depression . . . . . . . . . . . . . . . . . . . . . . . .31Background . . . . . . . . . . . . . . . . . . . . . . . . . . . . . . . . . . . . . . . . . . . . . . . . . . . . . . . . . . . . . . . . . . . . . . . . . . . . . . . . .31
Macroeconomic Considerations . . . . . . . . . . . . . . . . . . . . . . . . . . . . . . . . . . . . . . . . . . . . . . . . . . . . . . . . . . . . . . . .32
Design a Broad-Coverage Subsidy Reform Compensation Scheme . . . . . . . . . . . . . . . . . . . . . . . . . . . . . . . . .36
LEBANON ECONOMIC MONITOR: LE NAUFRAGE DU LIBAN (AU NUMÉRO 3)/LEBANON SINKING (TO THE TOP 3)iv
Implementing Broad-Coverage Subsidy Reform Compensation Scheme . . . . . . . . . . . . . . . . . . . . . . . . . . . . .38
Complementarities between the BC-CT Program and other SSN Programs . . . . . . . . . . . . . . . . . . . . . . . . . . .39
Special Focus II: Public Service Delivery in the Deliberate Depression . . . . . . . . . . . . . . . . . . . . .41The Electricity Sector . . . . . . . . . . . . . . . . . . . . . . . . . . . . . . . . . . . . . . . . . . . . . . . . . . . . . . . . . . . . . . . . . . . . . . . . .41
Water and Sanitation . . . . . . . . . . . . . . . . . . . . . . . . . . . . . . . . . . . . . . . . . . . . . . . . . . . . . . . . . . . . . . . . . . . . . . . . . .42
Education . . . . . . . . . . . . . . . . . . . . . . . . . . . . . . . . . . . . . . . . . . . . . . . . . . . . . . . . . . . . . . . . . . . . . . . . . . . . . . . . . . .43
Annex . . . . . . . . . . . . . . . . . . . . . . . . . . . . . . . . . . . . . . . . . . . . . . . . . . . . . . . . . . . . . . .47Forecasts of Lebanon’s Real GDP Growth Using MIDAS Regressions: An Update for 2020 and 2021 47
Dynamic Response of Inflation to Currency in Circulation in Lebanon. . . . . . . . . . . . . . . . . . . . . . . . . . . . . . . .51
Unit Root Tests . . . . . . . . . . . . . . . . . . . . . . . . . . . . . . . . . . . . . . . . . . . . . . . . . . . . . . . . . . . . . . . . . . . . . . . . . . .51
VAR Variables in Difference . . . . . . . . . . . . . . . . . . . . . . . . . . . . . . . . . . . . . . . . . . . . . . . . . . . . . . . . . . . . . . . .52
VAR Variables in (Log) Levels . . . . . . . . . . . . . . . . . . . . . . . . . . . . . . . . . . . . . . . . . . . . . . . . . . . . . . . . . . . . . . .53
The Cointegrated VAR: Vector Error Correction Model . . . . . . . . . . . . . . . . . . . . . . . . . . . . . . . . . . . . . . . . . .55
References . . . . . . . . . . . . . . . . . . . . . . . . . . . . . . . . . . . . . . . . . . . . . . . . . . . . . . . . . . . . . . . . . . . . . . . . . . . . . .57
Global Financial Crises Episodes . . . . . . . . . . . . . . . . . . . . . . . . . . . . . . . . . . . . . . . . . . . . . . . . . . . . . . . . . . . . . . .58
The Argentinian Banking Crisis of 1980 . . . . . . . . . . . . . . . . . . . . . . . . . . . . . . . . . . . . . . . . . . . . . . . . . . . . . .58
The Philippines Financial Crisis of 1981 . . . . . . . . . . . . . . . . . . . . . . . . . . . . . . . . . . . . . . . . . . . . . . . . . . . . . .59
The Mexican Debt Crisis of 1981–82 . . . . . . . . . . . . . . . . . . . . . . . . . . . . . . . . . . . . . . . . . . . . . . . . . . . . . . . .60
The Chilean Banking Crisis of 1981 . . . . . . . . . . . . . . . . . . . . . . . . . . . . . . . . . . . . . . . . . . . . . . . . . . . . . . . . .61
The Venezuelan Banking Crisis of 1994 . . . . . . . . . . . . . . . . . . . . . . . . . . . . . . . . . . . . . . . . . . . . . . . . . . . . . .63
The Argentinian Financial Crisis of 2001–02 . . . . . . . . . . . . . . . . . . . . . . . . . . . . . . . . . . . . . . . . . . . . . . . . . .64
The Uruguayan Banking Crisis of 2002 . . . . . . . . . . . . . . . . . . . . . . . . . . . . . . . . . . . . . . . . . . . . . . . . . . . . . .64
The Greek Financial Crisis 2009 . . . . . . . . . . . . . . . . . . . . . . . . . . . . . . . . . . . . . . . . . . . . . . . . . . . . . . . . . . . .66
References . . . . . . . . . . . . . . . . . . . . . . . . . . . . . . . . . . . . . . . . . . . . . . . . . . . . . . . . . . . . . . . . . . . . . . . . . . . . . .67
List of FiguresFigure 1 While the Contraction in Real GDP Commenced in 2018, it Accelerated Sharply in 2020 . . . . . . .4
Figure 2 Net Exports are Expected to Be the Sole Positive Contributor to Real GDP . . . . . . . . . . . . . . . . . . .4
Figure 3 Firm Status . . . . . . . . . . . . . . . . . . . . . . . . . . . . . . . . . . . . . . . . . . . . . . . . . . . . . . . . . . . . . . . . . . . . . . . . . .5
Figure 4 Large Shortfalls in Revenues Will Induce a Significant Deterioration in the Fiscal Position. . . . . .10
Figure 5 Valuation Effects from Exchange Rate Depreciations Will Pressure the Debt-to-GDP Ratio . . . . .10
Figure 6 A Steady Depletion in the Gross Foreign Exchange Position at BdL. . . . . . . . . . . . . . . . . . . . . . . . .11
Figure 7 Ratios of C1, C2b, Luxury and Other Imports Were Stable Until the Period
Leading to the Crisis… . . . . . . . . . . . . . . . . . . . . . . . . . . . . . . . . . . . . . . . . . . . . . . . . . . . . . . . . . . . . . . . .11
Figure 8 …when Ratios of C1 and C2b Imports Rose at the Expense of those for Luxury
and Other Goods.. . . . . . . . . . . . . . . . . . . . . . . . . . . . . . . . . . . . . . . . . . . . . . . . . . . . . . . . . . . . . . . . . . . .11
Figure 9 A Sharp Depreciation in the Exchange Rate along with Surging Inflation and Narrow Money 13
Figure 10 Inflation in Basic Items is a Key Driver of Overall Inflation, Hurting the Poor and
the Middle Class. . . . . . . . . . . . . . . . . . . . . . . . . . . . . . . . . . . . . . . . . . . . . . . . . . . . . . . . . . . . . . . . . . . . .13
Figure 11 Food Expenditure Shares by Deciles for Lebanese Nationals . . . . . . . . . . . . . . . . . . . . . . . . . . . . . .13
Figure 12 Heavy Deleveraging of Assets (Private Loans) and Liabilities (Private Deposits)
in Financial Sector . . . . . . . . . . . . . . . . . . . . . . . . . . . . . . . . . . . . . . . . . . . . . . . . . . . . . . . . . . . . . . . . . . . 17
Figure 13 A Steady and Sharp Deterioration in Credit Performance as Measured
by NPL Ratio for Banks . . . . . . . . . . . . . . . . . . . . . . . . . . . . . . . . . . . . . . . . . . . . . . . . . . . . . . . . . . . . . . .18
TABLE OF CONTENTS v
Figure 14 Lebanon’s Real GDP is a More Accurate Reference Point for the Start of
the Financial Crisis than Real GDP/Capita . . . . . . . . . . . . . . . . . . . . . . . . . . . . . . . . . . . . . . . . . . . . . .21
Figure 15 Real GDP Per Capita for G8 Plus Lebanon . . . . . . . . . . . . . . . . . . . . . . . . . . . . . . . . . . . . . . . . . . . . . .22
Figure 16 Real GDP Per Capita for G8 Plus Lebanon . . . . . . . . . . . . . . . . . . . . . . . . . . . . . . . . . . . . . . . . . . . . . .22
Figure 17 CPI Indices for G8 Plus Lebanon. . . . . . . . . . . . . . . . . . . . . . . . . . . . . . . . . . . . . . . . . . . . . . . . . . . . . . .23
Figure 18 Overall Fiscal Balance for G8 Plus Lebanon . . . . . . . . . . . . . . . . . . . . . . . . . . . . . . . . . . . . . . . . . . . . .23
Figure 19 CPI Indices for G8 Plus Lebanon. . . . . . . . . . . . . . . . . . . . . . . . . . . . . . . . . . . . . . . . . . . . . . . . . . . . . . .23
Figure 20 Overall Fiscal Balance for G8 Plus Lebanon . . . . . . . . . . . . . . . . . . . . . . . . . . . . . . . . . . . . . . . . . . . . .24
Figure 21 Gross Debt for G8 Plus Lebanon. . . . . . . . . . . . . . . . . . . . . . . . . . . . . . . . . . . . . . . . . . . . . . . . . . . . . . .24
Figure 22 Current Account Balance for G8 Plus Lebanon . . . . . . . . . . . . . . . . . . . . . . . . . . . . . . . . . . . . . . . . . .25
Figure 23 A Steady Depletion in the Gross Foreign Exchange Position at BdL. . . . . . . . . . . . . . . . . . . . . . . . .33
Figure 24 Upon Removal of FX Subsidy, Direct Effects on Inflation Are Substantial. . . . . . . . . . . . . . . . . . . . .35
Figure 25 Proposed Monthly Benefit Amount (US$), and Coverage (%), by Year . . . . . . . . . . . . . . . . . . . . . . .37
Figure 26 Compensation Program Outlay and Net Savings from Phase I Subsidy Withdrawal, US$ mn 37
Figure 27 Evolution of High Frequency Indicators Used to Nowcast and Forecast Lebanon’s
Real GDP Growth in 2020. . . . . . . . . . . . . . . . . . . . . . . . . . . . . . . . . . . . . . . . . . . . . . . . . . . . . . . . . . . . .48
Figure 28 Growth of High Frequency Real Economy Indicators Used to Nowcast and
Forecast Lebanon’s Real GDP Growth in 2021 . . . . . . . . . . . . . . . . . . . . . . . . . . . . . . . . . . . . . . . . . .50
Figure 29 Time Series Dynamics of the Variables in Changes . . . . . . . . . . . . . . . . . . . . . . . . . . . . . . . . . . . . . . .53
Figure 30 Responses to a 1 Percent Increase in the Growth of Currency in Circulation . . . . . . . . . . . . . . . . .54
Figure 31 Time Series Dynamics of the Variables in Log Levels . . . . . . . . . . . . . . . . . . . . . . . . . . . . . . . . . . . . .55
Figure 32 Responses to a 1 Percent Increase in the (Log of) Currency in Circulation . . . . . . . . . . . . . . . . . . .56
Figure 33 Responses to a 1 Percent Increase in (the Log of) Currency in Circulation from a VECM . . . . . .57
List of TablesTable 1 Average Change in Full-Time Employees by Gender for All Firms Surveyed. . . . . . . . . . . . . . . . . . .6
Table 2 Summary of Fiscal Accounts Showing Actual Numbers, WB Estimates and
Government Budgets. . . . . . . . . . . . . . . . . . . . . . . . . . . . . . . . . . . . . . . . . . . . . . . . . . . . . . . . . . . . . . . . . .8
Table 3 Crisis Severity: Percent Decline in Per Capita GDP, Duration of Contraction,
and Years to Full Recovery in 25 of the Worst Systemic Banking Crises, 1857–2013. . . . . . . . . .20
Table 4 Selected Macroeconomic Indicators for Lebanon; 2016–2021 . . . . . . . . . . . . . . . . . . . . . . . . . . . . .29
Table 5 Cost of FX Import Subsidy and Impact of its Removal . . . . . . . . . . . . . . . . . . . . . . . . . . . . . . . . . . . . .32
Table 6 Real GDP Growth Forecasts for 2020. . . . . . . . . . . . . . . . . . . . . . . . . . . . . . . . . . . . . . . . . . . . . . . . . . .48
Table 7 Candidate Predictor Variables for the Real High Frequency Indicators . . . . . . . . . . . . . . . . . . . . . .49
Table 8 Forecasts of Real GDP Growth for 2021 Using Real Activity Indicators . . . . . . . . . . . . . . . . . . . . . .49
Table 9 Forecasts of Real GDP Growth for 2021 Using Real Activity and Financial Indicators. . . . . . . . . .51
Table 10 Unit Root Tests . . . . . . . . . . . . . . . . . . . . . . . . . . . . . . . . . . . . . . . . . . . . . . . . . . . . . . . . . . . . . . . . . . . . . .52
Table 11 Cumulative Effect of a 1 Percent Increase in Currency in Circulation on Inflation. . . . . . . . . . . . . .52
Table 12 Cumulative Effect of a 1 Percent Increase in Currency in Circulation on Inflation. . . . . . . . . . . . . .54
Table 13 The Johansen (1988) Trace Statistic . . . . . . . . . . . . . . . . . . . . . . . . . . . . . . . . . . . . . . . . . . . . . . . . . . .56
Table 14 Cumulative Effect of a 1 Percent Increase in Currency in Circulation on Inflation. . . . . . . . . . . . . .57
List of BoxesBox 1 The Impact of Multiple Crises on Formal Firms and the Labor Market in Lebanon. . . . . . . . . . . . . .5
Box 2 Lebanon’ 2021 Budget Draft Proposal . . . . . . . . . . . . . . . . . . . . . . . . . . . . . . . . . . . . . . . . . . . . . . . . . . .8
Box 3 Impact of Crises on Poverty . . . . . . . . . . . . . . . . . . . . . . . . . . . . . . . . . . . . . . . . . . . . . . . . . . . . . . . . . . .13
Box 4 The Most Recent Financial Operation by BdL with Commercial Banks . . . . . . . . . . . . . . . . . . . . . .14


vii
AER Average Exchange Rate
BdL Banque du Liban
BoP Balance of Payments
CA Current Account
CBP Central Bank of the Philippines
CBV Central Bank of Venezuela
CD(s) Certificate of Deposit(s)
CFF Compensatory Financing Facility
CPI Consumer Price Index
CSI Crisis Severity Index
DBP Development Bank of the Philippines
ECB European Central Bank
EdL Electricité du Liban
EFF Extended Fund Facility
EFF Extended Fund Facility
EMU European Monetary Union
ES Enterprise Survey
ESSN Emergency Crisis and COVID-19
Response Social Safety Net Project
FCV Fragility, Conflict, and Violence
FI(s) Financial Institution(s)
FSBS Fund for the Stability of the Banking
System
FX Foreign Exchange
GDP Gross Domestic Product
GFSM International Government Accounting
Standards
GNI Gross National Income (per capita)
GNP Gross National Product
GOL Government of Lebanon
GRM Grievance Redress Mechanism
IADB Inter-American Development Bank
IMF International Monetary Fund
LBP Lebanese Pound
LEM Lebanon Economic Monitor
MIDAS Mixed-Data Sampling
MoET Ministry of Economy and Trade
MTO(s) Money Transfer Operator(s)
NGO(s) Non-governmental Organizations
NID National ID
NIR Net International Reserve
NPL(s) Non-performing Loan(s)
NPTP National Poverty Targeting Program
NSSF National Social Security Fund
O&M Operation and Maintenance
PEP(s) Politically Exposed Person(s)
PISA Programme for International Student
Assessment
PMI Purchasing Manager’s Index
PNB Philippines National Bank
PoB Port of Beirut
POS Point-of-Sale
Pp Percentage Points
PSI Private Sector Initiative
RDNA Rapid Damage and Needs Assessment
SBA Stand-by Arrangement
SDC(s) Social Development Center(s)
SSN Social Safety Net
TB(s) Treasury Bond(s)
TD(s) Time Deposit(s)
UN United Nations
US$ United States Dollar
WE(s) Water Establishment(s)
WSS Water Supply and Sanitation
xM 2020 First x months of 2020
yoy Year over Year
ACRONYMS

ix
PREFACE
T he Lebanon Economic Monitor provides
an update on key economic developments
and policies over the past six months. It also
presents findings from recent World Bank work on
Lebanon. The Monitor places them in a longer-term
and global context and assesses the implications of
these developments and other changes in policy on
the outlook for Lebanon. Its coverage ranges from
the macro-economy to financial markets to indicators
of human welfare and development. It is intended for
a wide audience, including policy makers, business
leaders, financial market participants, and the
community of analysts and professionals engaged in
Lebanon.
The Lebanon Economic Monitor is a product
of the World Bank’s Lebanon Macroeconomics,
Trade and Investment (MTI) team. It was prepared
by Wissam Harake (Senior Economist), Ibrahim
Jamali (Consultant) and Naji Abou Hamde
(Economic Analyst) with contributions from Lars
Jessen (Lead Debt Specialist), Haocong Ren (Senior
Financial Sector Economist), Zeina El Khoury
(Private Sector Specialist), Angela Elzir Assy (Labor
Market Specialist), Ganesh Kumar Seshan (Senior
Economist), Bilal Malaeb (Economist), Fahmina
Rahman Dutta (Social Protection Specialist) and
Haneen Ismail Sayed (Lead Operations Officer).
Special Focus I: FX Subsidy Reform in the Deliberate
Depression, has been led by Haneen Ismail Sayed
(Lead Operations Officer), and Wissam Harake
(Senior Economist). Special Focus II: Public Service
Delivery in the Deliberate Depression, has been led by
Wissam Harake (Senior Economist), Sameh Mobarak
(Senior Energy Specialist), Amal Talbi (Lead Water
Resources Management Specialist), Sally Zgheib
(Senior Water Supply and Sanitation Specialist), and
Nathalie Lahire (Senior Economist). The Lebanon
Economic Monitor has been completed under the
guidance of Christos Kostopoulos (Lead Economist),
Eric Le Borgne (Practice Manager) and Saroj Jha
(Country Director). Zeina Khalil (Communications
Officer) is the lead on communications, outreach and
publishing.
The findings, interpretations, and conclusions
expressed in this Monitor are those of World Bank
staff and do not necessarily reflect the views of the
Executive Board of The World Bank or the govern-
ments they represent.
For information about the World Bank and its
activities in Lebanon, including e-copies of this publi-
cation, please visit www .worldbank .org .lb
To be included on an email distribution list
for this Lebanon Economic Monitor series and
related publications, please contact Alain Barakat
(abarakat@worldbank .org). For questions and com-
ments on the content of this publication, please
contact Wissam Harake (wharake@worldbank .org)
or Christos Kostopoulos (ckostopoulos@worldbank .
org). Questions from the media can be addressed to
Zeina Khalil (zelkhalil@worldbank .org).


xi
EXECUTIVE SUMMARY
T he Lebanon financial and economic crisis
is likely to rank in the top 10, possibly
top three, most severe crises episodes
globally since the mid-nineteenth century.
This is a conclusion of the Spring 2021 Lebanon
Economic Monitor (LEM) in which the Lebanon crisis
is contrasted with the most severe global crises
episodes as observed by Reinhart and Rogoff (2014)1
over the 1857–2013 period. In fact, Lebanon’s GDP
plummeted from close to US$ 55 billion in 2018 to
an estimated US$ 33 billion in 2020, with US$ GDP/
capita falling by around 40 percent. Such a brutal
and rapid contraction is usually associated with
conflicts or wars. Even prior, the World Bank has long
identified Lebanon as a Fragility, Conflict & Violence
(FCV) State, and as such, the dire socio-economic
conditions risk systemic national failings with regional
and potentially global consequences.2 This illustrates
the magnitude of the economic depression that the
country is enduring, with sadly no clear turning point
on the horizon, given the disastrous deliberate policy
inaction.
In the Fall 2020 LEM, Lebanon’s economic
crisis was termed The Deliberate Depression.
For over a year, Lebanese authorities countered an
assailment of compounded crises—namely, the coun-
try’s largest peace-time economic and financial crisis,
COVID-19 and the Port of Beirut explosion—with delib-
erately inadequate policy responses. The inadequacy
is less due to knowledge gaps and quality advice
and more the result of a combination of (i) a lack of
political consensus over effective policy initiatives;
and (ii) political consensus in defense of a bankrupt
economic system, which benefited a few for so long.
In the face of these challenges, Lebanon lacks a fully-
functioning executive authority and is currently in the
process of forming its third Government in a little over
a year. This debilitating institutional void has lasted
over 8 months so far.
The social impact of the crisis, which is
already dire, could rapidly become catastrophic;
more than half the population is likely below
the national poverty line. Those paid in Lebanese
Lira—the bulk of the labor force—are seeing potent pur-
chasing power declines. Phone surveys conducted in
the end of 2020 by the World Food Program found
that 41 percent of households reported challenges
1 Reinhart, Carmen M. and Kenneth S. Rogoff (2014), Recovery from Financial Crises: Evidence from 100 Episodes, American Economic Review: Papers & Proceedings 2014, 104(5): 50–55.
2 In Amin’s Maalouf’s Le Naufrage des Civilisations, translated as The Wreckage of Civilizations, the Lebanese author highlights how the failings of the Levant are propagating into a failing of all civilizations.Maalouf, Amin (2019), Le Naufrage des Civilisations, French & European Publications, Inc., April 2, 2019.
LEBANON ECONOMIC MONITOR: LE NAUFRAGE DU LIBAN (AU NUMÉRO 3)/LEBANON SINKING (TO THE TOP 3)xii
Real GDP growth is estimated to have con-
tracted by 20.3 percent in 2020, on the back of a
6.7 percent contraction in 2019. In a large part due
to COVID-19, the tourism sector has been particularly
hit; tourist arrivals fell by 71.5 percent, (yoy), over the
first five months of 2020 (5M-2020). Meanwhile, con-
struction permits and cement deliveries (proxies for
the construction and real estate) suffered respective
declines of 26.9 percent (yoy) and 44.7 percent (yoy)
over the first 10 months of 2020 (10M-2020).
An ostensible improvement in some fiscal
indicators (as a percentage of GDP) masks an
actual deterioration. Revenues are estimated to
have declined sharply as a result of the severe eco-
nomic contraction, with the ratio to GDP falling further
due to an inflation-driven increase in nominal GDP.
However, this is more than offset by a larger decline
in current expenditures, which benefited from: lower
interest payments (due to the Eurobond default and
a favorable arrangement with BdL on domestic debt);
cuts in transfers; and also a denominator-led GDP
effect. Hence, while the 2020 overall fiscal balance is
estimated to have improved by 0.7 percentage points
(pp) to reach –4.9 percent of GDP, the primary bal-
ance deteriorated by 2.3 pp to –2.8 percent of GDP.
The sharp economic contraction implied
a commensurate drop in imports, and conse-
quently, an anticipated narrowing of the current
account deficit. During 10M-2020, merchandize
imports shrank by 45 percent, which drove a 54.8
percent decrease in the trade-in-goods deficit. We
estimate that the current account deficit fell by 10 pps
to reach 11 percent of GDP in 2020, compared to a
medium-term (2013–2019) average of 22.5 percent of
GDP. Nonetheless, the sudden stop in capital inflows
has implied a steady depletion of foreign exchange
(FX) reserves at BdL, which exacerbates constraints
on imports.
The burden of the ongoing adjustment/
deleveraging in the financial sector is highly
regressive, concentrated on smaller depositors,
the bulk of the labor force and smaller busi-
nesses. De facto lirafication and haircuts on dollar
in accessing food and other basic needs. The share
of households having difficulties in accessing health
care rose from 25 percent (July-August) to 36 percent
(Nov-Dec). The unemployment rate also rose among
the respondents, from 28 percent in February (pre-
COVID) to nearly 40 percent in Nov-Dec.
Lebanon, with a history of civil war and con-
flicts, faces realistic threats to its already fragile
social peace. As previously argued (World Bank,
20163), the key overarching constraints to develop-
ment in Lebanon are i) elite capture hidden behind the
veil of confessionalism, and ii) conflicts and violence,
with these two having a symbiotic relationship: they
feed and strive on each other. Demonstrations, while
more modest in numbers, have recently grown angrier,
erupting in cities across Lebanon to protest against
the dire economic conditions; vital routes are being
cut off causing significant disruptions to mobility and
livelihood; increased crime rates threaten personal
security; national fragmentation can allow infiltration
of sinister groups with grave security implications.
Hence, there is growing wariness of potential triggers
to social unrest.
Recent Economic Developments
Monetary and financial turmoil are driving crisis
conditions, more palpably through interactions
between the exchange rate, narrow money and
inflation. Acute exchange market pressures in
Lebanese markets are reflected by heavy fluctuations
in the US$ banknote exchange rate, which temporarily
breached LBP 15,000/US$, before falling back down.
This is within the context of a multiple exchange rate
system, which includes the official exchange (LBP
1,507.5/US$) as well Banque du Liban’s (BdL)
platform rate set at LBP 3,900/US$. Overall, the World
Bank Average Exchange Rate (AER) depreciated by
129 percent in 2020. Exchange rate pass through
effects on prices have resulted in surging inflation,
averaging 84.3 percent in 2020. Meanwhile, the stock
of currency in circulation increased by 197 percent,
even as broad money supply (which includes bank
deposits) declined, with the latter weighed down by
deleveraging in the financial sector.
3 World Bank (2016) “Lebanon Systematic Country Diagnostic”.
EXECuTIvE SuMMARy xiii
deposits are significant despite BdL’s and banks’
official commitment to safeguarding deposits. The
burden of the ongoing adjustment/deleveraging is
regressive and concentrated on the smaller deposi-
tors, who lack other source of savings, the local labor
force, that is paid in lira, and smaller businesses. The
banking sector is advocating for mechanisms that
incorporate state owned assets, gold reserves, and
public real estate in order to overhaul their impaired
balance sheets. This constitutes a bailout of the
financial sector and is inconsistent with restructuring
principles that protect taxpayers and depositors.
These principles include bail in solutions based on
a hierarchy of creditors, starting with banks share-
holders. Government can also apply a wealth tax (on
financial and real assets) as a tool to progressively
restructure the financial sector.
Special Foci
The financial and economic crisis has intensified
Lebanon’s fragility and fragmentation, increasing
the risk to social and civil unrest. The crisis
has exacerbated long-term national deficiencies
including institutional weaknesses, failed economic
and social policy, and dismal public service delivery.
In such an environment, there is growing weariness
of triggers for social unrest. In this LEM, we highlight
two potential economic triggers that are under
increased scrutiny, and which can have significant
social implications.
The first Special Focus examines Lebanon’s
FX subsidy for critical and essential imports,
which offers a serious political and social chal-
lenge. On the one hand, the current FX subsidy
is both distortionary, expensive and regressive. It
exerts considerable stress on Lebanon’s balance of
payments. On the other hand, the subsidy prevents
the prices of these products from increasing, which
would exacerbate inflationary-depreciation pressures,
further striking at residents purchasing power.
The second Special Focus discusses the
impact that the crises are having on four basic
public services: electricity, water supply, sanita-
tion and education. The Deliberate Depression has
further undermined already weak public services via
two effects: (i) it has significantly increased poverty
rates expanding the demography that is not able to
afford private substitutables (the way citizens had pre-
viously adapted to abysmal quality of public services),
and are thus more dependent on public services; and
(ii) threatens financial viability and basic operability
of the sector by raising its costs and lowering its
revenues. Specifically,
• Severe shortage of foreign currency threatens
termination of private sector contracts for
power plant maintenance and temporary power
generation. Meanwhile, Electricité du Liban
(EdL) revenues, which are in Lebanese pound,
are shrinking because of increasing technical,
commercial and collection losses. EdL is likely to
increase rolling blackouts to manage its cashflow
shortfalls.
• In 2020, the Water Establishments (WEs)
witnessed serious depletions in supplies,
revenues, and financial and human resources,
while affected by an upward spiral in costs. Due
to reduced water supply from the WEs in 2020,
people have had to rely more on other costlier
and less convenient water alternatives, such as
water tankers and bottled water, whose prices
have surged.
• The breakdown in sanitation services risks
intensifying the spread of water-borne diseases,
adversely impacting an already vulnerable public
health.
• Compounded crises have placed Lebanon’s
education sector under severe strain. The
increase in poverty rates is leading to an exodus
of students from private to public schools—this
year alone, 54,000 students (11 percent of public
sector students)—as well as higher student drop-
outs, especially from the most marginalized
households. Further, the most recent school
closures due to the COVID-19 pandemic have
effectively cost students a “lost year” of learning.

xv
الموجز
علّ الأزمة الاقتصاديةّ والمالية التي تضرب لبنان من بين الأزمات لالعشر، وربّا من بين الأزمات الثلاث، الأكثر حدةً عالميًّا منذ أواسط الاقتصاد مرصد تقرير خلاصات إحدى إنهّا عشر. التاسع القرن الأكثر العالميّة الأزمات لبنان مع أزمة يقارن الذي لربيع 2021، اللبناني الحقبة Rogoff )2014(4خلال وروغوف Reinhart رينارت وفق حدةً 1857–2013. في الواقع، تراجع إجمالي الناتج المحلي في لبنان من حوالى ،2020 العام في د.أ. مليار 33 حوالى إلى 2018 العام في د.أ. مليار 55مع تراجع إجمالي الناتج المحلي للفرد بالدولار الأميركي بنسبة حوالى 40 نزاعات إلى والسريع القاسي الانقباض هذا مثل يعُزا ما غالباً المئة. في أنهّ على لبنان الدولي البنك صنّف لطالما ذلك، قبل وحتى حروب. أو الاقتصاديةّ الظروف تهُدّد قد وبالتالي، وعنف، ونزاع، هشاشة، دولة والاجتماعيّة المتردية بانهيار وطني منهجي تكون له انعكاسات محتملة الاقتصادي الكساد يجُسّد حجم ممّا والعالمي5، الاقليمي المستوييَْ على إلى نظراً الأفق، تلوح في بتغيير أمل بارقة البلد، من دون الذي يشهده
التقاعس المتعمد عن اتخاذ السياسات الملائمة.في تقرير مرصد الاقتصاد اللبناني لخريف 2020، وُصفت الأزمة مدى على المتعمّد«. »الكساد بأنهّا لبنان لها يتعرضّ التي الاقتصاديةّ المتعاقبة الأزمات وابل تواجه اللبنانية السلطات كانت عام، من أكثر السلم، زمن في البلد يشهدها واقتصاديةّ مالية أزمة أكبر سيّما لا —ولا عمداً. ملائمة غير بسياسات — بيروت مرفأ وانفجار وكوفيد–19، تعود هذه الاستجابات غير الملائمة إلى نقص في المعلومات أو إلى توجيهات الإجماع غياب )i(منها عدّة، عوامل من توليفة نتيجة هي بل خاطئة، السياسي بشأن مبادرات سياسات فعّالة؛ و)ii( الاجماع السياسي في الدفاع عن نظام اقتصادي مُفلس، أفاد البعض لفترة طويلة جدًا. وفي وجه هذه التحديات، يفتقر لبنان إلى سلطة تنفيذيةّ تعمل بشكل كامل وهو في طور تشكيل حكومته الثالثة في أكثر من عام واحد بقليل. ويستمر هذا الفراغ
المؤسسي المعوّق من أكثر من 8 أشهر وحتى هذا التاريخ.مأساويًّا أصلاً، الصعب للأزمة، الاجتماعي الأثر يُصبح قد ح أن يكون أكثر من نصف السكان دون خط الفقر الوطني. بسرعة؛ يُرجَّيشهد الذين يتقاضون رواتبهم وأجورهم بالليرة اللبنانية — أي الغالبية
Reinhart, Carmen M. and Kenneth S. Rogoff )2014(, Recovery 4
from Financial Crises: Evidence from 100 Episodes, American.Economic Review: Papers & Proceedings 2014, 104)5(: 50–55
في ترُجم الذي Le Naufrage des Civilisations معلوف أمي كتاب في 5
الانجليزيةّ إلى The Wreckage of Civilizations، يسُلطّ الكاتب اللبناني الضوء على فشل الشرق المتفشي الذي يؤدي إلى فشل الحضارات كلهّا.
Maalouf, Amin )2019(, Le Naufrage des Civilisations, French &.European Publications, Inc., April 2, 2019
.”World Bank )2016( ”Lebanon Systematic Country Diagnostic 6
)البنك الدولي )2016( التشخيص المنهجي في لبنان(.
الساحقة للقوى العاملة — تراجعاً بالغاً في قوّتهم الشرائيّة. وقد أظهرت مسوحات أجراها برنامج الأغذية العالمي عبر الهاتف في أواخر 2020 أن وسدّ الغذائيّة المواد على الحصول عليها يصعب الأسر من المئة في 41حاجاتها الأساسيّة الأخرى. وارتفعت نسبة الأسر التي تواجه صعوبات في الحصول على الرعاية الصحيّة من 25 في المئة )تموز/يوليو-آب/أغسطس( الثاني/نوفمبر — كانون الأول/ديسمبر(. كما أن المئة )تشرين إلى 36 في معدّل البطالة ارتفع في صفوف المشمولي بالمسح، فانتقل من 28 في المئة في شباط/فبراير )ما قبل كوفيد( إلى حوالى 40 في المئة في تشرين الثاني/
نوفمبر — كانون الأول/ديسمبر.يواجه لبنان، وهو ذو تاريخ حافل بالنزاعات والحرب الأهليّة، مخاطر واقعيّة تهُدّد سلمه الاجتماعي الهشّ أصلاً. فوفق تقرير التشخيص المنهجي للبنان )البنك الدولي، 62016(، يعتبر العنصران التاليان من القيود الأساسيّة التي تعُيق عملية التنمية في لبنان )i( الحكم الطائفي، أي تولي )ii(لها و الطائفية قناعاً الحكم من قبل طبقة نخبوية تستخدم ذريعة النزاعات والعنف الناجمان جزئياً عن صراعات واسعة النطاق في منطقة البعض، الأوسط، وهما عنصران على علاقة متكافلة مع بعضهما الشرق يتغذيان وينموان من بعضهما البعض. وازدادت حدّة غضب التظاهرات الناشئة في المدن اللبنانيّة احتجاجًا على الظروف الاقتصاديةّ المتردية وإن كانت أعداد المتظاهرين أكثر تواضعًا؛ وقطُعت الطرق الحيويةّ، ممّا أعاق يهُدّد أمن الجريمة ارتفاع معدّل العيش؛ كما أن التنقّلات وكسب لقمة
LEBANON ECONOMIC MONITOR: LE NAUFRAGE DU LIBAN (AU NUMÉRO 3)/LEBANON SINKING (TO THE TOP 3)xvi
التفكّك الوطني باندساس مجموعات ذات الناس الشخصي؛ وقد يسمح نوايا سيئة، ممّا يولدّ انعكاسات خطيرة على مستوى الأمن. وبالتالي يزداد القلق، في لبنان، من العوامل التي يمكن أن تؤدي إلى اضطرابات اجتماعية.
التطوّرات الماكرو-اقتصادية والمالية الأخيرة
يتّضح ذلك بشكل و الماليّة والنقديّة ظروف الأزمة، تقود الاضطرابات ملموس من خلال التفاعل بين سعر الصرف، والتضخّم، والكتلة النقديةّ الأسواق على الصرف لسوق الحادة الضغوط تنعكس الضيق. بعناها مقابل الأميركي الدولار كبيرة في سعر صرف تقلبّات اللبنانيّة على شكل لبنانيّة، قبل أن اللبنانيّة، الذي تجاوز بشكل مؤقت 15 ألف ليرة الليرة يتراجع مجدداً. ويندرج ذلك في سياق نظام أسعار صرف متعدّدة تشمل سعر الصرف الرسمي )1 د.أ. = 1507.5 ل.ل.(، بالإضافة إلى سعر صرف تراجع عام، وبشكل ل.ل.، 3900 = د.أ. 1 البالغ لبنان مصرف منصة متوسط سعر الصرف الذي يحتسبه البنك الدولي بنسبة 129 في المئة في العام 2020. وأثرّت تقلبّات سعر الصرف على الأسعار، ممّا أدّى إلى زيادة التضخّم ليبلغ 84.3 في المئة في العام 2020. وفي موازاة ذلك، ازداد مخزون النقديةّ الكتلة تراجع بعد حتى المئة، في 197 بنسبة المتداولة العملة بدورها تأثرّت والتي المصرفيّة(، الودائع تشمل )التي الواسع بمعناها
بتقليص ميزانية القطاع المصرفي. 20.3 بنسبة الحقيقي المحلي الناتج إجمالي نمو تقلّص ر يُقدَّفي المئة في العام 2020، إثر تقلّص بنسبة 6.7 في المئة في العام 2019. وقد تعرضّ قطاع السياحة إلى ضربة قويةّ بشكل خاص، ناجمة إلى حد بعيد عن كوفيد – 19؛ وتراجع عدد المسافرين الوافدين بنسبة 71.5 في المئة )من سنة لأخرى(، على مدى الأشهر الخمسة الأولى من العام 2020 البناء وعملياّت تسليم تراخيص )5M-2020(. وفي موازاة ذلك، شهدت تراجعًا والعقارات، البناء قطاعي أنشطة مؤشرات من وهي الاسمنت، سنوياً قدره 26.9 و44.7 في المئة على التوالي، خلال الأشهر العشرة الأولى
.)10M-2020( 2020 من العامالمالية المؤشرات بعض في ظاهري تحسّن يُخفي الواقع، في تراجع ر يقُدَّ فعليًّا. تدهورًا المحلي( الناتج إجمالي من مئويّة )كنسبة تراجع مع الشديد، الاقتصادي الانقباض نتيجة حاد بشكل الايرادات الناتج الناتج المحلي بشكل أكبر بسبب زيادة إجمالي النسبة إلى إجمالي في أكبر تراجع ذلك يقُابل لكن، التضخّم. عن الناجمة الإسمي المحلي الفوائد تسديدات انخفاض يلي: ممّا تستفيد التي الجارية، النفقات )بسبب عدم سداد اليوروبوندز وبسبب ترتيب ملائم مع مصرف لبنان أثر إلى أيضاً بالإضافةهنا التحويلات؛ من والحدّ المحلي(؛ الدين بشأن النسبة(. وبالتالي، الناتج المحلي )الذي يؤدي إلى انخفاض ارتفاع إجمالي مع تحسّن الميزان المالي الكلي للعام 2020 بقدر 0.7 نقطة مئوية ليبلغ الرصيد الأولي 2.3 نقطة تراجع الناتج المحلي، المئة من إجمالي 4.9- في
مئويةّ إلى 2.8- في المئة من إجمالي الناتج المحلي.أدىّ الانقباض الاقتصادي الحاد إلى تراجع متناسب في الواردات، وبالتالي، من المنتظر أن يؤدي إلى تقلّص في عجز الحساب الجاري. خلال الأشهر العشرة الأولى من العام 2020، تقلصّت واردات السلع بنسبة 45 المئة. السلع قدره 54.8 في التجارة في المئة، ممّا ولدّ تراجعًا في عجز في
نقُدّر أن يكون عجز الحساب الجاري قد تراجع 10 نقاط مئويةّ ليبلغ 11 في المئة من إجمالي الناتج المحلي في العام 2020، مقارنةً مع معدّل عجز الناتج إجمالي من المئة في 22.5 نسبته )2019–2013( الأجل متوسط المحلي. ومع ذلك، أدّى التوقفّ المفاجئ في التدفقات الرأسماليّة الوافدة ممّا الأجنبية، العملات من لبنان مصرف لاحتياطي مضطرد تراجع إلى
يفاقم القيود على الواردات.المصرفي القطاع ميزانية تقليص الجاري/ التكيف عبء يُعتبَ الساحقة والغالبيّة الصغار، المودعين على يُركّز كبير، بشكل تراجعيًّا الليرة إلى الودائع تصريف يعُتبَر الصغيرة. والمؤسسات العاملة، للقوى من بالرغم واقعاً، أمراً الأميركي بالدولار الودائع من والاقتطاع اللبنانيّة يعُتبَر الودائع. لبنان بحماية الإلتزام الرسمي من قبل المصارف ومصرف ويرُكّز تراجعيًّا المصرفي القطاع ميزانية تقليص الجاري/ التكيف عبء والقوى ادخار أخرى، يفتقرون إلى مصادر الذين الصغار، المودعي على العاملة المحلية التي تتقاضى أجورها ورواتبها بالليرة اللبنانيّة، والمؤسسات تملكها أصولاً تشمل آليّات وضع إلى المصرفي القطاع يدعو الصغيرة. الدولة، واحتياطي الذهب، والعقارات العامة من أجل إصلاح ميزانياّتهم لا المالي، للقطاع العام القطاع من إنقاذ عملية يشُكّل ممّا الضعيفة، التي تحمي دافعي الضرائب. وتشمل الهيكلة تتماشى مع مبادئ إعادة الدائني، هرميّة أساس على داخليّة بمشاركة إنقاذ حلول المبادئ هذه تفرض ضريبة أن للحكومة يُمكن كما المصارف. في المساهمي من بدءًا على الثروات )على الأصول العقاريةّ والأصول الماليّة( كأداة من أجل إعادة
هيكلة القطاع المالي بشكل تقدمي.
مجالات التركيز الخاصة
زادت الأزمة المالية والاقتصاديةّ من هشاشة لبنان وتفكّكه، مما زاد من الخلل أوجه من الأزمة وزادت والاجتماعية. المدنية الاضطرابات خطر الطويلة الأمد، بما في ذلك مكامن الضعف المؤسسيّة، والسياسة الاجتماعيّة السياق، هذا ظل وفي السيئة. العامة والخدمات الفاشلة، والاقتصاديةّ إلى اضطرابات تؤدي أن التي يمكن العوامل لبنان، من القلق، في يزداد اجتماعية. في هذا التقرير، نسلطّ الضوء على محركّي اقتصاديَّيْ محتمليَْ قيد التدقيق المتزايد، يُمكن أن يكون لهما انعكاسات اجتماعيّة ملحوظة.
لبنان في الأجنبي الصرف دعم في الأول التركيز مجال ينظر للواردات الأساسيّة والمهمّة، والذي يشكّل تحديًا اجتماعيًّا وسياسيًّا جدّيّاً. من جهة، يعُتبَر دعم الصرف الأجنبي الحالي تشويهيًّا، ومكلفًا، وتراجعيًّا. فهو يشكل ضغوطاً كبيرة على ميزان المدفوعات في لبنان. ومن جهة أخرى، ضغوط من يزيد ممّا المنتجات، هذه أسعار زيادة دون الدعم يحول التضخّم-انخفاض قيمة العملة، فيحدّ أكثر من القدرة الشرائيّة للمواطني.ويتطرّق مجال التركيز الثاني إلى وقع الأزمات على أربع خدمات والتعليم. الصحي، والصرف المياه، وإمدادات الكهرباء، أساسيّة: عامة فقد أضعف الكساد المتعمّد بشكل أكبر الخدمات العامة الضعيفة أصلاً فتوسّع بشكل ملحوظ عدد الفقر زيادة معدّلات )i( أثرَينْ: من خلال السكان غير القادرين على تكبّد كلفة الخدمات البديلة الخاصة )السبل التي اعتمدها المواطنون في السابق للتكيّف مع نوعيّة الخدمات العامة )ii(فباتوا يعتمدون بالتالي بشكل أكبر على الخدمات العامة؛ و ،)المتردية
xviiالموجز
زيادة خلال من الأساسي وعمله للقطاع المالية الاستمراربة تهديد تكاليفه وخفض إيراداته.
وبشكل خاص،
يهُدّد الافتقار الحاد للعملات الأجنبيّة بإنهاء عقود القطاع الخاص لصيانة محطات توليد الطاقة الكهربائيّة وتوليد الطاقة المؤقت. وفي الوقت نفسه، تتقلصّ إيرادات شركة كهرباء لبنان، التي هي بالليرة اللبنانيّة، بسبب الخسائر الفنية والتجاريةّ المتزايدة وتلك المرتبطة بالجباية. ويتُوقَّع أن تزيد مؤسسة كهرباء لبنان من فترات التأني في
التغذية بالتيار الكهربائي لإدارة القصور في تدفقاتها النقديةّ.والايرادات الإمدادات إلى المياه مؤسسات افتقرت ،2020 العام في
والموارد البشرية والماليّة بشكل خطر، في ما شهدت زيادة مضطردة في
التكاليف. وبسبب تراجع إمدادات المياه من مؤسسات المياه في العام 2020، كان على المواطني الاعتماد على بدائل أخرى أكثر كلفةً وأقل ملاءمةً، على غرار صهاريج المياه وقوارير المياه، التي ارتفعت أسعارها.
يهُدّد تراجع خدمات الصرف الصحي بزيادة انتشار الأمراض المنقولة في المياه، ممّا يؤثرّ سلبًا على الصحة العامة الهشّة أصلاً.
شكّلت الأزمات المتعاقبة ضغوطاً كبيرة على قطاع التعليم في لبنان. تؤدي زيادة معدّلات الفقر إلى نزوح جماعي للطلاب من المدارس 54000 وحده العام هذا بلغ — الرسمية المدارس إلى الخاصة تلميذ )11 في المئة من تلامذة القطاع العام( – بالإضافة إلى معدّل تسّرب مدرسي أعلى، لا سيّما من الأسر الأكثر تهميشًا. إلى ذلك، خسر مؤخراً أبوابها المدارس إقفال مع التعلمّ من عامًا فعلياً التلامذة
بسبب جائحة كوفيد19-.

xix
RÉSUMÉ
L a crise économique et financière qui sévit
au Liban est probablement l’une des dix,
voire l’une des trois pires crises que le
monde ait connu depuis le milieu du XIXe siècle.
Telle est la conclusion de l’édition Printemps 2021 de
l’Observatoire économique du Liban (ou LEM, pour
Lebanon Economic Monitor), dans laquelle la crise au
Liban est considérée comme l’une des crises mondiales
les plus sévères au regard de la liste établie par Reinhart
et Rogoff (2014)7 durant la période 18572013. En effet,
le PIB du Liban a chuté de 55 milliards de dollars en
2018 à environ 33 milliards de dollars en 2020, avec
une baisse d’environ 40 % du PIB par habitant. Une
telle contraction, si brutale et rapide, est d’habitude
attribuée à des conflits ou des guerres. La Banque
mondiale a longtemps considéré le Liban, et ce, bien
avant la crise, comme un pays en situation de fragilité,
conflit et violence (FCV). À ce titre, il est possible que
les conditions socio-économiques difficiles que connaît
le pays risquent d’entraîner une faillite systémique à
l’échelle nationale, avec d’éventuelles conséquences
mondiales.8 Ceci illustre la magnitude de la dépression
économique que le pays subit, et, malheureusement,
le fait qu’aucune perspective de changement ne soit
à l’horizon eu égard à l’inaction désastreuse mais
néanmoins choisie des politiques.
Dans l’édition Automne 2020 du LEM, la
crise économique que traverse le Liban a été qua-
lifié de Dépression Délibérée. Pendant plus d’un
an, les autorités libanaises ont été assaillies par une
série de crises successives — à savoir, la plus grande
crise financière et économique du pays en temps de
paix, la COVID-19 et l’explosion du Port de Beyrouth
— auxquelles ils ont apporté des réponses politiques
délibérément inadéquates. Inadéquations qui mal-
heureusement ne proviennent pas d’un manque
d’informations ou de mauvaises directives mais d’une
combinaison (i) d’un manque de consensus politique
à l’égard d’initiatives de politiques effectives ; et
(ii) d’un consensus politique qui défend un système
économique en faillite — un système qui a profité à
certains pendant longtemps. Face à ces défis, le pays
est actuellement doté d’un pouvoir exécutif qui n’est
pas pleinement fonctionnel, attendant la formation
de son troisième gouvernement en un peu plus d’un
an, et est paralysé par un vide institutionnel qui dure
depuis plus de 8 mois.
L’impact social de la crise, déjà désastreux,
peut rapidement devenir catastrophique; plus de
la moitié de la population serait en-dessous du
7 Reinhart, Carmen M. and Kenneth S. Rogoff (2014), Recovery from Financial Crises: Evidence from 100 Episodes, American Economic Review: Papers & Proceedings 2014, 104(5): 50–55.
8 Dans l’ouvrage d’Amin Maalouf (2019), Le Naufrage des Civilisations, l’Académicien et auteur libanais montre comment les échecs du Levant se transforment en un échec de toutes les civilisations.

LEBANON ECONOMIC MONITOR: LE NAUFRAGE DU LIBAN (AU NUMÉRO 3)/LEBANON SINKING (TO THE TOP 3)xx
seuil national de pauvreté. Ceux qui sont payés en
livres libanaises — soit la majorité de la main-d’œuvre
— ont vu et voient leur pouvoir d’achat se rétrécir
comme une peau de chagrin. Selon des sondages
téléphoniques menés fin 2020 par le Programme
alimentaire mondial (PAM), 41 % des ménages ont
rapporté des difficultés à accéder à la nourriture
et à d’autres besoins fondamentaux. La part des
ménages connaissant des difficultés à accéder aux
services de santé est passée de 25 % en juillet-août à
36 % en novembre-décembre. Le taux de chômage a
également augmenté parmi les répondants, passant
de 28 % en février (avant la COVID) à environ 40 % en
novembre-décembre.
Le Liban, historiquement touché par les
conflits et la guerre civile, est confronté à des
menaces réalistes qui mettent en danger sa
paix sociale déjà fragile. Comme il a été mis en
évidence par le passé (Banque mondiale, 20169), les
principales contraintes au développement au Liban
sont i) l’accaparement des ressources par l’élite,
sous couvert de confessionnalisme et ii) les conflits
et la violence — ces deux facteurs entretenant une
relation symbiotique, l’un se nourrissant de l’autre
pour se développer mutuellement. La colère des
manifestations, bien que plus modestes en nombre,
est récemment montée d’un cran, émergeant dans
des villes à travers le Liban pour protester contre
les conditions économiques exsangues. De ce fait,
l’accès à des routes vitales est coupé, entraînant des
interruptions prolongées qui entravent la mobilité et
réduisent plus encore les moyens de subsistance ;
l’augmentation des taux de criminalité menace la
sécurité des personnes ; et la fragmentation nationale
peut permettre l’infiltration de groupes menaçants, ce
qui aurait des implications graves sur la sécurité du
pays. Les politiciens-timoniers du Liban, bloquant la
barre du pays, le rapprochent ainsi inexorablement
de récifs meurtriers et d’un naufrage tragique.
Les récents développements économiques
Les turbulences monétaires et financières, et
plus concrètement le taux de change, l’inflation
et l’augmentation rapide de la masse monétaire,
sont des conditions génératrices de crises.
Les sévères pressions du marché de change sur
les marchés libanais sont illustrées par de lourdes
fluctuations du taux de change de la livre face au
dollar américain, qui a temporairement dépassé
LBP 15 000/US$, avant de baisser à nouveau. Ceci
s’inscrit dans le cadre d’un système à taux de change
multiples, qui comprend le taux de change officiel à
LBP 1 507,5/US$, ainsi que celui de la plateforme
de la Banque du Liban (BdL) à LBP 3 900/US$. En
général, le taux de change effectif moyen calculé
par la Banque mondiale (AER) a baissé de 129 %
en 2020. L’impact des fluctuations des taux de
change sur les prix a provoqué une recrudescence
de l’inflation, enregistrant une moyenne de 84,3 % en
2020. En parallèle, le stock de monnaie en circulation
a augmenté de 197 %, même si la masse monétaire
au sens large (qui comprend les dépôts bancaires)
s’est réduite en raison du désendettement du secteur
financier.
La croissance du PIB réel a connu une
contraction de 20,3 % en 2020, aggravant celle
déjà importante de 6.7 % observée en 2019. Le
secteur du tourisme a été particulièrement touché,
en grande partie en raison de la COVID-19 ; les
arrivées de touristes ont baissé de 71,5 %, (d’une
année sur l’autre), durant les cinq premiers mois de
2020 (5M-2020). Dans le même temps, les permis
de construction et les livraisons de ciment (moyens
intermédiaires pour la construction et l’immobilier)
ont baissé de 26,9 % (d’une année sur l’autre) et de
44,7 % (d’une année sur l’autre) durant les dix pre-
miers mois de 2020 (10M-2020).
Une amélioration apparente de certains
indicateurs fiscaux (en pourcentage du PIB)
masque une détérioration effective et notoire.
Les revenus ont baissé de manière significative
en raison d’une sévère contraction économique,
le ratio au PIB se détériorant davantage à cause
d’une augmentation du PIB nominal due à l’inflation
galopante. Toutefois, cette situation est largement
compensée par une baisse plus importante des
9 World Bank (2016) “Lebanon Systematic Country Diagnostic”.

RéSuMé xxi
dépenses courantes, ayant bénéficié des éléments
suivants : des paiements d’intérêts inférieurs (en
raison du défaut de paiement des Eurobonds et d’un
arrangement favorable, bien qu’illusoire au niveau du
secteur publique consolidé, avec la BdL concernant
la dette intérieure) ; des baisses de transferts ; et d’un
PIB sur la base d’un dénominateur. Ainsi, alors que le
solde budgétaire global de 2020 a progressé de 0,7
point de pourcentage (pp) pour atteindre –4,9 % du
PIB, le solde primaire a régressé de 2,3 pp, atteignant
–2.8 % du PIB.
La contraction économique accrue signifie
une baisse conséquente des importations, et
donc, une réduction anticipée du déficit du compte
courant. Durant les dix premiers mois de 2020
(10M-2020), les importations de marchandises ont
régressé de 45 %, provoquant une baisse de 54,8 %
du déficit lié aux échanges de biens. Nous estimons
que le déficit du compte courant a baissé de 10
points de pourcentage pour atteindre 11 % du PIB en
2020, à comparer avec la moyenne à moyen terme
(2013–2019) de 22.5 % du PIB. Toutefois, l’arrêt sou-
dain et soutenu des flux de capitaux entrants signifie
un épuisement continu des réserves de change (FX)
à la BdL, accentuant par là-même les contraintes sur
les importations.
Le fardeau de l’ajustement en cours/du
désendettement dans le secteur financier est
particulièrement régressif, concentré sur de
petits déposants, la plus grande majorité de la
maind’œuvre, et des entreprises de taille plus
modeste. De facto, la « lirafication » et les « haircuts »
(les « ponctions ») sur les dépôts en dollars sont
importants, malgré l’engagement officiel de la Bdl et
des banques à sauvegarder les dépôts. Le fardeau
de l’ajustement en cours/du désendettement dans
le secteur financier est particulièrement régressif
et concentré sur de petits déposants qui n’ont pas
d’autres sources d’épargne, une maind’œuvre locale
rémunérée en livres libanaises et des entreprises de
taille plus modeste. Le secteur bancaire appelle à la
mise en place de mécanismes qui tiennent compte
des biens de l’État, des réserves en or et des actifs
immobiliers publics afin de rétablir l’équilibre de
ses bilans déficients. Il s’agit d’un renflouement du
secteur financier qui ne s’inscrit pas dans le cadre
des principes de restructuration visant à protéger les
contribuables et les déposants. Ces principes com-
prennent des solutions de cautionnement basées
sur une hiérarchie de créditeurs, à commencer par
les actionnaires des banques. Le gouvernement peut
également imposer un impôt sur la fortune (actifs
financiers et biens immobiliers) comme moyen de res-
tructurer de manière progressive le secteur financier.
Les champs d’intérêt particuliers
La crise économique et financière a accentué la
fragilité et la fragmentation du Liban, augmentant
ainsi le risque de mécontentement social et civil.
La crise a exacerbé les déficiences nationales à
long terme, y compris les fragilités institutionnelles,
la politique socioéconomique tenue en échec
et la mauvaise prestation des services publics.
Dans un tel contexte, le pays connaît une lassitude
grandissante face à d’éventuels facteurs susceptibles
de déclencher un mécontentement social. Dans cette
édition du LEM, nous mettons l’accent sur deux
éventuels éléments déclencheurs qui sont de plus en
plus l’objet d’une attention particulière, et qui auraient
des implications sociales de grande envergure.
Le premier champ d’intérêt particulier
concerne la bonification des réserves étrangères
au Liban pour les importations essentielles
et critiques, ce qui constitue un véritable défi
sociopolitique. D’une part, en plus d’être onéreuse
et régressive, la bonification des réserves étrangères
a présentement un effet de distorsion et exerce en
outre des pressions considérables sur la balance des
paiements du Liban. D’autre part, elle empêche une
augmentation du prix de ces produits, ce qui accen-
tuerait les pressions générées par l’inflation et la
dépréciation et porterait un coup au pouvoir d’achat
de la population.
Le deuxième champ d’intérêt particulier
porte sur l’impact que les crises ont sur quatre
services publics de base : l’électricité, l’eau, les
services sanitaires et l’éducation. La Dépression
Délibérée a davantage fragilisé les services publics
déjà vulnérables de deux façons : (i) elle a augmenté
de manière significative les taux de pauvreté,

LEBANON ECONOMIC MONITOR: LE NAUFRAGE DU LIBAN (AU NUMÉRO 3)/LEBANON SINKING (TO THE TOP 3)xxii
élargissant ainsi la portion de la population n’ayant
pas les moyens de se payer des biens et services
privés de substitution (ce qui était la manière dont la
population s’était auparavant adaptée à la prestation
de services publics de mauvaise qualité) et étant, par
conséquent, davantage dépendante des services
publics ; et (ii) elle menace la viabilité financière et
l’opérabilité fondamentale du secteur en augmentant
ses coûts et en baissant ses revenus. L’on retient plus
particulièrement les éléments suivants :
• Une sévère pénurie de devises étrangères
menace la résiliation des contrats du secteur
privé pour l’entretien des centrales électriques
et la génération provisoire d’électricité. Dans le
même temps, les revenus d’Électricité du Liban
(EdL), qui sont en livres libanaises, ont été réduits
considérablement en raison des pertes techniques
et commerciales et du manque de paiements
collectés. Il se pourrait donc qu’EdL augmente
ses coupures de courant rotatives afin de pouvoir
gérer son manque de flux de trésorerie.
• En 2020, les Offices des Eaux ont connu une
grave pénurie en matière d’approvisionnement
en eau, de revenus et de ressources financières
et humaines, qui est venue s’ajouter à la
flambée des coûts. En 2020, en raison de cet
approvisionnement limité, la population a été
obligée de recourir à d’autres alternatives plus
onéreuses et moins pratiques, telles que les
citernes d’eau et l’eau en bouteille, dont les prix
se sont envolés.
• La dégradation des services d’assainissement
risque d’intensifier la propagation de maladies
transmises par l’eau, ce qui affectera de manière
négative la santé publique déjà vulnérable.
• Les crises successives auxquelles le Liban a été
confronté ont exercé de sévères pressions sur
le secteur de l’éducation. En raison des taux de
pauvreté élevés, les élèves ont abandonné les
écoles privées au profit des écoles publiques —
cette année seulement, 54 000 élèves (11 % des
élèves du secteur public). À noter également :
un taux d’abandon scolaire plus élevé,
particulièrement au sein des ménages les plus
marginalisés. En outre, la récente fermeture des
écoles en raison de la COVID-19 a fait perdre aux
élèves une année d’apprentissage.

1
THE POLICY CONTEXT
L ebanon faces a dangerous depletion of
resources, including human capital since
brain drain has become an increasingly
desperate option. Over a year into the financial crisis,
Lebanon has yet to identify, least of all embark upon, a
credible path toward economic and financial recovery.
In fact, Lebanon lacks a fully-functioning executive
authority and is currently in the process of forming
its third Government in a little over a year. Meanwhile,
social discontent has spilled over to street action
even under COVID-19 conditions; internal political
discord and fragmentation continues; and geopolitical
tensions complicate solutions. In consequence, highly
skilled labor is increasingly likely to take up potential
opportunities abroad, constituting a permanent social
and economic loss for the country.
Lebanese authorities and the IMF began
discussions in May 2020. The discussions even-
tually stalled as differences and inconsistencies
emerged within the Lebanon team regarding the
Government’s financial recovery program. IMF dis-
cussions await the formation of new Government.
The burden of the ongoing adjustment/
deleveraging in the financial sector is highly
regressive, concentrated on smaller depositors,
the local labor force and smaller businesses. De
facto Lirafication and haircuts on dollar deposits are
ongoing despite BdL’s and banks’ official commit-
ment to safeguarding deposits. The burden of the
ongoing adjustment/deleveraging is regressive
and concentrated on the smaller depositors who
lack other source of savings, the local labor force
that is paid in LBP, and smaller businesses. The
banking sector is advocating for mechanisms that
incorporate state-owned assets, gold reserves, and
public real estate in order to overhaul their impaired
balance sheets. This constitutes a bailout of the
financial sector and is inconsistent with the restruc-
turing principles that protect taxpayers. These
principles include bail in solutions based on a hier-
archy of creditors, starting with banks’ shareholders.
Government can also apply a wealth tax (on financial
and real assets) as a tool to progressively restructure
the financial sector.
Lebanon urgently needs to adopt and
implement a credible, comprehensive and coor-
dinated macro-financial stability strategy, within
a medium-term macro-fiscal framework. This
strategy would be based on: (i) a debt restructuring
program that would achieve short-term fiscal space
1

LEBANON ECONOMIC MONITOR: LE NAUFRAGE DU LIBAN (AU NUMÉRO 3)/LEBANON SINKING (TO THE TOP 3)2
and medium-term debt sustainability; (ii) comprehen-
sively restructuring the financial sector in order to
regain solvency of the banking sector; (iii) adopting
a new monetary policy framework that would regain
confidence and stability in the exchange rate; (iv) a
phased fiscal adjustment aimed at regaining confi-
dence in fiscal policy; (v) growth enhancing reforms;
and (vi) enhanced social protection.
3
RECENT MACRO-FINANCIAL DEVELOPMENTS
Output and Demand
The compounded crises, namely, the financial
crisis, COVID-19 and the Port of Beirut (PoB)
explosion, have had staggered impacts on
output and with differentiated magnitudes. Due to
insufficient high frequency data, precise identification
of each of those impacts is a challenging task. In
order to draw empirical conclusions, we resort to a
combination of methodologies and models. To gauge
the impact of financial crisis along with COVID-19
effects, we use Mixed-Data Sampling (MIDAS)
methods to assess the state of the economic cycle
using available high frequency measures of economic
activity (See Annex A). The World Bank had earlier
estimated the economic impact of the PoB explosion
through a Rapid Damage and Needs Assessment
(RDNA).10,11
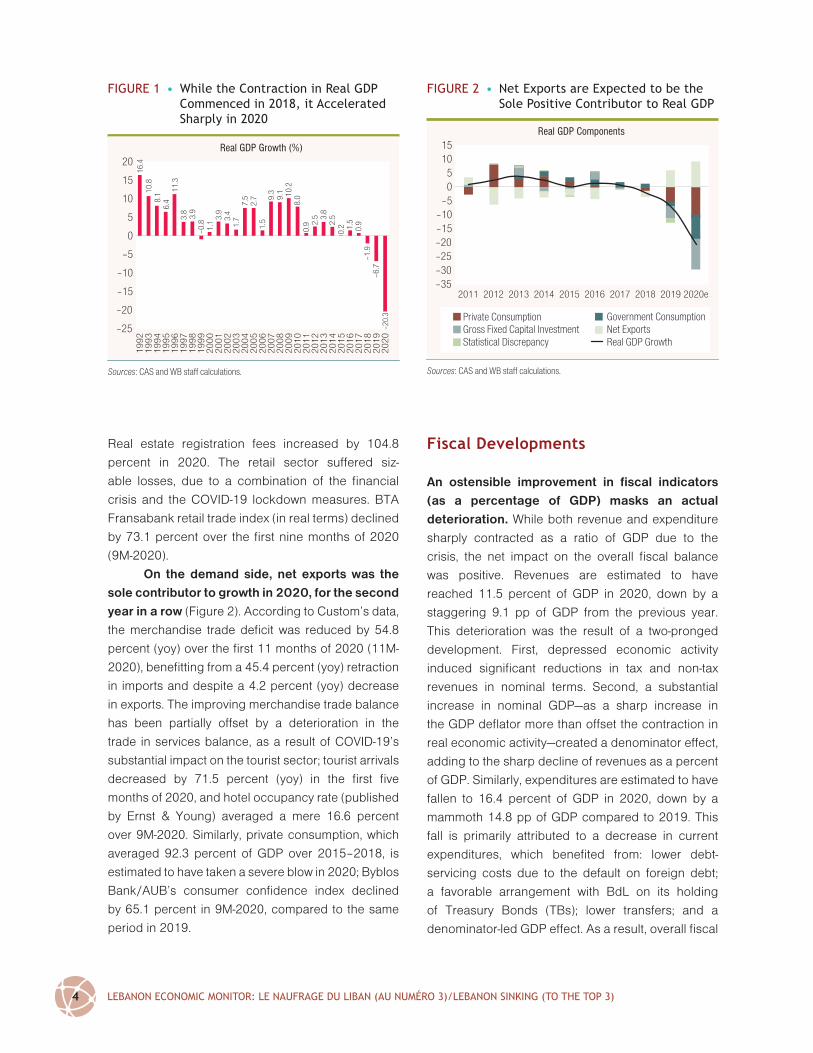
Real GDP is estimated to have contracted
by 20.3 percent in 2020 (Figure 1).12 High frequency
indicators support a substantial contraction in eco-
nomic activity. BLOM’s monthly Purchasing Manager’s
Index (PMI), which captures private sector activity,
averaged 41.1 over 2020—PMI values below 50 rep-
resent a contraction in economic activity. In fact, this
is the lowest PMI recorded since it was first published
in 2013 (see Box 1 for the impact on firms and labor
market). Meanwhile, the real estate sector has been
subject to two offsetting factors; on the one hand, con-
struction permits and cement deliveries—considered
to be indicators of future and ongoing construction,
respectively—suffered respective declines of 26.9
percent (yoy) and 44.7 percent (yoy) over 10M-2020.
On the other hand, throughout 2020 real estate
sales thrived as some depositors sought means to
utilize their otherwise untransferable bank deposits.13
10 World Bank (2020), Beirut Rapid Damage and Needs Assessment, August 2020.
11 According to the RDNA, the disaster event is estimated to cause (i) up to 0.4 and 0.6 percentage point (pp) declines in the growth rate of real GDP in 2020 and 2021, respectively, due to losses in the stock of physical capital; plus potentially (ii) import constraints that could subtract an additional of 0.4 and 1.3 pps from growth in 2020 and 2021, respectively.
12 This represents a slight downward revision from the Fall 2020 LEM which projected a 19.2 percent contraction in real GDP growth for 2020.
13 The financial sector facilitated real estate purchases using pre-October 2019 dollar deposits under conditions of capital controls (and therefore, lack of alternatives to get those deposits out), leading to an increase in such purchases.
2
LEBANON ECONOMIC MONITOR: LE NAUFRAGE DU LIBAN (AU NUMÉRO 3)/LEBANON SINKING (TO THE TOP 3)4
Real estate registration fees increased by 104.8
percent in 2020. The retail sector suffered siz-
able losses, due to a combination of the financial
crisis and the COVID-19 lockdown measures. BTA
Fransabank retail trade index (in real terms) declined
by 73.1 percent over the first nine months of 2020
(9M-2020).
On the demand side, net exports was the
sole contributor to growth in 2020, for the second
year in a row (Figure 2). According to Custom’s data,
the merchandise trade deficit was reduced by 54.8
percent (yoy) over the first 11 months of 2020 (11M-
2020), benefitting from a 45.4 percent (yoy) retraction
in imports and despite a 4.2 percent (yoy) decrease
in exports. The improving merchandise trade balance
has been partially offset by a deterioration in the
trade in services balance, as a result of COVID-19’s
substantial impact on the tourist sector; tourist arrivals
decreased by 71.5 percent (yoy) in the first five
months of 2020, and hotel occupancy rate (published
by Ernst & Young) averaged a mere 16.6 percent
over 9M-2020. Similarly, private consumption, which
averaged 92.3 percent of GDP over 2015–2018, is
estimated to have taken a severe blow in 2020; Byblos
Bank/AUB’s consumer confidence index declined
by 65.1 percent in 9M-2020, compared to the same
period in 2019.
Fiscal Developments
An ostensible improvement in fiscal indicators
(as a percentage of GDP) masks an actual
deterioration. While both revenue and expenditure
sharply contracted as a ratio of GDP due to the
crisis, the net impact on the overall fiscal balance
was positive. Revenues are estimated to have
reached 11.5 percent of GDP in 2020, down by a
staggering 9.1 pp of GDP from the previous year.
This deterioration was the result of a two-pronged
development. First, depressed economic activity
induced significant reductions in tax and non-tax
revenues in nominal terms. Second, a substantial
increase in nominal GDP—as a sharp increase in
the GDP deflator more than offset the contraction in
real economic activity—created a denominator effect,
adding to the sharp decline of revenues as a percent
of GDP. Similarly, expenditures are estimated to have
fallen to 16.4 percent of GDP in 2020, down by a
mammoth 14.8 pp of GDP compared to 2019. This
fall is primarily attributed to a decrease in current
expenditures, which benefited from: lower debt-
servicing costs due to the default on foreign debt;
a favorable arrangement with BdL on its holding
of Treasury Bonds (TBs); lower transfers; and a
denominator-led GDP effect. As a result, overall fiscal
FIGuRE 1 • While the Contraction in Real GDP Commenced in 2018, it Accelerated Sharply in 2020
–15
–20
–25
1992
1993
1994
1995
1996
1997
1998
1999
2000
2001
2002
2003
2004
2005
2006
2007
2008
2009
2010
2011
2012
2013
2014
2015
2016
2017
2018
2019
2020
–5
–10
5
0
15
20Real GDP Growth (%)
10
–20.
3–6
.7–1
.90.
91.5
0.22.
53.8
2.5
0.9
8.010
.29.
19.
31.
52.
77.
51.
73.4
3.9
3.9
3.8
11.3
6.48.
110.8
16.4
1.1
–0.8
Sources: CAS and WB staff calculations.
FIGuRE 2 • Net Exports are Expected to be the Sole Positive Contributor to Real GDP
–15–20
–30–35
–25
2011 2012 2013 2014 2015 2016 2017 2018 2019 2020e
–5–10
50
15Real GDP Components
10
Government ConsumptionPrivate Consumption
Real GDP GrowthStatistical DiscrepancyNet ExportsGross Fixed Capital Investment
Sources: CAS and WB staff calculations.

RECENT MACRO-FINANCIAL DEvELOPMENTS 5
BOX 1: THE IMPACT OF MuLTIPLE CRISES ON FORMAL FIRMS AND THE LABOR MARKET IN LEBANONa,b
Impact on Firms
The World Bank conducts Enterprise Surveys regularly in active member countries. It conducted one such survey in Lebanon in 2019/2020; this happened to be a pre-crisis survey, as the country would be subsequently hit by compounded crises—the financial crisis, COVID-19 and the August 4th explosion at the Port of Beirut (PoB). To assess the impact on firms from these crises, a follow up survey was conducted in Lebanon in November 2020.
From the surveys, we find that almost one out of five firms originally surveyed are confirmed or assumed permanently closed,c manufacturing firms that remain open are operating at 35 percent of capacity, and almost half of the firms have been affected by the PoB explosion. As illustrated by Figure 3, 16.6 percent of firms surveyed are confirmed or assumed permanently closed, while 72 percent have been temporarily closed at some point since the beginning of the pandemic due to Covid-19, with a 10 week average closure period. Further, 46 percent of all surveyed firms—both in Beirut and elsewhere—have been affected by the August 4 explosion either directly or indirectly. In fact, 22 percent of firms had to close temporarily because of the explosion and 17 percent experienced interruption of their supply chain.
Four out of five firms say their sales declined significantly together with demand. Since the beginning of the financial crisis (October 2019), 79 percent of firms surveyed reduced sales (nominal) by an average of 69 percent, with small firms bearing a greater impact. In reflection, firms reported a 74 percent drop in (real) demand for their products and services. The lack of demand is affecting the manufacturing sector the most severely; 81 percent of surveyed manufacturing firms reported a drop in sales that is equivalent to 70 percent on average. Exporters were also hit hard. One out of four firms reported an average 70 percent drop in exports. However, 20 firms were able to increase their exports; half of these firms were in the manufacturing sector, mainly food and machinery, but also in retail and ICT. This increase could be linked to the improved competitiveness resulting from the severe unofficial depreciation of the currency, or the drop in domestic demand due to the crisis, forcing firms to look for customers overseas.
More than half of firms surveyed are experiencing liquidity challenges. Since the beginning of the financial crisis, 55 percent of firms experienced a decline in their cashflow and around 75 percent of firms decreased sales and purchases on credit. Only 13 percent of firms reported relying on banks or financial institutions to finance their liquidity shortfalls. Instead, 28 percent of firms are financing their needs through equity, and 8 percent through delayed payments.d
The future looks bleak and uncertain. One out of four firms does not think recovery is possible. Twenty-four percent of firms expect to fall (further) into arrears and default on liabilities in the next 3 months, projecting their survival at less than 7 months or 27 weeks, given current costs. In sum, and according to firms reported expectations, one out of four firms will have to exit by June 2021.
COVID-19 adaptation is relatively low, with few firms ramping up online operations. Around 6 percent of firms have either started or increased their online activities, while 8 percent increased online delivery. A relatively higher share of firms (18 percent) have started to increase or has already increased remote work. There is a significant gap between small and large firms, with the latter showing more capacity to adapt.
Firms surveyed rank credit guarantees, tax deferrals and exemptions for social security contributions as the most helpful policy potential responses. But preferences vary by firm characteristics and by gender ownership. When asked “What would be the most effective policy to help firms cope with the crisis?” 30 percent of firms indicated credit guarantees, 18 percent pointed to tax deferrals and 16 percent of firms expressed a preference for exemptions to National Social Security Fund (NSSF) contributions. Small firms preferred credit guarantees, with tax deferrals in second place, while large firms preferred NSSF exemptions at a slightly higher rate than tax deferrals. Meanwhile, 34 percent of male owned firms ranked credit guarantees as more effective, while 43 percent of female owned firms ranked NSSF exemptions as their top choice.
FIGuRE 3 • Firm Status
Share of Firms with Unknown Status or Refused to AnswerShare of Firms Temporarily ClosedShare of Firms Open
Share of Firms Confirmed and Assumed Closed
0%10%20%30%40%50%60%70%80%90%
All
Man
ufac
turin
g
Who
lesa
le &
Ret
ail
Oth
erSe
rvic
es
Smal
l
Med
ium
Larg
e
100%
17%
5%
60%
19%
16%
7%
62%
15%
16%
3%
63%
18%
21%
4%
45%
31%
19%
6%
62%
14%
13%
3%
56%
29%
4%1%
66%
29%
Source: 2021 Follow up to the Enterprise Survey.
(continued on next page)
LEBANON ECONOMIC MONITOR: LE NAUFRAGE DU LIBAN (AU NUMÉRO 3)/LEBANON SINKING (TO THE TOP 3)6
BOX 1: THE IMPACT OF MuLTIPLE CRISES ON FORMAL FIRMS AND THE LABOR MARKET IN LEBANONa,b
(CONTINUED)
Impact on Jobs
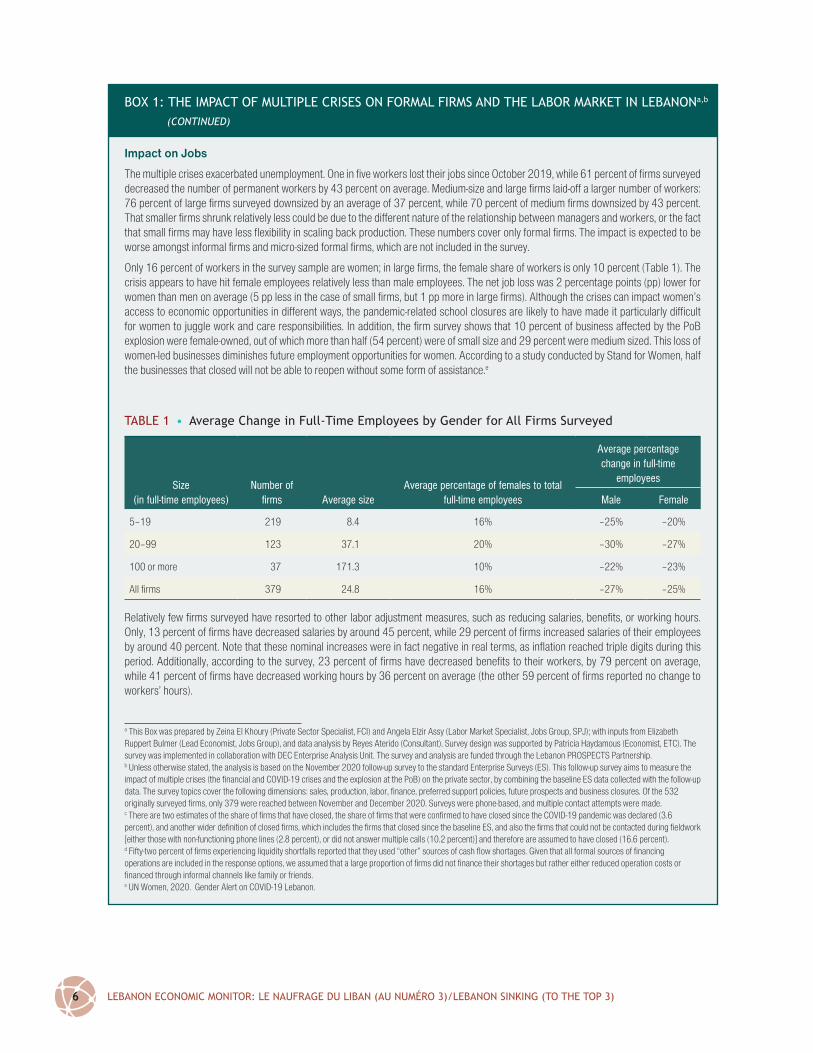
The multiple crises exacerbated unemployment. One in five workers lost their jobs since October 2019, while 61 percent of firms surveyed decreased the number of permanent workers by 43 percent on average. Medium-size and large firms laid-off a larger number of workers: 76 percent of large firms surveyed downsized by an average of 37 percent, while 70 percent of medium firms downsized by 43 percent. That smaller firms shrunk relatively less could be due to the different nature of the relationship between managers and workers, or the fact that small firms may have less flexibility in scaling back production. These numbers cover only formal firms. The impact is expected to be worse amongst informal firms and micro-sized formal firms, which are not included in the survey.
Only 16 percent of workers in the survey sample are women; in large firms, the female share of workers is only 10 percent (Table 1). The crisis appears to have hit female employees relatively less than male employees. The net job loss was 2 percentage points (pp) lower for women than men on average (5 pp less in the case of small firms, but 1 pp more in large firms). Although the crises can impact women’s access to economic opportunities in different ways, the pandemic-related school closures are likely to have made it particularly difficult for women to juggle work and care responsibilities. In addition, the firm survey shows that 10 percent of business affected by the PoB explosion were female-owned, out of which more than half (54 percent) were of small size and 29 percent were medium sized. This loss of women-led businesses diminishes future employment opportunities for women. According to a study conducted by Stand for Women, half the businesses that closed will not be able to reopen without some form of assistance.e
Relatively few firms surveyed have resorted to other labor adjustment measures, such as reducing salaries, benefits, or working hours. Only, 13 percent of firms have decreased salaries by around 45 percent, while 29 percent of firms increased salaries of their employees by around 40 percent. Note that these nominal increases were in fact negative in real terms, as inflation reached triple digits during this period. Additionally, according to the survey, 23 percent of firms have decreased benefits to their workers, by 79 percent on average, while 41 percent of firms have decreased working hours by 36 percent on average (the other 59 percent of firms reported no change to workers’ hours).
a This Box was prepared by Zeina El Khoury (Private Sector Specialist, FCI) and Angela Elzir Assy (Labor Market Specialist, Jobs Group, SPJ); with inputs from Elizabeth Ruppert Bulmer (Lead Economist, Jobs Group), and data analysis by Reyes Aterido (Consultant). Survey design was supported by Patricia Haydamous (Economist, ETC). The survey was implemented in collaboration with DEC Enterprise Analysis Unit. The survey and analysis are funded through the Lebanon PROSPECTS Partnership.b Unless otherwise stated, the analysis is based on the November 2020 follow-up survey to the standard Enterprise Surveys (ES). This follow-up survey aims to measure the impact of multiple crises (the financial and COVID-19 crises and the explosion at the PoB) on the private sector, by combining the baseline ES data collected with the follow-up data. The survey topics cover the following dimensions: sales, production, labor, finance, preferred support policies, future prospects and business closures. Of the 532 originally surveyed firms, only 379 were reached between November and December 2020. Surveys were phone-based, and multiple contact attempts were made. c There are two estimates of the share of firms that have closed, the share of firms that were confirmed to have closed since the COVID-19 pandemic was declared (3.6 percent), and another wider definition of closed firms, which includes the firms that closed since the baseline ES, and also the firms that could not be contacted during fieldwork [either those with non-functioning phone lines (2.8 percent), or did not answer multiple calls (10.2 percent)] and therefore are assumed to have closed (16.6 percent). d Fifty-two percent of firms experiencing liquidity shortfalls reported that they used “other” sources of cash flow shortages. Given that all formal sources of financing operations are included in the response options, we assumed that a large proportion of firms did not finance their shortages but rather either reduced operation costs or financed through informal channels like family or friends.e UN Women, 2020. Gender Alert on COVID-19 Lebanon.
TABLE 1 • Average Change in Full-Time Employees by Gender for All Firms Surveyed
Size (in full-time employees)
Number of firms Average size
Average percentage of females to total full-time employees
Average percentage change in full-time
employees
Male Female
5–19 219 8.4 16% –25% –20%
20–99 123 37.1 20% –30% –27%
100 or more 37 171.3 10% –22% –23%
All firms 379 24.8 16% –27% –25%
RECENT MACRO-FINANCIAL DEvELOPMENTS 7
deficit is estimated to have shrunk to 4.9 percent of
GDP, a narrowing of 5.6 pp of GDP from 2019, and
compared to a medium-term average of 8.6 percent
(Figure 4). However, the primary balance is estimated
to have worsened in 2020, reaching –2.8 percent
of GDP, compared to –0.5 percent in 2019, and a
medium-term average of 0.5 percent. This widening
is surprising for countries that are in sovereign
default as financing shortages usually forces them to
run a primary balance. In the case of Lebanon, BdL is
providing the required financing for the government,
notwithstanding its own financial difficulties.
Fiscal data available over the first eight
months of 2020 confirm fiscal distress, despite
the apparent improvement in the overall bal-
ance. Revenues were down by 20.2 percent (yoy)
over 8M-2020, with across the board decreases in
tax and non-tax revenues. VAT and custom revenues
were highly affected by the contraction in economic
activity, registering respective decreases of 49.7 per-
cent (yoy) and 34.5 percent (yoy); telecom revenues
were also down by 56.5 percent (yoy) in 8M-2020.
Meanwhile, total expenditures declined by 18.4
percent (yoy), over the same period. This was partly
a result of a 58.9 percent (yoy) decrease in interest
payments driven by (i) a 87.9 percent (yoy) decline
in foreign debt interest payments, an implication of
the Eurobond default; and (ii) a 41.3 percent (yoy)
decrease in domestic debt interest payments due to
a preferential agreement between BdL and Ministry
of Finance.14 Decreases of 37.1 and 39 percent (yoy)
in transfers to EdL,15 and municipalities, respectively,
also contributed to the total decline in expenditures.
Hence, while the overall fiscal deficit narrowed by
13.1 percent over 8M-2020, the primary balance
deteriorated by 409 percent, flipping from a surplus
of LBP 555 billion to LBP –1,713 billion.
High inflation rates drive a sharp fiscal
adjustment. For nominally fixed fiscal items, more
typically expenditure items, high inflation induces not
only a reduction of the ratio to GDP, but also a reduc-
tion in real terms. For fiscal items that are indexed to
inflation, more typically revenue items, high inflation
will induce a nominal increase in these items (in
principal maintaining real value), thereby partially
offsetting the denominator-led GDP effect. Hence,
a large part of the macro adjustment, even if not by
design from policy makers, is de facto taking place
through (1) an inflation tax on the revenue side (for
items other than those where the tax is set in fixed Lira
terms such as most fees);16 and (2) a real cut on the
expenditure side. Both are blunt instruments, but with
high inflation they generate a huge and fast adjust-
ment. Hence, as is illustrated by the 2021 Budget
proposal (Box 2), keeping the overall deficit at the
same nominal number implies a sharp consolidation.
Public debt ratios, which were already noto-
riously unsustainable, are further aggravated by
the economic crisis. Debt-to-GDP is estimated to have
reached 174 percent by the end of 2020, increasing
by 3 pp from the 2019 ratio. The sharp depreciation
in the local currency has implied a significantly lower
dollar value for domestic debt in 2020, lowering the
dollar value for total debt (the numerator in the debt-
to-GDP ratio); this is, however, more than offset by a
significantly lower denominator, GDP in US$, due
also to the currency depreciation, leaving a slightly
larger debt-to-GDP ratio.17 The expected worsening
of the exchange in 2021 will further exacerbate this
dynamic (Figure 5). So, whereas the surge in inflation
14 The agreement entails non-payment of coupon obligations on Treasury bonds held by BdL.
15 This is driven by a combination of lower oil prices, falling demand due to economic crisis, and increased power cuts as tool for savings by EdL.
16 This effect on the revenue side in Lebanon, however, is weakened by a combination of (i) a large chunk of the tax base is on imported goods, which for tax reasons are still valued at the official, thereby generating artificially lower revenues; (ii) a collapse in compliance; and (iii) the Tanzi effect—the reduction in the volume of tax collection and a deterioration of real tax proceeds being collected resulting from high inflation in a country.Tanzi, Vito (1977), Inflation, Lags in Collection, and the Real Value of Tax Revenue, Staff Papers, vol. 24, March 1977, IMF, pp. 154–167.
17 Taken at the official exchange rate, the share of foreign currency-denominated debt to the total outstanding stock of debt was 36 percent by end-2020 (amounting to 42 percent of GDP), mostly held by domestic banks; for illustration, if one were to use instead a simulated exchange rate of LBP 3,555/US$, foreign currency-denominated debt would surge to 57 percent of the total outstanding stock of debt (amounting to 100 percent of GDP).

LEBANON ECONOMIC MONITOR: LE NAUFRAGE DU LIBAN (AU NUMÉRO 3)/LEBANON SINKING (TO THE TOP 3)8
BOX 2: LEBANON’ 2021 BuDGET DRAFT PROPOSALa
The 2021 budget draft proposal targets an overall fiscal deficit equivalent to 2.4 percent of GDP, and a primary deficit of 0.8 percent of GDP.b This marks a consolidation when compared to 2020 estimates for the overall and primary deficits of 4.9 and 2.8 percent of GDP, respectively (Table 2). Nominally, total revenues and expenditures, and thus the overall fiscal balance, in Budget 2021 are largely unvaried from those in Budget 2020; only the primary balance deteriorates, signaling the re-allocation of savings from interest payments to primary spending.
In the 2021 draft, total revenues are projected to continue contracting to 7.3 percent of GDP, compared to 11.9 percent in 2020. The change is mainly due to a denominator-led effect, resulting from a rise in nominal GDP; in fact, revenues in both 2020 and 2021 budgets are almost unchanged (LBP 14,176 billion in 2020 and LBP 14,140 billion in 2021): the carry-over of the depressed economic activity in 2020 and the continued sharp fall in 2021 are dragging down revenue collection, notwithstanding the inflation-creep “tax” that is common in rapid and high inflation environments.
Tax revenues represent the main component of total revenues, budgeted to reach 5.4 percent of GDP in 2021, compared to 8.4 percent of GDP in 2020 budget; in nominal terms the 2021 budget marks a nominal increase in tax revenues—LBP 10,493 billion compared to LBP 9,966 billion, which is, however, well below the projected 100 percent in inflation for 2021, so tax collection is falling in real terms.
The budget draft proposes new measures, including a newly introduced “national solidarity tax” and an adjustment to tax on interest profits. The “national solidarity tax” imposes a (i) 1 percent tax on deposits between US$1 million and US$20 million; (ii) 1.5 percent on deposits greater than US$20 million but less than US$50 million; and (iii) 2 percent on deposits greater than US$50 million. This tax applies to equivalent deposits in LBP, calculated at the official exchange rate of LBP 1,507.5/US$, as well as to deposits in other foreign currencies.
TABLE 2 • Summary of Fiscal Accounts Showing Actual Numbers, WB Estimates and Government Budgets
2019 2020 2021 2020 2021
Central Government Finance (in percent of GDP) Actual WB estimates Budget Budget draft
Revenue (including grants) 20.6 11.5 6.9 11.3 6.3
o/w. tax revenues 15.5 8.1 4.9 8.4 4.9
Total expenditure and net lending 31.2 16.4 12.2 15.4 8.5
Current 29.9 15.2 10.9 14.9 8.2
o/w interest payment 10.0 2.1 1.4 4.0 1.4
Capital & net lending (excluding foreign financed) 1.3 1.2 1.3 0.4 0.3
Overall balance (deficit (–)) –10.5 –4.9 –5.3 –4.1 –2.2
Primary balance (deficit (–)) –0.5 –2.8 –3.9 –0.1 –0.7
(in LBP bln)
Revenue (including grants) 16,678 13,706 14,750 13,396 13,572
o/w. tax revenues 12,533 9,593 10,500 9,966 10,493
Total expenditure and net lending 25,180 19,492 26,132 18,232 18,259
Current 24,152 18,090 23,356 17,738 17,524
o/w interest payment 8,067 2,504 2,949 4,695 3,106
Capital & net lending (excluding foreign financed) 1,028 1,402 2,776 493 735
Overall balance (deficit (–)) –8,502 –5,786 –11,382 –4,836 –4,687
Primary balance (deficit (–)) –435 –3,282 –8,433 –141 –1,581
(continued on next page)
RECENT MACRO-FINANCIAL DEvELOPMENTS 9
BOX 2: LEBANON’ 2021 BuDGET DRAFT PROPOSALa (CONTINUED)
World Bank estimates suggests that, as of December 2020, this tax can generate revenues in the amount of around LBP 165 billion on LBP deposits, and a US$750 billion on dollar deposits.
Another measure is a tax on interest income paid on bank deposits, certificates of deposit and treasury bills, which currently stands at 10 percent. The adjustment proposed imposes a 30 percent tax on the part of interest rates that exceeds 3 percent and 5 percent on US$ and LBP accounts, respectively. This effectively targets the financial sector’s interest earned from government bonds. Bank customers’ deposits will largely be exempt since interest rates on US$ and LBP deposits have generally fallen below these thresholds.
Expenditures in 2021 budget draft are also projected to drop, to 9.4 percent of GDP, compared to an estimated 16.4 percent of GDP in 2020. In nominal terms, expenditures would rise by a mere 0.2 percent compared to the 2020 budget, but would fall by 84.1 percent in real terms (when considering the official aggregate Consumer Price Index). Sharp nominal cuts in spending (33.8 percent) arise in debt service thanks to the Eurobond default and favorable arrangement with BdL. Capital expenditures are projected at 0.4 percent of GDP, marking a 49 percent increase in nominal terms, from those in the 2020 budget.
Notable new expenditure items include: (1) the rescheduling arrears due to the National Social Security Fund (NSSF) to be paid in equal installments in Treasury Bonds over the next 20 years, with the first such payment due in September 2021; (2) in a bid to encourage employment of Lebanese in firms, the Government will pay, on their behalf, their due contributions to NSSF for a period of two years, as long as (i) they are hired before December 31, 2021; (ii) they were either unemployed or entering the job market for the first time; and (iii) each employee’s salary does not exceed LBP 18 million per year; (3) the amount of bank deposit guaranteed by the National Deposit Guarantee Institution increases to LBP 300 million, from a previous LBP 75 million; and (4) an obligation for banks to pay new foreign currency deposits in the currency of the deposit, upon the request of the involved person, in a bid to attract new deposits in foreign currencies. Relatedly, new deposits in FX will be exempt from tax on interest income, in hope of attracting FX deposits to the banking sector.
Irrespective of new expenditure items, the proposed 2021 budget allocations to primary expenditures constitute a decrease of around 12 percent compared to what are estimated for 2020. We note that our projections suggest the persistence of exceptionally high inflation rates in 2021. This predisposition can either (i) degrade the proposed budget’s creditability, due to expected social pressures and real costs resulting from the high inflationary environment; or, if forced through, (ii) further entrench the severe decline in purchasing power for another year.
a The budget draft proposal has yet to be discussed by Cabinet and will need to be ratified by Parliament. Hence, measures and numbers in the budget draft are subject to revisions by Cabinet and Parliament before the budget is passed as a law.b It is important to note that these numbers exclude a transfer to EdL in the amount of LBP 1,500 billion (0.7 percent of GDP), since this transfer is considered by the Ministry of Finance as a treasury advance, and is therefore excluded from Central Government fiscal balance. Since EdL has no capacity and poor prospects of ever repaying this and previous Treasury advances, under international government accounting standards (GFSM), they should be recorded as transfers.
is rapidly eroding the real value of domestic debt, the
sharp depreciation of the currency continues to make
Lebanon’s sovereign debt burden unsustainable.
The External Sector
As foreign financing of the current account (CA)
deficit came to a sudden stop in late 2019, a
massive contraction of the CA took place in 2020
driven by a sharp contraction in imports. Fol-
lowing the de facto introduction of capital controls,
the sovereign default, capital inflows into Lebanon
stopped. While BdL made use of its limited foreign
exchange reserves in 2020, a forced and massive
adjustment/re-sizing of the previously massive
current account deficit took place. Specifically, over
11M-2020, a 44 percent decline in merchandize im-
ports more than offset a 5 percent drop in exports,
shrinking the trade in goods deficit by a drastic 54.8
percent in one year. Net remittances is estimated to
have increased from 6.1 percent of GDP in 2019 to
9.7 percent of GDP in 2020. The increase is a result
of (i) a sharp decline in US$ GDP (a denominator
effect); (ii) large decreases in remittances outflows,
as foreign workers in Lebanon suffer from the eco-
nomic contraction; and (iii) some remittances inflows
incentivized by the well-documented “insurance”18
18 The “insurance” behavior suggests that diaspora increases remittances back home in case of natural disasters.

LEBANON ECONOMIC MONITOR: LE NAUFRAGE DU LIBAN (AU NUMÉRO 3)/LEBANON SINKING (TO THE TOP 3)10
and other countercyclical19 behaviors observed in
countries with large diasporas. Nominally, howev-
er, remittances inflows are estimated to have been
negatively impacted by an impaired banking sector—
the traditional conduit for remittances—and the CO-
VID-19 global impact. Overall, we expect the current
account deficit in 2020 to contract, falling by almost
10 pps to reach 11 percent of GDP, compared to a
medium-term (2013–2019) average of 22.5 percent
of GDP.
The sudden stop in capital inflows,
coupled with a smaller but still large current
account deficit, has steadily depleted BdL’s
foreign exchange (FX) reserves (Figure 6). By
January 2021, gross FX reserves at BdL (excluding
gold reserves) reached $23.5 billion, declining by
$13.8 billion since end-2019. BdL’s gross position
includes US$5 billion in Lebanese Eurobonds and
an unpublished amount lent out to banks since
October 2019. Much of the remainder is required
reserves on banks’ customer FX deposits, which is
estimated at US$16.7 billion. Critically, BdL’s gross
position differs widely from its net reserves (i.e., gross
FX reserves at the central bank net of FX liabilities to
others); contrary to other central banks, BdL does
not publish net reserves, which are estimated to be
significantly negative.
A high import ratio for the consumption
basket, along with the shortage of dollars in the
market suggest an implicit tradeoff between
(i) importation of goods and services and
(ii) BdL’s stock of foreign exchange reserves. This
compelled authorities to prioritize imports. First, and
early on in the crisis, BdL identified a list of highly
critical goods (denoted as C1 goods)—namely, fuel,
medicine and wheat—to be backed by its stock of
foreign exchange reserves at the official exchange
rate.20 The Government followed suit in July 2020 with
a list of other critical goods, issued by the Ministry
of Economy and Trade (MoET), which BdL agreed
to back up at the platform exchange rate (LL 3,900
19 During economic hardships in the home country, expatriates can also boost transfers back home in support of family.
20 BdL set up a mechanism via commercial banks whereby importers of highly critical goods can exchange LBP for dollars at the official exchange rate for 85 to 90 percent of the cost of their imports, while sourcing the remaining 15 to 10 percent from the market at the US$ banknote rate.
FIGuRE 4 • Large Shortfalls in Revenues Will Induce a Significant Deterioration in the Fiscal Position
–15–18
–23–20
–25–28
1993
1995
1997
1999
2001
2003
2005
2007
2009
2011
2013
2015
2017
2019
–10–13
–3–5–8
35
Fiscal Aggregates (% of GDP)
Perc
ent (
%)
0
Overall Fiscal BalancePrimary Fiscal Balance, Excluding Interest Payments
Sources: Lebanese authorities and WB staff calculations.
FIGuRE 5 • valuation Effects from Exchange Rate Depreciations Will Pressure the Debt-to-GDP Ratio
2010
0
1991
1994
1997
2000
2003
2006
2009
2012
2015
2018
2021
4030
706050
90100
Gross Public Debt
US$
Billi
on
Perc
ent o
f GDP
(%)80
0
100
50
200
250
150
External Public Debt (US$ bln)Gross Public Debt (US$ bln)Domestic Public Debt (US$ bln)
External Public Debt, at anIllustrative Exchange Rate,as a Percentage of GDP (rhs, %)External Public Debt, at Official Rate, as a Percentage of GDP (rhs, %)
Gross Public Debt as Percentage of GDP (rhs, %)
Sources: Lebanese authorities and WB staff calculations.

RECENT MACRO-FINANCIAL DEvELOPMENTS 11
per US$). This list was updated in November 2020 to
include almost half the number of items that were in
the original list. Hereafter, the original list will be called
C2a while the latest will be called C2b.
An examination of historical and recent
trends for C1 and C2b imports are revealing.
The shares of C1, C2b, luxury and other imports to
total imports are presented annually from 2011 to
2019 and monthly over 2019–20 in Figures 7 and 8,
respectively. Figure 7 illustrates relative stability in the
respective shares until 2019. Meanwhile, as foreign
exchange constraints became binding, the ratios
of C1 imports, and to a lesser extent C2a and C2b
imports, rose at the expense of those for luxury and
other goods (Figure 8). The average monthly values
over the January 2019 to October 2020 period for C2a
and C2b are US$180 and US$161 million, indicating
unsubstantial savings by the second MoET list.
Importers from across the economy com-
pete for access to these FX-backed facilities.
However, less transparent demand is also well-docu-
mented in countries with capital controls and multiple
exchange rate systems; specifically, corruption and
misclassification of imports to benefit from cheap
foreign exchange. As importers adapt to capital con-
trols and more depreciated black-market rates, this
incentive will grow.
Money and Banking
Monetary and financial turmoil are driving crisis
conditions, specifically through interactions
between the exchange rate, narrow money and
FIGuRE 6 • A Steady Depletion in the Gross Foreign Exchange Position at BdL
0
Jan-
13A
pr-1
3Ju
l-13
Oct
-13
Jan-
14A
pr-1
4Ju
l-14
Oct
-14
Jan-
15A
pr-1
5Ju
l-15
Oct
-15
Jan-
16A
pr-1
6Ju
l-16
Oct
-16
Jan-
17A
pr-1
7Ju
l-17
Oct
-17
Jan-
18A
pr-1
8Ju
l-18
Oct
-18
Jan-
19A
pr-1
9Ju
l-19
Oct
-19
Jan-
20A
pr-2
0Ju
l-20
Oct
-20
Jan-
21
50,00045,00040,00035,00030,00025,00020,000
10,0005,000
15,000
Gross Reserves at BdL
US$
mln
Foreign CurrenciesGross FX Reserves
Foreign SecuritiesCompulsory FX Reserve
Sources: BdL and WB staff calculations.Note: Compulsory FX reserves are World Bank estimates based on published data, and a 15 percent required reserve ratio on FX deposits in commercial banks.
FIGuRE 7 • Ratios of C1, C2b, Luxury and other Imports Were Stable until the Period Leading to the Crisis…
Critical 1 Critical 2b Luxury Other
0%2011 2012 2013 2014 2015 2016 2017 2018 2019
100%
90%
80%
70%
60%
50%
40%
30%
20%
10%
Critical and Essential Imports
% o
f Tot
al Im
ports
Sources: Customs, MOET, BdL and WB staff calculations.
FIGuRE 8 • …when Ratios of C1 and C2b Imports Rose at the Expense of those for Luxury and Other Goods .
Critical 1 Critical 2b Luxury Other
0%
100%
90%
80%
70%
60%
50%
40%
30%
20%
10%
Critical and Essential Imports
% o
f Tot
al Im
ports
Jan-
19Fe
b-19
Mar
-19
Apr
-19
May
-19
Jun-
19Ju
l-19
Aug
-19
Sep-
19O
ct-1
9
Jan-
20Fe
b-20
Mar
-20
Apr
-20
May
-20
Jun-
20Ju
l-20
Aug
-20
Sep-
20O
ct-2
0
Nov
-19
Dec
-19
Sources: CAS and WB staff calculations.

LEBANON ECONOMIC MONITOR: LE NAUFRAGE DU LIBAN (AU NUMÉRO 3)/LEBANON SINKING (TO THE TOP 3)12
inflation. Acute exchange market pressures in
Lebanese markets are reflected by heavy fluctuations
in the US$ banknote exchange rate,21 which breached
LL 15,000/US$, before falling back down. This is
within the context of a multiple exchange rate system,
which includes the official exchange (LBP 1,507.5/
US$) as well BdL’s platform rate set at LBP 3,900/
US$. Overall, the World Bank calculated Average
Exchange Rate (AER)22 depreciated by 129 percent
in 2020 (Figure 9).
Limited economic utility for electronic dol-
lars,23 along with scarcity of dollar banknotes, and
minimum incentives to save in LBP, all rendered
the economy heavily cash-based in local currency.
In 2020, the stock of currency in circulation increased
by 197 percent (yoy), even as M2 increased by a
mere 6.3 percent, while M3 declined by 1.4 percent.
The latter two money supply measures reflect the
deleveraging that is going in the financial sector (see
below).
Exchange rate pass through effects on
prices have resulted in surging inflation, hitting
the poorest and most vulnerable the most. The
12-month inflation rate has risen steadily and sharply
from 10 percent in January 2020, to 89.7 percent in
June 2020, 120 percent in August 2020, and most
recently, to 157.9 percent in March 2021. Inflation is
a highly regressive tax, disproportionally affecting
the poor and vulnerable (Box 3), and more generally,
people living on fixed income like pensioners. This is
especially so in Lebanon’s case where basic items of
the consumption basket are primary drivers of overall
inflation. In fact, the main contributors of inflation
are food and non-alcoholic beverages, followed by
clothing and footwear, and then furnishing and house-
hold equipment (Figure 10); prices for these basic
consumption items have surged by 254.3, 289.8 and
389.7 percent, respectively, in 2020.
The severe restrictions on capital outflows
have given the monetary authorities room
to lower interest rates. From October 2019 to
December 2020, BdL lowered interest rates on
banks’ LBP and dollar deposits by 639 and 567
basis points (bps), respectively. Banks’ lending rates
in LBP and US$ have mirrored this effect, falling by
342 and 332 bps, respectively over the same period.
As inflation has surged during that same period,
real interest rates in the country are highly negative
across the board.
Since the eruption of the financial crisis,
BdL has been almost an exclusive policy maker,
with the exception of a brief period in which
Government defaulted on its Eurobond obliga-
tions and unsuccessfully proposed its Financial
Recovery Plan. The Fall 2020 LEM listed in detail
the slew of BdL circulars, which formalized BdL’s
crisis management strategy. The main BdL policy
initiatives/updates since then include (i) a new
financial operation; (ii) an announcement by BdL
to allow commercial banks to conduct currency
exchanges at the market rate; and (iii) the expiration
of a deadline for commercial banks to meet Circular
154 provisions.
In March 2021, BdL announced a new
financial operation. Details of this operation and
an illustrative example are presented in Box 4. In
this most recent operation, BdL offers banks FX in
exchange for LBP, increasing its liabilities in FX and
21 The US$ banknote market has become a main supply channel for dollars for both real and financial activity, as commercial banks heavily restricted withdrawals and transfers of customers’ dollar deposits.
22 The AER is derived by applying consumption-based weights on the official, the platform and the US$ banknote exchange rates. For a detailed derivation please refer to: World Bank (2020), The Lebanon Economic Monitor: The Deliberate Depression, Fall 2020. Since then, we make adjusted the AER per the following:We account for a reduced MoET list of subsidized goods starting in November 2020. Beginning in August 2020, 75 percent of the non-imported services is linked to the official exchange rate (compared to 100 percent prior), while 25 percent is linked to the platform rate. The reason being is that, around that time, certain prominent hospitals and universities announced that they will start billing according to the BdL platform rate.
23 This refers to dollar deposits from prior October 2019, which are subject to strict capital controls and can generally be withdrawn only in LBP at the platform rate (LBP 3,900/US$), a significant haircut compared to the value of the dollar being traded in the parallel banknote market.
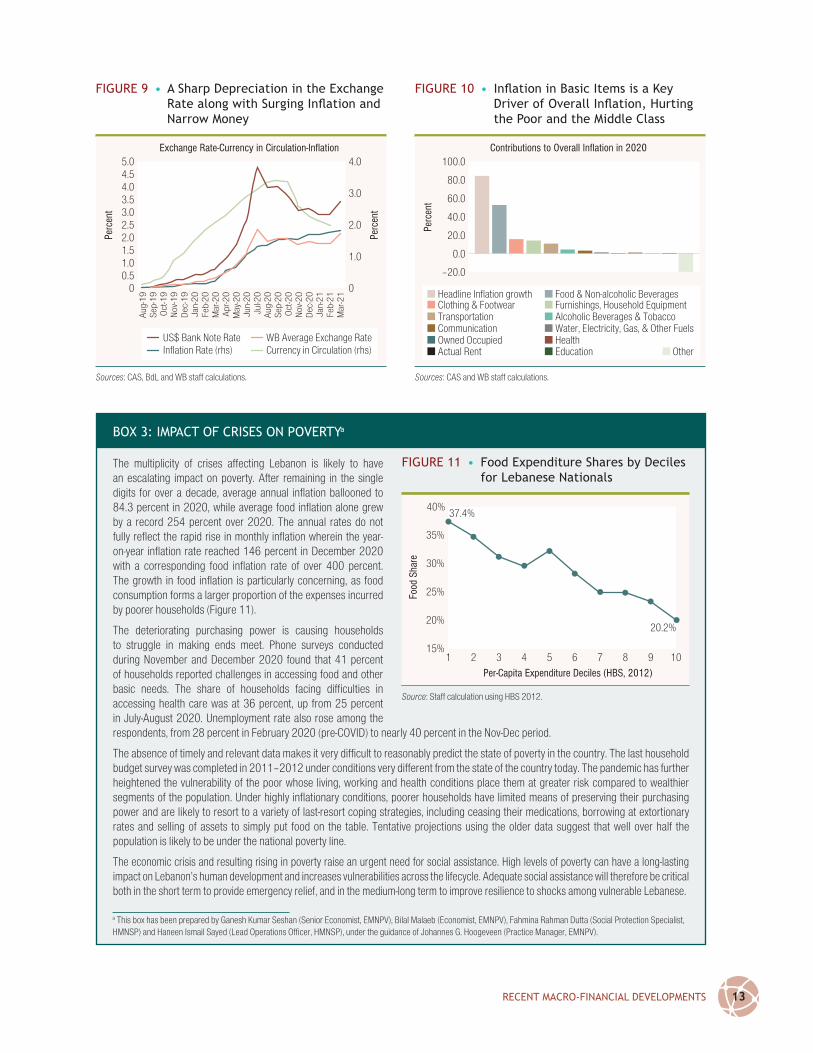
RECENT MACRO-FINANCIAL DEvELOPMENTS 13
FIGuRE 9 • A Sharp Depreciation in the Exchange Rate along with Surging Inflation and Narrow Money
0
Aug
-19
Sep-
19O
ct-1
9N
ov-1
9D
ec-1
9
Aug
-20
Jul-2
0Ju
n-20
May
-20
Apr
-20
Mar
-20
Feb-
20Ja
n-20
Mar
-21
Feb-
21Ja
n-21
Sep-
20O
ct-2
0N
ov-2
0D
ec-2
0
4.55.0
3.54.0
2.53.0
1.52.0
0.51.0
Exchange Rate-Currency in Circulation-Inflation
Perc
ent
Perc
ent
0
4.0
3.0
2.0
1.0
US$ Bank Note RateInflation Rate (rhs)
WB Average Exchange RateCurrency in Circulation (rhs)
Sources: CAS, BdL and WB staff calculations.
FIGuRE 10 • Inflation in Basic Items is a Key Driver of Overall Inflation, Hurting the Poor and the Middle Class
–20.0
80.0
100.0
40.0
60.0
20.0
0.0
Contributions to Overall Inflation in 2020
Perc
ent
Headline Inflation growth Food & Non-alcoholic BeveragesClothing & Footwear Furnishings, Household EquipmentTransportation Alcoholic Beverages & TobaccoCommunication Water, Electricity, Gas, & Other FuelsOwned Occupied HealthActual Rent Education Other
Sources: CAS and WB staff calculations.
BOX 3: IMPACT OF CRISES ON POvERTya
The multiplicity of crises affecting Lebanon is likely to have an escalating impact on poverty. After remaining in the single digits for over a decade, average annual inflation ballooned to 84.3 percent in 2020, while average food inflation alone grew by a record 254 percent over 2020. The annual rates do not fully reflect the rapid rise in monthly inflation wherein the year-on-year inflation rate reached 146 percent in December 2020 with a corresponding food inflation rate of over 400 percent. The growth in food inflation is particularly concerning, as food consumption forms a larger proportion of the expenses incurred by poorer households (Figure 11).
The deteriorating purchasing power is causing households to struggle in making ends meet. Phone surveys conducted during November and December 2020 found that 41 percent of households reported challenges in accessing food and other basic needs. The share of households facing difficulties in accessing health care was at 36 percent, up from 25 percent in July-August 2020. Unemployment rate also rose among the respondents, from 28 percent in February 2020 (pre-COVID) to nearly 40 percent in the Nov-Dec period.
The absence of timely and relevant data makes it very difficult to reasonably predict the state of poverty in the country. The last household budget survey was completed in 2011–2012 under conditions very different from the state of the country today. The pandemic has further heightened the vulnerability of the poor whose living, working and health conditions place them at greater risk compared to wealthier segments of the population. Under highly inflationary conditions, poorer households have limited means of preserving their purchasing power and are likely to resort to a variety of last-resort coping strategies, including ceasing their medications, borrowing at extortionary rates and selling of assets to simply put food on the table. Tentative projections using the older data suggest that well over half the population is likely to be under the national poverty line.
The economic crisis and resulting rising in poverty raise an urgent need for social assistance. High levels of poverty can have a long-lasting impact on Lebanon’s human development and increases vulnerabilities across the lifecycle. Adequate social assistance will therefore be critical both in the short term to provide emergency relief, and in the medium-long term to improve resilience to shocks among vulnerable Lebanese.
FIGuRE 11 • Food Expenditure Shares by Deciles for Lebanese Nationals
15%1 2 3 4 5 6 7 8 9 10
20%
25%
30%
35%
40%
Per-Capita Expenditure Deciles (HBS, 2012)
Food
Sha
re
20.2%
37.4%
Source: Staff calculation using HBS 2012.
a This box has been prepared by Ganesh Kumar Seshan (Senior Economist, EMNPV), Bilal Malaeb (Economist, EMNPV), Fahmina Rahman Dutta (Social Protection Specialist, HMNSP) and Haneen Ismail Sayed (Lead Operations Officer, HMNSP), under the guidance of Johannes G. Hoogeveen (Practice Manager, EMNPV).

LEBANON ECONOMIC MONITOR: LE NAUFRAGE DU LIBAN (AU NUMÉRO 3)/LEBANON SINKING (TO THE TOP 3)14
BOX 4: THE MOST RECENT FINANCIAL OPERATION By BDL WITH COMMERCIAL BANKS
The most recent financial operation employed by BdL involves the following steps:
1. Banks discount medium- to long-term LBP Time Deposits (TDs) and/or Certificates of Deposits (CDs) at a discount rate of yield plus up to 1 percent.
2. With the proceeds from the above operation, banks buy US$ at LBP 1514/US$ from BdL and deposit this amount at their US$ current account with BdL, receiving zero interest rate.
3. Banks are also required to unwind LBP financial engineering structures at least equivalent to the US$ amount bought (at least 1 to 1 ratio). The unwinding process consists of discounting at par LBP TDs as well as their linked LBP Repos.
4. Banks would sign an undertaking to sell back to BdL the amount US$ bought at the electronic platform rate upon the first demand from BdL, through discounting US$ TDs and CDs.
5. The amount of US$ the bank is committed to sell back to BdL will be reduced by the amount of US$ the bank sells to BdL under Circular 151, from January 2021 until the call back date (as per Central Decision Council amendment).
For illustrative purposes, we present a simplified example.
Steps 1–3 are Spot Transactions
Suppose step 1 involves discounting LBP 1,514,000 in face value divided evenly between TDs and CDs. Long term average interest rates for LBP TDs and CDs are around 3.5 and 8.5 percent, respectively. Hence the average yield for step 1 is 6 percent (= 0.5*3.5 + 0.5*8.5). Moreover, we assume the average maturity for these TDs and CDs is 10 years. Hence, the present value for this operation is calculated by discounting (i) coupon payments, which we are assuming annual; and (ii) the face value payment at maturity, such that:
6%*(1,514,000)
(1+6%)nn=1
10∑ +1,514,000
(1+6%)n=LBP 1,514,000 = US $ 1000 (at LBP 1,514 /US $)
Hence, banks use the proceeds to purchase US$1,000 from BdL, which is deposited at a non-yielding current account with the central bank.
Further, per step 3, banks unwind LBP 1,514,000 of financial engineering TDs and repos by discounting at par. These TDs were created as part of BdL’s financial engineering operations in which BdL lent banks LBP at 2 percent annual rates on the condition they were placed as TDs with BdL earning 10.5 percent annually. Hence, the net return on these TDs for banks was 8.5 percent annually. Hence, as earlier, we discount (i) the annual net return on these TDs; and (ii) the repayment of loan principal at maturity; this generates a present value of LBP 1,514,000.
Steps 4 and 5 are Future Transactions
At future dates, banks are obliged to sell back US$ 1000 minus whatever dollars they sell under Circular 151, herein denoted by X. The dollar value is exchanged to LBP at the platform rate of the time, denoted by E, and which is currently at LBP 3,900/US$.
The combination of steps constitutes a call option for BdL to buy back the US dollars, albeit, with undefined terms, due to uncertainty over key parameters, such as X, E, and time to expiration of the call option. Hence, for simplification purposes in this illustrative example, we assume away the accounting and pricing implication of the call option for BdL, and symmetrically for Banks.
Hence, according to the numbers used in this illustrative example, a balance sheet analysis suggests (with spot transactions in light green background and future transactions in white):
Banks
Assets Liabilities
LBP –1,514,000
US$ +1000
LBP –1,514,000 LBP –1,514,000
US$ –(1000-X)
LBP +[($1000-$X)*E]
BdL
Assets Liabilities
LBP –1,514,000
US$ +1000
LBP –1,514,000 LBP –1,514,000
US$ –(1000-X)
LBP +[($1000-$X)*E]
(continued on next page)
RECENT MACRO-FINANCIAL DEvELOPMENTS 15
BOX 4: THE MOST RECENT FINANCIAL OPERATION By BDL WITH COMMERCIAL BANKS (CONTINUED)
For BdL:
At spot
• BdL’s liabilities are lower by LBP 3,028,000 (=1,514,000+1,514,000) but higher by US$1000.
• BdL’s assets are lower by LBP 1,514,000
• Net impact on BdL’s capital would thus be
• Positive (i.e., capital increases) if the exchange rate is lower than LBP 1,514/US$
• Negative (i.e., capital decreases) if the exchange rate is higher than LBP 1,514/US$
Over time
• BdL’s liabilities are lower by LBP [1,514,000+1,514,000-($1000-$X)*E] but higher by US$X.
• BdL’s assets are lower by LBP 1,514,000
• Net impact on BdL’s capital would thus be
• Positive (ie. capital increases) if the exchange rate is lower than
LBP (1,514,000)−(1000−X)*EX
per US$
• Negative (ie. capital decreases) if the exchange rate is more than
LBP (1,514,000)−(1000−X)*EX
per US$
For Banks:
At spot
• Bank’s assets are lower by LBP 3,028,000 but higher by US$1000.
• Banks’ liabilities are lower by LBP 1,514,000
• Net impact on banks’ capital would thus be
• Negative (i.e., capital decreases) if the exchange rate is lower than LBP 1,514/US$
• Positive (i.e., capital increases) if the exchange rate is greater than LBP 1,514/US$
Over time
• Banks’ assets are lower by LBP [1,514,000+1,514,000-($1000-$X)*E] but higher by US$X.
• Banks’ liabilities are lower by LBP 1,514,000
• Net impact on Banks’ capital would thus be
• Negative (ie. capital decreases) if the exchange rate is lower than
• LBP (1,514,000)−(1000−X)*EX
per US$
• Positive (ie. capital increases) if the exchange rate is more than
• LBP (1,514,000)−(1000−X)*EX
per US$
From an income perspective, and according to the numbers used in this illustrative example, in the absence of this operation, banks (BdL) would be earning (paying) a return of
• an average of 6 percent from LBP TDs and CDs;
• an average of 8.5 percent from LBP TDs and repos;
for a total of 14.5 percent on LBP instruments. Meanwhile, in this operation
• 14.5 percent earnings on LBP instruments for banks are eliminated; hence BdL saves 14.5 percent;
• BdL does not pay interest on Banks’ dollar deposits;
Overall, from an income perspective, and according to the numbers used in this illustrative example, BdL saves (banks lose) 14.5 percent annually.
LEBANON ECONOMIC MONITOR: LE NAUFRAGE DU LIBAN (AU NUMÉRO 3)/LEBANON SINKING (TO THE TOP 3)16
decreasing it in LBP, with the exchange occurring
at the official exchange rate. It then compels banks
to sell this FX back to BdL (whether directly or via
the ongoing Lirafication scheme24) at the platform
rate, which is currently set at LBP 3,900/US$. With
the caveat that a comprehensive assessment of this
operation is more accurate from a hindsight per-
spective, as it is able to better capture interactions
and incentives that might not be clear at this point,
we present some preliminary observations:
• As a spot transaction, the operation will cancel
out LBP assets and liabilities that resulted from
BdL’s previous financial operations.25
• As a spot transaction, BdL will incur an FX liability
to banks and hence worsen its net international
reserve (NIR) position. Since the FX offered by
BdL to banks is not real liquidity, or “fresh dollars,”
its use is limited to closing banks’ FX positions
with BdL (i.e., banks’ deleveraging schemes such
as Lirafication).
• As a spot transaction, this operation will worsen
(improve) BdL’s (banks’) capital position.
• Over time, all things equal, this operation will
interact with Circular 151, with a likelihood that,
on the net, BdL will increase its FX liabilities.
Commercial banks’ deleveraging, as incentivized
by Circular 151,26 would be occurring
irrespective of this operation and will not be
further incentivized by it. Hence Step 5 in Box 4.
The most recent financial operation by BdL with
commercial banks27 suggests that this operation
would prevent a larger overall reduction to BdL
FX liabilities that would have occurred in the
absence of this operation.
• Over time, and after banks have sold back this
FX liquidity to BdL, BdL would have replaced the
LBP liability with currency in circulation.
Also in March 2021, a Baabda Presidential
Palace announcement stated that BdL will start
allowing commercial banks to conduct currency
transactions similar to legal exchange dealers, at
a rate to be set by the Central Bank’s electronic
platform. While information on this has been scarce,
notable factors include:
• This would be based on the current “Sayrafa”
platform, which is now set at LBP 3,900/US$.28
Indeed, after the Baabda Palace announcement,
BdL sent a “Request” to banks and exchange
dealers to register on Sayrafa.
• This is not meant to completely replace the
parallel market.
• It is not clear how close the Sayrafa rate would be
to US$ banknote rate; or how responsive it would
be to changes in the banknote rate.29
• Transactions would be restricted to exchange of
currency notes only (LBP and US$).
• On the demand side (of FX): the announced
intention is to allow access to only those engaged
in “legitimate economic transactions”, (i.e.,
traders/industrialists/businesses, for trade and
business activities).
24 BdL has regulated that dollar deposits that existed prior to October 2019 can be withdrawn only in LBP at the platform rate, thereby effecting Lirafication and a haircut (up to 70 percent) on these deposits. More formally, Circular 151, as part of a sequence of circulars (148, 151, 549, 565), allowed the withdrawal of pre-crisis deposits at exchange rates that are higher than the official rate, but lower than the US$ banknote rate. This rate eventually settled at the platform rate, which is currently set at LBP 3,900/US$.
25 In previous financial engineering schemes, BdL incurred LBP liabilities, which were offered as an incentive to commercial banks to purchase Eurobonds from BdL, allowing BdL to raise its gross foreign exchange reserves by tapping into commercial banks’ foreign assets.
26 These deleveraging schemes have resulted in reductions in customers FX deposits with banks, which effected commensurate reductions in banks’ FX deposits with BdL, and hence, reductions in BdL’s FX liabilities, and improvements in BdL’s NIR.
27 Step 5 states: the amount of US$ the bank is committed to sell back to BdL will be reduced by the amount of US$ the bank sells on an annual basis to BdL under Circular 151.
28 In fact, the Sayrafa platform was initially set up by Circular 149 (April 3, 2020), in which BdL announced a special unit comprising BdL, banks and exchange bureaus that exchanges foreign currencies. The Sayrafa was intended as electronic board that publishes exchange rates.
29 Minister of Finance, in an interview to a TV channel, mentioned the rate LL10,000/US$.
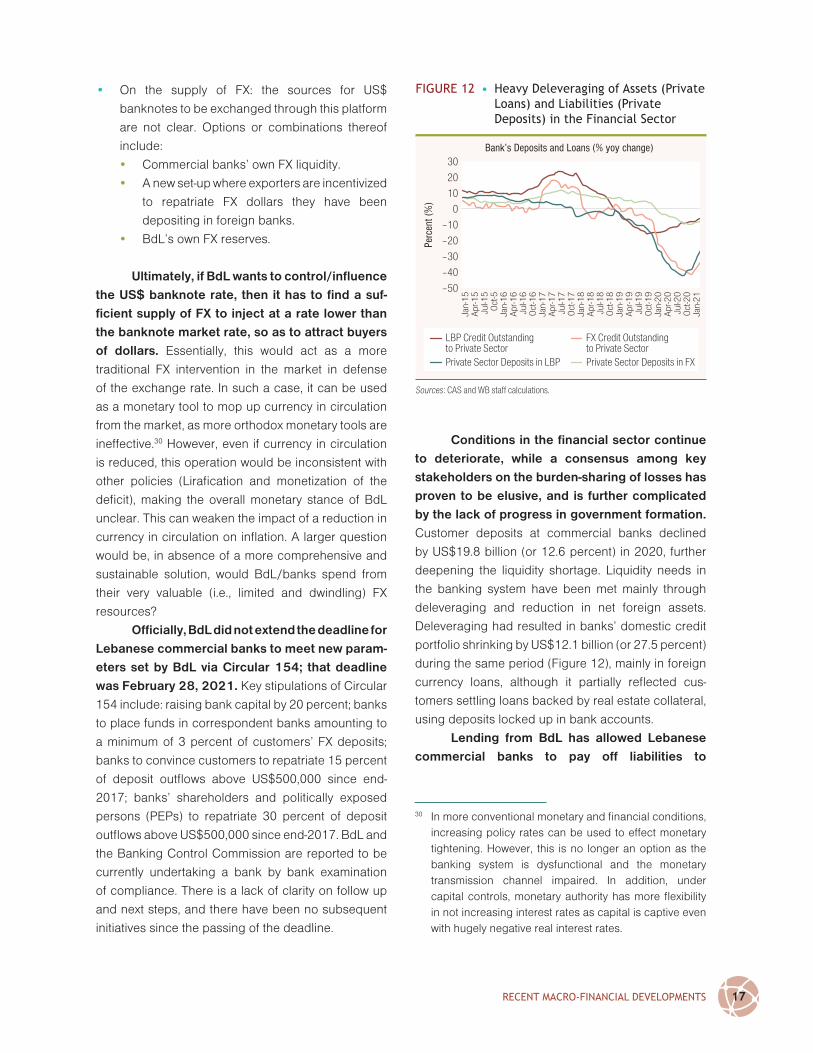
RECENT MACRO-FINANCIAL DEvELOPMENTS 17
• On the supply of FX: the sources for US$
banknotes to be exchanged through this platform
are not clear. Options or combinations thereof
include:
• Commercial banks’ own FX liquidity.
• A new set-up where exporters are incentivized
to repatriate FX dollars they have been
depositing in foreign banks.
• BdL’s own FX reserves.
Ultimately, if BdL wants to control/influence
the US$ banknote rate, then it has to find a suf-
ficient supply of FX to inject at a rate lower than
the banknote market rate, so as to attract buyers
of dollars. Essentially, this would act as a more
traditional FX intervention in the market in defense
of the exchange rate. In such a case, it can be used
as a monetary tool to mop up currency in circulation
from the market, as more orthodox monetary tools are
ineffective.30 However, even if currency in circulation
is reduced, this operation would be inconsistent with
other policies (Lirafication and monetization of the
deficit), making the overall monetary stance of BdL
unclear. This can weaken the impact of a reduction in
currency in circulation on inflation. A larger question
would be, in absence of a more comprehensive and
sustainable solution, would BdL/banks spend from
their very valuable (i.e., limited and dwindling) FX
resources?
Officially, BdL did not extend the deadline for
Lebanese commercial banks to meet new param-
eters set by BdL via Circular 154; that deadline
was February 28, 2021. Key stipulations of Circular
154 include: raising bank capital by 20 percent; banks
to place funds in correspondent banks amounting to
a minimum of 3 percent of customers’ FX deposits;
banks to convince customers to repatriate 15 percent
of deposit outflows above US$500,000 since end-
2017; banks’ shareholders and politically exposed
persons (PEPs) to repatriate 30 percent of deposit
outflows above US$500,000 since end-2017. BdL and
the Banking Control Commission are reported to be
currently undertaking a bank by bank examination
of compliance. There is a lack of clarity on follow up
and next steps, and there have been no subsequent
initiatives since the passing of the deadline.
Conditions in the financial sector continue
to deteriorate, while a consensus among key
stakeholders on the burden-sharing of losses has
proven to be elusive, and is further complicated
by the lack of progress in government formation.
Customer deposits at commercial banks declined
by US$19.8 billion (or 12.6 percent) in 2020, further
deepening the liquidity shortage. Liquidity needs in
the banking system have been met mainly through
deleveraging and reduction in net foreign assets.
Deleveraging had resulted in banks’ domestic credit
portfolio shrinking by US$12.1 billion (or 27.5 percent)
during the same period (Figure 12), mainly in foreign
currency loans, although it partially reflected cus-
tomers settling loans backed by real estate collateral,
using deposits locked up in bank accounts.
Lending from BdL has allowed Lebanese
commercial banks to pay off liabilities to
30 In more conventional monetary and financial conditions, increasing policy rates can be used to effect monetary tightening. However, this is no longer an option as the banking system is dysfunctional and the monetary transmission channel impaired. In addition, under capital controls, monetary authority has more flexibility in not increasing interest rates as capital is captive even with hugely negative real interest rates.
FIGuRE 12 • Heavy Deleveraging of Assets (Private Loans) and Liabilities (Private Deposits) in the Financial Sector
–50
–40
–30
–20
–10
0
Jul-1
5A
pr-1
5Ja
n-15
Oct
-5
Jul-1
6A
pr-1
6Ja
n-16
Oct
-16
Jul-1
7A
pr-1
7Ja
n-17
Oct
-17
Jul-1
8A
pr-1
8Ja
n-18
Oct
-18
Jul-1
9A
pr-1
9Ja
n-19
Oct
-19
Jul-2
0A
pr-2
0Ja
n-20
Jan-
21O
ct-2
0
30
20
10
Bank’s Deposits and Loans (% yoy change)
Perc
ent (
%)
Private Sector Deposits in LBP Private Sector Deposits in FX
LBP Credit Outstandingto Private Sector
FX Credit Outstandingto Private Sector
Sources: CAS and WB staff calculations.
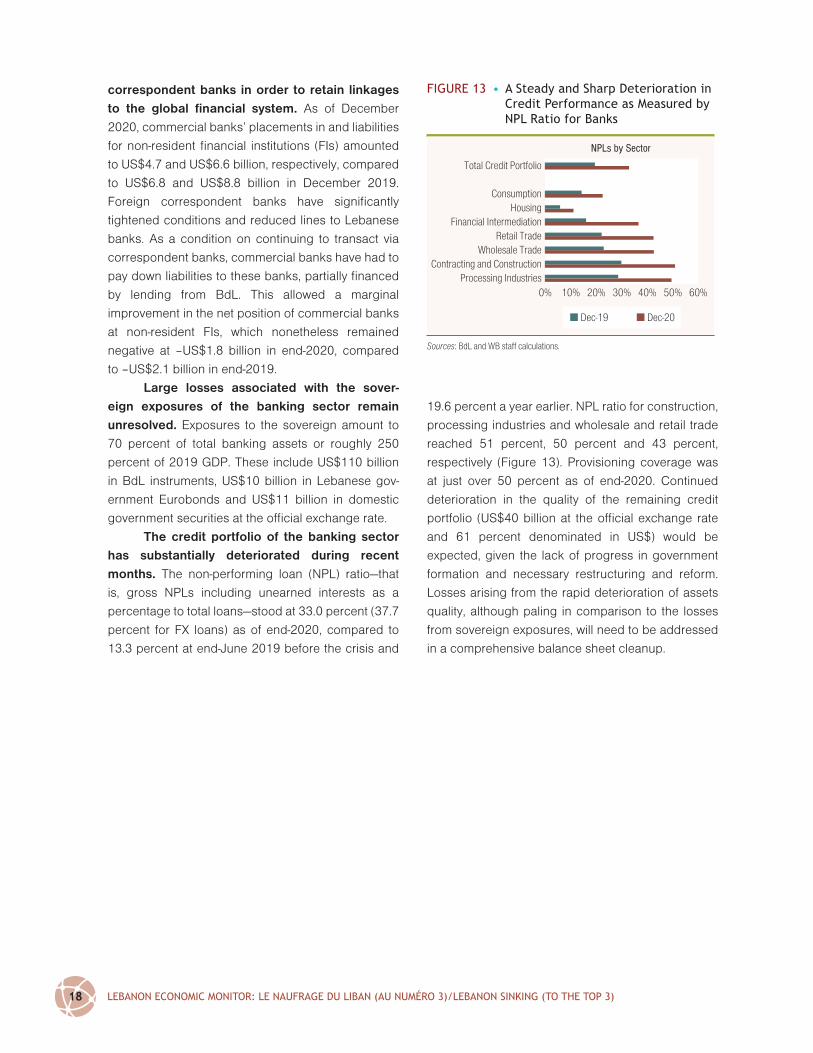
LEBANON ECONOMIC MONITOR: LE NAUFRAGE DU LIBAN (AU NUMÉRO 3)/LEBANON SINKING (TO THE TOP 3)18
correspondent banks in order to retain linkages
to the global financial system. As of December
2020, commercial banks’ placements in and liabilities
for non-resident financial institutions (FIs) amounted
to US$4.7 and US$6.6 billion, respectively, compared
to US$6.8 and US$8.8 billion in December 2019.
Foreign correspondent banks have significantly
tightened conditions and reduced lines to Lebanese
banks. As a condition on continuing to transact via
correspondent banks, commercial banks have had to
pay down liabilities to these banks, partially financed
by lending from BdL. This allowed a marginal
improvement in the net position of commercial banks
at non-resident FIs, which nonetheless remained
negative at –US$1.8 billion in end-2020, compared
to –US$2.1 billion in end-2019.
Large losses associated with the sover-
eign exposures of the banking sector remain
unresolved. Exposures to the sovereign amount to
70 percent of total banking assets or roughly 250
percent of 2019 GDP. These include US$110 billion
in BdL instruments, US$10 billion in Lebanese gov-
ernment Eurobonds and US$11 billion in domestic
government securities at the official exchange rate.
The credit portfolio of the banking sector
has substantially deteriorated during recent
months. The non-performing loan (NPL) ratio—that
is, gross NPLs including unearned interests as a
percentage to total loans—stood at 33.0 percent (37.7
percent for FX loans) as of end-2020, compared to
13.3 percent at end-June 2019 before the crisis and
19.6 percent a year earlier. NPL ratio for construction,
processing industries and wholesale and retail trade
reached 51 percent, 50 percent and 43 percent,
respectively (Figure 13). Provisioning coverage was
at just over 50 percent as of end-2020. Continued
deterioration in the quality of the remaining credit
portfolio (US$40 billion at the official exchange rate
and 61 percent denominated in US$) would be
expected, given the lack of progress in government
formation and necessary restructuring and reform.
Losses arising from the rapid deterioration of assets
quality, although paling in comparison to the losses
from sovereign exposures, will need to be addressed
in a comprehensive balance sheet cleanup.
FIGuRE 13 • A Steady and Sharp Deterioration in Credit Performance as Measured by NPL Ratio for Banks
Contracting and ConstructionProcessing Industries
Retail TradeWholesale Trade
HousingFinancial Intermediation
Total Credit Portfolio
Consumption
10%0% 20% 30% 40% 60%50%
Dec-20Dec-19
NPLs by Sector
Sources: BdL and WB staff calculations.

19
GLOBAL CRISES COMPARATORS: LOOKING FOR THE MINIMUM
W e continue to monitor the Lebanon
financial crisis in the context of Global
Crisis Comparators.31 In this LEM, we
compare the Lebanon crisis with the most severe
global crises episodes as observed by Reinhart
and Rogoff (2014), henceforth referred to as R&R.32
Based on the most extensive financial crises database
available,33 R&R calculate a crisis severity index (CSI)
for a sample of 100 crisis episodes over the 1857–
2013 period. The CSI is computed based on (i) the
depth of the crisis episode—the peak-to-trough decline
in real GDP per capita, and (ii) its duration—the number
of years it takes to reach the prior peak in real per
capita income. Specifically, for each crisis episode:
CSI = −1*(peak-to-trough percentage change) +
number of years from peak to recovery to prior peak
R&R’s 25 most severe crises and associated
results are presented in Table 3. Some notable find-
ings include:
• A typical recurring pattern across time and space
in these cycles is one in which economic activity
reaches a peak either the year before the onset
of crisis or the year of the financial crisis. There
are cases where the downturns start earlier but
these are less frequent.
• A substantial number of these crises are not
“pure” banking crises in that these unfold
alongside a currency crash and often involve a
sovereign default as well.
31 The Fall 2020 LEM, entitled The Deliberate Depression, compares Lebanon’s macroeconomic fundamentals in the lead-up to the crisis to two groups of global crises comparators: the Asian crisis countries of 1997–98, and a more eclectic set of crises that occurred in the 2000’s [Argentina (2001), Greece (2008), Ireland (2008), Iceland (2008) and Cyprus (2012)]. We conclude that, leading up to the crisis point, Lebanon’s macroeconomic fundamentals were weak compared to these global crises comparators, suggesting that the adjustment process will be more painful and will take longer, even with optimal policy measures in place.
32 Reinhart, Carmen M. and Kenneth S. Rogoff (2014), Recovery from Financial Crises: Evidence from 100 Episodes, American Economic Review: Papers & Proceedings 2014, 104(5): 50–55.
33 Reinhart, Carmen M., and Kenneth S. Rogoff (2009), This Time Is Different: Eight Centuries of Financial Folly. Princeton: Princeton University Press.
3
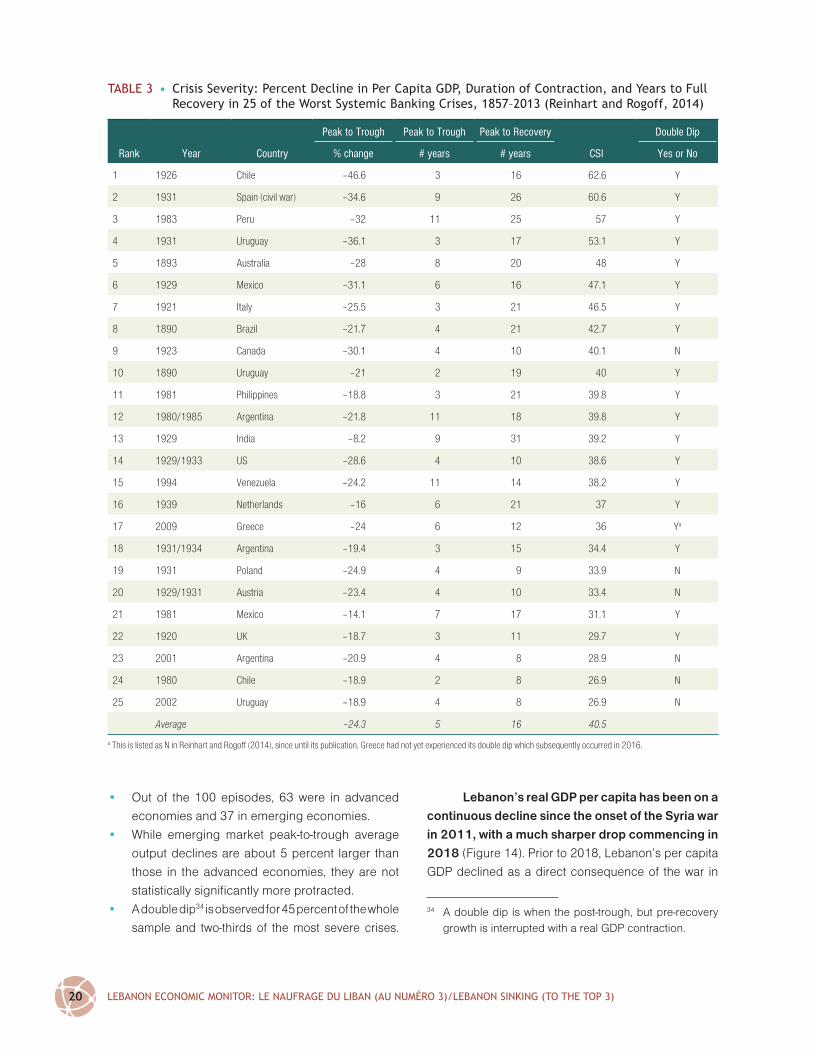
LEBANON ECONOMIC MONITOR: LE NAUFRAGE DU LIBAN (AU NUMÉRO 3)/LEBANON SINKING (TO THE TOP 3)20
• Out of the 100 episodes, 63 were in advanced
economies and 37 in emerging economies.
• While emerging market peak-to-trough average
output declines are about 5 percent larger than
those in the advanced economies, they are not
statistically significantly more protracted.
• A double dip34 is observed for 45 percent of the whole
sample and two-thirds of the most severe crises.
Lebanon’s real GDP per capita has been on a
continuous decline since the onset of the Syria war
in 2011, with a much sharper drop commencing in
2018 (Figure 14). Prior to 2018, Lebanon’s per capita
GDP declined as a direct consequence of the war in
34 A double dip is when the post-trough, but pre-recovery growth is interrupted with a real GDP contraction.
TABLE 3 • Crisis Severity: Percent Decline in Per Capita GDP, Duration of Contraction, and years to Full Recovery in 25 of the Worst Systemic Banking Crises, 1857–2013 (Reinhart and Rogoff, 2014)
Peak to Trough Peak to Trough Peak to Recovery Double Dip
Rank Year Country % change # years # years CSI Yes or No
1 1926 Chile –46.6 3 16 62.6 Y
2 1931 Spain (civil war) –34.6 9 26 60.6 Y
3 1983 Peru –32 11 25 57 Y
4 1931 Uruguay –36.1 3 17 53.1 Y
5 1893 Australia –28 8 20 48 Y
6 1929 Mexico –31.1 6 16 47.1 Y
7 1921 Italy –25.5 3 21 46.5 Y
8 1890 Brazil –21.7 4 21 42.7 Y
9 1923 Canada –30.1 4 10 40.1 N
10 1890 Uruguay –21 2 19 40 Y
11 1981 Philippines –18.8 3 21 39.8 Y
12 1980/1985 Argentina –21.8 11 18 39.8 Y
13 1929 India –8.2 9 31 39.2 Y
14 1929/1933 US –28.6 4 10 38.6 Y
15 1994 Venezuela –24.2 11 14 38.2 Y
16 1939 Netherlands –16 6 21 37 Y
17 2009 Greece –24 6 12 36 Ya
18 1931/1934 Argentina –19.4 3 15 34.4 Y
19 1931 Poland –24.9 4 9 33.9 N
20 1929/1931 Austria –23.4 4 10 33.4 N
21 1981 Mexico –14.1 7 17 31.1 Y
22 1920 UK –18.7 3 11 29.7 Y
23 2001 Argentina –20.9 4 8 28.9 N
24 1980 Chile –18.9 2 8 26.9 N
25 2002 Uruguay –18.9 4 8 26.9 N
Average –24.3 5 16 40.5
a This is listed as N in Reinhart and Rogoff (2014), since until its publication, Greece had not yet experienced its double dip which subsequently occurred in 2016.

GLOBAL CRISES COMPARATORS: LOOKING FOR THE MINIMuM 21
neighboring Syria; both real economic activity slowed
appreciably,35 and population increased significantly
due to the refugee influx.36 R&R calculations of crisis
depth and duration, and hence, the CSI, depend on the
identification of peak year—the year in which the per
capita real GDP reached a pre-crisis peak. However,
due to the impact of the Syrian crisis, and in order
to more accurately gauge the depth and duration of
the Lebanon financial crisis, it would be unbalanced
to identify the peak year in Lebanon by the pre-crisis
peak in real GDP per capita as in R&R. Instead for the
Lebanon episode, we identify the peak year by the pre-
crisis peak in real GDP, which is 2017.
The Lebanon financial crisis is likely to rank
in the top 10, possibly three, most severe crises
episodes globally since 1900. In order to compute
a CSI for the Lebanon financial crisis, we make
assumptions commensurate to (relatively) good and
bad case scenarios. In the good case scenario, we
assume: (i) real GDP per capita trough occurs in 2021
at the World Bank projected growth rate (–9.5 per-
cent), inducing an overall –35.1 percent peak (2017)
to trough (2021) change in real GDP per capita; and
that (ii) it takes 12 years for Lebanon to recover to
2017 real income per capita levels, the average crisis
duration of those cases ranking 16–25 in Table 3. The
good case CSI would be 47.1, ranking the Lebanon
episode 6th after Australia (1893) and aligned with
Mexico (1929) in Table 3. In the bad case scenario,
we assume: (i) real GDP trough occurs in 2022 at an
additional 5 percent annual contraction in real GDP,
resulting in an overall –38.6 percent peak (2017) to
trough (2022) change in real GDP per capita; and
that (ii) it takes 19 years for Lebanon to recover to
2017 real GDP levels, the average crisis duration of
the top 10 cases in R&R. Bad case CSI would be 57.6,
ranking the Lebanon financial crisis third after Chile
(1926) and the Spanish civil war.
We also cross-compare key macroeco-
nomic indicators for Lebanon with those for R&R’s
relatively more recent episodes. Specifically, we
compare Lebanon to the following R&R episodes,
henceforth referred to as G8: Chile (1980), Argentina
(1980), Philippines (1981), Mexico (1981), Venezuela
(1994), Argentina (2001), Uruguay (2002) and Greece
(2009). A summary of crisis events is presented in
Annex C for each of these episodes. To the extent
data is available, we plot each macroeconomic indi-
cator for the G8 plus Lebanon over the years leading
to the crisis point and observe dynamics in years that
follow.37
Per Capita Output
While Lebanon’s real GDP per capita has faltered
since 2011, 2018 marks the beginning of a much
sharper decline. Only Argentina (01) and Uruguay
(02) share Lebanon’s consistent negative growth in
35 Annual real GDP growth fell from a pre-Syria war average of 4–5 percent to 1.8 percent over the 2011–2017 period.
36 Total population expanded by 27.3 percent from 2010 to 2017.
37 In these charts, the indicator is plotted from 3 years prior to crisis year (t–3), to 5 (or 6) years post-crisis (t+5 or t+6), of course going through crisis year (t). In such a way, even when crisis years differ (say 2009 for Greece and 2001 for Argentina), plotting in reference to a crisis point rather than the calendar year superimposes the same indicator for Lebanon with global crises comparators on one chart. This allows us to cross-compare how the macro indicator developed as the crisis is approached, and how it evolved afterwards.
FIGuRE 14 • Lebanon’s Real GDP is a More Accurate Reference Point for the Start of the Financial Crisis than Real GDP/capita
–25%
–20%
–15%
–10%
–5%
0%
2008
2009
2010
2011
2012
2013
2014
2015
2016
2017
2018
2019
2020
2021
15%
10%
5%
Real GDP per Capita
Perc
ent (
%)
Real GDP Growth Population GrowthReal GDP/Capita Growth
Sources: CAS and WB staff calculations.

LEBANON ECONOMIC MONITOR: LE NAUFRAGE DU LIBAN (AU NUMÉRO 3)/LEBANON SINKING (TO THE TOP 3)22
per capita real GDP in the period leading to the crisis
point (Figures 15 and 16). While the contraction in
real GDP commenced in 2018, it accelerated sharply
in 2020. However, Lebanon stands out in magnitude
of the contraction at time t and t+1. Further, the
protracted nature of the crises in the G8 countries
is reflected in the difficulty for these economies to
regain growth in their per capita GDP. Only Argentina
(01) and Uruguay (02) amongst the G8 were able to
regain consistent per capita growth by t+2.
The contraction in Lebanon’s real GDP
per capita is already worse than any of the
G8’s Peak to Trough changes. The contraction
in Lebanon’s real GDP per capita from its level in
peak year 2017 had already reached an estimated
27.9 percent by 2020, and is projected to be 35.1
percent by 2021. This is significantly larger than G8
Peak to Trough changes in per capita GDP: –24.2
percent for Venezuela (94); –24 percent for Greece
(09); –21.8 percent for Argentina (80); –20.9 percent
for Argentina (01); –18.9 percent for each of Chile
(81) and Uruguay (02); –18.8 percent for Philippines
(81); and –14.1 percent for Mexico (81) (Table 3).
Depreciation-Inflation
A potent depreciation-inflation dynamic is a key
driver of macroeconomic instability for half of
the G8 episodes, a characteristic also shared
by the Lebanon financial crisis. To the extent
data allows, we examine the trajectories of both the
exchange rate and inflation in G8 plus Lebanon.
Crisis-related currency depreciations were most
severe in Argentina (80) (Figure 17), and to a lesser
extent in Mexico (81), Venezuela (94) and Argentina
(01) (Figure 18). Exchange rate depreciation in
Lebanon has so far been comparable to the latter
three. Loss in value for local currencies was relatively
moderate in Chile (80) and the Philippines (81),
and mild in Uruguay (02). Meanwhile, Greece (09)
had successfully retained membership of the Euro
monetary area.
Inflation in Lebanon, long subdued since
the early nineties in reflection of exchange rate
stability,38 has come to resemble the worst of
G8 episodes. Exchange rate pass-through effects
on prices have implied a correlation between cur-
rency depreciations and inflation rates. Due to data
limitations, we examine inflation in a subsample of
the G8 episodes, namely, Chile (80), Philippines (81),
Mexico (81), Uruguay (02) and Greece (09). Among
this subsample, inflation was most severe in Mexico
(81), relatively moderate in Chile (80) and Philippines
(81), and mild in Uruguay (02) and Greece (09). This
FIGuRE 15 • Real GDP Per Capita for G8 Plus Lebanon
–15
–20t–3 t–2 t–1 t t+1 t+2 t+3 t+4 t+5
–5
–10
5
0
10Real GDP per Capita Growth
Perc
ent (
%)
Argentina '80 Philippines '81Chile '80Lebanon '19Mexico '81
Sources: WDI, CAS and WB staff calculations.
FIGuRE 16 • Real GDP Per Capita for G8 Plus Lebanon
–15
–20t–3 t–2 t–1 t t+1 t+2 t+3 t+4 t+5
–5
–10
5
0
10Real GDP per Capita Growth
Perc
ent (
%)
Argentina '01 Uruguay '02Venezuela '94Lebanon '19Greece '09
Sources: WDI, CAS and WB staff calculations.
38 This is the case since the last exchange rate collapse, which saw the currency depreciate by over 400 percent from January 1990 until Fall of 1992.
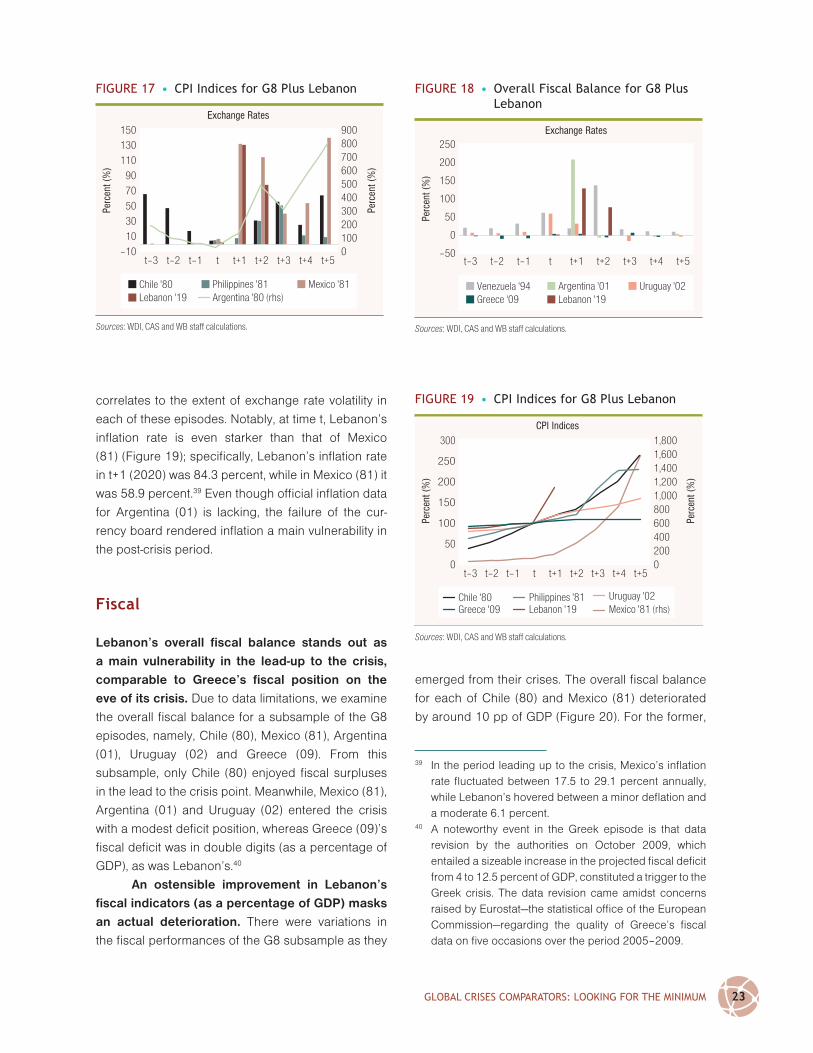
GLOBAL CRISES COMPARATORS: LOOKING FOR THE MINIMuM 23
correlates to the extent of exchange rate volatility in
each of these episodes. Notably, at time t, Lebanon’s
inflation rate is even starker than that of Mexico
(81) (Figure 19); specifically, Lebanon’s inflation rate
in t+1 (2020) was 84.3 percent, while in Mexico (81) it
was 58.9 percent.39 Even though official inflation data
for Argentina (01) is lacking, the failure of the cur-
rency board rendered inflation a main vulnerability in
the post-crisis period.
Fiscal
Lebanon’s overall fiscal balance stands out as
a main vulnerability in the lead-up to the crisis,
comparable to Greece’s fiscal position on the
eve of its crisis. Due to data limitations, we examine
the overall fiscal balance for a subsample of the G8
episodes, namely, Chile (80), Mexico (81), Argentina
(01), Uruguay (02) and Greece (09). From this
subsample, only Chile (80) enjoyed fiscal surpluses
in the lead to the crisis point. Meanwhile, Mexico (81),
Argentina (01) and Uruguay (02) entered the crisis
with a modest deficit position, whereas Greece (09)’s
fiscal deficit was in double digits (as a percentage of
GDP), as was Lebanon’s.40
An ostensible improvement in Lebanon’s
fiscal indicators (as a percentage of GDP) masks
an actual deterioration. There were variations in
the fiscal performances of the G8 subsample as they
emerged from their crises. The overall fiscal balance
for each of Chile (80) and Mexico (81) deteriorated
by around 10 pp of GDP (Figure 20). For the former,
FIGuRE 19 • CPI Indices for G8 Plus Lebanon
50
0t–3 t–2 t–1 t t+1 t+2 t+3 t+4 t+5
150
100
200
300CPI Indices
Perc
ent (
%)
Perc
ent (
%)
250
1,000
600400200
800
0
1,4001,200
1,6001,800
Uruguay '02Lebanon '19Greece '09Philippines '81Chile '80
Mexico '81 (rhs)
Sources: WDI, CAS and WB staff calculations.
FIGuRE 17 • CPI Indices for G8 Plus Lebanon
50
10
30
–10t–3 t–2 t–1 t t+1 t+2 t+3 t+4 t+5
90
70
110
150Exchange Rates
Perc
ent (
%)
Perc
ent (
%)
130
400
200100
300
0
600500
700800900
Philippines '81 Mexico '81Chile '80Lebanon '19 Argentina '80 (rhs)
Sources: WDI, CAS and WB staff calculations.
FIGuRE 18 • Overall Fiscal Balance for G8 Plus Lebanon
100
0
50
–50t–3 t–2 t–1 t t+1 t+2 t+3 t+4 t+5
150
250Exchange Rates
Perc
ent (
%)
200
Argentina '01 Uruguay '02Venezuela '94Greece '09 Lebanon '19
Sources: WDI, CAS and WB staff calculations.
39 In the period leading up to the crisis, Mexico’s inflation rate fluctuated between 17.5 to 29.1 percent annually, while Lebanon’s hovered between a minor deflation and a moderate 6.1 percent.
40 A noteworthy event in the Greek episode is that data revision by the authorities on October 2009, which entailed a sizeable increase in the projected fiscal deficit from 4 to 12.5 percent of GDP, constituted a trigger to the Greek crisis. The data revision came amidst concerns raised by Eurostat—the statistical office of the European Commission—regarding the quality of Greece’s fiscal data on five occasions over the period 2005–2009.
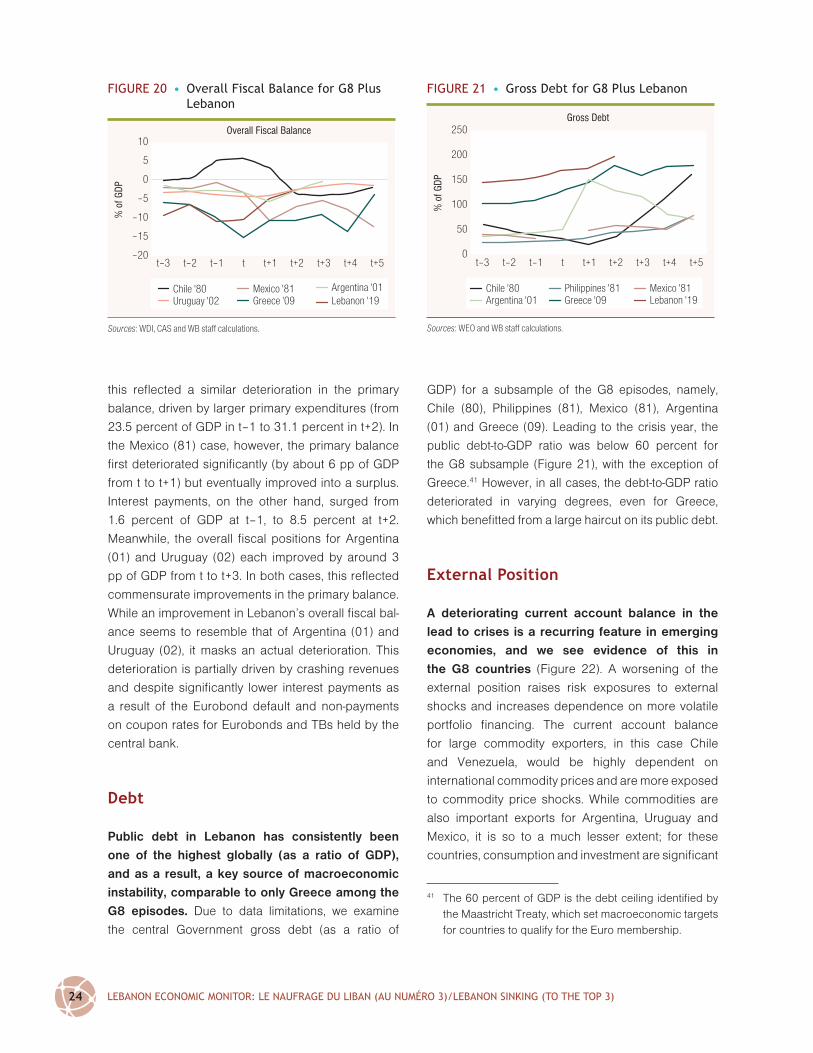
LEBANON ECONOMIC MONITOR: LE NAUFRAGE DU LIBAN (AU NUMÉRO 3)/LEBANON SINKING (TO THE TOP 3)24
this reflected a similar deterioration in the primary
balance, driven by larger primary expenditures (from
23.5 percent of GDP in t–1 to 31.1 percent in t+2). In
the Mexico (81) case, however, the primary balance
first deteriorated significantly (by about 6 pp of GDP
from t to t+1) but eventually improved into a surplus.
Interest payments, on the other hand, surged from
1.6 percent of GDP at t–1, to 8.5 percent at t+2.
Meanwhile, the overall fiscal positions for Argentina
(01) and Uruguay (02) each improved by around 3
pp of GDP from t to t+3. In both cases, this reflected
commensurate improvements in the primary balance.
While an improvement in Lebanon’s overall fiscal bal-
ance seems to resemble that of Argentina (01) and
Uruguay (02), it masks an actual deterioration. This
deterioration is partially driven by crashing revenues
and despite significantly lower interest payments as
a result of the Eurobond default and non-payments
on coupon rates for Eurobonds and TBs held by the
central bank.
Debt
Public debt in Lebanon has consistently been
one of the highest globally (as a ratio of GDP),
and as a result, a key source of macroeconomic
instability, comparable to only Greece among the
G8 episodes. Due to data limitations, we examine
the central Government gross debt (as a ratio of
GDP) for a subsample of the G8 episodes, namely,
Chile (80), Philippines (81), Mexico (81), Argentina
(01) and Greece (09). Leading to the crisis year, the
public debt-to-GDP ratio was below 60 percent for
the G8 subsample (Figure 21), with the exception of
Greece.41 However, in all cases, the debt-to-GDP ratio
deteriorated in varying degrees, even for Greece,
which benefitted from a large haircut on its public debt.
External Position
A deteriorating current account balance in the
lead to crises is a recurring feature in emerging
economies, and we see evidence of this in
the G8 countries (Figure 22). A worsening of the
external position raises risk exposures to external
shocks and increases dependence on more volatile
portfolio financing. The current account balance
for large commodity exporters, in this case Chile
and Venezuela, would be highly dependent on
international commodity prices and are more exposed
to commodity price shocks. While commodities are
also important exports for Argentina, Uruguay and
Mexico, it is so to a much lesser extent; for these
countries, consumption and investment are significant
FIGuRE 21 • Gross Debt for G8 Plus Lebanon
50
0t–3 t–2 t–1 t t+1 t+2 t+3 t+4 t+5
150
100
200
250Gross Debt
% o
f GDP
Lebanon '19Greece '09Philippines '81Chile '80 Mexico '81
Argentina '01
Sources: WEO and WB staff calculations.
41 The 60 percent of GDP is the debt ceiling identified by the Maastricht Treaty, which set macroeconomic targets for countries to qualify for the Euro membership.
FIGuRE 20 • Overall Fiscal Balance for G8 Plus Lebanon
–15
–20t–3 t–2 t–1 t t+1 t+2 t+3 t+4 t+5
–5
–10
0
10Overall Fiscal Balance
% o
f GDP
5
Argentina '01Greece '09Uruguay '02Mexico '81Chile '80
Lebanon '19
Sources: WDI, CAS and WB staff calculations.
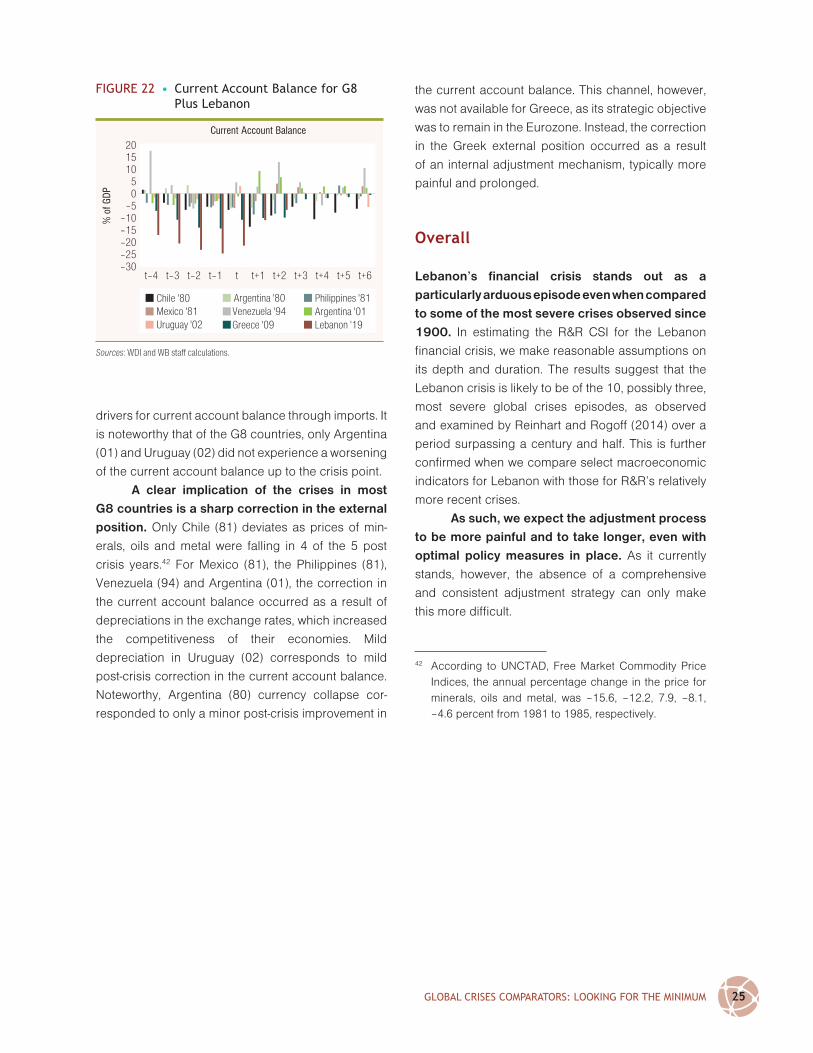
GLOBAL CRISES COMPARATORS: LOOKING FOR THE MINIMuM 25
drivers for current account balance through imports. It
is noteworthy that of the G8 countries, only Argentina
(01) and Uruguay (02) did not experience a worsening
of the current account balance up to the crisis point.
A clear implication of the crises in most
G8 countries is a sharp correction in the external
position. Only Chile (81) deviates as prices of min-
erals, oils and metal were falling in 4 of the 5 post
crisis years.42 For Mexico (81), the Philippines (81),
Venezuela (94) and Argentina (01), the correction in
the current account balance occurred as a result of
depreciations in the exchange rates, which increased
the competitiveness of their economies. Mild
depreciation in Uruguay (02) corresponds to mild
post-crisis correction in the current account balance.
Noteworthy, Argentina (80) currency collapse cor-
responded to only a minor post-crisis improvement in
the current account balance. This channel, however,
was not available for Greece, as its strategic objective
was to remain in the Eurozone. Instead, the correction
in the Greek external position occurred as a result
of an internal adjustment mechanism, typically more
painful and prolonged.
Overall
Lebanon’s financial crisis stands out as a
particularly arduous episode even when compared
to some of the most severe crises observed since
1900. In estimating the R&R CSI for the Lebanon
financial crisis, we make reasonable assumptions on
its depth and duration. The results suggest that the
Lebanon crisis is likely to be of the 10, possibly three,
most severe global crises episodes, as observed
and examined by Reinhart and Rogoff (2014) over a
period surpassing a century and half. This is further
confirmed when we compare select macroeconomic
indicators for Lebanon with those for R&R’s relatively
more recent crises.
As such, we expect the adjustment process
to be more painful and to take longer, even with
optimal policy measures in place. As it currently
stands, however, the absence of a comprehensive
and consistent adjustment strategy can only make
this more difficult.
FIGuRE 22 • Current Account Balance for G8 Plus Lebanon
–10
–25
–15–20
–30t–4 t–3 t–2 t–1 t t+1 t+2 t+3 t+4 t+6t+5
0–5
105
20Current Account Balance
% o
f GDP
15
Argentina '80 Philippines '81Chile '80Mexico '81 Venezuela '94 Argentina '01Uruguay '02 Greece '09 Lebanon '19
Sources: WDI and WB staff calculations.
42 According to UNCTAD, Free Market Commodity Price Indices, the annual percentage change in the price for minerals, oils and metal, was –15.6, –12.2, 7.9, –8.1, –4.6 percent from 1981 to 1985, respectively.


27
OUTLOOK AND RISKS
S ubject to extraordinarily high uncertainty,
we project real GDP to contract by a
further 9.5 percent in 2021. Our projections
(Table 4) assume that COVID-19 conditions carry
through 2021, while macro policy responses remain
inadequate. We also assume a minimum level of
stability on the political and security scenes, but
refrain from assuming runaway inflation-depreciation,
which is a realistic scenario. For more empirical
discussion on our projection, please refer to Annex A.
As mentioned earlier, monetary and
financial turmoil are driving crisis conditions,
more acutely through interactions between the
exchange rate, narrow money and inflation. The
unusual centrality of this dynamic on the macro
framework is an important caveat regarding our mac-
roeconomic outlook for 2021. In an attempt to pin
down the framework and help narrow the confidence
intervals for our outlook, we undertake crisis-specific
econometric estimations; specifically, we assess
the response of inflation to changes in currency in
circulation using multivariate time series models. The
results, which are presented in Annex B, suggest that
a 1 percent shock to currency in circulation gener-
ates a response of 0.80 pp increase in the inflation
rate over a twelve-month horizon. Hence, policy
with implications on narrow money supply, such as
Lirafication and monetization of the fiscal deficit, will
continue to be critical to the inflationary environment.
Assuming that in 2021, the Lebanese pound suffers a
comparable depreciation in the US$ banknote market
as it did in 2020, we expect inflation to remain highly
elevated in 2021, possibly surpassing 2020 rates.
On the fiscal front, a continued collapse in
revenues is expected to lead a deterioration in
Lebanon’s fiscal position compared to 2020. On
revenues, we assume marginal nominal increases
compared to 2020, as the economic contraction is
expected to be less severe and high inflation boosts
collection in nominal (but not real) terms. Very high
inflation rates will drive a denominator-led shrinking
of the revenues-to-GDP ratio by a projected 4.6 pps,
to reach almost 7 percent, compared to a medium-
term average of 20.7 percent. On expenditures, and
despite proposed 2021 Budget numbers, we factor
a 30 percent increase in nominal primary spending,
due again to inflationary pressures. As a ratio of
GDP, however, primary current expenditures are also
projected to decline due to the same denominator-
led effect. Based on this, the overall and primary
balances are expected to deteriorate in 2021.43
43 That suggests that BdL will have to keep financing the deficit which will accelerate its FX reserve losses. Hence,
4
LEBANON ECONOMIC MONITOR: LE NAUFRAGE DU LIBAN (AU NUMÉRO 3)/LEBANON SINKING (TO THE TOP 3)28
Lebanon’s recession is likely to be arduous
and prolonged given the lack of policymaking lead-
ership and reforms. Lebanon’s GDP/capita has fallen
by around 40 percent over the 2018–2020 period and
is expected to decline further. Hence, Lebanon’s World
Bank income classification is likely to be downgraded
from an upper-middle income economy, which should
enjoy a GNI per capita of between U$4,046 and
US$12,535, to a lower-middle income status.44
Lebanon faces realistic threats to its already
fragile social peace. Angry demonstrations have
been erupting in cities across Lebanon, protesting the
depreciation of the local currency and the associated
very high inflation rates, as well as general economic
and political conditions. While numbers have not been
large, these demonstrations have been spread across
the country, and have cut off important roads and
highways, thereby causing significant disruptions. A
more recent phenomena has involved scuffles in super-
markets and angry protests outside over access to
subsidized products. This is even occurring in high end
supermarkets. Further, the volatile situation allows for
parasitic groups that can be of a more sinister nature
to usurp legitimate popular discontent creating grave
security implications. This is in addition to Lebanon’s
long-term sectarian fragmentation. Hence, there is
growing wariness of potential triggers to social unrest. In
this LEM, we highlight two potential economic triggers.
The FX Subsidy45
The first Special Focus of the LEM examines
Lebanon’s FX subsidy for critical and essential
imports, which offers a serious political and social
challenge. On the one hand, the current FX subsidy
is both distortionary, expensive, and regressive. Its
elimination and possible replacement with a more
effective and efficient pro-poor (targeted) program
would improve Lebanon’s balance of payments,
meaningfully extend the time-till-exhaustion of
remaining BdL reserves, and help cushion the impact
on Lebanon’s poor and middle class. On the other
hand, the subsidy prevents, in the very short-term,
the prices of these products from increasing, which
would exacerbate inflationary-depreciation pressures.
Therefore, the removal of the subsidy will have significant
social implications due to direct and indirect effects
on residents’ purchasing power. Further, Lebanon’s
political economy suggests that, much like solutions (or
lack thereof) to other burdens and deficiencies, there is
a high likelihood of suboptimality. Possible scenarios
and associated social implications include:
a. An orderly FX subsidy removal. This would involve
effectual political and security coordination,
along with its replacement with a more effective
and efficient pro-poor (targeted) program. In this
case, social implications can be mitigated.
b. Non-coordinated FX subsidy removal. This can
involve BdL unilaterally halting the subsidy, with
minimal political and security coordination. In this
case, BdL will carry the political cost, and can
involve increased demonstrations targeting BdL.
The political class can pass on the blame and
feel somewhat relieved, but to many, the obvious
responsibility of the political class will remain.
c. Disorderly FX subsidy removal due to depletion
of FX reserves at BdL. This traverses subsidy
management to constitute a balance of
payments crisis within a balance of payments
crisis—the complete depletion of FX resources in
an economy that has been trying to ration these
resources to pay for critical needs. It can trigger an
inflationary-depreciation spiral and cause import
shortages. Naturally, there are definite significant
social and possible security implications.
Large Scale Interruptions to Vital Public Services
The second Special Focus of the LEM discusses
the impact that the crises are having on four basic
the fiscal trajectory is contingent on BdL having sufficient reserves to continue to finance the government.
44 Latest available Gross National Income per capita for Lebanon is for 2019 US$7,380.
45 For a more detailed analysis on the FX subsidy, please refer to: World Bank (2020), Lebanon Subsidy Reform Note, December 2020.
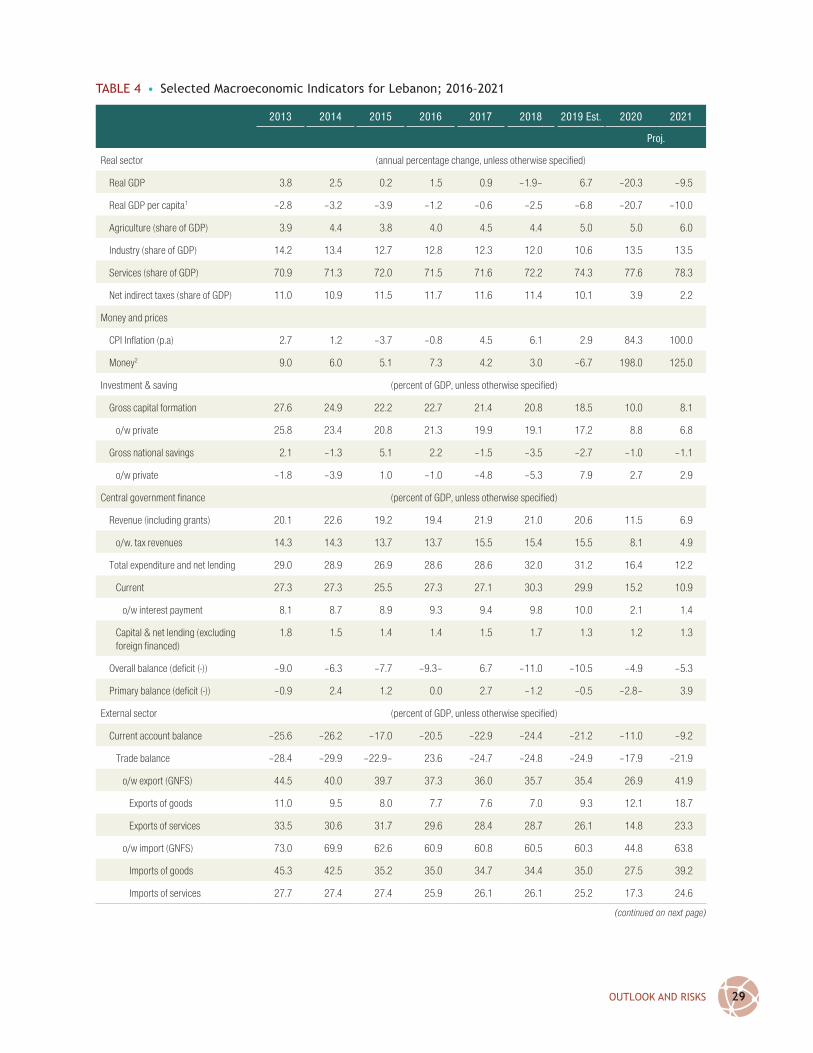
OuTLOOK AND RISKS 29
TABLE 4 • Selected Macroeconomic Indicators for Lebanon; 2016–2021
2013 2014 2015 2016 2017 2018 2019 Est. 2020 2021
Proj.
Real sector (annual percentage change, unless otherwise specified)
Real GDP 3.8 2.5 0.2 1.5 0.9 –1.9– 6.7 –20.3 –9.5
Real GDP per capita1 –2.8 –3.2 –3.9 –1.2 –0.6 –2.5 –6.8 –20.7 –10.0
Agriculture (share of GDP) 3.9 4.4 3.8 4.0 4.5 4.4 5.0 5.0 6.0
Industry (share of GDP) 14.2 13.4 12.7 12.8 12.3 12.0 10.6 13.5 13.5
Services (share of GDP) 70.9 71.3 72.0 71.5 71.6 72.2 74.3 77.6 78.3
Net indirect taxes (share of GDP) 11.0 10.9 11.5 11.7 11.6 11.4 10.1 3.9 2.2
Money and prices
CPI Inflation (p.a) 2.7 1.2 –3.7 –0.8 4.5 6.1 2.9 84.3 100.0
Money2 9.0 6.0 5.1 7.3 4.2 3.0 –6.7 198.0 125.0
Investment & saving (percent of GDP, unless otherwise specified)
Gross capital formation 27.6 24.9 22.2 22.7 21.4 20.8 18.5 10.0 8.1
o/w private 25.8 23.4 20.8 21.3 19.9 19.1 17.2 8.8 6.8
Gross national savings 2.1 –1.3 5.1 2.2 –1.5 –3.5 –2.7 –1.0 –1.1
o/w private –1.8 –3.9 1.0 –1.0 –4.8 –5.3 7.9 2.7 2.9
Central government finance (percent of GDP, unless otherwise specified)
Revenue (including grants) 20.1 22.6 19.2 19.4 21.9 21.0 20.6 11.5 6.9
o/w. tax revenues 14.3 14.3 13.7 13.7 15.5 15.4 15.5 8.1 4.9
Total expenditure and net lending 29.0 28.9 26.9 28.6 28.6 32.0 31.2 16.4 12.2
Current 27.3 27.3 25.5 27.3 27.1 30.3 29.9 15.2 10.9
o/w interest payment 8.1 8.7 8.9 9.3 9.4 9.8 10.0 2.1 1.4
Capital & net lending (excluding foreign financed)
1.8 1.5 1.4 1.4 1.5 1.7 1.3 1.2 1.3
Overall balance (deficit (-)) –9.0 –6.3 –7.7 –9.3– 6.7 –11.0 –10.5 –4.9 –5.3
Primary balance (deficit (-)) –0.9 2.4 1.2 0.0 2.7 –1.2 –0.5 –2.8– 3.9
External sector (percent of GDP, unless otherwise specified)
Current account balance –25.6 –26.2 –17.0 –20.5 –22.9 –24.4 –21.2 –11.0 –9.2
Trade balance –28.4 –29.9 –22.9– 23.6 –24.7 –24.8 –24.9 –17.9 –21.9
o/w export (GNFS) 44.5 40.0 39.7 37.3 36.0 35.7 35.4 26.9 41.9
Exports of goods 11.0 9.5 8.0 7.7 7.6 7.0 9.3 12.1 18.7
Exports of services 33.5 30.6 31.7 29.6 28.4 28.7 26.1 14.8 23.3
o/w import (GNFS) 73.0 69.9 62.6 60.9 60.8 60.5 60.3 44.8 63.8
Imports of goods 45.3 42.5 35.2 35.0 34.7 34.4 35.0 27.5 39.2
Imports of services 27.7 27.4 27.4 25.9 26.1 26.1 25.2 17.3 24.6
(continued on next page)

LEBANON ECONOMIC MONITOR: LE NAUFRAGE DU LIBAN (AU NUMÉRO 3)/LEBANON SINKING (TO THE TOP 3)30
public services: electricity, water supply, sanitation
and education. While Lebanon’s public service
delivery has long been notoriously deficient relative
to its upper middle-income status, long established
mitigation measures and private substitutables have
traditionally filled the gap, particularly for those with
economic means. The Deliberate Depression has
further undermined this set up via two effects: (i) it has
significantly increased poverty rates, expanding the
demographic that is not able to afford these private
substitutables, and are thus more dependent on
public services; and (ii) it threatens financial viability
and basic operability of the sector by raising its costs
and lowering its revenues.
TABLE 4 • Selected Macroeconomic Indicators for Lebanon; 2016–2021
2013 2014 2015 2016 2017 2018 2019 Est. 2020 2021
Proj.
Net private current transfers: 3.4 4.9 6.8 4.8 2.3 2.5 5.6 9.6 16.7
Net remittances 5.0 5.8 7.2 6.6 5.2 4.2 6.1 9.7 16.5
Net income receipts –0.6 –1.2 –0.9 –1.7 –0.5 –2.1 –1.9 –2.7 –4.1
Capital accounts 0 0 0 0 0 0 0 0 0
Gross reserves (months of imports GNFS)c,d
11.7 13.1 13.8 15.2 15.6 14.3 14.3 19.8 10.6
Total public debt
Total debt stock (in million US$) 63,490 66,564 70,325 74,900 79,530 85,139 88,900 58,082 43,958
Debt-to-GDP ratio (percent) 135.3 138.3 140.8 146.3 149.7 154.9 171.0 174.0 197.2
Memorandum items:
GDP (in million US$) 46,909 48,134 49,939 51,205 53,141 54,961 51,992 33,383 22,297
Source: Government data, and World Bank staff estimates and projections.a Population figures, which include Syrian refugees registered with the UNHCR, are taken from the United Nations Population Division.b Prior to 2020 this is M3, including non-resident deposits; 2020 and after, this is M0 (currency in circulation).c Gross Reserves (months of imports GNFS) = (Imports of Goods & Services / Gross Res. excl. Gold)*12.d Total Imports using the BOP data from the Quarterly Bulletin of BDL.
(continued)
31
SPECIAL FOCUS I: FX SUBSIDY REFORM IN THE DELIBERATE DEPRESSION
T he real question regarding BdL’s FX subsidy
for imports of critical and essential goods, is
when and how to remove it, not whether. This
note shows that the sooner the subsidy is replaced
with a cheaper and more effective compensation
scheme, the better for the economy and for people’s
welfare. This is because the current FX subsidy is
both distortionary, expensive (costing an estimated
US$287m/month), and regressive (i.e., benefits
predominantly wealthier consumers). Its elimination
and possible replacement with a more effective and
efficient pro-poor (targeted) program would improve
Lebanon’s balance of payments, meaningfully extend
the time-till-exhaustion of remaining BdL reserves,
and help cushion the impact on Lebanon’s poor and
middle class. This note suggests a broad-based cash
transfer program as one such option, which should
be in place prior to subsidy removal. However, while
the removal of the FX subsidy would be welcome, it
is a mere short-term patch as only a comprehensive
reform package that is consistent with a credible
macroeconomic framework can prevent the country
from running out of reserves and being forced into
a disorderly and highly disruptive exchange rate
adjustment.
Background
Policymakers in Lebanon are considering a shift
away from the FX subsidy for imports of critical
and essential goods, towards direct transfers to
households. The decision to remove the FX subsidy
for imports of critical goods and essential food and
other items (henceforth referred to as essential
items) should be based on the most efficient and
cost-effective use of pro-poor public spending. The
subsidy concerns import of critical goods—energy,
medicine, wheat—and essential items (as identified
by the MoET. The estimated cost of the subsidy
amounts to a monthly average of US$287 million
(Table 5).46 Maintaining the current subsidy scheme
accelerates the steady depletion of FX reserves at
BdL and reduces the time available to undertake
reforms to avoid a forced and disorderly adjustment
of the exchange rate. On the other hand, the subsidy
prevents, in the very short-term, the prices of these
46 This is distinguishable from the total value of the subsidy, which amounts to an estimated US$437 million per month.
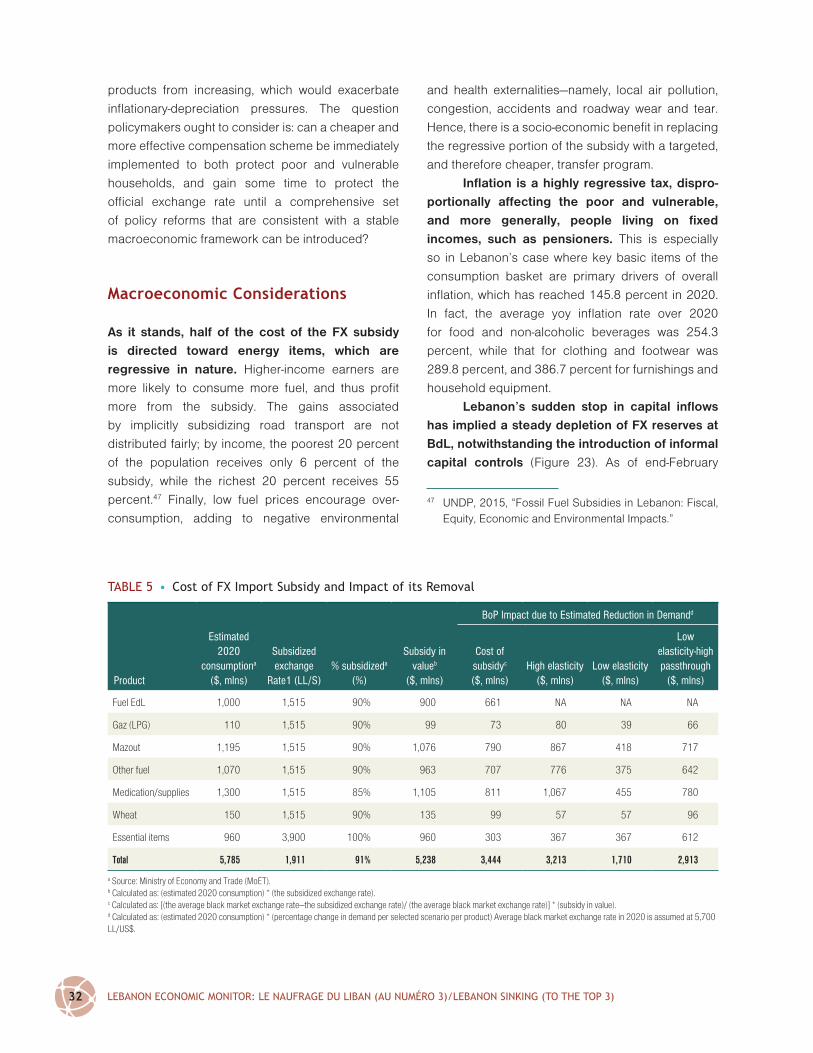
LEBANON ECONOMIC MONITOR: LE NAUFRAGE DU LIBAN (AU NUMÉRO 3)/LEBANON SINKING (TO THE TOP 3)32
products from increasing, which would exacerbate
inflationary-depreciation pressures. The question
policymakers ought to consider is: can a cheaper and
more effective compensation scheme be immediately
implemented to both protect poor and vulnerable
households, and gain some time to protect the
official exchange rate until a comprehensive set
of policy reforms that are consistent with a stable
macroeconomic framework can be introduced?
Macroeconomic Considerations
As it stands, half of the cost of the FX subsidy
is directed toward energy items, which are
regressive in nature. Higher-income earners are
more likely to consume more fuel, and thus profit
more from the subsidy. The gains associated
by implicitly subsidizing road transport are not
distributed fairly; by income, the poorest 20 percent
of the population receives only 6 percent of the
subsidy, while the richest 20 percent receives 55
percent.47 Finally, low fuel prices encourage over-
consumption, adding to negative environmental
and health externalities—namely, local air pollution,
congestion, accidents and roadway wear and tear.
Hence, there is a socio-economic benefit in replacing
the regressive portion of the subsidy with a targeted,
and therefore cheaper, transfer program.
Inflation is a highly regressive tax, dispro-
portionally affecting the poor and vulnerable,
and more generally, people living on fixed
incomes, such as pensioners. This is especially
so in Lebanon’s case where key basic items of the
consumption basket are primary drivers of overall
inflation, which has reached 145.8 percent in 2020.
In fact, the average yoy inflation rate over 2020
for food and non-alcoholic beverages was 254.3
percent, while that for clothing and footwear was
289.8 percent, and 386.7 percent for furnishings and
household equipment.
Lebanon’s sudden stop in capital inflows
has implied a steady depletion of FX reserves at
BdL, notwithstanding the introduction of informal
capital controls (Figure 23). As of end-February
TABLE 5 • Cost of FX Import Subsidy and Impact of its Removal
BoP Impact due to Estimated Reduction in Demandd
Product
Estimated 2020
consumptiona ($, mlns)
Subsidized exchange
Rate1 (LL/S)% subsidizeda
(%)
Subsidy in valueb
($, mlns)
Cost of subsidyc ($, mlns)
High elasticity ($, mlns)
Low elasticity ($, mlns)
Low elasticity-high passthrough
($, mlns)
Fuel EdL 1,000 1,515 90% 900 661 NA NA NA
Gaz (LPG) 110 1,515 90% 99 73 80 39 66
Mazout 1,195 1,515 90% 1,076 790 867 418 717
Other fuel 1,070 1,515 90% 963 707 776 375 642
Medication/supplies 1,300 1,515 85% 1,105 811 1,067 455 780
Wheat 150 1,515 90% 135 99 57 57 96
Essential items 960 3,900 100% 960 303 367 367 612
Total 5,785 1,911 91% 5,238 3,444 3,213 1,710 2,913
a Source: Ministry of Economy and Trade (MoET).b Calculated as: (estimated 2020 consumption) * (the subsidized exchange rate).c Calculated as: [(the average black market exchange rate—the subsidized exchange rate)/ (the average black market exchange rate)] * (subsidy in value).d Calculated as: (estimated 2020 consumption) * (percentage change in demand per selected scenario per product) Average black market exchange rate in 2020 is assumed at 5,700 LL/US$.
47 UNDP, 2015, “Fossil Fuel Subsidies in Lebanon: Fiscal, Equity, Economic and Environmental Impacts.”

SPECIAL FOCuS I: FX SuBSIDy REFORM IN THE DELIBERATE DEPRESSION 33
2021, BdL’s gross foreign asset position reached
US$22.9 billion, declining by US$14.4 billion since
end-2019, and by US$1.2 billion from end-2020. The
gross position, however, differs widely from its net
reserves (i.e., FX reserves at the central bank net of FX
liabilities to others).48 BdL’s gross position includes
US$5 billion in Lebanese Eurobonds, an unpublished
amount lent out to banks since October 2019, and
required reserves on banks’ customer FX deposits
(estimated at US$16.7 billion).
BdL officials have warned that falling FX
reserves will force the central bank to halt its sup-
port for imports of critical goods and essential
items at lower exchange rates. The officials indi-
cated that in the next few months BdL’s FX reserves
will drop to the level of the Required Reserves on
banks’ customer FX deposits. Should BdL abandon
its support for imports of critical goods and essential
items (i.e., including energy products, medicine and
food essentials), importers will be forced to fully revert
to the US$ banknote market rate49 for the needed
hard currency. New imports would thus be priced at
the going US$ banknote market rate, exacerbating
inflationary pressures and potentially stoking an
inflationary-depreciation spiral. In fact, in anticipation
of higher prices, importers, retailers and customers
are already hoarding critical and essential goods,
bringing forward price and volume implications.
Demand effects resulting from the removal
of subsidies are a key factor for an impact on
the balance of payments (BoP). In principal, the
absence of demand effects, dragged by the fall in
income and increase in prices, would leave the BoP
unchanged by the removal of subsidy. To estimate
the impact on demand, we use country specific,
product-based, income and prices elasticities of
demand as presented in Seale et al (2003).50 Notably,
the study finds that energy products and medical care
are generally elastic for most countries, including in
Lebanon; that is, if consumers’ incomes decline by
half, or if product prices increase by 50 percent, then
demand for these products declines by half or more.
Meanwhile, demand for food items are relatively
inelastic; that is, if consumers’ incomes decline by
half, or if product prices increase by 50 percent,
then demand for these products declines by less
48 BdL, contrary to other central banks, does not publish net reserves.
49 This refers to the street market access to dollar banknotes, which has depreciated the Lira by up to 90 percent.
50 James Seale, Anita Regmi, and Jason Bernstein (2003), International Evidence on Food Consumption Patterns, United States Department of Agriculture, Electronic Report from the Economic Research Service.
FIGuRE 23 • A Steady Depletion in the Gross Foreign Exchange Position at BdL
Gross reserves at BdL
0
50,00045,00040,00035,00030,00025,00020,00015,00010,000
5,000
Compulsory FX reserveForeign securities Gross FX reservesForeign currencies
US$
mln
Jul-1
5
Apr
-15
Jan-
15
Oct
-5
Jul-1
4
Apr
-14
Jan-
14
Oct
-14
Jul-1
3
Apr
-13
Jan-
13
Oct
-3
Jul-1
6
Apr
-16
Jan-
16
Oct
-16
Jul-1
7
Apr
-17
Jan-
17
Oct
-17
Jul-1
8
Apr
-18
Jan-
18
Oct
-18
Jul-1
9
Apr
-19
Jan-
19
Oct
-19
Jul-2
0
Apr
-20
Jan-
20
Jan-
21
Oct
-20
Sources: WB staff calculations based on WDI data.

LEBANON ECONOMIC MONITOR: LE NAUFRAGE DU LIBAN (AU NUMÉRO 3)/LEBANON SINKING (TO THE TOP 3)34
than half.51 We shall preclude from our simulations
EdL due to the company’s obvious deficiencies, spe-
cifically the severe and chronic shortages in power
supply and tariff regulations that distort the impact
on demand. Further, there is uncertainty regarding
the elasticities for these consumption goods in the
Lebanese economy. Specifically, other literature
suggest that energy products and medical care are
inelastic goods.52 For robustness, we also re-run
simulations based on relative in-elasticities of energy
products and medical care.53 We shall henceforth
refer to simulations based on Seale et al (2003) as
High Elasticity Scenario, and those that assume the
inelasticity of energy products and medical care as the
Low Elasticity Scenario. We proceed by (i) assuming
that income contracts by 20 percent across all sce-
narios; and (ii) simulating two scenarios for product
price increases: a 50 percent increase in prices of
energy products, medicine and food items, and a 100
percent increase (dubbed the High Passthrough).
Hence, we present three scenarios:
1. High Elasticity Scenario: a high elasticity scenario
that assumes a 20 percent contraction in income
and a 50 percent increase in prices of energy
products, medicine and food items;
2. Low Elasticity Scenario: a low elasticity scenario
that assumes a 20 percent contraction in income
and a 50 percent increase in prices of energy
products, medicine and food items;
3. Low Elasticity-High Passthrough Scenario: a low
elasticity scenario that assumes a 20 percent
contraction in income and a 100 percent increase
in prices of energy products, medicine and food
items.54
Removal of subsidies on imports of critical
goods and essential items can lead to some BoP
relief. The sharp declines in consumption of the
subsidized products translate into BoP relief; all three
scenarios suggest improvements to the BoP, ranging
from US$1.7 to US$3.2 billion depending on the
scenario (Table 5).
Based on the above, the removal of subsidy
can meaningfully extend the time-till-exhaustion
of remaining BdL reserves, thus delaying a forced
and disorderly exchange rate adjustment. The
sudden stop in capital inflows has induced a more
direct trade-off between the stock of FX reserves at
BdL and the import bill. As a result, the BoP relief
shown will reflect on the foreign exchange reserves
at BdL. We stress that the improvement in the BoP
position and the extension of reserves are temporary
and come at the expense of worsening economic
activity and declining standard of living.
As a result of subsidy removal, inflationary
pressures would materialize via direct and itera-
tive effects. Through the direct effect, the inflation
rate would increase as prices for critical goods and
essential items reflect the higher US$ banknote
exchange rate.55,56 Additionally, an iterative effect
arises from an increased demand for dollars in the
dollar-note market, which further depreciates the
currency, fueling inflation. With surging inflation,
demand for narrow money increases. Meeting this
51 According to Seale et al. (2003), income elasticities of demand for Lebanon are 0.632 for food, beverage and tobacco, 1.2 for gross rent, fuel and power, and 1.357 for medical care. The authors also present price elasticities of demand for Lebanon, which are –0.511 for food, beverage and tobacco, –0.971 for gross rent, fuel and power, and –1.098 for medical care.
52 Accurate elasticities can be derived from more recent and comprehensive Lebanese household surveys which are not available.
53 Toward that end, we assume income (price) elasticities of demand for Lebanon to be 0.5 (–0.5) for gross rent, fuel and power and 0.5 (–0.5) for medical care.
54 Here we omit a High Elasticity-High Passthrough scenario that assumes a 20 percent contraction in income and a 100 percent increase in prices of energy products, medicine and food items. The reason is that when price elasticity of demand is at or lower than –1, a 100 percent increase in prices would wipe out demand, which is not a realistic outcome.
55 We note that energy products are final and intermediate goods, and changes to their prices impose economy-wide effects.
56 While this will naturally reflect on volumes imported—since consumers will cut down on purchases, and there will be some substitutional effects for food products that can be manufactured locally (a process likely ongoing)—being critical goods, they will still be demanded in substantial volumes.

SPECIAL FOCuS I: FX SuBSIDy REFORM IN THE DELIBERATE DEPRESSION 35
demand with a corresponding increase in money
supply—BdL’s current response—would lead to exac-
erbated pressures on the exchange rate. Moreover,
under panic conditions, inflation and exchange rates
are key observables that drive sentiment, and their
deterioration re-enforces the inflationary-deprecia-
tion cycle.57
Removing the subsidy is estimated to
increase inflation through the direct effect by 24
percentage points (Figure 24).58 This inflationary
impact is frontloaded, hitting hardest the first months
and diminishing over the course of the year. We
caveat that this does not account for the impact on
inflationary expectations and other related iterative
effects, which are likely to be forceful dynamics. The
inflation results are generated from an estimated
AER59 and an exchange rate pass-through effect on
prices of about 50 percent60 applied to the following
two scenarios: (1) a hypothetical continuation of the
FX subsidy through 2021, which we will refer to as the
Status Quo Scenario;61 and (2) a full termination of
the FX subsidy on January 2021, dubbed the Sudden
Stop Scenario.62
The Government of Lebanon (GOL) needs
to prioritize a comprehensive, consistent and
credible macroeconomic stabilization plan, the
fiscal part of which should include a social safety
net (SSN) component. Given Lebanon’s rapidly
and continuously deteriorating macroeconomic
57 There are also stock implications, whereby high inflation imposes a wealth effect via transfers from creditors to debtors; ceteris paribus borrowers would owe less—and hence, creditors would receive less—in real terms than what was determined at the time the contract was signed. Consequently, public debt denominated in local currency would be worth less in real terms, providing a fiscal benefit.
58 We note that this estimation does not take into consideration the iterative effects, which can potentially drive an inflation-depreciation spiral.
59 The AER is calculated using consumption-based weights applied on multiple exchange rates, specifically, the official exchange rate, the platform rate at BdL and the US$ banknote rate. For further details on the AER, please refer to: The Lebanon Economic Monitor, Fall 2020, The Deliberate Depression.
60 The exchange rate pass-through rate on inflation is calculated by first dividing the inflation rate by the AER depreciation rate for the same month and multiplying by 100. This generates a series of pass-through rates for the time period August 2019 to September 2020, which we averaged out. The estimated exchange rate pass-through rate will likely change as more actual data are populated.
61 This scenario is used for illustrative purposes and is not a likely option. Sharply falling FX reserves at the central bank precludes the option of continued support for the full list of critical goods and essential items.
62 The Sudden Stop Scenario assumes (i) the subsidy is eliminated on January 2021; and (ii) the US$ banknote exchange rate deteriorates to LL 10,000 per US$ by January 2021, stabilizing thereafter.
FIGuRE 24 • upon Removal of FX Subsidy, Direct Effects on Inflation are SubstantialCP
I ind
ex
40
60
908070
50
120110100
140
Aug-
19
Sep-
19
Oct-1
9
Nov-1
9
Dec-
19
Jan-
20
Feb-
20
Mar
-20
Apr-2
0
May
-20
Jun-
20
Jul-2
0
Aug-
20
Sep-
20
Oct-2
0
Nov-2
0
Dec-
20
Jan-
21
Feb-
21
Mar
-21
Apr-2
1
May
-21
Jun-
21
Jul-2
1
Aug-
21
Sep-
21
Oct-2
1
Nov-2
1
Dec-
21
130
CPI, sudden stop scenario (Dec 2020 = 100)CPI, status quo scenario (Dec 2020 = 100)
Sources: WB staff calculations based on WDI data.
LEBANON ECONOMIC MONITOR: LE NAUFRAGE DU LIBAN (AU NUMÉRO 3)/LEBANON SINKING (TO THE TOP 3)36
conditions, a social safety net by itself will be
insufficient, and indeed, as shown above, can
trigger additional macroeconomic risks. Lebanon
needs to incorporate a SSN into a macroeconomic
stabilization strategy that prioritizes the arrest of
hyperinflation, currency depreciation and prolifera-
tion of multiple exchange rates. This strategy would
be based on: (i) a debt restructuring that would
achieve short-term fiscal space and medium-term
debt sustainability; (ii) comprehensively restructuring
the financial sector in order to regain solvency of the
banking sector; (iii) creating a new monetary policy
framework that would regain confidence and stability
in the exchange rate; (iv) a phased fiscal adjustment
aimed at regaining confidence in fiscal policy;
(v) growth enhancing reforms; and (vi) enhanced
social protection.
Design of a Broad-Coverage Subsidy Reform Compensation Scheme63
Governments often use generalized subsidies as a
tool to lower the cost of living for poor households
and to shield households from price fluctuations—
Lebanon is not alone in this approach. However,
subsidies are a blunt and inefficient instrument, and
some are regressive, benefiting the rich more than the
poor. International experience shows that a shift from
generalized subsidies to direct support to the poor
could result in an improvement in public welfare.64
The subsidy reform being considered by
the GOL aims to replace implicit FX subsidies
for fuel, medicines, wheat and essential items
with direct cash transfers to Lebanese resident
households.65 The direct cash transfers should offer
some compensation to households to purchase items
at market prices (which will increase following the
withdrawal of subsidies as discussed previously) and
should not be restricted in their use (allowing greater
autonomy and a dignified freedom of choice on the
best use of assistance while offering compensation
for the anticipated increase in prices).
As the withdrawal of FX subsidies will
result in a considerable price shock66 that will
be felt by large sections of the population, the
compensation program proposed is of a ‘broad
coverage’ nature.67 In year 1, the broad-coverage
subsidy reform compensation scheme (Broad
Coverage-Cash Transfer [BC-CT]) could aim to
cover approximately 80 percent of the Lebanese
population. To ensure progressive coverage, the
BC-CT will seek to exclude the top 20 percent of
the population as they are better able to absorb the
price increases and can afford to pay for the cur-
rently subsidized items at market price. The broad
coverage approach would involve identifying and
excluding the top 20 percent of the population (in
terms of income/economic wellbeing) and covering
the remaining 80 percent of the population. Unlike
traditional poverty-targeted programs that seek to
identify the poor (bottom 10–40 percent, depending
on the country), in this case, the identification of the
richest 20 percent would be based on affluence
tests (i.e., markers of affluence to identify the ineli-
gible) such as asset filters, dwelling ownership and
characteristics, and formal incomes. Preliminary
analysis undertaken by the World Bank points to
the potential use of indicators such as number of
rooms/bathrooms per household member, dwelling
area per household member, and thresholds for
wages and other formal income for such an afflu-
ence test. Implementing such an approach would
require careful integration of data across multiple
databases to ensure reliability and automation of
eligibility decisions. In subsequent years, as the
63 The proposal in this section reflects the recommendations of the World Bank and not necessarily what GOL will adopt.
64 Ruslan Yemtsov and Amr Moubarak “Assessing the readiness of Social Safety Nets to Mitigate the Impact of Reform”; World Bank Good Practice Note 5.
65 This section refers to the GoL subsidy reform proposal as presented by the Minister of Economy and Trade in April 2021 and published on the MoET website. As of the publication of this note, the GOL has not reached a decision on what kind of scheme will replace the generalized subsidies scheme.
66 Especially as higher fuel prices will lead to increases in prices of several other goods and services.
67 Covering the majority of Lebanese households though not attempting universal coverage.

SPECIAL FOCuS I: FX SuBSIDy REFORM IN THE DELIBERATE DEPRESSION 37
population adjusts to the new (market) prices for
the currently subsidized items and as economic
recovery begins, the coverage of this compensa-
tion program may be progressively reduced, along
with the level of benefits (per adult and per child) to
ensure a smooth phasing out of the compensation
program that dovetails with more sustainable and
assured financing for a targeted safety net program
that covers around 30 percent of the population
over time.
We specifically (and demonstratively)
analyze one proposal of a benefits scheme under
which Lebanese adults (age 23 and above) receive
US$50 per month in year 1 of the compensation
program, US$40 in years 2 and 3, and US$30 in
years 4 and 5. Children get half this amount. The cov-
erage progressively declines from 85 percent of the
Lebanese population in the first six months, to 75 per-
cent in the next six. Over the next 4 years, coverage
declines to 70 percent, 60 percent, 45 percent and
30 percent of the population, respectively (Figure 25.)
The scheme described represents compen-
sation equivalent to 41 percent of the average
Lebanese household’s monthly consumption
expenditure in Year 1, 28 percent in years 2 and
3, and 21 percent in years 4 and 5, reflecting a
substantial level of support to recipient households
(compared to most unconditional cash transfer pro-
grams in upper-middle income countries that provide
22 percent of beneficiary welfare).68
One option we model is a phased
approach to subsidy removal: Phase 1 is removal
of FX subsidy for the MOET essential items and
fuel (except for EdL) to take place in January 2021.
Phase 2 is removal of fuel subsidy for EdL along
with a reform of EdL’s pricing reform to take place
on Jan 2022. Phase 3 is removal of medication
subject to broad medical coverage for Lebanese
citizens to take place in January 2023.
Figure 26 shows the required outlay of
the program and the resulting savings against
Phase 1 of the removal of subsidies. The bud-
getary outlays start at US$1.5 billion in year 1 (80
percent coverage) and decline to US$311 million
in year 5 (30 percent coverage); equivalent to an
average annual expenditure of around US$779
million. The removal of phase I subsidies and the
introduction of the cash transfer compensation as
described will result in a net savings of an average
annual value of around US$2.6 billion over the
5-year period.69
BC-CT financing options and associated
risks necessitate a credible medium-term mac-
roeconomic framework. In principle, financing
options for the BC-CT include: (i) money printing by
FIGuRE 25 • Proposed Monthly Benefit Amount (uS$), and Coverage (%), by year
0%
90%
80%
70%
60%
50%
40%
30%
20%
10%
40
20
0
30
10
50
60
Year 1 Year 2 Year 3 Year 4 Year 5
% Population CoveredAmount ChildAmount Adult
Bene
fit A
mou
nt
Cove
rage
50
2520
40
80%
70%
60%
45%
30%
40
30 30
1515
20
FIGuRE 26 • Compensation Program Outlay and Net Savings from Phase I Subsidy Withdrawal, uS$ mn
0
3,500
3,000
2,500
2,000
1,500
1,000
500
Year 1 Year 2 Year 3 Year 4 Year 5 Average 5 Years
Savings ($ mn)Cash Transfer Program Outlay ($ mn)
620 465 311
779
2,5922,407
964
2,7512,906 3,060
Adult $50Child $25
Adult $40Child $20
Adult $30Child $15
1,8351,536
68 World Bank (2018) The State of Social Safety Nets 2018. Washington DC: The World Bank.
69 These savings do not account for administrative costs of implementing the compensation program.

LEBANON ECONOMIC MONITOR: LE NAUFRAGE DU LIBAN (AU NUMÉRO 3)/LEBANON SINKING (TO THE TOP 3)38
the central bank (i.e., monetization); (ii) budgetary
allocations; and (iii) international assistance.70 In light
of BC-CT’s large financing needs, monetization risks
significantly exacerbate current macroeconomic
conditions, further entrenching macroeconomic
instability. This option will lead to further deteriora-
tion in monetary conditions, potentially stoking the
afore described inflationary-depreciation effects.
Alternatively, fiscal financing via additional (unfunded)
budgetary allocations would not be qualitatively dif-
ferent from the monetization option; currently, the
fiscal deficit is de facto monetized. The previous
two options are also likely to preclude effective
international assistance (option iii), which can only be
as part of a credible medium-term macroeconomic
framework. As mentioned above, this framework
should include: (a) a debt restructuring program
that would achieve short-term fiscal space and
medium-term debt sustainability; (b) comprehensivly
restructuring the financial sector in order to regain
solvency of the banking sector; (c) creating a new
monetary policy framework that would regain confi-
dence and stability in the exchange rate; (d) a phased
fiscal adjustment aimed at regaining confidence in
fiscal policy; (e) growth enhancing reforms; and (f)
enhanced social protection (i.e., the BC-CT program).
Implementing a Broad-Coverage Subsidy Reform Compensation Scheme
Delivering a broad-coverage cash transfer (BC-
CT) scheme requires careful design, transparent
implementation, and adequate financing. It
involves the following broad steps: (i) consultations
and communications; (ii) identification and beneficiary
selection; (iii) payment of benefits; and (iv) monitoring
and grievance redress mechanism (GRM).
Consultations & communication
A well-prepared communication and out-reach
campaign must precede and accompany the
subsidy reform program. International experience
demonstrates that well-planned and consistent
communication is critical for successful subsidy
reforms. In Jordan, for example, a widely cast and
well-designed communication strategy played a
crucial role in addressing uncertainties and managing
expectations during the 2008 and 2011/12 subsidy
reforms. Making an effective use of available
channels to project transparency, clarity on the role
of the program, public information on objectives,
operational rules, and results are necessary to tackle
information asymmetries and concerns of different
stakeholders. Bringing in different stakeholders in
the design of the program would enrich the scheme
and its acceptability. Reforms can succeed only
if an informed public accepts and supports the
reform’s rationale. Clearly communicating who will be
impacted, and how, is vital to generate public buy-in.
Identification and Beneficiary Selection
The BC-CT scheme would aim to cover the
Lebanese population residing in Lebanon only
(which refers to individuals who spend at least
183 days in the country). The program is proposed
to involve a simple mobile-based registration (self-
declared information) to be completed by the
applicant. No household visits will be undertaken. The
program will require ownership of a National ID71 (NID).
Individuals who do not have a NID will be required to
obtain an NID before registering. The program should
provide two different registration options: (i) online
through citizen interface (for individuals who can
access the internet72) or (ii) physical visit to one of the
registration sites which could include the LibanPost,
and the Social Development Centers (SDCs), or the
70 For illustrative purposes here, we assume each of these options are utilized exclusively, when in practice there are financing modalities that use combinations thereof.
71 Initial assessment indicates that 78 percent of the Lebanese population have NIDs, World Bank Technical Mission for a Digital Transformation Project, ID4D, Sept 2019.
72 Share of population who uses internet is 75.9 percent (penetration rate), Internet usage, Broadband and Telecommunications report by Internet World Stats, 2016.

SPECIAL FOCuS I: FX SuBSIDy REFORM IN THE DELIBERATE DEPRESSION 39
use of registration trucks. Each entry point will use
the same “basic delivery system” accessible through
a mobile compatible citizen interface. A selfie-
based registration will be utilized for onboarding to
the program.73 During the registration, additional
information will be requested to exclude well-off
segments of the population.
The exclusion criteria will be based on
a phased approach whereby in Phase I basic
demographics and information on income and
assets will be collected for immediate exclusion.
Households who pass the eligibility for Phase I will be
onboarded and start receiving the benefits based on
their preferred payment modality (see payment sec-
tion). Phase II exclusion will be a recurrent process and
will commence 3 months after the onboarding. Detailed
demographics, information on employment, the value
of assets and ownership, etc. will be collected at Phase
II for exclusion purposes. The program should con-
struct interlinkages with other governmental databases
at Phase II depending on technical availability and IT
infrastructure. A call center and a back-office team
need to be developed to perform random spot checks
(up to 3–5 percent of beneficiaries) to decrease poten-
tial fraud and/or under/misreporting (which would be
communicated via a set of outreach and communica-
tion activities). The back-office team will also manage
the program’s GRM to ensure fairness, transparency,
objectiveness, and accessibility.
Payments Mechanism
Upon registering for the program, applicants
will be able to choose their preferred payment
modality among the options currently available
in the Lebanese market, receiving funds: (i) on an
individually or jointly held bank account (58 percent
of Lebanese residents being banked);74 (ii) on a
physical or virtual banking card, with funds redeemed
at automated teller machines (ATMs), or digitally
spent for purchases on point-of-sale (POS) devices;
or (iii) in LBP physical notes, with funds redeemed
through money transfer operators (MTO) agents
and/or LibanPost offices. Other payment modalities,
including mobile wallets, can be added once available
in the market. The GOL will send the payment orders
to the financial institution(s) based on the applicant’s
preferred payment choice. Giving recipients the
choice of the financial service provider often improves
customer experience by incentivizing providers to
offer the best services, while allowing governments
to cut on costs and avoid lengthy procurement
processes.75 For recipients opting to receive physical
notes, identification information, including biometrics
where possible, will be used for authentication at
disbursement time, hereby ensuring that the applicant
and whomever is redeeming the funds are the same
person.
It is important to note that the payment
mechanism depends on whether GOL opts for
a restricted or an unrestricted use of funds. The
above applies to an unrestricted use of funds, whereby
recipients can spend the funds without any condition,
be it digitally or in physical notes. It is not possible to
use transfer to bank accounts as a payment modality
if funds are restricted in their use.
Monitoring & GRM
An effective GRM and an effective monitoring
system is critical for the success of any social
safety net program and for establishing channels
of trust with the communities. A back-office
team needs to be put in place to manage appeals,
complaints, data updates, etc. through a GRM
module.
Complementarities Between the BC-CT Program and Other SSN Programs
The main targeted SSN program in Lebanon is the
National Poverty Targeting Program (NPTP) which
is being scaled up. The scale up will be financed
73 For each HH member, a photo of the NID and a selfie will be taken to create a user profile in the system. Please note that this option is only valid for polycarbonate type of IDs .
74 Financial Inclusion Demand Side Survey Report, BDL, 2018.
75 The Future of G2P Payments: Expanding Customer Choice, CGAP, 2019.

LEBANON ECONOMIC MONITOR: LE NAUFRAGE DU LIBAN (AU NUMÉRO 3)/LEBANON SINKING (TO THE TOP 3)40
through a US$246 million World Bank supported
Emergency Crisis and COVID-19 Response Social
Safety Net Project (ESSN) and support from donors.
The ESSN aims to provide cash transfers and access to
social services to 147,000 extreme poor and vulnerable
Lebanese households (approximately 20 percent
of the population), as well as top-up cash to 87,000
children ages 13–18 who are at risk of dropping out
from school. In addition, funding from donor partners
will support an additional 50,000 households reaching
a total of 200,000 of the poorest households—i.e., 27
percent of the Lebanese population.
While the BC-CT and the ESSN have simi-
larities and can both be considered types of SSN
programs, they have different (albeit related)
objectives and could be run in parallel. The
BC-CT is a compensation for subsidy reform aimed
at the general public and likely will be temporary and
time-bound. The NPTP/ESSN is a long-term sustained
SSN program aimed at protecting extreme poor house-
holds facing multiple shocks. The two programs, which
can carefully be run in parallel, are complementary to
each other with gradual dovetailing over the next 4–5
years, especially as the necessary delivery systems are
developed. The BC-CT program is likely to be financed
by GOL and will entail a gradual reduction in coverage
over 5 years. By year 5, the level of coverage would be
in line with a sustainable GOL-financed social safety net
program as the current crisis subsides. The 4–5-year
horizon will also enable a smooth (rather than abrupt)
reduction of coverage, as well as the establishment of
a fully functional SSN delivery system (including social
registry, GRM, and payments system). The proposed
timeframe is also suitable for the transition to a new
macroeconomic framework, allowing it to settle in and
support an adequate and robust social safety net.

41
SPECIAL FOCUS II: PUBLIC SERVICE DELIVERY IN THE DELIBERATE DEPRESSION76
L ebanon is enduring a severe and prolonged
economic depression. These conditions
transverse the financial and economic spheres
to directly impact the wellbeing of residents. Critical to
this wellbeing is delivery of essential public services.
A sharp deterioration in basic services would have
long-term implications, incurring permanent damage
to human capital, which should be a matter of grave
concern. Mass migration, loss of learning, poor health
outcomes, and lack of adequate safety nets, among
other consequences, would lead to a human capital
catastrophe, from which recovery would be very
difficult. Perhaps this dimension of the Lebanese
crisis makes the Lebanon episode unique compared
to other crises comparators presented in the report.
Lebanon’s public service delivery has long been
notoriously deficient relative to its upper middle-income
status. Nonetheless, long-established mitigation mea-
sures and private substitutables have traditionally filled
the gap, particularly for those with economic means.
The Deliberate Depression has further undermined this
set up via two effects: (i) it has significantly increased
poverty rates, expanding the demographic that is not
able to afford these private substitutables, and are
therefore more dependent on public services; and (ii) it
threatens financial viability and basic operability of the
public services sector by raising its costs and lowering
its revenues. In this Special Focus, we shed light on 4
basic public services: electricity, water supply, sanita-
tion and education.
The Electricity Sector
The electricity sector has been suffering for
decades from a financial deficit that required
constant annual budgetary transfers of US$1–2
billion to EdL. Using simple back-of-the-envelope
calculations, these cumulative deficits amount to
around US$40 billion as of 2020, a considerable
share of public debt.
76 This Special Focus section is a product of the Lebanon country team, led by Wissam Harake (Senior Economist), Sameh Mobarak (Senior Energy Specialist), Amal Talbi (Lead Water Resources Management Specialist), Sally Zgheib (Senior Water Supply and Sanitation Specialist), and Nathalie Lahire (Senior Economist).
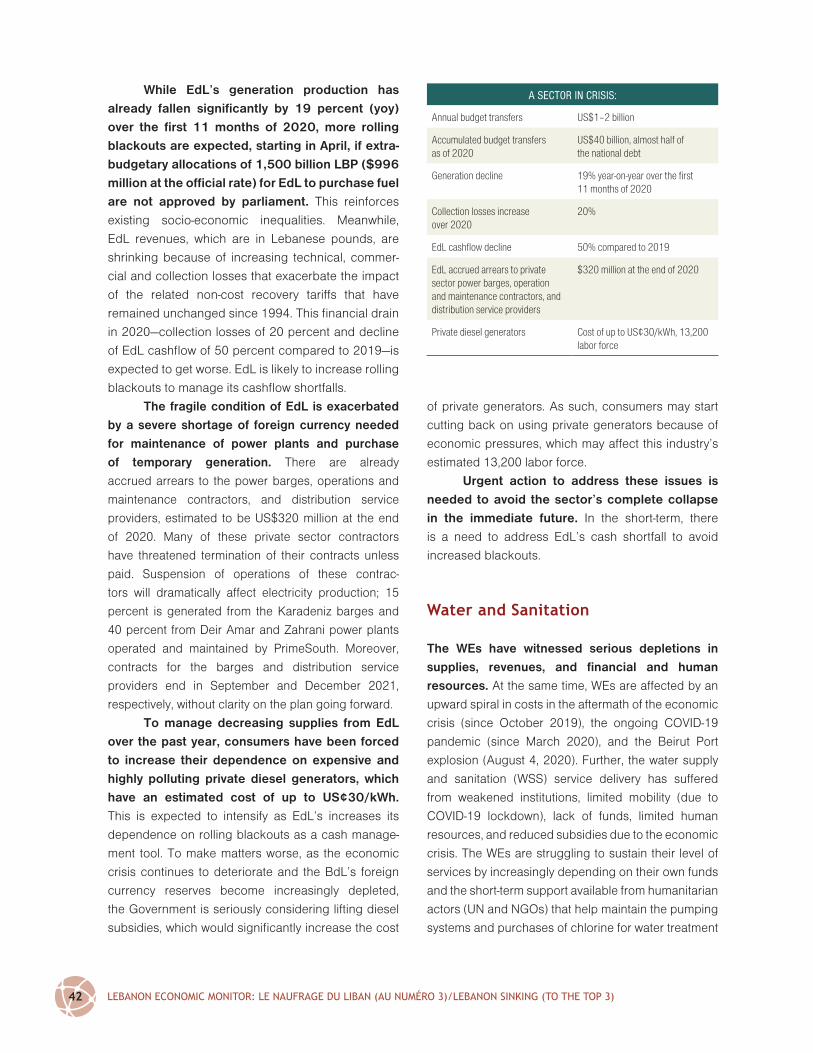
LEBANON ECONOMIC MONITOR: LE NAUFRAGE DU LIBAN (AU NUMÉRO 3)/LEBANON SINKING (TO THE TOP 3)42
While EdL’s generation production has
already fallen significantly by 19 percent (yoy)
over the first 11 months of 2020, more rolling
blackouts are expected, starting in April, if extra-
budgetary allocations of 1,500 billion LBP ($996
million at the official rate) for EdL to purchase fuel
are not approved by parliament. This reinforces
existing socio-economic inequalities. Meanwhile,
EdL revenues, which are in Lebanese pounds, are
shrinking because of increasing technical, commer-
cial and collection losses that exacerbate the impact
of the related non-cost recovery tariffs that have
remained unchanged since 1994. This financial drain
in 2020—collection losses of 20 percent and decline
of EdL cashflow of 50 percent compared to 2019—is
expected to get worse. EdL is likely to increase rolling
blackouts to manage its cashflow shortfalls.
The fragile condition of EdL is exacerbated
by a severe shortage of foreign currency needed
for maintenance of power plants and purchase
of temporary generation. There are already
accrued arrears to the power barges, operations and
maintenance contractors, and distribution service
providers, estimated to be US$320 million at the end
of 2020. Many of these private sector contractors
have threatened termination of their contracts unless
paid. Suspension of operations of these contrac-
tors will dramatically affect electricity production; 15
percent is generated from the Karadeniz barges and
40 percent from Deir Amar and Zahrani power plants
operated and maintained by PrimeSouth. Moreover,
contracts for the barges and distribution service
providers end in September and December 2021,
respectively, without clarity on the plan going forward.
To manage decreasing supplies from EdL
over the past year, consumers have been forced
to increase their dependence on expensive and
highly polluting private diesel generators, which
have an estimated cost of up to US¢30/kWh.
This is expected to intensify as EdL’s increases its
dependence on rolling blackouts as a cash manage-
ment tool. To make matters worse, as the economic
crisis continues to deteriorate and the BdL’s foreign
currency reserves become increasingly depleted,
the Government is seriously considering lifting diesel
subsidies, which would significantly increase the cost
of private generators. As such, consumers may start
cutting back on using private generators because of
economic pressures, which may affect this industry’s
estimated 13,200 labor force.
Urgent action to address these issues is
needed to avoid the sector’s complete collapse
in the immediate future. In the short-term, there
is a need to address EdL’s cash shortfall to avoid
increased blackouts.
Water and Sanitation
The WEs have witnessed serious depletions in
supplies, revenues, and financial and human
resources. At the same time, WEs are affected by an
upward spiral in costs in the aftermath of the economic
crisis (since October 2019), the ongoing COVID-19
pandemic (since March 2020), and the Beirut Port
explosion (August 4, 2020). Further, the water supply
and sanitation (WSS) service delivery has suffered
from weakened institutions, limited mobility (due to
COVID-19 lockdown), lack of funds, limited human
resources, and reduced subsidies due to the economic
crisis. The WEs are struggling to sustain their level of
services by increasingly depending on their own funds
and the short-term support available from humanitarian
actors (UN and NGOs) that help maintain the pumping
systems and purchases of chlorine for water treatment
A SECTOR IN CRISIS:
Annual budget transfers US$1–2 billion
Accumulated budget transfers as of 2020
US$40 billion, almost half of the national debt
Generation decline 19% year-on-year over the first 11 months of 2020
Collection losses increase over 2020
20%
EdL cashflow decline 50% compared to 2019
EdL accrued arrears to private sector power barges, operation and maintenance contractors, and distribution service providers
$320 million at the end of 2020
Private diesel generators Cost of up to US¢30/kWh, 13,200 labor force

SPECIAL FOCuS II: PuBLIC SERvICE DELIvERy IN THE DELIBERATE DEPRESSION 43
plants. Moreover, due to ongoing water shortages and
intermittent water supply from the WEs—with hours
of supply further reduced in 2020—people have had
to rely more on other costlier water alternatives such
as water tankers and bottled water. The cost of these
alternatives is increasing. For example, since 2020,
the cost of supply from water tankers increased by
about 35 percent, while prices of bottled water almost
doubled.
More specifically, WEs are facing the fol-
lowing challenges:
• Lack of coverage for operation and maintenance
(O&M) costs further exacerbated by poor and
falling collection rates . Even prior to the economic
crisis, the applicable yearly flat fee (approximately
LBP 295,000) already failed to cover the full
cost of O&M. The crisis further exacerbated the
situation, leading to a 20 percent fall in collection
in 2020 compared to 2019.77
• Increase in service delivery costs. Financial crisis
conditions—including FX shortages and sharp
depreciation of the local currency—along with an
inefficient FX subsidy on fuel imports compounded
by rising global oil prices, have led to fuel supply
shortages in the country. All this has resulted in an
increase in the service delivery costs.
• Poor incentives for staff . Staff are paid in LBP.
As such, very high inflation rates have resulted in
sharp declines in their real wages. In addition, the
WEs have struggled to pay salaries and statutory
commitments to retirees resulting in an adverse
impact on staff morale.
• Delays in implementing ongoing work paid in
US$ . The WEs are facing challenges and delays
in paying contractors in US$, which are needed
to import the necessary goods and equipment,
thus delaying or blocking the work.
• Limited availability of stock of materials. The
available stock of material and equipment at WEs
is limited and will not sustain beyond the next
few months. The need to import replenishments
necessitates access to FX.
Should the situation continue to dete-
riorate, these challenges will seriously impair
the delivery of WSS services through delays in
addressing breakages and repairing leaks and
assets, possibly leading to the non-operation of
treatment plants. WEs might start diverting funds
from resource monitoring to other immediate O&M
needs. Consequently, there is a risk of intensified
spread of water-borne diseases, adversely impacting
an already vulnerable public health system. Thus,
there is urgent need for the following:
• Reliable electricity supply is one of the main
limiting factors in ensuring operational continuity
of WSS service delivery . WEs require electricity
to produce, treat and distribute water supply
and continue treating wastewater. Thus, the
Government of Lebanon should prioritize power
supply to WEs during this crisis despite delayed
payments to avoid shutting-off of the pumping
stations and treatment plants.
• Maintaining the WSS services at a minimum
operating capacity to safeguard public health .
The ongoing humanitarian support can include
contracting out emergency rehabilitation of WSS
systems to construction firms (where and when
possible) and providing spare parts (e.g., pumps,
motors, pipes, valves, fittings, repair clamps,
transformers) and consumables (e.g., chemicals for
water treatment and disinfection, fuel, lubricants).
• Continue sustaining the flow of funds to procure
the spare parts and consumables . Standby
financing mechanisms from the Government
are needed to sustain the flow of spare parts
and consumables to WEs, to maintain personnel
(e.g., operators and technicians) and must be
equipped and able to meet the capital costs of
system repairs and rehabilitation.
Education
In 2021, Lebanon’s education sector has to
respond to five major crises, rather than just
77 This is according to unaudited 2020 accounts for the Beqaa Water Establishment (BWE).

LEBANON ECONOMIC MONITOR: LE NAUFRAGE DU LIBAN (AU NUMÉRO 3)/LEBANON SINKING (TO THE TOP 3)44
one—the Syrian crisis, economic collapse, political
instability, the COVID-19 pandemic, and the PoB
explosion—putting severe strain on an already
struggling education system. Pre-COVID-19 learning
levels were already comparatively low, with only
6.3 years of learning taking place, once schooling is
adjusted for actual learning.78 The most recent school
closures due to the COVID-19 pandemic—with schools
closed over 75 percent of the school year between
January 2020 and February 202179—will likely lead to a
further and significant decrease in learning. Effectively,
students are facing a “lost year” of learning.
Impact on access to education
The many crises severely impacted demand
for education and student retention, especially
as many parents can no longer afford private
education for their children. School completion
rates in primary (78 percent) and lower secondary
education (59 percent) have already been declining
over the last years,80 with completion rates being
significantly lower among poorer students.81 The
burden of education in Lebanon, which enrolled about
1.2 million students in 2019/2020, falls on parents’
shoulders, who pay a combined US$1.5 billion
annually, with the government paying an additional
US$1.2 billion (World Bank 2017).82
This school year alone, 54,000 students
(11 percent of public sector students) transi-
tioned from private to the public schools, putting
additional strain on a public education sector,
which already faced severe constraints in terms of
available school infrastructure, education quality
and service delivery.83 It is estimated that through
this shift, the private sector is losing at least 8 percent
of its financing, either through per-student tuition or
direct subsidies that are linked to enrollment.
The contraction in the economy and
increase in poverty rates will likely lead to more
parents shifting their children to public schools
in the coming years, as well as higher student
drop-outs, especially from the most marginalized
households. These large-scale shifts will change the
setup of the Lebanese education sector fundamen-
tally, necessitating re-evaluation of education sector
financing.84 Expected austerity measures implemented
by local universities, will lead to a further decline in
higher education quality, likely exacerbating a brain
drain as youth graduates seek employability abroad,
particularly in critical sectors such as medicine.
Impact on learning
The recent Programme for International Student
Assessment (PISA) (OECD 2019) and Trends in
International Mathematics and Science Study
(TIMSS) (IEA 2020) show Lebanon as one of the
lowest ranked countries in the region in terms of
student learning outcomes. Time trends show that
learning outcomes have consistently declined over
the last decade, pointing at systematic issues with
quality of education. While quality of education is low
overall, learning outcomes are highly unequal across
the country. The differences in the quality of individual
schools are very large—more than in other countries—
and disproportionately affect students in public schools
and those from lower socio-economic backgrounds. The
prolonged school closures and interrupted education
service delivery will have long lasting negative effects
on learning for all children, exacerbating inequalities
and impacting the most marginalized.
Impact on equity in education
The prolonged school closures have
disproportionately affected the most marginalized
78 World Bank Human Capital Index (2020). Learning-adjusted years of schooling.
79 This amounts to 154 days of full closure according to World Bank & UNICEF 2021.
80 Abdul-Hamid and Yassine 202081 Only half of 18-year-olds from the lowest economic
quantiles completed school prior to the economic crisis in the country (CAS 2020).
82 Households private expenses comprise fees for private schools or out-of-pocket expenses in public schools, such as transportation costs and textbooks.
83 Most public schools are located in the poorest areas, where demand is greatest.
84 World Bank. 2020. “Emergency Social Safety Net Project Appraisal Document.”

SPECIAL FOCuS II: PuBLIC SERvICE DELIvERy IN THE DELIBERATE DEPRESSION 45
students, who had little access to continued
learning. Since February 2020, schools were mostly
closed and remote learning the default for most
months. Remote learning requires availability of IT and
other resources. About 60 percent of students either
do not have a computer or have to share it with at
least 3 other family members. Recent estimates show
that only about 50 percent of students are connected
to online learning.85 Inequities in the education system
have been further exposed with the pandemic—from
access to broadband and computers needed for
online education, to resourceful home environments
needed to support learning, up to the misalignment
between resources provided by the education sector
and education needs.
85 Gajderowicz, Tomasz, and Maciej Jakubowski. Forthcoming. “PISA In-Depth Analysis of Results for Jordan and Lebanon (draft).” Washington, DC: World Bank.

47
ANNEXForecasts of Lebanon’s Real GDP Growth using MIDAS Regressions: An Update for 2020 and 2021
Introduction
The forecasts of Lebanon’s real GDP growth for the
year 2020 and 2021 are updated based on the new
incoming data for the high frequency indicators. The
data on the high frequency indicators are available for
the first eleven months of 2020 at the time of writing.86
The data for real GDP growth are available until 2019.
In forecasting growth in 2020 and 2021, we
make a distinction between the utility of financial versus
real economy indicators. Financial indicators are likely
to better first capture financial crisis dynamics, making
them more relevant leading indicators for 2020 than
real economy indicators. However, over the course of
2020, the financial sector became increasingly inop-
erative and segmented from both the local and global
economy. Meanwhile, real indicators increasingly
capture the extent of the economic crisis and become
more relevant leading indicators for 2021.
Forecasting Real GDP Growth for 2020
The high frequency indicators used to nowcast and
forecast Lebanon’s real GDP growth in 2020 are:
annual growth rates in claims of the commercial
banking sector on resident customers, outstanding
lines of credit for imports, non-resident deposits and
resident deposits (Figure 27). That is, in the MIDAS
setup, our vector of high frequency indicators is,
xtH = cl , lc, nr , r( ) , where cl, lc, nr and r denote,
respectively, annual growth rates in claims of the
commercial banking sector on resident customers,
outstanding lines of credit for imports, non-resident
deposits and resident deposits. We also aggregate
the information from the four high frequency
indicators using principal components analysis. More
specifically, we extract the first principal component
from the four indicators and use it to forecast real
GDP growth for 2020. The MIDAS model, which uses
the first principal component of the four indicators,
86 In the previous update to the MIDAS forecasting exercise, the data on the high frequency indicators were available until May 2020.
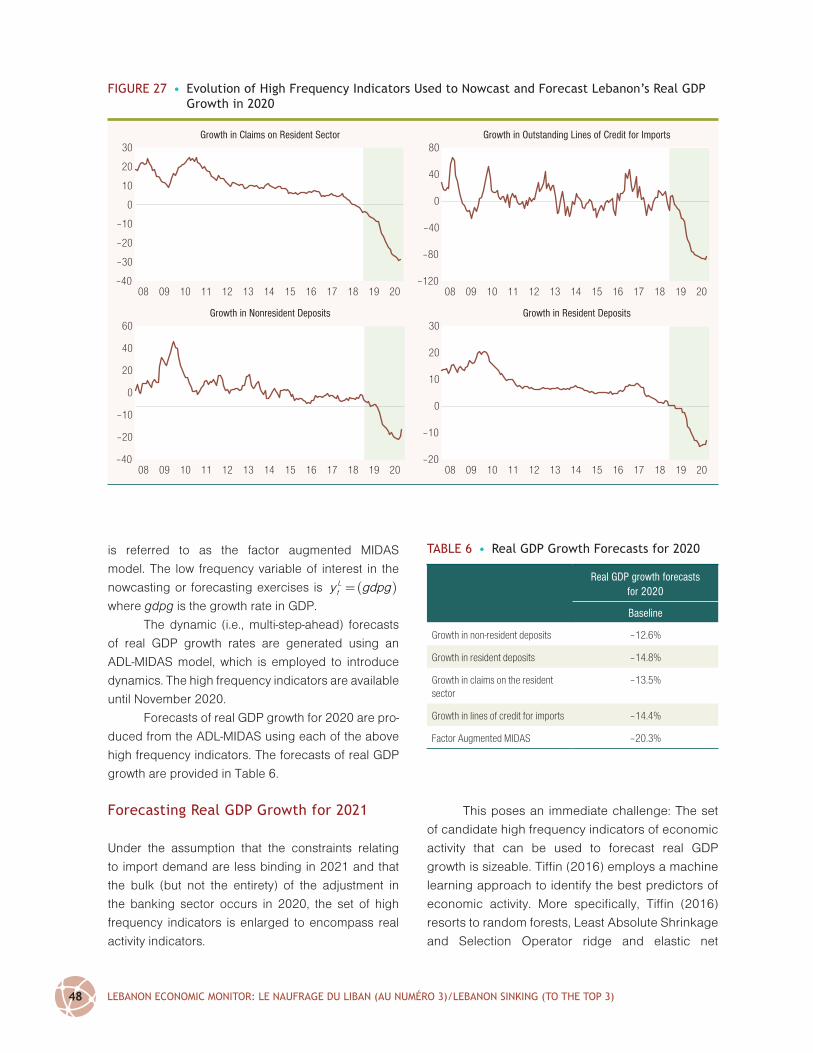
LEBANON ECONOMIC MONITOR: LE NAUFRAGE DU LIBAN (AU NUMÉRO 3)/LEBANON SINKING (TO THE TOP 3)48
is referred to as the factor augmented MIDAS
model. The low frequency variable of interest in the
nowcasting or forecasting exercises is ytL = gdpg( )
where gdpg is the growth rate in GDP.
The dynamic (i.e., multi-step-ahead) forecasts
of real GDP growth rates are generated using an
ADL-MIDAS model, which is employed to introduce
dynamics. The high frequency indicators are available
until November 2020.
Forecasts of real GDP growth for 2020 are pro-
duced from the ADL-MIDAS using each of the above
high frequency indicators. The forecasts of real GDP
growth are provided in Table 6.
Forecasting Real GDP Growth for 2021
Under the assumption that the constraints relating
to import demand are less binding in 2021 and that
the bulk (but not the entirety) of the adjustment in
the banking sector occurs in 2020, the set of high
frequency indicators is enlarged to encompass real
activity indicators.
This poses an immediate challenge: The set
of candidate high frequency indicators of economic
activity that can be used to forecast real GDP
growth is sizeable. Tiffin (2016) employs a machine
learning approach to identify the best predictors of
economic activity. More specifically, Tiffin (2016)
resorts to random forests, Least Absolute Shrinkage
and Selection Operator ridge and elastic net
TABLE 6 • Real GDP Growth Forecasts for 2020
Real GDP growth forecasts for 2020
Baseline
Growth in non-resident deposits –12.6%
Growth in resident deposits –14.8%
Growth in claims on the resident sector
–13.5%
Growth in lines of credit for imports –14.4%
Factor Augmented MIDAS –20.3%
FIGuRE 27 • Evolution of High Frequency Indicators used to Nowcast and Forecast Lebanon’s Real GDP Growth in 2020
Growth in Claims on Resident Sector Growth in Outstanding Lines of Credit for Imports
Growth in Nonresident Deposits Growth in Resident Deposits
–4008 09 10 11 12 13 14 15 16 17 18 19 20
30
20
10
0
–10
–20
–30
–120
–80
08 09 10 11 12 13 14 15 16 17 18 19 20
80
40
0
–40
–4008 09 10 11 12 13 14 15 16 17 18 19 20
60
40
20
0
–10
–20
–20
–10
08 09 10 11 12 13 14 15 16 17 18 19 20
30
20
10
0
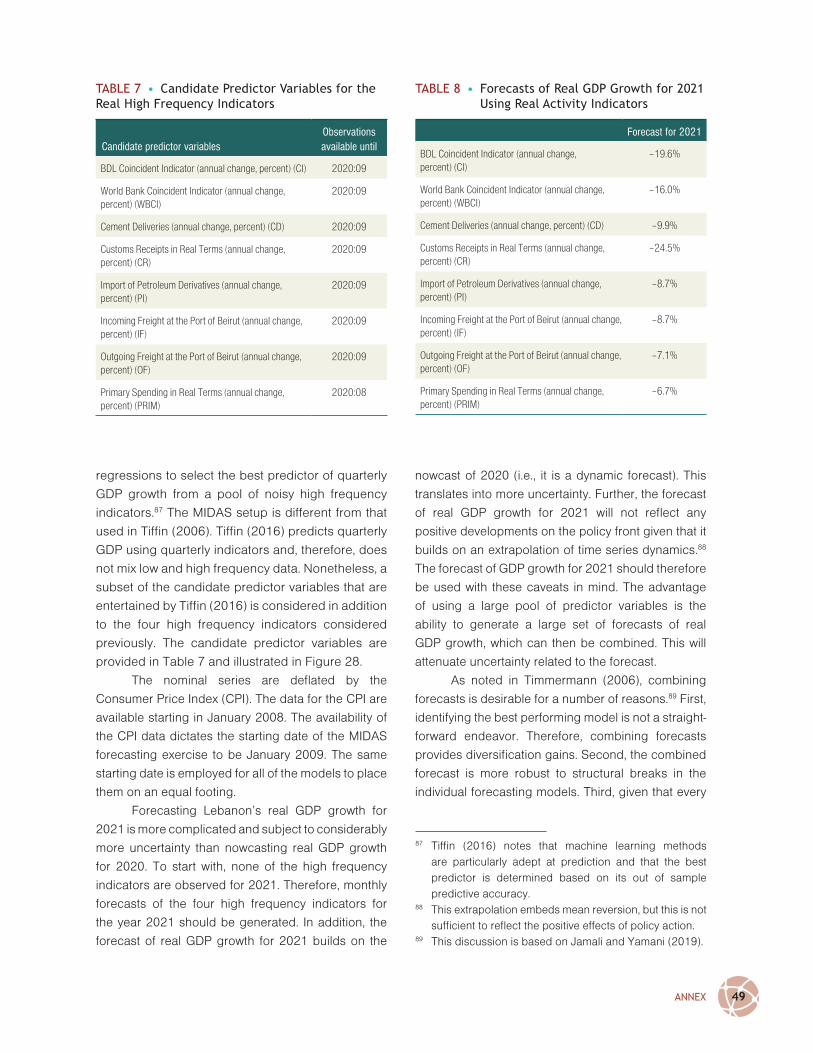
ANNEX 49
regressions to select the best predictor of quarterly
GDP growth from a pool of noisy high frequency
indicators.87 The MIDAS setup is different from that
used in Tiffin (2006). Tiffin (2016) predicts quarterly
GDP using quarterly indicators and, therefore, does
not mix low and high frequency data. Nonetheless, a
subset of the candidate predictor variables that are
entertained by Tiffin (2016) is considered in addition
to the four high frequency indicators considered
previously. The candidate predictor variables are
provided in Table 7 and illustrated in Figure 28.
The nominal series are deflated by the
Consumer Price Index (CPI). The data for the CPI are
available starting in January 2008. The availability of
the CPI data dictates the starting date of the MIDAS
forecasting exercise to be January 2009. The same
starting date is employed for all of the models to place
them on an equal footing.
Forecasting Lebanon’s real GDP growth for
2021 is more complicated and subject to considerably
more uncertainty than nowcasting real GDP growth
for 2020. To start with, none of the high frequency
indicators are observed for 2021. Therefore, monthly
forecasts of the four high frequency indicators for
the year 2021 should be generated. In addition, the
forecast of real GDP growth for 2021 builds on the
TABLE 7 • Candidate Predictor variables for the Real High Frequency Indicators
Candidate predictor variablesObservations available until
BDL Coincident Indicator (annual change, percent) (CI) 2020:09
World Bank Coincident Indicator (annual change, percent) (WBCI)
2020:09
Cement Deliveries (annual change, percent) (CD) 2020:09
Customs Receipts in Real Terms (annual change, percent) (CR)
2020:09
Import of Petroleum Derivatives (annual change, percent) (PI)
2020:09
Incoming Freight at the Port of Beirut (annual change, percent) (IF)
2020:09
Outgoing Freight at the Port of Beirut (annual change, percent) (OF)
2020:09
Primary Spending in Real Terms (annual change, percent) (PRIM)
2020:08
TABLE 8 • Forecasts of Real GDP Growth for 2021 using Real Activity Indicators
Forecast for 2021
BDL Coincident Indicator (annual change, percent) (CI)
–19.6%
World Bank Coincident Indicator (annual change, percent) (WBCI)
–16.0%
Cement Deliveries (annual change, percent) (CD) –9.9%
Customs Receipts in Real Terms (annual change, percent) (CR)
–24.5%
Import of Petroleum Derivatives (annual change, percent) (PI)
–8.7%
Incoming Freight at the Port of Beirut (annual change, percent) (IF)
–8.7%
Outgoing Freight at the Port of Beirut (annual change, percent) (OF)
–7.1%
Primary Spending in Real Terms (annual change, percent) (PRIM)
–6.7%
87 Tiffin (2016) notes that machine learning methods are particularly adept at prediction and that the best predictor is determined based on its out of sample predictive accuracy.
88 This extrapolation embeds mean reversion, but this is not sufficient to reflect the positive effects of policy action.
89 This discussion is based on Jamali and Yamani (2019).
nowcast of 2020 (i.e., it is a dynamic forecast). This
translates into more uncertainty. Further, the forecast
of real GDP growth for 2021 will not reflect any
positive developments on the policy front given that it
builds on an extrapolation of time series dynamics.88
The forecast of GDP growth for 2021 should therefore
be used with these caveats in mind. The advantage
of using a large pool of predictor variables is the
ability to generate a large set of forecasts of real
GDP growth, which can then be combined. This will
attenuate uncertainty related to the forecast.
As noted in Timmermann (2006), combining
forecasts is desirable for a number of reasons.89 First,
identifying the best performing model is not a straight-
forward endeavor. Therefore, combining forecasts
provides diversification gains. Second, the combined
forecast is more robust to structural breaks in the
individual forecasting models. Third, given that every

LEBANON ECONOMIC MONITOR: LE NAUFRAGE DU LIBAN (AU NUMÉRO 3)/LEBANON SINKING (TO THE TOP 3)50
model is likely to be misspecified, combining forecasts
will alleviate the effects of misspecification in indi-
vidual forecasting models (Elliott and Timmermann,
2016). Fourth, Timmermann (2006)’s synthesis of the
empirical literature suggests that combining forecast
yields gains in predictive accuracy relative even to
FIGuRE 28 • Growth of High Frequency Real Economy Indicators used to Nowcast and Forecast Lebanon’s Real GDP Growth in 2021
CIG WBCIG
CDG CRG
PIG IFG
OFG PRIMG
–60
–40
–20
0
20
40
–80
–60
–40
–20
0
20
40
2008 2010 2012 2014 2016 2018 2020 2008 2010 2012 2014 2016 2018 2020
2008 2010 2012 2014 2016 2018 2020 2008 2010 2012 2014 2016 2018 2020
2008 2010 2012 2014 2016 2018 2020 2008 2010 2012 2014 2016 2018 2020
2008 2010 2012 2014 2016 2018 2020 2008 2010 2012 2014 2016 2018 2020
–80
–40
0
40
80
–80
–40
0
40
80
120
–50
–25
0
25
50
75
100
–60
–40
–20
0
20
40
60
–60
–40
–20
0
20
40
60
80
–80
–40
0
40
80
120

ANNEX 51
the best performing individual forecasting model. The
simple mean, the trimmed mean and the median are
three simple forecast combination methods that can
be applied in this setup.
Dynamic forecasts of the growth in the high
frequency indicators are generated from a well-
specified Autoregressive Moving Average model. The
forecast sample begins on the month following the
last for which an observation on the high frequency
indicator is available. The forecast sample for the
high frequency indicators ends in December 2021.
The set of high frequency candidate predictors is
xtH = ci , wbci , cd , cr , pi , if , of , prim( ).
The time series dynamics of the high frequency
indicators of economic activity are provided.
The simple average of the forecasts for 2021 is
–12.65 percent whereas the median is –9.32 percent.
The growth forecasts using the main high
frequency indicators are provided in Table 9.
Again, given that the import constraint is likely
not binding in 2021, the GDP growth forecast for 2021
obtained from the growth in lines of credit for imports as
a high frequency indicator is dropped from the forecast
combination. Combining the forecasts from Tables 8
and 9 yields an average growth rate of –11.6 percent in
2021 and a median growth rate of –9.90 percent. If the
forecast of real GDP growth obtained with lines of credit
for imports is included in the forecast averaging, the
average growth rate for 2021 becomes –12.05 percent
while the median growth rate is –10.22 percent.
References
Elliott, G., & Timmermann, A 2016. Economic
Forecasting. Princeton University Press.
Jamali, I., & Yamani, E. 2019. Out-of-sample exchange
rate predictability in emerging markets:
Fundamentals versus technical analysis. Journal
of International Financial Markets, Institutions
and Money, 61, 241–263.
Tiffin, A. 2016. Seeing in the dark: a machine-learning
approach to nowcasting in Lebanon. IMF Working
paper WP/16/56, International Monetary Fund,
Washington DC.
Timmermann, A. 2006. Forecast combinations. Hand-
book of Economic Forecasting, 1, 135–196.
Dynamic Response of Inflation to Currency in Circulation in Lebanon
This section offers an assessment of the response of
inflation to changes in currency in circulation using
multivariate time series models. The variables of
interest are the percentage change (growth) in the
currency in circulation, inflation and the percentage
change in the World Bank coincident indicator. The
coincident indicator is employed to control for real
economic activity.
unit Root Tests
We begin the exercise by testing for stationarity for each
of the series using the augmented Dickey–Fuller (ADF)
(1979) and the Phillips and Perron (PP)(1988) tests. The
null hypothesis for both the ADF and PP tests is that the
series contains a unit root. The ADF test is known to
exhibit low power when the alternative is near unit root
TABLE 9 • Forecasts of Real GDP Growth for 2021 using Real Activity and Financial Indicators
IndicatorForecast for
2021
BDL Coincident Indicator (annual change, percent) (CI) –19.6%
World Bank Coincident Indicator (annual change, percent) (WBCI)
–16.0%
Cement Deliveries (annual change, percent) (CD) –9.9%
Customs Receipts in Real Terms (annual change, percent) (CR)
–24.5%
Import of Petroleum Derivatives (annual change, percent) (PI)
–8.7%
Incoming Freight at the Port of Beirut (annual change, percent) (IF)
–8.7%
Outgoing Freight at the Port of Beirut (annual change, percent) (OF)
–7.1%
Primary Spending in Real Terms (annual change, percent) (PRIM)
–6.7%
Growth in non-resident deposits (NR) –10.5%
Growth in resident deposits (R) –11.3%
Growth in claims on the resident sector (CL) –8.9%
Growth in lines of credit for imports (LC) –12.6%

LEBANON ECONOMIC MONITOR: LE NAUFRAGE DU LIBAN (AU NUMÉRO 3)/LEBANON SINKING (TO THE TOP 3)52
TABLE 10 • unit Root Tests
ADF PP ADF-GLS ZA
Growth of currency in circulation
–3.29 –11.29*** –2.62 –5.49***
Inflation –4.33*** –7.46*** –4.18*** –6.27***
Percentage change in the World Bank coincident indicator
–12.96*** –13,08*** –4.01*** –5.36***
Notes: This table provides the results from the Augmented Dickey Fuller (ADF), Phillips and Perron (PP), Elliott, Rothenberg and Stock (1996) ADF test with GLS detrending (ADF-GLS) as well as the Zivot and Andrews (ZA) (1992) tests.
TABLE 11 • Cumulative Effect of a 1 Percent Increase in Currency in Circulation on Inflation
Percentage increase in currency in circulation Cumulative effect on CPI
1% 1.29%
100% 129%
behavior (Elliot et al., 1996). Therefore, the ADF test with
GLS detrending of Elliott et al . (1996) is also employed.
The existing literature shows that the ADF–GLS test has
good power properties against near unit root behavior.
The crisis dynamics pervading the post
October 2019 period imply that the series might be
subject to a structural break. Therefore, the Zivot and
Andrews (ZA) (1992) test, which allows for a break in
the intercept and the trend, is also employed.
The results from the unit root tests suggest that
all three series are stationary. The tests also indicate
that the growth in currency in circulation can be char-
acterized as a stationary variable that is subject to a
structural break. The Perron (2006) test designates
August 2019 as the break point.90
vAR variables in Difference
Let M0t, P
t and WBCI
t denote, respectively, the
level of the currency in circulation, the CPI and the
World Bank Coincident Indicator index. The natural
logarithms of the currency in circulation and the
price level are denoted, respectively, mot and p
t. The
percentage change in the WBCIt is computed as
wbgt =100 xWBCIt −WBCIt−1
WBCIt
.
The vector of variables in the VAR is thus
yt = Δm0t ,Δpt ,wbgt[ ]’. Namely, the vector of variables
yt includes the percentage change in the currency in
circulation, inflation as measured by the percentage
change in the CPI, and lastly, the percentage change
in the World Bank Coincident Indicator index. The
VAR model is estimated using percent changes in
the variables to circumvent non-stationarity.
A recursive ordering (Cholesky decomposi-
tion) is employed to identify the VAR. An optimal lag
length of five is used based on the Akaike Information
Criterion (AIC). The analysis is carried out at the
monthly frequency over the period January 2008 to
September 2020. The times series of the variables are
displayed in Figure 29.
The effects of a shock to currency in circula-
tion are assessed using impulse response analysis.
Figure 30 provides the responses of each of the vari-
ables to a 1 percent shock to currency in circulation.
The response of inflation and the World Bank
coincident indicator to a 1 percent shock to currency
in circulation is significant. More specifically, the
response of inflation peaks five months following the
shock and remains positive and significant. The growth
in the WBCI exhibits a negative response to the shock
to currency in circulation. This response is significant
in the two to five months following the shock.
The cumulative effect of the shock to the cur-
rency in circulation on inflation for the entire forecast
horizon (12 months) can be computed by accumu-
lating the responses in inflation. The effect is provided
in Table 11. The results suggest that a 100 percent
increase in the currency in circulation increase prices
by 129 percent annually, which averages about 10.75
percent per month.
vAR variables in (Log) Levels
The robustness of the results is assessed by estimating
the VAR model in log levels. More specifically, the VAR
in log levels comprises in the following order: mot, p
t
and wbcit, where wbci
t is the natural logarithm of the
90 Other unit root tests that account for a break include Lee and Strazicich (2003) as well as Lumsdaine and Papell (1997).
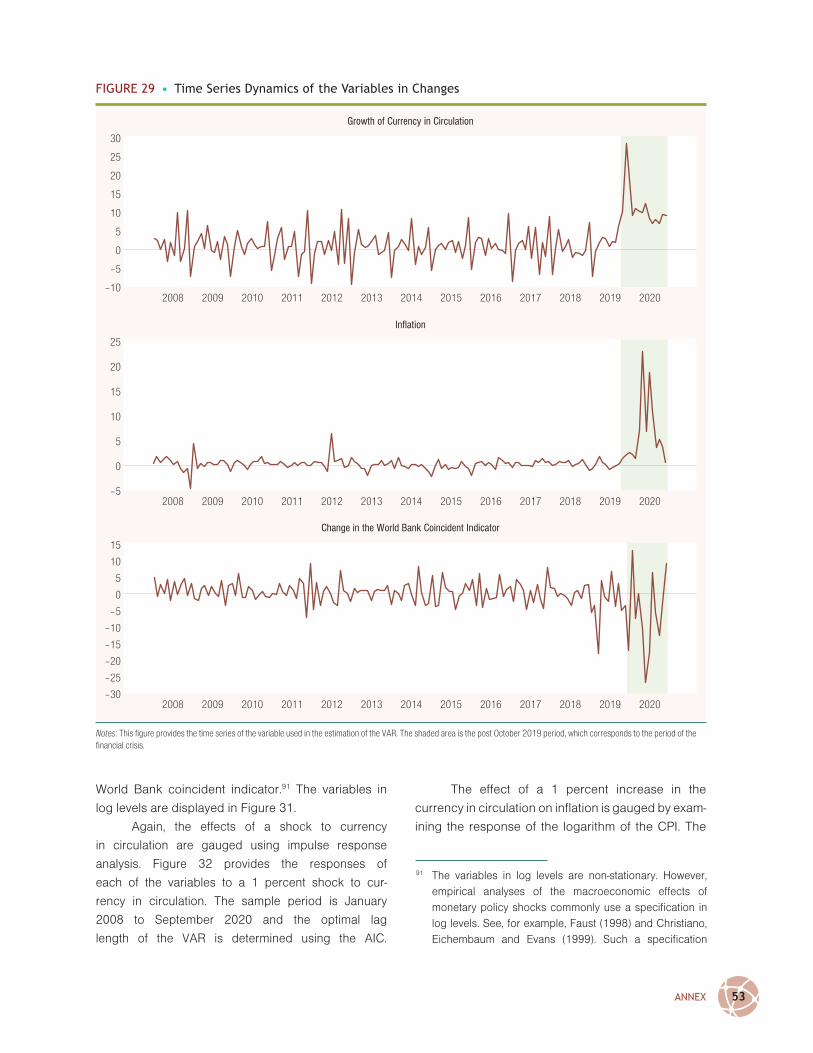
ANNEX 53
World Bank coincident indicator.91 The variables in
log levels are displayed in Figure 31.
Again, the effects of a shock to currency
in circulation are gauged using impulse response
analysis. Figure 32 provides the responses of
each of the variables to a 1 percent shock to cur-
rency in circulation. The sample period is January
2008 to September 2020 and the optimal lag
length of the VAR is determined using the AIC.
FIGuRE 29 • Time Series Dynamics of the variables in Changes
Growth of Currency in Circulation
Inflation
Change in the World Bank Coincident Indicator
–102008 2009 2010 2011 2012 2013 2014 2015 2016 2017 2018 2019 2020
0
5
–5
20
15
10
30
25
2008 2009 2010 2011 2012 2013 2014 2015 2016 2017 2018 2019 2020
0
5
–5
20
15
10
25
–302008 2009 2010 2011 2012 2013 2014 2015 2016 2017 2018 2019 2020
–15
–10
–25
–20
5
0
–5
15
10
Notes: This figure provides the time series of the variable used in the estimation of the VAR. The shaded area is the post October 2019 period, which corresponds to the period of the financial crisis.
91 The variables in log levels are non-stationary. However, empirical analyses of the macroeconomic effects of monetary policy shocks commonly use a specification in log levels. See, for example, Faust (1998) and Christiano, Eichembaum and Evans (1999). Such a specification
The effect of a 1 percent increase in the
currency in circulation on inflation is gauged by exam-
ining the response of the logarithm of the CPI. The
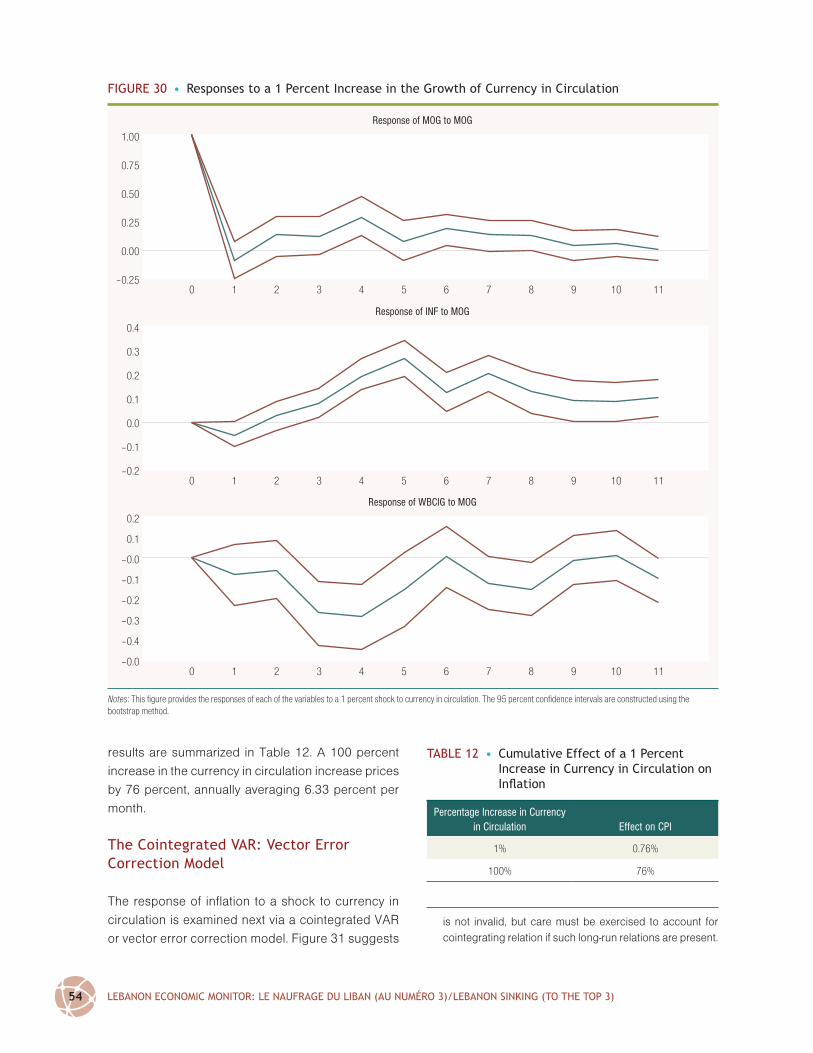
LEBANON ECONOMIC MONITOR: LE NAUFRAGE DU LIBAN (AU NUMÉRO 3)/LEBANON SINKING (TO THE TOP 3)54
FIGuRE 30 • Responses to a 1 Percent Increase in the Growth of Currency in Circulation
Response of MOG to MOG
Response of INF to MOG
Response of WBCIG to MOG
–0.250 1 2 3 4 5 6 7 8 9 10 11
0 1 2 3 4 5 6 7 8 9 10 11
0 1 2 3 4 5 6 7 8 9 10 11
0.00
0.50
0.25
1.00
0.75
–0.1
0.0
–0.2
0.3
0.2
0.1
0.4
–0.0
–0.4
–0.3
–0.0
–0.1
–0.2
0.2
0.1
Notes: This figure provides the responses of each of the variables to a 1 percent shock to currency in circulation. The 95 percent confidence intervals are constructed using the bootstrap method.
results are summarized in Table 12. A 100 percent
increase in the currency in circulation increase prices
by 76 percent, annually averaging 6.33 percent per
month.
The Cointegrated vAR: vector Error Correction Model
The response of inflation to a shock to currency in
circulation is examined next via a cointegrated VAR
or vector error correction model. Figure 31 suggests
TABLE 12 • Cumulative Effect of a 1 Percent Increase in Currency in Circulation on Inflation
Percentage Increase in Currency in Circulation Effect on CPI
1% 0.76%
100% 76%
is not invalid, but care must be exercised to account for cointegrating relation if such long-run relations are present.

ANNEX 55
FIGuRE 31 • Time Series Dynamics of the variables in Log Levels
log of Currency in Circulation
log of CPI
log of WBCI
7.0
8.5
8.0
7.5
9.5
9.0
10.5
10.0
4.8
5.0
4.6
5.8
5.6
5.2
5.4
6.0
3.75
4.00
4.75
4.50
4.25
5.25
5.00
2008 2009 2010 2011 2012 2013 2014 2015 2016 2017 2018 2019 2020
2008 2009 2010 2011 2012 2013 2014 2015 2016 2017 2018 2019 2020
2008 2009 2010 2011 2012 2013 2014 2015 2016 2017 2018 2019 2020
that the logarithms of the currency in circulation and
the CPI may exhibit a long-run cointegrating relation.
The presence of a cointegration relation in
the VAR in log levels is tested using the Johansen
(1988) approach. More specifically, the existence
of cointegrating vectors can be examined using the
trace statistic:
λtrace r( )=–Τ ln 1–λ̂i( )i=r+1
g∑ , (5)
where r is the number of cointegrating vectors under
the null hypothesis and λtrace r( )=–Τ ln 1–λ̂i( )i=r+1
g∑ is the estimated ith ordered
eigenvalue of the matrix Π . The trace statistic tests
the null hypothesis that the number of cointegrating
vector is r or less against the alternative hypothesis
that there are more than r cointegrating vectors. The
trace statistic is reported in Table 13.
The null hypothesis of no cointegrating vector
is marginally rejected (at the 10 percent level). The
null hypothesis of one or less cointegrating vector

LEBANON ECONOMIC MONITOR: LE NAUFRAGE DU LIBAN (AU NUMÉRO 3)/LEBANON SINKING (TO THE TOP 3)56
is not rejected. The null of two or less cointegrating
vectors is rejected at the 5 percent.
A VECM is estimated and the response to a one
standard deviation shock are provided in Figure 33.
The 95 percent confidence bands are generated
using Monte Carlo simulation.
The impulse response analysis suggests that
a 1 percent shock to currency in circulation gener-
ated a response of 0.80 percent increase in CPI over
a twelve-month horizon. This result is summarized in
Table 14. Hence, an increase in currency in circulation
by a 100 percent results in an 80 percent increase in
TABLE 13 • The Johansen (1988) Trace Statistic
Trace statistic
r =0 28.30*
r ≤1 12.86
r ≥2 4.66**
FIGuRE 32 • Responses to a 1 Percent Increase in the (log of) Currency in Circulation
Response of LMO to log of MO
Response of LCPI to log of MO
Response of LWBCI to long of MO
0.000 1 2 3 4 5 6 7 8 9 10 11
0 1 2 3 4 5 6 7 8 9 10 11
0 1 2 3 4 5 6 7 8 9 10 11
0.50
0.25
1.50
1.00
1.25
0.75
0.0
–0.2
0.2
1.0
0.4
0.6
0.8
–1.0
–0.4
–0.6
–0.8
–0.0
–0.2
0.2
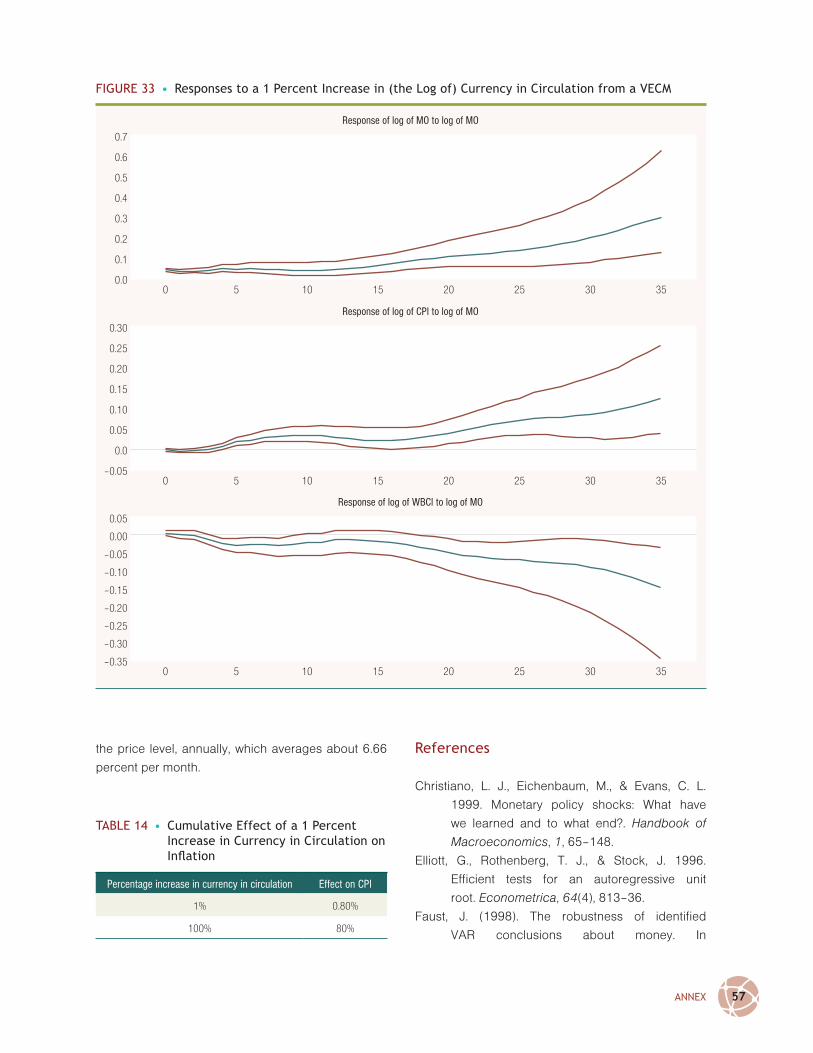
ANNEX 57
TABLE 14 • Cumulative Effect of a 1 Percent Increase in Currency in Circulation on Inflation
Percentage increase in currency in circulation Effect on CPI
1% 0.80%
100% 80%
the price level, annually, which averages about 6.66
percent per month.
References
Christiano, L. J., Eichenbaum, M., & Evans, C. L.
1999. Monetary policy shocks: What have
we learned and to what end?. Handbook of
Macroeconomics, 1, 65–148.
Elliott, G., Rothenberg, T. J., & Stock, J. 1996.
Efficient tests for an autoregressive unit
root. Econometrica, 64(4), 813–36.
Faust, J. (1998). The robustness of identified
VAR conclusions about money. In
FIGuRE 33 • Responses to a 1 Percent Increase in (the Log of) Currency in Circulation from a vECM
Response of log of MO to log of MO
Response of log of CPI to log of MO
Response of log of WBCI to log of MO
0.00 5 10 15 20 25 30 35
0 5 10 15 20 25 30 35
0 5 10 15 20 25 30 35
0.3
0.1
0.2
0.7
0.5
0.6
0.4
0.0
–0.05
0.05
0.30
0.10
0.15
0.20
0.25
–0.35
–0.20
–0.25
–0.10
–0.15
0.00
–0.05
–0.30
0.05

LEBANON ECONOMIC MONITOR: LE NAUFRAGE DU LIBAN (AU NUMÉRO 3)/LEBANON SINKING (TO THE TOP 3)58
Carnegie-Rochester conference series
on public policy (Vol. 49, pp. 207–244).
North-Holland.
Johansen, S. 1988. Statistical analysis of cointegration
vectors. Journal of Economic Dynamics and
Control, 12(2–3), 231–254.
Perron, P. 2006. Dealing with structural breaks.
Palgrave Handbook of Econometrics, 1(2),
278–352.
Lee, J., & Strazicich, M. 2003. Minimum Lagrange
multiplier unit root test with two structural
breaks. Review of Economics and Statistics,
85(4), 1082–1089.
Lumsdaine, R. L., & Papell, D. H. 1997. Multiple trend
breaks and the unit-root hypothesis. Review of
Economics and Statistics, 79(2), 212–218.
Phillips, P. C., & Perron, P. 1988. Testing for a unit root
in time series regression. Biometrika, 75(2),
335–346.
Sims, C. A. 1980. Macroeconomics and reality.
Econometrica 48(1), 1–48.
Zivot, E., & Andrews, D. W. K. 2002. Further evidence
on the great crash, the oil-price shock, and the
unit-root hypothesis. Journal of Business &
Economic Statistics, 20(1), 25–44.
Global Financial Crises Episodes
The Argentinian Banking Crisis of 1980
Prior to 1976, the Argentinian economy contended
with high inflation, balance of payments pressures
and fiscal deficits. Since 1976, and in a bid to address
these chronic imbalances, policymakers undertook
short-term and structural reforms that predominantly
affected the financial sector.
A rapid liberalization of the financial sector
was in full swing in 1977. The central bank gradually
loosened prudential regulations relating to capital
requirements, asset immobilization and limits on bank
lending. It also eased its heavy regulatory oversight
on the establishment of new banks as well as new
branches of existing banks. The changes effectively
transformed the Argentinian banking sector from
a 100 percent to a fractional reserve system. The
central bank, however, was not properly equipped to
supervise a banking sector that grew precipitously.
At the monetary policy level, a crawling peg
system became a main stabilization tool to rein in
inflation; pre-announced devaluations of the Perso was
hoped would reduce uncertainty and guide tradable
prices along international prices (with non-tradables
following). Exchange rate policies “had important
effects on the soundness of the financial system,
directly by influencing the capital flows and the value
of the foreign debt of firms, and indirectly by dramati-
cally changing many relative prices in the economy—in
particular, asset prices” (Balino 1991, pg. 71).
Enterprise indebtedness increased signifi-
cantly, leading to business failures and soaring levels
of NPLs, which increased from 1.7 percent in 1975
to 11.7 percent in 1980 in the primary sector and
from 3 percent in 1975 to 12.8 percent in 1980 in the
manufacturing sector (Balino 1991). The rapid dete-
rioration in the bank-lending portfolio in 1980 spelled
trouble for the banking sector.
The crisis broke on March 18, 1980 with the
failure of Banco Intercambio Regional, one of the
largest private banks in the country. This failure
struck at confidence in the domestic private banking
model, prompting a reallocation of deposits to State
banks and foreign affiliates. Further, the interbank
lending market froze. Despite a retroactive increase
in deposit insurance, uninsured Peso deposits
exceeding 100 million Pesos were lost. Dollar deposi-
tors in failed institutions suffered a complete loss. The
central bank was forced to intervene to rescue three
major banks, two of which were ultimately liquidated
(Balino, 1991).
The adverse developments in the banking
sector strained the crawling peg regime. The
exchange rate devalued by about 23 percent on
June 2 owing to losses in foreign exchange reserves
at the central bank. A two-tiered exchange rate regime
emerged: a commercial rate set by the central bank
and a market determined rate for financial markets.
Confused and inconsistent exchange rate policies
ensued by subsequent governments; first liberaliza-
tion and unification in December 1981, and then the
reintroduction of a dual exchange rate system in July
1982, before unification again in November 1982.
ANNEX 59
In response to the crisis, authorities pursued a
three-pronged solution. “First, they had to take emer-
gency measures to avoid a bank panic; second, they
had to search for longer-term solutions to the private
debt problem and its effects on financial institutions;
and third, they had to find ways to restructure the finan-
cial system.” (Balino 1991, pg. 92). The emergency
measures included liquidating Banco Intercambio
Regional, establishing a new credit facility as well
as retroactively increasing the deposit insurance.
The central bank also intervened with three troubled
banks on April 28, 1980. The authorities addressed
the private debt problems via maturity extensions
and refinancing schemes. Despite the central bank’s
success in stemming the run on deposits, the crisis
had far-reaching consequences and resulted in the
liquidation of 71 financial institutions between 1980
and 1982.
The Philippines Financial Crisis of 1981
The Philippines crisis followed a boom-bust
phenomenon typical of those analyzed in crisis
literature (Nascimento 1991). Over the 1970’s, The
Philippines experienced high growth rates in its real
Gross National Product (GNP). It was a demand-
driven economic boom that reflected an investment-
intensive development strategy by the Government.
In order to finance this boom and attract
foreign capital, The Philippines authorities and the
Central Bank of the Philippines (CBP) embarked
over the 1972–81 period on a liberalization pro-
gram in the financial sector and the capital controls
regime. The authorities and the CBP relaxed
controls on foreign capital, facilitated the entry of
foreign banks and encouraged the establishment
of “universal” banks—commercial banks whose
activities encompass, in addition to retail banking,
securities transaction and investment banking. The
CBP introduced important changes to prudential
regulations by lowering banks’ capital requirement
from 15 percent in 1972 to 6 percent in 1980,
thereby encouraging loose lending practices.
An investment (and credit) boom ensued and the
external debt burden increased from 31.3 percent
of GDP to 48.9 percent in 1980 (Nascimento 1991).
The large capital inflows stoked inflationary
pressures and pushed real lending rates below zero
in 1980, further enticing credit growth and a misal-
location of resources. An overreliance by enterprises
and the nongovernment sector on debt to finance
expansion doubled the outstanding debt between
1972 and 1980 and quadrupled foreign currency
denominated debt. The external imbalances and the
sharp rise in foreign savings as a percent of GDP
made the Philippines economy vulnerable to shocks.
In January 1981, confidence in the financial
system of the Philippines was shaken by fraud in the
commercial paper market—an episode that became
known as the Dewey Dee affair. The confidence crisis
rapidly spread from the periphery of the financial
sector to its core. Rippling through the system, it first
caused a collapse of the commercial paper market,
failures of nonbank money market institutions and
the crash of the two largest investment houses
belonging to two major holding companies, which
also subsequently failed. Wealth holders reacted by
shifting savings to the commercial banking sector.
The loss of confidence consequently afflicted the
thrift banking system and precipitated failures in
rural banks. As the year progressed, it became
readily apparent that the Dewey Dee affair had
lasting effects on public trust in the financial system
as it triggered bank runs, capital flight and a “flight to
quality” towards the (perceived) relative safety of the
commercial banking sector.
In this first phase of the crisis, between 1981
and 1983, authorities’ priority focused on containing
the spread of financial distress. The CBP extended
emergency lending to quasi banks through a special
rediscount facility. An Industrial Fund, co-financed by
Government budget and the CBP, was also estab-
lished and, in early 1982, replaced with a special
rediscount window. The CBP used the rediscount
window to extend medium and long-term loans
to universal banks and to the Government-owned
Philippines National Bank and Development Bank
of the Philippines. These two banks accounted for a
significant share of credit to the private sector. The
Government also provided emergency lending and
equity contributions to nonfinancial public corpora-
tions from 1981 to mid-1983 (Nascimento 1991).
LEBANON ECONOMIC MONITOR: LE NAUFRAGE DU LIBAN (AU NUMÉRO 3)/LEBANON SINKING (TO THE TOP 3)60
However, increasing uncertainty in the political
climate and unfavorable external conditions caused
a balance of payments crisis in the second half of
1983. Faced with these adverse developments, the
Government declared a moratorium on external debt
repayments on October 1983. This renewed the run
on banks and deprived the Philippines from external
financing.
The CBP injected reserve money to meet the
increase in currency demand and provided extensive
monetization of the fiscal deficit. This policy stance
caused inflation to jump from 12 percent in 1983 to
50 percent in 1984, and led to a crowding out of the
private sector. Inflationary pressures and accelerated
depreciation in the Peso in 1983 and 1984 exac-
erbated financial difficulties of the corporates and
increased distress among banking institutions.
The Government extended emergency lending
and equity contributions to Government financial
institutions from 1983 to 1985. The assistance aimed
at financing acquisitions of distressed institutions and
facilitating the conversion of debt owed to Government
financial institutions into equity (Nascimento 1991).
The volume of CBP assistance soared from
3,054 million Pesos in 1981 to 13,549 million Pesos
in 1985 (Nascimento, 1991). The financial crisis,
which erupted in 1981 and lasted until mid-1987,
resulted in a major contraction in the financial system.
In total, the authorities intervened with 128 rural
banks, 32 thrift institutions and 2 private banks. The
Government-owned commercial banks, PNB and
DBP, became practically insolvent in 1986 and their
non-performing assets were transferred to the Asset
Privatization Fund, a special purpose entity created
to manage impaired assets. Between 1985 and 1986,
CBP finally brought inflation under control by main-
taining a tight policy.
The Mexican Debt Crisis of 1981–82
The intrigue and distinction of the Mexican debt crisis
rest with its globally systemic nature that necessitated
a complicated multi-stakeholder coordination and co-
financing mechanism. This mechanism involved, in
addition to Mexican authorities, the US Government,
multilateral organizations, especially the IMF and the
Bank of International Settlement (on behalf of main
central banks), and commercial banks, both large
and small. Significant linkages to the global financial
system implied serious implications of a Mexican
default to its commercial creditors; indeed, this fact
ironically bestowed some leveraged on the Mexican
negotiating position. The role of commercial banks in
this mechanism can be considered as a progenitor of
later participations in crisis resolutions (i.e., Greece,
bail ins etc.).
In 1970s, on prospects of expanded volumes
of oil exports, the Mexican Government borrowed
heavily in foreign currency from commercial markets to
finance a rapid rise in public expenditures (Dornbusch
and Werner 1994; van Wijnbergen 1991). The rise in
expenditures stoked inflationary pressures, caused
an appreciation in the real exchange rate and led to
a rapid accumulation of debt; inflation averaged 20.6
percent over the 1972–1981 period (Dornbusch
and Werner 1994). Meanwhile, the external debt
of the public sector, a significant part of which was
short-term, increased at an annual rate exceeding 30
percent from US$4 billion in 1973 to US$43 billion in
1981 (Boughton 2001).
The Mexican economy faced a significant external
shock as the price of oil, its major export, declined by
65 percent between 1981 and 1986 (Cantu, Park and
Tornell 2015) due to a softening in the demand for oil
(Boughton 2001). The tightening of monetary policy in
the US and Europe—in a bid to combat inflation—in the
late 1970s pushed world interest rates higher than 15
percent (Cantu, Park and Tornell 2015) exacerbating
Mexico’s financing difficulties.
On February 17, 1982, the authorities
announced that the central bank will temporarily
withdraw from the foreign exchange market. The
Peso immediately depreciated by more than 40 per-
cent (Boughton 1991), worsening Mexico’s external
debt servicing prospects. By April 1982, capital flight
accelerated and Mexico’s largest conglomerate,
Alfa Industrial Group, defaulted on debt payments of
US$2.3 billion (Boughton 1991).
On April 20, Mexico’s Minister of Finance,
Silva Herzog, announced a stabilization program that
lowered the fiscal deficit by 3 percent by year-end.
This announcement, however, was insufficient to

ANNEX 61
stem the crisis. Faced with dwindling foreign cur-
rency reserves, the Bank of Mexico drew US$800
million on a swap line with the Federal Reserve. A
large debt repayment was looming in August 1982
and prospects for meeting this obligation appeared
impossible (Oks and van Wijnbergen 1994). In July,
commercial banks expressed increasing reluctance
to roll over their maturing debt or to extend more
funding to Mexico. This caused a widening in spreads
relative to the LIBOR.
Mexico’s political transition, from outgoing
President Lopez Portillo to President-elect Miguel de
La Madrid following presidential elections on July 4,
1982, complicated and increased vagueness around
political consensus on a crisis management strategy.
It was not clear the extent to which Herzog had a
political mandate from his superiors to structure a
strategy and negotiate with the IMF, US and other
counterparts; decisions made in Mexico City contra-
dicted those made by the Mexico negotiating team
(Boughton 1991).
By August, the crisis was in full swing. On
August 4, 1982, the Bank of Mexico drew a three-
month loan of US$700 million on a swap line with the
Federal Reserve. A dual exchange rate system was
announced on August 5 with the aim of restricting
speculative capital flows. At that point, it became
apparent that Mexico’s debt problems could not be
resolved solely via negotiations with commercial
creditors. Instead, on August 12, authorities closed
the foreign exchange market, restricted banks’ for-
eign exchange operations to the Bank of Mexico at
a rate that was less favorable than the market rate,
and paid out dollar-denominated deposits in Pesos.
In addition, commercial creditors, the US Treasury,
and the Federal Reserve were notified that Mexico is
unable to honor the principal debt payment.
The implication of a Mexican default on its
international commercial creditors directly threatened
the global financial system. Faced with that fact, a
concerted, multilateral funding effort was required
to stem the crisis. Such an effort was underway by
August 15. The US Treasury extended a line of credit
of US$1 billion to Mexico, while the US Department of
Agriculture offered credit guarantees of US$1 billion
on August 15. A US$925 million bridge loan by the
Bank of International Settlements was announced on
August 28. The IMF conditioned a Mexico program
on a clear contribution by private creditors, which
involved rolling over the debt and extending further
credit to close a US$ 7 billion funding gap. Once this
was secured, an IMF Extended Fund Facility (EFF) of
US$3.75 billion was announced on December 23.
The Chilean Banking Crisis of 1981
Following the overthrow of the left-leaning,
democratically elected President Salvador Allende by
General Augusto Pinochet on September 11, 1973,
Chile embarked on an intensive market-oriented
liberalization of the economy; indeed, “the dictatorship
that supplanted Allende used its powers to open the
economy and to give market economics as free a rein
as Latin America had ever seen” (Boughton 2001, pg.
346). This developed to be one of the more prominent
macroeconomic liberalization case studies, especially
espoused by free-market proponents.
Prevailing conditions at the time of the coup
included a stagflationary economy with rising
government expenditures, import controls and an
overvaluation of the currency, with black-market rates
that were over 10 times the official rate. Pinochet
handed economic management to the so-called
“Chicago boys”—a group of Chilean economists
educated at the Department of Economics of the
University of Chicago. The economic team, led by
finance minister Sergio de Castro, undertook fiscal
consolidation and structural reforms that succeeded
in raising growth to 7.5 percent. The reform program
was supported by the IMF in January 1974 via a
one-year stand-by arrangement (SBA) of about $95
million as well as a Compensatory Financing Facility
(CFF) that allowed for weathering the effects of export
shortfalls and the 1973 oil supply shock.
The economic team proceeded with the liber-
alization of domestic markets, including the following:
removal of controls on interest rates and credit
growth; lowering of reserve requirements; reduction
of barriers to entry into the banking sector, including
for foreign banks; the privatization of previously
nationalized banks; open access to foreign borrowing
by private banks and businesses. Chile, however,

LEBANON ECONOMIC MONITOR: LE NAUFRAGE DU LIBAN (AU NUMÉRO 3)/LEBANON SINKING (TO THE TOP 3)62
did not adequately adapt and update its supervisory
capabilities and prudential regulations over the
financial sector; “supervision continued to focus on
reviewing compliance with accounting rules and
related regulations, but did not concentrate on the
overall risks affecting the operations of each bank”
(Larrain 1989, page 10).
Starting in 1978, these changes resulted in a
substantial accumulation of foreign currency debt
by the private sector. Buoyed by the high economic
growth, on June 29, 1979, the crawling peg regime
was replaced with a firm peg. The move to a firm peg
aimed at establishing a nominal anchor to counter
stubbornly high inflation rates. Nonetheless, inflation
and inflation expectations continued to be elevated
and the firm peg resulted in a further loss of com-
petitiveness and a widening current account deficit.
Indeed, the current account deficit stood at 18.9
percent of GDP in 1981 (Larrain 1989).
Toward end-1981, domestic and external factors
helped plunge the economy into a recession and made
the debt burden more formidable. Difficulties included
a decline in copper prices, Chile’s main export. Further,
an increase in global interest rates stalled the domestic
credit boom and led to soaring domestic real interest
rates in a bid to stanch capital flight. By year-end, the
current account deficit stood at 15 percent of GDP and
the annual lending rate reached 63 percent (Boughton
2001). This made the servicing of bank loans more
challenging for debtors and forced the central bank to
supply liquidity to the banking sector.
A systemic banking crisis was in full swing by
November 1981 (Laeven and Valencia 2014); eleven
financial institutions were intervened between 1981
and 1982 and eventually liquidated (Larrain 1989).
These institutions accounted for about 14.5 percent
of deposits in the banking sector. The two largest
banks were put into receivership and their assets
were transferred to other institutions. The govern-
ment and shareholders absorbed the losses of the
failed institutions and depositors were compensated.
The pressures on a weakened banking sector
were exacerbated by adverse macroeconomic
developments in 1982 and 1983. Rising fears of
an impending devaluation were met with a cabinet
shuffle on April 11, 1982, aiming at shoring up
confidence. Despite official reaffirmations of the peg,
authorities could not honor this commitment; on June
13, 1982, the Minister of Economy, Luis Francisco
Danus, announced a devaluation in the Peso of about
18 percent vis-à-vis the dollar. Danus also announced
that the Peso would continue to be depreciated at
a fixed rate vis-à-vis a basket of the currencies. The
crawling peg regime subsequently collapsed on
August 5, 1982 causing a run on bank deposits and
forcing the authorities to float the Peso.
The depreciation of the Peso severely ham-
pered firms’ ability to repay or service their foreign
currency debts to the banking sector. Non-performing
loans soared from 2.3 percent in 1981 to 18.4 percent
in 1983. Domestic banks borrowed more in foreign
currencies to honor their obligations to foreign banks.
On January 10, 1983, Chile secured a 24-month
SBA from the IMF in the amount of US$550 million,
and drew an additional US$325 million CFF. This,
however, was insufficient to reverse the spiral. On
January 14, eight financial institutions (seven banks
and one finance company) became insolvent and
required intervention, 3 of which were subsequently
liquidated. A bank holiday was declared. At that stage,
the IMF program was off track.
On March 22, 1983, the new finance minister
announced an emergency economic program, which
consisted of accelerating the Peso’s devaluation, fiscal
measures and the tightening of foreign exchange con-
trols. In addition, a US$1.3 billion funding and public
debt rescheduling package, supplanted with a bridge
loan from the Bank of International Settlements, was
agreed upon with the banks. In light of the agreement
with the banks, the IMF disbursed based on a new
shadow program on July 27.
Efficient and sensible restructuring of the
banking sector and the credit portfolio were critical
for an accelerated recovery. This included bank
re-capitalization and incentives for recouping bad
loans. Further, debt relief was offered to borrowers
who were assessed to be “productive.” These inter-
ventions were expensive; the cost of foreclosure of
insolvent institutions was 10.6 percent of the GDP
and the cost of portfolio purchase under conditions
of repurchase reached 6.7 percent of the GDP
(Sanhueza 2001).

ANNEX 63
The venezuelan Banking Crisis of 1994
In the period preceding Venezuela’s financial crisis,
the country’s banking system was oligopolistic
in nature, composed of a large number of
specialized banks belonging to financial groups
that were ultimately owned by a few individuals. This
concentration encouraged lax supervision, resulting
in low capitalization and incentives to divert losses
and problem loans to offshore branches, which were
subject to even less supervision. This created large off-
balance sheet items for Venezuela’s financial sector,
which was not monitored by authorities. Moreover,
the share of state banks was relatively low compared
to other Latin American economies; as of June 1993,
private banks held about 90 percent of total assets,
with the largest six banks holding 52 percent of the
total (Garcia-Herrero 1997).
The state of the macroeconomy in the 1980s
reflected anemic growth and rising inflation. This
resulted in negative real interest rates causing
disintermediation and capital outflows; in the late
part of the decade, large amounts of deposits were
transferred to banks’ off-shore facilities. In 1989, the
Venezuelan government, in coordination with the IMF,
launched a macroeconomic adjustment program in a
bid to stimulate the economy. The program consisted
of abandoning interest rate controls and shifting to
indirect monetary policy tools, as well as the unifica-
tion and floating of the Bolivar.
Nonetheless, the resurgence of inflationary
pressures led the Venezuelan authorities to rein-
state the peg in 1990. Two coup attempts in 1991
and political instability throughout 1992 aggravated
capital flight and made the economy more vulner-
able. An exchange rate crisis occurred in October
1992 following the loss of about US$1 billion in
reserves (Garcia-Herrero 1997). The Venezuelan
economy depended heavily on oil exports and the
weakening demand for oil in 1993, political uncer-
tainty and loose fiscal policy weighed negatively on
the economic outlook and exerted pressure on the
Bolivar.
Amid these adverse conditions and due to
a significant loss in reserves, the Central Bank of
Venezuela (CBV) tightened monetary policy and
adopted a crawling peg. The rising interest rates
precipitated a recession, reduced bank lending and
led to an increase in non-performing loans from 4 per-
cent in 1991 to 10 percent in 1993 (Garcia-Herrero
1997). Higher interest rates did not curtail the outflow
of deposits to the offshore banking sector. Indeed,
deposits decreased in real terms by 11 percent in
1993 relative to 1991 (Garcia-Herrero 1997) and
banks siphoned their liquidity to their offshore facili-
ties. Despite liquidity injections by the CBV, rumors
concerning the health of the banking sector continued
unabated at end-1993.
The crisis broke with the collapse of Banco
Latino in mid-January of 1994, the second largest
bank in terms of deposits, prompting a run on two
other banks that belonged to the same financial group.
This affected over 10 percent of commercial banks’
deposits. Hence, panic soon spread to other banks.
The Deposit Guarantee Fund reacted by assisting
the distressed banks and the CBV continued to inject
liquidity into the banking sector. The resources of the
Deposit Guarantee Fund were depleted by February
1994 and the foreign currency reserves of the CBV
diminished considerably amid an unrelenting run on
deposits and capital flight.
The authorities responded by passing a law
on March 1994 to protect depositors, nationalizing
Banco Latino and reopening it with withdrawals
limits on deposits that were frozen, even those in
off-balance sheet accounts. The Deposit Guarantee
Fund injected the equivalent of 3.6 percent of GDP
to cover the losses of Banco Latino (Garcia-Herrero
1997).
These actions proved insufficient to shore
up the public’s feeble confidence in the banking
sector. Deposit runs continued in light of fears of
partial deposit freezes, devaluation and exchange
rate controls. When the CBV ceased supplying the
Deposit Guarantee Fund with liquidity in June 1994,
eight distressed financial institutions, accounting for
21 percent of deposits, had to be intervened despite a
massive liquidity injection of 6 percent of GDP by that
date (Garcia-Herrero 1997). In an attempt to restore
confidence in the banking sector, the authorities
established a Financial Emergency Board. However,
the financial distress of the Deposit Guarantee Fund
LEBANON ECONOMIC MONITOR: LE NAUFRAGE DU LIBAN (AU NUMÉRO 3)/LEBANON SINKING (TO THE TOP 3)64
continued to weigh heavily on confidence in the
public sector.
In the following weeks, capital flight led to
a large loss of reserves at the CBV. The authorities
responded by fixing the exchange rate, and insti-
tuting price and exchange rate controls. Rumors
surrounding two large banks—Banco Consolidado
and Banco Venezuela—renewed the deposit run and
the authorities decided to nationalize both banks. In
December, two additional banks—Banco Progreso
and Republica—were in distress. Authorities closed
the former and nationalized the latter. Further,
the liabilities of Banco Progreso were migrated to
the nationalized banks (Banco Latino, Venezuela,
Consolidado and Republica) without a corresponding
transfer of assets (due to large one-sided off-balance
sheet items in the form of deposits that suddenly
appeared), thus placing enormous pressure on the
four banks which continued to experience deposit
withdrawals.
The passage of a Financial Emergency Law
in July 1995, which gave broader powers to the
Financial Emergency Board and eased restrictions
on the liquidation of impaired assets at the Deposit
Guarantee Fund, succeeded in mitigating, but not
completely resolving, the banking crisis. Deposit flight
continued, albeit at a slower rate, and a small bank
was intervened in August 1995.
The Argentinian Financial Crisis of 2001–02
The Argentine Currency Board—via the so-called
Convertibility Law—pegged the Argentine peso to the
U.S. dollar at a parity from March 1991, until its failure
in January 2002 (Spiegel 2002). Argentina adopted
the hard peg in an attempt to eliminate hyperinflation
and stimulate economic growth following a
tumultuous economic performance in the 1980s.
While successful initially, it became a main constraint
on the economy’s competitiveness in general, and
on countercyclical macroeconomic management
in particular. Moreover, there was a large degree
of financial dollarization in the economy with the
banking system functioning mainly in US dollars. The
banking system’s dollar-denominated, short-term
liabilities exceeded its stock of dollar assets—namely
liquidity held by banks and international reserves. As
the system lacked a lender of last resort in dollars, the
financial system was inherently unstable, subject to
bank runs (Kiguel 2016).
In the period just prior to the abandonment
of the currency board (1998–2001), the economy
witnessed a deep contraction, exposing mounting
vulnerabilities in the economy. The hard peg and
a lack of fiscal space precluded countercyclical
macroeconomic measures. In response, in January
2001, the IMF approved an augmentation of
financing, boosting an existing SBA program, to
an equivalent of US$14 billion, centered on fiscal
adjustment and accelerated structural reforms
(IMF 2003). However, this failed to achieve stability.
So did various attempts by the Government for
voluntary debt arrangements. The IMF approved a
new program, disbursing US$5 billion immediately
and pledging another US$3 billion in support of
prospective debt restructuring.
The crisis broke with a run on private deposits,
which fell by more than US$3.6 billion (6 percent of the
deposit base) over November 28–30, 2001. The authori-
ties responded with a wide range of controls on banking
and foreign exchange transactions. As the economy
faltered, social and political unrest ensued, forcing the
resignation of President de La Rua on December 20,
followed by 4 other (Congress-appointed) Presidents
within 3 weeks. On December 23, President Sáa
declared a default on Government debt; on January
3, 2002, President Duhalde announced the end of the
convertibility regime (IMF 2003).
The uruguayan Banking Crisis of 2002
On the eve of the crisis, Uruguay’s banking sector,
which consisted of two large public banks—Banco
de la Republica Oriental del Uruguay and Banco
Hipotecario del Uruguay—and approximately thirty
private banks, was widely regarded as sound and
healthy (de la Plaza and Sirtaine 2005). The banking
sector, however, was highly dollarized on the asset
and liability sides and, although not as highly exposed
to the sovereign as its neighbors, it was prone to
external shocks and to cross-border bank runs due
to its exposure to Argentina. On the liabilities side,

ANNEX 65
foreign currency deposits constituted 90 percent of
total deposits in the system, with the latter amounting
to US$ 15.4 billion (representing 83 percent of
Uruguay’s 2001 GDP). Further, 47 percent of foreign
currency deposits were held by non-residents. The
dollarization of assets reached 75 percent of the total
loan book of the system, with the latter amounting to
US$ 11.5 billion. The banking sector also suffered
from currency mismatches as 71 percent of foreign
currency loans were extended to residents, the vast
majority of who earned in Pesos (de la Plaza and
Sirtaine 2005, pg. 4–5).
A weakening macroeconomic environment
weighed on banks’ profitability. Uruguay had
experienced a prolonged recession since 1999
and recurrent fiscal deficits were financed by
issuing mostly foreign currency denominated debt.
Government debt increased from 38 percent of
GDP 1998 to 58 percent of GDP in 2001. The fixed
exchange rate regime (Roubini and Sester 2004),
which weakened external competitiveness, became
untenable with devaluations in the currencies of
Uruguay’s two largest neighbors and trading partners,
Brazil and Argentina, in 1999 and 2001, respectively.
In the lead up to the banking crisis, the Uruguayan
economy was characterized by a high level of foreign
currency indebtedness and a significantly overvalued
exchange rate vis-à-vis its major trading partners and
the rest of the world.
The crisis broke in December 2001 when
Argentina imposed deposit freezes (“el corralito”).
Two of Uruguay’s largest private banks—Banco Galicia
Uruguay (a subsidiary of an Argentinian bank) and
Banco Commercial—which combined accounted for
around 20 percent of the deposit base, came under
intense pressure due to their exposure to Argentinian
depositors and debt. Deposit withdrawals continued
unabated as the crisis in Argentina deepened.
By March 2002, deposit withdrawals, mostly
by non-residents (i.e., Argentinians), amounted to 12
percent of the deposit base (de la Plaza and Sirtaine
2005). Argentina’s tightening of its deposit freeze in
February 2002 (“El Corralon”) as well as Uruguay’s
downgrade from investment grade prompted a
second wave of withdrawals by residents and non-
residents totaling 18 percent of deposits in April and
May of 2002. The deposit withdrawals, which were
no longer confined to specific banks, accelerated
in May and June of 2002. On June 21, 2002, Banco
de Monteviedo-Caja Obrera, the third largest private
bank experienced severe liquidity shortages causing
the authorities to intervene. As sentiment deteriorated
further in July 2002 and government spreads widened,
the bank run extended to local currency deposits. By
the end of July 2002, a cumulative 38 percent of total
deposits had been withdrawn from the system. The
majority of banks had become technically insolvent
(de la Plaza and Sirtaine 2005, pg. 11).
Faced with declining foreign currency reserves
due to liquidity support to the banking sector, the
authorities were forced to abandon the crawling peg.
As a result, the Peso immediately depreciated by 27
percent forcing the authorities to declare a five-day
banking holiday on July 30, 2002; by then, the Peso
had lost 57 percent of its value.
The bank run had turned into a system-wide
credit crunch; credit to the non-financial sector
shrunk by 37 percent in 2002, greatly contributing to
a GDP contraction of 10.7 percent for that same year
(de la Plaza and Sirtaine 2005, pg. 11). The two public
banks were in a perilous position. The Banco Galicia
Uruguay had been suspended and the government
took control of the Banco Commercial and Banco de
Montevideo-Caja Obrera.
In the first stage, the authorities’ response to
the crisis consisted of: provision of ample liquidity
support via already established lender of last resort
facilities; the restructuring and/or liquidation of
troubled institutions; and the expansion of the
crawling exchange rate band from 6 to 12 percent.
While this response appeared to stem cross-border
bank run, the deepening of the crisis in June and July
2002 compelled the authorities to scale up and better
target their response.
The central bank of Uruguay subsequently
prioritized liquidity support to core banks, which
played an instrumental role in the payment system;
non-core banks, which were mostly Uruguayan
branches of foreign banks, were to rely on liquidity
support from their headquarters abroad. In light of the
central bank’s diminishing scope to act as a lender of
last resort, the authorities established in June 2002 a

LEBANON ECONOMIC MONITOR: LE NAUFRAGE DU LIBAN (AU NUMÉRO 3)/LEBANON SINKING (TO THE TOP 3)66
US$2.5 billion facility, the Fondo para la Fortificacion
del Sistema Bancario (FFSB), to provide equity and
liquidity support to the core banks. The FFSB was
funded by an augmentation of the SBA with the IMF,
other multinational institutions and the government.
The FFSB ultimately proved to be insufficient
and was suspended. Following the five-day bank
holiday that was declared on July 30, the authorities
announced on August 5, 2002 the creation of US$1.4
billion stabilization fund, the Fund for the Stability of the
Banking System (FSBS), that was funded by the IMF,
the World Bank and the Inter-American Development
Bank (IADB). The FSBS was sufficient to fully back the
remaining US$ deposits at core banks (Seeling 2007;
de la Plaza and Sirtaine 2005). The establishment of
the FSBS, coupled with maturity extensions of dollar
deposits in the public banks and changes to macropru-
dential regulations, succeeded in stopping the bank
run. The IMF’s exposure (of US$1.3 billion) to Uruguay,
relative to GDP, was its largest to date (Seeling 2007).
The Greek Financial Crisis 2009
Greece’s accession to the European Monetary Union
(EMU) in 2001 did not correct structural imbalances
that included large internal and external deficits
coupled with a low growth environment. Public sector
net borrowing averaged around 7 percent of GDP
annually in the Euro-but-pre-crisis period (2002–
2008), compared to 6.7 percent in the pre-Euro
period (1994–2000). Public debt remained relatively
stable over the former period fluctuating between
100 and 110 percent of GDP. Externally, the current
account deficit rose from a pre-Euro average of 3.3
percent of GDP to Euro-pre-crisis average of 10.5
percent. Moreover, external debt also rose decidedly
from about 100 percent of GDP end-2003, to 133
percent by end-2008. Clearly, the EMU facilitated
easier access to foreign financing for both the public
as well as the private sectors; by 2009, private sector
external debt stood at 175 percent of GDP (IMF
2017a). The adoption of the Euro also adversely
affected the Greek economy’s competitiveness
relative to its trading partners, given that wages in
the European periphery countries rose relative to the
core countries (Hale 2013). Hence, on the eve of the
crisis, Greece was gripped with deep twin structural
deficits, lack of competitiveness as wage growth
outpaced productivity growth and a real exchange
rate overvaluation (IMF 2012a).
The onset of the global financial crisis exacer-
bated the mounting imbalances of the Greek economy.
After the failure of Lehman brothers in September
2008, the spread between the Greek Government
bonds and the German bunds soared to 100 basis
points (IMF 2013) and led to downgrades by Standard
and Poor’s. A main trigger to the Greek episode was
data revision by the authorities in October 2009, which
entailed a sizeable increase in the projected fiscal
deficit from 4 to 12.5 percent of GDP.92 This roiled
markets further, weakened confidence in the Greek
economy and prompted a downgrade by Fitch (IMF
2013). The loss of confidence in the Greek economy
prompted capital outflows from the banking sector
estimated at 30 percent of the deposit base. It also
suspended Greece’s access to financial markets by
significantly widening yields on Greek bonds to unaf-
fordable rates.
Given that Greece is an EMU member, a
nominal currency devaluation that corrects the built-
up imbalances was not possible. Instead, under the
Troika of the IMF, the European Commission and the
European Central Bank (ECB), Greece underwent a
very sharp internal devaluation, including a reduction
in the wage bill and pension benefits. A deep reces-
sion ensued over the next decade.
In return, the Greek authorities secured a €30
billion SBA from the IMF in May 2010, complemented
with a cooperative package of financing from the
European Union amounting to €110 billion (IMF,
2012b). The SBA was underpinned by a stringent
fiscal consolidation program that aimed at putting
Greek debt on sustainable footing. However, key
SBA macro-fiscal targets, namely, fiscal and current
account indicators, failed to be met. The SBA was
subsequently cancelled in 2012 and was replaced
with an Extended Fund Facility (EFF) arrangement
92 The data revision came amidst concerns raised by Eurostat—the statistical office of the European Commission—regarding the quality of Greece’s fiscal data on five occasions over the period 2005–2009.

ANNEX 67
on March 15, 2012, also under the Troika. The EFF
arrangement included financing of about €173 billion
over four years.
Critically, and as a prior action for the EFF, a
Private Sector Initiative (PSI) was announced on June
2011 for a voluntary debt swap of Greek sovereign
bonds involving a haircut on private creditors who
were represented by the Institute of International
Finance. This haircut, which was subsequently imple-
mented on March 2012, was equivalent to a 53.5
percent cut in the face value (principal) of the bonds,
corresponding to an approximately €107 billion
reduction in Greece’s debt stock.93
The internal adjustment proved harsh and
counter-productive, as macro-fiscal targets remained
elusive due to unaccounted for economic contrac-
tions and an unsustainable public debt that persisted
despite the PSI. This translated into social pain and
political instability. A banking sector crisis ensued
in 2015, which required the introduction of capital
controls. Once again, the EFF program faltered
and was eventually cancelled in January 2016 (IMF
2017a). The prolonged economic contraction helped
drive the debt-to-GDP ratio to a peak of 180 percent
of GDP in 2016. In July 2017, the IMF approved a
precautionary €1.6 billion SBA for Greece (IMF
2017b). This time the program explicitly noted that,
without debt relief, Greece’s debt would continue to
be unsustainable.
References
Balino, T. J., T. 1991. The Argentine Banking Crisis
of 1980. In Banking Crises: Cases and Issues,
edited by V. Sundararajan and Tomâs J. T. Balino,
International Monetary Fund, Washington DC.
Boughton, J. 2001. The Crisis Erupts. In Silent
Revolution: The International Monetary Fund,
International Monetary Fund, Washington DC .
Boughton, J. 2001. The Mexican Crisis: No
Mountain Too High?. In Silent Revolution: The
International Monetary Fund, International
Monetary Fund, Washington DC .
Cantu, C., Park, K .Y., and Tornell, A. 2015. Lessons
from the 1982 Mexican Debt Crisis for Greece.
VoxEU, CEPR, retrieved from Lessons from the
1982 Mexican Debt Crisis for Greece | VOX,
CEPR Policy Portal (voxeu .org) .
de la Plaza, L. and Sirtaine, S. 2005. An Analysis of the
2002 Uruguayan Banking Crisis, World Bank
Policy Research Working Paper 3780, World
Bank, Washington DC.
Dornbusch, R., Werner, A. 1994. Mexico: stabilization,
reform, and no growth. Brookings Papers on
Economic Activity, 253–315.
Garcia-Herrero, A. 1997. Banking crises in Latin
America in the 1990s: Lessons from Argentina,
Paraguay, and Venezuela. IMF working paper
WP/97/140, International Monetary Fund,
Washington DC.
Hale, G. 2013. Balance of Payments in the European
Periphery, Federal Reserve Bank of San
Francisco Economic Letter.
IMF 2003. Lessons from Argentina, Washington DC,
October 2003.
IMF 2012a. Greece: Request for Extended
Arrangement Under the Extended Fund
Facility, Washington DC.
IMF 2012b. Press Release: IMF Executive Board
Approves €30 Billion Stand-By Arrangement
for Greece.
IMF 2013. Greece: Ex-Post Evaluation of Exceptional
Access Under the 2010 Stand-By Arrangement,
Washington DC.
IMF 2017a. Greece: Ex-Post Evaluation of Exceptional
Access Under the 2012 Extended Arrangement,
Washington DC.
IMF 2017b. Greece: Request for Stand-By
Arrangement, Washington DC.
Kiguel, Miguel 2016. Argentina’s 2001 Economic
and Financial Crisis: Lessons for Europe,
Brookings, June 2016.
Laeven, L., and Valencia, F. 2014. Systemic
Banking Crises. In Financial Crises: Causes,
Consequences and Policy Responses, edited
by Stijn Claessens, M. Ayhan Kose, Luc Laeven
93 The European Stability Mechanism: https://www.esm.europa.eu/content/what-was-private-sector-debt-restructuring-march-2012#:~:text=Also%20known%20as%20the%20PSI,lighten%20Greece’s%20overall%20debt%20burden.
LEBANON ECONOMIC MONITOR: LE NAUFRAGE DU LIBAN (AU NUMÉRO 3)/LEBANON SINKING (TO THE TOP 3)68
and Fabian Valencia, International Monetary
Fund, Washington DC.
Larrain, M. 1989. How the 1981–1983 Chilean
Banking Crisis was Handled, Working Paper
WPS 300, World Bank, Washington DC.
Nascimento, J. C. 1991. Crisis in the Financial Sector
and the Authorities’ Reaction: The Philippines.
In Banking Crises: Cases and Issues, edited
by V. Sundararajan and Tomâs J. T. Balino,
International Monetary Fund, Washington DC.
Oks, D., and S van Wijnbergen 1994. Mexico after the
debt crisis: is growth sustainable?, World Bank
Policy Research Working Paper, WPS 1378.
Roubini, N., & Setser, B. 2004. Bailouts or bail-ins?:
responding to financial crises in emerging
economies. Peterson Institute.
Sanhueza, G. I. 2001. Chilean Banking Crisis of the
1980s: Solutions and Estimations of the Costs.
Central Bank of Chile Working Paper No 104.
Seeling, S. 2007. Resolving the Banking Crisis in
Uruguay. In Building Monetary and Financial
Systems: Case Studies in Technical Assistance
edited by Charles Enoch, Karl Habermeier and
Marta Castello-Branco, International Monetary
Fund, Washington DC.
Spiegel, Mark 2002. Argentina’s currency crisis:
lessons for Asia, Federal Reserve Bank of San
Francisco, December 2002.
Van Wijnbergen, S. 1991. Mexico and the Brady plan
Economic Policy, 6 (12), 14–56.


1818 H Street, NWWashington, DC 20433