application of dinsar technique for post-earthquake land
TRANSCRIPT
SCIENTIFIC CORRESPONDENCE
CURRENT SCIENCE, VOL. 110, NO. 3, 10 FEBRUARY 2016 302
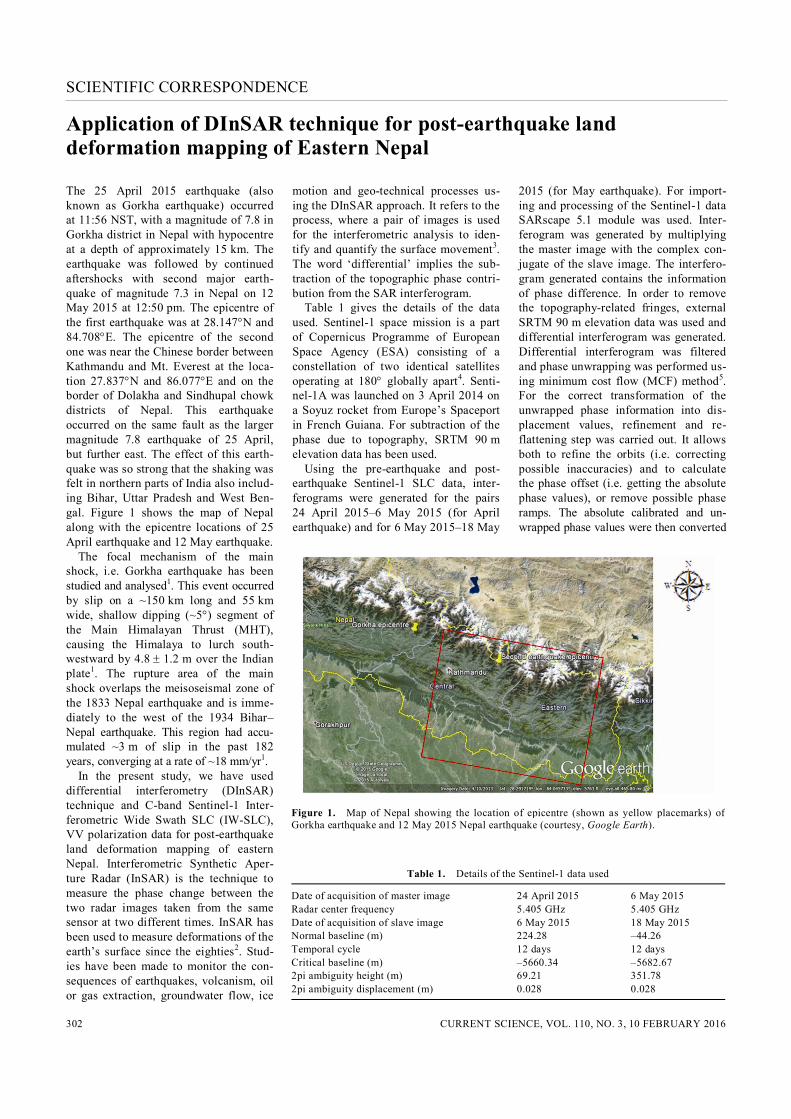
Application of DInSAR technique for post-earthquake land deformation mapping of Eastern Nepal The 25 April 2015 earthquake (also known as Gorkha earthquake) occurred at 11:56 NST, with a magnitude of 7.8 in Gorkha district in Nepal with hypocentre at a depth of approximately 15 km. The earthquake was followed by continued aftershocks with second major earth-quake of magnitude 7.3 in Nepal on 12 May 2015 at 12:50 pm. The epicentre of the first earthquake was at 28.147N and 84.708E. The epicentre of the second one was near the Chinese border between Kathmandu and Mt. Everest at the loca-tion 27.837N and 86.077E and on the border of Dolakha and Sindhupal chowk districts of Nepal. This earthquake occurred on the same fault as the larger magnitude 7.8 earthquake of 25 April, but further east. The effect of this earth-quake was so strong that the shaking was felt in northern parts of India also includ-ing Bihar, Uttar Pradesh and West Ben-gal. Figure 1 shows the map of Nepal along with the epicentre locations of 25 April earthquake and 12 May earthquake. The focal mechanism of the main shock, i.e. Gorkha earthquake has been studied and analysed1. This event occurred by slip on a ~150 km long and 55 km wide, shallow dipping (~5) segment of the Main Himalayan Thrust (MHT), causing the Himalaya to lurch south-westward by 4.8 1.2 m over the Indian plate1. The rupture area of the main shock overlaps the meisoseismal zone of the 1833 Nepal earthquake and is imme-diately to the west of the 1934 Bihar–Nepal earthquake. This region had accu-mulated ~3 m of slip in the past 182 years, converging at a rate of ~18 mm/yr1. In the present study, we have used differential interferometry (DInSAR) technique and C-band Sentinel-1 Inter-ferometric Wide Swath SLC (IW-SLC), VV polarization data for post-earthquake land deformation mapping of eastern Nepal. Interferometric Synthetic Aper-ture Radar (InSAR) is the technique to measure the phase change between the two radar images taken from the same sensor at two different times. InSAR has been used to measure deformations of the earth’s surface since the eighties2. Stud-ies have been made to monitor the con-sequences of earthquakes, volcanism, oil or gas extraction, groundwater flow, ice
motion and geo-technical processes us-ing the DInSAR approach. It refers to the process, where a pair of images is used for the interferometric analysis to iden-tify and quantify the surface movement3. The word ‘differential’ implies the sub-traction of the topographic phase contri-bution from the SAR interferogram. Table 1 gives the details of the data used. Sentinel-1 space mission is a part of Copernicus Programme of European Space Agency (ESA) consisting of a constellation of two identical satellites operating at 180 globally apart4. Senti-nel-1A was launched on 3 April 2014 on a Soyuz rocket from Europe’s Spaceport in French Guiana. For subtraction of the phase due to topography, SRTM 90 m elevation data has been used. Using the pre-earthquake and post-earthquake Sentinel-1 SLC data, inter-ferograms were generated for the pairs 24 April 2015–6 May 2015 (for April earthquake) and for 6 May 2015–18 May
2015 (for May earthquake). For import-ing and processing of the Sentinel-1 data SARscape 5.1 module was used. Inter-ferogram was generated by multiplying the master image with the complex con-jugate of the slave image. The interfero-gram generated contains the information of phase difference. In order to remove the topography-related fringes, external SRTM 90 m elevation data was used and differential interferogram was generated. Differential interferogram was filtered and phase unwrapping was performed us-ing minimum cost flow (MCF) method5. For the correct transformation of the unwrapped phase information into dis-placement values, refinement and re-flattening step was carried out. It allows both to refine the orbits (i.e. correcting possible inaccuracies) and to calculate the phase offset (i.e. getting the absolute phase values), or remove possible phase ramps. The absolute calibrated and un-wrapped phase values were then converted
Figure 1. Map of Nepal showing the location of epicentre (shown as yellow placemarks) of Gorkha earthquake and 12 May 2015 Nepal earthquake (courtesy, Google Earth).
Table 1. Details of the Sentinel-1 data used
Date of acquisition of master image 24 April 2015 6 May 2015 Radar center frequency 5.405 GHz 5.405 GHz Date of acquisition of slave image 6 May 2015 18 May 2015 Normal baseline (m) 224.28 –44.26 Temporal cycle 12 days 12 days Critical baseline (m) –5660.34 –5682.67 2pi ambiguity height (m) 69.21 351.78 2pi ambiguity displacement (m) 0.028 0.028
SCIENTIFIC CORRESPONDENCE
CURRENT SCIENCE, VOL. 110, NO. 3, 10 FEBRUARY 2016 303
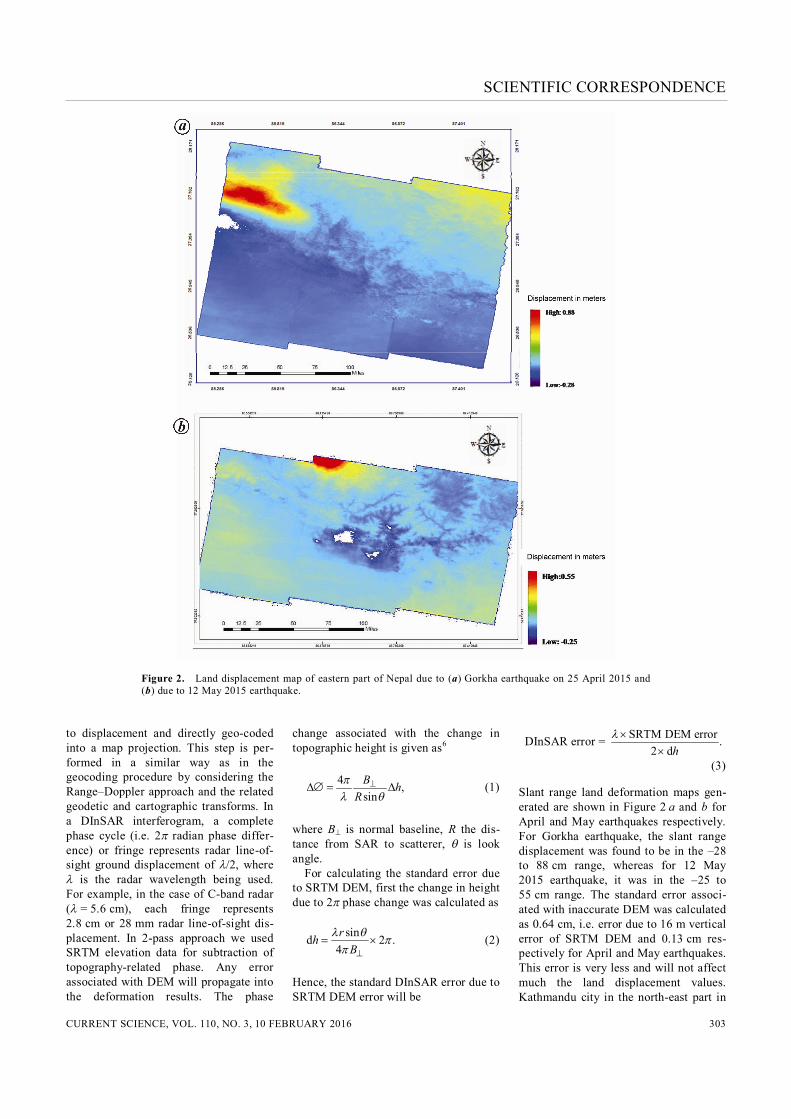
Figure 2. Land displacement map of eastern part of Nepal due to (a) Gorkha earthquake on 25 April 2015 and (b) due to 12 May 2015 earthquake.
to displacement and directly geo-coded into a map projection. This step is per-formed in a similar way as in the geocoding procedure by considering the Range–Doppler approach and the related geodetic and cartographic transforms. In a DInSAR interferogram, a complete phase cycle (i.e. 2 radian phase differ-ence) or fringe represents radar line-of-sight ground displacement of /2, where is the radar wavelength being used. For example, in the case of C-band radar ( = 5.6 cm), each fringe represents 2.8 cm or 28 mm radar line-of-sight dis-placement. In 2-pass approach we used SRTM elevation data for subtraction of topography-related phase. Any error associated with DEM will propagate into the deformation results. The phase
change associated with the change in topographic height is given as6
4 ,sinB h
R
(1)
where B is normal baseline, R the dis-tance from SAR to scatterer, is look angle. For calculating the standard error due to SRTM DEM, first the change in height due to 2 phase change was calculated as
sind 2 .4rh
B
(2)
Hence, the standard DInSAR error due to SRTM DEM error will be
DInSAR error = SRTM DEM error .2 dh
(3) Slant range land deformation maps gen-erated are shown in Figure 2 a and b for April and May earthquakes respectively. For Gorkha earthquake, the slant range displacement was found to be in the –28 to 88 cm range, whereas for 12 May 2015 earthquake, it was in the –25 to 55 cm range. The standard error associ-ated with inaccurate DEM was calculated as 0.64 cm, i.e. error due to 16 m vertical error of SRTM DEM and 0.13 cm res-pectively for April and May earthquakes. This error is very less and will not affect much the land displacement values. Kathmandu city in the north-east part in
SCIENTIFIC CORRESPONDENCE
CURRENT SCIENCE, VOL. 110, NO. 3, 10 FEBRUARY 2016 304
Figure 2 a shows uplift (red colour), whereas in Figure 2 the uplift is seen in the northern part of the displacement map which is near to the epicentre of May earthquake. The subsidence is shown by blue colour in both the maps. The results are in accordance to the re-sults reported by the European Space Agency’s ‘SEOM programme-InSAR ap project’ team and Advanced Rapid Imag-ing and Analysis (ARIA) team at JPL and Caltech7,8.
1. Mitra, S., Paul, H., Ajay Kumar, Singh, S. K., Dey, S. and Powali, D., Curr. Sci., 2015, 108(10), 1938–1943.
2. Gabriel, A. K., Goldstein, R. M. and Zebker, H. A., J. Geophys. Res., 1989, 94(B7), 9183–9191.
3. Hanssen, R. F., Data Interpretation and Error Analysis, Kluwer Academic, Dordrecht, 2001.
4. https://sentinel.esa.int/web/sentinel/user-guides/sentinel-1-sar (last accessed on 21 May 2015).
5. Costantini, M., IEEE Trans. Geosci. Re-mote Sens., 1998, 36(3), 813–821.
6. Bamler, R. and Hartl, P., Inverse Prob-lems, 1998, 14, R1–R54.
7. http://insarap.org (last accessed on 26 Sep-tember 2015).
8. http://aria.jpl.nasa.gov/case_studies (last accessed on 26 September 2015).
ACKNOWLEDGEMENTS. We thank Sri Tapan Misra, Director SAC for his encour-agement; P. K. Pal (Deputy Director), Dr B. S. Gohil (Group Director, ADVG EPSA, SAC, ISRO) for their constant support. We also thank European Space agency (ESA) for
providing Sentinel-1 data of Nepal and the SARMAP team for providing evaluation ver-sion of SARscape 5.1. Received 4 August 2015; revised accepted 9 October 2015
SHWETA SHARMA1,2,*
Y. S. RAO2 AJAI1
A. K. MATHUR1
1Space Applications Centre (ISRO), Ahmedabad 380 058, India 2Indian Institute of Technology Bombay, Mumbai 400 076, India *For correspondence. e-mail: [email protected]
Secondary craters detection from Mini-SAR for lunar surface age dating Counting of crater is a widely accepted method for estimation of geologic age where there is no returned lunar sample. For lunar landing site, cratering chrono-logy and cratering rate decay are inter-preted by the empirical relationship established by plotting crater frequency versus radiometric age1. Surface age is determined by the observed crater size frequency distribution (CSFD) of a unit area to the production function (PF) and using the crater frequency together with a calibrated chronology function (CF). Impact craters are taken into account for dating using the crater diameter to its frequency present in an area. Impact cra-ters result from interplanetary bombard-ment on the lunar surface. Lunar craters created by impact are labelled into pri-mary and secondary craters. Primary impact craters are formed by direct meteoritic bombardment on the lunar surface. Secondary craters are formed from ejecta emitted from the primary crater. Surface age dating by CSFD tech-nique has been used in high spatial reso-lution optical remote sensing datasets like the Terrain Mapping Camera (TMC)2. However, certain anomalies like secondary craters affecting the age de-termination are more readily detected in radar datasets rather than optical dataset.
The ability of Mini-SAR to detect secon-dary craters and differentiate them from primary craters is because of the capabi-lity to utilize the polarimetric radar sig-natures. Mini-SAR uses S-band (12.6 cm wavelength) to probe the far side, polar regions and particularly, the permanently shadowed region of the lunar surface. Mini-SAR contains two intensity images in H and V and two cross-power intensity images between the H and V exhibiting hybrid-polarity SAR where the transmit-ted field is circularly polarized, and the resulting backscatter is received in two mutually coherent linear polarizations3. The hybrid-polarity approach utilizes the polarized properties of the backscattered fields which are characterized as Stokes parameter4. The four channels of Mini-SAR were converted to Stokes parame-ters to generate the various daughter by-products to study the surface proper-ties for detecting the secondary craters. The daughter by-products were noisy because of speckle; the image quality was improved by applying statistical filter followed by adaptive filters. MNF transformation was applied to the filtered images for reducing their coherent dimensionality and noise from the pro-ducts. For surface dating, homogenous
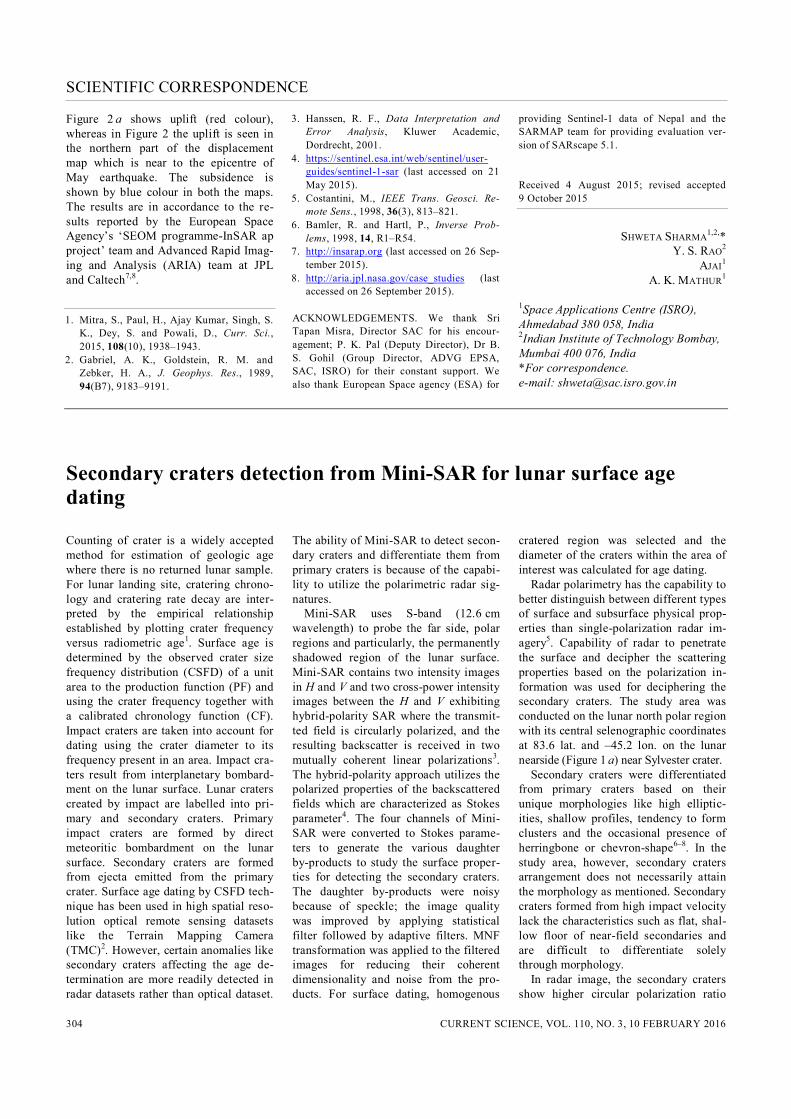
cratered region was selected and the diameter of the craters within the area of interest was calculated for age dating. Radar polarimetry has the capability to better distinguish between different types of surface and subsurface physical prop-erties than single-polarization radar im-agery5. Capability of radar to penetrate the surface and decipher the scattering properties based on the polarization in-formation was used for deciphering the secondary craters. The study area was conducted on the lunar north polar region with its central selenographic coordinates at 83.6 lat. and –45.2 lon. on the lunar nearside (Figure 1 a) near Sylvester crater. Secondary craters were differentiated from primary craters based on their unique morphologies like high elliptic-ities, shallow profiles, tendency to form clusters and the occasional presence of herringbone or chevron-shape6–8. In the study area, however, secondary craters arrangement does not necessarily attain the morphology as mentioned. Secondary craters formed from high impact velocity lack the characteristics such as flat, shal-low floor of near-field secondaries and are difficult to differentiate solely through morphology. In radar image, the secondary craters show higher circular polarization ratio