appendix o - air analysis i-94 maple grove aq study
TRANSCRIPT

I-94 Unbonded Overlay
DRAFT AIR QUALITY STUDY
Rogers to Maple Grove
I-94 Unbonded Overlay
SP 2780-97
Rogers to Maple Grove, MINNESOTA
Prepared for
Minnesota Department of Transportation
November 2018

I-94 Unbonde d Ov e rlay Draft Air Quality Study Rogers to Maple Grove , MN
i
Minnesota Department of Transportation
Air Quality Study
TABLE OF CONTENTS Table of Contents .......................................................................................................................... i
1.0 Transportation Air Quality Analysis ........................................................................................ 2
Introduction .......................................................................................................... 2
General Project Description..................................................................................... 2
2.0 Criteria Air Pollutant Analysis................................................................................................ 4
Ozone .................................................................................................................. 4
Particulate Matter .................................................................................................. 4
Nitrogen Dioxide (Nitrogen Oxides) ......................................................................... 5
Sulfur Dioxide....................................................................................................... 7
Lead .................................................................................................................... 8
Carbon Monoxide.................................................................................................. 8
3.0 Air Quality Conformity.........................................................................................................9
Hot-Spot Analysis.................................................................................................10
4.0 Mobile Source Air Toxics (MSAT) Analysis .......................................................................... 11
Background .........................................................................................................11
MSAT Research...................................................................................................13
Consideration of MSAT in NEPA Documents...........................................................13
Quantitative MSAT Analysis ..................................................................................14
MSAT Analysis Results.........................................................................................15
Incomplete or Unavailable Information for Project-Specific MSAT Health Impacts ........17
Conclusions .........................................................................................................19
Construction-Period Strategies................................................................................19
5.0 REFERENCES .................................................................................................................. 20
Figure 1– Project Location Overview............................................................................................... 3
Figure 2– Annual Average NO2 Concentrations Compared to the NAAQS, 2016....................................6
Figure 3– 1-hour NO2 Concentrations Compared to the NAAQS, 2014-2016.........................................6
Figure 4– 1-hour SO2 Concentrations Compared to the NAAQS, 2014-2016..........................................8
Figure 5– National MSAT Emission Trends 2010-2050.................................................................... 12
Figure 6– I-94 UBOL Annual VMT for the Affected Transportation Network...................................... 15
Figure 7– I-94 UBOL Annual Total MSAT Emissions for the Affected Transportation Network............. 16
Table 1–I-94 Maple Grove, MN MSAT Analysis for the Affected Transportation Network.................... 17

I-94 Unbonde d Ov e rlay Draft Air Quality Study 2 Rogers to Maple Grove , MN Minnesota Department of Transportation – Air Quality Study
1.0 TRANSPORTATION AIR QUALITY ANALYSIS
Introduction
The Minnesota Department of Transportation (MnDOT) is proposing modifications to Interstate
94 (I-94) from Rogers to Maple Grove in Hennepin County.
Motorized vehicles affect air quality by emitting airborne pollutants. Changes in traffic volumes, travel patterns, and roadway locations affect air quality as the number of vehicles and congestion
levels in a given area change. The adverse impacts this project could have on air quality have
been analyzed by addressing criteria air pollutants, a group of common air pollutants that are
regulated by the U.S. Environmental Protection Agency (EPA) on the basis of specific criteria
that reflect the effects of pollution on public health and the environment. The criteria air
pollutants identified by the EPA are ozone, particulate matter, carbon monoxide, nitrogen dioxide, lead, and sulfur dioxide. Potential impacts resulting from these pollutants are assessed by
comparing the project’s projected concentrations to National Ambient Air Quality Standards (NAAQS).
In addition to the criteria air pollutants, the EPA also regulates a category of pollutants knowns as
air toxics, which are generated by emissions from mobile sources. The Federal Highway
Administration (FHWA) provides guidance for the assessment of Mobile Source Air Toxic
(MSAT) effects for transportation projects in the National Environmental Policy Act (NEPA) process. A quantitative evaluation of MSATs has been performed for this project, as documented
below. The scope and methods of the analysis performed were developed in collaboration with
the Minnesota Department of Transportation (MnDOT), the Minnesota Pollution Control Agency
(MPCA), and the FHWA.
General Project Description
The I-94 Unbonded Overlay (UBOL) Resurfacing and Brockton Interchange Project (the project)
will resurface 9.6 miles of the existing pavement on I-94 between the I-494/I-694 interchange in
Maple Grove to Rogers, MN. Resurfacing will be accomplished by placing an unbonded concrete
overlay over the existing concrete traffic lanes and over the existing bituminous shoulders. The project also includes the construction of a new interchange to the east of Brockton Lane in the
City of Dayton. The new interchange will be a four-lane diverging diamond interchange and
include intersection improvements at Brockton Lane on the west and CSAH 81 on the east.
Finally, the project will also involve the addition of a new travel lane in both the westbound and
eastbound directions of I-94 from TH 610 to TH 101. To accommodate the addition of the eastbound travel lane near TH 101, an additional lane will be added on eastbound I-94 from the
end of the exit ramp to TH 101 to the end of the entrance ramp from TH 101.
Other portions of the project include repaving and expanding the truck parking capacity at the Elm Creek Rest Area in Maple Grove; modifying trails and sidewalks within the MnDOT right of
way to make them ADA compliant; replacing deficient storm water management systems; and
constructing a commercial vehicle enforcement lane in the westbound direction between CSAH
81 and TH 101 in the City of Rogers. Figure 1 provides an overview of the project location.

Docu
ment
Path:
N:\6
1509
-I-9
4 Map
le Gr
ove M
N\GI
S\MX
D\Re
ceive
rMap
_Ove
rview
_091
218.m
xd
Autho
r: Je
nnife
r Ryb
arczy
k, HN
TB Co
rporat
ion
Date:
11/27
/2018
0 1
Miles 1 inch = 2 miles
I-94 UBOL Project Area
rn, DEPARTM IENT OF
TRANSPORTATION
... HNT& WSB
MSAT Study Area
Figure 1 - MSAT Study Area I-94 UBOL Resurfacing Maple Grove to Rogers and Brockton Interchange S.P. 2780-97 MnDOT and City of Dayton, Minnesota ¯

I-94 Unbonde d Ov e rlay Draft Air Quality Study 4 Rogers to Maple Grove , MN Minnesota Department of Transportation – Air Quality Study
2.0 CRITERIA AIR POLLUTANT ANALYSIS
Ozone
Ground-level ozone is a primary constituent of smog and is a pollution problem in many areas of the United States. Exposures to ozone can cause people to be more susceptible to respiratory
infection, resulting in lung inflammation, and aggravating respiratory diseases, such as asthma.
Ozone is not emitted directly from vehicles but is formed when volatile organic compounds
(VOCs) and nitrogen oxides (NOx) react in the presence of sunlight. Transportation sources emit
NOx and VOCs and can therefore affect ozone concentrations. However, due to the phenomenon of atmospheric formation of ozone from chemical precursors, concentrations are not expected to
be elevated near a particular roadway.
The MPCA, in cooperation with various other agencies, industries, and groups, has encouraged voluntary control measures for ozone concentrations and has begun developing a regional ozone
modeling effort. Ozone concentrations in the lower atmosphere are influenced by a complex
relationship of precursor concentrations, meteorological conditions, and regional influences on
background concentrations. The MPCA states in The Air We Breathe: The state of Minnesota’s Air Quality 2017 (January 2017) that:
On October 1, 2015, the EPA strengthened the ozone standard to 70 parts per billion (ppb),
down from the 2008 standard of 75 ppb. All areas of Minnesota currently meet the new standard – but some parts of the state are close. Measured ozone levels in some areas of the
state are now within 85% or more of the level of ozone standard, placing these areas at
greater risk for violating the standard in the future. While emissions that help form ozone are
decreasing, warmer summers and more frequent wildfires may cause both fine-particle levels
and ozone levels to rise.
The State of Minnesota is classified by the EPA as an “ozone attainment area”, which means that Minnesota has been identified as a geographic area that meets the national health-based standards
for ozone levels. Because of these factors, a quantitative ozone analysis was not conducted for the
project.
Particulate Matter
Particulate matter (PM) is the term for particles and liquid droplets suspended in air. Particles come in a wide variety of sizes and have been historically measured by the diameter of the
particle in micrometers. PM2.5, or finer particulate matter, refers to particles that are 2.5
micrometers or less in diameter. PM10 refers to particulate matter that is 10 micrometers or less in
diameter.
Motor vehicles (i.e., cars, trucks, and buses) emit direct PM from their tailpipes, as well as from
normal brake and tire wear. Vehicle dust from paved and unpaved roads may be re-entrained, or
re-suspended, in the atmosphere. In addition, PM2.5 can be formed in the atmosphere from gases
such as sulfur dioxide, nitrogen oxides, and volatile organic compounds. PM2.5 can penetrate the human respiratory system's natural defenses and damage the respiratory tract when inhaled.
Numerous scientific studies have linked particle pollution exposure to a variety of problems,
including:
• Increased respiratory symptoms, such as irritation of the airways, coughing, or difficulty
breathing;
• Decreased lung function;
• Aggravated asthma;
• Development of chronic bronchitis;
• Irregular heartbeat;
I-94 Unbonde d Ov e rlay Draft Air Quality Study 5 Rogers to Maple Grove , MN Minnesota Department of Transportation – Air Quality Study
• Nonfatal heart attacks; and
• Premature death in people with heart or lung disease.
(Source: http://www.epa.gov/air/particlepollution/health.html)
On December 14, 2012, the EPA issued a final rule revising the annual health NAAQS for fine
particles (PM2.5). The EPA website states:
With regard to primary (health-based) standards for fine particles (generally referring to
particles less than or equal to 2.5 micrometers (mm) in diameter, PM2.5), the EPA is
strengthening the annual PM2.5 standard by lowering the level to 12.0 micrograms per cubic
meter (μg/m3). The existing annual standard, 15.0 μg/m3, was set in 1997. The EPA is revising the annual PM2.5 standard to 12.0 μg/m3 so as to provide increased protection
against health effects associated with long- and short-term exposures (including premature
mortality, increased hospital admissions and emergency department visits, and development
of chronic respiratory disease), and to retain the 24-hour PM2.5 standard at a level of 35
μg/m3 (the EPA issued the 24-hour standard in 2006). The EPA is revising the Air Quality
Index (AQI) for PM2.5 to be consistent with the revised primary PM2.5 standards. (Source:
http://www.epa.gov/pm/actions.html).
The EPA also retained the existing standards for coarse particle pollution (PM10). The NAAQS 24-hour standard for PM10 is 150 μg/m3, which is not to be exceeded more than once per year, on
average, over 3 years.
The Clean Air Act conformity requirements include the assessment of localized air quality impacts of federally-funded or federally-approved transportation projects that are located within
PM2.5 nonattainment and maintenance areas and deemed to be projects of air quality concern. The
Project is located in an area that has been designated as an unclassifiable/attainment area for PM.
This means that the project area has been identified as a geographic area that meets the national
health- based standards for PM levels, and therefore is exempt from performing PM analyses.
Nitrogen Dioxide (Nitrogen Oxides)
Nitrogen oxides, or NOx, are the generic term for a group of highly reactive gases, all of which
contain nitrogen and oxygen in varying amounts. Nitrogen oxides form when fuel is burned at high temperatures, as in a combustion process. The primary sources of NOx are motor vehicles,
train engines, electric utilities, and other industrial, commercial, and residential sources that burn
fuels. In addition to being a precursor to ozone, NOx can worsen bronchitis, emphysema and
asthma and increase risk of premature death from heart or lung disease (Source: 2015 Report to
the Legislature, MPCA, January 2015).
Nitrogen dioxide (NO2), which is a form of nitrogen oxide (NOx), is regularly monitored.
Minnesota currently meets federal nitrogen dioxide standards, according to the Annual Air
Monitoring Network Plan for Minnesota, 2018 (July 2017). A monitoring site meets the annual NAAQS for NO2 if the annual average is less than or equal to 53 ppb. The 2016 Minnesota NO2
monitoring site averages ranged from 5 ppb to 13 ppb; therefore, Minnesota currently meets the
annual NAAQS for NO2.
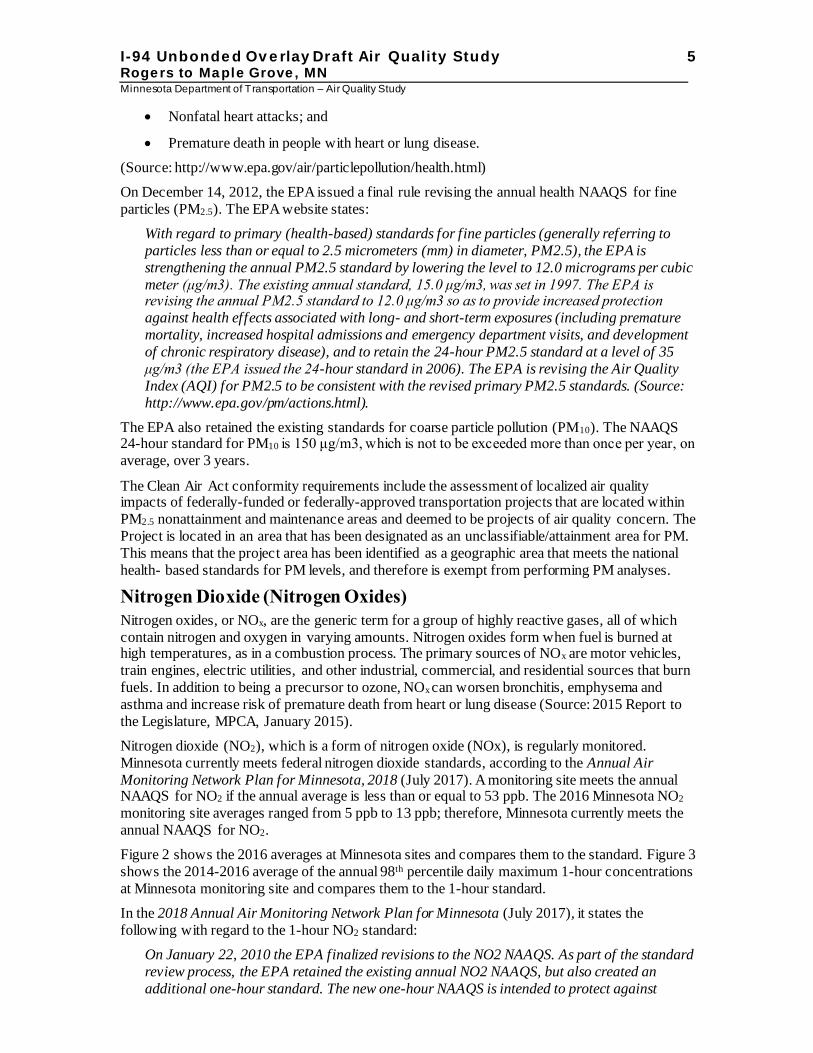
Figure 2 shows the 2016 averages at Minnesota sites and compares them to the standard. Figure 3
shows the 2014-2016 average of the annual 98th percentile daily maximum 1-hour concentrations
at Minnesota monitoring site and compares them to the 1-hour standard.
In the 2018 Annual Air Monitoring Network Plan for Minnesota (July 2017), it states the
following with regard to the 1-hour NO2 standard:
On January 22, 2010 the EPA finalized revisions to the NO2 NAAQS. As part of the standard
review process, the EPA retained the existing annual NO2 NAAQS, but also created an
additional one-hour standard. The new one-hour NAAQS is intended to protect against

Figure 3– 1-hour NO2 Concentrations Compared to the NAAQS, 2014-2016
c:: 60 0
i .b 50 c::_ a, c:: Uo c::= 40 o= (.) ,Q a, ... "O a,
30 - Q. >< Ill .2 t:: 0"' 20 c:: Q. a, --C) 13 0
10 .b z 0
FHR 420 FHR 423 Lakeville (480) Minneapolis (962) Blaine (6010)
- 2016 - standard
120 Ill t:: "' .e: 100 c:: 0 i ... 80 .. c::_ a, c:: Uo C::= o= 60 (.) ,Q
46 a, ... 44 "O a, - Q. >< 40 0 Q 26 c:: a, 20 C) 0 .b z
0 FHR 420 FHR 423 Minneapolis (962) Blaine (6010)
- 2014-2016 - Standard
I-94 Unbonde d Ov e rlay Draft Air Quality Study 6 Rogers to Maple Grove , MN Minnesota Department of Transportation – Air Quality Study
adverse health effects associated with short-term exposures to elevated NO2. To meet this
standard, the three-year average of the annual 98th percentile daily maximum one-hour NO2
concentration must not exceed 100 ppb. Minnesota averages ranged from 26 ppb at Flint
Hills Refinery 423 to 46 ppb at Blaine (6010); therefore, all Minnesota sites currently meet
the one-hour NAAQS for NO2 (Figure 22).
Figure 2– Annual Average NO2 Concentrations Compared to the NAAQS, 2016
The EPA's regulatory announcement, EPA420-F-99-051 (December 1999), describes the Tier 2
standards for tailpipe emissions, and states:
The new tailpipe standards are set at an average standard of 0.07 grams per mile for
nitrogen oxides for all classes of passenger vehicles beginning in 2004. This includes all
light-duty trucks, as well as the largest SUVs. Vehicles weighing less than 6000 pounds will
be phased-in to this standard between 2004 and 2007.
As newer, cleaner cars enter the national fleet, the new tailpipe standards will significantly reduce emissions of nitrogen oxides from vehicles by about 74 percent by 2030. The

I-94 Unbonde d Ov e rlay Draft Air Quality Study 7 Rogers to Maple Grove , MN Minnesota Department of Transportation – Air Quality Study
standards also will reduce emissions by more than 2 million tons per year by 2020 and nearly
3 million tons annually by 2030.
Within the project area, it is unlikely that NO2 standards will be approached or exceeded based on
the relatively low ambient concentrations of NO2 in Minnesota and on the long-term trend toward
reduction of NOx emissions. Because of these factors, a specific analysis of NO2 was not
conducted for this Project.
Sulfur Dioxide Sulfur dioxide (SO2) and other sulfur oxide gases (SOx) are formed when fuel containing sulfur,
such as coal, oil, and diesel fuel is burned. Sulfur dioxide is a heavy, pungent, colorless gas.
Elevated levels can impair breathing, lead to other respiratory symptoms, and at very high levels,
can aggravate heart disease. People with asthma are most at risk when SO2 levels increase. Once emitted into the atmosphere, SO2 can be further oxidized into sulfuric acid, a component of acid
rain. Emissions of sulfur oxides from transportation sources are a small component of overall
emissions and continue to decline due to the desulphurization of fuels.
MPCA monitoring shows ambient SO2 concentrations ranging from 2 ppb to 11 ppb for the 2013
to 2015 average 99th percentile daily maximum 1-hour SO2 concentrations; these findings are
consistently below state and federal standard of 75 ppb (Source: 2018 Annual Air Monitoring
Network Plan for Minnesota, 2017). The MPCA has concluded that long-term trends in both
ambient air concentrations and total SO2 emissions in Minnesota indicate steady improvement.
In the 2018 Annual Air Monitoring Network Plan for Minnesota (July 2017), it states the
following with regard to SO2:
On June 2, 2010, the EPA finalized revisions to the primary SO2 NAAQS. EPA established a
new one-hour standard which is met if the three-year average of the annual 99th percentile
daily maximum 1-hour SO2 concentration is less than 75 ppb. Previous standards were
revoked under the new rule. Minnesota averages ranged from 2 ppb at Rochester (5008) to 12 ppb at Flint Hills Refinery (420); therefore, all Minnesota sites currently meet the one-
hour NAAQS for SO2 (Figure 24).
Emissions of sulfur oxides from transportation sources are a small component of overall
emissions and continue to decline due to the desulphurization of fuels. Additionally, the project
area is classified by the EPA as a “sulfur dioxide attainment area,” which means that the project
area has been identified as a geographic area that meets the national health-based standards for
sulfur dioxide levels. Because of these factors, an analysis for sulfur dioxide was not conducted for this Project. Figure 4 describes the 2014-2016 average 99th percentile 1-hour sulfur dioxide
concentration and compares them to the 1-hour standard.

80 t:: (II
.e, 70
C: 0
ii! 60 .. c'E" so CII 0 u-c:: o.c 40 0 .. CII CII ~ C. 30 )(
0 20 c ..
,2 10 3 (J)
0
12
FHR420 FHR423 Saint Paul Park Refinery (436)
FHR443
- 2014-2016 - standard
Minneapolis (954) Rochester (5008)
I-94 Unbonde d Ov e rlay Draft Air Quality Study 8 Rogers to Maple Grove , MN Minnesota Department of Transportation – Air Quality Study
Figure 4– 1-hour SO2 Concentrations Compared to the NAAQS, 2014-2016
Lead Due to the phase out of leaded gasoline, lead is no longer a pollutant associated with vehicular
emissions.
Carbon Monoxide Carbon Monoxide (CO) is the traffic-related pollutant that has been of concern in the Twin Cities
Metropolitan area. In 1999, the EPA re-designated all of Hennepin, Ramsey, Anoka, and portions
of Carver, Scott, Dakota, Washington, and Wright counties as a maintenance area for CO. This
means that area was previously classified as a nonattainment area but has now been found to be in
attainment. This area includes the project area, which is located in Hennepin County. Evaluation of CO for assessment of air quality impacts is required for environmental approval in NEPA
documents.

I-94 Unbonde d Ov e rlay Draft Air Quality Study 9 Rogers to Maple Grove , MN Minnesota Department of Transportation – Air Quality Study
3.0 AIR QUALITY CONFORMITY The 1990 Clean Air Act Amendments (CAAA) require that State Implementation Plans (SIP)
must demonstrate how states with nonattainment and maintenance areas will meet federal air
quality standards. The U.S. Environmental Protection Agency (USEPA) has designated all of Hennepin, Ramsey, Anoka and portions of Carver, Scott, Dakota, Washington and Wright
counties as a maintenance area for carbon monoxide (CO). This area includes the project area,
which is in Hennepin County.
The USEPA issued final rules on transportation conformity (40 CFR 93 Subpart A) which
describe the methods required to demonstrate State Implementation Plan (SIP) compliance for
transportation projects. This project is currently included Draft 2019-2022 Transportation
Improvement Program (TIP) and in the transportation conformity section of the TIP. On
November 8th, 2010, the EPA approved a limited maintenance plan request for the Twin Cities maintenance area. Under a limited maintenance plan, the EPA has determined that there is no
requirement to project emissions over the maintenance period and that an emission budget may be
treated as essentially not constraining for the length of the maintenance period. The reason is that
it is unreasonable to expect that our maintenance area will experience so much growth within this
period that a violation of CO National Ambient Air Quality Standard (NAAQS) would result (US EPA Limited Maintenance Plan Option for Nonclassifiable CO Nonattainment Areas, October 6,
1995). Therefore, no regional modeling analysis for the Transportation Policy Plan (TPP) and TIP
is required; however, federally funded and state funded projects are still subject to “hot-spot” analysis requirements. The limited maintenance plan adopted in 2010 determines that the level of
CO emissions and resulting ambient concentrations will continue to demonstrate attainment of
CO NAAQS.
This project does not interfere with implementation of any transportation control measure
included in the SIP. The 2019-2022 TIP implements, and is consistent with, the region’s long-range transportation plan (LRTP), titled the Transportation Policy Plan (TPP), adopted by the
Metropolitan Council on January 14, 2015, with US DOT conformity determination established
on March 13, 2015. The project's design concept and scope are not significantly different from
that used in the TIP conformity analyses. As demonstrated by the above information, this project
conforms to the requirements of the CAAA and to the Conformity Rules, 40 CFR 93.
Furthermore, the EPA has approved a screening method to determine which intersections need
hot-spot analysis. The hot-spot screening method uses a traffic volume threshold of 82,300
entering vehicles per day. Intersections with traffic volumes above this threshold must be evaluated using EPA approved emission and dispersion models. Intersections with traffic
volumes below this threshold are not expected to result in CO concentrations that exceed state or
federal standards, and detailed modeling is not required. The screening method demonstrates that
because this project has less than the benchmark AADT of 82,300 and does not involve or affect
“Top Ten Intersections,” a hot-spot analysis is not needed. Based on the results of the screening,
there are no intersections included in the project area that require hot-spot analysis.
Improvements in vehicle technology and in motor fuel regulations continue to result in reductions
in vehicle emission rates. The EPA MOVES 2014a emissions model estimates that emission rates will continue to fall from existing rates through year 2030. Consequently, year 2030 vehicle-
related CO concentrations in the study area are likely to be lower than existing concentrations
even considering any increase in development-related and background traffic.

I-94 Unbonde d Ov e rlay Draft Air Quality Study 10 Rogers to Maple Grove , MN Minnesota Department of Transportation – Air Quality Study
Hot-Spot Analysis
CO evaluation is performed by evaluating the worst-operating (hot-spot) intersections in the
project area. The EPA has approved a screening method to determine which intersections need
hot-spot analysis. The hot-spot screening method uses a traffic volumes threshold of 82,300 entering vehicles per day. Intersection with traffic volumes above this threshold must be
evaluated using EPA-approved emission and dispersion models. Intersections with traffic
volumes below this threshold are not expected to result in CO concentrations that exceed state or
federal standards, and detailed modeling is not required. The I-94 UBOL project does not
significantly affect any intersections within the project corridor. Therefore, no hot-spot analysis
or screening procedure was needed nor completed.

I-94 Unbonde d Ov e rlay Draft Air Quality Study 11 Rogers to Maple Grove , MN Minnesota Department of Transportation – Air Quality Study
4.0 MOBILE SOURCE AIR TOXICS (MSAT) ANALYSIS
Background
In October 2016 FHWA issued updated guidance for the analysis of mobile source air toxics (MSATs) in the National Environmental Policy Act (NEPA) process for highway projects
(Updated Interim Guidance on Mobile Source Air Toxic Analysis in NEPA Documents) requiring
the use of the most recent version of USEPA’s Motor Vehicle Emissions Simulator (MOVES2014a) model for air quality analysis on documents prepared in accordance with NEPA.
The following language is taken from the guidance document and associated appendices.1
In addition to the criteria air pollutants for which there are the NAAQS, USEPA also regulates air
toxics. Most air toxics originate from human-made sources, including on road mobile sources,
non-road mobile sources (e.g., airplanes), area sources (e.g., dry cleaners) and stationary sources
(e.g., factories or refineries).
Controlling air toxic emissions became a national priority with the passage of the Clean Air Act Amendments (CAAA) of 1990, whereby Congress mandated that the U.S. Environmental
Protection Agency (EPA) regulate 188 air toxics, also known as hazardous air pollutants. The
EPA has assessed this expansive list in their latest rule on the Control of Hazardous Air Pollutants
from Mobile Sources (Federal Register, Vol. 72, No. 37, page 8430, February 26, 2007), and
identified a group of 93 compounds emitted from mobile sources that are listed in their Integrated Risk Information System (IRIS)2. In addition, EPA identified nine compounds with significant
contributions from mobile sources that are among the national and regional-scale cancer risk
drivers or contributors and non-cancer hazard contributors from the 2011 National Air Toxics
Assessment (NATA)3. These are 1,3-butadiene, acetaldehyde, acrolein, benzene, diesel
particulate matter (diesel PM), ethylbenzene, formaldehyde, naphthalene, and polycyclic organic
matter. While FHWA considers these the priority MSATs, the list is subject to change and may
be adjusted in consideration of future EPA rules.
Based on an FHWA analysis using USEPA's MOVES2014a model, as shown in Figure 5, even if vehicle-miles travelled (VMT) increases by 45 percent 2010 to 2050 as forecast, a combined
reduction of 91 percent in the total annual emissions for the priority MSAT is projected for the
same time period.
Based on an FHWA analysis using EPA's MOVES2014a model, as shown in Figure 5, even if
vehicle-miles travelled (VMT) increases by 45 percent as assumed from 2010 to 2050, a
combined reduction of 91 percent in the total annual emissions for the priority MSAT is projected
for the same time period (Updated Interim Guidance on Mobile Source Air Toxic Analysis in
NEPA Documents, October 18, 2016).
1 http://www.fhwa.dot.gov/Environment/air_quality/air_toxics/policy_and_guidance/msat/index.cfm, accessed January 5,
2018. 2
EPA, https://www.epa.gov/iris 3
EPA, https://www.epa.gov/national-air-toxics-assessment

VMT ____ ,., __ ...._ --Ac:et ...... ---~ __ ,,....._ ......... ·~ ~ ~ ...
.................................................................
.us O.M
!?~ o..u 4tU f;tQ ..
1: 1: I ::
OAJJ~~ . ...,
••• O;.OIDO :·-·· •.~
OAOIS~ ·= ._ ...... ,.......,...... ••a;;;;;;;;;;;;;;l.o ····-----.. ---· ...
I-94 Unbonde d Ov e rlay Draft Air Quality Study 12 Rogers to Maple Grove , MN Minnesota Department of Transportation – Air Quality Study
Figure 5– National MSAT Emission Trends 2010-2050
for Vehicles Operating on Roadways Using EPA’s MOVES2014a Mode l
Source: EPA MOVES2014a model runsconducted by FHWA, September 2016.
I-94 Unbonde d Ov e rlay Draft Air Quality Study 13 Rogers to Maple Grove , MN Minnesota Department of Transportation – Air Quality Study
Note: Trends for specific locations may be different, depending on locally derived information
representing vehicle-miles travelled, vehicle speeds, vehicle mix, fuels, emission control
programs, meteorological, and other factors.
Diesel PM is the dominant component of MSAT emissions, making up 50 to 70 percent of all
priority MSAT pollutants by mass, depending on calendar year. Users of MOVES2014a will
notice some differences in emissions compared with MOVES2010b. MOVES2014a is based on
updated data on some emissions and pollutant processes compared to MOVES2010b, and also reflects the latest Federal emissions standards in place at the time of its release. In addition,
MOVES2014a emissions forecasts are based on lower VMT projections than MOVES2010b,
consistent with recent trends suggesting reduced nationwide VMT growth compared to historical
trends.
MSAT Research
Air toxics analysis is a continuing area of research. While much work has been done to assess the
overall health risk of air toxics, many questions remain unanswered. In particular, the tools and
techniques for assessing project-specific health outcomes as a result of lifetime MSAT exposure remain limited. These limitations impede the ability to evaluate how potential public health risks
posed by MSAT exposure should be factored into project-level decision-making within the
context of NEPA.
Nonetheless, air toxics concerns continue to be raised on highway projects during the NEPA
process. Even as the science emerges, we are duly expected by the public and other agencies to
address MSAT impacts in our environmental documents. The FHWA, EPA, the Health Effects
Institute, and others have funded and conducted research studies to try to more clearly define
potential risks from MSAT emissions associated with highway projects. The FHWA will
continue to monitor the developing research in this field.
Consideration of MSATin NEPA Documents
The FHWA developed a tiered approach with three categories for analyzing MSAT in NEPA
documents, depending on specific project circumstances:
1. No analysis for projects with no potential for meaningful MSAT effects;
2. Qualitative analysis for projects with low potential MSAT effects; or
3. Quantitative analysis to differentiate alternatives for projects with higher potential MSAT
effects.
For projects warranting an MSAT analysis, the nine priority MSATs should be analyzed.
(1) Projects with No Meaningful Potential MSATEffects, or Exempt Projects.
The types of projects included in this category are:
• Projects qualifying as a categorical exclusion under 23 CFR 771.117(c) (subject to
consideration whether unusual circumstances exist under 23 CFR 771.117(b));
• Projects exempt under the Clean Air Act (CAA) conformity rule under 40 CFR 93.126;
or
• Other projects with no meaningful impacts on traffic volumes or vehicle mix.
(2) Projects with Low Potential MSAT Effects
The types of projects included in this category are those that serve to improve operations of
highway, transit, or freight without adding substantial new capacity or without creating a facility
that is likely to meaningfully increase MSAT emissions. This category covers a broad range of
projects.

I-94 Unbonde d Ov e rlay Draft Air Quality Study 14 Rogers to Maple Grove , MN Minnesota Department of Transportation – Air Quality Study
Any projects not meeting the criteria in category (1) or category (3) below should be included in
this category. Examples of these types of projects are minor widening projects, new interchanges,
replacing a signalized intersection on a surface street, or projects where design year traffic is
projected to be less than 140,000 to 150,000 annual average daily traffic (AADT).
(3) Projects with Higher Potential MSATEffects
This category includes projects that have the potential for meaningful differences in MSAT
emissions among project alternatives. Projects in this category are those that:
• Create or significantly alter a major intermodal freight facility that has the potential to
concentrate high levels of diesel particulate matter in a single location, involving a
significant number of diesel vehicles for new projects or accommodating with a
significant increase in the number of diesel vehicles for expansion projects; or
• Create new capacity or add significant capacity to urban highways such as interstates,
urban arterials, or urban collector-distributor routes with traffic volumes where the
AADT is projected to be in the range of 140,000 to 150,0004 or greater by the design
year; and
• Proposed to be located in proximity to populated areas.
The I-94 Unbonded Overlay (UBOL) Resurfacing and Brockton Interchange Project has project
design year traffic volumes in the 140,000 to 150,000 AADT range. Therefore, the project meets
the criteria of category 3, projects with higher potential MSAT effects; and a quantitative MSAT
analysis is required.
Quantitative MSATAnalysis
A quantitative analysis was completed to provide a basis for identifying and comparing the
potential differences among MSAT emissions—if any—from the various alternatives.
Scope and Methodology
The quantitative MSAT analysis estimates the annual emissions of the nine priority MSATs as a
function of VMT and MSAT emission rates developed by MOVES2014a. The simplest scope of
analysis would be to only calculate emissions for those roadway segments that would be
constructed as part of the project. However, this methodology would not consider the influence of the proposed project on the surrounding areas. Therefore, it is more appropriate to define an
Affected Transportation Network to better capture the MSAT emissions that would be generated
as a result of the project. This network would include the proposed project plus other
transportation links where traffic volumes are expected to change as a result of the project.
The Affected Transportation Network included the project plus additional roads around the
project from as far north as US-10, I-169 and I-494 on the east and STH 55 on the south.
The MSAT analysis years included the existing year (2017), first full opening year (2021) and
design year (2040) for the No-Build and Build Alternative. The MSAT emissions analysis was
completed using the current version of EPA’s MOVES2014a based upon recommendations in the FHWA’s Frequently Asked Questions (FAQ) Conducting Quantitative MSAT Analysis for FHWA NEPA Documents.
4 FHWA, https://www.fhwa.dot.gov/environMent/air_quality/air_toxics/policy_and_guidance/msat/

------
-- --~ -
- -- -
I I
I-94 Unbonde d Ov e rlay Draft Air Quality Study 15 Rogers to Maple Grove , MN Minnesota Department of Transportation – Air Quality Study
MSAT Analysis Results
The amount of MSATs emitted in the region would be proportional to VMT. However, because
of improvements in emissions technologies, total MSAT emissions will decline over time, even
while VMT increases.
The results of the analyses are presented graphically in Figure 6 and Figure 7 and numerically in
Table 1. Within the Affected Transportation Network, VMT would increase as shown in Figure 6
from existing to the 2021 and a greater amount to 2040. The overall increase in VMT from existing to the Build Alternative in 2040 would be 18 percent, as shown in Table 1. Figure 6
shows that the estimated 2040 Build VMT would be slightly greater than the No-Build VMT.
Based on the data presented in Table 1 there is no significant increase in VMT from the 2040 No-
Build to the 2040 Build Alternative.
Figure 6– I-94 UBOL Annual VMT for the Affected Transportation Network
14,000,000
14,500,000
15,000,000
15,500,000
16,000,000
16,500,000
17,000,000
17,500,000
18,000,000
18,500,000
19,000,000
Existing No-Build Build No-Build Build
2017 2021 2040
Annual
Vehic
le M
iles
Tra
vele
d
Source: Project Team, November 2018
Under the Build Alternative, MSAT emissions would be lower than present levels in the design
year as a result of EPA’s national control programs. On a national basis, a combined reduction of 91 percent in the total annual emission rate for the priority MSATs is projected from 2010 to 2050. Local conditions may differ from these national projections in terms of fleet mix and
turnover, VMT growth rates, and local control measures. However, the magnitude of the EPA-
projected reductions is so great (even after accounting for VMT growth) that MSAT emissions
are lower in the future.
As shown in Figure 6, annual total MSAT emissions in the Affected Transportation Network
would drop dramatically from 2017 to 2021 and would continue to decline into the 2040 design
year for both alternatives. The data in Table 1 indicates that the analyses predicts a decrease of 80
percent in MSAT emissions from 2017 to 2040 despite an 18 percent increase in VMT. Figure 6 also indicates that the differences in MSAT emissions between the No-Build Alternative and the
Build Alternative would be relatively small. Table 1 indicates that the difference in total MSAT

.35
ffi 0.30 Q) :>, ....
0.25 Q) a. V) C 0 0.20 ~ V) C 0
0.15 ' iii V) .E
UJ 0.10 I-<1'. (f)
0.05 2
0.00 2017 2021 2040
Year
■ No-Build □ Build
I-94 Unbonde d Ov e rlay Draft Air Quality Study 16 Rogers to Maple Grove , MN Minnesota Department of Transportation – Air Quality Study
emissions between the No-Build Alternative and the Build Alternative would vary by 0.00149
tons per year in 2021 and 0.00006 tons per year in 2040. The Build Alternative had higher MSAT
emissions in 2040 than the No-Build Alternative by 0.1%.
Figure 7– I-94 UBOL Annual Total MSAT Emissions for the Affected Transportation Network
Source: Project Team, November 2018
As shown in Table 1, Diesel Particulate Matter (Diesel PM) is the major contributor to the total
MSAT emissions. Diesel PM would decrease 85% from existing levels by 2040. The greatest
percentage reduction in MSAT emissions, 99%, occurs with 1.3 Butadiene. Smaller reductions
are anticipated for the remaining pollutants. Variations between the No-Build and Build
Alternatives are minor.
The additional travel lanes and the Brockton Interchange contemplated as part of the Build Alternative will have the effect of moving traffic closer to some homes, and businesses; therefore,
there may be localized areas where ambient concentrations of MSATs could be higher compared
to the No-Build Alternative. Also, MSATs will be lower in other locations when traffic shifts
away from them. However, as discussed below, the magnitude and the duration of these potential
increases compared to the No-Build Alternative cannot be reliably quantified due to the inherent
deficiencies of current models.
In summary, MSAT emissions in 2040 are expected to be relatively similar under the Build
Alternative relative to the No-Build Alternative. In comparing the Build Alternative to the No-Build Alternative, MSAT levels could be higher in some locations than others, but current tools
and science are not adequate to reliably quantify them. However, on a regional basis, EPA’s vehicle and fuel regulations, coupled with fleet turnover, will over time cause substantial
reductions that will cause region-wide MSAT levels to be significantly lower than today. As this

I- 94 Unbonded Overlay Draft Air Quality Study 17 Rogers to Maple Grove, MN
Minnesota Department of Transportation – Air Quality Study
analysis shows, despite VMT increases from 2017 to 2040, MSAT emissions are still anticipated to decline considerably over the same period. The proposed project would not interfere with the substantial emissions reductions forecasted in the project area due to the implementation of EPA’s regulations
Table 1–I-94 Maple Grove, MN MSAT Analysis for the Affected Transportation Network
2017 2021 2040 Percent Change 2017 to 2040
Existing No-Build Build No-Build Build Existing Build
Annual Vehicle Miles Traveled 15,583,493 16,065,110 16,204,540 18,346,908 18,390,981 18% 18% MSAT Pollutant (Tons per Year)
Benzene 0.03444 0.02331 0.02352 0.00988 0.00990 -71% -71% Diesel PM (DPM) 0.19994 0.11670 0.11753 0.02996 0.02999 -85% -85% 1,3 Butadiene 0.00308 0.00135 0.00136 0.00004 0.00004 -99% -99% Formaldehyde 0.03804 0.02600 0.02620 0.01332 0.01333 -65% -65% Naphthalene 0.00435 0.00280 0.00282 0.00116 0.00116 -73% -73% Acrolein 0.00245 0.00157 0.00158 0.00062 0.00062 -75% -75% Acetaldehyde 0.01946 0.01208 0.01218 0.00475 0.00475 -76% -76% Ethyl Benzene 0.01813 0.01196 0.01206 0.00559 0.00559 -69% -69% Polycyclic 0.00225 0.00136 0.00137 0.00039 0.00039 -83% -83% Totals 0.32214 0.19713 0.19862 0.06571 0.06577 -80% -80%
Source: Project Team, November 2018
Incomplete or Unavailable Information for Project-Specific MSAT Health Impacts In FHWA’s view, information is incomplete or unavailable to credibly predict the project-specific health impacts due to changes in MSAT emissions associated with a proposed set of highway alternatives. The outcome of such an assessment, adverse or not, would be influenced more by the uncertainty introduced into the process through assumption and speculation rather than any genuine insight into the actual health impacts directly attributable to MSAT exposure associated with a proposed action.
The USEPA is responsible for protecting the public health and welfare from any known or anticipated effect of an air pollutant. They are the lead authority for administering the CAA and its amendments and have specific statutory obligations with respect to hazardous air pollutants and MSAT. The USEPA is in the continual process of assessing human health effects, exposures, and risks posed by air pollutants. They maintain the Integrated Risk Information System (IRIS), which is “a compilation of electronic reports on specific substances found in the environment and their potential to cause human health effects”.5 Each report contains assessments of non- cancerous and cancerous effects for individual compounds and quantitative estimates of risk levels from lifetime oral and inhalation exposures with uncertainty spanning perhaps an order of magnitude. Other organizations are also active in the research and analyses of the human health effects of MSAT, including the Health Effects Institute (HEI). Two HEI studies are summarized in Appendix D of FHWA’s Interim Guidance Update on Mobile Source Air Toxic Analysis in NEPA Documents. Among the adverse health effects linked to MSAT compounds at high exposures are cancer in humans in occupational settings; cancer in animals; and irritation to the
5 Source: EPA, https://www.epa.gov/iris

I-94 Unbonde d Ov e rlay Draft Air Quality Study 18 Rogers to Maple Grove , MN Minnesota Department of Transportation – Air Quality Study
respiratory tract, including the exacerbation of asthma. Less obvious are the adverse human
health effects of MSAT compounds at current environmental concentrations (HEI Special Report
16, https://www.fhwa.dot.gov/exit.cfm?link=https://www.healtheffects.org/publication/mobile-
source-air-toxics-critical-review-literature-exposure-and-health-effects) or in the future as vehicle
emissions substantially decrease.
The methodologies for forecasting health impacts include emissions modeling; dispersion
modeling; exposure modeling; and then final determination of health impacts – each step in the process building on the model predictions obtained in the previous step. All are encumbered by
technical shortcomings or uncertain science that prevents a more complete differentiation of the
MSAT health impacts among a set of project alternatives. These difficulties are magnified for
lifetime (i.e., 70-year) assessments, particularly because unsupportable assumptions would have
to be made regarding changes in travel patterns and vehicle technology (which affects emissions
rates) over that time frame, since such information is unavailable.
It is particularly difficult to reliably forecast 70-year lifetime MSAT concentrations and exposure
near roadways; to determine the portion of time that people are actually exposed at a specific location; and to establish the extent attributable to a proposed action, especially given that some
of the information needed is unavailable.
There are considerable uncertainties associated with the existing estimates of toxicity of the
various MSAT, because of factors such as low-dose extrapolation and translation of occupational
exposure data to the general population, a concern expressed by HEI (Special Report 16,
https://www.fhwa.dot.gov/exit.cfm?link=https://www.healtheffects.org/publication/mobile-
source-air-toxics-critical-review-literature-exposure-and-health-effects). As a result, there is no
national consensus on air dose-response values assumed to protect the public health and welfare for MSAT compounds, and in particular for diesel PM. The USEPA states that with respect to
diesel engine exhaust, “[t]he absence of adequate data to develop a sufficiently confident dose-
response relationship from the epidemiologic studies has prevented the estimation of inhalation
carcinogenic risk (EPA IRIS database, Diesel Engine Exhaust, Section II.C.
https://cfpub.epa.gov/ncea/iris/iris_documents/documents/subst/0642.htm#quainhal).”
There is also the lack of a national consensus on an acceptable level of risk. The current context is
the process used by the EPA as provided by the CAA to determine whether more stringent
controls are required in order to provide an ample margin of safety to protect public health or to prevent an adverse environmental effect for industrial sources subject to the maximum achievable
control technology standards, such as benzene emissions from refineries. The decision framework
is a two-step process. The first step requires EPA to determine an “acceptable” level of risk due to
emissions from a source, which is generally no greater than approximately 100 in a million.
Additional factors are considered in the second step, the goal of which is to maximize the number of people with risks less than 1 in a million due to emissions from a source. The results of this
statutory two-step process do not guarantee that cancer risks from exposure to air toxics are less
than one in a million; in some cases, the residual risk determination could result in maximum
individual cancer risks that are as high as approximately 100 in a million. In a June 2008
decision, the U.S. Court of Appeals for the District of Columbia Circuit upheld EPA’s approach to addressing risk in its two-step decision framework. Information is incomplete or unavailable to
establish that even the largest of highway projects would result in levels of risk greater than safe
or acceptable
https://www.cadc.uscourts.gov/internet/opinions.nsf/284E23FFE079CD59852578000050C9DA/
$file/07-1053-1120274.pdf).
Because of the limitations in the methodologies for forecasting health impacts described, any
predicted difference in health impacts between alternatives is likely to be much smaller than the
uncertainties associated with predicting the impacts. Consequently, the results of such assessments would not be useful to decision makers, who would need to weigh this information

I-94 Unbonde d Ov e rlay Draft Air Quality Study 19 Rogers to Maple Grove , MN Minnesota Department of Transportation – Air Quality Study
against project benefits, such as reducing traffic congestion, accident rates, and fatalities plus
improved access for emergency response, that are better suited for quantitative analysis.
Conclusions
Based on the air quality analyses completed for the proposed improvements, this project will not
contribute to any violation of the NAAQS.
FHWA and MnDOT have provided a quantitative analysis of MSAT emissions relative to the No-
Build Alternative and the Project. The FHWA and MnDOT have acknowledged that a future
project in the study area may result in increased exposure to MSAT emissions in certain
locations, although the concentrations and duration of exposures are uncertain. Because of this
uncertainty, the health effects from these emissions cannot be reliably estimated.
Construction-Period Strategies
During project implementation, all strategies should be evaluated to determine their
appropriateness and effectiveness at reducing regional and localized criteria pollutant emissions.
Strategies that could be considered during construction include:
• Apply water suppression to active construction areas to minimize dust.
• Tarp trucks hauling soil, sand, and other loose materials or require trucks to maintain at
least two feet of freeboard.
• Pave, apply water as needed, or apply (non-toxic) soil stabilizers on unpaved access
roads, parking areas and staging areas at construction sites.
• Use water sweepers to sweep paved access roads, parking areas and staging areas at
construction sites.
• Use water sweepers to sweep streets if visible soil material is carried onto adjacent public
streets.
• Hydroseed or apply (non-toxic) soil stabilizers to inactive construction areas (previously
graded areas inactive for ten days or more).
• Enclose, cover, water or apply (non-toxic) soil binders to exposed stockpiles (dirt, sand,
etc.).
• Limit traffic speeds on unpaved roads to 15 miles per hour.
• Utilize appropriate erosion control measures to reduce silt runoff to public roadways.
• Replant vegetation as quickly as possible to minimize erosion in disturbed areas.
• Use alternative fuels for construction equipment when feasible.
• Minimize equipment idling time.
• Maintain properly tuned equipment.

I-94 Unbonde d Ov e rlay Draft Air Quality Study 20 Rogers to Maple Grove , MN Minnesota Department of Transportation – Air Quality Study
5.0 REFERENCES
Annual Air Monitoring Network Plan for Minnesota 2018, MPCA, July 2017.
Frequently Asked Questions (FAQ) Conducting Quantitative MSAT Analysis for FHWA NEPA Documents,
http://www.fhwa.dot.gov/environment/air_quality/air_toxics/policy_and_guidance/moves_msat_f
aq.cfm, updated September 9, 2017.
Interim Guidance Update on Mobile Source Air Toxic Analysis in NEPA,
https://www.fhwa.dot.gov/environMent/air_quality/air_toxics/policy_and_guidance/msat/,
updated May 17, 2017.
MOVES2014a User Guide, Assessment and Standards Division, Office of Transportation and Air
Quality, U.S. Environmental Protection Agency, EPA-420-B-15-095, November 2015.
The Air We Breathe: The State of Minnesota’s Air Quality 2017, MPCA, January 2017.

I-94 Unbonde d Ov e rlay Air Quality Study Rogers to Maple Grove , MN Minnesota Department of Transportation – Air Quality Study