appendix f - california water service
TRANSCRIPT

Water Resources Planning Department
Projection Analysis Work Sheetsfor
Dominguez District
2015
Printed on 5/9/2016 at 9:31 AM

17
Projected Annual Supply by Source
Historical and Projected Average Day, Maximum Day, and Peak Demands
13
14
15 Per Capita Water Demand Calculation
Indoor/Outdoor Water Usage
SB-7 Compliance Demand Worksheet
Population Estimate
Temperature & Rainfall History
Groundwater Facilities (if available)
11
12
7
16
Actual & Projected Demand in Acre-Feet
Percentage of Total Sales
9
Percentage of Total Demand
Actual & Projected Annual Average Services
10
2 Service Growth Percentage
Table of Contents for Worksheets
Worksheet Title
1 Annual Services
3 District Sales (AF)
4
5
6
Demand per Service (Gallons per Day)
Percentage Change in Annual Demand
8
Printed on 5/9/2016 at 9:31 AM

Distribution of Services Chart
DOM PAWS 2015 Distribution of Services Chart 5/9/2016
Residential
87.5%
Multi-Residential
2.3%
Commercial
8.7%
Industrial
0.5%
Government
0.8%
Other
0.1%
Distribution of Services
(2015)

Historical Services Graph
DOM PAWS 2015 Historical Services Graph 5/9/2016
10,000
15,000
20,000
25,000
30,000
35,000
1980 1985 1990 1995 2000 2005 2010 2015
Ser
vic
es
Year
Historical Services

Services
California Water Service Company - Dominguez District Worksheet 1
Water Supply and Demand Analysis and Projections
Average Annual Services
Single Family Multi Family Commercial Industrial Government Reclaimed Other Annual
Year (SFR) (MFR) (COM) (IND) (GOV) (REC) (OTH) Total Change
1990
1991
1992 26,873 860 2,800 132 216 0 31 30,911
1993 26,908 868 2,810 133 217 0 26 30,963 52
1994 26,957 865 2,807 133 221 0 29 31,012 49
1995 27,038 864 2,796 131 223 0 29 31,081 69
1996 27,115 864 2,796 130 227 0 31 31,164 83
1997 27,291 875 2,797 130 233 0 28 31,354 190
1998 27,351 888 2,794 129 244 0 37 31,443 89
1999 27,436 903 2,809 128 244 0 51 31,570 127
2000 27,561 919 2,816 133 245 0 67 31,740 170
2001 27,668 936 2,876 132 249 0 50 31,910 170
2002 27,713 942 2,940 137 264 0 52 32,047 137
2003 27,725 930 2,967 144 261 0 45 32,071 24
2004 27,965 926 2,956 159 264 0 31 32,301 230
2005 28,136 920 2,979 160 264 0 37 32,495 194
2006 28,210 912 2,996 165 265 0 32 32,580 85
2007 28,220 910 2,998 165 269 0 27 32,589 9
2008 28,334 801 2,937 163 278 0 20 32,533 -56
2009 28,495 696 2,863 160 288 0 26 32,527 -6
2010 28,573 704 2,863 162 286 0 28 32,616 89
2011 28,632 735 2,871 161 286 0 28 32,713 96
2012 28,646 742 2,865 159 285 0 25 32,722 9
2013 28,650 744 2,865 159 287 0 28 32,732 10
2014 28,694 746 2,865 159 286 0 33 32,784 52
2015 28,733 746 2,870 158 279 0 34 32,820 35
5 Yr Avg. 28,671 742 2,867 159 284 0 30 32,754 51
10 Yr Avg. 28,519 774 2,899 161 281 0 28 32,662 48
15 Yr Avg. 28,293 826 2,914 156 274 0 33 32,496 81
20 Yr Avg. 28,057 842 2,886 150 265 0 35 32,235 89
Note: Reclassification occurred between categories from 2007 to 2009
DOM PAWS 2015 Services 5/9/2016

Services
California Water Service Company - Dominguez District Worksheet 2
Water Supply and Demand Analysis and Projections
Service Growth Percentage
Single Family Multi Family Commercial Industrial Government Reclaimed Other
Year (SFR) (MFR) (COM) (IND) (GOV) (REC) (OTH) Total
1991
1992
1993 0.13% 0.93% 0.39% 0.89% 0.69% -13.86% 0.17%
1994 0.18% -0.32% -0.12% -0.19% 1.76% 8.83% 0.16%
1995 0.30% -0.12% -0.39% -1.57% 0.83% 0.29% 0.22%
1996 0.29% 0.05% 0.01% -0.26% 1.64% 6.65% 0.27%
1997 0.65% 1.23% 0.02% -0.58% 2.90% -8.94% 0.61%
1998 0.22% 1.45% -0.11% -0.64% 4.61% 33.04% 0.28%
1999 0.31% 1.69% 0.53% -0.84% 0.07% 37.14% 0.40%
2000 0.46% 1.86% 0.24% 4.18% 0.31% 31.00% 0.54%
2001 0.39% 1.77% 2.14% -0.56% 1.57% -25.53% 0.53%
2002 0.16% 0.69% 2.22% 3.97% 5.93% 3.51% 0.43%
2003 0.04% -1.27% 0.94% 4.43% -0.89% -13.73% 0.08%
2004 0.87% -0.43% -0.38% 10.57% 1.18% -30.34% 0.72%
2005 0.61% -0.63% 0.77% 1.10% -0.09% 18.28% 0.60%
2006 0.26% -0.92% 0.60% 3.06% 0.32% -11.82% 0.26%
2007 0.04% -0.19% 0.04% 0.05% 1.73% -17.27% 0.03%
2008 0.40% -11.92% -2.02% -1.71% 3.31% -24.92% -0.17%
2009 0.57% -13.16% -2.54% -1.33% 3.47% 28.22% -0.02%
2010 0.28% 1.21% 0.02% 0.68% -0.81% 10.03% 0.27%
2011 0.20% 4.28% 0.28% -0.15% -0.03% 0.29% 0.30%
2012 0.05% 0.95% -0.20% -1.29% -0.15% -12.61% 0.03%
2013 0.01% 0.31% -0.02% -0.16% 0.47% 13.09% 0.03%
2014 0.16% 0.32% 0.01% 0.00% -0.15% 18.99% 0.16%
2015 0.13% 0.00% 0.17% -0.47% -2.62% 1.25% 0.11%
5 Yr. Avg. 0.11% 1.17% 0.05% -0.41% -0.50% 4.20% 0.13%
10 Yr. Avg. 0.21% -1.91% -0.37% -0.13% 0.55% 0.53% 0.10%
15 Yr. Avg. 0.28% -1.27% 0.14% 1.21% 0.88% -2.84% 0.22%
20 Yr. Avg. 0.31% -0.64% 0.14% 1.00% 1.14% 2.82% 0.27%
DOM PAWS 2015 Services 5/9/2016

Services
PAGE LEFT BLANK INTENTIONALLY
DOM PAWS 2015 Services 5/9/2016

Historical Sales Graph
DOM PAWS 2015 Historical Sales Graph 5/9/2016
0
5,000
10,000
15,000
20,000
25,000
30,000
35,000
40,000
45,000
199
0
199
1
199
2
199
3
199
4
199
5
199
6
199
7
199
8
199
9
200
0
200
1
200
2
200
3
200
4
200
5
200
6
200
7
200
8
200
9
201
0
201
1
201
2
201
3
201
4
201
5
Sa
les
in A
cre-F
eet
Year
Historical Sales
Single Family Multi Family Commercial Industrial Government Other Unaccounted for Water

Sales
California Water Service Company - Dominguez District Worksheet 3
Water Supply and Demand Analysis and Projections
Sales (AF)
Single Family Multi Family Commercial Industrial Government Reclaimed Other
Unaccounted for
Water
(SFR) (MFR) (COM) (IND) (GOV) (REC) (OTH) (UAFW)
1990 0 0 0 0 0 0 0 0 0 0 0
1991 0 0 0 0 0 0 0 0 0 0 0
1992 9,889 3,185 7,934 11,039 2,091 0 62 -627 34,199 33,572 10,940
1993 10,196 3,052 7,961 9,772 1,978 0 52 519 33,010 33,529 10,925
1994 10,567 3,131 8,053 9,653 2,316 0 39 2,337 33,759 36,096 11,762
1995 10,497 3,116 8,221 11,741 2,257 0 92 573 35,924 36,497 11,893
1996 11,170 3,249 8,716 7,559 2,235 0 95 102 33,025 33,127 10,795
1997 11,484 3,307 9,645 8,835 2,283 0 129 330 35,684 36,014 11,735
1998 10,619 3,185 8,699 8,867 1,833 0 118 746 33,323 34,069 11,101
1999 11,195 3,276 9,196 11,077 2,068 0 173 -702 36,986 36,283 11,823
2000 11,524 3,507 10,255 8,046 2,358 0 359 161 36,049 36,210 11,799
2001 11,105 3,300 9,611 7,264 2,513 0 108 1,754 33,900 35,654 11,618
2002 11,687 3,418 10,181 8,852 2,465 0 80 190 36,682 36,872 12,015
2003 12,327 3,369 9,002 9,288 1,948 0 132 1,632 36,067 37,699 12,284
2004 12,038 3,400 8,752 11,259 2,060 0 205 1,026 37,714 38,740 12,624
2005 11,196 3,174 8,137 11,982 1,867 0 44 99 36,400 36,499 11,893
2006 11,341 3,162 8,409 13,435 1,746 0 27 -623 38,120 37,498 12,219
2007 11,689 3,128 8,586 13,934 1,986 0 28 -1,251 39,351 38,100 12,415
2008 11,119 2,897 8,229 13,946 1,752 0 174 -2,521 38,117 35,596 11,599
2009 10,616 2,776 7,448 10,336 1,486 0 122 -2,649 32,784 30,136 9,820
2010 9,937 2,661 7,308 10,953 1,438 0 67 628 32,364 32,992 10,751
2011 9,718 2,708 7,357 9,989 1,327 0 70 477 31,169 31,646 10,312
2012 9,820 2,742 8,395 10,419 1,347 0 56 543 32,778 33,321 10,858
2013 9,897 2,805 8,540 10,382 1,410 0 104 739 33,138 33,877 11,039
2014 9,258 2,573 8,288 11,437 1,635 0 63 581 33,254 33,835 11,025
2015 8,012 2,428 8,077 10,772 1,312 0 59 631 30,660 31,291 10,196
Total Sales
(AF)
Total
Demand
(AF)
Total
Demand
(MGal)Year
DOM PAWS 2015 Sales 5/9/2016

DPS TOT
DOM PAWS 2015 DPS TOT 5/9/2016
600
700
800
900
1,000
1,100
1,200
1,300
1,400
1990 1995 2000 2005 2010 2015
Dem
an
d p
er S
erv
ice
(Ga
llo
ns/
da
y)
Combined Demand per Service
Combined Demand
AVG
AVG-SD
AVG+SD

Demand Per Service
California Water Service Company - Dominguez District Worksheet 4
Water Supply and Demand Analysis and Projections
Demand per Service (Gallons per Day)
Combined
Year SFR MFR COM IND GOV REC OTH UAFW Demand/Serv
1990
1991
1992 329 3,308 2,530 74,799 8,648 1,794 -18 970
1993 338 3,140 2,529 65,633 8,123 1,762 15 967
1994 350 3,233 2,561 64,960 9,350 1,205 67 1,039
1995 347 3,221 2,625 80,268 9,035 2,855 16 1,048
1996 368 3,357 2,783 51,812 8,803 2,756 3 949
1997 376 3,375 3,079 60,904 8,739 4,120 9 1,025
1998 347 3,204 2,780 61,526 6,708 2,839 21 967
1999 364 3,241 2,923 77,510 7,560 3,027 -20 1,026
2000 373 3,406 3,251 54,044 8,594 4,795 5 1,018
2001 358 3,150 2,983 49,064 9,019 1,927 49 998
2002 376 3,239 3,092 57,510 8,350 1,377 5 1,027
2003 397 3,234 2,709 57,785 6,660 2,657 45 1,049
2004 384 3,278 2,644 63,352 6,960 5,898 28 1,071
2005 355 3,079 2,439 66,682 6,312 1,076 3 1,003
2006 359 3,096 2,505 72,543 5,886 741 -17 1,027
2007 370 3,069 2,557 75,203 6,581 943 -34 1,044
2008 350 3,227 2,501 76,576 5,620 7,721 -69 977
2009 333 3,561 2,323 57,522 4,606 4,223 -73 827
2010 310 3,373 2,279 60,544 4,493 2,123 17 903
2011 303 3,292 2,288 55,301 4,147 2,208 13 864
2012 306 3,301 2,616 58,436 4,217 1,997 15 909
2013 308 3,366 2,661 58,323 4,395 3,298 20 924
2014 288 3,078 2,583 64,247 5,103 1,688 16 921
2015 249 2,904 2,512 60,800 4,206 1,549 17 851
10-yr AVG 338 3,264 2,481 64,448 5,322 3,023 16 955
SD 35 139 255 8,590 1,833 1,667 32 69
Note: Negatative Un-Accounted for Water 2006 to 2009 drove re-assignment of average period to 2010 to 2014.
DOM PAWS 2015 Demand Per Service 5/9/2016

Demand Per Service
0
500
1,000
1,500
2,000
2,500
3,000
3,500
4,000
1990 1995 2000 2005 2010 2015
Dem
an
d p
er S
erv
ice (
Ga
llo
ns/
da
y)
Multi Family Residential Demand per Service
MFR
AVG
AVG-SD
AVG+SD
0
50
100
150
200
250
300
350
400
450
1990 1995 2000 2005 2010 2015
Dem
an
d p
er S
erv
ice
(Ga
llo
ns/
da
y)
Single Family Residential Demand per Service
SFR
AVG
AVG-SD
AVG+SD
DOM PAWS 2015 Demand Per Service 5/9/2016

Demand Per Service
0
10,000
20,000
30,000
40,000
50,000
60,000
70,000
80,000
90,000
1990 1995 2000 2005 2010 2015
Dem
an
d p
er S
erv
ice
(Ga
llo
ns/
da
y)
Industrial Demand per Service
IND
AVG
AVG-SD
AVG+SD
0
500
1,000
1,500
2,000
2,500
3,000
3,500
1990 1995 2000 2005 2010 2015
Dem
an
d p
er S
erv
ice (
Ga
llo
ns/
da
y)
Commercial Demand per Service
COM
AVG
AVG-SD
AVG+SD
DOM PAWS 2015 Demand Per Service 5/9/2016

Demand Per Service
0
1,000
2,000
3,000
4,000
5,000
6,000
7,000
8,000
9,000
10,000
1990 1995 2000 2005 2010 2015
Dem
an
d p
er S
erv
ice
(Ga
llo
ns/
da
y)
Government Demand per Service
GOV
AVG
AVG-SD
AVG+SD
0
0
0
0
0
1
1
1
1
1
1
1980 1985 1990 1995 2000 2005 2010 2015 2020
Dem
an
d p
er S
erv
ice
(Ga
llo
ns/
da
y)
Reclaimed Demand per Service
REC
AVG
AVG-SD
AVG+SD
DOM PAWS 2015 Demand Per Service 5/9/2016

Demand Per Service
0
1,000
2,000
3,000
4,000
5,000
6,000
7,000
8,000
9,000
1990 1995 2000 2005 2010 2015
Dem
an
d p
er S
erv
ice (
Ga
llo
ns/
da
y)
Other Demand per Service
OTH
AVG
AVG-SD
AVG+SD
-50
-30
-10
10
30
50
70
90
1990 1995 2000 2005 2010 2015
Dem
an
d p
er S
erv
ice (
Ga
llo
ns/
da
y)
Un-accounted for Water Demand per Service
UAFW
AVG
AVG-SD
AVG+SD
DOM PAWS 2015 Demand Per Service 5/9/2016

Percent Change
California Water Service Company - Dominguez District Worksheet 5
Water Supply and Demand Analysis and Projections
Percentage Change in Annual Demand
Year Residential Multi Res Commercial Industrial Government Reclaimed Other Unaccounted Total
19901991
1992
1993 3.10% -4.18% 0.35% -11.48% -5.42% -15.38% -182.77% -3.48%
1994 3.64% 2.61% 1.15% -1.21% 17.14% -25.59% 350.50% 2.27%
1995 -0.66% -0.47% 2.08% 21.63% -2.57% 137.60% -75.46% 6.41%1996 6.41% 4.27% 6.03% -35.62% -0.96% 2.97% -82.17% -8.07%
1997 2.81% 1.79% 10.66% 16.87% 2.15% 36.11% 222.90% 8.05%
1998 -7.53% -3.70% -9.81% 0.37% -19.70% -8.32% 126.05% -6.62%
1999 5.42% 2.86% 5.71% 24.92% 12.77% 46.23% -194.14% 10.99%
2000 2.93% 7.04% 11.52% -27.36% 14.03% 107.46% -122.94% -2.53%2001 -3.63% -5.89% -6.28% -9.73% 6.58% -70.08% 988.84% -5.96%
2002 5.24% 3.55% 5.93% 21.87% -1.93% -26.00% -89.16% 8.21%
2003 5.48% -1.43% -11.57% 4.93% -20.95% 66.41% 758.06% -1.68%
2004 -2.35% 0.93% -2.78% 21.22% 5.74% 54.65% -37.11% 4.57%
2005 -6.99% -6.64% -7.03% 6.42% -9.39% -78.41% -90.35% -3.49%2006 1.30% -0.39% 3.35% 12.12% -6.46% -39.29% -728.59% 4.73%
2007 3.06% -1.07% 2.10% 3.72% 13.74% 5.31% 100.86% 3.23%
2008 -4.88% -7.38% -4.15% 0.08% -11.76% 514.41% 101.61% -3.14%
2009 -4.52% -4.18% -9.49% -25.88% -15.21% -29.87% 5.05% -13.99%
2010 -6.40% -4.13% -1.88% 5.96% -3.23% -44.68% -123.70% -1.28%2011 -2.20% 1.76% 0.67% -8.80% -7.74% 4.31% -24.08% -3.69%
2012 1.04% 1.25% 14.11% 4.30% 1.55% -20.98% 13.87% 5.16%
2013 0.79% 2.29% 1.73% -0.35% 4.70% 86.78% 36.16% 1.10%
2014 -6.46% -8.26% -2.95% 10.16% 15.93% -39.10% -21.38% 0.35%
2015 -13.45% -5.65% -2.55% -5.81% -19.74% -7.09% 8.53% -7.80%
DOM PAWS 2015 Percent Change 5/9/2016

Percent Change
PAGE LEFT BLANK INTENTIONALLY
DOM PAWS 2015 Percent Change 5/9/2016

Percent Total
Residential
26.1%
Multi Res
7.9%
Commercial
26.3%
Industrial
35.1%
Government
4.3%
Reclaimed
0.0%Other
0.2%
Percent of Total Sales by Type of Use
(2015)
DOM PAWS 2015 Percent Total 5/9/2016

Percent Total
California Water Service Company - Dominguez District Worksheet 6
Water Supply and Demand Analysis and Projections
Percentage of Total Sales
Percent
Year Residential Multi Res Commercial Industrial Government Reclaimed Other Total
19901991
1992 28.92% 9.31% 23.20% 32.28% 6.11% 0.00% 0.18% 100.00%
1993 30.89% 9.24% 24.12% 29.60% 5.99% 0.00% 0.16% 100.00%
1994 31.30% 9.27% 23.85% 28.59% 6.86% 0.00% 0.11% 100.00%
1995 29.22% 8.67% 22.88% 32.68% 6.28% 0.00% 0.26% 100.00%1996 33.82% 9.84% 26.39% 22.89% 6.77% 0.00% 0.29% 100.00%
1997 32.18% 9.27% 27.03% 24.76% 6.40% 0.00% 0.36% 100.00%
1998 31.87% 9.56% 26.11% 26.61% 5.50% 0.00% 0.36% 100.00%
1999 30.27% 8.86% 24.86% 29.95% 5.59% 0.00% 0.47% 100.00%
2000 31.97% 9.73% 28.45% 22.32% 6.54% 0.00% 1.00% 100.00%2001 32.76% 9.74% 28.35% 21.43% 7.41% 0.00% 0.32% 100.00%
2002 31.86% 9.32% 27.75% 24.13% 6.72% 0.00% 0.22% 100.00%
2003 34.18% 9.34% 24.96% 25.75% 5.40% 0.00% 0.37% 100.00%
2004 31.92% 9.02% 23.21% 29.85% 5.46% 0.00% 0.54% 100.00%
2005 30.76% 8.72% 22.35% 32.92% 5.13% 0.00% 0.12% 100.00%2006 29.75% 8.29% 22.06% 35.24% 4.58% 0.00% 0.07% 100.00%
2007 29.70% 7.95% 21.82% 35.41% 5.05% 0.00% 0.07% 100.00%
2008 29.17% 7.60% 21.59% 36.59% 4.60% 0.00% 0.46% 100.00%
2009 32.38% 8.47% 22.72% 31.53% 4.53% 0.00% 0.37% 100.00%
2010 30.70% 8.22% 22.58% 33.84% 4.44% 0.00% 0.21% 100.00%2011 31.18% 8.69% 23.60% 32.05% 4.26% 0.00% 0.23% 100.00%
2012 29.96% 8.37% 25.61% 31.79% 4.11% 0.00% 0.17% 100.00%
2013 29.87% 8.46% 25.77% 31.33% 4.26% 0.00% 0.31% 100.00%
2014 27.84% 7.74% 24.92% 34.39% 4.92% 0.00% 0.19% 100.00%
2015 26.13% 7.92% 26.34% 35.13% 4.28% 0.00% 0.19% 100.00%
DOM PAWS 2015 Percent Total 5/9/2016
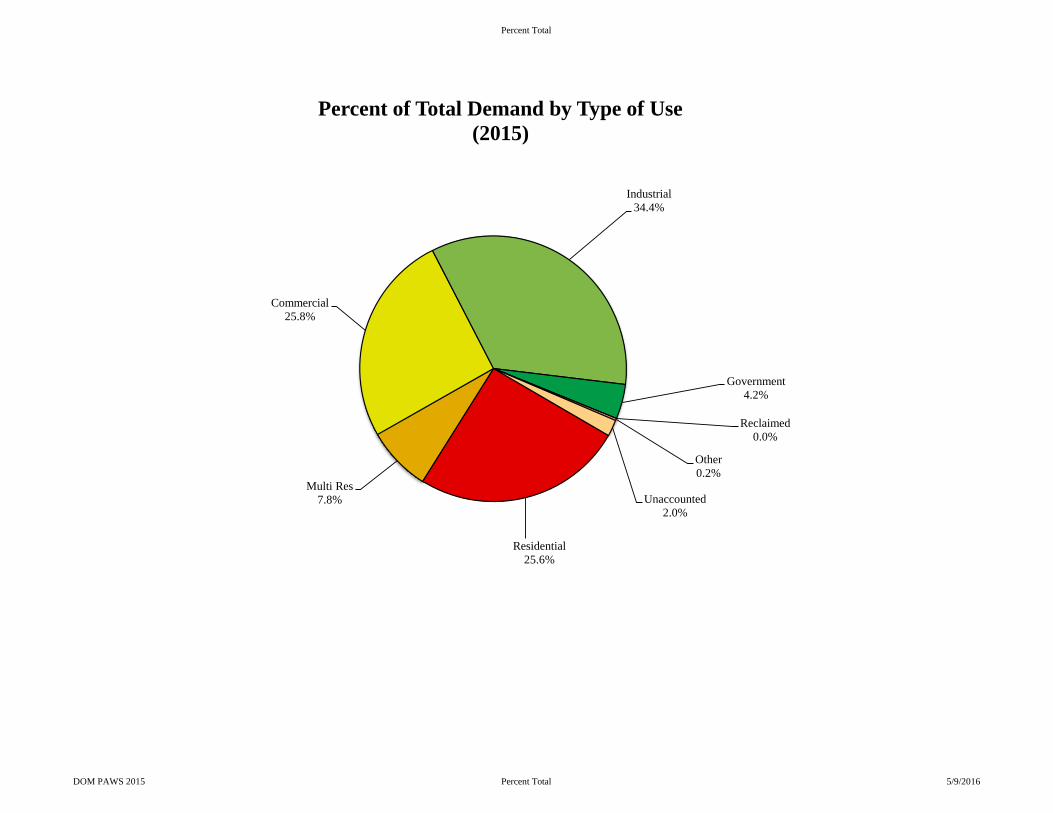
Percent Total
Residential
25.6%
Multi Res
7.8%
Commercial
25.8%
Industrial
34.4%
Government
4.2%
Reclaimed
0.0%
Other
0.2%
Unaccounted
2.0%
Percent of Total Demand by Type of Use
(2015)
DOM PAWS 2015 Percent Total 5/9/2016

Percent Total
California Water Service Company - Dominguez District Worksheet 7
Water Supply and Demand Analysis and Projections
Percentage of Total Demand
Percent
Year Residential Multi Res Commercial Industrial Government Reclaimed Other Unaccounted Total
1990
1991
1992
1993 30.41% 9.10% 23.74% 29.14% 5.90% 0.00% 0.16% 1.55% 100.00%
1994 29.27% 8.67% 22.31% 26.74% 6.42% 0.00% 0.11% 6.47% 100.00%
1995 28.76% 8.54% 22.52% 32.17% 6.18% 0.00% 0.25% 1.57% 100.00%
1996 33.72% 9.81% 26.31% 22.82% 6.75% 0.00% 0.29% 0.31% 100.00%
1997 31.89% 9.18% 26.78% 24.53% 6.34% 0.00% 0.36% 0.92% 100.00%
1998 31.17% 9.35% 25.53% 26.03% 5.38% 0.00% 0.35% 2.19% 100.00%
1999 30.86% 9.03% 25.35% 30.53% 5.70% 0.00% 0.48% -1.94% 100.00%
2000 31.82% 9.68% 28.32% 22.22% 6.51% 0.00% 0.99% 0.44% 100.00%
2001 31.15% 9.26% 26.96% 20.37% 7.05% 0.00% 0.30% 4.92% 100.00%
2002 31.70% 9.27% 27.61% 24.01% 6.68% 0.00% 0.22% 0.52% 100.00%
2003 32.70% 8.94% 23.88% 24.64% 5.17% 0.00% 0.35% 4.33% 100.00%
2004 31.07% 8.78% 22.59% 29.06% 5.32% 0.00% 0.53% 2.65% 100.00%
2005 30.68% 8.70% 22.29% 32.83% 5.11% 0.00% 0.12% 0.27% 100.00%
2006 30.25% 8.43% 22.43% 35.83% 4.66% 0.00% 0.07% -1.66% 100.00%
2007 30.68% 8.21% 22.53% 36.57% 5.21% 0.00% 0.07% -3.28% 100.00%
2008 31.24% 8.14% 23.12% 39.18% 4.92% 0.00% 0.49% -7.08% 100.00%
2009 35.23% 9.21% 24.72% 34.30% 4.93% 0.00% 0.40% -8.79% 100.00%
2010 30.12% 8.07% 22.15% 33.20% 4.36% 0.00% 0.20% 1.90% 100.00%
2011 30.71% 8.56% 23.25% 31.56% 4.19% 0.00% 0.22% 1.51% 100.00%
2012 29.47% 8.23% 25.19% 31.27% 4.04% 0.00% 0.17% 1.63% 100.00%
2013 29.21% 8.28% 25.21% 30.65% 4.16% 0.00% 0.31% 2.18% 100.00%
2014 27.36% 7.61% 24.50% 33.80% 4.83% 0.00% 0.19% 1.72% 100.00%
2015 25.61% 7.76% 25.81% 34.43% 4.19% 0.00% 0.19% 2.02% 100.00%
DOM PAWS 2015 Percent Total 5/9/2016

TOT Cht
DOM PAWS 2015 TOT Cht 5/9/2016
0
5,000
10,000
15,000
20,000
25,000
30,000
35,000
40,000
45,000
50,000
1980 1985 1990 1995 2000 2005 2010 2015 2020 2025 2030 2035 2040
Serv
ice
sHistorical & Projected Services
Annual Services
Projection
2010 UWMP
Water Supply and Facility Master Plan
Serv Proj
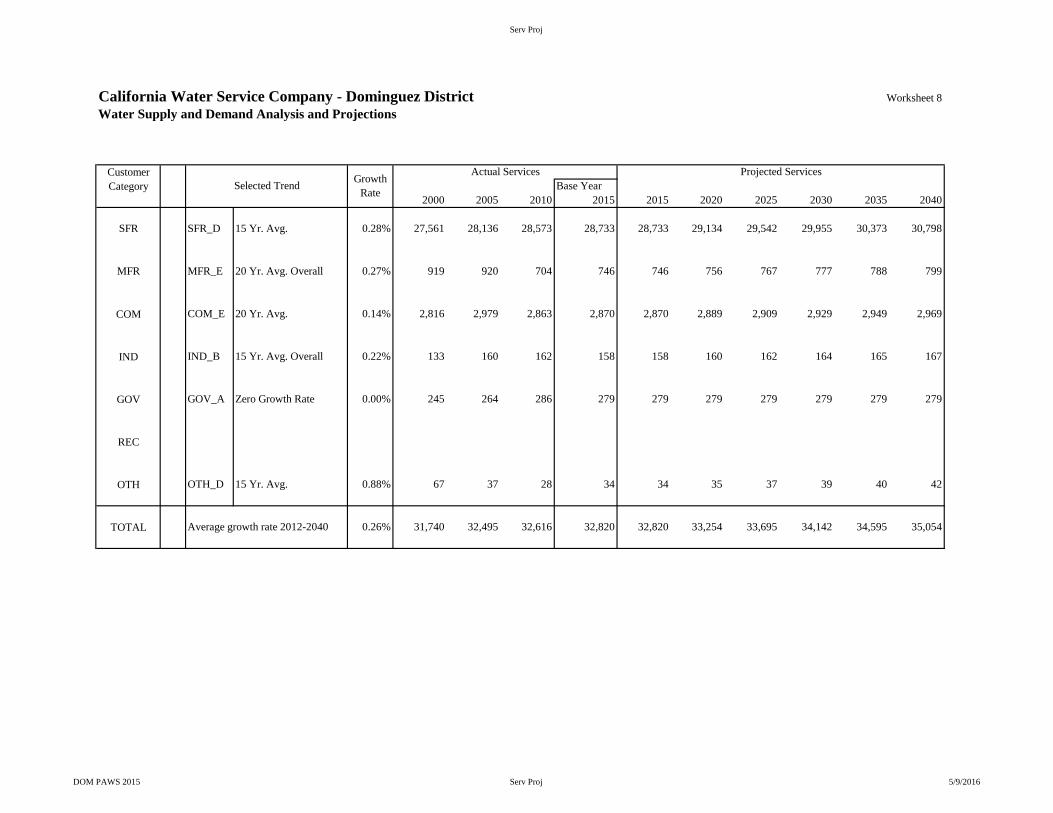
California Water Service Company - Dominguez District Worksheet 8
Water Supply and Demand Analysis and Projections
Customer
Category Base Year
2000 2005 2010 2015 2015 2020 2025 2030 2035 2040
SFR SFR_D 15 Yr. Avg. 0.28% 27,561 28,136 28,573 28,733 28,733 29,134 29,542 29,955 30,373 30,798
MFR MFR_E 20 Yr. Avg. Overall 0.27% 919 920 704 746 746 756 767 777 788 799
COM COM_E 20 Yr. Avg. 0.14% 2,816 2,979 2,863 2,870 2,870 2,889 2,909 2,929 2,949 2,969
IND IND_B 15 Yr. Avg. Overall 0.22% 133 160 162 158 158 160 162 164 165 167
GOV GOV_A Zero Growth Rate 0.00% 245 264 286 279 279 279 279 279 279 279
REC
OTH OTH_D 15 Yr. Avg. 0.88% 67 37 28 34 34 35 37 39 40 42
TOTAL Average growth rate 2012-2040 0.26% 31,740 32,495 32,616 32,820 32,820 33,254 33,695 34,142 34,595 35,054
Actual Services Projected Services
Selected TrendGrowth
Rate
DOM PAWS 2015 Serv Proj 5/9/2016

Serv Proj
California Water Service Company - Dominguez District Worksheet 8a
Water Supply and Demand Analysis and Projections
SFR Historical & Projected Services
Customer
Category Base Year Services Services Services Services Services Services
2000 2005 2010 2015 2015 2020 2025 2030 2035 2040
SFR 27,561 28,136 28,573 28,733
SFR_A Zero Growth Rate 0.00% 28,733 28,733 28,733 28,733 28,733 28,733 28,733
SFR_B 5 Yr. Avg. 0.11% 28,733 28,733 28,891 29,050 29,211 29,372 29,534
SFR_C 10 Yr. Avg. 0.21% 28,733 28,733 29,036 29,342 29,651 29,964 30,280
> SFR_D 15 Yr. Avg. 0.28% 28,733 28,733 29,134 29,542 29,955 30,373 30,798
SFR_E 20 Yr. Avg. 0.31% 28,733 28,733 29,174 29,621 30,076 30,537 31,006
TrendGrowth
Rate
Actual Projected
0
5,000
10,000
15,000
20,000
25,000
30,000
35,000
1990 1995 2000 2005 2010 2015 2020 2025 2030 2035 2040
SF
R S
erv
ices
Annual Services
Monthly Data
SFR_A
SFR_B
SFR_C
SFR_D
SFR_E
DOM PAWS 2015 Serv Proj 5/9/2016

Serv Proj
California Water Service Company - Dominguez District Worksheet 8b
Water Supply and Demand Analysis and Projections
MFR Historical & Projected Services
Customer
Category Base Year Services Services Services Services Services Services
2000 2005 2010 2015 2015 2020 2025 2030 2035 2040
MFR 919 920 704 746
MFR_A Zero Growth Rate 0.00% 746 746 746 746 746 746 746
MFR_B 5 Yr. Avg. Overall 0.13% 746 746 751 756 760 765 770
MFR_C 10 Yr. Avg. Overall 0.10% 746 746 750 754 758 761 765
MFR_D 15 Yr. Avg. Overall 0.22% 746 746 755 763 772 780 789
> MFR_E 20 Yr. Avg. Overall 0.27% 746 746 756 767 777 788 799
TrendGrowth
Rate
Actual Projected
0
200
400
600
800
1,000
1,200
1980 1985 1990 1995 2000 2005 2010 2015 2020 2025 2030 2035 2040
MF
R S
erv
ices
Annual Data
Monthly Data
MFR_A
MFR_B
MFR_C
MFR_D
MFR_E
DOM PAWS 2015 Serv Proj 5/9/2016

Serv Proj
California Water Service Company - Dominguez District Worksheet 8c
Water Supply and Demand Analysis and Projections
COM Historical & Projected Services
Customer
Category Base Year Services Services Services Services Services Services
2000 2005 2010 2015 2015 2020 2025 2030 2035 2040
COM 2,816 2,979 2,863 2,870
COM_A Zero Growth Rate 0.00% 2,870 2,870 2,870 2,870 2,870 2,870 2,870
COM_B 5 Yr. Avg. 0.05% 2,870 2,870 2,877 2,884 2,891 2,898 2,905
COM_C 10 Yr. Avg. -0.37% 2,870 2,870 2,818 2,767 2,716 2,667 2,619
COM_D 15 Yr. Avg. 0.14% 2,870 2,870 2,889 2,909 2,929 2,949 2,969
> COM_E 20 Yr. Avg. 0.14% 2,870 2,870 2,889 2,909 2,929 2,949 2,969
TrendGrowth
Rate
Actual Projected
1,200
1,400
1,600
1,800
2,000
2,200
2,400
2,600
2,800
3,000
3,200
1980 1985 1990 1995 2000 2005 2010 2015 2020 2025 2030 2035 2040
CO
M S
erv
ices
Annual Services
Monthly Data
COM_A
COM_B
COM_C
COM_D
COM_E
DOM PAWS 2015 Serv Proj 5/9/2016

Serv Proj
California Water Service Company - Dominguez District Worksheet 8d
Water Supply and Demand Analysis and Projections
IND Historical & Projected Services
Customer
Category Base Year Services Services Services Services Services Services
2000 2005 2010 2015 2015 2020 2025 2030 2035 2040
IND 133 160 162 158
IND_A Zero Growth Rate 0.00% 158 158 158 158 158 158 158
> IND_B 15 Yr. Avg. Overall 0.22% 158 158 160 162 164 165 167
IND_C 10 Yr. Avg. -0.13% 158 158 157 156 155 154 153
IND_D 15 Yr. Avg. 1.21% 158 158 168 178 190 201 214
IND_E 20 Yr. Avg. 1.00% 158 158 166 175 184 193 203
TrendGrowth
Rate
Actual Projected
0
50
100
150
200
250
1980 1985 1990 1995 2000 2005 2010 2015 2020 2025 2030 2035 2040
IND
Ser
vic
esAnnual Services
Monthly Data
IND_A
IND_B
IND_C
IND_D
IND_E
DOM PAWS 2015 Serv Proj 5/9/2016

Serv Proj
California Water Service Company - Dominguez District Worksheet 8e
Water Supply and Demand Analysis and Projections
GOV Historical & Projected Services
Customer
Category Base Year Services Services Services Services Services Services
2000 2005 2010 2015 2015 2020 2025 2030 2035 2040
GOV 245 264 286 279
> GOV_A Zero Growth Rate 0.00% 279 279 279 279 279 279 279
GOV_B 5 Yr. Avg. -0.50% 279 279 272 265 259 252 246
GOV_C 10 Yr. Avg. 0.55% 279 279 286 294 303 311 320
GOV_D 15 Yr. Avg. 0.88% 279 279 291 304 318 332 347
GOV_E 20 Yr. Avg. 1.14% 279 279 295 312 330 349 370
TrendGrowth
Rate
Actual Projected
0
50
100
150
200
250
300
350
400
450
500
1980 1985 1990 1995 2000 2005 2010 2015 2020 2025 2030 2035 2040
GO
V S
erv
ices
Annual Services
Monthly Data
GOV_A
GOV_B
GOV_C
GOV_D
GOV_E
DOM PAWS 2015 Serv Proj 5/9/2016

Serv Proj
California Water Service Company - Dominguez District Worksheet 8f
Water Supply and Demand Analysis and Projections
REC Historical & Projected Services
Customer
Category Base Year Services Services Services Services Services Services
2000 2005 2010 0 0 0 0 0 0
REC 0 0 0 0
REC_A Zero Growth Rate 0.00% 0 0 0 0 0 0 0
REC_B 5 Yr. Avg. 0.00% 0 0 0 0 0 0 0
REC_C 10 Yr. Avg. 0.00% 0 0 0 0 0 0 0
REC_D 15 Yr. Avg. 0.00% 0 0 0 0 0 0 0
REC_E 20 Yr. Avg. 0.00% 0 0 0 0 0 0 0
> REC_F User 1.00% 0 0 0 0 0 0 0
TrendGrowth
Rate
Actual Projected
0
5
10
15
20
25
30
35
40
1980 1985 1990 1995 2000 2005 2010 2015 2020 2025 2030 2035 2040
RE
C S
erv
ices
Annual Services
Monthly Data
REC_C
REC_B
REC_A
REC_C
REC_E
Series6
DOM PAWS 2015 Serv Proj 5/9/2016

Serv Proj
California Water Service Company - Dominguez District Worksheet 8g
Water Supply and Demand Analysis and Projections
OTH Historical & Projected Services
Customer
Category Base Year Services Services Services Services Services Services
2000 2005 2010 2015 2015 2020 2025 2030 2035 2040
OTH 67 37 28 34
OTH_A Zero Growth Rate 0.00% 34 34 34 34 34 34 34
OTH_B 5 Yr. Avg. 4.20% 34 34 42 51 63 77 95
OTH_C 10 Yr. Avg. 0.55% 34 34 35 36 37 38 39
> OTH_D 15 Yr. Avg. 0.88% 34 34 35 37 39 40 42
OTH_E 20 Yr. Avg. 1.14% 34 34 36 38 40 42 45
TrendGrowth
Rate
Actual Projected
0
5
10
15
20
25
30
35
40
45
50
1980 1985 1990 1995 2000 2005 2010 2015 2020 2025 2030 2035 2040
OT
H S
erv
ices
Annual Services
Monthly Data
OTH_C
OTH_B
OTH_A
OTH_D
OTH_E
DOM PAWS 2015 Serv Proj 5/9/2016

Serv Proj
PAGE LEFT BLANK INTENTIONALLY
DOM PAWS 2015 Serv Proj 5/9/2016

Projected Demand Graph
DOM PAWS 2015 Projected Demand Graph 5/9/2016
0.000
8.927
17.854
26.781
35.708
44.635
53.562
0
10,000
20,000
30,000
40,000
50,000
60,000
1980 1985 1990 1995 2000 2005 2010 2015 2020 2025 2030 2035 2040
His
tori
cal
& P
roje
cte
d D
ema
nd
(m
gd
)
His
tori
cal
& P
roje
cte
d D
ema
nd
(A
cre-F
eet)
Year
Historical & Projected Demand (DOM)
(without recycled water)
Historical Demand
AVG+SD
AVG
AVG w/ Cons
AVG-SD
Water Supply and Facility Master Plan
2010 UWMP

Demand Proj
California Water Service Company - Dominguez District Worksheet 9
Water Supply and Demand Analysis and Projections
Customer
Category
1980 1985 1990 1995 2000 2005 2010 2015 2015 2020 2025 2030 2035 2040
11,992 12,160 12,330 12,502 12,677 12,854
SFR 10,497 11,524 11,196 9,937 8,012 10,876 11,028 11,182 11,338 11,497 11,657
9,759 9,895 10,033 10,174 10,316 10,460
2,845 2,884 2,923 2,964 3,004 3,045
MFR 3,116 3,507 3,174 2,661 2,428 2,729 2,766 2,804 2,843 2,882 2,921
2,613 2,649 2,685 2,722 2,759 2,797
8,797 8,857 8,917 8,978 9,039 9,101
COM 8,221 10,255 8,137 7,308 8,077 7,976 8,031 8,086 8,141 8,196 8,252
7,156 7,205 7,254 7,303 7,353 7,403
12,940 13,086 13,233 13,382 13,532 13,685
IND 11,741 8,046 11,982 10,953 10,772 11,418 11,547 11,677 11,808 11,941 12,075
9,896 10,008 10,120 10,234 10,349 10,466
2,233 2,233 2,233 2,233 2,233 2,233
GOV 2,257 2,358 1,867 1,438 1,312 1,661 1,661 1,661 1,661 1,661 1,661
1,089 1,089 1,089 1,089 1,089 1,089
0 0 0 0 0 0
REC 0 0 0 0 0 0 0 0 0 0 0
0 0 0 0 0 0
178 186 194 203 212 221
OTH 92 359 44 67 59 115 120 125 131 137 143
51 54 56 59 61 64
1,784 1,807 1,831 1,856 1,880 1,905
UAWF 573 161 99 628 631 595 603 611 619 628 636
0 0 0 0 0 0
40,769 41,212 41,662 42,117 42,578 43,045
TOTAL (AFY) 36,497 36,210 36,499 32,992 31,291 35,370 35,755 36,145 36,540 36,940 37,345
30,564 30,898 31,237 31,580 31,927 32,279
36.396 36.792 37.193 37.600 38.011 38.428
TOTAL (MGD) 32.583 32.326 32.584 29.454 27.934 31.576 31.920 32.268 32.621 32.978 33.339
27.286 27.584 27.887 28.193 28.503 28.817
Actual Demand (AFY) Projected Demand (AFY)
DOM PAWS 2015 Demand Proj 5/9/2016

Projected Sources Graph
DOM PAWS 2015 Projected Sources Graph 5/9/2016
0
5,000
10,000
15,000
20,000
25,000
30,000
35,000
40,000
45,000
19
92
19
93
19
94
19
95
19
96
19
97
19
98
19
99
20
00
20
01
20
02
20
03
20
04
20
05
20
06
20
07
20
08
20
09
20
10
20
11
20
12
20
13
20
14
20
15
20
16
20
17
20
18
20
19
20
20
20
21
20
22
20
23
20
24
20
25
20
26
20
27
20
28
20
29
20
30
20
31
20
32
20
33
20
34
20
35
20
36
20
37
20
38
20
39
20
40
Pro
duct
ion i
n A
cre-
Fee
t
Year
Historical and Projected Distribution of Demand by Source
Groundwater Purchased Water Conservation
Historical Projected

Sources
California Water Service Company - Dominguez DistrictWater Supply and Demand Analysis and Projections
Historical and Projected Distribution of Demand by Source
Year MGD AFY MGD AFY MGD AFY MGD AFY MGD AFY Year MGD AFY MGD AFY MGD AFY MGD AFY MGD AFY
1980
1981 2011 19.97 22,371 8.28 9,275 0.00 0 0.00 0 28.25 31,646
1982 2012 22.61 25,330 7.13 7,991 0.00 0 0.00 0 29.75 33,321
1983 2013 25.00 28,005 5.24 5,872 0.00 0 0.00 0 30.24 33,877 /\
1984 2014 24.87 27,858 5.34 5,977 0.00 0 0.00 0 30.21 33,835 |
1985 2015 24.00 26,886 3.93 4,405 0.00 0 0.00 0 27.93 31,291 ACTUAL
1986 2016 20.29 22,726 6.61 7,405 0.00 0 4.75 5,316 31.64 35,446 PROJECTED
1987 2017 17.06 19,104 9.29 10,405 0.00 0 5.37 6,014 31.71 35,523 |
1988 2018 13.82 15,479 11.97 13,405 0.00 0 6.00 6,717 31.78 35,600 \/
1989 2019 10.58 11,850 14.65 16,405 0.00 0 6.63 7,423 31.85 35,678
1990 2020 9.57 10,725 15.08 16,897 0.00 0 7.26 8,133 31.92 35,755
1991 2021 9.64 10,801 15.08 16,897 0.00 0 7.26 8,134 31.99 35,833
1992 24.07 26,965 5.90 6,607 0.00 0 29.97 33,572 2022 9.71 10,878 15.08 16,897 0.00 0 7.26 8,136 32.06 35,910
1993 29.93 33,529 0.00 0 0.00 0 29.93 33,529 2023 9.78 10,954 15.08 16,897 0.00 0 7.26 8,137 32.13 35,988
1994 28.65 32,090 3.58 4,006 0.00 0 32.22 36,096 2024 9.85 11,031 15.08 16,897 0.00 0 7.27 8,138 32.20 36,067
1995 23.02 25,784 9.56 10,713 0.00 0 32.58 36,497 2025 9.92 11,108 15.08 16,897 0.00 0 7.27 8,140 32.27 36,145
1996 13.60 15,234 15.97 17,893 0.00 0 29.57 33,127 2026 9.99 11,186 15.08 16,897 0.00 0 7.27 8,141 32.34 36,224
1997 17.38 19,464 14.78 16,550 0.00 0 32.15 36,014 2027 10.06 11,263 15.08 16,897 0.00 0 7.27 8,142 32.41 36,303
1998 17.64 19,759 12.78 14,310 0.00 0 30.41 34,069 2028 10.12 11,341 15.08 16,897 0.00 0 7.27 8,143 32.48 36,382
1999 19.62 21,980 12.77 14,303 0.00 0 32.39 36,283 2029 10.19 11,419 15.08 16,897 0.00 0 7.27 8,145 32.55 36,461
2000 19.15 21,454 13.17 14,756 0.00 0 32.33 36,210 2030 10.26 11,497 15.08 16,897 0.00 0 7.27 8,146 32.62 36,540
2001 21.98 24,622 9.85 11,032 0.00 0 31.83 35,654 2031 10.33 11,576 15.08 16,897 0.00 0 7.27 8,147 32.69 36,620
2002 25.10 28,113 7.82 8,759 0.00 0 32.92 36,872 2032 10.40 11,654 15.08 16,897 0.00 0 7.27 8,148 32.76 36,699
2003 26.42 29,600 7.23 8,099 0.00 0 33.66 37,699 2033 10.47 11,733 15.08 16,897 0.00 0 7.28 8,149 32.83 36,779
2004 29.08 32,570 5.51 6,171 0.00 0 34.59 38,740 2034 10.55 11,812 15.08 16,897 0.00 0 7.28 8,150 32.91 36,860
2005 28.73 32,184 3.85 4,315 0.00 0 32.58 36,499 2035 10.62 11,891 15.08 16,897 0.00 0 7.28 8,152 32.98 36,940
2006 28.47 31,885 5.01 5,612 0.00 0 33.48 37,498 2036 10.69 11,971 15.08 16,897 0.00 0 7.28 8,153 33.05 37,021
2007 26.38 29,548 7.63 8,552 0.00 0 34.01 38,100 2037 10.76 12,051 15.08 16,897 0.00 0 7.28 8,154 33.12 37,101
2008 22.97 25,726 8.81 9,869 0.00 0 31.78 35,596 2038 10.83 12,131 15.08 16,897 0.00 0 7.28 8,155 33.19 37,182
2009 18.56 20,784 8.35 9,351 0.00 0 26.90 30,136 2039 10.90 12,211 15.08 16,897 0.00 0 7.28 8,156 33.27 37,264
2010 21.11 23,645 8.34 9,347 0.00 0 29.45 32,992 2040 10.97 12,291 15.08 16,897 0.00 0 7.28 8,157 33.34 37,345
Purchased
Water
Purchased Reclaimed
Water Water
Ground
Water
Worksheet 10
TotalTotalReclaimed
Water
Conservation ConservationGround
Water
DOM PAWS 2015 Sources 5/9/2016

PerCapita chart
DOM PAWS 2015 PerCapita chart 5/9/2016
0
50
100
150
200
250
300
1995 2000 2005 2010 2015 2020 2025 2030 2035 2040
Ga
llo
ns
Per
Ca
pit
a
Per
Da
y
Year
Gross Per Capita Consumption (DOM)
Potable Demand
Residential Only
Avg Demand
Avg Demand w/ Cons
SBx7-7 Targets

PerCapita
California Water Service Company - Dominguez District Worksheet 15
Water Supply and Demand Analysis and Projections
Gross Per Capita Water Demand Calculation
Per Capita Per Capita Per Capita Demand Per Capita Demand Per Capita Demand Per Capita 2015 193
(GPCPD) (GPCPD) (GPCPD) (AFY) (GPCPD) (AFY) (GPCPD) (AFY) (GPCPD) 2020 171
1995 134,702 36,497 242 36,497 242 13,614 90
1996 134,967 33,127 219 33,127 219 14,420 95
1997 136,136 36,014 236 36,014 236 14,792 97
1998 137,060 34,069 222 34,069 222 13,805 90
1999 138,195 36,283 234 36,283 234 14,472 93
2000 139,558 36,210 232 36,210 232 15,030 96
2001 139,731 35,654 228 35,654 228 14,405 92
2002 139,709 36,872 236 36,872 236 15,105 97
2003 139,584 37,699 241 37,699 241 15,696 100
2004 140,175 38,740 247 38,740 247 15,438 98
2005 140,545 36,499 232 36,499 232 14,370 91
2006 140,614 37,498 238 37,498 238 14,503 92
2007 140,485 38,100 242 38,100 242 14,817 94
2008 140,679 35,596 226 35,596 226 14,016 89
2009 141,021 30,136 191 30,136 191 13,393 85
2010 141,105 32,992 209 32,992 209 12,598 80
2011 141,093 31,646 200 31,646 200 12,427 79
2012 141,626 33,321 210 33,321 210 12,562 79
2013 141,801 33,877 213 33,877 213 12,702 80
2014 142,111 33,835 213 33,835 213 11,831 74
2015 142,231 31,291 196 31,291 196 10,440 66
2016 142,624 35,446 222 35,446 222 30,131 189
2017 143,018 35,523 222 35,523 222 29,509 184
2018 143,413 35,600 222 35,600 222 28,884 180
2019 143,809 35,678 221 35,678 221 28,255 175
2020 144,206 35,755 221 35,755 221 27,622 171
2025 146,208 36,145 221 36,145 221 28,005 171
2030 148,238 36,540 220 36,540 220 28,394 171
2035 150,296 36,940 219 36,940 219 28,788 171
2040 152,383 37,345 219 37,345 219 29,188 171
Year Usage
(AFY)
Gross Demand Residential Only
Usage
(AFY)
POP Usage
(AFY)
Historical Projected
Avg Demand Avg Demand w/ Cons SBx7-7 TargetsPotable Demand Avg Potable Demand
DOM PAWS 2015 PerCapita 5/9/2016

Demand Grph
DOM PAWS 2015 Demand Grph 5/9/2016
0
20
40
60
80
100
1980 1985 1990 1995 2000 2005 2010 2015
Dem
and i
n M
illi
on G
allo
ns
per
Day
Year
Average Day, Maximum Day, Peak Demand
Average Day Demand Est. Maximum Day Demand Maximum Day Demand (old) Estimated Peak Hour Demand

ADD MDD PHD
California Water Service Company - Dominguez District Worksheet 11
Water Supply and Demand Analysis and Projections
Historical and Projected Average Day, Maximum Day, and Peak Demand
Historical Annual Average Day Demand Est. Maximum Day Demand MDD PHD PHD PHD
Demand Demand Demand Per Service Demand Per Service ADD MDD ADD MDD
Year (AFY) (MGY) (MGD) (GPD) (MGD) (GPD) Ratio (MGD) (GPM) Ratio Ratio (MGD) (GPM) Ratio
19801981
1982
1983
1984
19851986
1987
1988
1989
19901991
1992 33,572 10,940 29.97 970
1993 33,529 10,925 29.93 967
1994 36,096 11,762 32.22 1,039
1995 36,497 11,893 32.58 1,0481996 33,127 10,794 29.57 949
1997 36,014 11,735 32.15 1,025
1998 34,069 11,101 30.41 967
1999 36,283 11,823 32.39 1,026
2000 36,210 11,799 32.33 1,018 58.95 1,857 1.82 88.42 61,403 1.50 2.742001 35,654 11,618 31.83 998 59.08 1,852 1.86 88.62 61,545 1.50 2.78
2002 36,872 12,015 32.92 1,027 58.72 1,832 1.78 88.08 61,164 1.50 2.68
2003 37,699 12,284 33.66 1,049 62.75 1,957 1.86 94.13 65,370 1.50 2.80
2004 38,740 12,624 34.59 1,071 61.19 1,894 1.77 91.78 63,735 1.50 2.65
2005 36,499 11,893 32.58 1,003 56.64 1,743 1.74 84.96 59,003 1.50 2.612006 37,498 12,219 33.48 1,027 61.38 1,884 1.83 92.07 63,936 1.50 2.75
2007 38,100 12,415 34.01 1,044 63.49 1,948 1.87 95.23 66,134 1.50 2.80
2008 35,596 11,599 31.78 977 57.05 1,754 1.80 85.57 59,427 1.50 2.69
2009 30,136 9,820 26.90 827 47.28 1,454 1.76 70.92 49,252 1.50 2.64
2010 32,992 10,751 29.45 903 51.76 1,587 1.76 77.65 53,920 1.50 2.642011 31,646 10,312 28.25 864 49.36 1,509 1.75 74.04 51,415 1.50 2.62
2012 33,321 10,858 29.75 909 54.24 1,658 1.82 81.36 56,497 1.50 2.73
2013 33,877 11,039 30.24 924 55.53 1,697 1.84 83.30 57,848 1.50 2.75
2014 33,835 11,025 30.21 921 54.63 1,666 1.81 81.94 56,903 1.50 2.71
2015 31,291 10,196 27.93 851
10 year Average 30.20 925 55.14 1,690 1.80 82.70 57,434 1.50 2.69
5 year Average 29.28 894 53.10 1,623 1.79 79.66 55,317 1.50 2.69
Estimated Peak
Hour Demand
Measured Peak
Hour Demand
DOM PAWS 2015 ADD MDD PHD 5/9/2016

Marplot Summary
California Water Service Company - Dominguez District Worksheet 12
Water Supply and Demand Analysis and Projections
MarPlot Summary
System
Census
Tract
Blocks
Population
Housing
Units
(HU)
Density
Census
Tract
Blocks
Populatio
n
Housing
Units
(HU)
Density
Percentage
Population
Change
Percentage
HU
Change
Density
Change
Dominguez 889 139,558 44,631 3.13 930 141,105 45,021 3.13 1.1% 0.9% 0.2%
889 139,558 44,631 3.13 930 141,105 45,021 3.13 1.1% 0.9% 0.2%
US Census 2000 Summary US Census 2010 Summary 2000-2010 Change
MARPLOT disclaimer: The population and housing number given above are only rough estimates. They are based on the US Census B locks. Although Census Blocks are polygons,
MARPLOT uses the centoid, or center point, rather than the entire polygon. If a Census Block centroid is within any of the MA RPLOT selected objects, the population and housing numbers
for that block are tallied, even if only part of the block is within the selected object. It is possible for a block not be counted if its centroid is not within selected objects, even thought part of the block is within the selected objects.
DOM PAWS 2015 Marplot Summary 5/9/2016

HOU
DOM PAWS 2015 HOU 5/9/2016
0
10,000
20,000
30,000
40,000
50,000
60,000
1990 1995 2000 2005 2010 2015 2020 2025 2030 2035 2040
Ho
use
/Se
rvic
e C
ou
nt
Year
Housing Projections
Total Residential Dwelling Units
US Census
CDOF
WSFMP
Los Angeles County Economic Forecast
2012 Draft SCAG Projection

POP
DOM PAWS 2015 POP 5/9/2016
80,000
100,000
120,000
140,000
160,000
180,000
200,000
220,000
1995 2000 2005 2010 2015 2020 2025 2030 2035 2040
Po
pu
lati
on
Year
Population Projections
Cal Water Projection
US Census
CDOF
WSFMP Projection
Los Angeles County Economic Forecast
2010 UWMP
2012 Draft SCAG Projection

Population
California Water Service Company - Dominguez District Worksheet 12
Water Supply and Demand Analysis and Projections
Population Estimate
Single Family Flat Rate
Residential Residential Unit Residential
Services (DU) Services Units (DU) Density Services (DU)
2000 139,558 44,631 3.127 27,561 919 17,070 18.6 0
2010 141,105 45,021 3.134 28,573 704 16,448 23.4 0
1.1% 0.9% 0.2% 3.7% -23.4% -3.6% 25.8% 0.0%
Single Family Flat Rate Total Estimated
Residential Services Residential Unit Residential Residential District
Services (DU) Units (DU) Density Services (DU) Dwelling Units Population
1995 27,038 864 16,040 18.6 0 43,078 3.127 134,702
1996 27,115 864 16,047 18.6 0 43,163 3.127 134,967
1997 27,291 875 16,246 18.6 0 43,537 3.127 136,136
1998 27,351 888 16,481 18.6 0 43,832 3.127 137,060
1999 27,436 903 16,759 18.6 0 44,195 3.127 138,195
2000 27,561 919 17,070 18.6 0 44,631 3.127 139,558
2001 27,668 936 17,008 18.2 0 44,676 3.128 139,731
2002 27,713 942 16,946 18.0 0 44,659 3.128 139,709
2003 27,725 930 16,884 18.2 0 44,608 3.129 139,584
2004 27,965 926 16,821 18.2 0 44,786 3.130 140,175
2005 28,136 920 16,759 18.2 0 44,894 3.131 140,545
2006 28,210 912 16,697 18.3 0 44,906 3.131 140,614
2007 28,220 910 16,634 18.3 0 44,854 3.132 140,485
2008 28,334 801 16,572 20.7 0 44,906 3.133 140,679
2009 28,495 696 16,510 23.7 0 45,005 3.133 141,021
2010 28,573 704 16,448 23.4 0 45,021 3.134 141,105
2011 28,632 735 16,385 22.3 0 45,017 3.134 141,093
2012 28,646 742 16,541 22.3 0 45,187 3.134 141,626
/\ 2013 28,650 744 16,594 22.3 0 45,243 3.134 141,801 /\
| 2014 28,694 746 16,647 22.3 0 45,342 3.134 142,111 |
ACTUAL 2015 28,733 746 16,647 22.3 0 45,380 3.134 142,231 ACTUAL
PROJECTED 2020 29,134 756 16,876 22.3 0 46,010 3.134 144,206 PROJECTED
| 2025 29,542 767 17,108 22.3 0 46,649 3.134 146,208 |
\/ 2030 29,955 777 17,342 22.3 0 47,297 3.134 148,238 \/
2035 30,373 788 17,580 22.3 0 47,954 3.134 150,296
2040 30,798 799 17,822 22.3 0 48,619 3.134 152,383
Notes: Linear extrapolation used to estimated MFR-DU from 2000. Estimate extend until 2011 due to reclassification, afterwards a constant MFR Unit Density is used.
Multi Family Residential
Year
Persons per
Housing Unit
Multi Family Residential
Population Housing UnitsYear
US CensusPersons per
Housing Unit
Return to TOC
DOM PAWS 2015 Population 5/9/2016

Annual Rain
DOM PAWS 2015 Annual Rain 5/9/2016
72
.1%
-13
.3%
2.1
%
13
1.1
%
-35
.9%
-30
.1%
24
.8%
-24
.4%
-26
.1%
-70
.0%
-57
.0%
4.1
%
36
.0%
67
.4%
-31
.9%
89
.5%
30
.4%
-6.0
%
95
.4%
-46
.6%
-13
.1%
37
.4%
-48
.5%
2.2
%
15
.0%
58
.2%
-24
.1%
-63
.8%
-2.8
%
-44
.3%
89
.8%
-29
.5%
-30
.0%
-70
.1%
-35
.9%
-52
.0%
21
.32
10
.74
12
.65
28
.62
7.9
4
8.6
6
15
.46
9.3
6
9.1
5
3.7
2
5.3
3
12
.90
16
.84
20
.74
8.4
3
23
.47
16
.15
11
.64
24
.20
6.6
2
10
.77
17
.02
6.3
8
12
.66
14
.24
19
.59
9.4
0
4.4
9
12
.04
6.9
0
23
.51
8.7
3
8.6
7
3.7
0
7.9
4
5.9
4
-
200
400
600
800
1,000
1,200
-100%
-80%
-60%
-40%
-20%
0%
20%
40%
60%
80%
100%
120%
140%
160%
180%
200%
19
80
19
81
19
82
19
83
19
84
19
85
19
86
19
87
19
88
19
89
19
90
19
91
19
92
19
93
19
94
19
95
19
96
19
97
19
98
19
99
20
00
20
01
20
02
20
03
20
04
20
05
20
06
20
07
20
08
20
09
20
10
20
11
20
12
20
13
20
14
20
15
Dem
an
d p
er S
ervic
e (G
PD
)
Per
cen
t D
evia
tio
n f
rom
Av
era
ge
(%)
Calendar Year
Comparison of Annual Rainfall to Historical Average
Annual Rainfall Totals (inches)
Demand per Service

TempRain
California Water Service Company - Dominguez District Worksheet 13
Water Supply and Demand Analysis and Projections
Temperature & Rainfall History
Percent of
Year Tmax Tmin Mean Average Mean High Year Low Year
(°F) (°F) (°F) Demand in. in. - in. -
1980 21.32 72.1% 82.00 48.10 65.1 Jan 2.74 14.18 1995 0.00 1945 1.86
1981 10.74 -13.3% 83.10 48.10 65.6 Feb 2.76 12.59 1998 0.00 1896 2.24
1982 12.65 2.1% 82.00 44.80 63.4 Mar 2.03 8.45 1983 0.00 1956 3.41
1983 28.62 131.1% 85.90 47.90 66.9 Apr 0.82 5.46 1965 0.00 1897 4.80
1984 7.94 -35.9% 87.60 46.10 66.9 May 0.26 3.33 1921 0.00 1899 5.58
1985 8.66 -30.1% 84.80 45.50 65.2 Jun 0.05 0.84 1993 0.00 1906 6.30
1986 15.46 24.8% 80.80 46.80 63.8 Jul 0.01 0.63 2015 0.00 1967 6.51
1987 9.36 -24.4% 80.20 43.80 62.0 Aug 0.04 2.81 1977 0.00 1957 6.20
1988 9.15 -26.1% 79.30 45.20 62.3 Sep 0.19 4.84 1939 0.00 1895 4.80
1989 3.72 -70.0% 80.30 43.20 61.8 Oct 0.43 3.82 2004 0.00 1903 3.72
1990 5.33 -57.0% 82.60 43.10 62.9 Nov 1.14 8.05 1965 0.00 1897 2.40
1991 12.90 4.1% 78.90 45.90 62.4 Dec 1.98 9.26 2010 0.00 1900 1.86
1992 16.84 36.0% 83.70 45.40 64.6 970 -0.6%
1993 20.74 67.4% 78.90 46.50 62.7 967 -0.9% Annual 12.46 28.62 1983 3.41 1947 49.68
1994 8.43 -31.9% 84.50 45.80 65.2 1,039 6.6%
1995 23.47 89.5% 80.40 48.30 64.4 1,048 7.5%1996 16.15 30.4% 82.80 47.60 65.2 949 -2.7% Tmax Tmin Mean
1997 11.64 -6.0% 84.30 47.00 65.7 1,025 5.2% °F °F °F
1998 24.20 95.4% 82.80 44.90 63.9 967 -0.8% Jan 57.3 38.5 47.9
1999 6.62 -46.6% 81.80 46.70 64.3 1,026 5.2% Feb 61.2 41.4 51.3
2000 10.77 -13.1% 80.70 47.50 64.1 1,018 4.4% Mar 64.3 43.1 53.7
2001 17.02 37.4% 77.50 43.70 60.6 998 2.3% Apr 68.4 44.7 56.6
2002 6.38 -48.5% 78.70 45.80 62.3 1,027 5.3% May 72.9 48.5 60.7
2003 12.66 2.2% 81.40 47.70 64.6 1,049 7.6% Jun 77.4 52.6 65.0
2004 14.24 15.0% 82.10 46.40 64.3 1,071 9.8% Jul 78.4 54.9 66.7
2005 19.59 58.2% 78.30 48.40 63.4 1,003 2.8% Aug 78.5 54.7 66.6
2006 9.40 -24.1% 84.30 45.20 64.8 1,027 5.4% Sep 78.2 52.6 65.4
2007 4.49 -63.8% 80.70 43.30 62.0 1,044 7.0% Oct 73.0 48.0 60.5
2008 12.04 -2.8% 81.20 46.30 63.8 977 0.2% Nov 64.4 42.7 53.6
2009 6.90 -44.3% 82.40 47.70 65.1 827 -15.2% Dec 57.8 38.2 48.0
2010 23.51 89.8% 76.90 48.30 62.6 903 -7.4%2011 8.73 -29.5% 78.40 43.70 61.1 864 -11.4% Annual 69.3 46.7 58.0
2012 8.67 -30.0% 82.90 46.50 64.7 909 -6.8%
2013 3.70 -70.1% 80.70 44.20 62.5 924 -5.3%
2014 7.94 -35.9% 83.80 48.70 66.3 921 -5.5%
2015 5.94 -52.0% 84.60 46.50 65.6 851 -12.7%2016
2017
2018
2019
2020
Precipitation
Percent
Variation
Annual
(in)
Demand per
Service
(gpd)
Monthly
Average Eto
1) Eto values based on California Irrigation Management Information System (CIMIS),
http://wwwcimis.water.ca.gov/cimis/ welcome.jsp, EvapoTranspiration (Eto) Zones Map, Zone 6
2) PPT, Tmax, Tmin obtained from PRISM
where, PPT is total montly rainfall, Tmax is average of maximum temperatures for given month,
and Tmin is average of minimum temperatures for given month
3) Percent variaion based on average of 1980 to present values
Temperature
Temperature (1895 - present)
Precipitation (1895 - present)
DOM PAWS 2015 TempRain 5/9/2016

TempRain Chart
DOM PAWS 2015 TempRain Chart 5/9/2016
Jan Feb Mar Apr May Jun Jul Aug Sep Oct Nov Dec
Commerce Avg. Temp 47.9 51.3 53.7 56.6 60.7 65.0 66.7 66.6 65.4 60.5 53.6 48.0
Commerce Avg. Rainfall 2.74 2.76 2.03 0.82 0.26 0.05 0.01 0.04 0.19 0.43 1.14 1.98
Monthly Average Eto 1.86 2.24 3.41 4.80 5.58 6.30 6.51 6.20 4.80 3.72 2.40 1.86
0.00
1.00
2.00
3.00
4.00
5.00
6.00
7.00
0.0
10.0
20.0
30.0
40.0
50.0
60.0
70.0
Mea
n M
on
thly
Ra
infa
ll,
inch
es
Mea
n M
on
thly
Tem
per
atu
re,
°F
Average Monthly Temperature, Rainfall, and Monthly Eto

Wells
California Water Service Company - Dominguez District Worksheet 14
Water Supply and Demand Analysis and Projections
Groundwater Production Facilities
DOM PAWS 2015 Wells 5/9/2016

Indoor Usage Chart
DOM PAWS 2015 Indoor Usage Chart 5/9/2016
0
5,000
10,000
15,000
20,000
25,000
30,000
35,000
40,000
1980 1990 2000 2010 2020 2030 2040
Esti
mat
ed
In
do
or
Wat
er
Usa
ge (
AFY
)Estimated Indoor Water Usage
Single Family Residential (SFR) Multi Family Residential (MFR) Commercial (COM) Industrial (IND)
Govenment (GOV) Est. Indoor Usage (Historical) Est. Indoor Usage (Projected)

Indoor Usage
California Water Service Company - Dominguez DistrictWater Supply and Demand Analysis and Projections
Estimated Indoor/Outdoor Water Usage
SFR
Jan
Usage
MFR Jan
Usage
COM Jan
Usage
JAN (CCF) AFY AF/Serv AFY GPD/Serv % (CCF) AFY GPD/Serv % (CCF) AFY GPD/Serv %
19801981
1982
1983
1984
19851986
1987
1988
1989
19901991
1992 267,626 6,635 0.247 0 6,635 220 67% 144,729 3,588 3,727 113% 249,428 6,184 1,972 78%
1993 314,071 7,787 0.289 0 7,787 258 76% 107,916 2,676 2,753 88% 217,983 5,405 1,717 68%
1994 359,621 8,916 0.331 0 8,916 295 84% 110,613 2,742 2,831 88% 269,931 6,693 2,128 83%
1995 331,853 8,228 0.304 0 8,228 272 78% 109,409 2,713 2,804 87% 236,931 5,874 1,876 71%1996 358,153 8,880 0.327 0 8,880 292 79% 122,711 3,042 3,143 94% 253,694 6,290 2,008 72%
1997 340,025 8,430 0.309 0 8,430 276 73% 119,540 2,964 3,024 90% 266,761 6,614 2,111 69%
1998 330,848 8,203 0.300 0 8,203 268 77% 104,895 2,601 2,616 82% 254,742 6,316 2,018 73%
1999 380,635 9,437 0.344 0 9,437 307 84% 127,002 3,149 3,115 96% 287,422 7,126 2,265 77%
2000 420,345 10,422 0.378 0 10,422 338 90% 133,574 3,312 3,216 94% 368,508 9,137 2,897 89%2001 403,079 9,994 0.361 0 9,994 322 90% 134,263 3,329 3,177 101% 335,206 8,311 2,580 86%
2002 356,522 8,839 0.319 0 8,839 285 76% 117,862 2,922 2,770 86% 255,795 6,342 1,926 62%
2003 373,198 9,253 0.334 0 9,253 298 75% 123,990 3,074 2,951 91% 260,076 6,448 1,940 72%
2004 413,541 10,253 0.367 0 10,253 327 85% 111,728 2,770 2,671 81% 264,295 6,553 1,979 75%
2005 353,229 8,758 0.311 0 8,758 278 78% 113,069 2,803 2,720 88% 250,710 6,216 1,863 76%
2006 376,368 9,331 0.331 0 9,331 295 82% 117,984 2,925 2,865 93% 269,144 6,673 1,988 79%
2007 376,735 9,341 0.331 0 9,341 295 80% 111,674 2,769 2,717 89% 273,510 6,781 2,020 79%
2008 330,501 8,194 0.289 0 8,194 258 74% 114,987 2,851 3,176 98% 228,563 5,667 1,722 69%
2009 341,356 8,463 0.297 0 8,463 265 80% 96,533 2,393 3,070 86% 219,850 5,451 1,700 73%
2010 327,704 8,125 0.284 0 8,125 254 82% 92,600 2,296 2,910 86% 212,319 5,264 1,641 72%2011 297,659 7,380 0.258 0 7,380 230 76% 88,950 2,205 2,681 81% 196,843 4,880 1,518 66%
2012 323,519 8,021 0.280 0 8,021 250 82% 87,176 2,161 2,602 79% 243,558 6,039 1,881 72%
2013 298,227 7,394 0.258 0 7,394 230 75% 95,922 2,378 2,854 85% 229,128 5,681 1,770 67%
2014 334,564 8,295 0.289 0 8,295 258 90% 89,337 2,215 2,650 86% 285,372 7,075 2,205 85%
2015 283,761 7,035 0 7,035 88,978 2,206 242,287 6,007
2016 7,815 242 2,260 2,697 5,934 1,843
2017 7,837 242 2,267 2,697 5,942 1,843
2018 7,858 242 2,273 2,697 5,950 1,843
2019 7,880 242 2,279 2,697 5,959 1,843
2020 7,902 242 2,285 2,697 5,967 1,843
2025 8,013 242 2,317 2,697 6,007 1,843
2030 8,125 242 2,348 2,697 6,048 1,843
2035 8,238 242 2,381 2,697 6,090 1,843
2040 8,353 242 2,413 2,697 6,131 1,843
Note: GPD/Service is estimated as the average of the last 5 years for given customer class.
Single Family Residential (SFR) Multi Family Residential (MFR) Commercial (COM)
Year
Metered SFR Indoor Use
(Annualized 90% of January
Total)
Indoor Flat
Rate Usage
(AFY)
Total SFR Indoor Usage
MFR Indoor Use
(Annualized 90% of January
Total)
COM Indoor Use
(Annualized 90% of January
Total)
DOM PAWS 2015 Indoor Usage 5/9/2016

Indoor Usage
California Water Service Company - Dominguez District Worksheet 16
Water Supply and Demand Analysis and Projections
Estimated Indoor/Outdoor Water Usage
IND Jan
Usage
GOV Jan
UsageEst. Indoor Usage Est. Outdoor Usage Est. Indoor Usage Est. Outdoor Usage
(CCF) AFY GPD/Serv % (CCF) AFY GPD/Serv % AFY AFY % %
19801981
1982
1983
1984
19851986
1987
1988
1989
19901991
1992 273,659 6,785 45,975 61% 45,639 1,132 4,680 54% 24,324 9,248 72% 28%
1993 455,749 11,300 75,894 116% 38,485 954 3,919 48% 28,121 5,408 84% 16%
1994 301,517 7,476 50,305 77% 62,030 1,538 6,208 66% 27,365 8,731 76% 24%
1995 359,725 8,919 60,974 76% 49,997 1,240 4,963 55% 26,973 9,524 74% 26%1996 273,320 6,777 46,447 90% 72,260 1,792 7,056 80% 26,780 6,347 81% 19%
1997 209,009 5,182 35,724 59% 42,164 1,045 4,001 46% 24,236 11,779 67% 33%
1998 417,748 10,357 71,864 117% 50,956 1,263 4,622 69% 28,740 5,329 84% 16%
1999 371,594 9,213 64,467 83% 47,299 1,173 4,288 57% 30,098 6,185 83% 17%
2000 349,127 8,656 58,139 108% 75,096 1,862 6,787 79% 33,388 2,822 92% 8%2001 273,491 6,781 45,802 93% 55,772 1,383 4,963 55% 29,797 5,857 84% 16%
2002 73,408 1,820 11,824 21% 56,929 1,411 4,782 57% 21,335 15,537 58% 42%
2003 358,680 8,893 55,325 96% 48,224 1,196 4,087 61% 28,864 8,835 77% 23%
2004 289,566 7,179 40,395 64% 48,123 1,193 4,031 58% 27,948 10,792 72% 28%
2005 381,918 9,469 52,697 79% 53,625 1,330 4,496 71% 28,576 7,923 78% 22%
2006 438,985 10,884 58,769 81% 53,159 1,318 4,443 75% 31,132 6,366 83% 17%
2007 519,341 12,876 69,492 92% 49,403 1,225 4,059 62% 32,992 5,109 87% 13%
2008 810,665 20,099 110,364 144% 48,777 1,209 3,879 69% 38,020 -2,425 107% -7%
2009 461,957 11,453 63,740 111% 37,839 938 2,908 63% 28,699 1,437 95% 5%
2010 347,715 8,621 47,656 79% 42,138 1,045 3,265 73% 25,351 7,642 77% 23%2011 362,566 8,989 49,768 90% 15,015 372 1,164 28% 23,827 7,819 75% 25%
2012 324,912 8,056 45,183 77% 30,014 744 2,330 55% 25,021 8,300 75% 25%
2013 348,211 8,633 48,499 83% 37,543 931 2,900 66% 25,017 8,860 74% 26%
2014 422,048 10,464 58,783 91% 38,378 952 2,969 58% 29,001 4,834 86% 14%
2015 364,134 9,028 40,059 993 25,270 6,021 81% 19%
2016 8,977 50,558 730 2,341 25,718 9,729 73% 27%
2017 8,998 50,558 730 2,341 25,774 9,750 73% 27%
2018 9,018 50,558 730 2,341 25,830 9,770 73% 27%
2019 9,038 50,558 730 2,341 25,886 9,791 73% 27%
2020 9,058 50,558 730 2,341 25,943 9,812 73% 27%
2025 9,160 50,558 730 2,341 26,227 9,918 73% 27%
2030 9,263 50,558 730 2,341 26,515 10,025 73% 27%
2035 9,367 50,558 730 2,341 26,806 10,134 73% 27%
2040 9,473 50,558 730 2,341 27,101 10,244 73% 27%
Estimated Indoor/Outdoor UsageIndustrial (IND) Govenment (GOV)
Year
IND Indoor Use
(Annualized 90% of January
Total)
GOV Indoor Use
(Annualized 90% of January
Total)
DOM PAWS 2015 Indoor Usage 5/9/2016

Blank Page
PAGE LEFT BLANK INTENTIONALLY
DOM PAWS 2015 Blank Page 5/9/2016