appendix a potential water sources
TRANSCRIPT
Appendix A Potential water sources

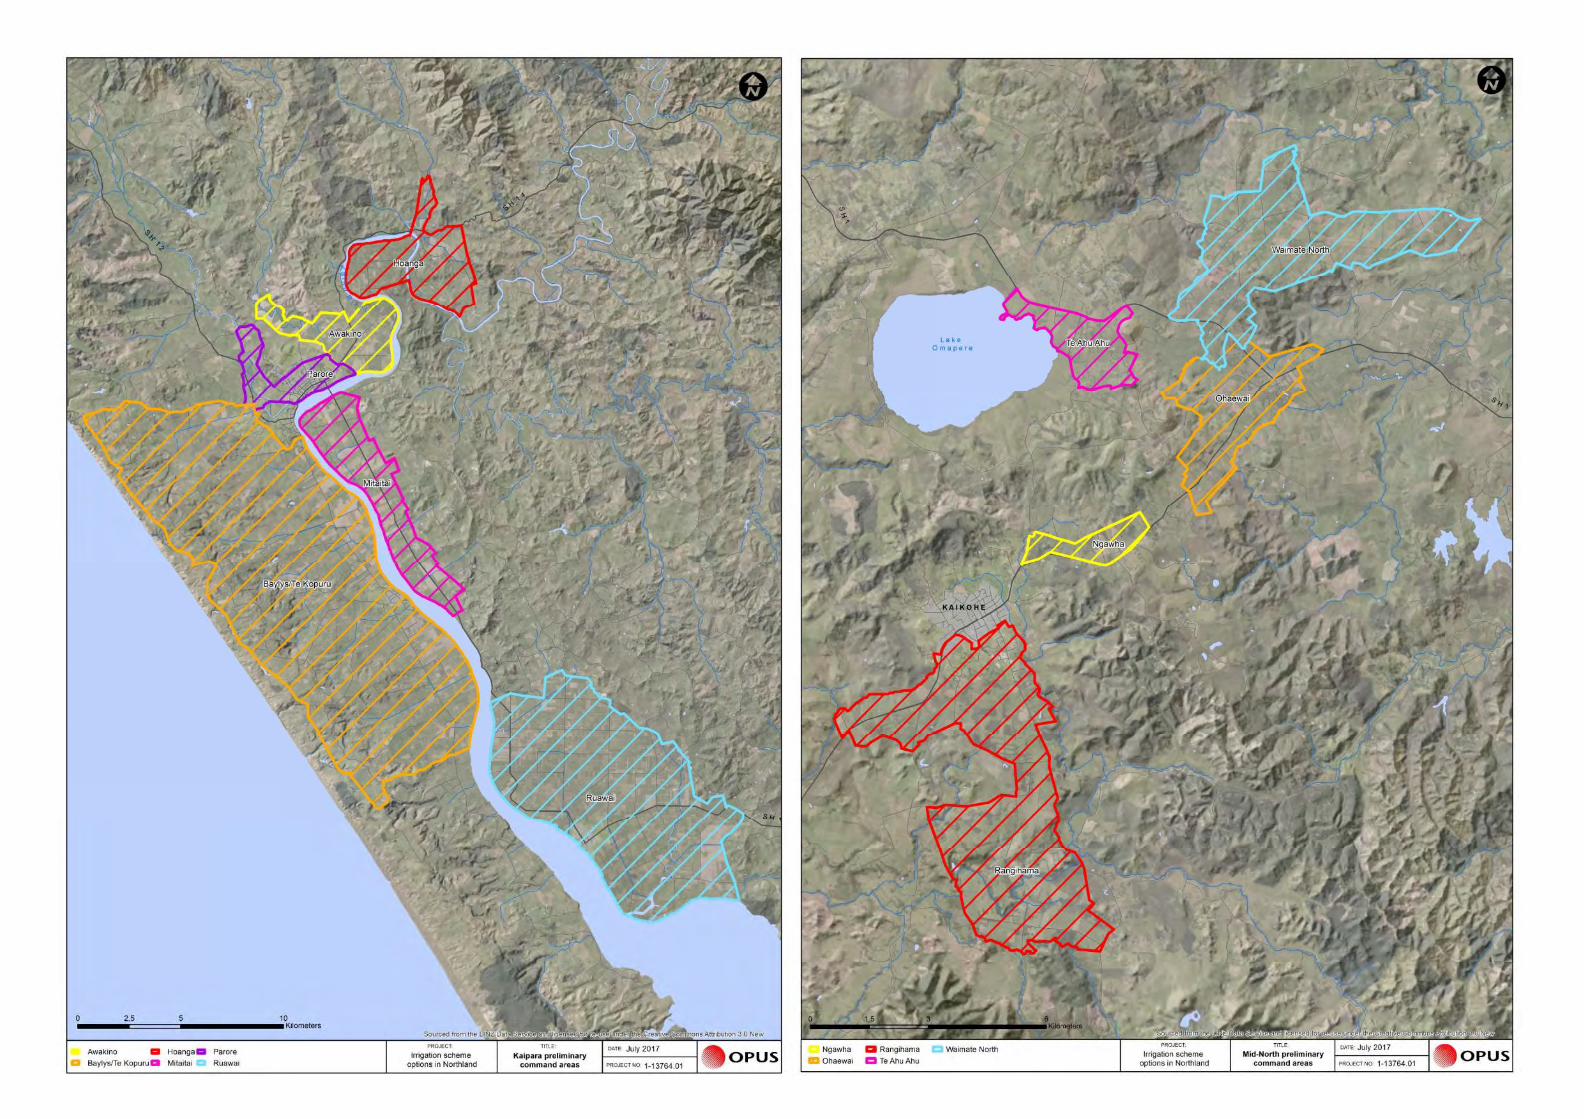
Appendix B Preliminary command areas


Appendix C Water balance model

IrriCalc model uses the water balance modelling approach developed by the Food and Agriculture Organization (FAO) of the United Nations Allen et al. (1998). The relationship between crop and reference evapotranspiration:
Crop evapotranspiration = ks×kc×Reference evapotranspiration Eqn 1
where ks is the water stress reduction factor and kc is the crop coefficient.
The water stress reduction factor is a function of the current soil moisture status. As recommended by Allen et al. (1998), it was assumed that ks equalled 1.0 when the soil water content was equal to the plant readily available water, and ks reduced linearly down to a value of zero at wilting point. Readily available water was assumed to be equal to 50% of the plant available water at field capacity (PAW). Crop information modelled is given in Section 4.1.4. For temporary crops such as vegetables, kc varies over the growing season primarily due to change in leaf area.
For each day the soil moisture is calculated from:
ASMday i= ASMday i-1 + (rain + effective irrigation - crop evapotranspiration)day i Eqn 2
where ASM = plant available soil moisture.
Effective irrigation is the irrigation water that is applied and retained within the soil water reservoir of the crop. Effective irrigation was calculated using the total depth of irrigation water and the application coefficient uniformity (CU) (Christiansen, 1942). The model assumes the maximum water the soil can hold is the PAW value; any rain in excess of that required to reach field capacity was assumed to drain below the root zone. In other words the maximum value of ASM for any given day is the PAW. For temporary crops, PAW varied with the time of year as the crop rooting depth varied.
IrriCalc modelling assumed that the soils were free draining, and the depth to groundwater was greater than crop soil water reservoir depths. Where soil pans exist, or where groundwater is close to the surface, water requirements will be less than estimated values in this report.
For irrigation demand modelling, it was assumed that water was available on a continuous basis, without restrictions. Where irrigators are subject to frequent restrictions, daily water requirements may be greater than estimated within this study. This is because, when the water source is considered unreliable, the irrigation systems ideally should have additional capacity to be able to ‘catch up’ with the crop water requirements, following periods when flow was restricted. However, the schemes water balance has been assessed such that the average supply-demand reliability ratio is high; as shown in Section 4, the average supply-demand reliabilities are over 98% for the assessed scheme areas.

Appendix D Irrigation water demand

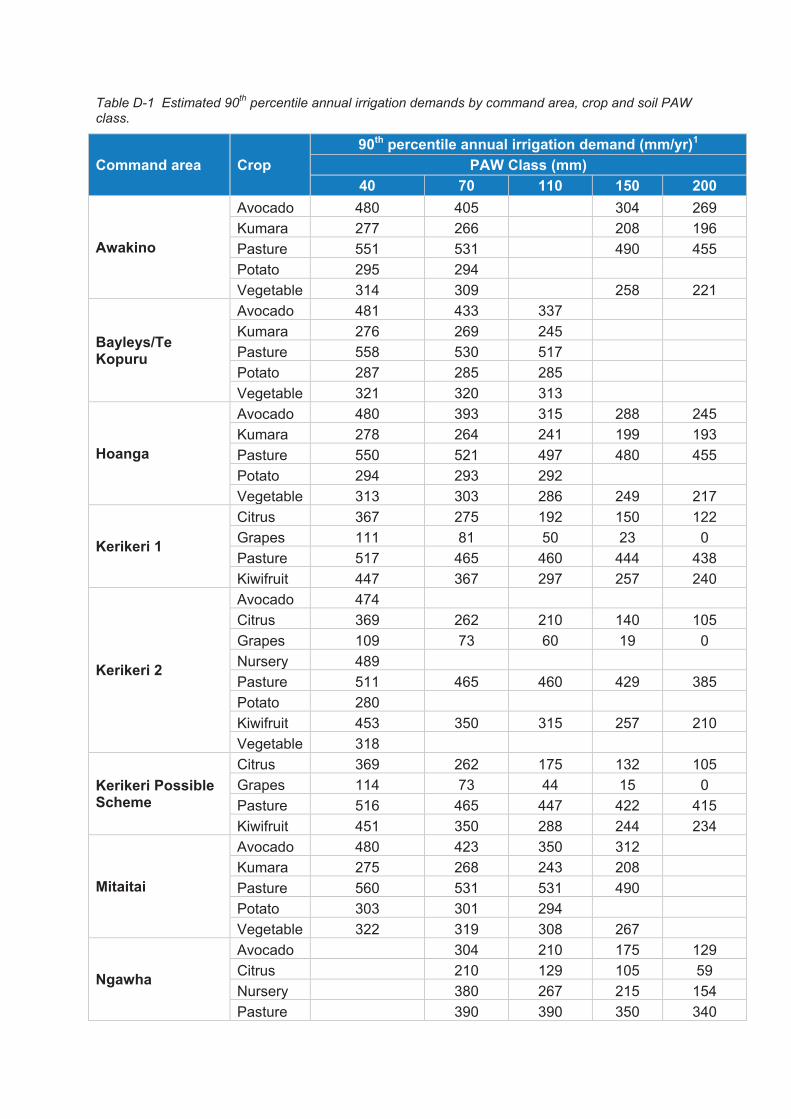
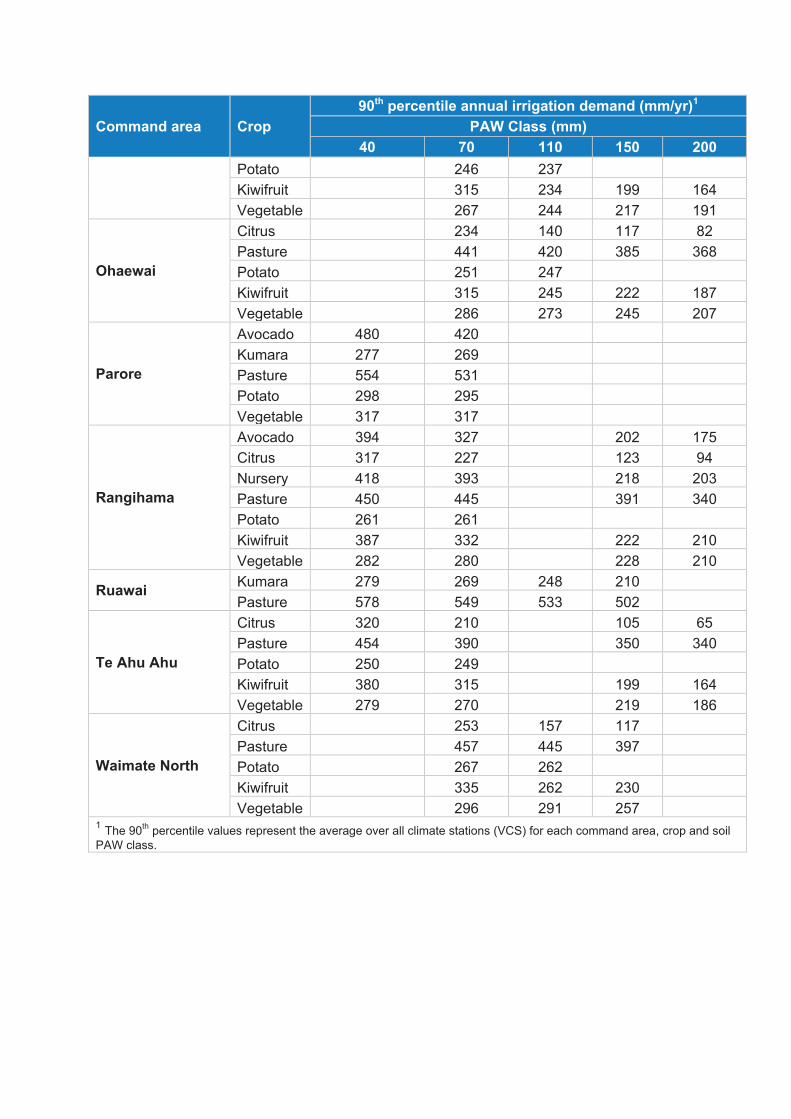
Table D-1 Estimated 90th percentile annual irrigation demands by command area, crop and soil PAW
class.
Command area Crop
90th percentile annual irrigation demand (mm/yr)1
PAW Class (mm)
40 70 110 150 200
Awakino
Avocado 480 405
304 269
Kumara 277 266
208 196
Pasture 551 531
490 455
Potato 295 294 Vegetable 314 309
258 221
Bayleys/Te Kopuru
Avocado 481 433 337 Kumara 276 269 245 Pasture 558 530 517 Potato 287 285 285 Vegetable 321 320 313
Hoanga
Avocado 480 393 315 288 245
Kumara 278 264 241 199 193
Pasture 550 521 497 480 455
Potato 294 293 292 Vegetable 313 303 286 249 217
Kerikeri 1
Citrus 367 275 192 150 122
Grapes 111 81 50 23 0
Pasture 517 465 460 444 438
Kiwifruit 447 367 297 257 240
Kerikeri 2
Avocado 474 Citrus 369 262 210 140 105
Grapes 109 73 60 19 0
Nursery 489 Pasture 511 465 460 429 385
Potato 280 Kiwifruit 453 350 315 257 210
Vegetable 318
Kerikeri Possible Scheme
Citrus 369 262 175 132 105
Grapes 114 73 44 15 0
Pasture 516 465 447 422 415
Kiwifruit 451 350 288 244 234
Mitaitai
Avocado 480 423 350 312 Kumara 275 268 243 208 Pasture 560 531 531 490 Potato 303 301 294
Vegetable 322 319 308 267
Ngawha
Avocado
304 210 175 129
Citrus
210 129 105 59
Nursery
380 267 215 154
Pasture
390 390 350 340
Command area Crop
90th percentile annual irrigation demand (mm/yr)1
PAW Class (mm)
40 70 110 150 200
Potato
246 237 Kiwifruit
315 234 199 164
Vegetable
267 244 217 191
Ohaewai
Citrus
234 140 117 82
Pasture
441 420 385 368
Potato
251 247 Kiwifruit
315 245 222 187
Vegetable
286 273 245 207
Parore
Avocado 480 420 Kumara 277 269 Pasture 554 531 Potato 298 295 Vegetable 317 317
Rangihama
Avocado 394 327
202 175
Citrus 317 227
123 94
Nursery 418 393
218 203
Pasture 450 445
391 340
Potato 261 261 Kiwifruit 387 332
222 210
Vegetable 282 280
228 210
Ruawai Kumara 279 269 248 210
Pasture 578 549 533 502
Te Ahu Ahu
Citrus 320 210
105 65
Pasture 454 390
350 340
Potato 250 249 Kiwifruit 380 315
199 164
Vegetable 279 270
219 186
Waimate North
Citrus
253 157 117 Pasture
457 445 397
Potato
267 262 Kiwifruit
335 262 230
Vegetable
296 291 257 1 The 90
th percentile values represent the average over all climate stations (VCS) for each command area, crop and soil
PAW class.

Appendix E Market assessment

Market for more Northland avocados
Northland is a main New Zealand region producing avocados. There is strong interest in expanding production in Northland and developments are already taking place. The industry as a whole has embarked on a global strategy as a Primary Growth Partnership with MPI. The potential developments could significantly increase the scale of New Zealand’s production in the next few years. It is therefore essential to consider expansion within the global market context.
The four main realities to be addressed by prospective growers and irrigators of avocado orchards in Northland are:
» Ongoing strong growth in market demand for avocados in the world and New Zealand
» NZ avocado industry and packers and exporters are able to handle more in Northland
» Variable production from avocado orchards’ 2 year alternate bearing cycle causes price swings
» Requirements for skilled orchard workers and seasonal staff needs attention/ organised sharing?
The global market situation
The global market for avocados is very large and continues to increase strongly. Global consumption is 3.8 million tonnes a year. For the last twenty years world consumption has been grown at 4% every year, or 150,000 tones increase each year. Consumption and production is centred on the Americas, and in the US market consumption has increased from 0.3 million to 1.0 million tonnes since 2004, much imported from Mexico.
New Zealand place in global avocado production and market
The relevant New Zealand comparison with the global market is that New Zealand production in the last three years has been about 33,000 tonnes, or about 0.8% of world production. Our exports have averaged about 19,000 tonnes a year or about 1.5% of world exports.
New Zealand production is increasing, but even if production doubled in the next few years, and the increase was all exported, it would be absorbed by under three months’ growth in the world consumption. This general picture indicates that in a large and growing world market for avocados, New Zealand could make significant increases in our production, and still remain a small player.
New Zealand and Northland current production
Production in New Zealand over the last ten years has increased each year by an average of 470,000 trays, or 2,500 tonnes a year. These trays, at an average yield of about 1,400 trays per hectare would be produced on an additional 330ha per year.
The current areas of land in Northland planted in avocados are shown in the New Zealand Avocado Annual Report 2016 as 523ha in the Far North and 817ha in the Mid-North, a total of 1,340ha in the North. Since the only other region of substance shown in their data is Bay of Plenty, it appears that their definition of the Mid North region would include Whangarei, and possibly Kaipara Districts. This is a broader definition than our definition for the purpose of this assessment.
The area of 1,340ha of avocados grown in the North is 36% of the total area in New Zealand, given as 3,748ha in the Avocado NZ annual report.
New Zealand avocado market growth and export price
There is a strong market for avocados both domestically and for export. Sales on the domestic market roughly doubled in fifteen years from 600,000 trays in 2000 to 1.2 million trays in 2015/16. Export sales have similarly grown strongly from 1.1 million trays in 2000 to 4.5 million trays in 2014/15, but an alternative ‘low’ year export of only 2.6 million trays in 2015/16.
The strength of the world market for avocados is seen in the fact that even with that dramatic increase in volumes exported by New Zealand the average export price $NZ FOB was about the same in
2014/15 as it was in 2000, namely $4,600 per tonne. Over the period 2004 to 2016 it was in the relatively narrow range $3,900 to $6,500 per tonne FOB.
Australia: Since 2002 Australia has taken 80% to 90% of our avocado exports, and as with the overall world market the Fob value per tonne received from that market has been relatively stable.
Asia and US: The Asian countries have been developed as markets and from about 2% of our exports in 2002, to 13% to 14% over the last seven years. The US is an occasional ‘welcome safety-valve for the heavily supplied Australian market’ in large volume years, though yields a lower average FOB price - $NZ2,230 per tonne in 2014/15.
The general assessment is that the historical rate of expansion can be absorbed in New Zealand’s expanding markets, although from time-to-time our marketing effort may struggle to maintain pace with production, and product available for export. This is especially so since New Zealand has not yet found a solution to the avocado orchards’ two year alternate bearing cycle. Not surprisingly our analysis shows that these changes in export volume drive changes in the average FOB price received.
Export price and orchard price of avocados
The value of avocados exported over the last ten years has averaged $4,740 per tonne FOB. Over the same period the orchard gate value has averaged $2,180 per tonne which is equivalent to about $11.50 per tray. In the last three years the value at orchard gate has been generally in the range $12 per tray to $15 per tray. This is in contrast to the last ‘on’ year 2011-2012, when the high volumes of production and export drove the orchard price down to about $6 per tray.
The previous experience indicates that players entering the market to produce avocados would advisably budget for orchard gate returns no higher than $12 per tray.
Northland avocado expansion and irrigation
The current area of avocados believed to be in production in Northland is about 1,250ha. There is considerable expansion underway in southern Northland, particularly at Tapora on the Okahukura Peninsula in the Kaipara Harbour, and also on the Aupouri Peninsula in the Far North. In total these plans could double the planted avocado area in Northland in the next three years.
The production increase in New Zealand over the last ten years has been equivalent to an average of 330ha per year. On this basis, the known developments in Northland are equivalent to about four years at the past rate. It is therefore quite reasonable to assume that the ongoing expansion of demand in New Zealand and Australia, together with the successful marketing expansion into Asia could readily handle the marketing and logistics of an additional 300ha of orchards per year.
The existence of a considerable area of deep soils suitable to grow avocados, combined with availability of irrigation water means that over the coming five to seven years there can be expected to be the scope to expand the area of avocado as irrigated avocado to about 500ha in the Mid-North and 250ha in the Baylys-Te Kopuru area of Kaipara.
Marketing, packing, processing and logistics
There are substantial post-harvest operators and exporters already working with avocados from Northland. There does not appear to be any difficulty at present in new or expanding growers in having their crop handled post-harvest and to export. With very significant expansion of production from Northland, transport of the crop for domestic sale and for export will become a significant factor in regional and national planning of infrastructure. It is not a constraint as yet.
Labour requirement for Mid-North avocado orchards
Once the orchards are established we estimate that the additional labour requirements on-orchard in the mid-North would be about 170 FTEs, and this could be as high as 400 FTEs when and if high productivity is achieved. The total increase in employment generated including packing, transport and other services would be 340FTEs.
The difficult labour to obtain is likely to be the 170 plus people for quality in-orchard work, as discussed in section 5. Some growers are working to overcome the problems of extreme seasonality in demand for labour by becoming involved in production of crops with seasonal demand for labour at different times of the year. There is some complementarity between avocados and kiwifruit in that regard, and a locally generated solution to sharing workers among these growers would provide a more stable employment environment in the industry.
Demand for water for avocados
It is indicated in section 0 that the recorded average yield of avocados in New Zealand has been about 1,350 tray/ha. This average covers a range for 600 trays average in one ‘low’ year to an average 2,000 trays/ha in a recent ‘high’ year.
The prudent budgeter would allow for an average yield of 1,350 trays/ha and then set about improving that if possible, for example, a grower could use irrigation tactically in an attempt to mitigate to some extent the fluctuation in the alternate bearing cycle.
Taking that yield at a prudent budgeting level of $12 per tray at orchard gate, gives a value of sales of $16,200 per hectare. However the average in the last two years has been a value of sales of $24,000 per hectare.
Direct production costs are approximately $10,000 per canopy hectare leaving a margin to cover the overheads, development and water costs of $7,000 to $15,000 per hectare. Top growers can earn $40,000 margin per hectare so there is plenty of room for improvement.
With water demands of about 4,000 m3/ha/yr the costs of water can readily be covered by the
avocados.
Market for more Northland kiwifruit
» Very strong growth in global demand, Zespri releasing new licences for existing varieties and developing new ones to grow future demand.
» Increasing production yields, with green varieties averaging 11,000 trays/ha. Gold varieties though still young, average 8,700 trays/ha
» Any significant increase in kiwifruit production in Northland would stimulate expansion of packhouse logistics and transport handled within the region.
The global market situation
Kiwifruit is a small crop by global standards, accounting for approximately 0.22% of globally traded fruit. New Zealand is the third largest producer of kiwifruit globally, behind China and Italy. It is New Zealand’s single largest horticultural export crop by volume.
Zespri is responsible for the export and marketing of premium New Zealand kiwifruit around the world, and is looking to increase global consumption of kiwifruit. It has partnerships with growers in Italy, France, Japan, Australia and South Korea growing gold varieties to ensure continuous supply of Zespri kiwifruit when New Zealand Zespri kiwifruit is not available. Trials are in place in other countries.
New Zealand’s place in global kiwifruit production and market
Kiwifruit production has increased rapidly over the last several years, as new gold varieties have yielded healthy harvests. The recovery following the crop devastation suffered from the PSA virus in 2010 has seen harvest yields not only returning to, but exceeding pre-PSA volumes. Industry forecasts are that the gold varieties will boost exports to 180 million trays by the 2020-21 season.
The increase in supply has been accompanied by increased demand, both domestically but more especially in terms of export. Increased market penetration is being targeted particularly in China and South East Asia, as well as India and Europe.
New Zealand kiwifruit have been marketed as a premium product overseas, as a nutrient dense fruit. This is to cover New Zealand’s high cost of production (land, labour, freight), and due to the seasonal nature of the fruit with it having a limited shelf life and narrow selling window.
The Zespri kiwifruit varieties currently being sold include: Green, Organic Green, Sweet Green, SunGold, Organic SunGold, Gold. Red varieties are still being trialled.
New Zealand and Northland current production
There are approximately 2,600 Zespri growers across the country, with 3,207 registered orchards, and with a total of 14,340ha planted in kiwifruit vines (Zespri, n.d.). Volumes of production have bounced in the post-PSA recovery, to record volumes, with over 45 million trays over the last season, up from 27.5 million trays the previous season.
The number of growers has fallen slightly, from close to 2,800 in 2005. This number may increase again slightly as favourable returns on gold varieties attract more growers to the industry, or current growers may seek to expand their current production.
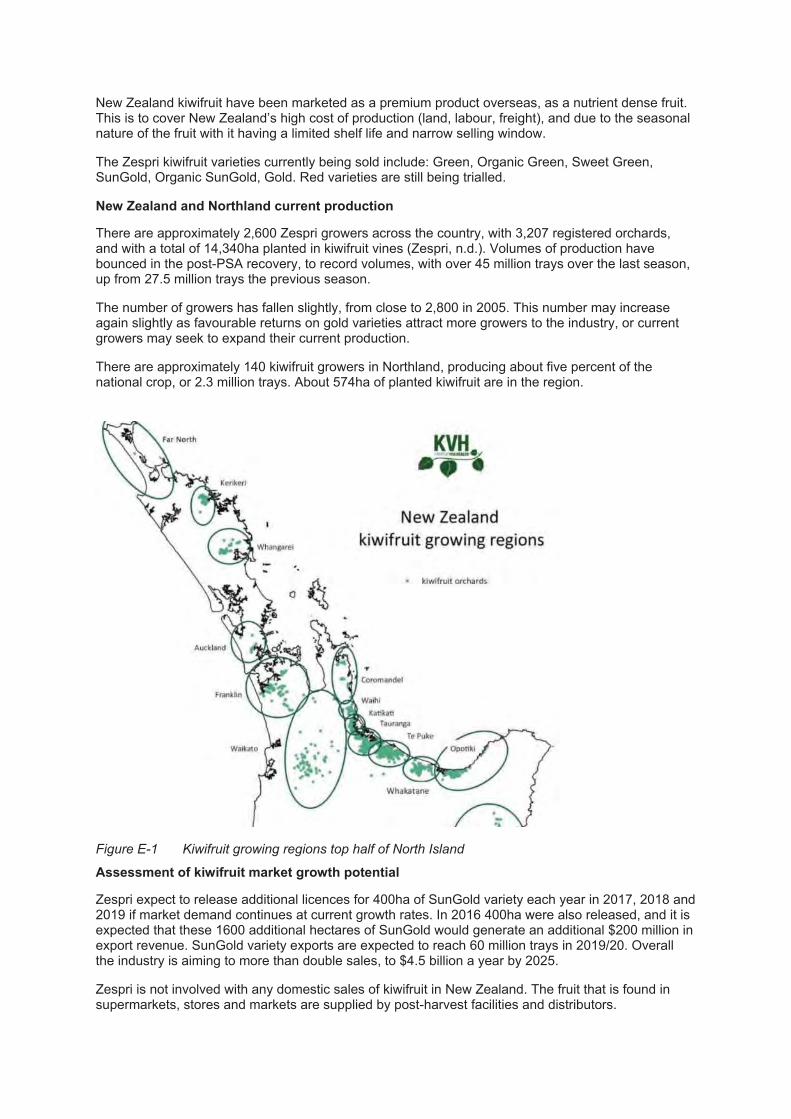
There are approximately 140 kiwifruit growers in Northland, producing about five percent of the national crop, or 2.3 million trays. About 574ha of planted kiwifruit are in the region.
Figure E-1 Kiwifruit growing regions top half of North Island
Assessment of kiwifruit market growth potential
Zespri expect to release additional licences for 400ha of SunGold variety each year in 2017, 2018 and 2019 if market demand continues at current growth rates. In 2016 400ha were also released, and it is expected that these 1600 additional hectares of SunGold would generate an additional $200 million in export revenue. SunGold variety exports are expected to reach 60 million trays in 2019/20. Overall the industry is aiming to more than double sales, to $4.5 billion a year by 2025.
Zespri is not involved with any domestic sales of kiwifruit in New Zealand. The fruit that is found in supermarkets, stores and markets are supplied by post-harvest facilities and distributors.
Export price and orchard price of kiwifruit
The export value of kiwifruit in 2015 was approximately $1.67 billion FOB in 2015, up from $1.18 billion the previous year. It has remained at the higher level through to 2017.
Management and production techniques could lead to potential further increases in yield – for example, recent developments such as like an artificial pollenating machine which blows pollen on to open flowers four times, more than the traditional single but heavy application. Research trials showed that yields were increased, costs reduced, and timing of pollen applications optimised. Also, the more frequent application of pollen to the flowers, the bigger and ‘better’ the resulting fruit.
Marketing, packing, processing and logistics
There are around 50 pack houses and 62 cool stores across the country. There are a few in the Northland region, including Orangewood based in Kerikeri, who are the largest packer of gold kiwifruit in Northland and who are the only pack house dedicated solely to kiwifruit in the region.
Some Northland producers send their kiwifruit south and out-of-region for packing as there are machines out-of-region with 18-lane machines compared with the older 2-lane machines. Increased kiwifruit production in Northland is likely to justify further investment in packing capability in the region.
In terms of export we have raised the possibility of the volume of kiwifruit being exported from Northland becoming sufficient to justify international vessels calling at a Northland port for loading. We have not received a definitive reply from Zespri as to the volume of export needed to justify loading from a Northland port.
The 2016 season saw 67 chartered vessels leaving New Zealand shores, with around 7,000 containers and over 100 million trays of kiwifruit.
Labour requirement for Northland kiwifruit
The industry employs approximately 3,000 seasonal workers for the 2017 harvest of kiwifruit across the country.
It experiences shortages in certain skilled roles, such as forklift drivers, and also filling unpopular night shifts. Seeka is working with Work and Income New Zealand (WINZ) to bring out of town workers to their packhouses.
One aspect of the labour requirement is the seasonality. At least one operator finds that by being involved in two or perhaps three types of horticultural crop, the labour requirement can cover most of the year.
Demand for water for kiwifruit
Irrigation water is primarily used for younger vines and for frost protection. Research is currently underway to define best practice water use to further optimise water use and to support future new planting decisions. Some growers are also establishing offline water storage to meet their needs, while minimising pressure on natural resources. We presume that much of this activity is happening in areas outside the Northland region, such as in the Bay of Plenty region.
At the orchard gate, a study estimated that green kiwifruit have an average water footprint of 417 litres per kg. Applying the volumetric Water Footprinting Network methodology to the orchard showed that, based on the national average, the majority of water consumed in the cultivation of green kiwifruit (85%) is taken from rainwater or soil moisture. Five per cent of water consumed was taken from irrigation and 10% is the volume of water needed to dilute orchard inputs below safe drinking standards, e.g. nitrogen fertiliser entering the environment (Landcare Research, n.d.).
Some advanced growers have replaced trickle irrigation with foliar spray irrigation or ‘fertigation’. This has resulted in very significant yield increases. With foliar spray, kiwifruit require 32 litres per plant per day. At a plant density of 450 vines per hectare this is about 15m
3 per hectare per day. With a
season requiring, say 100 days irrigation this is 1,500m3/ha/season.
Ability to pay for water for kiwifruit
Kiwi Gold
The average yield of kiwi golds in New Zealand is currently about 8,700 trays per hectare, but this is expected to increase. This is because SunGold, the PSA-resistant variety which replaced Hort16A, is only halfway to reaching full production. A prudent budgeter would allow for an average yield of 10,000 trays per hectare and then set about improving that if possible, and as yields reach maturity.
Taking that yield of 10,000 trays at a prudent budgeting level of $7.60 per tray at orchard gate, gives a value of sales of $76,000 per hectare. The capital costs include $250,000 per hectare licence fee to Zespri, and approximately $195,000 per hectare to establish the orchard.
Direct production costs are approximately $40,000 per hectare leaving a margin to cover the overheads, development and water costs of $36,000 per hectare. The average Orchard Gate Return (OGR) per hectare for 2015/16 was around $71,000.
Kiwi Green
The average yield of kiwi green in New Zealand is about 10,000 plus trays per hectare. A prudent budgeter would allow for an average yield of 9,000 trays per hectare and then set about improving that if possible. The 2015/16 season saw average yields of 11,000 trays per hectare. The challenge now is of balancing increasing yields and thus supply, with maintaining per-tray returns.
Taking a yield of 10,000 trays at a prudent budgeting level of $5.60 per tray at orchard gate, gives a value of sales of $50,000 per hectare. The capital costs include $200,000 per hectare licence fee to Zespri, and approximately $200,000 per hectare to establish the orchard.
Direct production costs are approximately $35,000 per hectare leaving a margin to cover the overheads, development and water costs of $15,000 per hectare. The average OGR per hectare for 2015/16 was around $57,000.
Opportunity to increase yields, and employment
Anecdotal evidence suggests that production using foliar spray and ‘fertigation’ helped one kiwifruit grower in the region lift their yield from 8,000 to 26,000 trays per hectare. We note however that this is an exception rather than the rule. The potential to increase yield using foliar spray has yet to firmly established; further research would need to be completed but successful application could almost certainly add to higher yields.
At these levels of yield we can expect a strong interest in use of spray irrigation, at, ~1,500 to 2,000m³/ha of irrigation water per hectare per season. With this yield of fruit there will also be a strong need for labour during the picking and packing season.
Planned properly this can make employees available for other production such as intensive berry growing.
Values and prices forecast by Zespri as at February 2017 are detailed below:
· Zespri Green $53,348 per ha - $4.35 per tray · Zespri Organic Green $53,470 per ha - $6.75 per tray · Zespri Gold $97,405 per ha - $8.52 per tray · Zespri Green14 $45,049 per ha - $5.69 per tray
Market assessment for other Northland fruits
Citrus fruit
» The majority of citrus production is consumed domestically (~84%), worth around $59m. NZ’s produces less than 1% of global production.
» Climate issues, crop pests, and higher yields in the Bay of Plenty region has made citrus investment less attractive to current growers in Northland, with the number of hectares expected to decrease in the region over the next several years.
Northland has about 295ha planted in citrus which is about one-sixth of the national total; recorded as 1,857ha.
There are around 439 citrus growers across the country, producing 3,600 tonnes a year. Domestic sales are worth about $60 million, with the FOB value of exports at $11.5 million
Most of these growers are in the Gisborne, Bay of Plenty, and Northland regions. The NZ citrus industry is small, accounting for around only 0.03% of global citrus production.
We have learnt from the industry that yields of citrus in Gisborne region are significantly higher than in Northland, and that some Northland production is likely to be re-located to Gisborne. This is despite the relative advantage of citrus fruiting about two weeks earlier than elsewhere in the country.
We therefore assess that it is unlikely that there will be a need to market increased volumes of citrus from Northland.
Tamarillos market assessment
» A fledgling industry both domestically and internationally, it has been recovering over the last several years after being impacted by the Tomato Potato Psyllid (TPP) crop pest.
Some areas of land in Northland have been identified by the project team and by a number of stakeholders as very suitable for production of tamarillos.
The NZ Tamarillo Co-operative Ltd (Tamco) is the country’s only tamarillo co-operative. The size of the tamarillo industry is quite small, with Tamco buying about 90 percent of the national tamarillo crop. It handles about 350 tonnes of crop a year, grown by a small group of specialist orchardists. Much of the crop is used in producing a range of tamarillo relishes, jams, jellies, sauces, and most recently vinegar dressing. This means that Tamco can control the commercialised added value product at both the orchard gate and final product supply chain.
They usually produce a good crop in their second winter after planting – about 18 to 20 months after planting. Peak harvest months are usually July and August. The three varieties are: red, amber, and gold.
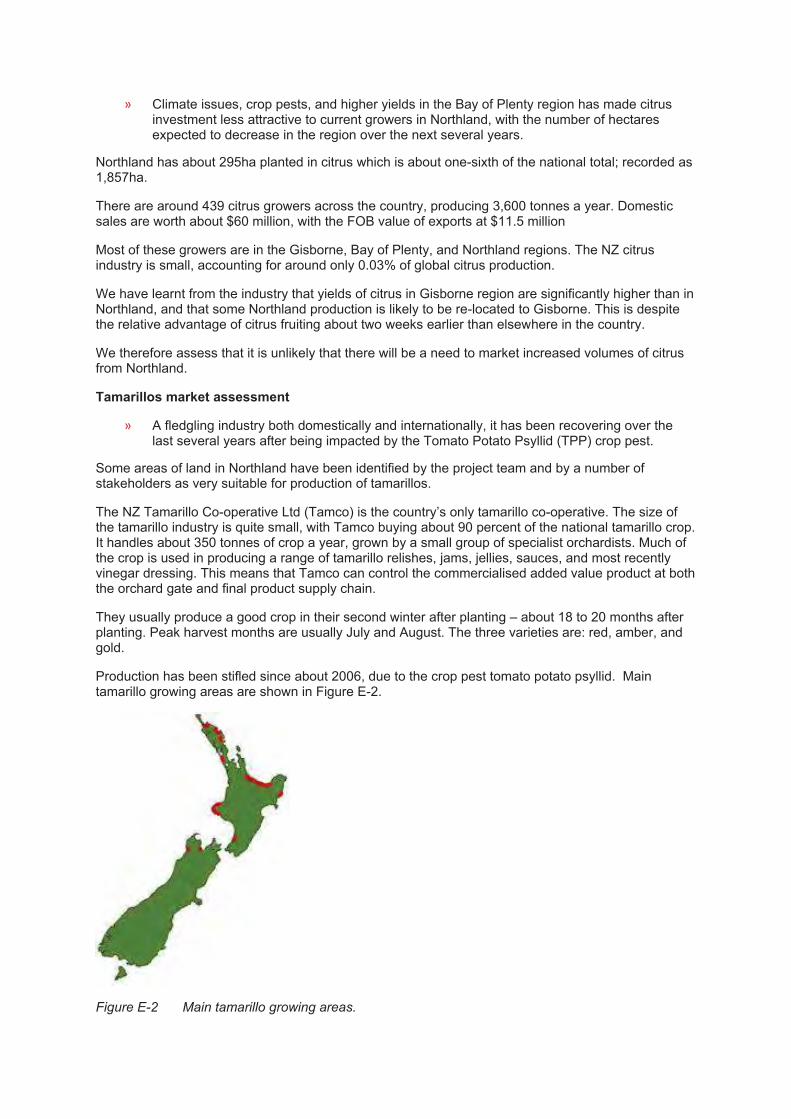
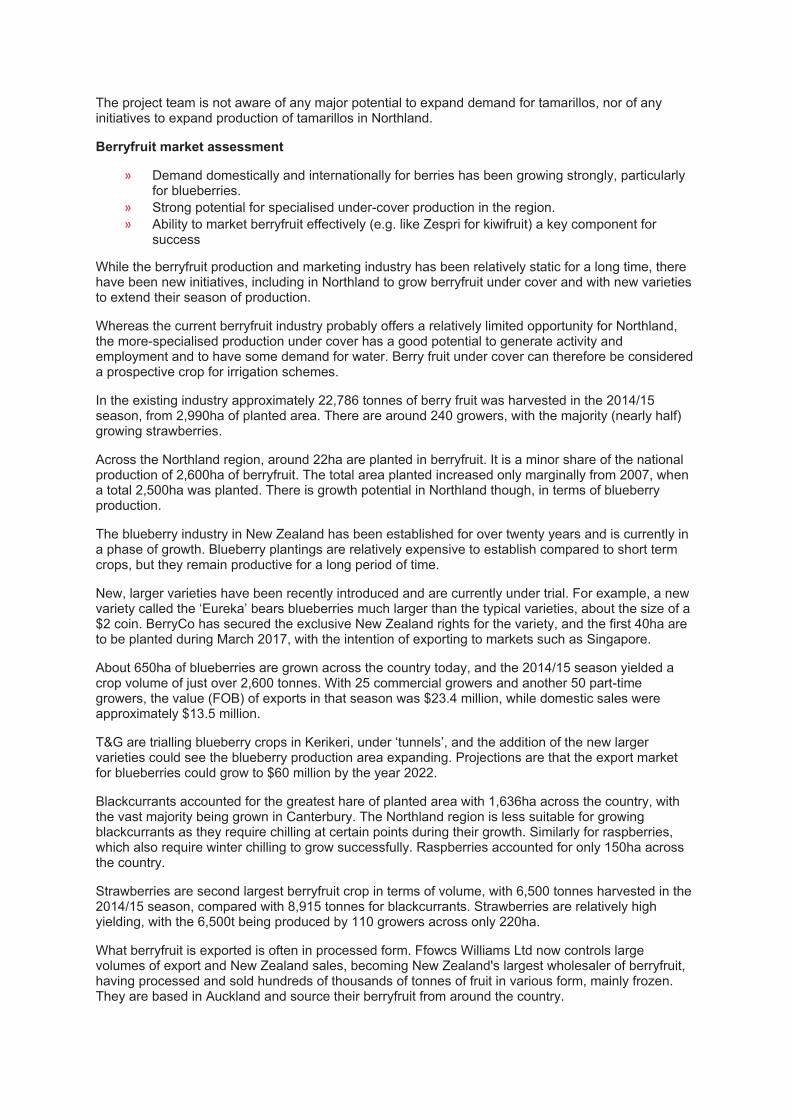
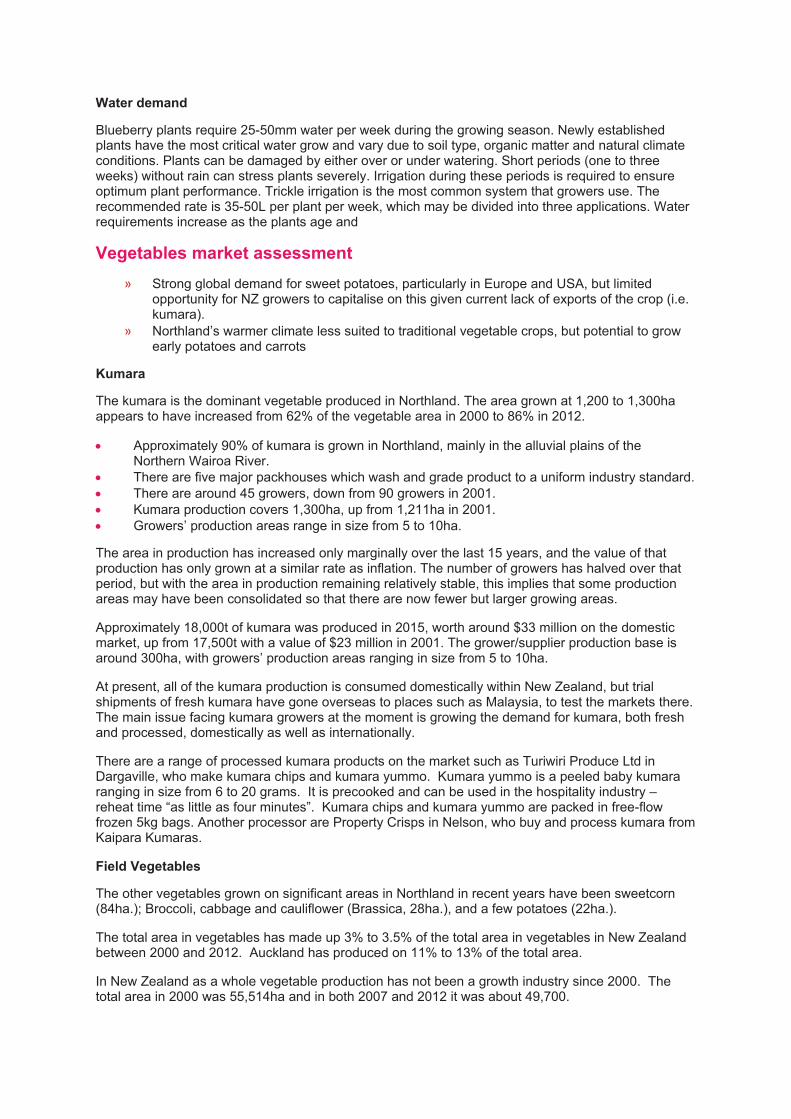
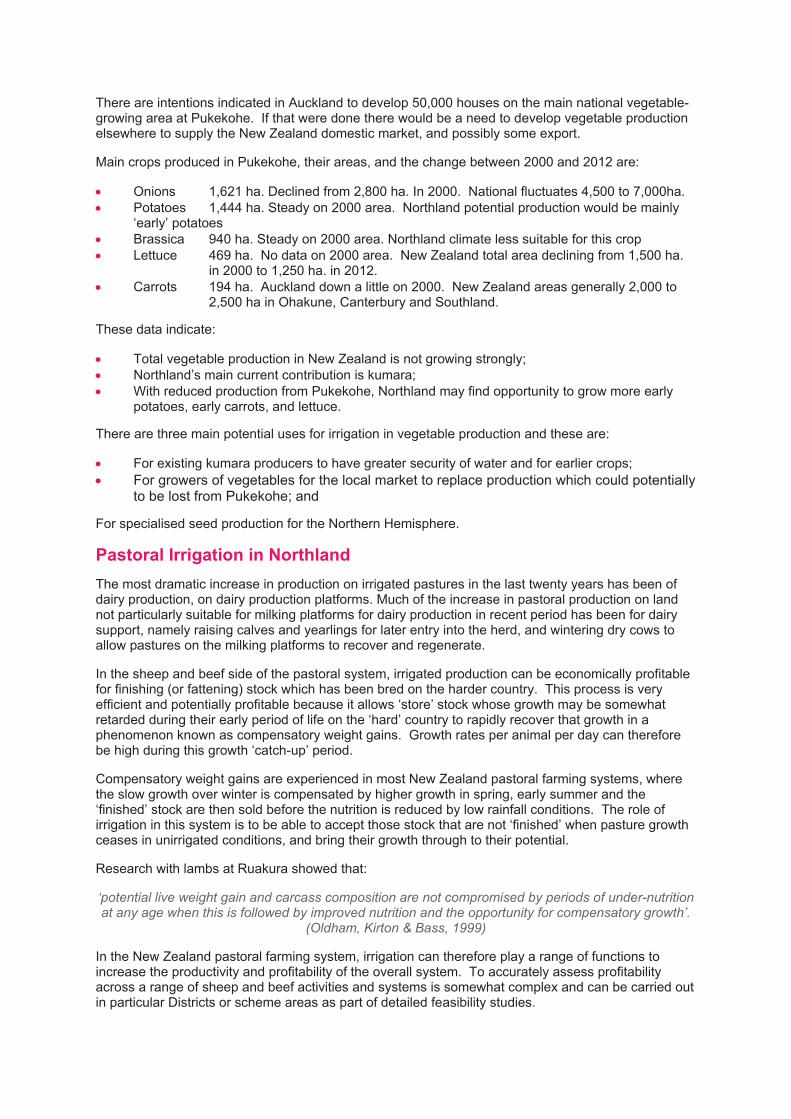
Production has been stifled since about 2006, due to the crop pest tomato potato psyllid. Main tamarillo growing areas are shown in Figure E-2.
Figure E-2 Main tamarillo growing areas.
The project team is not aware of any major potential to expand demand for tamarillos, nor of any initiatives to expand production of tamarillos in Northland.
Berryfruit market assessment
» Demand domestically and internationally for berries has been growing strongly, particularly for blueberries.
» Strong potential for specialised under-cover production in the region.
» Ability to market berryfruit effectively (e.g. like Zespri for kiwifruit) a key component for success
While the berryfruit production and marketing industry has been relatively static for a long time, there have been new initiatives, including in Northland to grow berryfruit under cover and with new varieties to extend their season of production.
Whereas the current berryfruit industry probably offers a relatively limited opportunity for Northland, the more-specialised production under cover has a good potential to generate activity and employment and to have some demand for water. Berry fruit under cover can therefore be considered a prospective crop for irrigation schemes.
In the existing industry approximately 22,786 tonnes of berry fruit was harvested in the 2014/15 season, from 2,990ha of planted area. There are around 240 growers, with the majority (nearly half) growing strawberries.
Across the Northland region, around 22ha are planted in berryfruit. It is a minor share of the national production of 2,600ha of berryfruit. The total area planted increased only marginally from 2007, when a total 2,500ha was planted. There is growth potential in Northland though, in terms of blueberry production.
The blueberry industry in New Zealand has been established for over twenty years and is currently in a phase of growth. Blueberry plantings are relatively expensive to establish compared to short term crops, but they remain productive for a long period of time.
New, larger varieties have been recently introduced and are currently under trial. For example, a new variety called the ‘Eureka’ bears blueberries much larger than the typical varieties, about the size of a $2 coin. BerryCo has secured the exclusive New Zealand rights for the variety, and the first 40ha are to be planted during March 2017, with the intention of exporting to markets such as Singapore.
About 650ha of blueberries are grown across the country today, and the 2014/15 season yielded a crop volume of just over 2,600 tonnes. With 25 commercial growers and another 50 part-time growers, the value (FOB) of exports in that season was $23.4 million, while domestic sales were approximately $13.5 million.
T&G are trialling blueberry crops in Kerikeri, under ‘tunnels’, and the addition of the new larger varieties could see the blueberry production area expanding. Projections are that the export market for blueberries could grow to $60 million by the year 2022.
Blackcurrants accounted for the greatest hare of planted area with 1,636ha across the country, with the vast majority being grown in Canterbury. The Northland region is less suitable for growing blackcurrants as they require chilling at certain points during their growth. Similarly for raspberries, which also require winter chilling to grow successfully. Raspberries accounted for only 150ha across the country.
Strawberries are second largest berryfruit crop in terms of volume, with 6,500 tonnes harvested in the 2014/15 season, compared with 8,915 tonnes for blackcurrants. Strawberries are relatively high yielding, with the 6,500t being produced by 110 growers across only 220ha.
What berryfruit is exported is often in processed form. Ffowcs Williams Ltd now controls large volumes of export and New Zealand sales, becoming New Zealand's largest wholesaler of berryfruit, having processed and sold hundreds of thousands of tonnes of fruit in various form, mainly frozen. They are based in Auckland and source their berryfruit from around the country.
Water demand
Blueberry plants require 25-50mm water per week during the growing season. Newly established plants have the most critical water grow and vary due to soil type, organic matter and natural climate conditions. Plants can be damaged by either over or under watering. Short periods (one to three weeks) without rain can stress plants severely. Irrigation during these periods is required to ensure optimum plant performance. Trickle irrigation is the most common system that growers use. The recommended rate is 35-50L per plant per week, which may be divided into three applications. Water requirements increase as the plants age and
Vegetables market assessment
» Strong global demand for sweet potatoes, particularly in Europe and USA, but limited opportunity for NZ growers to capitalise on this given current lack of exports of the crop (i.e. kumara).
» Northland’s warmer climate less suited to traditional vegetable crops, but potential to grow early potatoes and carrots
Kumara
The kumara is the dominant vegetable produced in Northland. The area grown at 1,200 to 1,300ha appears to have increased from 62% of the vegetable area in 2000 to 86% in 2012.
· Approximately 90% of kumara is grown in Northland, mainly in the alluvial plains of the Northern Wairoa River.
· There are five major packhouses which wash and grade product to a uniform industry standard. · There are around 45 growers, down from 90 growers in 2001. · Kumara production covers 1,300ha, up from 1,211ha in 2001. · Growers’ production areas range in size from 5 to 10ha.
The area in production has increased only marginally over the last 15 years, and the value of that production has only grown at a similar rate as inflation. The number of growers has halved over that period, but with the area in production remaining relatively stable, this implies that some production areas may have been consolidated so that there are now fewer but larger growing areas.
Approximately 18,000t of kumara was produced in 2015, worth around $33 million on the domestic market, up from 17,500t with a value of $23 million in 2001. The grower/supplier production base is around 300ha, with growers’ production areas ranging in size from 5 to 10ha.
At present, all of the kumara production is consumed domestically within New Zealand, but trial shipments of fresh kumara have gone overseas to places such as Malaysia, to test the markets there. The main issue facing kumara growers at the moment is growing the demand for kumara, both fresh and processed, domestically as well as internationally.
There are a range of processed kumara products on the market such as Turiwiri Produce Ltd in Dargaville, who make kumara chips and kumara yummo. Kumara yummo is a peeled baby kumara ranging in size from 6 to 20 grams. It is precooked and can be used in the hospitality industry – reheat time “as little as four minutes”. Kumara chips and kumara yummo are packed in free-flow frozen 5kg bags. Another processor are Property Crisps in Nelson, who buy and process kumara from Kaipara Kumaras.
Field Vegetables
The other vegetables grown on significant areas in Northland in recent years have been sweetcorn (84ha.); Broccoli, cabbage and cauliflower (Brassica, 28ha.), and a few potatoes (22ha.).
The total area in vegetables has made up 3% to 3.5% of the total area in vegetables in New Zealand between 2000 and 2012. Auckland has produced on 11% to 13% of the total area.
In New Zealand as a whole vegetable production has not been a growth industry since 2000. The total area in 2000 was 55,514ha and in both 2007 and 2012 it was about 49,700.
There are intentions indicated in Auckland to develop 50,000 houses on the main national vegetable-growing area at Pukekohe. If that were done there would be a need to develop vegetable production elsewhere to supply the New Zealand domestic market, and possibly some export.
Main crops produced in Pukekohe, their areas, and the change between 2000 and 2012 are:
· Onions 1,621 ha. Declined from 2,800 ha. In 2000. National fluctuates 4,500 to 7,000ha. · Potatoes 1,444 ha. Steady on 2000 area. Northland potential production would be mainly
‘early’ potatoes · Brassica 940 ha. Steady on 2000 area. Northland climate less suitable for this crop · Lettuce 469 ha. No data on 2000 area. New Zealand total area declining from 1,500 ha.
in 2000 to 1,250 ha. in 2012. · Carrots 194 ha. Auckland down a little on 2000. New Zealand areas generally 2,000 to
2,500 ha in Ohakune, Canterbury and Southland.
These data indicate:
· Total vegetable production in New Zealand is not growing strongly; · Northland’s main current contribution is kumara; · With reduced production from Pukekohe, Northland may find opportunity to grow more early
potatoes, early carrots, and lettuce.
There are three main potential uses for irrigation in vegetable production and these are:
· For existing kumara producers to have greater security of water and for earlier crops;
· For growers of vegetables for the local market to replace production which could potentially to be lost from Pukekohe; and
For specialised seed production for the Northern Hemisphere.
Pastoral Irrigation in Northland
The most dramatic increase in production on irrigated pastures in the last twenty years has been of dairy production, on dairy production platforms. Much of the increase in pastoral production on land not particularly suitable for milking platforms for dairy production in recent period has been for dairy support, namely raising calves and yearlings for later entry into the herd, and wintering dry cows to allow pastures on the milking platforms to recover and regenerate.
In the sheep and beef side of the pastoral system, irrigated production can be economically profitable for finishing (or fattening) stock which has been bred on the harder country. This process is very efficient and potentially profitable because it allows ‘store’ stock whose growth may be somewhat retarded during their early period of life on the ‘hard’ country to rapidly recover that growth in a phenomenon known as compensatory weight gains. Growth rates per animal per day can therefore be high during this growth ‘catch-up’ period.
Compensatory weight gains are experienced in most New Zealand pastoral farming systems, where the slow growth over winter is compensated by higher growth in spring, early summer and the ‘finished’ stock are then sold before the nutrition is reduced by low rainfall conditions. The role of irrigation in this system is to be able to accept those stock that are not ‘finished’ when pasture growth ceases in unirrigated conditions, and bring their growth through to their potential.
Research with lambs at Ruakura showed that:
‘potential live weight gain and carcass composition are not compromised by periods of under-nutrition at any age when this is followed by improved nutrition and the opportunity for compensatory growth’.
(Oldham, Kirton & Bass, 1999)
In the New Zealand pastoral farming system, irrigation can therefore play a range of functions to increase the productivity and profitability of the overall system. To accurately assess profitability across a range of sheep and beef activities and systems is somewhat complex and can be carried out in particular Districts or scheme areas as part of detailed feasibility studies.
In the current study, we shall use the dairy production on dairy platforms as the main indicator of likelihood of profitability. If this production is not feasible, and profitable under irrigation on the proposed schemes it is likely that sheep and beef finishing and dairy support would similarly struggle.
Market for more dairy production in Northland
In general in New Zealand it is assumed that any milk which can be produced economically on dairy farms with reasonable road access will be taken by the Fonterra co-operative, and processed into product, mainly for export. In order to obtain the right to sell to Fonterra, the dairy farmers must own shares in Fonterra equivalent to the volume of milk they wish to supply.
In New Zealand, over the long term, namely 40 years, the inflation adjusted farm gate payout price for milk has been very close to $6.00 per kilogram of Milk Solids (kgMS), expressed in 2016 $NZ. The actual average number to 2016 is $5.89 per kgMS. Currently the International Milk Product auctions are at prices that would yield a farmgate payout of $NZ 6.00 per kgMS
The key determinant of the likely demand for water for irrigation for dairy production is thus the ability to use the water to produce more Milk Solids at a farm gate payout of $6.00 per kgMS.
Dairy production benefit from irrigation in Northland
The main potential benefits to dairy production of irrigation in Northland are:
· To reduce the fluctuations in production due to fluctuations in rainfall and water availability; · To increase and managed the type and quanitity of feed available to cows in all years and thus
increase production per cow, and potentially in cow numbers; · To maintain current cow numbers and production per cow, but reduce purchased feed; and · In Kaipara in particular to increase per cow production by providing more palatable drinking
water to the cows.
Reducing dry season fluctuations in Northland dairy production
In Stage 1, we showed that the year-by-year fluctuations in production of MS per cow and MS per hectare in the years since 1996 indicate that if these fluctuations were eliminated and production per hectare had progressed steadily along the trend from 580 kgsMS in 1996 to about 730 kgsMS in 2016, then the average production per year would have been increased by 9% to 10%. In terms of current production levels averaging 730 kgsMS per hectare the increased value per hectare would be 9% to 10% of 730kg, namely 66 to 73 kgsMS per hectare at $6 per kg is $396 to $438 per hectare, say $415 per hectare per year.
To give some scale to the impacts possible in reducing dry season fluctuations, we now describe seasonal profiles of pasture growth in Northland under dryland and irrigation conditions. We then compare the seasonal production profile in Northland in recent ‘normal;’ and ‘drought’ years with the North Canterbury profile which is largely irrigated. We also show the effects of droughts on average lengths of lactations in rain-fed and irrigated regions.
Seasonal pastoral feed production and dairying
The level of dairy production per hectare in Northland in 2016 stands at about 730 kgsMS. This is little more than one-half of the 1,350 kgsMS per hectare produced under irrigation on the free-draining soils in Canterbury.
These average figures disguise a range of factors which result in Northland average (and the Northland Districts’ averages) levels of production being different. These differences cannot all be overcome with irrigating pasture in Northland, but some can be.
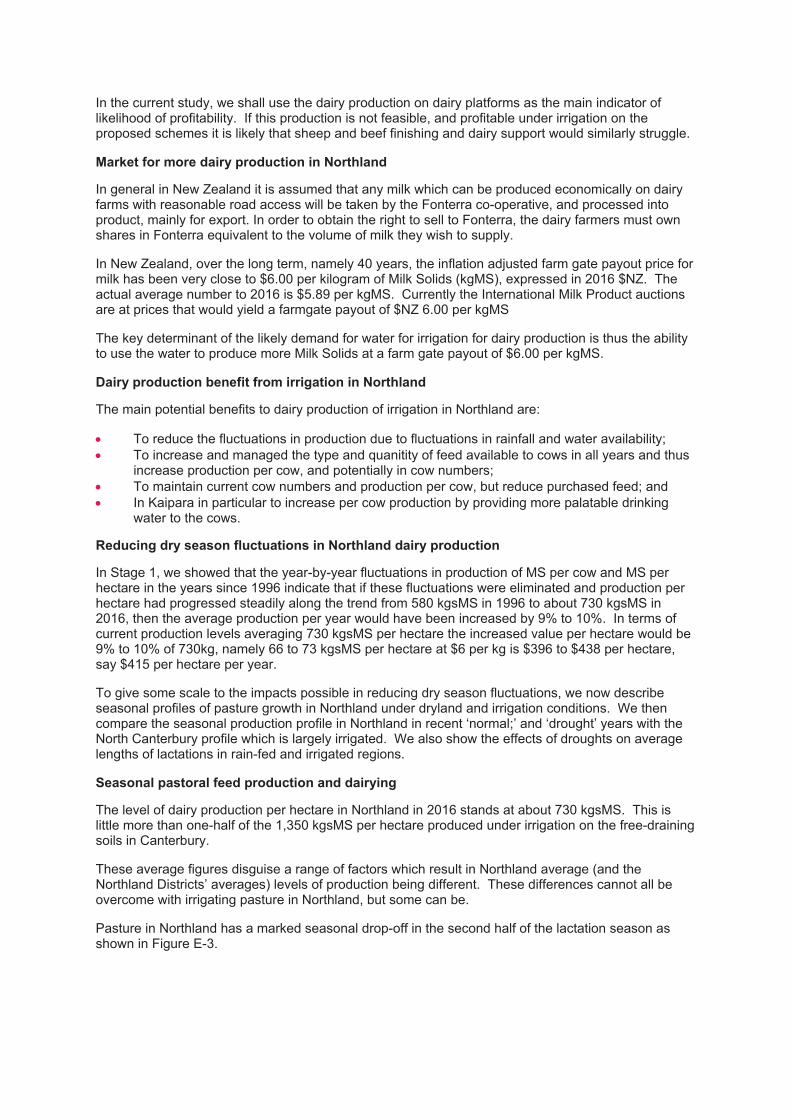
Pasture in Northland has a marked seasonal drop-off in the second half of the lactation season as shown in Figure E-3.
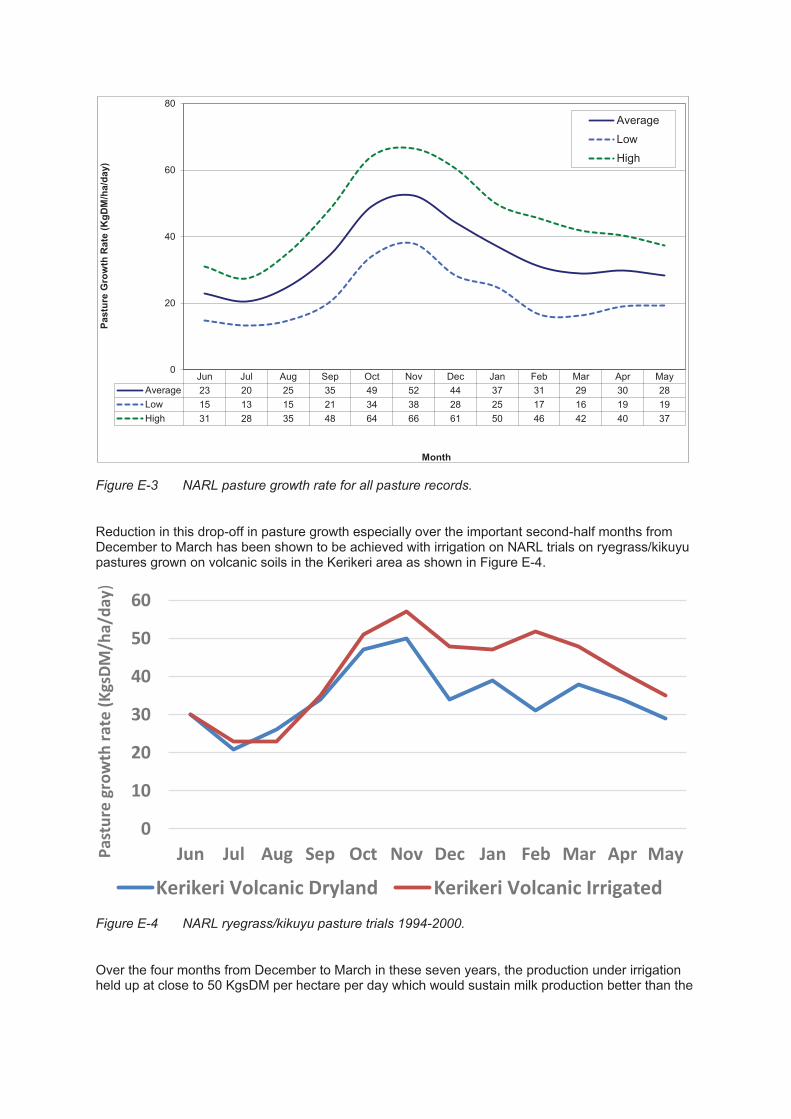
Figure E-3 NARL pasture growth rate for all pasture records.
Reduction in this drop-off in pasture growth especially over the important second-half months from December to March has been shown to be achieved with irrigation on NARL trials on ryegrass/kikuyu pastures grown on volcanic soils in the Kerikeri area as shown in Figure E-4.
Figure E-4 NARL ryegrass/kikuyu pasture trials 1994-2000.
Over the four months from December to March in these seven years, the production under irrigation held up at close to 50 KgsDM per hectare per day which would sustain milk production better than the
Jun Jul Aug Sep Oct Nov Dec Jan Feb Mar Apr May
Average 23 20 25 35 49 52 44 37 31 29 30 28
Low 15 13 15 21 34 38 28 25 17 16 19 19
High 31 28 35 48 64 66 61 50 46 42 40 37
0
20
40
60
80P
astu
re G
row
th R
ate
(K
gD
M/h
a/d
ay)
Month
Average
Low
High
0
10
20
30
40
50
60
Jun Jul Aug Sep Oct Nov Dec Jan Feb Mar Apr MayPa
stu
re g
row
th r
ate
(K
gsD
M/h
a/d
ay
)
Kerikeri Volcanic Dryland Kerikeri Volcanic Irrigated
dryland pasture. The latter averaged about 35 KgsDM per hectare per day, giving the irrigation about a 37% margin.
This within-season variation is also apparent at the regional level if we compare monthly dairy production levels between Northland which is largely unirrigated dairy, and North Canterbury which is largely irrigated dairy production. We studied three seasons – 2011-12, a moderate season; 2012-13, a drought in Northland; and 2015-16, a better season.
We tracked the average production of milk solids per cow per day in each month over these production seasons. We found that in all three of these seasons the production per cow per day in September in North Canterbury was 20% above that in Northland, and in October was 30% higher in all seasons. For November, December, January, February and March, in the better seasons, production in North Canterbury, tracking from 1.9Kgs to 1.5 kgsMS/cow/day over the period was fairly consistently 40% above that in Northland which tracked down from 1.5 to 1.1 kgsMS/cow/day over the period. However the dramatic difference was in the drought year 2012-13 when North Canterbury Milk Solids production held up under irrigation similarly to the other years, whereas production in drought affected Northland dropped from 1.5 kgsMS/cow/day in November to just 0.85 kgsMS/cow/day by March. In February and March in this dry year, the North Canterbury production was 65% to 75% greater than in Northland.
Given the different soils and other factors, Northland would not aspire to produce those Canterbury levels, however with attention to exploring the best mix of pasture species and other inputs under irrigation, it could well be possible to increase pasture production and thus kgsMS by 30% per hectare under irrigation. Given the current level at 730 kgsMS, this would imply an increase to 950 kgsMS per hectare. This increase of 220 kgsMS per hectare would be worth an additional $1,320 per hectare as returns at farm gate.
With the higher production of pasture it is also probable that there would be no need for additional feed such as PKE to be purchased and brought on-farm. This could further increase margins earned per hectare.
Reducing the seasonal decline in production by judicious use of irrigation in Northland could increase the per cow production by 5% to 11% per season.
Lactation lengths in rain-fed and irrigated or high rainfall regions
One of the key causes of the reduced production in the dry years is that with delayed spring growth or with drought causing cows to be dried off early, the lactation length, and thus per cow production is reduced. The impacts of the droughts in Northland in recent years has been as significant as it has been in the Waikato and other rain-fed North Island dairy regions.
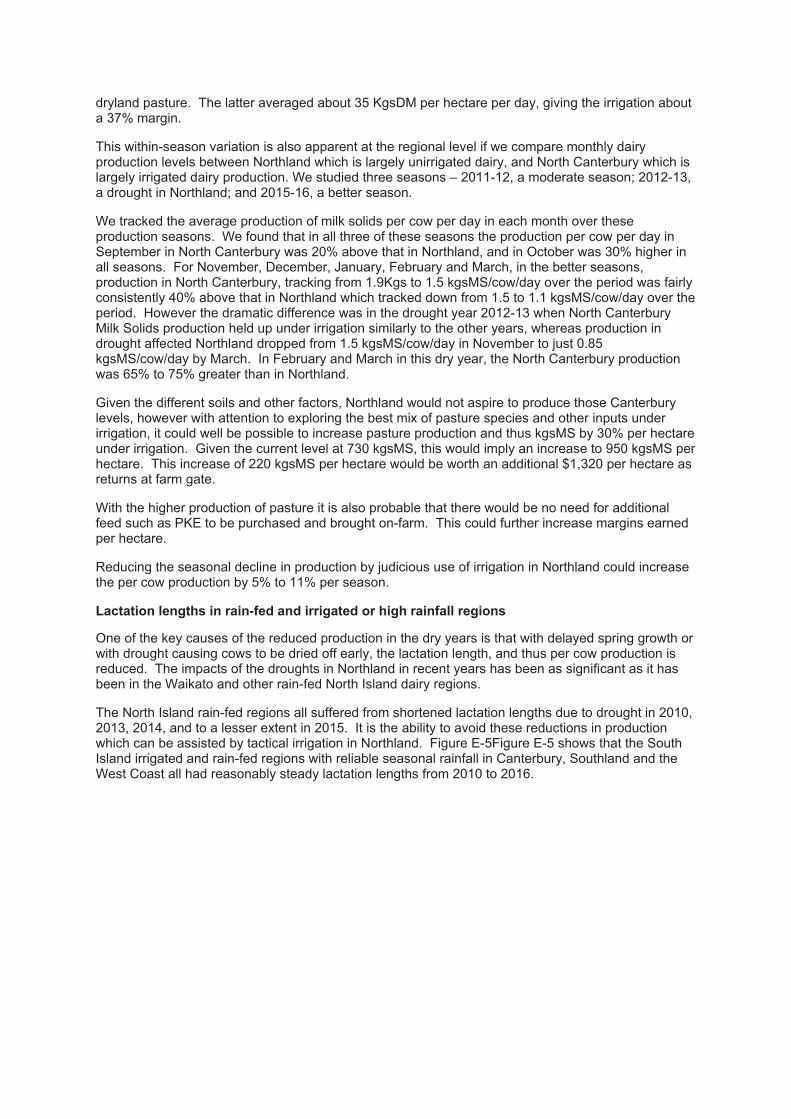
The North Island rain-fed regions all suffered from shortened lactation lengths due to drought in 2010, 2013, 2014, and to a lesser extent in 2015. It is the ability to avoid these reductions in production which can be assisted by tactical irrigation in Northland. Figure E-5Figure E-5 shows that the South Island irrigated and rain-fed regions with reliable seasonal rainfall in Canterbury, Southland and the West Coast all had reasonably steady lactation lengths from 2010 to 2016.
Figure E-5 New Zealand regional lactation lengths from 2010-2016.
Increasing production in Kaipara from better dairy drinking water
While most of the increased dairy production achieved with water is generally gained through increased pasture production, in Kaipara however, the stockwater provided to dairy cows is very high in iron. There is evidence that this impacts heavily on the level of dairy production per cow, and it is likely to also cause animal health problems with impacts on the numbers of lactations per cow, the higher numbers of cows getting in-calf and the like.
The findings on two farms operated by the same entity was that on a farm using local groundwater untreated, the average production was 350 kgs MS/cow, whereas on the other farm with filtered water, the production was 450 kgs MS/cow. A scheme to supply surface water to dairy cows would not necessarily service all herds, nor is it likely that all cows would respond by increasing their production by 100 kgs MS/cow. Even if one-third of the 108,000 cows in Kaipara increased their production by, say, 50kgs MS/cow, at a payout of $6 per kg of MS, the farmgate value of the production increase would be about $11 million per year in Kaipara.
Similar increases in productivity have also been found in raising bulls for beef in the Kaipara, where stocking rate of three bulls finished per hectare has been increased to five bulls per hectare,
Irrigated dairy production ability to pay for water
The ability of the dairy production to pay for water for irrigation will depend upon the specific climate in various parts of the region, and the soils and pasture species and/or feed crops. There is an expectation that the average requirement for irrigation water would be in the depth range 300mm to 500mm. If there was 3.5 mm applied per day, or 35m
3 per hectare per day over 100 days, this would
be 3,500m3/ha per season. The estimates across the various areas, especially in Kaipara are that
average water need is expected to be 4,500 to 5,500m3/ha/yr for the area being irrigated. In
Northland on dairy platforms it is expected that irrigation will be on part of the property only.
The indications are that benefits in terms of increased margins from drought avoidance and increased pasture productivity could be of the order of $1,500 plus per hectare under dairy production. This implies that all other things considered dairy production could probably afford a ‘total landed cost including capital servicing and other charges on pasture or feed crop’ of $0.40 cents per cubic metre.
230
240
250
260
270
280
290
2010 2011 2012 2013 2014 2015 2016
Per Cow Production days In Milk
Northland Waikato Bay of Plenty Taranaki
West Coast North Canterbury South Canterbury Southland
Irrigated dairy production scope in Kaipara and the Mid-North
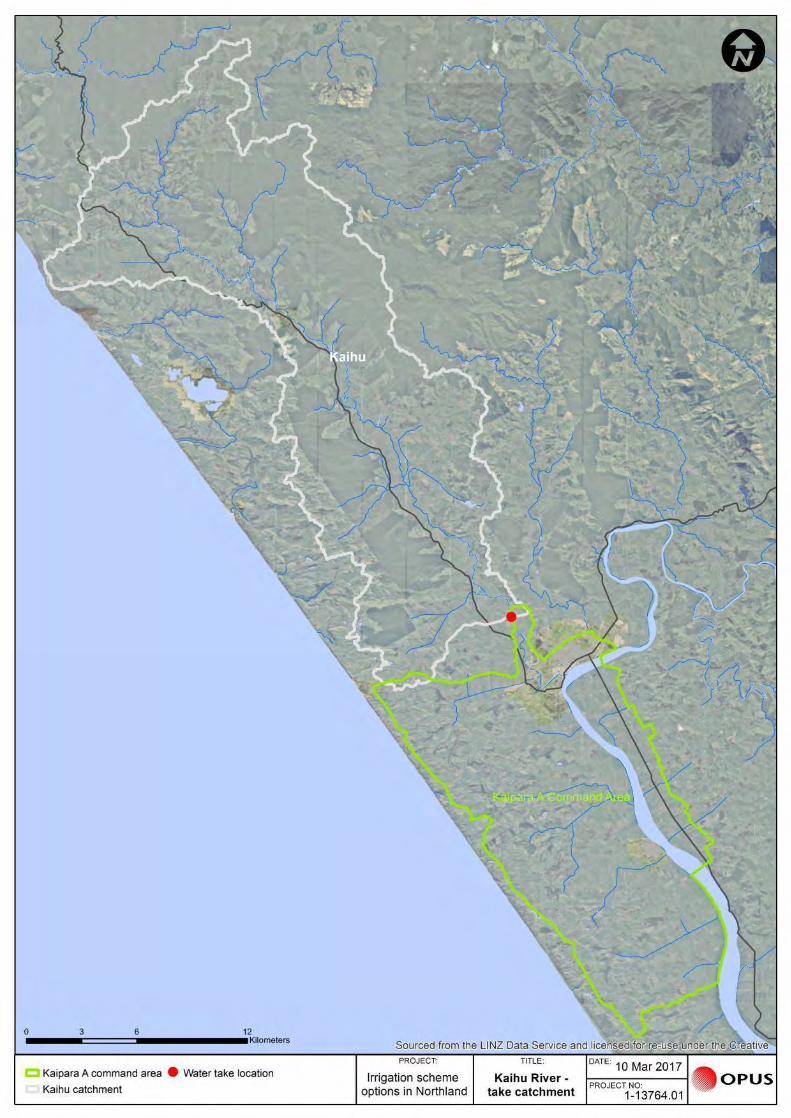
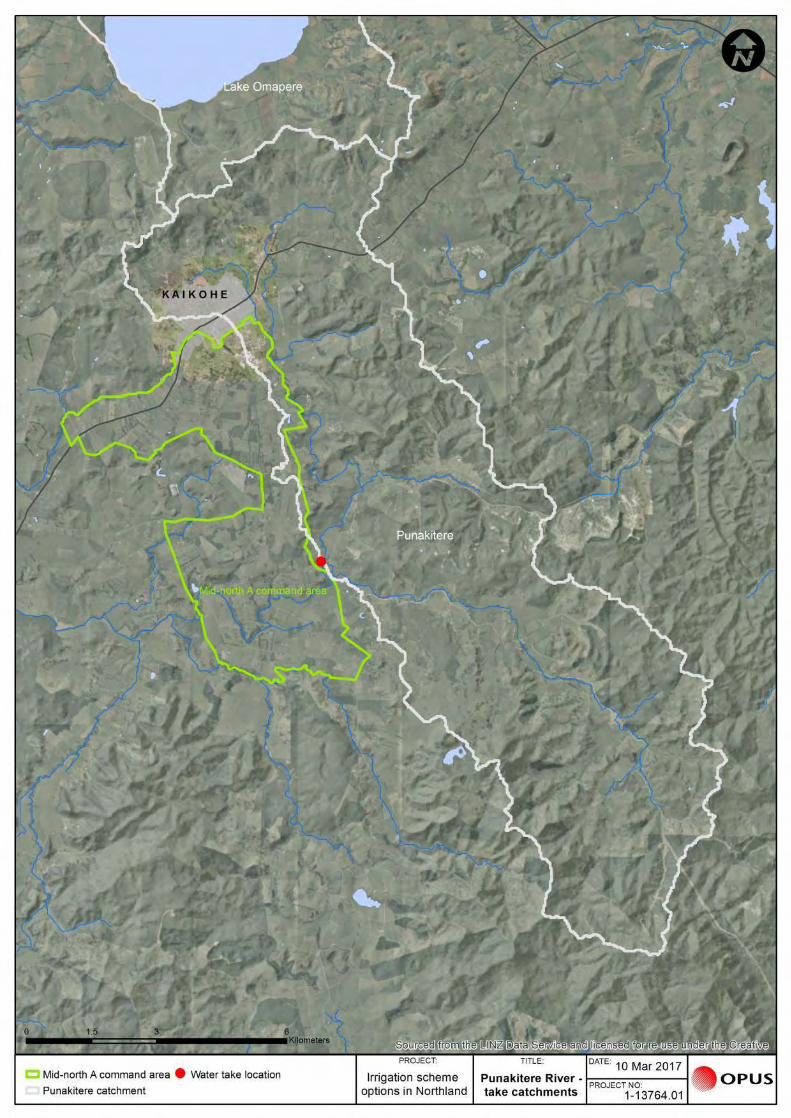
The land, soil and climate investigations indicate that in the selected scheme areas in Kaipara and the Mid-North there are 10,400ha of land suitable for irrigated dairy production platforms. At the expected rate of uptake in each area, the estimated area of land likely to be irrigated as part of dairy production platforms is 3,850ha. Most of this land is in the Kaipara command areas.
This area of 3,850ha irrigated is similar in scale to the current total area under irrigated dairy production which is recorded as 4,000ha.
At this level, and if this land was fully irrigated, the total annual demand would be over 19Mm³.
Beef, sheep and dairy support tactical irrigation
The previous section has concentrated on dairy production response to irrigation rather than concentrating on other pastoral uses for two reasons:
» Firstly, the area suited to irrigated dairy production in the scheme areas (3,800 hectares) is greater than that suitable to irrigated pasture for beef, sheep and dairy support (1,100 hectares); and
» Secondly, with these other pastoral uses there are a wide range of functions irrigation can be used to improve production, environmental management, and other tactical inputs to a wide range of pastoral farming systems. Whereas for dairying, it is relatively simple to track the impact on the production of milk solids and also, in particular situations, the environmental impacts.
Having shown that irrigated production to support dairy production in these scheme areas is likely to be feasible and economic, it follows that it is likely that in some of the other pastoral management systems in the scheme areas, irrigated pasture and feed production will also be feasible and economic. While the actual area likely to be irrigated for beef, sheep and dairy support in these scheme areas is expected to be smaller than the areas of some other land uses, the impact of this irrigated production can significantly improve the outcomes on a much larger farming area. The outcomes improved include farm incomes, employment and environmental management of the more fragile pasture areas, such as the clays, and the harder country. The irrigated feed production can be used tactically to increase the productivity of the pasture growth through techniques like techno-grazing and other systems. It will be essential to research some farm system case studies to show the benefits of this irrigation in terms of drought mitigation, and other management functions across the range of soil, terrain and climate types in the scheme areas.

Appendix F Location of assumed intakes

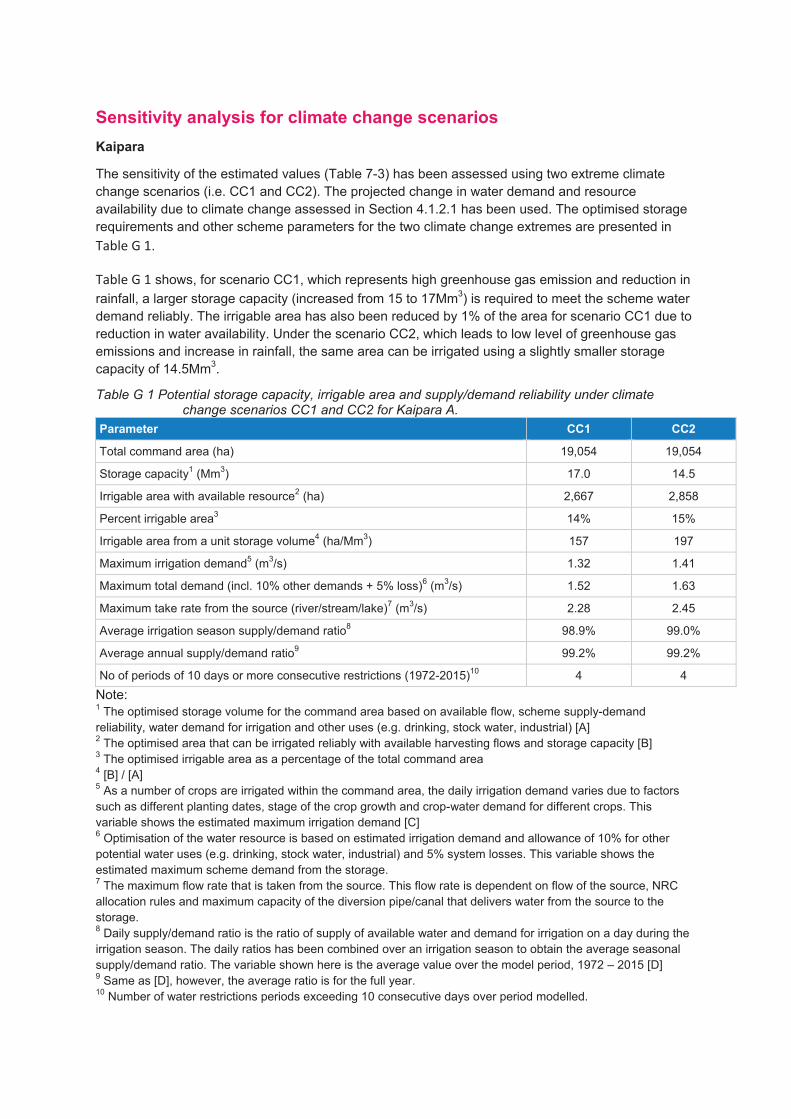
Sensitivity analysis for climate change scenarios
Kaipara
The sensitivity of the estimated values (Table 7-3) has been assessed using two extreme climate
change scenarios (i.e. CC1 and CC2). The projected change in water demand and resource
availability due to climate change assessed in Section 4.1.2.1 has been used. The optimised storage
requirements and other scheme parameters for the two climate change extremes are presented in
Table G 1.
Table G 1 shows, for scenario CC1, which represents high greenhouse gas emission and reduction in
rainfall, a larger storage capacity (increased from 15 to 17Mm3) is required to meet the scheme water
demand reliably. The irrigable area has also been reduced by 1% of the area for scenario CC1 due to
reduction in water availability. Under the scenario CC2, which leads to low level of greenhouse gas
emissions and increase in rainfall, the same area can be irrigated using a slightly smaller storage
capacity of 14.5Mm3.
Table G 1 Potential storage capacity, irrigable area and supply/demand reliability under climate change scenarios CC1 and CC2 for Kaipara A.
Parameter CC1 CC2
Total command area (ha) 19,054 19,054
Storage capacity1 (Mm
3) 17.0 14.5
Irrigable area with available resource2 (ha) 2,667 2,858
Percent irrigable area3 14% 15%
Irrigable area from a unit storage volume4 (ha/Mm
3) 157 197
Maximum irrigation demand5 (m
3/s) 1.32 1.41
Maximum total demand (incl. 10% other demands + 5% loss)6 (m
3/s) 1.52 1.63
Maximum take rate from the source (river/stream/lake)7 (m
3/s) 2.28 2.45
Average irrigation season supply/demand ratio8 98.9% 99.0%
Average annual supply/demand ratio9 99.2% 99.2%
No of periods of 10 days or more consecutive restrictions (1972-2015)10
4 4
Note: 1 The optimised storage volume for the command area based on available flow, scheme supply-demand
reliability, water demand for irrigation and other uses (e.g. drinking, stock water, industrial) [A] 2 The optimised area that can be irrigated reliably with available harvesting flows and storage capacity [B]
3 The optimised irrigable area as a percentage of the total command area
4 [B] / [A]
5 As a number of crops are irrigated within the command area, the daily irrigation demand varies due to factors
such as different planting dates, stage of the crop growth and crop-water demand for different crops. This
variable shows the estimated maximum irrigation demand [C] 6 Optimisation of the water resource is based on estimated irrigation demand and allowance of 10% for other
potential water uses (e.g. drinking, stock water, industrial) and 5% system losses. This variable shows the
estimated maximum scheme demand from the storage. 7 The maximum flow rate that is taken from the source. This flow rate is dependent on flow of the source, NRC
allocation rules and maximum capacity of the diversion pipe/canal that delivers water from the source to the
storage. 8 Daily supply/demand ratio is the ratio of supply of available water and demand for irrigation on a day during the
irrigation season. The daily ratios has been combined over an irrigation season to obtain the average seasonal
supply/demand ratio. The variable shown here is the average value over the model period, 1972 – 2015 [D] 9 Same as [D], however, the average ratio is for the full year.
10 Number of water restrictions periods exceeding 10 consecutive days over period modelled.
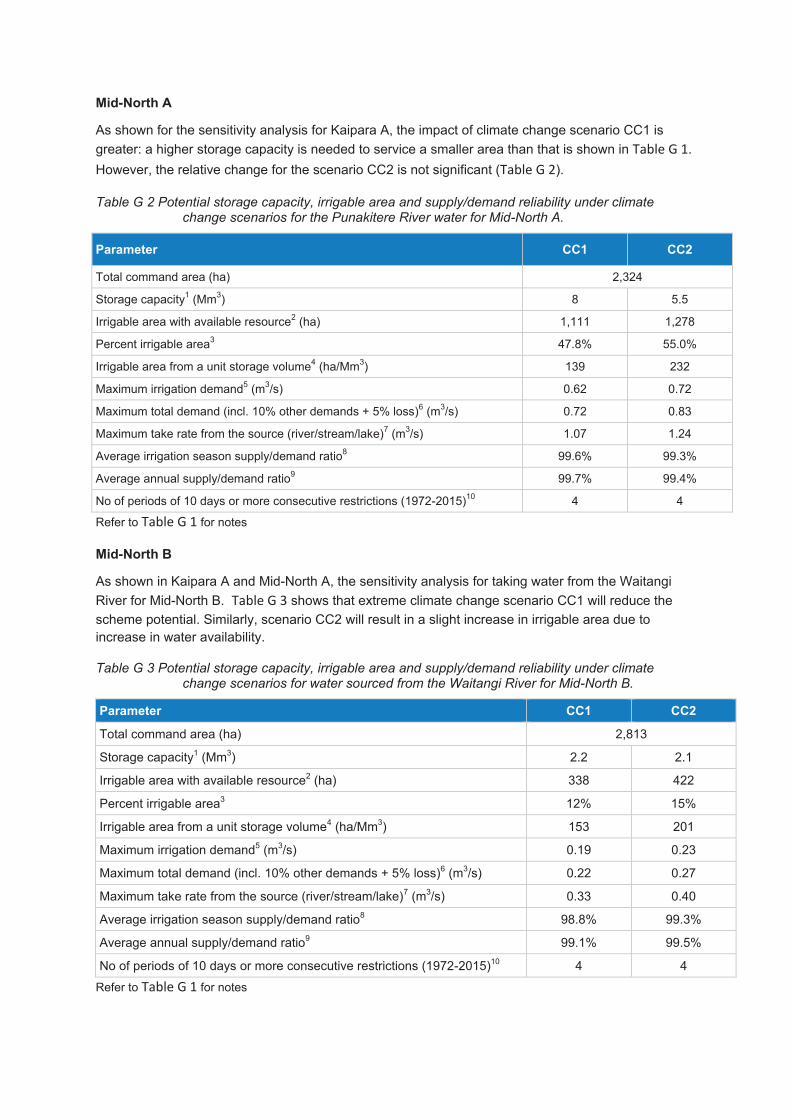
Mid-North A
As shown for the sensitivity analysis for Kaipara A, the impact of climate change scenario CC1 is
greater: a higher storage capacity is needed to service a smaller area than that is shown in Table G 1.
However, the relative change for the scenario CC2 is not significant (Table G 2).
Table G 2 Potential storage capacity, irrigable area and supply/demand reliability under climate change scenarios for the Punakitere River water for Mid-North A.
Parameter CC1 CC2
Total command area (ha) 2,324
Storage capacity1 (Mm
3) 8 5.5
Irrigable area with available resource2 (ha) 1,111 1,278
Percent irrigable area3 47.8% 55.0%
Irrigable area from a unit storage volume4 (ha/Mm
3) 139 232
Maximum irrigation demand5 (m
3/s) 0.62 0.72
Maximum total demand (incl. 10% other demands + 5% loss)6 (m
3/s) 0.72 0.83
Maximum take rate from the source (river/stream/lake)7 (m
3/s) 1.07 1.24
Average irrigation season supply/demand ratio8 99.6% 99.3%
Average annual supply/demand ratio9 99.7% 99.4%
No of periods of 10 days or more consecutive restrictions (1972-2015)10
4 4
Refer to Table G 1 for notes
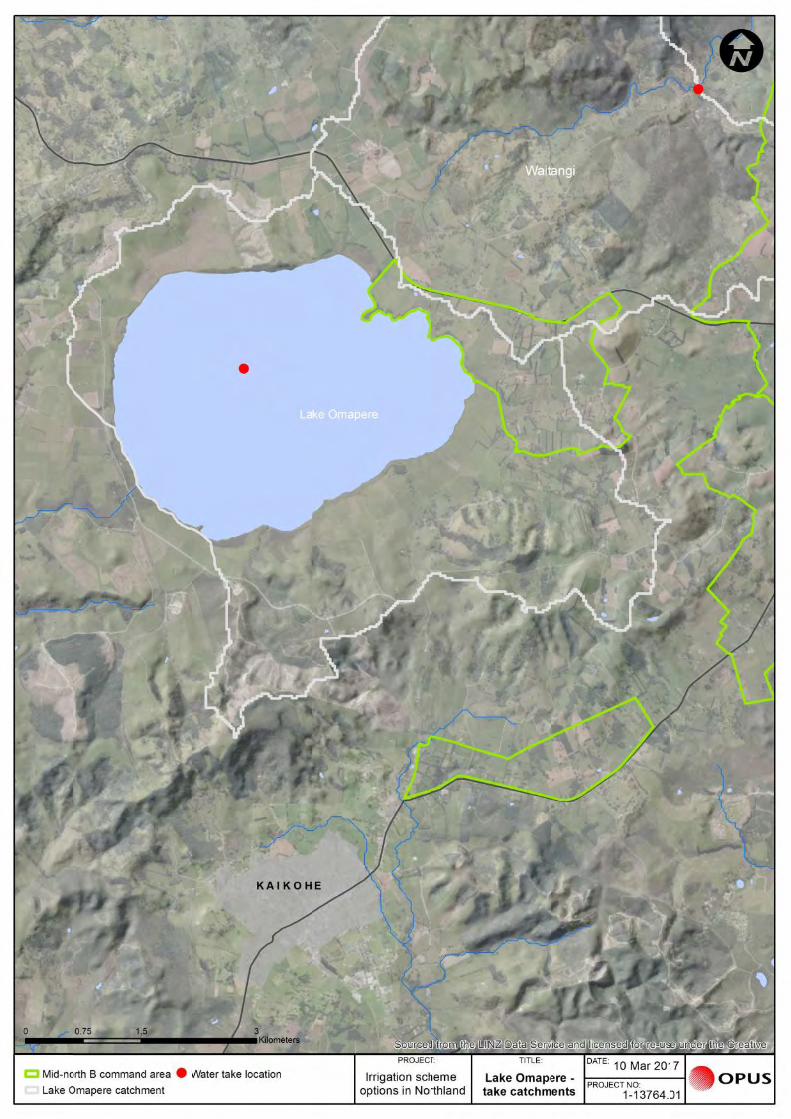
Mid-North B
As shown in Kaipara A and Mid-North A, the sensitivity analysis for taking water from the Waitangi
River for Mid-North B. Table G 3 shows that extreme climate change scenario CC1 will reduce the
scheme potential. Similarly, scenario CC2 will result in a slight increase in irrigable area due to
increase in water availability.
Table G 3 Potential storage capacity, irrigable area and supply/demand reliability under climate change scenarios for water sourced from the Waitangi River for Mid-North B.
Parameter CC1 CC2
Total command area (ha) 2,813
Storage capacity1 (Mm
3) 2.2 2.1
Irrigable area with available resource2 (ha) 338 422
Percent irrigable area3 12% 15%
Irrigable area from a unit storage volume4 (ha/Mm
3) 153 201
Maximum irrigation demand5 (m
3/s) 0.19 0.23
Maximum total demand (incl. 10% other demands + 5% loss)6 (m
3/s) 0.22 0.27
Maximum take rate from the source (river/stream/lake)7 (m
3/s) 0.33 0.40
Average irrigation season supply/demand ratio8 98.8% 99.3%
Average annual supply/demand ratio9 99.1% 99.5%
No of periods of 10 days or more consecutive restrictions (1972-2015)10
4 4
Refer to Table G 1 for notes
It is considered that the uncertainty of water availability from Lake Omapere is high, and therefore it is
not meaningful to assess the sensitivity of the supply at this stage.
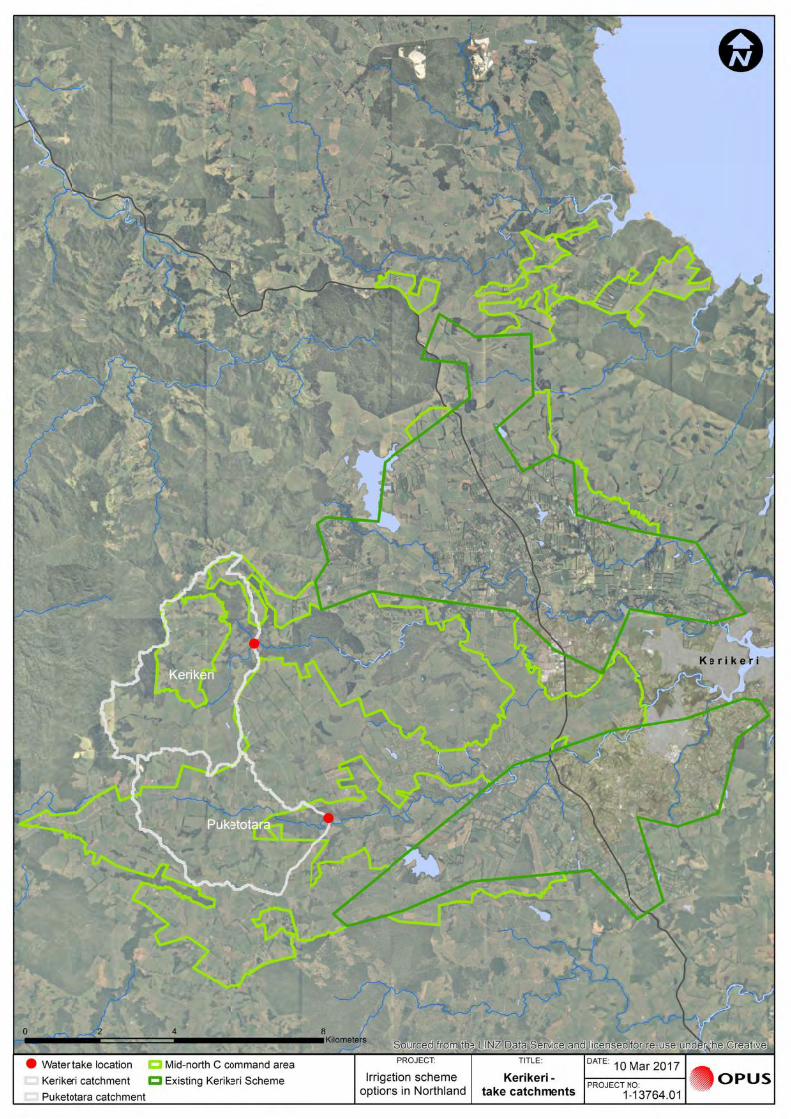
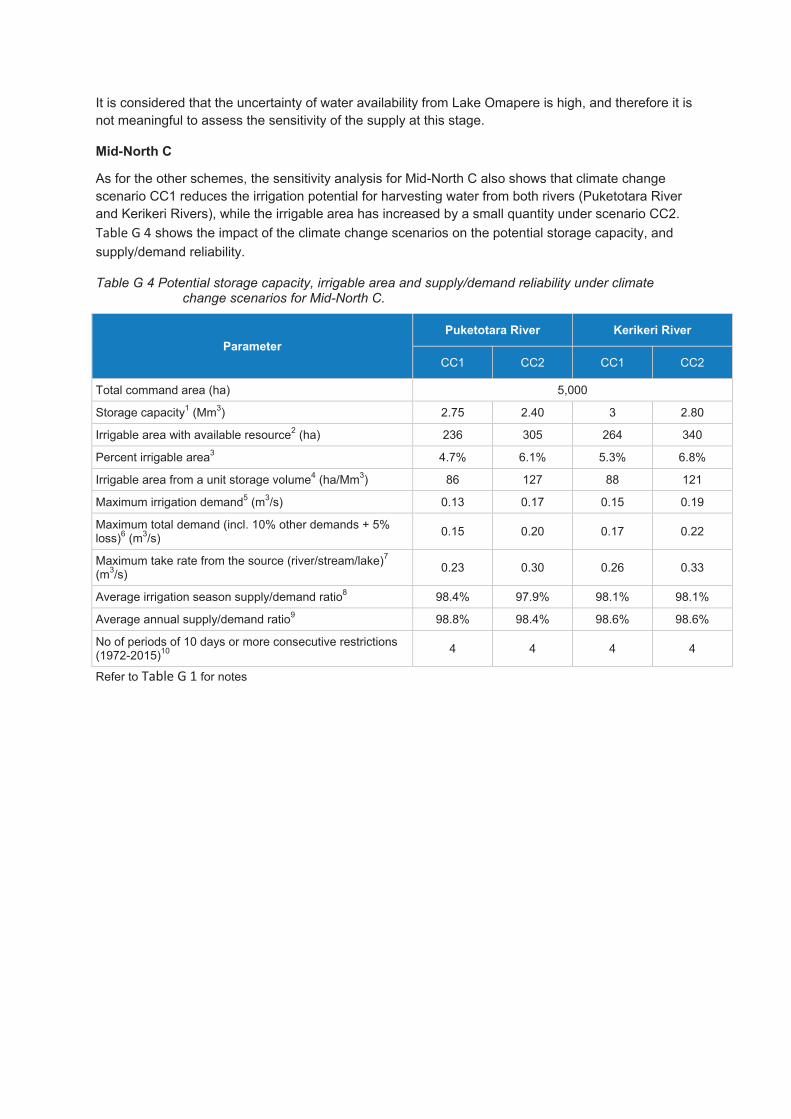
Mid-North C
As for the other schemes, the sensitivity analysis for Mid-North C also shows that climate change
scenario CC1 reduces the irrigation potential for harvesting water from both rivers (Puketotara River
and Kerikeri Rivers), while the irrigable area has increased by a small quantity under scenario CC2.
Table G 4 shows the impact of the climate change scenarios on the potential storage capacity, and
supply/demand reliability.
Table G 4 Potential storage capacity, irrigable area and supply/demand reliability under climate change scenarios for Mid-North C.
Parameter
Puketotara River Kerikeri River
CC1 CC2 CC1 CC2
Total command area (ha) 5,000
Storage capacity1 (Mm
3) 2.75 2.40 3 2.80
Irrigable area with available resource2 (ha) 236 305 264 340
Percent irrigable area3 4.7% 6.1% 5.3% 6.8%
Irrigable area from a unit storage volume4 (ha/Mm
3) 86 127 88 121
Maximum irrigation demand5 (m
3/s) 0.13 0.17 0.15 0.19
Maximum total demand (incl. 10% other demands + 5% loss)
6 (m
3/s)
0.15 0.20 0.17 0.22
Maximum take rate from the source (river/stream/lake)7
(m3/s)
0.23 0.30 0.26 0.33
Average irrigation season supply/demand ratio8 98.4% 97.9% 98.1% 98.1%
Average annual supply/demand ratio9 98.8% 98.4% 98.6% 98.6%
No of periods of 10 days or more consecutive restrictions (1972-2015)
10
4 4 4 4
Refer to Table G 1 for notes

Appendix H Storage

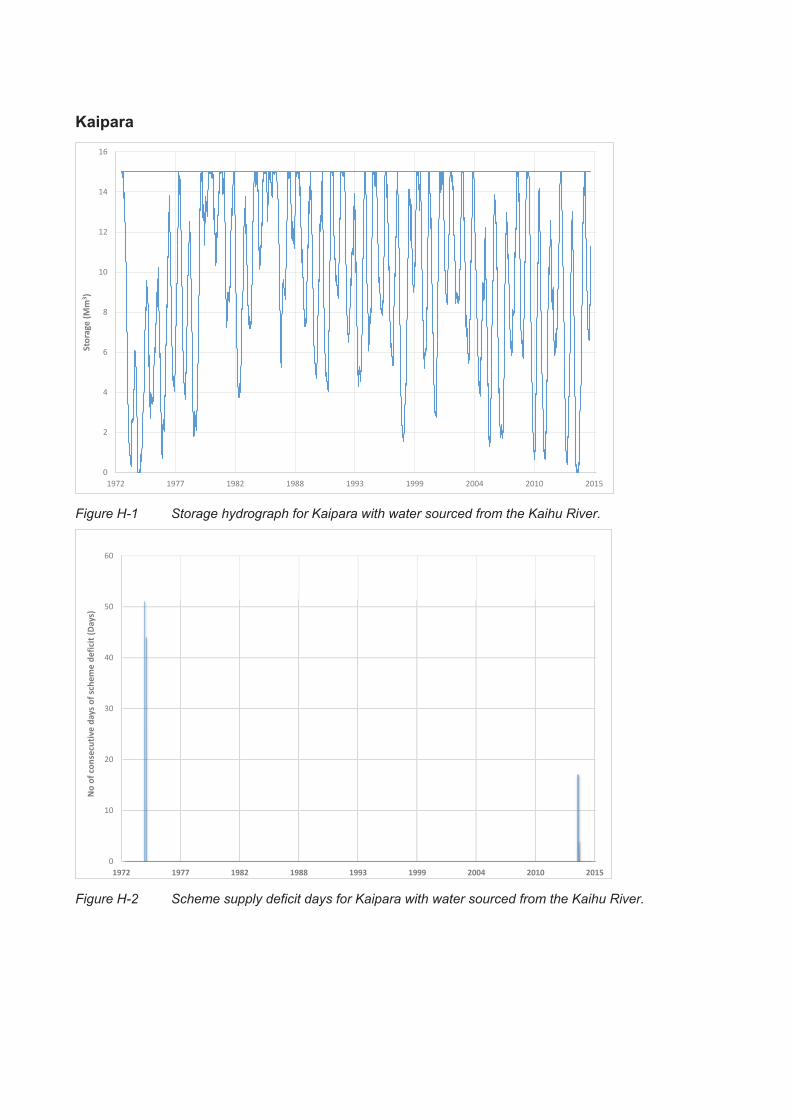
Kaipara
Figure H-1 Storage hydrograph for Kaipara with water sourced from the Kaihu River.
Figure H-2 Scheme supply deficit days for Kaipara with water sourced from the Kaihu River.
0
2
4
6
8
10
12
14
16
1972 1977 1982 1988 1993 1999 2004 2010 2015
Sto
rag
e (
Mm
3)
0
10
20
30
40
50
60
1972 1977 1982 1988 1993 1999 2004 2010 2015
No
of
con
secu
tiv
e d
ay
s o
f sc
he
me
de
fici
t (D
ay
s)
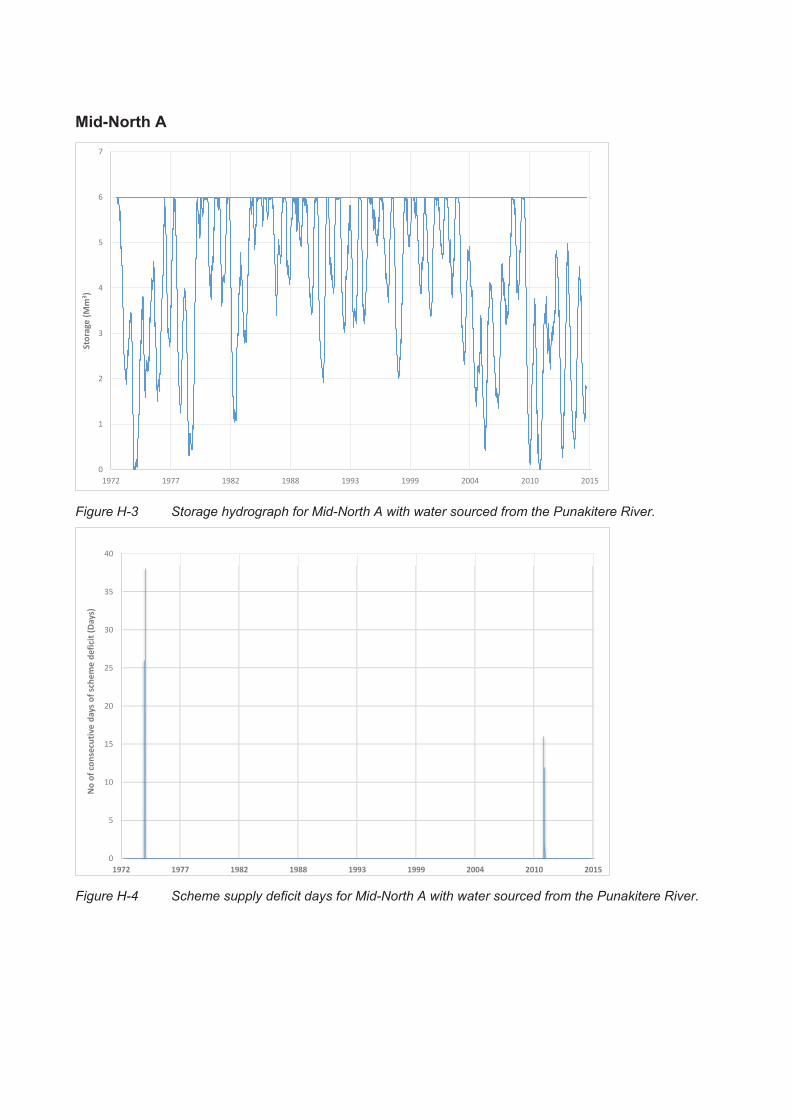
Mid-North A
Figure H-3 Storage hydrograph for Mid-North A with water sourced from the Punakitere River.
Figure H-4 Scheme supply deficit days for Mid-North A with water sourced from the Punakitere River.
0
1
2
3
4
5
6
7
1972 1977 1982 1988 1993 1999 2004 2010 2015
Sto
rag
e (
Mm
3)
0
5
10
15
20
25
30
35
40
1972 1977 1982 1988 1993 1999 2004 2010 2015
No
of
con
secu
tiv
e d
ay
s o
f sc
he
me
de
fici
t (D
ay
s)
Mid-North B
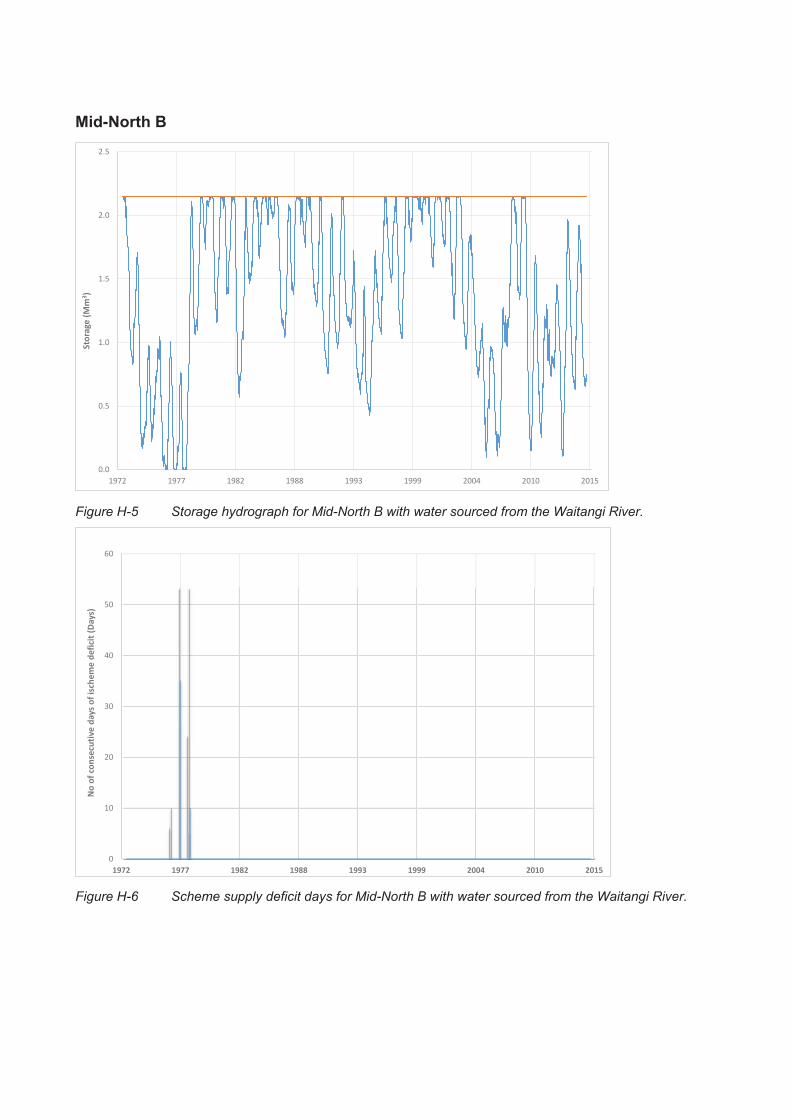
Figure H-5 Storage hydrograph for Mid-North B with water sourced from the Waitangi River.
Figure H-6 Scheme supply deficit days for Mid-North B with water sourced from the Waitangi River.
0.0
0.5
1.0
1.5
2.0
2.5
1972 1977 1982 1988 1993 1999 2004 2010 2015
Sto
rag
e (
Mm
3)
0
10
20
30
40
50
60
1972 1977 1982 1988 1993 1999 2004 2010 2015
No
of
con
secu
tiv
e d
ay
s o
f is
che
me
de
fici
t (D
ay
s)
Mid-North C
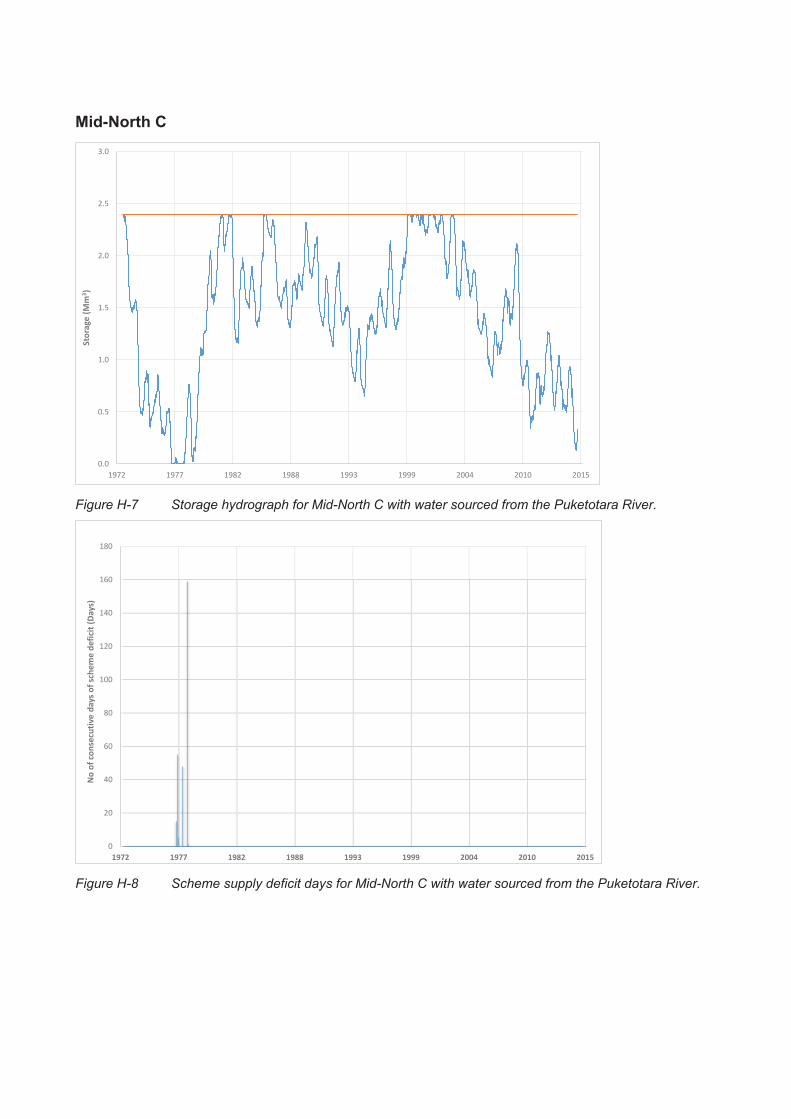
Figure H-7 Storage hydrograph for Mid-North C with water sourced from the Puketotara River.
Figure H-8 Scheme supply deficit days for Mid-North C with water sourced from the Puketotara River.
0.0
0.5
1.0
1.5
2.0
2.5
3.0
1972 1977 1982 1988 1993 1999 2004 2010 2015
Sto
rag
e (
Mm
3)
0
20
40
60
80
100
120
140
160
180
1972 1977 1982 1988 1993 1999 2004 2010 2015
No
of
con
secu
tiv
e d
ay
s o
f sc
he
me
de
fici
t (D
ay
s)
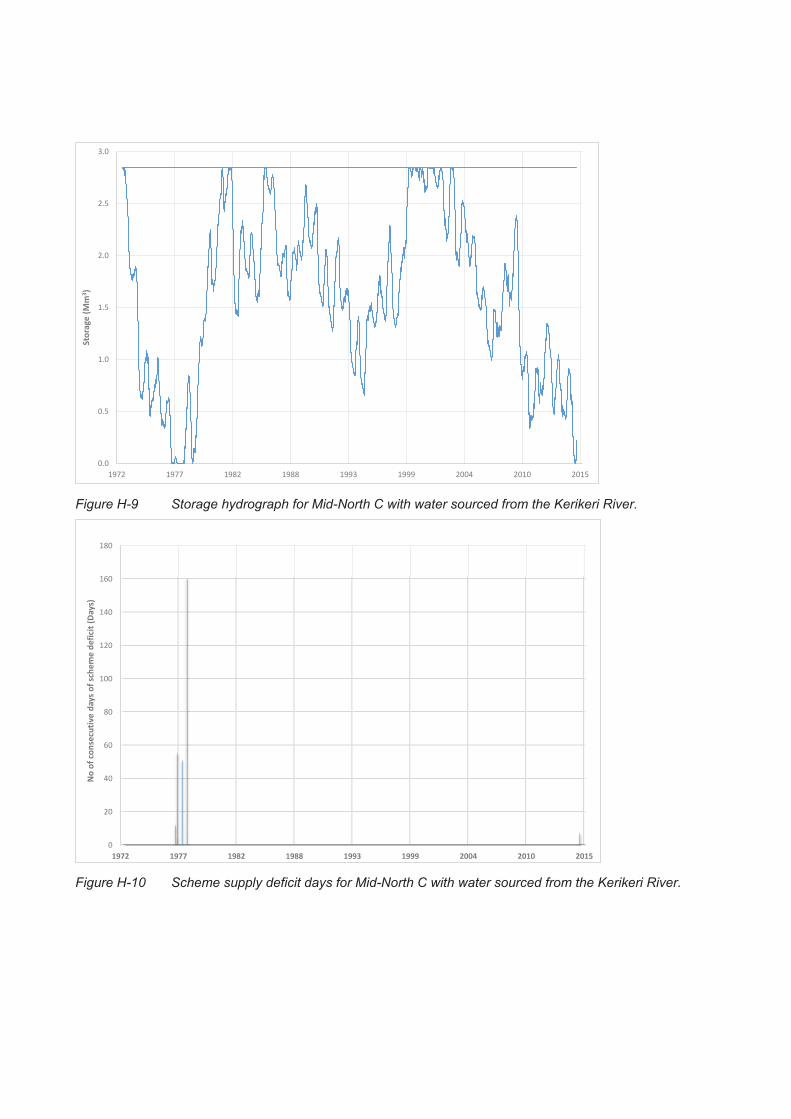
Figure H-9 Storage hydrograph for Mid-North C with water sourced from the Kerikeri River.
Figure H-10 Scheme supply deficit days for Mid-North C with water sourced from the Kerikeri River.
0.0
0.5
1.0
1.5
2.0
2.5
3.0
1972 1977 1982 1988 1993 1999 2004 2010 2015
Sto
rag
e (
Mm
3)
0
20
40
60
80
100
120
140
160
180
1972 1977 1982 1988 1993 1999 2004 2010 2015
No
of
con
secu
tiv
e d
ay
s o
f sc
he
me
de
fici
t (D
ay
s)

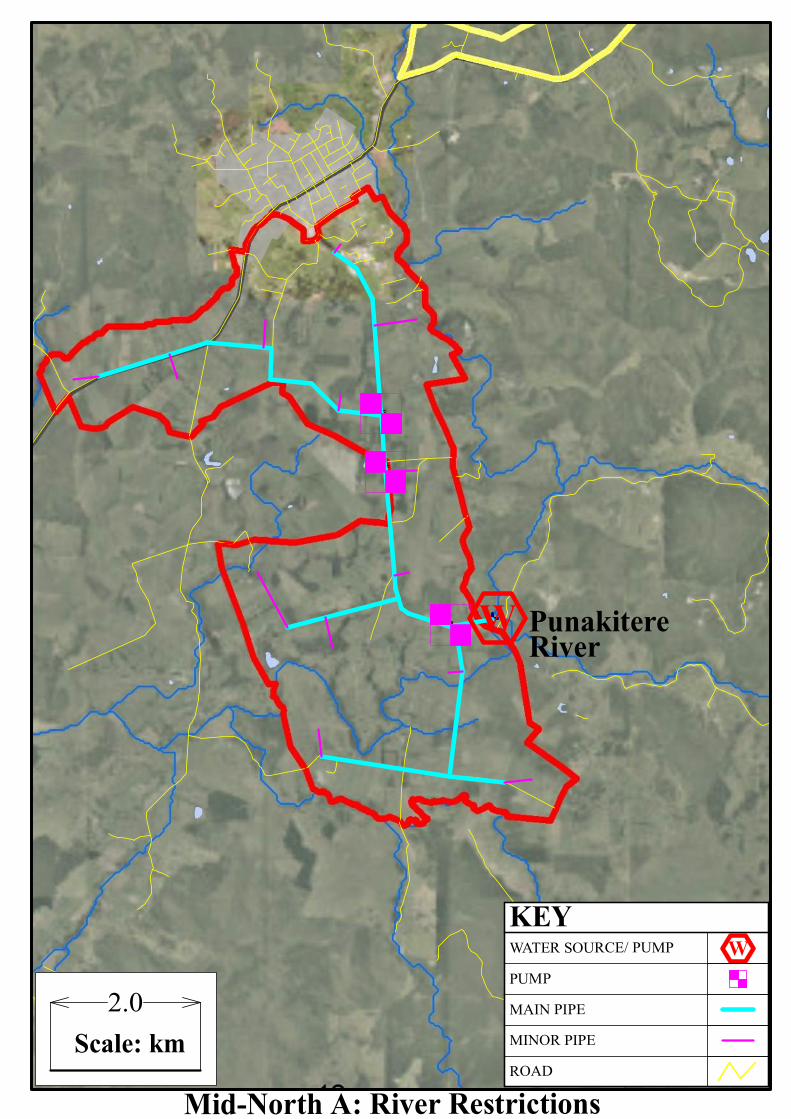
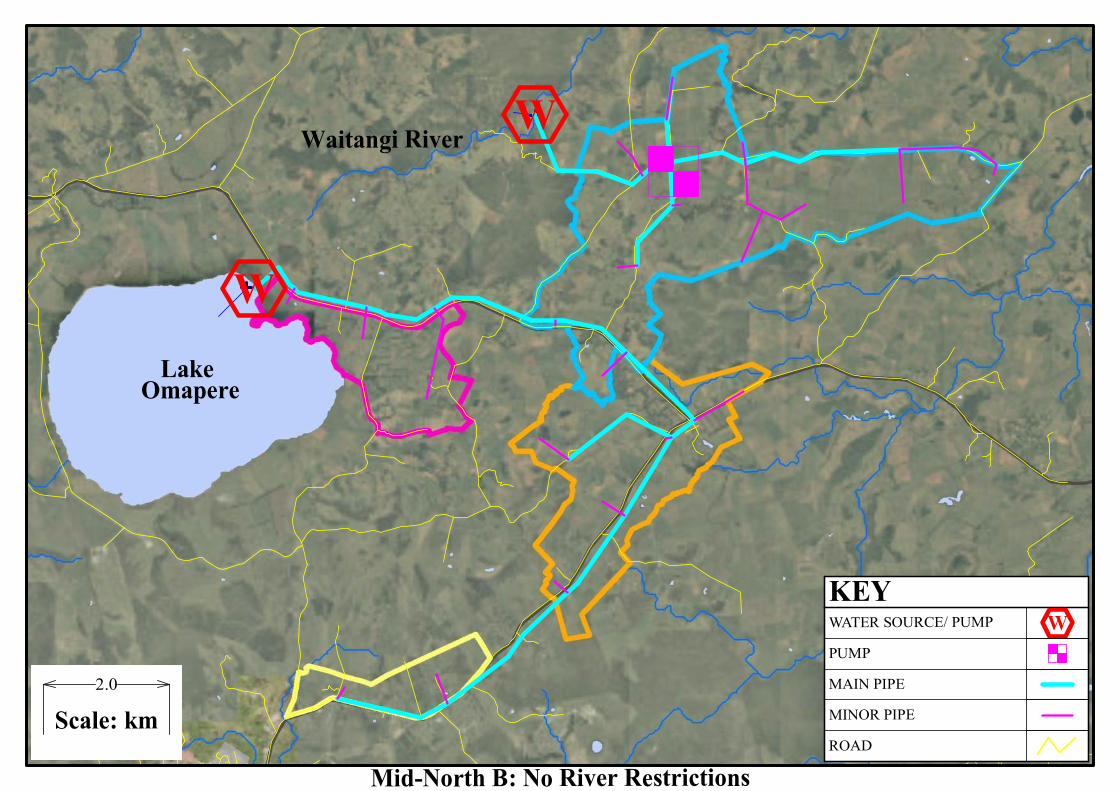
Appendix I Infrastructure


Kaihu River
Scale: km4.0
Kaipara - No River Restrictions
W
ROAD
WWATER SOURCE/ PUMP
KEY
PUMP
MAIN PIPE
MINOR PIPE
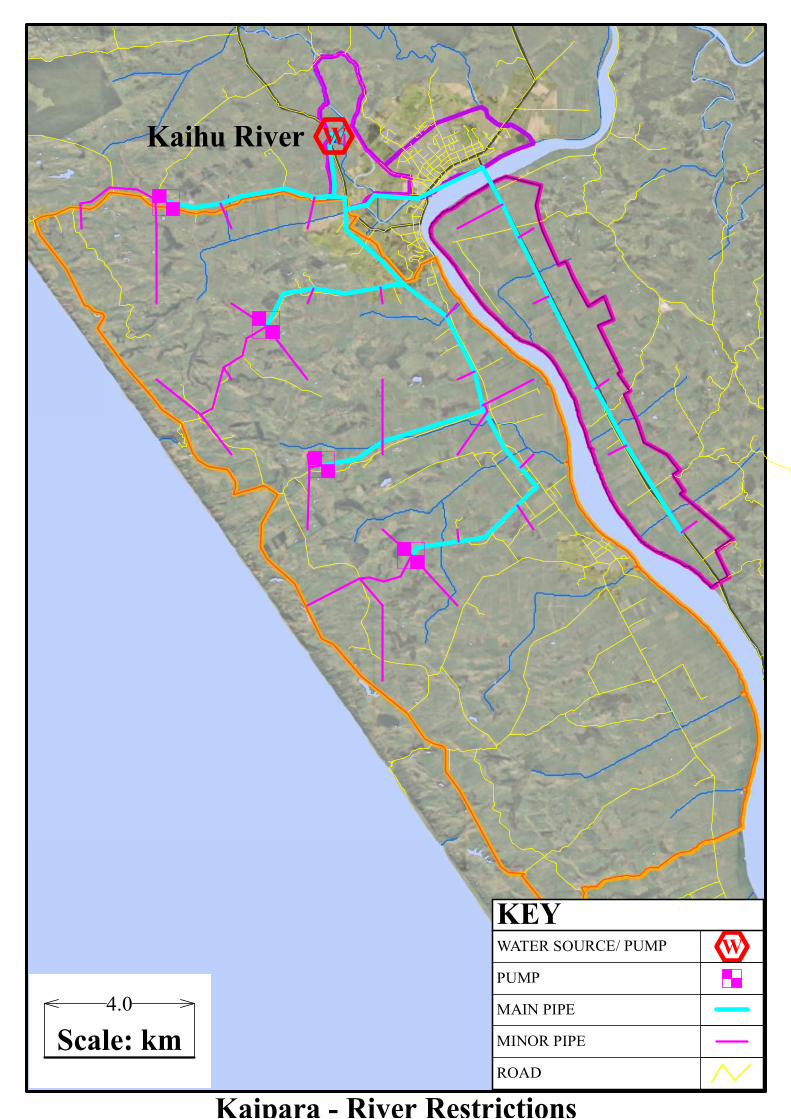
FIGURE 1: KAIPARA CONCEPT IRRIGATION LAYOUT
Kaihu River W
4.0
Scale: km
Kaipara - River RestrictionsROAD
WWATER SOURCE/ PUMP
KEY
PUMP
MAIN PIPE
MINOR PIPE
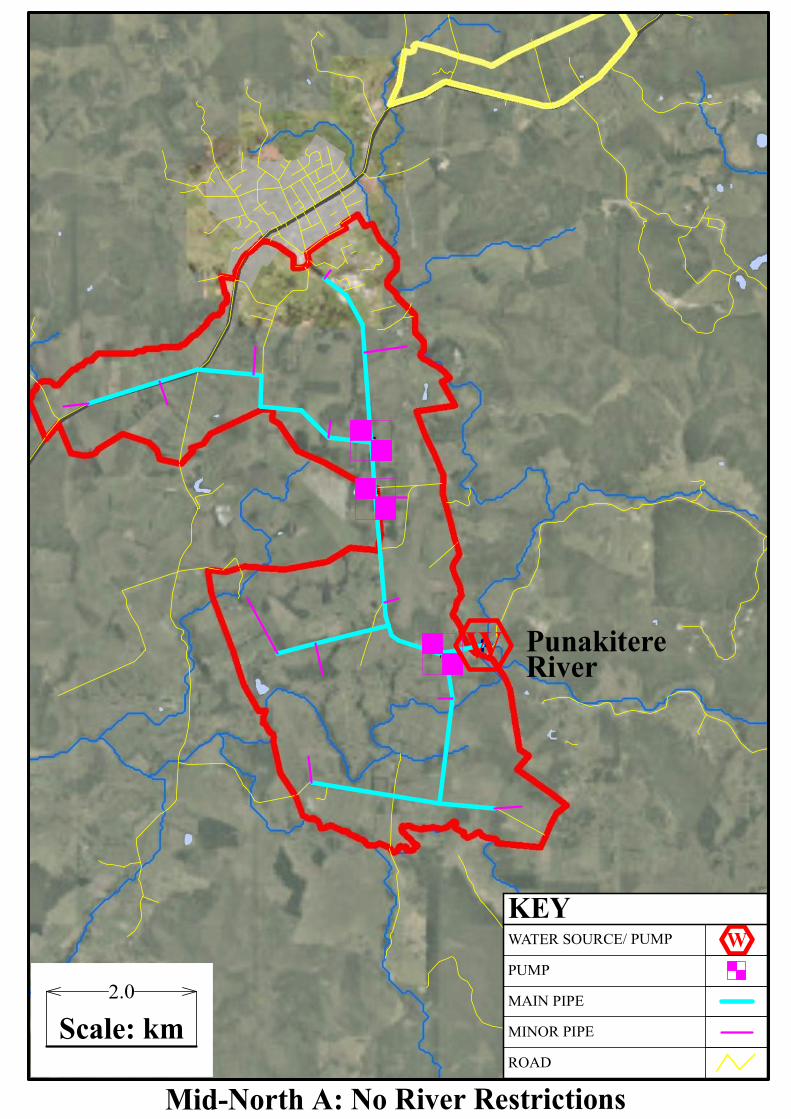
Mid-North A: No River Restrictions
Scale: km2.0
Punakitere River
W
ROAD
WWATER SOURCE/ PUMP
KEY
PUMP
MAIN PIPE
MINOR PIPE
Scale: km
2.0
Mid-North A: River Restrictions
Punakitere River
W
ROAD
WWATER SOURCE/ PUMP
KEY
PUMP
MAIN PIPE
MINOR PIPE
SCALE: KM
2.0
Scale: km
Lake Omapere
Waitangi River
W
W
Mid-North B: No River RestrictionsROAD
WWATER SOURCE/ PUMP
KEY
PUMP
MAIN PIPE
MINOR PIPE
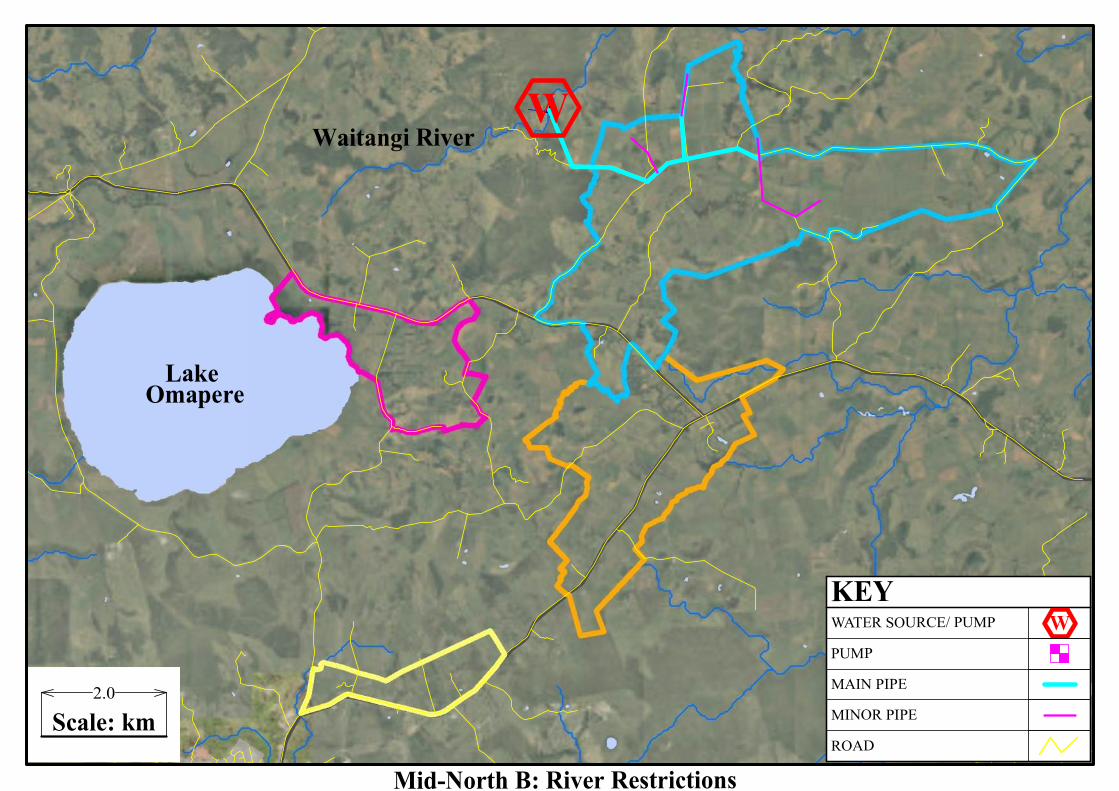
Lake Omapere
Waitangi River
Scale: km2.0
W
ROAD
WWATER SOURCE/ PUMP
KEY
PUMP
MAIN PIPE
MINOR PIPE
Mid-North B: River Restrictions
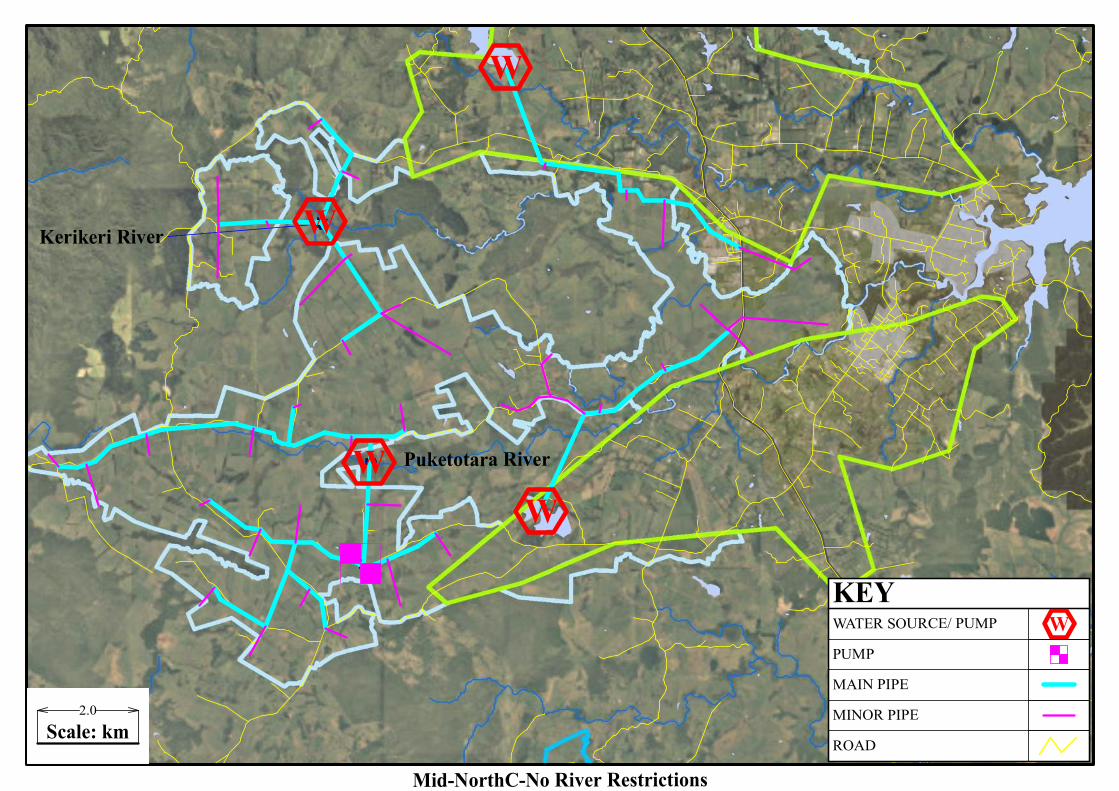
Mid-NorthC-No River Restrictions
Scale: km2.0
W
W
W
W Puketotara River
Kerikeri River
ROAD
WWATER SOURCE/ PUMP
KEY
PUMP
MAIN PIPE
MINOR PIPE
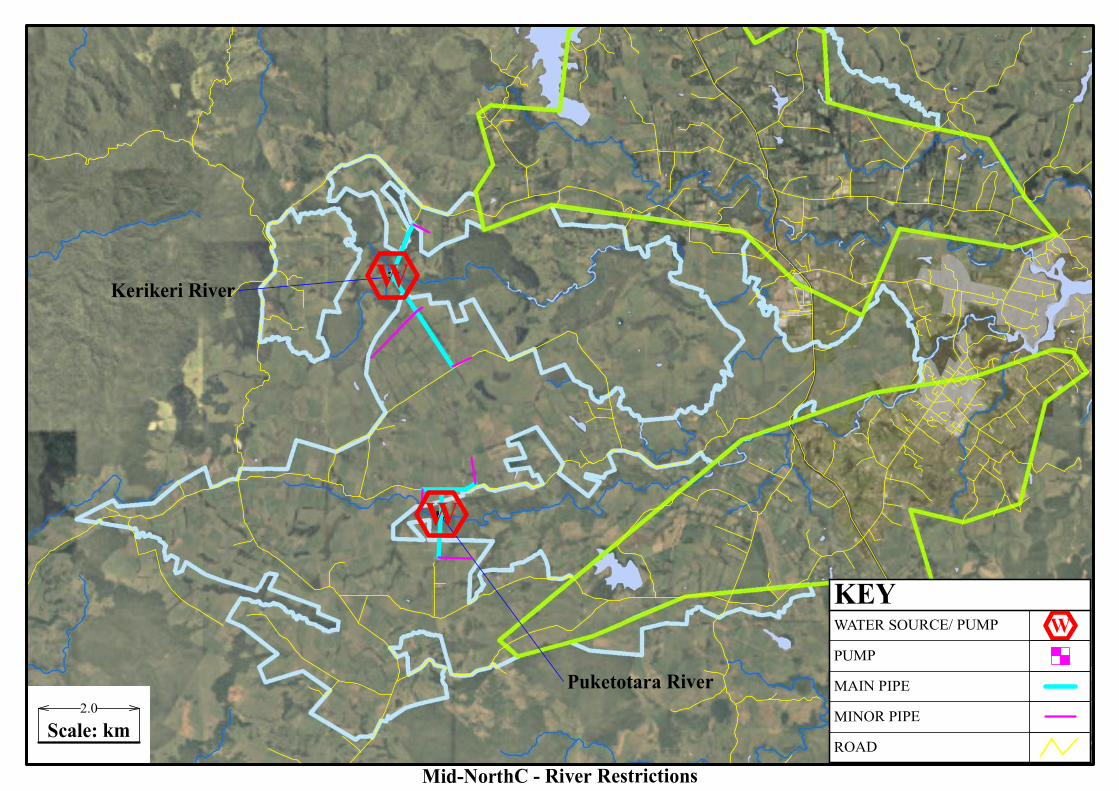
Mid-NorthC - River Restrictions
2.0
Scale: km
Puketotara River
Kerikeri River W
W
ROAD
WWATER SOURCE/ PUMP
KEY
PUMP
MAIN PIPE
MINOR PIPE
Appendix J Development entity case studies

Development entity case studies
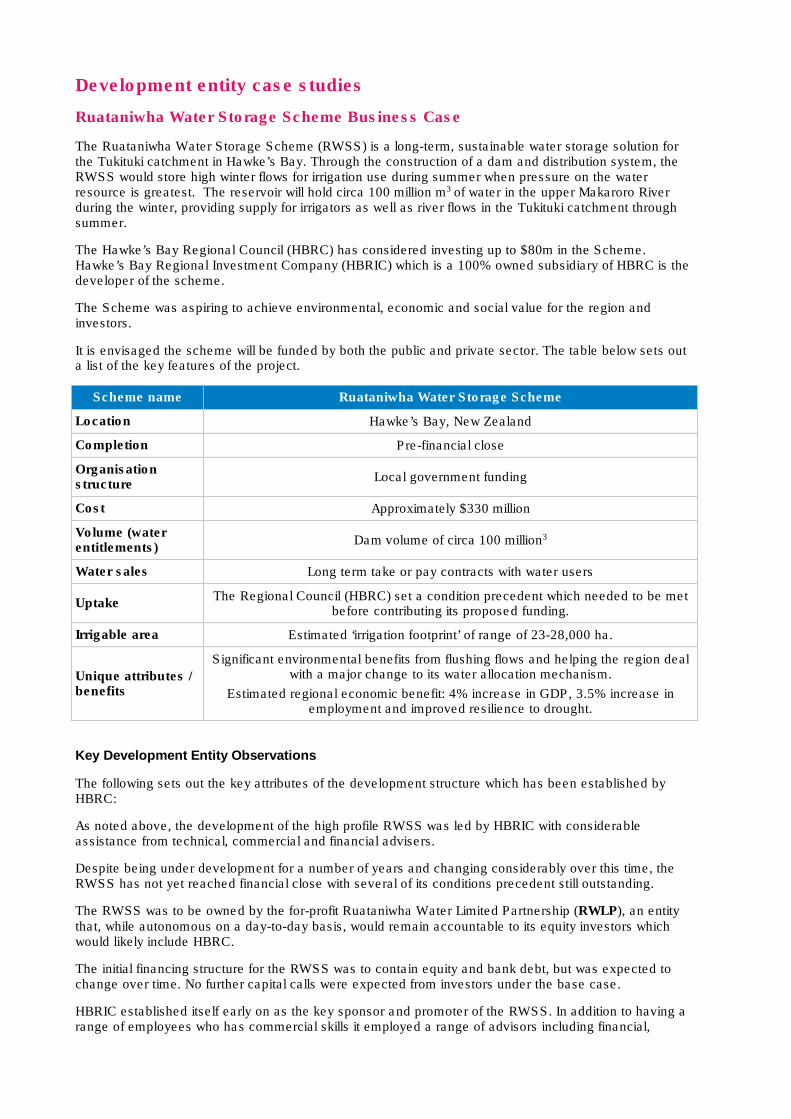
Ruataniwha Water Storage Scheme Business Case
The Ruataniwha Water Storage Scheme (RWSS) is a long-term, sustainable water storage solution for the Tukituki catchment in Hawke’s Bay. Through the construction of a dam and distribution system, the RWSS would store high winter flows for irrigation use during summer when pressure on the water resource is greatest. The reservoir will hold circa 100 million m3 of water in the upper Makaroro River during the winter, providing supply for irrigators as well as river flows in the Tukituki catchment through summer.
The Hawke’s Bay Regional Council (HBRC) has considered investing up to $80m in the Scheme. Hawke’s Bay Regional Investment Company (HBRIC) which is a 100% owned subsidiary of HBRC is the developer of the scheme.
The Scheme was aspiring to achieve environmental, economic and social value for the region and investors.
It is envisaged the scheme will be funded by both the public and private sector. The table below sets out a list of the key features of the project.
Scheme name Ruataniwha Water Storage Scheme
Location Hawke’s Bay, New Zealand
Completion Pre-financial close
Organisation structure
Local government funding
Cost Approximately $330 million
Volume (water entitlements)
Dam volume of circa 100 million3
Water sales Long term take or pay contracts with water users
Uptake The Regional Council (HBRC) set a condition precedent which needed to be met
before contributing its proposed funding.
Irrigable area Estimated ‘irrigation footprint’ of range of 23-28,000 ha.
Unique attributes / benefits
Significant environmental benefits from flushing flows and helping the region deal with a major change to its water allocation mechanism.
Estimated regional economic benefit: 4% increase in GDP, 3.5% increase in employment and improved resilience to drought.
Key Development Entity Observations
The following sets out the key attributes of the development structure which has been established by HBRC:
As noted above, the development of the high profile RWSS was led by HBRIC with considerable assistance from technical, commercial and financial advisers.
Despite being under development for a number of years and changing considerably over this time, the RWSS has not yet reached financial close with several of its conditions precedent still outstanding.
The RWSS was to be owned by the for-profit Ruataniwha Water Limited Partnership (RWLP), an entity that, while autonomous on a day-to-day basis, would remain accountable to its equity investors which would likely include HBRC.
The initial financing structure for the RWSS was to contain equity and bank debt, but was expected to change over time. No further capital calls were expected from investors under the base case.
HBRIC established itself early on as the key sponsor and promoter of the RWSS. In addition to having a range of employees who has commercial skills it employed a range of advisors including financial,

technical, legal, environmental and economic. While HBRIC was able to fund its portion of the development costs.
The development of the RWSS through to the current date has taken approximately seven years. It has been jointly funded by Council, HBRIC Ltd, Ministry for Primary Industries (MPI) on behalf of the Government, and Institutional Investors. MPI alone has committed many millions to date reflecting the scale and complexity of the Scheme. The development has been run in tandem with a range of strategic work streams, such as, Plan Change 6.
It is important to note that over the seven year timeframe the skills and capability required to develop the scheme have continuously changed and as a result a number of independent advisors have been used to assist with the development of the scheme options, procurement and engineering design, commercial assistance to support the design and construction procurement, financial advisors and a range of other technical and environmental consultants and advisors.
A detailed and multifaceted review1 of the entire development was undertaken by a range of related and independent parties who concluded that the “RWSS is a nationally significant proposal involving long-term public and private investment in large-scale infrastructure, with complex hydrology and engineering, and involving land use and water quality implications that will require careful ongoing management. The review further states that the RWSS is an unprecedented intervention for any regional council in New Zealand. In seeking to generate better environmental outcomes with economic and social benefits via commercial water storage, the HBRC has taken the role of an environmental regulator into the higher risk realm of using its financial balance sheet to more actively enable change.”
There are a range of learnings from the RWSS development which are set out in the independent review. The development has involved a huge amount of analysis and analytical work to plan and evaluate aspects of the scheme.
The review raised a key financial question that the Council needs to resolve is whether it believes the rates of return on the Council’s capital, including the risks around the timing and quantum of these returns, are acceptable in light of the Council’s broader strategic economic and environmental objectives. This is of particular relevance for NRC as it considers what its role is with regard to the development of any proposed scheme or portfolio of schemes and in particular its role within the development entity itself.
1 http://www.hbrc.govt.nz/assets/Document-Library/RWSS-Reports/RWSS-Review-Report-5May2017-final.pdf
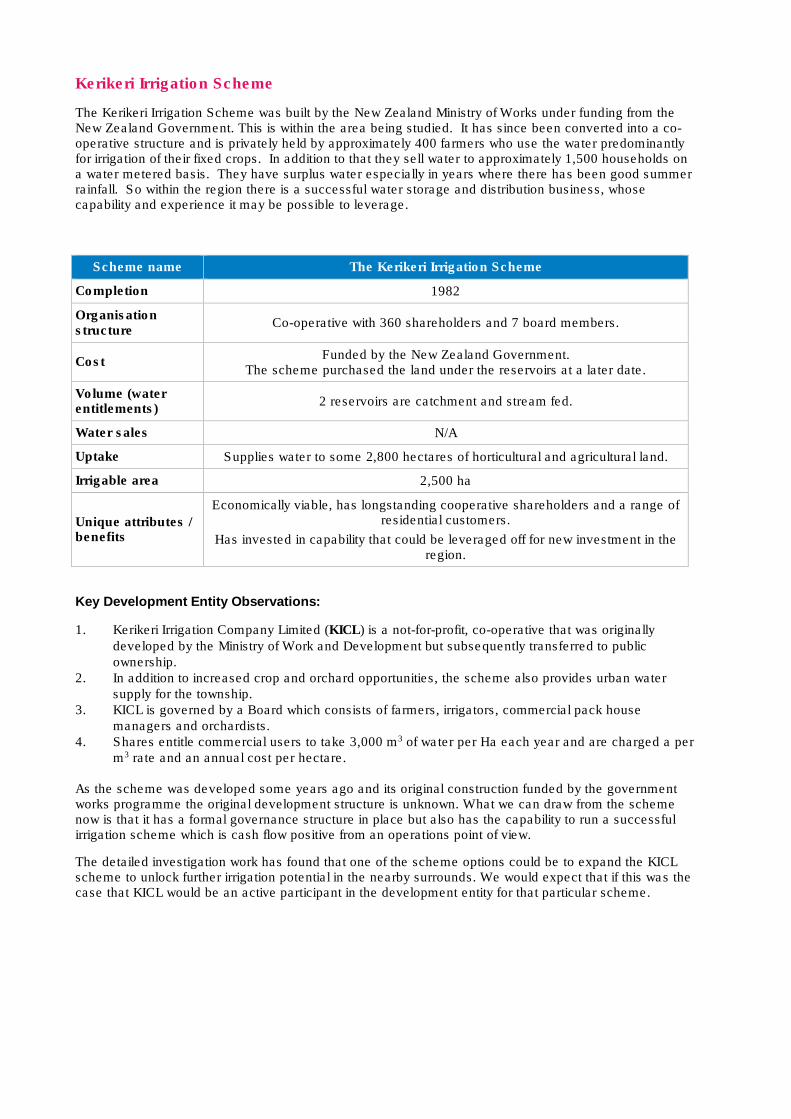
Kerikeri Irrigation Scheme
The Kerikeri Irrigation Scheme was built by the New Zealand Ministry of Works under funding from the New Zealand Government. This is within the area being studied. It has since been converted into a co-operative structure and is privately held by approximately 400 farmers who use the water predominantly for irrigation of their fixed crops. In addition to that they sell water to approximately 1,500 households on a water metered basis. They have surplus water especially in years where there has been good summer rainfall. So within the region there is a successful water storage and distribution business, whose capability and experience it may be possible to leverage.
Scheme name The Kerikeri Irrigation Scheme
Completion 1982
Organisation structure
Co-operative with 360 shareholders and 7 board members.
Cost Funded by the New Zealand Government.
The scheme purchased the land under the reservoirs at a later date.
Volume (water entitlements)
2 reservoirs are catchment and stream fed.
Water sales N/A
Uptake Supplies water to some 2,800 hectares of horticultural and agricultural land.
Irrigable area 2,500 ha
Unique attributes / benefits
Economically viable, has longstanding cooperative shareholders and a range of residential customers.
Has invested in capability that could be leveraged off for new investment in the region.
Key Development Entity Observations:
1. Kerikeri Irrigation Company Limited (KICL) is a not-for-profit, co-operative that was originally developed by the Ministry of Work and Development but subsequently transferred to public ownership.
2. In addition to increased crop and orchard opportunities, the scheme also provides urban water supply for the township.
3. KICL is governed by a Board which consists of farmers, irrigators, commercial pack house managers and orchardists.
4. Shares entitle commercial users to take 3,000 m3 of water per Ha each year and are charged a per m3 rate and an annual cost per hectare.
As the scheme was developed some years ago and its original construction funded by the government works programme the original development structure is unknown. What we can draw from the scheme now is that it has a formal governance structure in place but also has the capability to run a successful irrigation scheme which is cash flow positive from an operations point of view.
The detailed investigation work has found that one of the scheme options could be to expand the KICL scheme to unlock further irrigation potential in the nearby surrounds. We would expect that if this was the case that KICL would be an active participant in the development entity for that particular scheme.
Tasmania Irrigation Development Company
The Tasmanian Irrigation Pty Limited (TI) is a state-owned company, incorporated and operated in Australia. TI was established in 2008, with the primary goal of fostering growth in the State’s agricultural sector. The strategic goals of the company are to;
• deliver reliable water; • provide value to customers; • support an active water market in Tasmania which ensures that the maximum value is generated
from Tasmania’s irrigation infrastructure and resources; • build irrigation schemes with the local community; and • fully realise the benefit of TI’s irrigation schemes through increasing high value agricultural
production.
The work undertaken is a continuation from the Tasmanian Government’s Water Development Plan.
As well as developing irrigation schemes, TI also oversees the operations of three schemes and five water supply and river improvement schemes, inherited from Tasmanian Irrigation Schemes. It also oversees two other schemes that run under self-management. TI’s focus has thus developed over time to becoming more of a scheme facilitator.
TI’s irrigation projects are organized into two tranches: Tranche one consists of ten operational schemes: the Sassafras Wesley Vale, Great Forester, Whitemore, Winnaleah, Lower South Esk, Kindred North Motton, Dial Blythe, Midlands Water Scheme, South East Irrigation Scheme Stage 3 and the Upper Ringarooma Irrigation Scheme.
Tranche Two consists of five schemes all either under development or construction; the Scottsdale, Swan Valley, Southern Highlands, Duck and North Esk Irrigation Schemes.
Funding
TI develops irrigation schemes through the Private-Public Partnerships (PPP) model whereby the construction costs for new schemes are shared between the public and private sector. The costs are paid by the private sector through the purchase of water entitlements and by the public sector through the form of Government contributions. This arrangement recognises by the Government the wider community benefit created from the irrigation schemes including regional economic activity and employment, as well as the direct private sector benefits including having a reliable water supply.
Public sector funds of $229 million have been made available to TI from the Australian and Tasmanian Government to fund the tranche 1 programme and an additional $90 million to fund the tranche 2 programme.
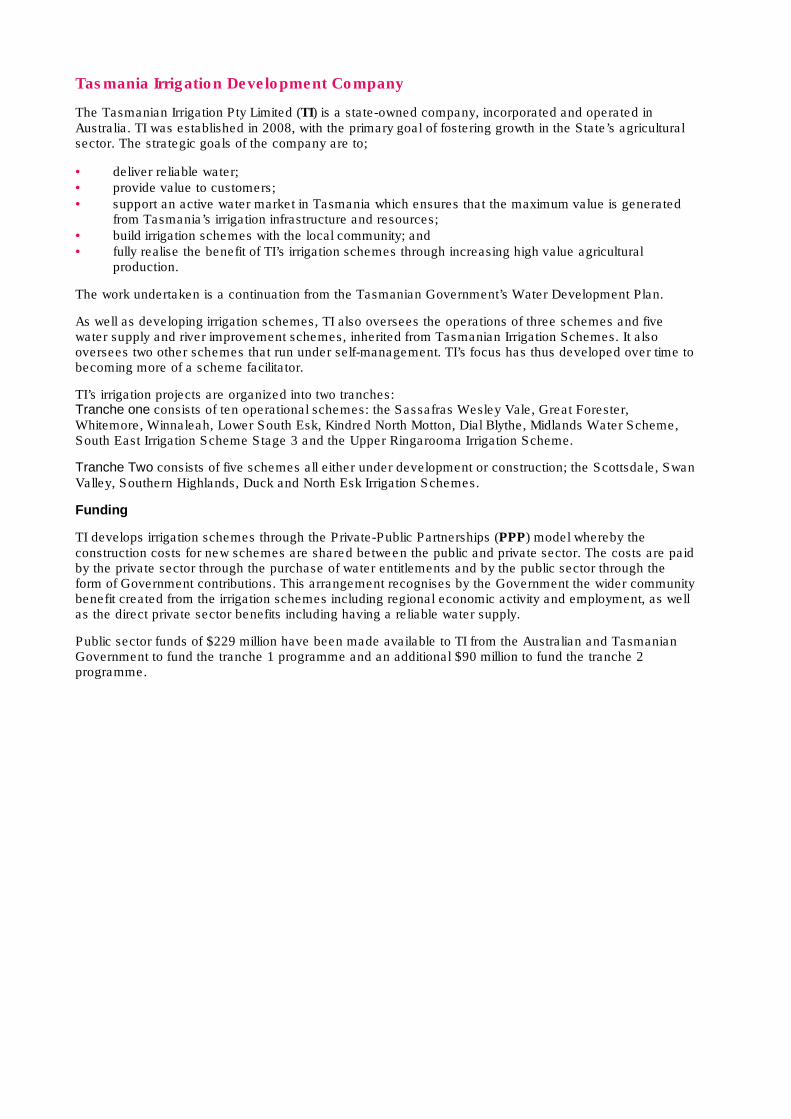
Case study 1
Scheme name Midlands Water Scheme
Location Tasmania, Australia
Completion April 2014
Organisation structure PPP
Cost Total cost $104 million
Private sector: $25 million
Volume (water entitlements)
38,500 mL over two delivery periods: 15,812ML during a 150-day summer delivery period (October – February) and 22,688ML during a 215-day
winter delivery period (March – September)
Water sales 23,503 mL (FY16)
Uptake 74% (FY16)
Irrigable area 55,484 ha
Unique attributes / benefits
The largest irrigation development in Tasmania. The scheme achieved the highest level of environmental and occupational health and safety
standards, and is designed to have an operating life of at least 100 years.
As well as providing a water supply for irrigation, the Midlands Irrigation Scheme also has an integrated hydro power station that produces
enough power to supply 10,000 homes with electricity. Of the power generated, approximated 78% is fed into Tasmania’s electricity grid and
22% is used to power the scheme’s pump stations.
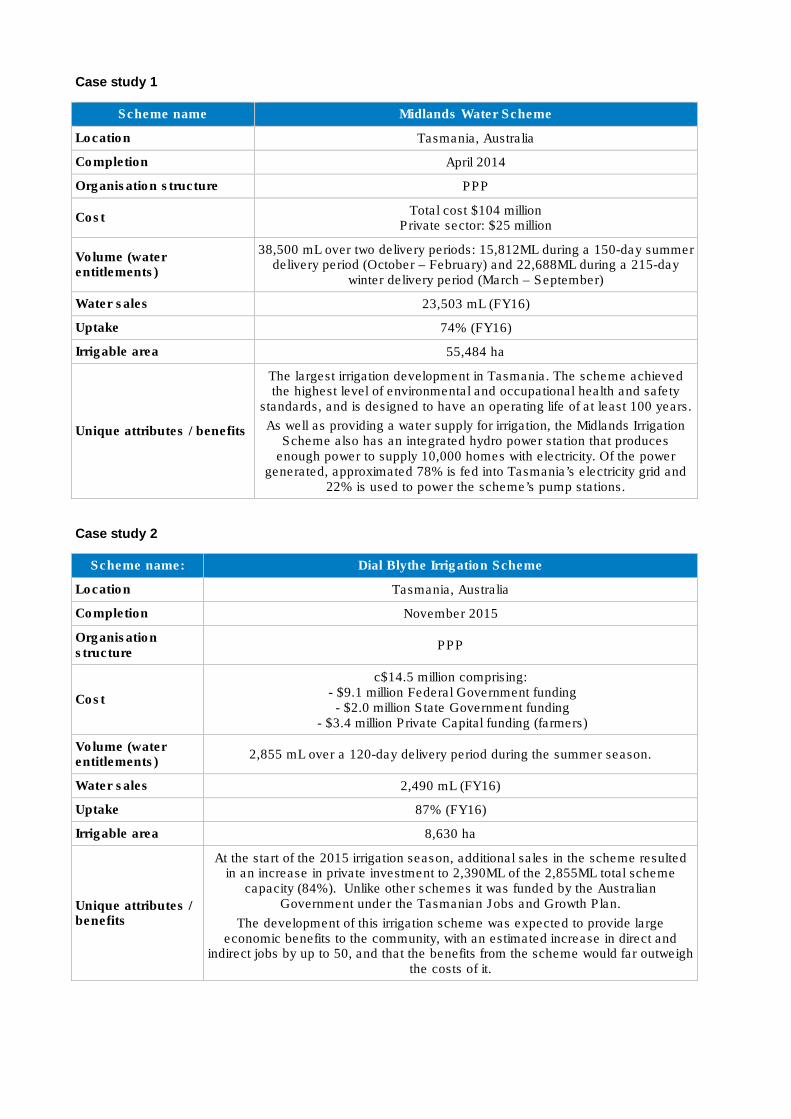
Case study 2
Scheme name: Dial Blythe Irrigation Scheme
Location Tasmania, Australia
Completion November 2015
Organisation structure
PPP
Cost
c$14.5 million comprising: - $9.1 million Federal Government funding - $2.0 million State Government funding
- $3.4 million Private Capital funding (farmers)
Volume (water entitlements)
2,855 mL over a 120-day delivery period during the summer season.
Water sales 2,490 mL (FY16)
Uptake 87% (FY16)
Irrigable area 8,630 ha
Unique attributes / benefits
At the start of the 2015 irrigation season, additional sales in the scheme resulted in an increase in private investment to 2,390ML of the 2,855ML total scheme
capacity (84%). Unlike other schemes it was funded by the Australian Government under the Tasmanian Jobs and Growth Plan.
The development of this irrigation scheme was expected to provide large economic benefits to the community, with an estimated increase in direct and
indirect jobs by up to 50, and that the benefits from the scheme would far outweigh the costs of it.
Key Development Entity Observations:
1. Tasmanian Irrigation Proprietary Limited (TIPL) has a reasonable amount of autonomy and capability to develop, own and operate irrigation schemes but remains accountable to the Ministers for Primary Industries and Water and the Treasurer.
2. As TIPL’s development pipeline continues to decline following the completion of a number of its irrigation schemes, TIPL’s focus is transitioning from development to ownership and operation of irrigation schemes.
3. TIPL is a state-owned company but the schemes that it develops are delivered by public-private partnerships (PPP) between the government and beneficiaries of the schemes.
While TIPL is a for-profit entity and its schemes are supposed to earn commercial rates of return, post-development operational expenditure and lifecycle costs are funded by a mixture of government funding, hydro income and water entitlement user levies.
It is important to note that TI provides the technical, financial and project management skills to progress schemes from concept development through feasibility and construction to operations.
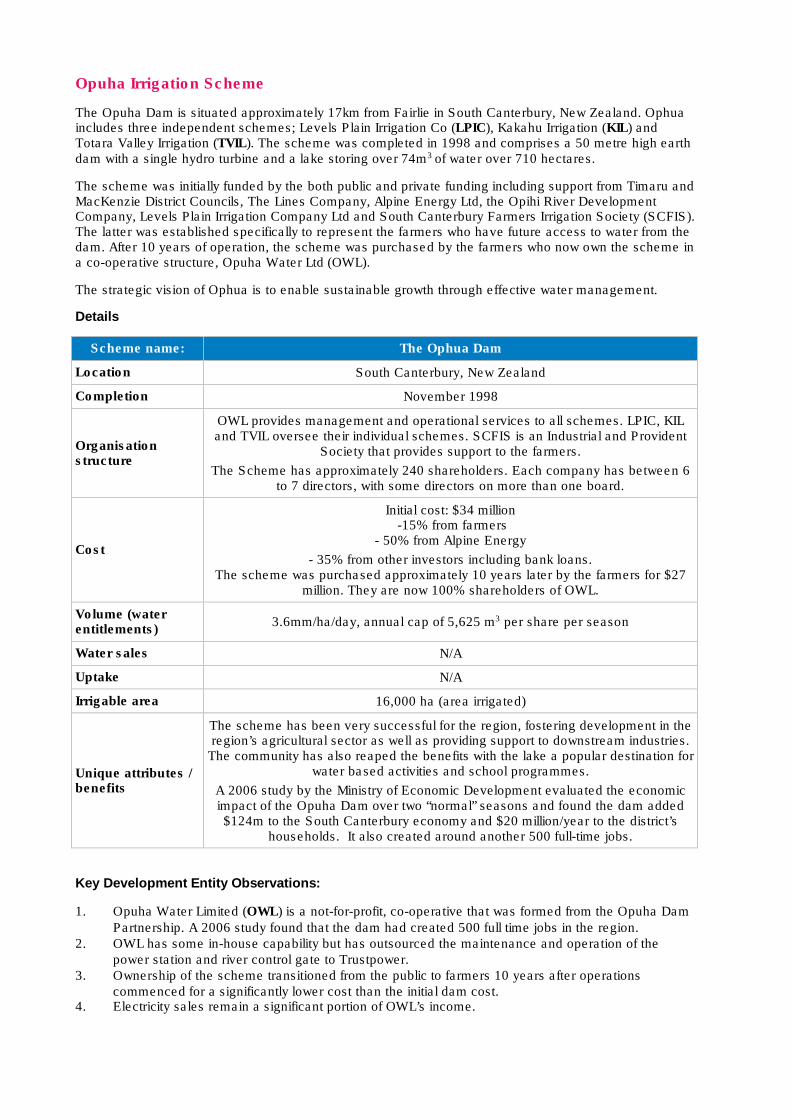
Opuha Irrigation Scheme
The Opuha Dam is situated approximately 17km from Fairlie in South Canterbury, New Zealand. Ophua includes three independent schemes; Levels Plain Irrigation Co (LPIC), Kakahu Irrigation (KIL) and Totara Valley Irrigation (TVIL). The scheme was completed in 1998 and comprises a 50 metre high earth dam with a single hydro turbine and a lake storing over 74m3 of water over 710 hectares.
The scheme was initially funded by the both public and private funding including support from Timaru and MacKenzie District Councils, The Lines Company, Alpine Energy Ltd, the Opihi River Development Company, Levels Plain Irrigation Company Ltd and South Canterbury Farmers Irrigation Society (SCFIS). The latter was established specifically to represent the farmers who have future access to water from the dam. After 10 years of operation, the scheme was purchased by the farmers who now own the scheme in a co-operative structure, Opuha Water Ltd (OWL).
The strategic vision of Ophua is to enable sustainable growth through effective water management.
Details
Scheme name: The Ophua Dam
Location South Canterbury, New Zealand
Completion November 1998
Organisation structure
OWL provides management and operational services to all schemes. LPIC, KIL and TVIL oversee their individual schemes. SCFIS is an Industrial and Provident
Society that provides support to the farmers.
The Scheme has approximately 240 shareholders. Each company has between 6 to 7 directors, with some directors on more than one board.
Cost
Initial cost: $34 million -15% from farmers
- 50% from Alpine Energy
- 35% from other investors including bank loans. The scheme was purchased approximately 10 years later by the farmers for $27
million. They are now 100% shareholders of OWL.
Volume (water entitlements)
3.6mm/ha/day, annual cap of 5,625 m3 per share per season
Water sales N/A
Uptake N/A
Irrigable area 16,000 ha (area irrigated)
Unique attributes / benefits
The scheme has been very successful for the region, fostering development in the region’s agricultural sector as well as providing support to downstream industries.
The community has also reaped the benefits with the lake a popular destination for water based activities and school programmes.
A 2006 study by the Ministry of Economic Development evaluated the economic impact of the Opuha Dam over two “normal” seasons and found the dam added $124m to the South Canterbury economy and $20 million/year to the district’s
households. It also created around another 500 full-time jobs.
Key Development Entity Observations:
1. Opuha Water Limited (OWL) is a not-for-profit, co-operative that was formed from the Opuha Dam Partnership. A 2006 study found that the dam had created 500 full time jobs in the region.
2. OWL has some in-house capability but has outsourced the maintenance and operation of the power station and river control gate to Trustpower.
3. Ownership of the scheme transitioned from the public to farmers 10 years after operations commenced for a significantly lower cost than the initial dam cost.
4. Electricity sales remain a significant portion of OWL’s income.

The Opuha Dam was commissioned in 1999 after a long development phase which started in the 1980’s. Initially it was hoped after several dry seasons where the Opihi River ran dry that water might be able to be bought in from Tekapo however this was not successful and subsequently the plan for Opuha was drawn up. The scheme has a priority of flow for environmental, town supply, irrigation and electricity generation. In the past few years greater attention has been given to the environmental flows.
The Opuha development highlighted the importance of having local investors and funders involved as the scheme struggled to get sufficient funding in place. As a result Alan Hubbard underwrote a number of shares which were subsequently taken up by farmers in the few years following the completion of the scheme. In addition Alpine Energy (47.5% owned by Timaru District Council, 7.5% Waimate District Council, 5% MacKenzie District Council and 40% Consumer Owned) was a 50% shareholder in the scheme until 2007 when the farmer shareholders purchased 100% of the shares.
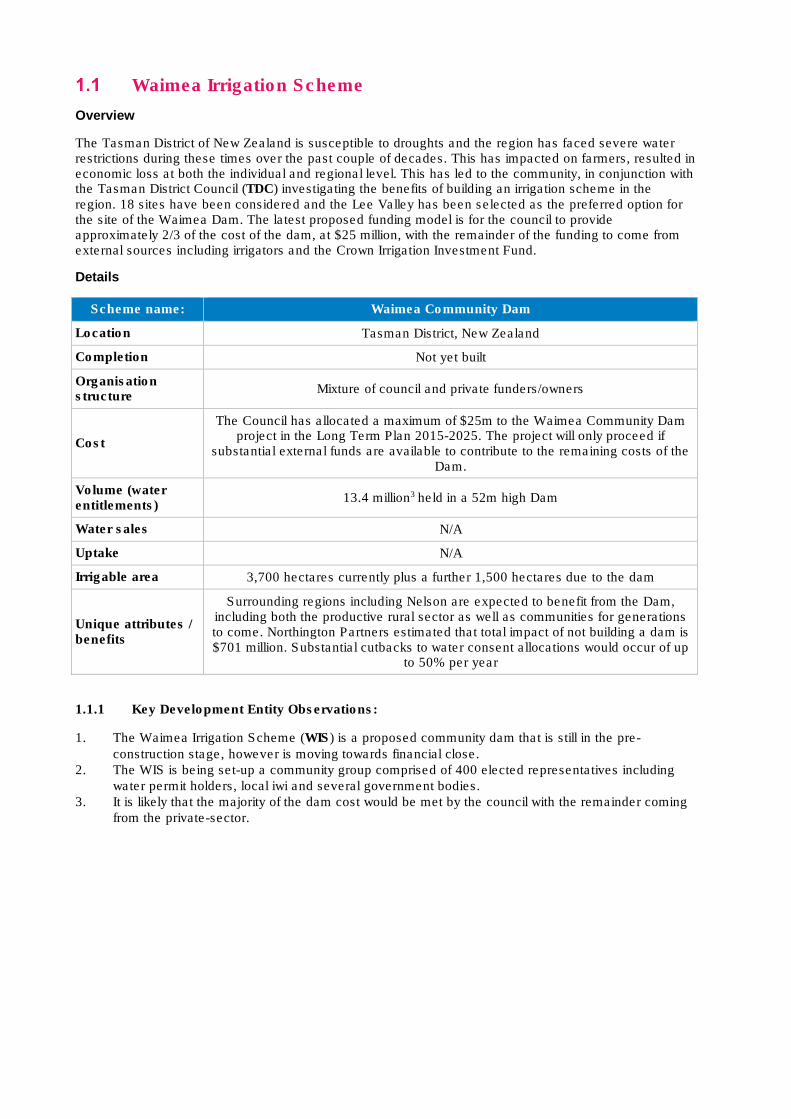
Waimea Irrigation Scheme
Overview
The Tasman District of New Zealand is susceptible to droughts and the region has faced severe water restrictions during these times over the past couple of decades. This has impacted on farmers, resulted in economic loss at both the individual and regional level. This has led to the community, in conjunction with the Tasman District Council (TDC) investigating the benefits of building an irrigation scheme in the region. 18 sites have been considered and the Lee Valley has been selected as the preferred option for the site of the Waimea Dam. The latest proposed funding model is for the council to provide approximately 2/3 of the cost of the dam, at $25 million, with the remainder of the funding to come from external sources including irrigators and the Crown Irrigation Investment Fund.
Details
Scheme name: Waimea Community Dam
Location Tasman District, New Zealand
Completion Not yet built
Organisation structure
Mixture of council and private funders/owners
Cost
The Council has allocated a maximum of $25m to the Waimea Community Dam project in the Long Term Plan 2015-2025. The project will only proceed if
substantial external funds are available to contribute to the remaining costs of the Dam.
Volume (water entitlements)
13.4 million3 held in a 52m high Dam
Water sales N/A
Uptake N/A
Irrigable area 3,700 hectares currently plus a further 1,500 hectares due to the dam
Unique attributes / benefits
Surrounding regions including Nelson are expected to benefit from the Dam, including both the productive rural sector as well as communities for generations to come. Northington Partners estimated that total impact of not building a dam is $701 million. Substantial cutbacks to water consent allocations would occur of up
to 50% per year
1.1.1 Key Development Entity Observations:
1. The Waimea Irrigation Scheme (WIS) is a proposed community dam that is still in the pre-construction stage, however is moving towards financial close.
2. The WIS is being set-up a community group comprised of 400 elected representatives including water permit holders, local iwi and several government bodies.
3. It is likely that the majority of the dam cost would be met by the council with the remainder coming from the private-sector.
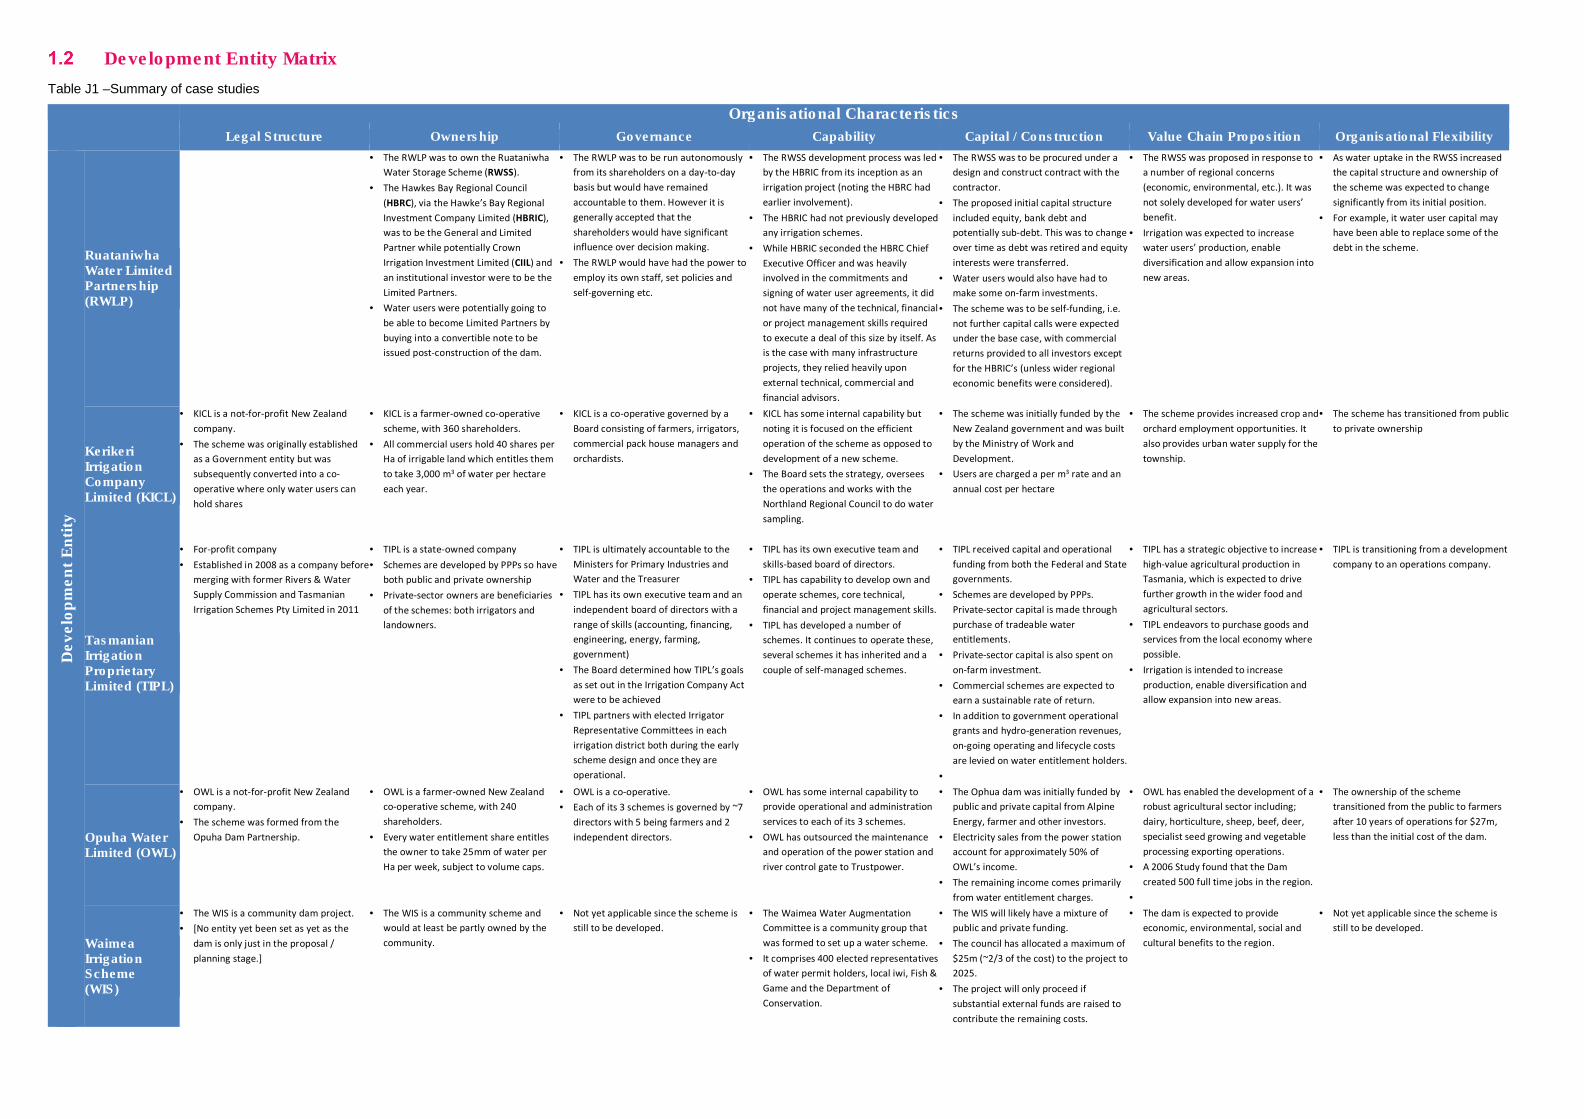
Development Entity Matrix
Table J1 –Summary of case studies
Organisational Characteristics
Legal Structure Ownership Governance Capability Capital / Construction Value Chain Proposition Organisational Flexibility
De
ve
lop
me
nt
En
tity
Ruataniwha Water Limited Partnership (RWLP)
• The RWLP was to own the Ruataniwha
Water Storage Scheme (RWSS).
• The Hawkes Bay Regional Council
(HBRC), via the Hawke’s Bay Regional
Investment Company Limited (HBRIC),
was to be the General and Limited
Partner while potentially Crown
Irrigation Investment Limited (CIIL) and
an institutional investor were to be the
Limited Partners.
• Water users were potentially going to
be able to become Limited Partners by
buying into a convertible note to be
issued post-construction of the dam.
• The RWLP was to be run autonomously
from its shareholders on a day-to-day
basis but would have remained
accountable to them. However it is
generally accepted that the
shareholders would have significant
influence over decision making.
• The RWLP would have had the power to
employ its own staff, set policies and
self-governing etc.
• The RWSS development process was led
by the HBRIC from its inception as an
irrigation project (noting the HBRC had
earlier involvement).
• The HBRIC had not previously developed
any irrigation schemes.
• While HBRIC seconded the HBRC Chief
Executive Officer and was heavily
involved in the commitments and
signing of water user agreements, it did
not have many of the technical, financial
or project management skills required
to execute a deal of this size by itself. As
is the case with many infrastructure
projects, they relied heavily upon
external technical, commercial and
financial advisors.
• The RWSS was to be procured under a
design and construct contract with the
contractor.
• The proposed initial capital structure
included equity, bank debt and
potentially sub-debt. This was to change
over time as debt was retired and equity
interests were transferred.
• Water users would also have had to
make some on-farm investments.
• The scheme was to be self-funding, i.e.
not further capital calls were expected
under the base case, with commercial
returns provided to all investors except
for the HBRIC’s (unless wider regional
economic benefits were considered).
• The RWSS was proposed in response to
a number of regional concerns
(economic, environmental, etc.). It was
not solely developed for water users’
benefit.
• Irrigation was expected to increase
water users’ production, enable
diversification and allow expansion into
new areas.
• As water uptake in the RWSS increased
the capital structure and ownership of
the scheme was expected to change
significantly from its initial position.
• For example, it water user capital may
have been able to replace some of the
debt in the scheme.
Kerikeri Irrigation Company Limited (KICL)
• KICL is a not-for-profit New Zealand
company.
• The scheme was originally established
as a Government entity but was
subsequently converted into a co-
operative where only water users can
hold shares
• KICL is a farmer-owned co-operative
scheme, with 360 shareholders.
• All commercial users hold 40 shares per
Ha of irrigable land which entitles them
to take 3,000 m3 of water per hectare
each year.
• KICL is a co-operative governed by a
Board consisting of farmers, irrigators,
commercial pack house managers and
orchardists.
• KICL has some internal capability but
noting it is focused on the efficient
operation of the scheme as opposed to
development of a new scheme.
• The Board sets the strategy, oversees
the operations and works with the
Northland Regional Council to do water
sampling.
• The scheme was initially funded by the
New Zealand government and was built
by the Ministry of Work and
Development.
• Users are charged a per m3 rate and an
annual cost per hectare
• The scheme provides increased crop and
orchard employment opportunities. It
also provides urban water supply for the
township.
• The scheme has transitioned from public
to private ownership
Tasmanian Irrigation Proprietary Limited (TIPL)
• For-profit company
• Established in 2008 as a company before
merging with former Rivers & Water
Supply Commission and Tasmanian
Irrigation Schemes Pty Limited in 2011
• TIPL is a state-owned company
• Schemes are developed by PPPs so have
both public and private ownership
• Private-sector owners are beneficiaries
of the schemes: both irrigators and
landowners.
• TIPL is ultimately accountable to the
Ministers for Primary Industries and
Water and the Treasurer
• TIPL has its own executive team and an
independent board of directors with a
range of skills (accounting, financing,
engineering, energy, farming,
government)
• The Board determined how TIPL’s goals
as set out in the Irrigation Company Act
were to be achieved
• TIPL partners with elected Irrigator
Representative Committees in each
irrigation district both during the early
scheme design and once they are
operational.
• TIPL has its own executive team and
skills-based board of directors.
• TIPL has capability to develop own and
operate schemes, core technical,
financial and project management skills.
• TIPL has developed a number of
schemes. It continues to operate these,
several schemes it has inherited and a
couple of self-managed schemes.
• TIPL received capital and operational
funding from both the Federal and State
governments.
• Schemes are developed by PPPs.
Private-sector capital is made through
purchase of tradeable water
entitlements.
• Private-sector capital is also spent on
on-farm investment.
• Commercial schemes are expected to
earn a sustainable rate of return.
• In addition to government operational
grants and hydro-generation revenues,
on-going operating and lifecycle costs
are levied on water entitlement holders.
•
• TIPL has a strategic objective to increase
high-value agricultural production in
Tasmania, which is expected to drive
further growth in the wider food and
agricultural sectors.
• TIPL endeavors to purchase goods and
services from the local economy where
possible.
• Irrigation is intended to increase
production, enable diversification and
allow expansion into new areas.
• TIPL is transitioning from a development
company to an operations company.
Opuha Water Limited (OWL)
• OWL is a not-for-profit New Zealand
company.
• The scheme was formed from the
Opuha Dam Partnership.
• OWL is a farmer-owned New Zealand
co-operative scheme, with 240
shareholders.
• Every water entitlement share entitles
the owner to take 25mm of water per
Ha per week, subject to volume caps.
• OWL is a co-operative.
• Each of its 3 schemes is governed by ~7
directors with 5 being farmers and 2
independent directors.
• OWL has some internal capability to
provide operational and administration
services to each of its 3 schemes.
• OWL has outsourced the maintenance
and operation of the power station and
river control gate to Trustpower.
• The Ophua dam was initially funded by
public and private capital from Alpine
Energy, farmer and other investors.
• Electricity sales from the power station
account for approximately 50% of
OWL’s income.
• The remaining income comes primarily
from water entitlement charges.
• OWL has enabled the development of a
robust agricultural sector including;
dairy, horticulture, sheep, beef, deer,
specialist seed growing and vegetable
processing exporting operations.
• A 2006 Study found that the Dam
created 500 full time jobs in the region.
•
• The ownership of the scheme
transitioned from the public to farmers
after 10 years of operations for $27m,
less than the initial cost of the dam.
Waimea Irrigation Scheme (WIS)
• The WIS is a community dam project.
• [No entity yet been set as yet as the
dam is only just in the proposal /
planning stage.]
• The WIS is a community scheme and
would at least be partly owned by the
community.
• Not yet applicable since the scheme is
still to be developed.
• The Waimea Water Augmentation
Committee is a community group that
was formed to set up a water scheme.
• It comprises 400 elected representatives
of water permit holders, local iwi, Fish &
Game and the Department of
Conservation.
• The WIS will likely have a mixture of
public and private funding.
• The council has allocated a maximum of
$25m (~2/3 of the cost) to the project to
2025.
• The project will only proceed if
substantial external funds are raised to
contribute the remaining costs.
• The dam is expected to provide
economic, environmental, social and
cultural benefits to the region.
• Not yet applicable since the scheme is
still to be developed.
Appendix K Decision-making criteria

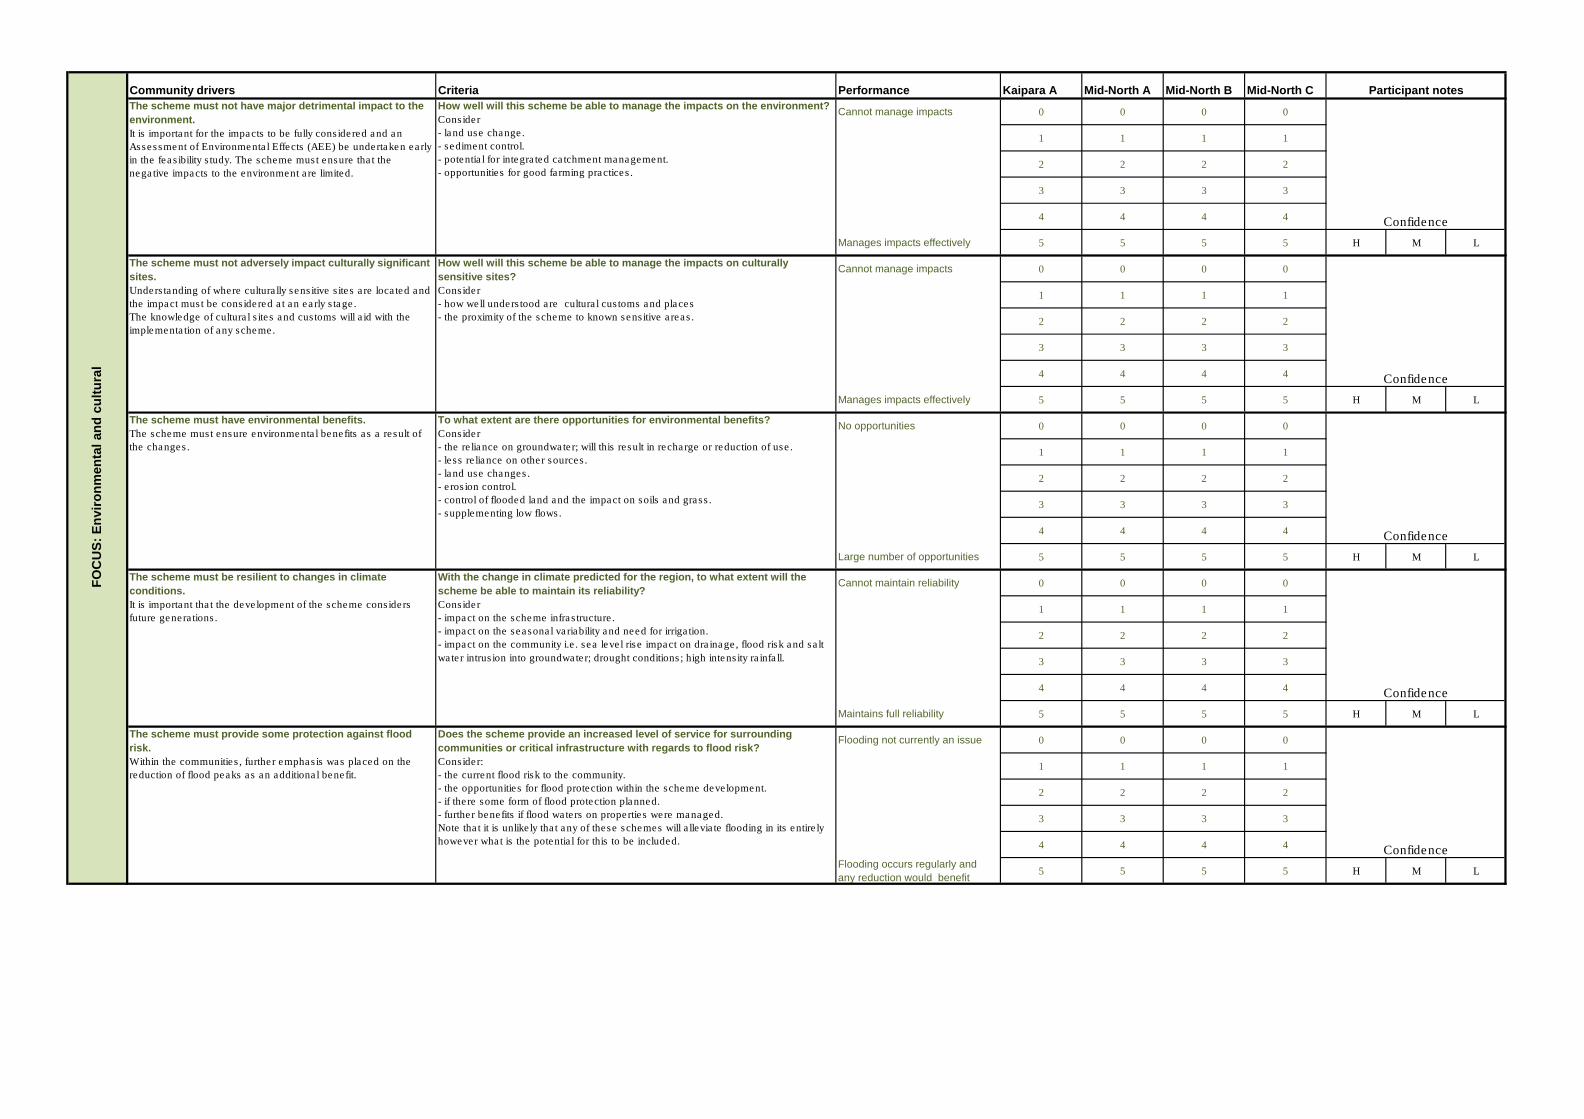
Community drivers Criteria Performance Kaipara A Mid-North A Mid-North B Mid-North C
Cannot manage impacts 0 0 0 0
1 1 1 1
2 2 2 2
3 3 3 3
4 4 4 4
Manages impacts effectively 5 5 5 5 H M L
Cannot manage impacts 0 0 0 0
1 1 1 1
2 2 2 2
3 3 3 3
4 4 4 4
Manages impacts effectively 5 5 5 5 H M L
No opportunities 0 0 0 0
1 1 1 1
2 2 2 2
3 3 3 3
4 4 4 4
Large number of opportunities 5 5 5 5 H M L
Cannot maintain reliability 0 0 0 0
1 1 1 1
2 2 2 2
3 3 3 3
4 4 4 4
Maintains full reliability 5 5 5 5 H M L
Flooding not currently an issue 0 0 0 0
1 1 1 1
2 2 2 2
3 3 3 3
4 4 4 4
Flooding occurs regularly and
any reduction would benefit5 5 5 5 H M L
Confidence
FO
CU
S:
En
vir
on
me
nta
l a
nd
cu
ltu
ral
How well will this scheme be able to manage the impacts on the environment?
Consider
- land use change.
- sediment control.
- potential for integrated catchment management.
- opportunities for good farming practices.
How well will this scheme be able to manage the impacts on culturally
sensitive sites?
Consider
- how well understood are cultural customs and places
- the proximity of the scheme to known sensitive areas.
To what extent are there opportunities for environmental benefits?
Consider
- the reliance on groundwater; will this result in recharge or reduction of use.
- less reliance on other sources.
- land use changes.
- erosion control.
- control of flooded land and the impact on soils and grass.
- supplementing low flows.
With the change in climate predicted for the region, to what extent will the
scheme be able to maintain its reliability?
Consider
- impact on the scheme infrastructure.
- impact on the seasonal variability and need for irrigation.
- impact on the community i.e. sea level rise impact on drainage, flood risk and salt
water intrusion into groundwater; drought conditions; high intensity rainfall.
Does the scheme provide an increased level of service for surrounding
communities or critical infrastructure with regards to flood risk?
Consider:
- the current flood risk to the community.
- the opportunities for flood protection within the scheme development.
- if there some form of flood protection planned.
- further benefits if flood waters on properties were managed.
Note that it is unlikely that any of these schemes will alleviate flooding in its entirely
however what is the potential for this to be included.
The scheme must not have major detrimental impact to the
environment.
It is important for the impacts to be fully considered and an
Assessment of Environmental Effects (AEE) be undertaken early
in the feasibility study. The scheme must ensure that the
negative impacts to the environment are limited.
The scheme must not adversely impact culturally significant
sites.
Understanding of where culturally sensitive sites are located and
the impact must be considered at an early stage.
The knowledge of cultural sites and customs will aid with the
implementation of any scheme.
The scheme must have environmental benefits.
The scheme must ensure environmental benefits as a result of
the changes.
The scheme must be resilient to changes in climate
conditions.
It is important that the development of the scheme considers
future generations.
The scheme must provide some protection against flood
risk.
Within the communities, further emphasis was placed on the
reduction of flood peaks as an additional benefit.
Confidence
Confidence
Confidence
Participant notes
Confidence
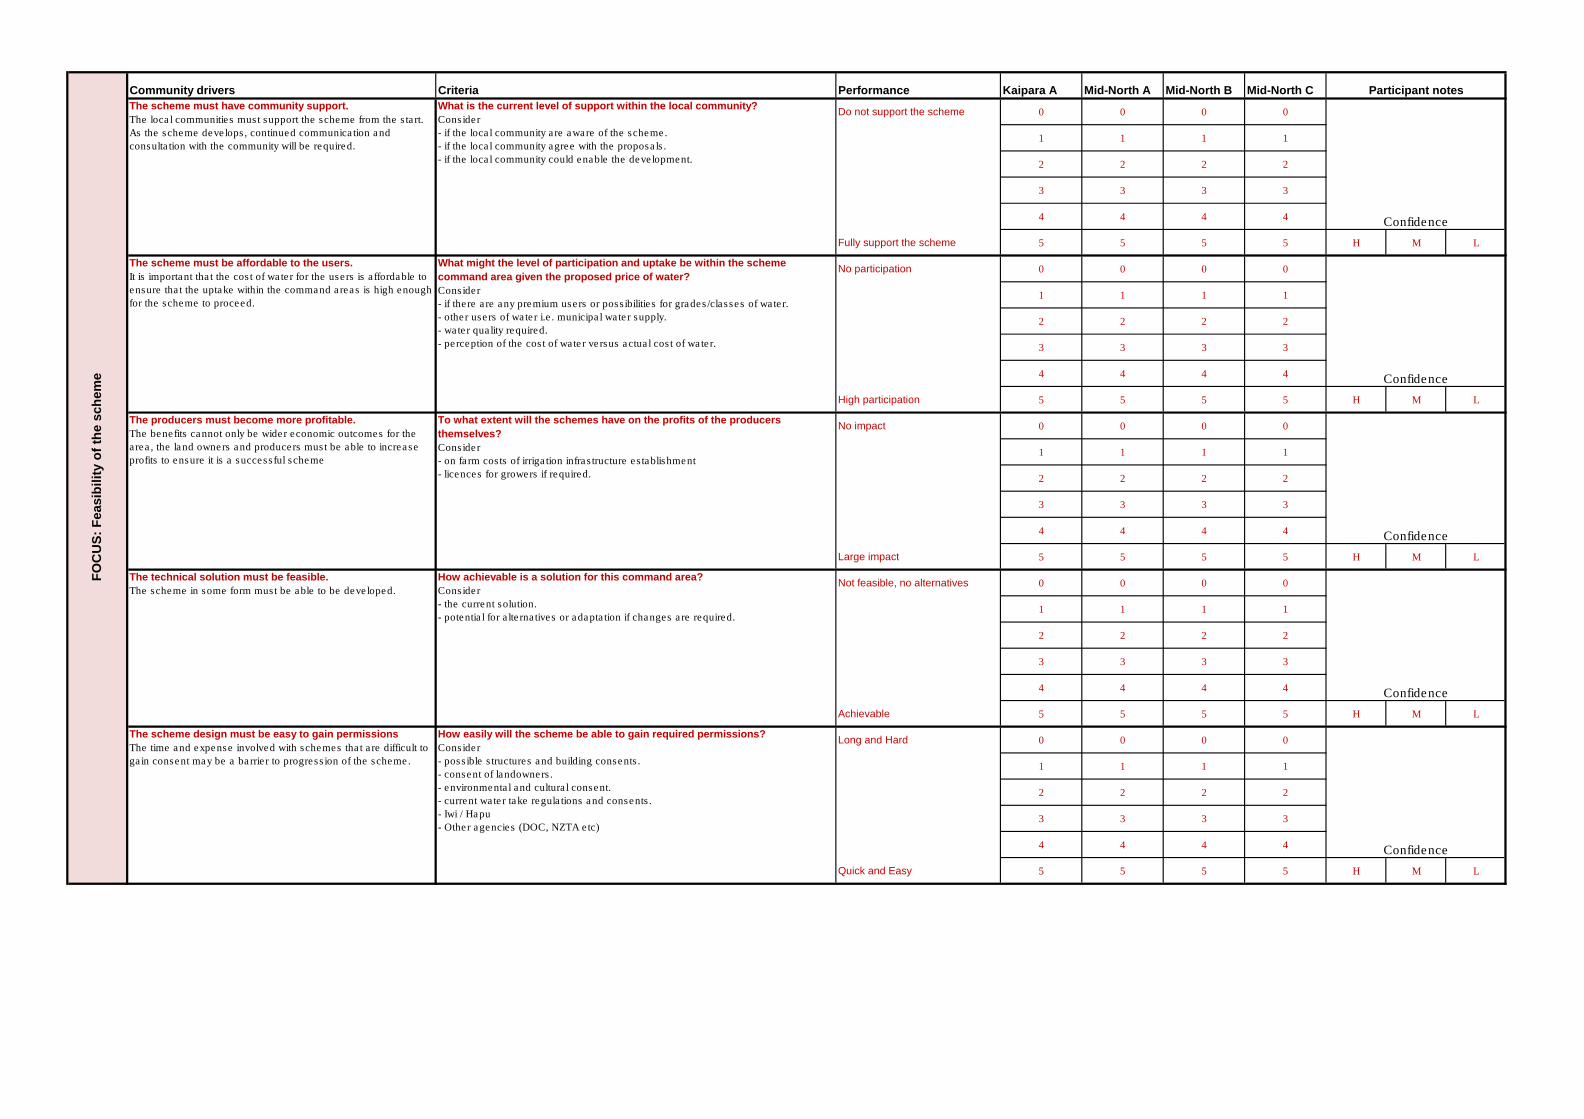
Community drivers Criteria Performance Kaipara A Mid-North A Mid-North B Mid-North C
Do not support the scheme 0 0 0 0
1 1 1 1
2 2 2 2
3 3 3 3
4 4 4 4
Fully support the scheme 5 5 5 5 H M L
No participation 0 0 0 0
1 1 1 1
2 2 2 2
3 3 3 3
4 4 4 4
High participation 5 5 5 5 H M L
No impact 0 0 0 0
1 1 1 1
2 2 2 2
3 3 3 3
4 4 4 4
Large impact 5 5 5 5 H M L
Not feasible, no alternatives 0 0 0 0
1 1 1 1
2 2 2 2
3 3 3 3
4 4 4 4
Achievable 5 5 5 5 H M L
Long and Hard 0 0 0 0
1 1 1 1
2 2 2 2
3 3 3 3
4 4 4 4
Quick and Easy 5 5 5 5 H M L
Confidence
Confidence
Confidence
Participant notes
Confidence
Confidence
FO
CU
S:
Fe
as
ibil
ity
of
the
sc
he
me
How easily will the scheme be able to gain required permissions?
Consider
- possible structures and building consents.
- consent of landowners.
- environmental and cultural consent.
- current water take regulations and consents.
- Iwi / Hapu
- Other agencies (DOC, NZTA etc)
The scheme must have community support.
The local communities must support the scheme from the start.
As the scheme develops, continued communication and
consultation with the community will be required.
What is the current level of support within the local community?
Consider
- if the local community are aware of the scheme.
- if the local community agree with the proposals.
- if the local community could enable the development.
The scheme must be affordable to the users.
It is important that the cost of water for the users is affordable to
ensure that the uptake within the command areas is high enough
for the scheme to proceed.
What might the level of participation and uptake be within the scheme
command area given the proposed price of water?
Consider
- if there are any premium users or possibilities for grades/classes of water.
- other users of water i.e. municipal water supply.
- water quality required.
- perception of the cost of water versus actual cost of water.
The technical solution must be feasible.
The scheme in some form must be able to be developed.
How achievable is a solution for this command area?
Consider
- the current solution.
- potential for alternatives or adaptation if changes are required.
The scheme design must be easy to gain permissions
The time and expense involved with schemes that are difficult to
gain consent may be a barrier to progression of the scheme.
The producers must become more profitable.
The benefits cannot only be wider economic outcomes for the
area, the land owners and producers must be able to increase
profits to ensure it is a successful scheme
To what extent will the schemes have on the profits of the producers
themselves?
Consider
- on farm costs of irrigation infrastructure establishment
- licences for growers if required.
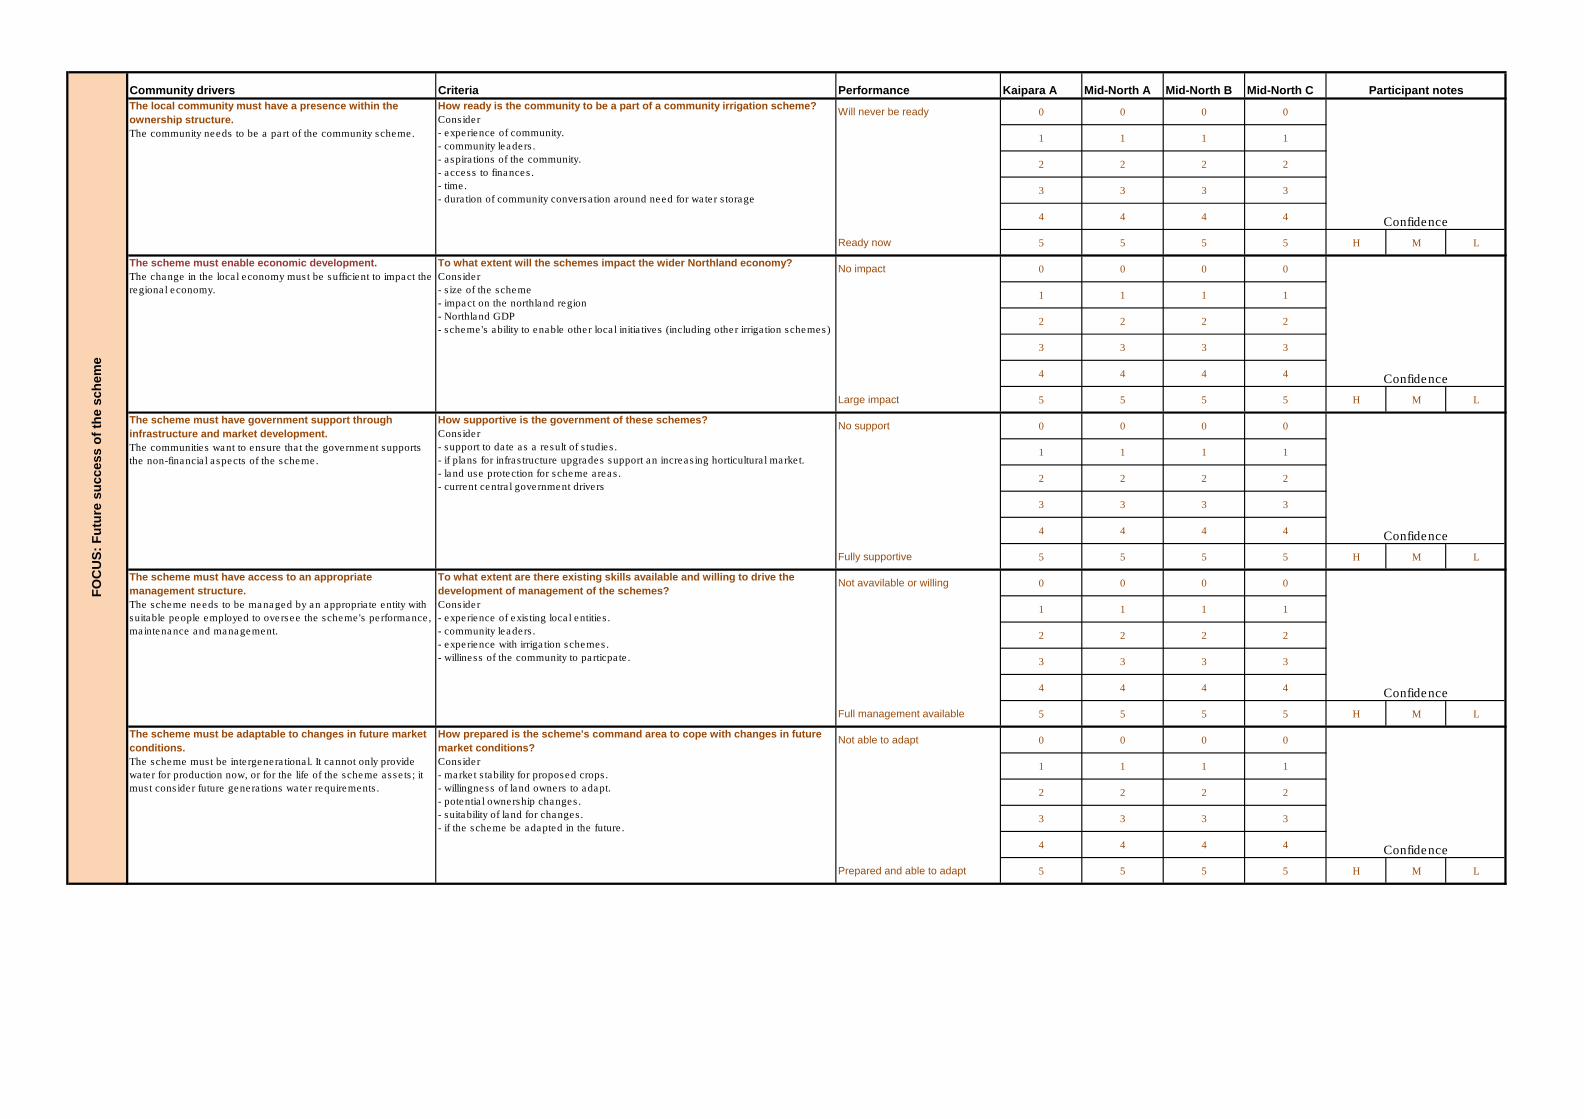
Community drivers Criteria Performance Kaipara A Mid-North A Mid-North B Mid-North C
Will never be ready 0 0 0 0
1 1 1 1
2 2 2 2
3 3 3 3
4 4 4 4
Ready now 5 5 5 5 H M L
No impact 0 0 0 0
1 1 1 1
2 2 2 2
3 3 3 3
4 4 4 4
Large impact 5 5 5 5 H M L
No support 0 0 0 0
1 1 1 1
2 2 2 2
3 3 3 3
4 4 4 4
Fully supportive 5 5 5 5 H M L
Not avavilable or willing 0 0 0 0
1 1 1 1
2 2 2 2
3 3 3 3
4 4 4 4
Full management available 5 5 5 5 H M L
Not able to adapt 0 0 0 0
1 1 1 1
2 2 2 2
3 3 3 3
4 4 4 4
Prepared and able to adapt 5 5 5 5 H M L
Confidence
Confidence
Confidence
Participant notes
Confidence
Confidence
FO
CU
S:
Fu
ture
su
cc
es
s o
f th
e s
ch
em
e
How prepared is the scheme's command area to cope with changes in future
market conditions?
Consider
- market stability for proposed crops.
- willingness of land owners to adapt.
- potential ownership changes.
- suitability of land for changes.
- if the scheme be adapted in the future.
The local community must have a presence within the
ownership structure.
The community needs to be a part of the community scheme.
How ready is the community to be a part of a community irrigation scheme?
Consider
- experience of community.
- community leaders.
- aspirations of the community.
- access to finances.
- time.
- duration of community conversation around need for water storage
The scheme must enable economic development.
The change in the local economy must be sufficient to impact the
regional economy.
To what extent will the schemes impact the wider Northland economy?
Consider
- size of the scheme
- impact on the northland region
- Northland GDP
- scheme's ability to enable other local initiatives (including other irrigation schemes)
The scheme must have government support through
infrastructure and market development.
The communities want to ensure that the government supports
the non-financial aspects of the scheme.
How supportive is the government of these schemes?
Consider
- support to date as a result of studies.
- if plans for infrastructure upgrades support an increasing horticultural market.
- land use protection for scheme areas.
- current central government drivers
The scheme must have access to an appropriate
management structure.
The scheme needs to be managed by an appropriate entity with
suitable people employed to oversee the scheme's performance,
maintenance and management.
To what extent are there existing skills available and willing to drive the
development of management of the schemes?
Consider
- experience of existing local entities.
- community leaders.
- experience with irrigation schemes.
- williness of the community to particpate.
The scheme must be adaptable to changes in future market
conditions.
The scheme must be intergenerational. It cannot only provide
water for production now, or for the life of the scheme assets; it
must consider future generations water requirements.
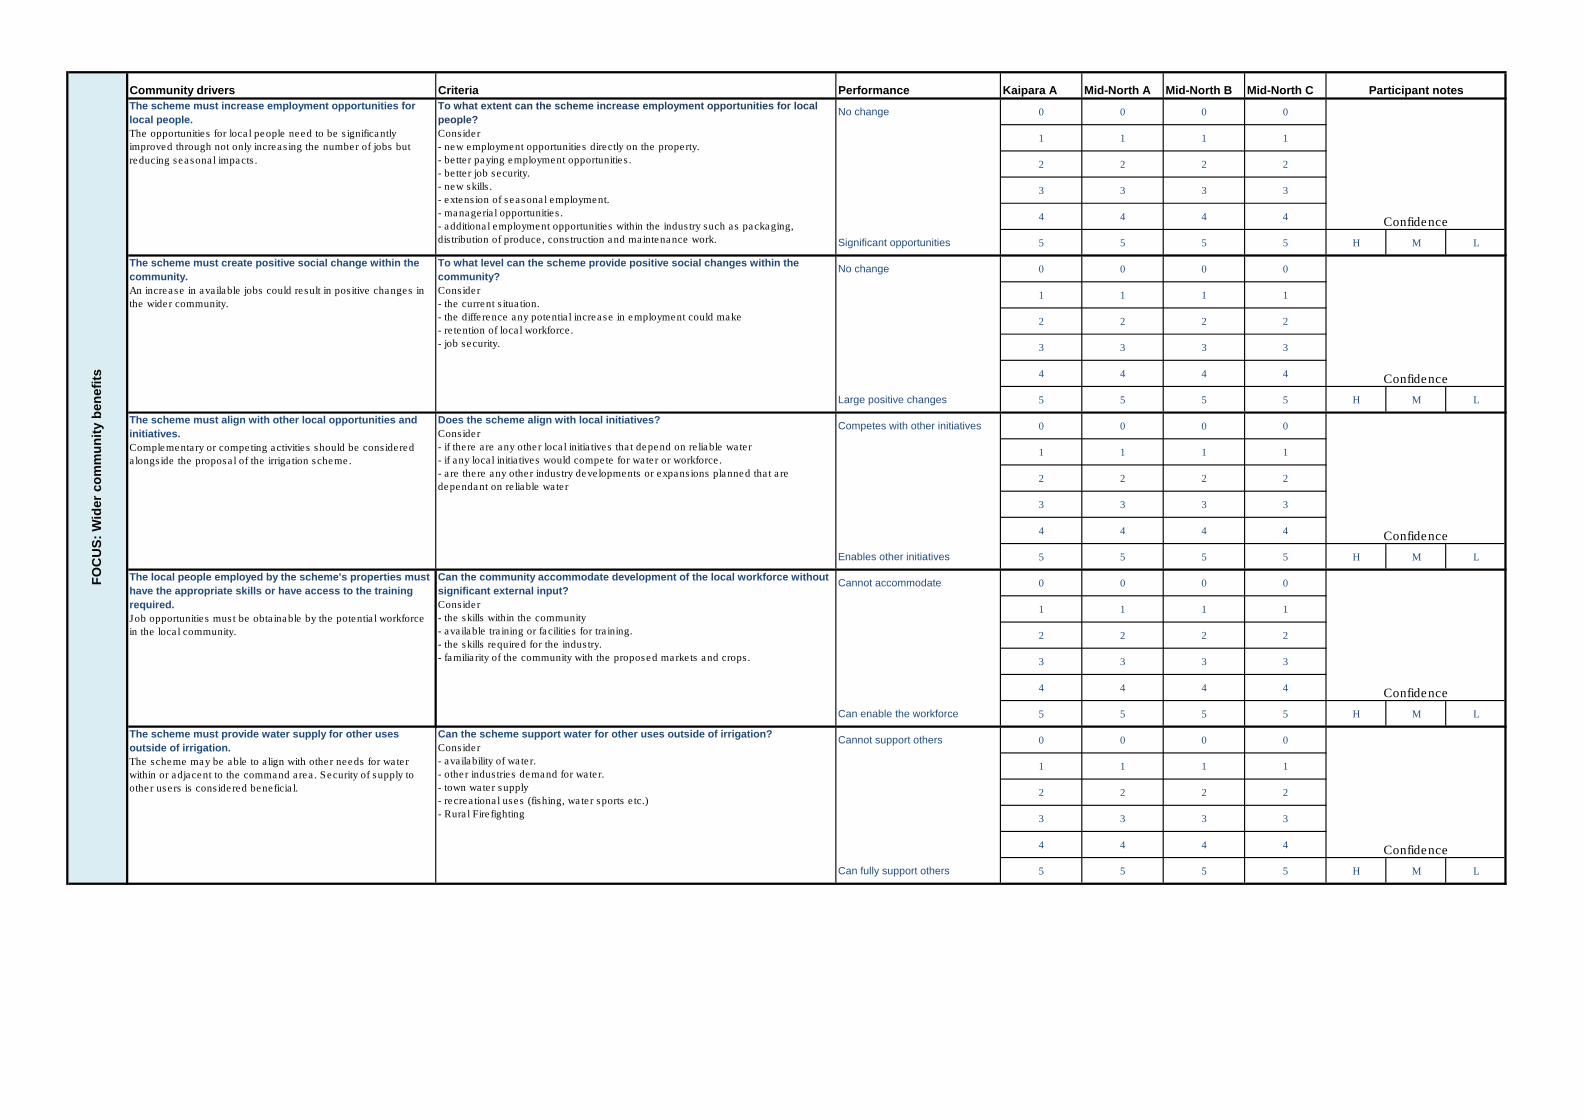
Community drivers Criteria Performance Kaipara A Mid-North A Mid-North B Mid-North C
No change 0 0 0 0
1 1 1 1
2 2 2 2
3 3 3 3
4 4 4 4
Significant opportunities 5 5 5 5 H M L
No change 0 0 0 0
1 1 1 1
2 2 2 2
3 3 3 3
4 4 4 4
Large positive changes 5 5 5 5 H M L
Competes with other initiatives 0 0 0 0
1 1 1 1
2 2 2 2
3 3 3 3
4 4 4 4
Enables other initiatives 5 5 5 5 H M L
Cannot accommodate 0 0 0 0
1 1 1 1
2 2 2 2
3 3 3 3
4 4 4 4
Can enable the workforce 5 5 5 5 H M L
Cannot support others 0 0 0 0
1 1 1 1
2 2 2 2
3 3 3 3
4 4 4 4
Can fully support others 5 5 5 5 H M L
Confidence
Confidence
Confidence
Participant notes
Confidence
Confidence
FO
CU
S:
Wid
er
co
mm
un
ity
be
ne
fits
Can the scheme support water for other uses outside of irrigation?
Consider
- availability of water.
- other industries demand for water.
- town water supply
- recreational uses (fishing, water sports etc.)
- Rural Firefighting
The scheme must increase employment opportunities for
local people.
The opportunities for local people need to be significantly
improved through not only increasing the number of jobs but
reducing seasonal impacts.
To what extent can the scheme increase employment opportunities for local
people?
Consider
- new employment opportunities directly on the property.
- better paying employment opportunities.
- better job security.
- new skills.
- extension of seasonal employment.
- managerial opportunities.
- additional employment opportunities within the industry such as packaging,
distribution of produce, construction and maintenance work.
The scheme must create positive social change within the
community.
An increase in available jobs could result in positive changes in
the wider community.
To what level can the scheme provide positive social changes within the
community?
Consider
- the current situation.
- the difference any potential increase in employment could make
- retention of local workforce.
- job security.
The local people employed by the scheme's properties must
have the appropriate skills or have access to the training
required.
Job opportunities must be obtainable by the potential workforce
in the local community.
Can the community accommodate development of the local workforce without
significant external input?
Consider
- the skills within the community
- available training or facilities for training.
- the skills required for the industry.
- familiarity of the community with the proposed markets and crops.
The scheme must provide water supply for other uses
outside of irrigation.
The scheme may be able to align with other needs for water
within or adjacent to the command area. Security of supply to
other users is considered beneficial.
The scheme must align with other local opportunities and
initiatives.
Complementary or competing activities should be considered
alongside the proposal of the irrigation scheme.
Does the scheme align with local initiatives?
Consider
- if there are any other local initiatives that depend on reliable water
- if any local initiatives would compete for water or workforce.
- are there any other industry developments or expansions planned that are
dependant on reliable water