assessment of renewable energy sources potential in...
TRANSCRIPT
May 2014
Sofia 1517 229 Botevgradsko shosse Blvd.
Telephone.: 02 84 12 977 Fax: 02 84 12 984
Assessment of Renewable Energy Sources Potential in the Cross-
Border Region Bulgaria – FYROM by Components
Executive Summary
Reference Number No 2007CB16IPO007-2011-2-89-2
Revision 0

PROJECT: Valorization of Renewable Energy Sources in the Cross-Border Area
Project No. 2007CB16IPO007-2011-2-89
SECTION: Executive Summary
TEAM: Inteladvisers, Ltd.
CLIENT: ZRNOVCI MUNICIPALITY, FORMER YUGOSLAV REPUBLIC OF MACEDONIA
AUTHORS ENDORSED BY
Dipl. Eng. Maria Mihaylova Dipl. Eng. Valentin Atanasov Dipl. Eng. Rumyana Stoyanova
Teodora Pavlova

Assessment of the Renewable Energy Sources Potential in the Cross-Border Region Bulgaria-FYROM by Components
Executive Summary
Control over modifications
Version 0
Amendments in documentation
№ DATE Prepared by
Description of amendment
Reason of amendment Checked
by Endorsed
by 1. 2.
3.

Assessment of the Renewable Energy Sources Potential in the Cross-Border Region Bulgaria-FYROM by Components
Executive Summary
page i of ii
СЪДЪРЖАНИЕ 1 Description of the subject of the research ....................................................................... 1
1.1 Types of RES ..................................................................................................................... 1 1.2 Theoretical and technical potential of RES ......................................................................... 5
2 BELITSA MUNICIPALITY ........................................................................................... 5
2.1 General description ............................................................................................................ 5 2.2 ENERGY FROM WATER SOURCES .............................................................................. 8 2.2.1 Assessment of the area ....................................................................................................... 8 2.2.2 Evaluation of the resource .................................................................................................. 8 2.2.3 Evaluation of the potential ............................................................................................... 10 2.2.4 Technologies for utilization of the evaluated resource potential ........................................ 11 2.2.5 Forecast annual production of energy ............................................................................... 12 2.3 ЕNERGY FROM BIOMASS ........................................................................................... 13 2.3.1 Assessment of the area ..................................................................................................... 13 2.3.2 Evaluation of the resource ................................................................................................ 13 2.3.3 Evaluation of the potential ............................................................................................... 13 2.3.4 Technologies for utilization of the evaluated resource potential ........................................ 14 2.3.5 Forecast annual production of energy ............................................................................... 14 2.4 SOLAR ENERGY ........................................................................................................... 15 2.4.1 Assessment of the area ..................................................................................................... 15 2.4.2 Evaluation of the resource ................................................................................................ 19 2.4.3 Evaluation of the potential ............................................................................................... 19 2.4.4 Technologies for utilization of the evaluated resource potential ........................................ 19 2.4.5 Forecast annual production of energy ............................................................................... 20 2.5 WIND ENERGY ............................................................................................................. 20 2.5.1 Assessment of the area ..................................................................................................... 20 2.5.2 Evaluation of the resource ................................................................................................ 22 2.5.3 Evaluation of the potential ............................................................................................... 22 2.5.4 Technologies for utilization of the evaluated resource potential ........................................ 23 2.5.5 Forecast annual production of energy ............................................................................... 24 2.6 ELECTRICAL CONNECTION OF NEW RES FACILITIES .......................................... 24
3 ZRNOVCI MUNICIPALITY ........................................................................................ 25
3.1 General description .......................................................................................................... 25 3.2 ENERGY FROM WATER SOURCES ............................................................................ 26 3.2.1 Assessment of the area ..................................................................................................... 26 3.2.2 Evaluation of the resource ................................................................................................ 27 3.2.3 Evaluation of the potential ............................................................................................... 28 3.2.4 Technologies for utilization of the evaluated resource potential ........................................ 29
Assessment of the Renewable Energy Sources Potential in the Cross-Border Region Bulgaria-FYROM by Components
Executive Summary
page ii of ii
3.2.5 Forecast annual production of energy ............................................................................... 30 3.3 ЕNERGY FROM BIOMASS ........................................................................................... 30 3.3.1 Assessment of the area ..................................................................................................... 30 3.3.2 Evaluation of the resource ................................................................................................ 32 3.3.3 Evaluation of the potential ............................................................................................... 32 3.3.4 Technologies for utilization of the evaluated resource potential ........................................ 33 3.3.5 Forecast annual production of energy ............................................................................... 33 3.4 SOLAR ENERGY ........................................................................................................... 34 3.4.1 Assessment of the area ..................................................................................................... 34 3.4.2 Evaluation of the resource ................................................................................................ 36 3.4.3 Evaluation of the potential ............................................................................................... 36 3.4.4 Technologies for utilization of the evaluated resource potential ........................................ 38 3.4.5 Forecast annual production of energy ............................................................................... 39 3.5 WIND ENERGY ............................................................................................................. 39 3.5.1 Assessment of the area ..................................................................................................... 39 3.5.2 Evaluation of the resource ................................................................................................ 41 3.5.3 Evaluation of the potential ............................................................................................... 41 3.5.4 Forecast annual production of energy ............................................................................... 42 3.6 ELECTRICAL CONNECTION OF NEW RES FACILITIES .......................................... 42
4 REGULATORY BASELINE AND REFERENCES .................................................... 44

Assessment of the Renewable Energy Sources Potential in the Cross-Border Region Bulgaria-FYROM by Components
Executive Summary
Page 1 of 44
1 DESCRIPTION OF THE SUBJECT OF THE RESEARCH
This study represents an executive summary to the report and it aims to provide a more general description of the RES assessment of the target area of the two municipalities. The research includes a description of the reviewed regions in which the project will be implemented, definition and analysis of renewable energy sources in this region, as well as their parameters; and definition and analysis of the available and forecast theoretical and technical potential of energy from renewable sources.
Based on the checks done of the suitable areas in Zrnovci and Belitsa municipalities and based on the information gathered in the process, four types of RES have been defined - hydro power, biomass, solar and wind energy..
1.1 TYPES OF RES
Renewable Energy Sources encompass solar, wind, water, geothermal energy, as well as energy obtained from plant and animal biomass. Production of energy from RES is supported by Bulgarian and EU legislation. When a project based on using RES is implemented, purchasing of energy is guaranteed at preferential rates according to the regulations and decrees adopted. The different types of RES require specialized preparation and resources.
Еnergy from water sources Hydro Power Plants (HPP) are a traditionally well-developed renewable source of energy.
HPP produce energy through gravity of falling or running water. This is the most widespread energy form of RES across the world. Price of energy from RES is relatively low which makes it a competitive source of renewable energy. Additionally, HPP are a flexible source of energy being able to get charged or discharged very fast in order to respond to the ever changing needs for electricity. The main ecological issue with them is the damming of rivers where the obstruction of the river flow affects negatively the ecosystems along the river basin, while the construction of dams and reservoirs is often accompanied by displacement of people and livestock. Once constructed, HPP does not directly produce waste and has lower carbon footprint compared to the energy obtained from solid and liquid fuels.
Biomass The term “biomass” is a generic term used in relation to organic matters of plant or animal
origin that may be recycled, processed and used for production of energy. Most often it is being associated with plants or plant-based products called lignocellulose biomass. These are predominantly waste products of plant origin from wood processing, agriculture, food processing, household waste, the industry and others. As an energy source biomass can be used directly by burning to produce heat or indirectly after having been transformed into different forms of bio fuels. Transformation of biomass into biofuels is done via following methods: thermal, chemical and biochemical.
The decreasing reserves of primary energy sources and the ecological issues arising from their use are just some of the reasons that led to the search for alternative sources of energy and to the development of new technologies for their utilization. Being a part of the Renewable Energy Sources, biomass is among the energy vectors that, unlike a certain part of the other renewable, are well-known and widely used.
Among the main advantages of biomass compared to other Renewable Energy Sources is its capacity to directly turn into liquid fuels like biodiesel and ethanol, as well as its suitability for use in the production of biogas, especially in agricultural areas with large amounts of livestock.

Assessment of the Renewable Energy Sources Potential in the Cross-Border Region Bulgaria-FYROM by Components
Executive Summary
Page 2 of 44
Main sources of bio energy are wood and wood chips; beside the waste from wood processing, fast growing hardwood species are also used for the production of biomass. Normally these are specially selected wood varieties like hybrid ivy and poplar, maple, ash tree, walnut and plane trees which are good for use within five to eight years after planting. Waste from forestry includes also biomass which has not been collected or removed from clearings, as well as materials obtained by forest management activities like thinning or removal of dying trees. Solid and liquid wastes from agriculture are also sources of biomass. Out of the solid agriculture wastes, in the energy production mostly hay, corn stems, rice stems and others are used, with maize feed holding serious percentage. Liquid wastes from agriculture being mainly waste products from animal and poultry farms are also used in the production of biogas. Beside agriculture crops biomass includes also certain water cultures. These are predominantly some varieties of algae. Biomass includes certain solid industrial wastes like oils and minerals of vegetal and animal origin, and some household waste containing a substantial quantity of organic matters obtained by plants represent a source of renewable energy.
Several main technologies are used for the utilization of biomass. Some of them are direct burning, parallel burning, gasification, pyrolisis and anaerobic assimilation. Parallel burning, gasification and anaerobic assimillation are technologies still having relatively limited application. They are suitable for use mainly in industrial environment. In parallel burning, the biomass is used as an additional resource of energy in highly effective coal-fired steam boilers. Gasification is related to the production of biogas used as a fuel in energy plants with combined production cycles. Аnaerobic assimillation is a process in which methane and other secondary products are obtained. In this process organic matters are disintegrated by bacteria in oxygen-free medium. Undoubtedly, direct burning in furnaces and heaters is the easiest way of biomass utilization. The main disadvantage is its lower effectiveness due to temperature losses through their bodies or through exhaust gases.
Biogas is a fuel gas obtained through organized fermentation of biological products in anaerobic medium. Its basic composition is: 55%÷75% methane and 25%÷45% CO2. Calorific value of biogas is from 4,5 tо 7,5 kWh/m3. One kilogram of methane equals 1,18 kilo of heavy oil, i.е. 1 m3 of methane = 1 l of heavy oil. Оut of 1 kilogram of biomass (as a dry substance) 200 l tо 1.200 l of bio gas are obtained depending on the biomass composition and the conditions of fermentation.
Starting raw materials for the production of biogas are wastes produced by animal farms – grass, straw, leaves, pine needles, manure, feces, litter (mixture of feces and straw), wash waters, food and household waste. These materials contain organic and non-organic substances; thus, they are a suitable medium for the growth of various microorganisms. These materials represent a serious problem as they pile up in large quantities and pollute the environment. During their natural fermentation methane is being released which is a greenhouse gas and makes up 7% to 10% of the global methane pollution.
Main source for the production of bio diesel is rapeseed. There is a high demand for this product on European markets which makes it an inseparable part of the contemporary grain production. It flowers from 15th of April till 10th of May and is a good source of anther for bees.
Seeds of this plant contain from 40% tо 52% slow-drying oil, up to 20% proteins and over 17% carbohydrates. Nutritional qualities of the rapeseed oil are defined by oil and acid composition and the content of А, Е, К and D vitamins, phosphatides and tocopherols. Around 85% оf rapeseed oil composition is essential fatty acids: 20% linoleic and 65% оleic acid. This makes it the most important among the plants rich in oils and proteins and it occupies the third place in the global production of vegetable oils and biofuel (diesel). Its waste products are oil cakes and groat. They contain around 33% of proteins and represent valuable forage for livestock. Groat from rapeseed oil is very close to the one from soy in terms of feed quality.
The rapeseeds grow slowly already at 1÷2 °С, while in spring they start to vegetate again at 3÷4 °С. Rapeseed is a plant of the long day. It developes greatly in mass and needs a lot of water,

Assessment of the Renewable Energy Sources Potential in the Cross-Border Region Bulgaria-FYROM by Components
Executive Summary
Page 3 of 44
especially during buttonisation and flowering, as well as during the growth phase of pods. Seeds germinate upon having absorbed 80÷90% water of their mass. It is tolerate to various types of soils – black, alluvial, grey, cinnamon and brown forest soil. Most of the modern hybrids could be grown even on weaker soils in pre-mountainous areas where other cultures yield unsatisfactory results. Rapeseed requires neutral reaction of soil, but it develops well also with slightly acidic and slightly alkaline reaction of the soil at Ph 6÷7,5. Rapeseed growing technology is to be followed strictly.
Recommendable sowing density is 50÷80 seeds per m2 so a yield of minimum 20÷30 plants per m2 is secured.
Sowing standard depends on the relevant technology of rapeseed growing and varies from 0,4 to 0,9 kg/decare for the different varieties.
Calorific value of biodiesel is almost the same as of petrol diesel, 10,5 kWh/l and 11,6 kWh/l respectively. Rapeseed yield is approximately 1 170 kg/hа which results in production of 421 kg/ha of biodiesel.
The Paulownia grows at places up to 2 000 m altitude. An altitude of 750 – 800 m is recommendable for the plant cultivation with investment goal.
Growth of trees starts when soil temperature reaches 15 °С÷16 °С. Optimal temperature for growing of paulownia is in the range 24 °С÷33 °С.
Paulownia is highly adaptive to various soils and grows on a wide range of soils but it develops best in deep and well-drained soils.
Comparing its annual yield to those of poplar, willow or miscantus it appears to be the most effective culture in our geographical area.
The main advantage of paulownia as energy yielding culture is its fast growth in the first 1-2 years of its life as well as the capacity of its root system to ensure forming of new plants on the spot of the cut stem. Seeds are sown in spring and in the end of the first vegetative period paulownia is cut to the ground level so formation of multitude of new stems during the following year is induced.
Growth during the following year is fast, with the plant reaching 3-4 m height in the end of the year and 6-7 m in the second year when it is cut for processing of the biomass obtained in this way. Such a plantation has a life cycle of 20-25 years and is supposed to give 10-12 yields after which the ground can be used again for other purposes.
For the creation of forestry plantations, the following sowing density is recommended: 4х4, 4х5 or 5х5 m with 620÷500 trees/ha. Higher sowing density leads to slowing down of plants growth after the first 3-4 years. Lower sowing density produces much faster initial growth which results in lower quality of the wood material.
For an effective production of biomass trees are planted more densely than it is required in the production of wood material. Recommendable density of planting for production of biomass is between 350÷1000 trees/decare depending on the biomass harvesting technique, its follow-up use and the planting density.
Bioethanol is alcohol produced through fermentation of carbohydrates from sugar plants and cultures containing starch like sugar cane, corn, soya, sorghum, wheat etc. Beside that, for the production of bioethanol, cellulose biomass from non-alimentary products like wood, straw and others can be used as well. Bioethanol is directly used as a fuel for various vehicles being usually mixed with gasoline for improving its octane number thus decreasing its harmful emissions. Besides, its use does not require any changes or replacements of existing installations of inner combustion engines which does not lead to additional costs. Just like biodiesel, bioethanol is ecologically renewable fuel which EU has established as a compulsory ingredient of petrol fuels in recent years.
Solar energy Еnergy from sunlight is used in two ways: through transforming it into electricity or
through transforming it into thermal energy for households and industry. Electricity from the sun is obtained through transformation of sunlight either directly through photovoltaic pannels or

Assessment of the Renewable Energy Sources Potential in the Cross-Border Region Bulgaria-FYROM by Components
Executive Summary
Page 4 of 44
indirectly through concentrating and focusing of light through enormous quantity of tracking mirrors/lenses. Photovoltaics transform light into power through the so called photovoltaic effect. On the other hand, thermal energy is produced in special flat collectors with selective covering or vacuum pipe collectors which capture and retain the heat from ultraviolet and infrared rays and render it to a thermal carrier, usually antifreeze.
Photovoltaics are important and relatively cheap source of power in areas where either the site is inconvenient for connecting to the power network or it is unreasonably expensive, or if there is no connection point at all. As prices of photovoltaic panels are constantly dropping, and also due to the fact that they do not release any emissions, the interest towards this type of RES is increasing.
The limited working hours during the day, their dependence of the weather conditions, as well as the seasonal nature of the yield may be pointed as some of the main disadvantages. Their life as a resource is also short, but with the progress of technologies this problem will weaken or disappear. Another disadvantage in terms of their principle of work is that power produced by photovoltaics is highly non-inertial which practically means that, for instance, switching from maximum to minimum power (in cloudy conditions) happens momentarily, without any delay. In the course of work these impulses lead to inconsistencies in the loads and to misbalances in the power system which is an unwanted effect.
Production of energy by photovoltaic power stations is directly influenced by the geographical position of the site, the daily dose of radiation reaching it and the index of transparency.
Solar energy is the energy that reaches a unit of surface for a unit of time. Measurement unit is kWh/m2 per day.
Index of transparency of the air reflects the solar radiation reaching the Earth surface from the atmosphere which has a value of between 0 and 1.
High index of transparency means that the air has a high level of cleanliness and there are no obstacles for the solar radiation.
Geographical latitude of the site defines the amount of solar radiation and impacts the measuring of strings of the photovoltaic system.
Wind energy Wind power plants are quickly getting to the lead position in the group of renewable
energy sources. In Bulgaria there are several geographical areas that are suitable for the construction of mainly medium-sized wind turbines. Research and design of such equipment is to be done very carefully and thoroughly due to the specifics of the wind energy.
Wind turbines turn the kinetic energy of the wind into electric power. It happens through transformation of the linear movement of wind into torque of the vane shaft which in turn passes this torque onto a reductor and a generator.
The energy obtained in this way is attractive for several reasons: there is plenty of wind, it is free and practically inexhaustible, does not lead to pollution and climatic anomalies.
Researches done with the aim of determining the power potential of wind energy show that there are objective possibilities for its development.
Typically, this kind of wind power plants are constructed in the so called "wind parks" which are situated in previously assessed sites with a high amount of wind.
Again, the following might be pointed out as disadvantages: unbalanced loading; non-possibility of reliable long-run forecasting of winds and the production of energy respectively; difficult connection to the network due to the common remoteness of parks from the network; low frequency vibrations and noises; danger for bats and birds flying and nesting in the area.
Geothermal Energy Geothermal energy is a thermal energy which is generated and stored in the Earth’s crust.
This energy originates from the initial forming of our planet (20%) and from the radioactive decomposition of the minerals contained in it (80%). The geothermal gradient, which represents the

Assessment of the Renewable Energy Sources Potential in the Cross-Border Region Bulgaria-FYROM by Components
Executive Summary
Page 5 of 44
difference in the temperatures of the core and the surface of the planet, maintains a constant transportation of thermal energy from the inner part to the surface of the planet.
As a completely clean and practically free source of energy it is the best option of providing heating and hot water to a number of settlements, touristic centers and enterprises.
Geothermal energy is profitable, reliable, sustainable and ecological. The high initial investment, as well as the peculiar disposition of the source which usually
is situated on the boundary between tectonic plates, are the main disadvantages.
1.2 THEORETICAL AND TECHNICAL POTENTIAL OF RES
The index "Potential of Renewable Energy Resources" is viewed in two aspects: Theoretical potential is the resource which is established on an on-going basis
from data from various scientific researches and measurements. In terms of biomass for instance it is the entire quantity of standing lumber, while for water sources it is the entire water resource available. Theoretical potential is the base for the assessment of the technical potential.
Technical potential is defined as a part of the theoretical potential whose use is limited by technical and non-technical conditions obstructing the use of the complete quantity of the renewable energy source. An example of non-technical condition limiting the utilization of the biomass resource is the protected territories where economic activities are banned.
2 BELITSA MUNICIPALITY
2.1 General description
Belitsa Municipality is one of the smallest municipalities in Southwestern Bulgaria with an area of 382 km2 and a population of 9 927 inhabitants and is one of the municipalities of Blagoevgrad region. The town of Belitsa is the main administrative center of the municipality with 3 362 inhabitants, situated on the southern slopes of the Rila Mountain. The municipality borders the municipalities of Bansko , Razlog, Yakorouda, as well as Velingrad municipality in the District of Pazardjik; Rila Municipality in Kyustendil district and Samokov Municipality in Sofia district. It covers twelve settlements: the town of Belitsa and eleven villages: Kraishte, Gorno Kraishte, Dagonovo, Babyak, Gulubovo, Palatik, Chereshovo, Kuzyovo, Ortsevo, Lyutovo and Zlatarica.

Assessment of the Renewable Energy Sources Potential in the Cross-Border Region Bulgaria-FYROM by Components
Executive Summary
Page 6 of 44
Boundaries of Belitsa municipality
Assessment of the Renewable Energy Sources Potential in the Cross-Border Region Bulgaria-FYROM by Components
Executive Summary
Page 7 of 44
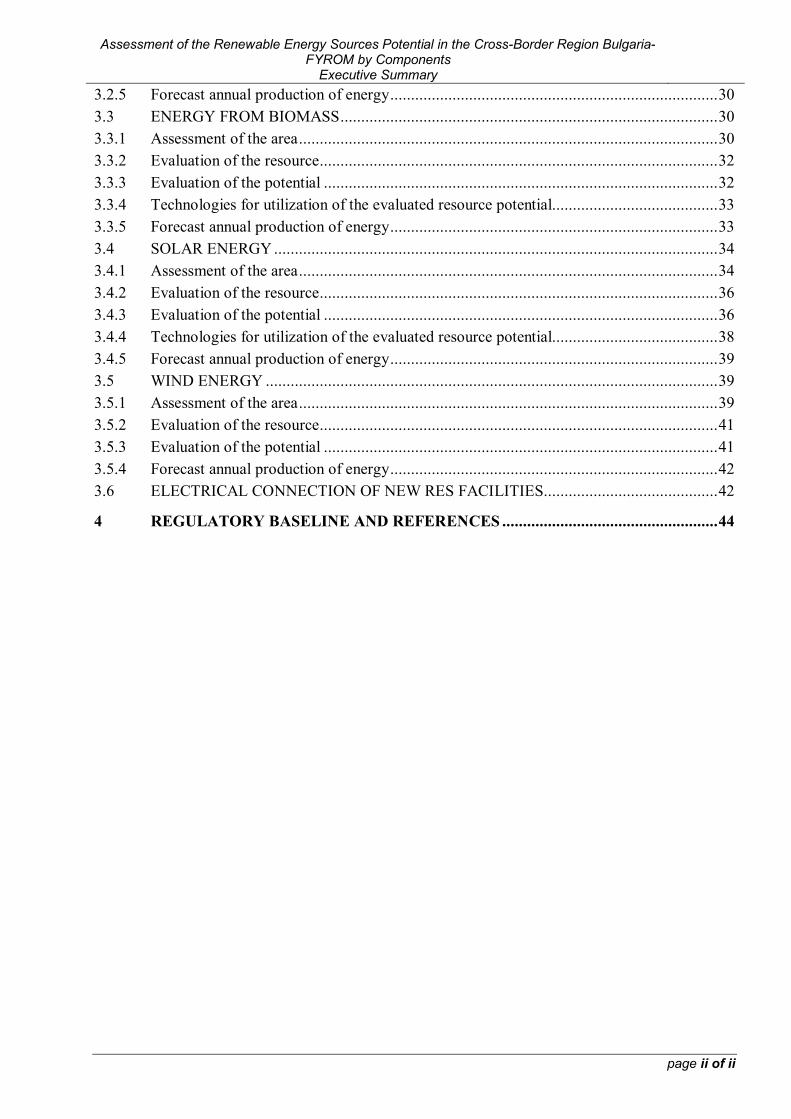
Map of Belitsa Municipality
The settlement network is poorly developed due to the limitations of the terrain, with no
significant administrative and economic center. Eight of the mayoralties (Babyak, Gulubovo, Palatik, Chereshovo, Kuzyovo, Ortsevo,
Lyutovo and Zlatarica) are scattered in the higher part of the Rhodope mountains. Total area of the municipality is 293 536 decars.
Water Supply Systems
Potable water supply of the town of Belitsa and the tourist sites The water intake for potable water supply of Belitsa is on Vapata River with a maximum
authorized amount of water - 0,35 l / s. The water supply system is made of asbestos-cement pipes, which are not suitable for building HPP.
Potable water supply of Belitsa Park for readaptation of dancing bears The water intake for potable water supply of Belitsa Park for readaptation of dancing bears
is Polenishka River with a maximum authorized amount of water - 0,2 l / s.

Assessment of the Renewable Energy Sources Potential in the Cross-Border Region Bulgaria-FYROM by Components
Executive Summary
Page 8 of 44
2.2 ENERGY FROM WATER SOURCES
2.2.1 Assessment of the area The information about the conditions of the area was taken from the topographic maps, as
well as from the field trips for informing about the area conditions, geology, access roads, opportunities for connecting to the electrical network, etc. Satellite data about the environment are also a proven valuable source of information.
Different mapping materials have been used for the purpose of preliminary assessment of the potential for production of electricity from water sources in Belitsa Municipality, namely:
Topographic maps of Belitsa, in scale 1:50 000 Topographic maps of Belitsa, in scale 1:25 000 Satellite images from Google Earth Interactive map of NATURA 2000. On-the-spot visits have been made to all potentially usable areas for production of
electricity from water sources in Belitsa Municipality. In Annex 1 (Map 1) is given a map of Belitsa Municipality. In Annex 2 (Drawings 1 and 2) the position of the selected zone of production is indicated.
Geographic coordinates The exact geographic coordinates of the area are shown below, as well as satellite images
from Google Earth. Water intake: N 41°55’28”; Е 23°37’05” HPP: N 41°54’25”; Е 23°36’25”
2.2.2 Evaluation of the resource The water resources of the municipality are formed by the Rila mountain rivers Mesta
(coming out of the territory of the neighboring municipality Yakorouda), Belishka, Votrachka and the rivers coming from the West Rhodope mountains: Babeshka, Zlatarica, Palatik and their tributaries. Abundant precipitation, prolonged snow cover and relatively well-developed forest and grass vegetation determine the affluence of Rila mountain rivers in the municipality .

Assessment of the Renewable Energy Sources Potential in the Cross-Border Region Bulgaria-FYROM by Components
Executive Summary
Page 9 of 44
The main rivers capable of production of electric power, passing through the territory of Belitsa Municipality, are: Belishka, Votrachka, Stankova and Babeshka rivers.
Hydrographic, hypsographic and other characteristics of the water sources have been established on the basis of maps in scale M 1:25 000.
The main hydrological parameters of the flux have been calculated on the basis of multiannual measurements of the water quantities in different hydrometric stations situated along the valleys of the rivers in the municipality.
There are 22 hydrometric stations installed and functioning in the catchment basin of Mesta river. 5 of them are along the main river, and the rest are on the tributaries. They are part of the National Hydrometric Network. The density and placement of the stations are sufficient for the purposes of design and evaluation of the water sources.
There is only one station in the catchment basin, station № 52800 (215) at Momina kula, which gives information about monitoring of water levels since 1927, and water quantities since 1935/36. The rest have been installed in the 50s. The first limnographs (1958) have been installed in the stations at Momina kula and Hadzhidimovo, and later in the end of the 60's and early 70's a total of 13 limnographs have been installed. They are daily, with graphic analogous (continuous) recording of water levels on paper. Sheets are changed daily at 8 o'clock in the morning, when the water levels on the water meter rack are measured. The limnographs (measurement device, tools and stands for filtering turbidity samples) are placed in limnograph booths above appeasement shafts, where cleaning of sludge on the bottom is foreseen.
In the stations without a limnograph the water levels are measured twice: 8:00 in the morning and 20:00 in the evening by a hydrology observer. Measurement of water quantities is carried out by hydrometric propellers. In compliance with the national legislative documents and those of WMO (World Meteorological Organization). For the proper plotting of key curves and reliable definition of water quantities, measurements were made (up to 1989) once or twice a month, covering the entire fluctuation range of the flux, and in case of a high wave extra measurements were made to capture it.
Description of hydrological regime of rivers Basic hydrological parameters have been determined based on observations in the period
1961 ÷ 1998.
Belishka River
Orohydrographical characteristics Belishka river draws its waters from Vapski Lakes, Skalishki Lakes, the south-east slopes
of Kanarata Peak (2691 m), Pastri Slap Peak (2683 m) and Goliama Pastrica peak (2606 m). In the upper stream the watershed of the river is largely covered with predominantly coniferous trees but there are also deciduous trees.
Up to Hydrometeorological Station (HMS) 460 – Belishka River, 5 km above Belitsa town the watershed covers an area of 64.7 km2.
Basic hydrological characteristics
Table 1. Basic hydrological parameters of Belishka river
F (km²)
Мо (l/s.km²)
Water quantity and volume
Provision % Average 95 90 75 5 1 0.1
64.7 19.32 Qo (m³/s) 1.25 0.69 0.79 1.05 91 138 211
Wo (mln. m³) 38.38 21.63 24.98 33.10 - - -

Assessment of the Renewable Energy Sources Potential in the Cross-Border Region Bulgaria-FYROM by Components
Executive Summary
Page 10 of 44
Votrachka River with right tributary Stankova River
In the watershed of Stankova river there is no hydrometeorological station (HMS) set up. For the determination of water draining characteristics data have been used from the analogue station HMS №210 on Votrachka river above Belitsa town, and additionally from the HMS №211 on Biala river. The source feeding of the watersheds of Belishka and Votrachka rivers comes from deep fissures and the influence of heavy rain alluviums in the foot of high peaks is significant over the average multiannual water flux.
Due to the specific high mountain conditions, topographical, orohydrographical, soil-geological and climatic peculiarities of the watersheds, the superficial water flux is influenced by the climatic peculiarities and the precipitation.
Table 2. Basic hydrological parameters of Stankova river
F (km²)
Мо (l/s.km²)
Water quantity and volume
Provision % Average 95 90 75 5 1 0.1
10.10 36.5 Qo (m³/s) 0.369 - - - - 57.80 -
Wo (mln. m³) 11.64 - - - - - -
Table 3. Basic hydrological parameters of Votrachka river
F (km²)
Мо (l/s.km²)
Water quantity and volume
Provision % Average 95 90 75 5 1 0.1
33.48 21.59 Qo (m³/s) 0.716 0.309 0.456 0.607 - - -
Wo (mln. m³) 22.80 11.32 14.38 19.42 - - -
Babeshka River
Table 4. Basic hydrological parameters of Babeshka river - estuary
F (km²)
Мо (l/s.km²)
Water quantity and volume
Provision % Average 95 90 75 5 1 0.1
31.20 12.14 Qo (m³/s) 0.378 0.256 0.286 0.324 - - -
Wo (mln. m³) 11.92 8.073 9.019 10.22 - - -
2.2.3 Evaluation of the potential The production of electrical power from water sources in Belitsa Municipality is reduced
to the utilization of the energy potential of Babeshka river. The remaining water sources are with depleted potential, since there are hydro power plant constructed on them. The parts of the rivers free from construction have practically zero potential for production of electrical power. In Annex 3 there is a table containing the HPPs constructed in Belitsa municipality.
The theoretical energy potential of a certain section of a hydraulic stream is the quantity of potential energy of the water stream for one year, defined by the complete fall and the average multiannual flux of the reviewed section.
The use of hydraulic power is a combination of activities for transformation of the latter into electrical power, which takes place by means of hydro power plants.
The working principle in production of power from water is to turn the potential energy of the water stream in the reviewed section into electrical power by creating artificially or naturally a concentrated height difference between two water levels - called a fall (pressure) and concentration of the water quantity.

Assessment of the Renewable Energy Sources Potential in the Cross-Border Region Bulgaria-FYROM by Components
Executive Summary
Page 11 of 44
Essentially, the fast-flowing water is not sufficient for conclusive production, except in large power plants in the seas and oceans where streams are used. Therefore, two parameters are accounted for: water quantity (Q) and total pressure (H).
The total pressure (H) is the maximum possible height of waterfall from the upper stream level down to the lower stream level. The real height, however, would be a little less than the total, due to losses.
The water quantity (Q) in the river is the volume of water transferred through a certain section per second, measured in m3/s.
The theoretical energy potential of the selected stream is defined by the formula: P = ρ.g. Q. H where:
P - average power of the water stream (W); ρ - water density (1000 kg/m3); g - Earth's acceleration (9.81 m/s2); Q - the average water quantity which flows through the reviewed section for a certain
period of time (m3/s); H - total pressure. For the reviewed section the theoretical potential for construction of a HPP is: P = 1000.9,81. Qз. Hgr m = 1000.9,81.0,50.110≈540 000 W=540 kW, where:
Qз – Constructed water quantity - the water quantity with which the power plant will be working. Upon designing of derivation-type hydro power plants an increase of the average water quantity by about 50% is assumed.
Hgr - the gross pressure of the power plant (not accounting for losses) The technological energy potential of a certain section of a hydraulic stream is the quantity
of potential energy of the water stream for one year, defined by the net fall (accounting for pressure losses along the route from water intake to the power plant) and the average multiannual flux of the reviewed section.
The technological energy potential of the selected stream is defined by the formula: P = c. Q. Hn where:
P - average power of the water stream (kW); c – η.g – c≈8÷8,2 for HPP with power less than 5000 kW η - overall quotient accounting for efficiency of energy equipment; ρ - water density (1000 kg/m3); g - Earth's acceleration (9.81 m/s2); Q - the average water quantity which flows through the reviewed section for a certain
period of time (m3/s); Hn - net pressure (Hn = Hn-hloss); hloss - pressure losses from water intake to HPP. For the reviewed section the theoretical potential for construction of a HPP is: P = 8. Qз. Hn m = 8.0,50.110=440 kW
2.2.4 Technologies for utilization of the evaluated resource potential The main element in a small HPP is the hydro turbine. The turbines transform energy from
water pressure into torque, but under different circumstances different types of turbines are used. The selection is made according to the characteristics of the spot, the height and volume of the water quantity, the desired rotation speed of the generator and whether the turbine is expected to also work at slower water speeds.

Assessment of the Renewable Energy Sources Potential in the Cross-Border Region Bulgaria-FYROM by Components
Executive Summary
Page 12 of 44
There are two main types of turbines in existence - active and reactive. The active type transforms the potential energy of the water into kinetic energy by a stream of water coming from a nozzle and actuation the turbine's propellers. The reactive type, in turn, uses the pressure of the water, as well as its speed, to create power. The working wheel is entirely submerged and thus both pressure and speed are reduced when exiting the turbine. In the opposite case with the active turbine the propellers are actuated by a stream and are in the air.
The most common may be grouped into three categories:
Kaplan and propeller turbines; Francis turbines; Pelton and other active turbines. Kaplan and propeller turbines are axial reactive turbines, usually used for small pressures
(usually under 16 m). Francis turbines are reactive turbines with radial stream, with fixed blades and adjustable
angle, which are used for average heights of water pressure. Pelton turbines are impulse turbines with one or more streams. Each stream passes through
a nozzle with a needle valve for stream control. Used for average and high waterfalls. For the reviewed section for production of electrical power from RES in Belitsa
municipality, and with a view of the main parameters, with which the power plant (Q=0.5 m3/s and H=110 m), the use of a Pelton-type turbine is assumed.
HPPs have small operational and maintenance costs. Their lifecycle is very long and they are extremely reliable from an operational point of view, therefore, this is a secure and well-tested technology. Furthermore, small and mini HPPs have a higher return on investment due to their small investment capital and operational costs for maintenance. They a re easier to construct and commission, due to the simplified design, thus keeping the costs low.
The selected turbine will provide high power production and maximum reliability during operation. It ahs high efficiency even when working with 20% of the constructed water quantity. The technology is very well-known and has proven its qualities worldwide.
The return on investment period for such a project may be defined after a detailed feasibility study containing the necessary data. in most cases this period is within the guaranteed period for buying out the electrical power (7÷9 years).
Based on the inspections done of Babeshka river the place of water catchment and HPP building have been chosen to be in the area above Gorno Kraishte village. This area has been proposed for possible construction of a small HPP and basic parameters of the future plant have been established. By the moment of elaboration of this report there were no other investment intentions and it is free for future development.
Babeshka River HPP is planned to be of a derivation type with a water catchment, pressure pipeline and a building for the HPP.
The water catchment will be a bottom grid of Tyrolean type. The catchment will be placed on a part of the river close to the road. The bottom level of the river is at an altitude of circa 940 m.
The water level above the catchment basin is at around 948 m. The catchment basin will include bottom grids placed across the river, tidal outlets for alluvia, fish passage and sludge basin with water intake chambers for a pressure pipeline.
The pressure pipeline will be about 2,4 km long. It will be dug in 1 m underground. Its route will run along the less inclined bank of the river. The pipe diameter will be 0,6 m. Pipes will be made of fiberglass. The platform of the HPP building will be situated in the end of the narrow valley immediately in its extension. The HPP site is 1,5 km above the village of Gorno Kraishte. Next to it there is a country road along the riverbank.
2.2.5 Forecast annual production of energy Parameters of the small HPP and potential annual average energy production:

Assessment of the Renewable Energy Sources Potential in the Cross-Border Region Bulgaria-FYROM by Components
Executive Summary
Page 13 of 44
Water amount: 0.500 m3/s Pressure: 110 m Turbine type: Pelton Power: 440 kW Average annual energy production: 2 024 МWh
2.3 ЕNERGY FROM BIOMASS
2.3.1 Assessment of the area Fields occupy most of the arable land in the Municipality Belitsa: 19 131 decars or 55.9%
of the municipal territory. The amount of permanent crops is 3 241 decars (9.5% of arable land). The amount of natural meadows is considerable: 11 787 decars (34.5%).
The total area of cultivated land (arable land, with fields and pastures) is 62 146 decars, or 21.1% of the municipal territory.
The main crops for the municipality are potatoes. Other crops grown are: beans, corn for grain and tobacco.
Livestock production is carried out only in the private sector and is characterized by the large number of small farms raising animals. Around 1690 heads of cattle, 6400 sheep, 445 goats and 314 horses are bred in the municipality.
In the municipality there are wood processing factories for production of lumber. Sawdust, splinters and barks are waste by-products from this production. Quantities of these residues are not known, but it is possible for their processing to be organized into pellets or briquettes for distribution to residents; thus, the quantity of timber used as firewood and illegal logging will be reduced.
On the territory of the town of Belitsa there is a working installation for production of pellets. This installation is owned by one of the factories and its capacity is unknown. It is probably used for recycling of waste from its own production.
Organized waste collection is done twice a week for Belitsa and once for the villages served in an organized manner. Amount of waste generated in the municipality is about 5152 tons from households and 11,700 tons from construction works.
The most probable biogas installation is the one located in Belitsa, provided that it will be using manure only from Belitsa and the closest villages: Kraishte, Gorno Kraishte and Dagonovo. They are at an average distance of 3 km from the road junction to Belitsa and are at the same altitude. In the other villages biogas could be produced in each settlement separately in small quantities from 1.5 to 3,5 m3 per hour. These installations may have an effect only in environmental aspect.
2.3.2 Evaluation of the resource Evaluation of the resource was made on the basis of the existing opportunities and the
availability of biomass in the municipality. Thus the three main raw materials for energy production have been defined - rapeseed for biodiesel, straw for heating, manure for biogas.
2.3.3 Evaluation of the potential
Rapeseed for production of biodiesel If 25% of the arable land of the municipality Belitsa i.e. 5000 decars (500 ha) are allocated
for the production of rapeseed, this would make 210 500 kg of biodiesel or 2,525,250 kWh a year. Theoretical potential is 10 101 MWh per year, while technical potential is 2 525,25 MWh
per year.
Straw for direct combustion for heating

Assessment of the Renewable Energy Sources Potential in the Cross-Border Region Bulgaria-FYROM by Components
Executive Summary
Page 14 of 44
The technological potential of the straw used for animal bedding is about 23 MWh / year, and the theoretical potential is about 60 MWh / year.
Manure for biogas production and utilization by cogeneration From the livestock listed in item 2.3.1. it is possible to collect the manure to produce
biogas in the amount of 190 m3 / h or about 1200 kW. Energy value of biogas produced from manure is estimated at around 480 000 m3 of biogas per year, or 3 024 000 kWh energy per year. This would ensure the operation of a boiler or a cogenerator with a power of 370 kW at annual load of around 8000 hours.
Theoretical potential is 10 485 MWh/year, while technical potential is 3 024 MWh/year. The lower part of the range of calorific value of biogas depends on the content of methane
(50% ÷ 70%) and is in the range of 6 ÷ 8 kWh/m3. If residues of crops are measured after the harvest an additional quantity of the produced
biogas can be determined, whereas the extraction of biogas from tonne of organic dry matter is:
Fresh alfalfa 350 m3 Grass 550 m3 Straw 340 m3 Tree leaves 250m3 Corn stalks 420 m3 Dairy waste 630 m3 Sewage waters 600 m3
2.3.4 Technologies for utilization of the evaluated resource potential
Production of biogas
For the production of biogas in the municipality a bioreactor needs to be built on a previously researched and approved site, near sources of organic waste. A major issue is that regular collection and consistency in the and production of manure from individual farms in Belitsa Municipality needs to be ensured. Disposal should be done regularly and in an organized manner.
– Out of one ton of manure from cattle between 200 ÷ 350 m3 of biogas are obtained with a methane content of 60%;
– Out of one ton of plants 300 ÷ 630 m3 of biogas are obtained with a methane content up to 70%;
Biodiesel production
The amount of natural meadows is 11,787 decares. At this stage there are no known abandoned and uncultivated agricultural areas due to a lack of interest or owners. These lands are suitable for sowing of oilseed cultures such as rapeseed or corn.
After removal of seeds, the waste biomass may be used as silage to animals or for the production of biogas in bioreactors.
2.3.5 Forecast annual production of energy The forecast annual quantities of energy are equal to the technological potential, on the
condition that the requirements and particulars of production are observed: For biodiesel - 2 525.25 MWh/year; For straw - 60 MWh/year; For manure - 3 024 MWh/year;

Assessment of the Renewable Energy Sources Potential in the Cross-Border Region Bulgaria-FYROM by Components
Executive Summary
Page 15 of 44
2.4 SOLAR ENERGY
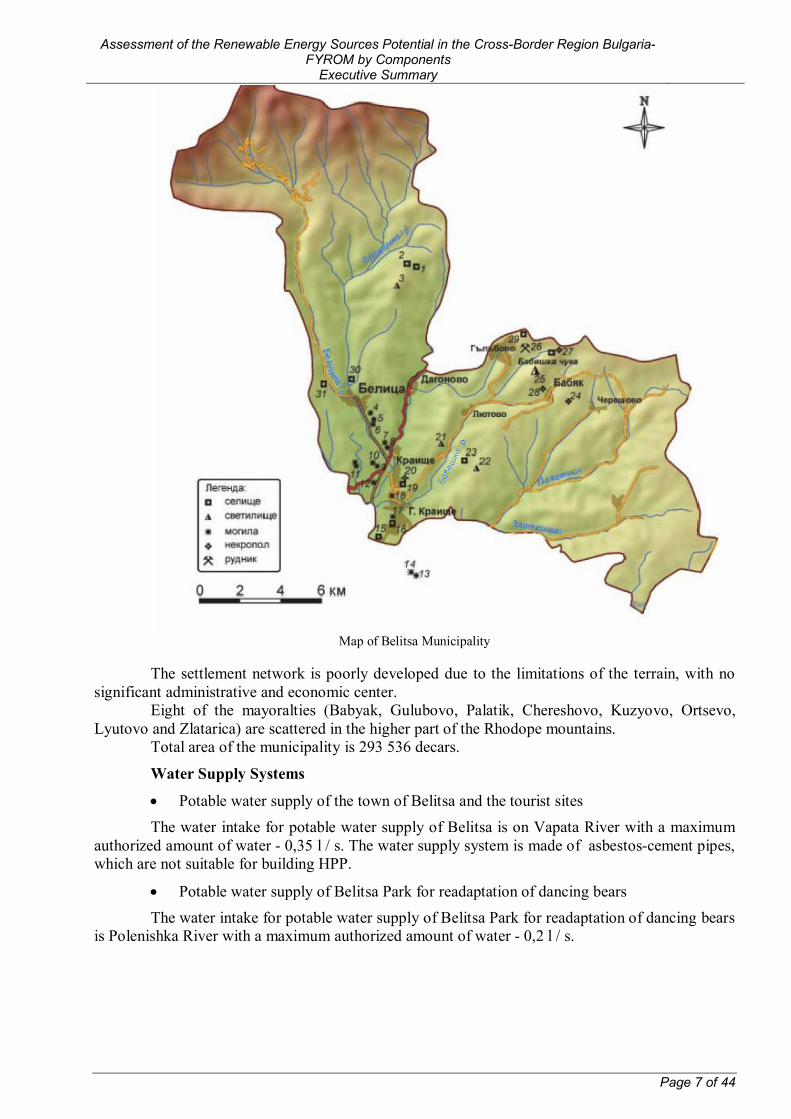
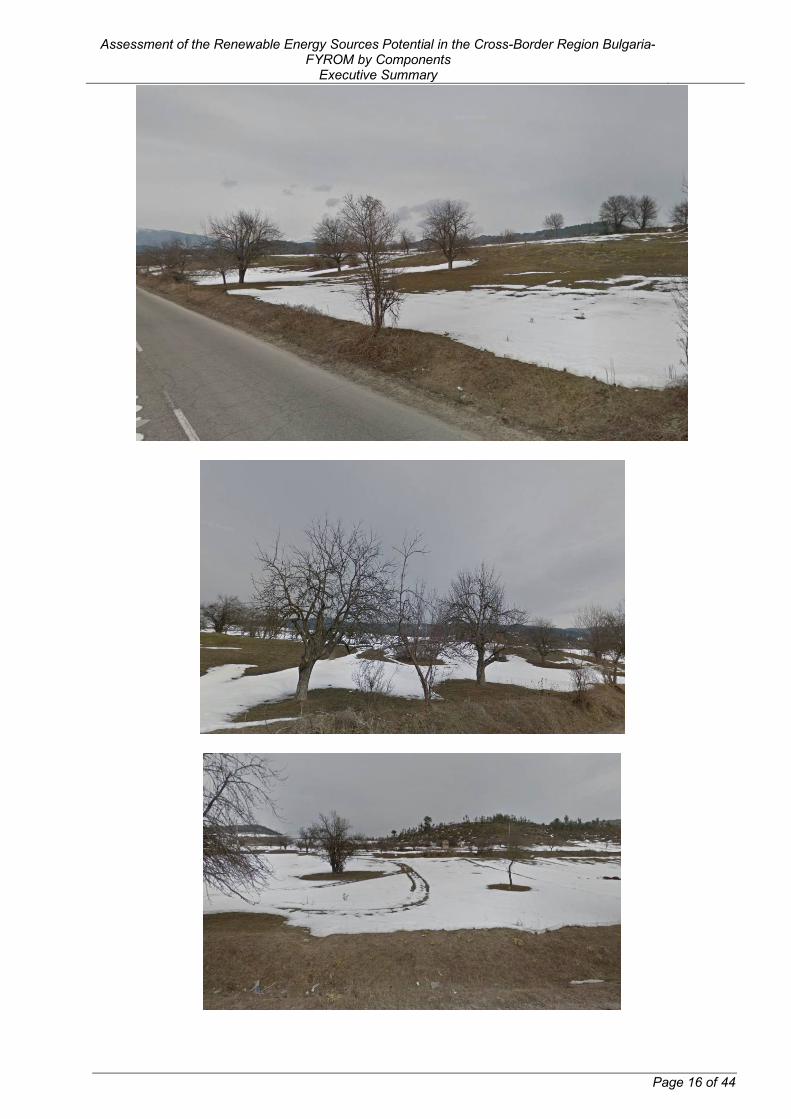
2.4.1 Assessment of the area The suggested sites of construction of photovoltaic panels are relatively flat without
declinations and large inclinations. They are selected to be close to asphalt or dirt road, with access for heavy machinery and equipment which will be used for construction.
Area 1
Area 1 is provisionally named Belitsa1, to facilitate its recognition of the photos and in the calculations.
Geographic coordinates The exact coordinates of the area are shown below, as well as satellite images and photos. N 41°55’45,82” E 23 ° 34'42, 55 " Altitude 808 m. The site is about 3 km from the center of Belitsa; 1 km from the main road of the
municipality II-84 Razlog-Velingrad; 84 km from Sofia; 329 km from the port of Burgas. The place is dominated by low vegetation, as evidenced by the attached photos.
Assessment of the Renewable Energy Sources Potential in the Cross-Border Region Bulgaria-FYROM by Components
Executive Summary
Page 16 of 44

Assessment of the Renewable Energy Sources Potential in the Cross-Border Region Bulgaria-FYROM by Components
Executive Summary
Page 17 of 44
The area is chosen so that it is accessible for installation and operation. It is close to an asphalt or passable road, with opportunity to facilitate the work of machines. No risk of damming, swamping or fogging.
There is no danger of shading either, as the horizon is clear both to the east and the west. The soil is firm and able to bear concrete foundations on the surface or in non-freezing
depth. In the preliminary survey no signs of shallow underground rocks were found, which makes installation of constructions on pile-driven steel poles or screws possible.
Exact conditions of installation will be clear after a detailed geological survey of the soil.
Area 2
Area 2 is provisionally named Kraishte (because of its proximity to Kraishte village) to facilitate its recognition on the photos and in calculations.
Geographic coordinates
The exact coordinates of the area are shown below, as well as satellite images and photos. N 41 ° 54'28 .16 " E 23 ° 34'50 .90 " Altitude is 755 ÷ 765 m. Area is ventilated which will ensure better cooling of modules at
higher ambient temperatures during summer months. The site is about 2 km from the center of Kraishte village, 100 km from Sofia; it is next to
the main road of the municipality II -84 Razlog - Velingrad; 326 km from the port of Burgas (all distances measured in straight line).
The place is dominated by low vegetation, as evidenced by the attached photos.

Assessment of the Renewable Energy Sources Potential in the Cross-Border Region Bulgaria-FYROM by Components
Executive Summary
Page 18 of 44
The area is chosen so that it is accessible for installation and operation. It is close to an asphalt road to facilitate the work of machines. Large leveling or removal of earth are not required.

Assessment of the Renewable Energy Sources Potential in the Cross-Border Region Bulgaria-FYROM by Components
Executive Summary
Page 19 of 44
It is located near Mesta River, which could be a prerequisite for the formation of fog, thus reducing its electricity production.
There is no danger of shading, as the horizon is clear both to the east and to the west. In the preliminary survey no signs of shallow underground rocks were found, which
makes installation of constructions on pile-driven steel poles or screws possible. Exact conditions of installation will be clear after a detailed geological survey of the soil.
2.4.2 Evaluation of the resource For defining the solar energy resource were used the models embedded in the following
websites, as well as licensed analysis software: Photovoltaic Geographical Information System (PVGIS) –
www.re.jrc.ec.europa.eu/pvgis/ - updated version PVGIS- CMSAF (data on the period from 2006 to 2010 is included)
METEONORM – Global database on solar radiation; www.meteonorm.com; NASA – Database on meteorology and solar energy –
www.eosweb.larc.nasa.gov/cgi-bin/sse/grid.cgi PVSyst V5.20 – Computer program for research/study, measuring, simulations and
analysis of data of entire photovoltaic systems.
2.4.3 Evaluation of the potential The electrical energy generated by the photovoltaic installation will be fed to the electrical
transfer grid. The country as a whole is rich in solar resources, but it is unevenly distributed on its territory, and the quality of solar radiation is different.
This necessitates the carrying out of a solar energy audit evaluating the solar radiation as a resource for production of electrical energy.
Data below is taken from the website of the Ministry of Economy, Energy and Tourism. The solar radiation potential on the territory of Bulgaria is significant, but serious
differences are observed in the solar intensity by regions. The data analysis shows that in terms of territory, the Republic of Bulgaria may be divided in three solar areas, where the average annual length of sunlight is about 2150 h and represents about 49% of the maximum possible sunlight.
Production of energy by the photovoltaic power plant is directly influenced by the geographical position of the site, the daily dose of radiation reaching it and the index of transparency.
Solar energy is the energy that reaches a unit of surface for a unit of time. Measurement unit is kWh/m2 per day.
Index of transparency of the air reflects the solar radiation reaching the Earth surface from the atmosphere which has a value of between 0 and 1.
High index of transparency means that the air has a high level of cleanliness and there are no obstacles for the solar radiation.
Geographical latitude of the site defines the amount of solar radiation and impacts the measuring of strings of the photovoltaic system.
The theoretical data and calculations of the solar radiation and the data of its distribution for a static metal construction and such with a tracking system for Area 1 and Area 2 are provided in Annex 4.
2.4.4 Technologies for utilization of the evaluated resource potential
The used technologies are provided in Annex 5.

Assessment of the Renewable Energy Sources Potential in the Cross-Border Region Bulgaria-FYROM by Components
Executive Summary
Page 20 of 44
2.4.5 Forecast annual production of energy
Based on the results obtained and the recommended technology for this field, the economic forecasts envisage the following average annual production:
For Area 1: Technology PVGIS-CMSAF Crystal 1720 kWh/kWp Losses registered in the system for 1 kW: - Temperature losses: - Losses from reflections: - Losses in cables, invertors, transformers
etc.:
8.6% 2.8% 10%
Thin-ply 1720 kWh/kWp Losses registered in the system for 1 kW: - Temperature losses: - Losses from reflections: - Losses in cables, invertors, transformers
etc.:
1.0% 2.8% 10%
For Area 2:
Technology PVGIS-CMSAF Crystal 1720 kWh/kWp Losses registered in the system for 1 kW: - Temperature losses: - Losses from reflections: - Losses in cables, invertors, transformers
etc.:
8.7% 2.7% 10%
Thin-ply 1720 kWh/kWp Losses registered in the system for 1 kW: - Temperature losses: - Losses from reflections: - Losses in cables, invertors, transformers
etc.:
1.1% 2.7% 10%
2.5 WIND ENERGY
2.5.1 Assessment of the area Before a wind system is installed, the existence of sufficient potential for its operation
should be verified. Necessary information could be taken from statistical reports from the Institute for Meteorology and Hydrology, or own measurements of the indicators in the selected site could be done.
Locations selected for the installation of wind turbines have been picked according to the theoretical rationale of Bulgarian Academy of Science (return on investment at over 1 000 m above sea level and a certain wind speed), as well as based on their accessibility for transportation and installation of machinery.
Area 1
(provisionally named WindGenerator1)
Assessment of the Renewable Energy Sources Potential in the Cross-Border Region Bulgaria-FYROM by Components
Executive Summary
Page 21 of 44
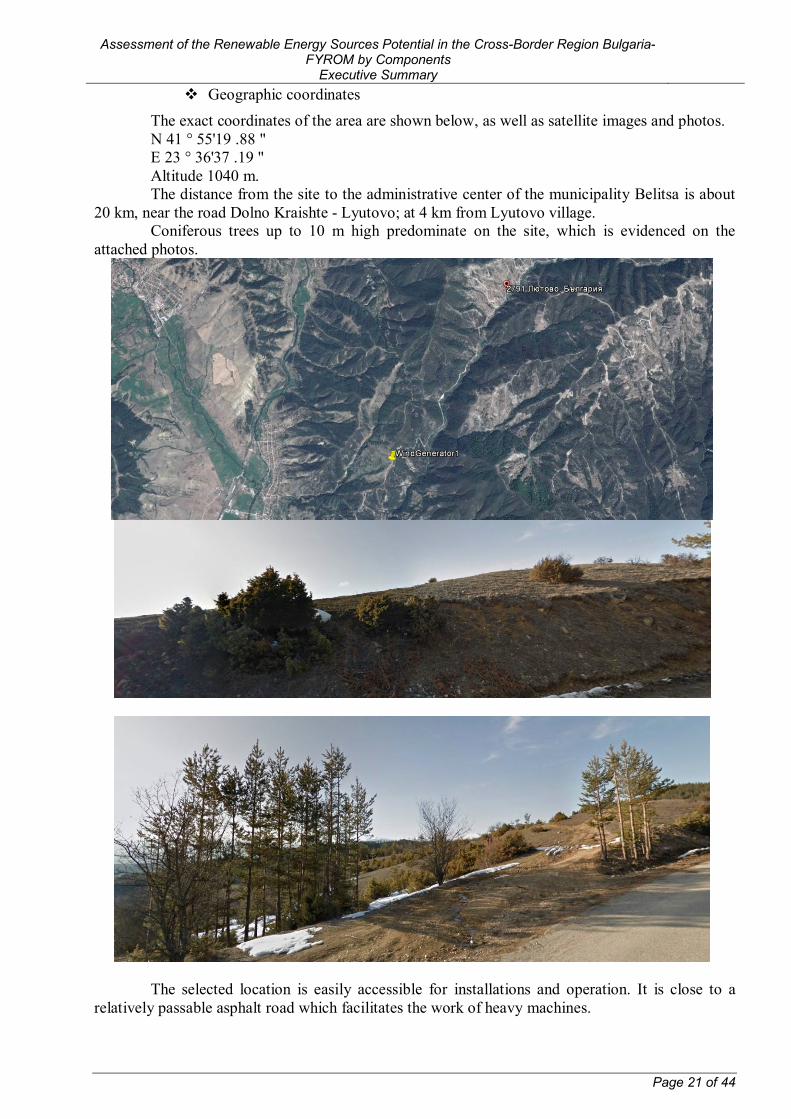
Geographic coordinates The exact coordinates of the area are shown below, as well as satellite images and photos. N 41 ° 55'19 .88 " E 23 ° 36'37 .19 " Altitude 1040 m. The distance from the site to the administrative center of the municipality Belitsa is about
20 km, near the road Dolno Kraishte - Lyutovo; at 4 km from Lyutovo village. Coniferous trees up to 10 m high predominate on the site, which is evidenced on the
attached photos.
The selected location is easily accessible for installations and operation. It is close to a relatively passable asphalt road which facilitates the work of heavy machines.
Assessment of the Renewable Energy Sources Potential in the Cross-Border Region Bulgaria-FYROM by Components
Executive Summary
Page 22 of 44
The soil is firm and able to bear concrete foundations on the surface or in non-freezing depth.
Exact conditions of installation will be clear after a detailed geological survey of the soil.
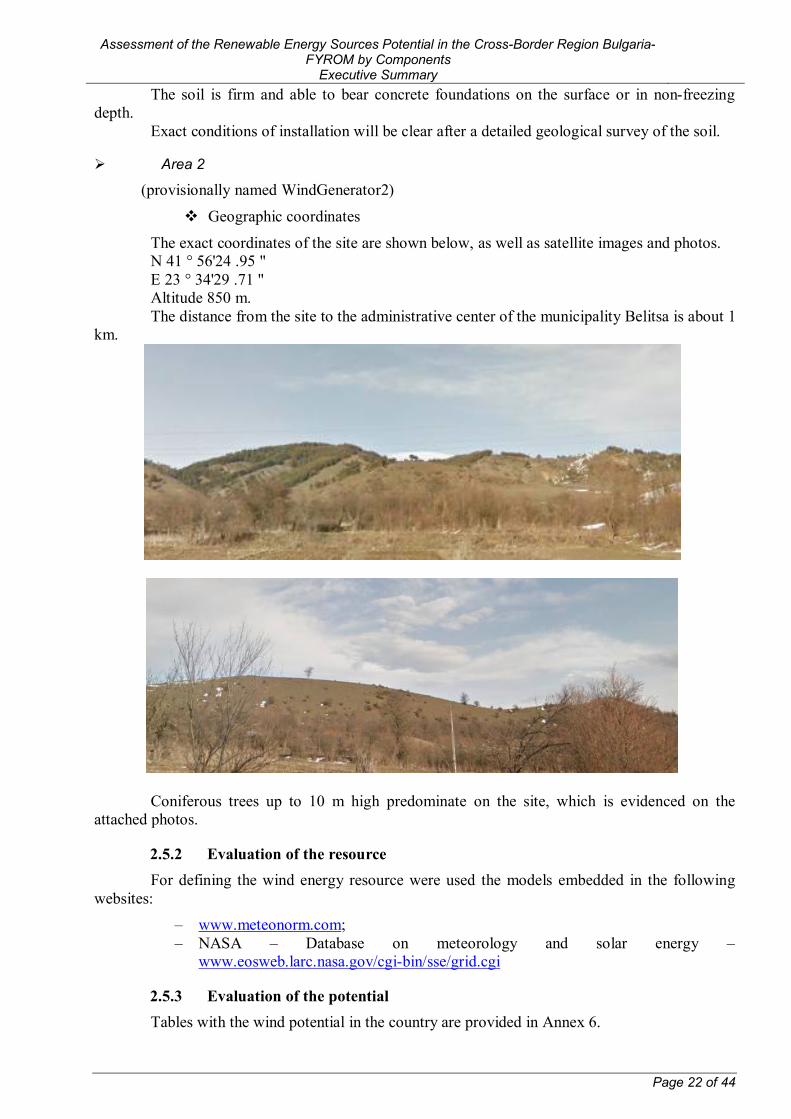
Area 2
(provisionally named WindGenerator2)
Geographic coordinates
The exact coordinates of the site are shown below, as well as satellite images and photos. N 41 ° 56'24 .95 " E 23 ° 34'29 .71 " Altitude 850 m. The distance from the site to the administrative center of the municipality Belitsa is about 1
km.
Coniferous trees up to 10 m high predominate on the site, which is evidenced on the attached photos.
2.5.2 Evaluation of the resource For defining the wind energy resource were used the models embedded in the following
websites: – www.meteonorm.com; – NASA – Database on meteorology and solar energy –
www.eosweb.larc.nasa.gov/cgi-bin/sse/grid.cgi
2.5.3 Evaluation of the potential Tables with the wind potential in the country are provided in Annex 6.

Assessment of the Renewable Energy Sources Potential in the Cross-Border Region Bulgaria-FYROM by Components
Executive Summary
Page 23 of 44
In Bulgaria there is existing potential for construction of wind farms in the coastal line and in the areas above 1000 m a.s.l. The future development in suitable mountain areas and such with lower wind speeds depends on the implementation of new technical solutions.
The operation of the turbine depends on the speed and turbulence of the wind, the height of the tower and density of the air, therefore it is important to know the potential in the area of the country selected for installation, as well as the conditions in which it was established.
There are 119 meteorological stations in Bulgaria, which register the speed and direction of the wind. There are data for a period of more than 30 years.
As a whole, the wind energy potential of Bulgaria is not big. The assessments are that an area of 1400 km2 have an average annual wind speed over 6,5 m/s, which is actually the threshold of economic viability for a wind energy project.
The accessible energy potential of the wind energy is defined after taking into account of the following main factors:
- highly difficult construction and operation of wind facilities in urbanized territories, reserves, military bases and other specific territories;
- uneven distribution of wind energy resource during the separate seasons of the year; - physic-geographic peculiarities of the country's territory; - technical requirements for installation of wind generator facilities.
The main shortcoming is also the peak energy production from wind generators is around 4 o'clock in the morning when the consumption is the smallest.
The reduction of the air density with the altitude requires the increase of the average wind speed by about 3% per 1000 m in order to define the same energy density.
The criteria on the basis of which assessment of the wind energy potential is made, are its direction and annual average speed. For this purpose, data from project BG 9307-03-01-L001, ""Technical and Economical Assessment of RES in Bulgaria" under the PHARE Programme, 1997, obtained by the Institute of Meteorology and Hydrology at BAS (119 meteorological stations in Bulgaria, recording wind speed and direction). Data covers a period of more than 30 years and are of general character. On this basis, the division by regions of the country is made, based on the wind potential.
2.5.4 Technologies for utilization of the evaluated resource potential Since the areas are in proximity, the data of the two areas are summarized. Municipality of Belitsa is within an area of small wind energy potential. The characteristics
of this area are:
- Average wind speed - 6 ÷ 7 m / s; - Energy potential - 100 W/m2 (Less than 1450 kWh/m2 per year); - Average duration of the speed range ∑휏5 − 25푚/푠 in this area is about
1000 h, which represents about 12% of the number of hours over the year. Most turbines are designed to switch off at speeds above 25-30 m/s to avoid damage. More
powerful turbines switch on at wind speeds above 5 m/s. The spatial distribution of wind energy is based on lines and surfaces of same values of the
power stream density expressed in classes. At heights h = 50 m, wind stream density is twice as high than at a height of h = 10 m. At
the higher altitude wind speed increases by about 25% separately for each wind class. There are interesting variations in the wind parameters at other heights: 30 m and 80 m. It has been proven that the density of energy stream at a height of 80 m is slightly greater than at 50 m: by 10 ÷ 20%, while speed is also higher, but only 1 ÷ 6%. Values of these parameters at 30 m rank between those relating to 10 m and 50 m.
Assessment of the Renewable Energy Sources Potential in the Cross-Border Region Bulgaria-FYROM by Components
Executive Summary
Page 24 of 44
2.5.5 Forecast annual production of energy In choosing turbines, beside the wind speed, the diameter of the rotor is also taken into
consideration. Turbines of the Enercon and Vestas companies are given as an example: It is assumed that for the purposes of the calculation made, the speed is 5 m/s, while the
height of the tower for the gondola is minimum 70÷75 m.
Company Machine model Diameter of the rotor, m Power, kW Vestas V90-1,8/ 2,0 MW 90 95.42
V110- 2,0 MW 110 142.55 Enercon E-82 E2 / 2,000 kW 82 79.21
E-70 / 2,300 kW 71 59.38 At lower wind speed lower power wind generators will be more economical. On the basis of these data it can be concluded that the forecast annual energy production
from wind turbines is less than 1450 kWh/m2 per year.
2.6 ELECTRICAL CONNECTION OF NEW RES FACILITIES
Reviewing the construction of RES for production of electricity, inevitably we must examine the opportunities for connecting that capacity to the existing power grid or a certain electrical consumer. Accordingly, the voltage levels at which RES capacities are connected, are divided as follows:
LV - Low Voltage: 0,23/0,4 kV; MV - Medium Voltage 6 kV, 10 kV, 20 kV; HV - High Voltage: 110kV.
All three voltage levels are possible for connection of new RES capacities, where the choice is determined by:
The size of the connected capacity; The existing constructed power grid; The point of connection of the new capacity to the power grid, defined by the relevant
electrical company ("NEC" EAD or "CEZ Electro Bulgaria" AD).
The points for connection of the new RES capacities are defined following a research by the relevant electrical company ("NEC" EAD or "CEZ Electro Bulgaria" AD) concerning the possibility for connecting new RES capacities. The relevant company issues a statement indicating the location and possibility for connecting these capacities.
The possible connection points are:
The existing constructed power grid, at the relevant voltage levels; Existing constructed electrical substations MV/HV, junction stations MV/MV and
substations MV/LV.
the manners of connecting new RES capacities are defined after clarification of the exact place for their connection. The possible connection methods are:
Construction of new power lines (cables or aerial) at the relevant voltage levels, for connection to the existing constructed power grid;
Construction of the necessary new facilities in the existing power grid, in order to carry out the connection;
Reconstruction of the existing electrical installations in the MV/HV substations, junction stations MV/MV and substations MV/LV, defined as connection points.

Assessment of the Renewable Energy Sources Potential in the Cross-Border Region Bulgaria-FYROM by Components
Executive Summary
Page 25 of 44
Construction of the necessary new electrical facilities within the limits (territory) of the new RES capacities, in order to implement the electrical connection.
3 ZRNOVCI MUNICIPALITY
3.1 General description
Zrnovci municipality is one of the smaller municipalities in the eastern part of the Former Yugoslav Republic of Macedonia with a territory of 55,82 km2 and a population of 3 112 inhabitants according to the state statistics data as of 2012. It is situated along the cross-border highway connecting Skopje-Veles-Shtip-Kochani-Delchevo with the Republic of Bulgaria. Zrnovci village is the administrative center of the municipality. Being mainly agricultural area, Zrnovci is one of the least environmentally polluted. It is located in the skirts of Plachkovica Mountain, i.e. in the zone of the Serbian-Macedonian massif or the “old” Rhodope mountain.
It is 8 km away from the closest railway in the town of Kochani, 134 km from the capital Skopje, 118 km from the international airport Alexander the Great (near Skopje) and 60 km from the border crossing point Delchevo-Bulgaria.
Location of the municipality in FYROMacedonia

Assessment of the Renewable Energy Sources Potential in the Cross-Border Region Bulgaria-FYROM by Components
Executive Summary
Page 26 of 44
Borders of Zrnovci Municipality
The largest village Zrnovtsi, which is the center of the municipality is located in the eastern
part of Macedonia at an altitude of 345 m, in the Kochani valley, just at the foot of Plachkovitsa mountain on an area of 2 848 decars. Zrnovtsi is protected from the strong northern winds by the Ossogovska mountain, and from the strong air intrusions from south by the Plachkovitsa mountain. Out of the whole territory of Zrnovtsi 57% is forests and 32% is agricultural land. The majority of the arable land are rice fields.
Water resources
Water supply system of Zrnovci municipality
A water supply system was built to supply settlements in Zrnovtsi municipality that consists of a pressure pipeline connected to a penstock drawing water from a water tower, water treatment plant, mechanical filters located on the right-hand slope, as well as a feeding pipeline to a tank (P1) supplying the village and connected to tanks P2 and P3 supplying the other settlements in the municipality. Water supply system is designed with capacity of 21 l/s.
3.2 ENERGY FROM WATER SOURCES
3.2.1 Assessment of the area The information about the conditions of the area was taken from the topographic maps, as
well as from the field trips for informing about the area conditions, geology, access roads,

Assessment of the Renewable Energy Sources Potential in the Cross-Border Region Bulgaria-FYROM by Components
Executive Summary
Page 27 of 44
opportunities for connecting to the electrical network, etc. Satellite data about the environment are also a proven valuable source of information.
Different mapping materials have been used for the purpose of preliminary assessment of the potential for production of electricity from water sources in Zrnovci Municipality, namely:
Topographic maps of Zrnovci, in scale 1:50 000 Topographic maps of Zrnovci, in scale 1:25 000 Satellite images from Google Earth On-the-spot visits have been made to all potentially usable areas for production of
electricity from water sources in Zrnovci Municipality. In Annex 1 (Map 2) is given a map of Zrnovci Municipality.
Geographic coordinates
The exact geographic coordinates of the area are: SHPP Zrnovci-2: N 41°51’05”; Е 22°27’05”
3.2.2 Evaluation of the resource Several rivers run through the municipality, with the largest being Zrnovska river running
through the village of Zrnovtsi. The watershed of the river is 38 km2, and its length is 24 km. There is a HPP constructed on the river. Other major rivers on the territory of the municipality are Moroshka river passing through the village Morodvis with 7 km2 watershed and length of 6 km and Vidovishka river passing through the village Vidovishte with 5 km2 watershed and length of 6 km.
Water Supply Systems A water supply system was built to supply settlements in Zrnovtsi municipality that
consists of a pressure pipeline connected to a penstock drawing water from a water tower, water treatment plant, mechanical filters located on the right-hand slope, as well as a feeding pipeline to a tank (P1) supplying the village and connected to tanks P2 and P3 supplying the other settlements in the municipality. Water supply system is designed with capacity of 21 l/s.
Description of hydrological regime of rivers Basic hydrological parameters have been determined based on observations in the period
1961 ÷ 2000.
Zrnovska river
Orohydrographical characteristics Zrnovska river is a left tributary to Bregalnitsa river. It sources from the mountain tops of
Plachkovitsa mountain at an altitude of over 1700 m. The total watershed area is 70 km2, stretching from the tallest peak Lisets to the inflow to Bregalnitsa river at elevation 325.0 m. The length of the river is 22 km, the average altitude of the watershed is 1160 m, and the river has an average incline of J=0.255%. The larger left tributaries of Zrnovska river are Boshalichka, Yaskamska, Eden dere, Kukushnitsa rivers, and of the right ones the largest is the Lisechka river.
Basic hydrological characteristics
Table 5. Basic hydrological parameters of Zrnovska river
Month I II III IV V VI VII VIII IX X XI XII Qav.an. (m3/s) Qmin 0.093 0.062 0.062 0.227 0.161 0.085 0.046 0.054 0.054 0.062 0.085 0.101 0.046 Qav 1.108 1.397 1.357 1.509 1.151 0.717 0.405 0.272 0.231 0.377 0.596 0.91 0.836

Assessment of the Renewable Energy Sources Potential in the Cross-Border Region Bulgaria-FYROM by Components
Executive Summary
Page 28 of 44
Qmax 13.16 36.01 19.55 7.71 12.2 12.78 27.01 14.04 8.38 13.16 13.75 18.88 36.01
3.2.3 Evaluation of the potential The potential for construction of a small HPP is defined by the water quantity at the water
intake and the location of the power plant on the river course. The height difference between the two spots is defined as Hydraulic (gross) pressure (Hgr).
The evaluation of the potential of a small HPP depends on the following factors:
The serious variations in the natural debit of the water according to season, as well as the dry and wet periods of hydrological years. These specific characteristics are of particular importance concerning small fluxes.
Types of hydro turbines. The types of hydro turbines are selected according to a specific range of the nominal hydraulic (net) pressure and nominal debit. Each has a different range of operation, different effectiveness, whose maximum depends on the nominal power of the turbine, the different sizes and price.
The water sources are with depleted potential, since there are hydro power plant constructed on them. The parts of the rivers free from construction have practically zero potential for production of electrical power. On the Zrnovska river was built “Zrnovtsi” HPP in 1950 and reconstructed in 2009 and is still in operation. The plant is of derivation type. It was built just above the village of Zrnovtsi.
Basic parameters of Zrnovtsi HPP
Pressure: 220 m Water quantity for turbine: 1 m3/s Power: 2x630 kW Annual electricity production: 5 500 000 kWh 3 more HPP are foreseen to be constructed on Zrnovska river, thus depleting its potential
for production of electrical energy. Based on the available technical information and the examinations done on the spot, an
area for construction of HPP in Zrnovtsi municipality has been selected, using the existing water mains.
The theoretical energy potential of a certain section of a hydraulic stream is the quantity of potential energy of the water stream for one year, defined by the complete fall and the average multiannual flux of the reviewed section.
The use of hydraulic power is a combination of activities for transformation of the latter into electrical power, which takes place by means of hydro power plants.
The working principle in production of power from water is to turn the potential energy of the water stream in the reviewed section into electrical power by creating artificially or naturally a concentrated height difference between two water levels - called a fall (pressure) and concentration of the water quantity.
Essentially, the fast-flowing water is not sufficient for conclusive production, except in large power plants in the seas and oceans where streams are used. Therefore, two parameters are accounted for: water quantity (Q) and total pressure (H).
The total pressure (H) is the maximum possible height of waterfall from the upper stream level down to the lower stream level. The real height, however, would be a little less than the total, due to losses.
The water quantity (Q) in the river is the volume of water transferred through a certain section per second, measured in m3/s.
The theoretical energy potential of the selected stream is defined by the formula:

Assessment of the Renewable Energy Sources Potential in the Cross-Border Region Bulgaria-FYROM by Components
Executive Summary
Page 29 of 44
P = ρ.g. Q. H where:
P - average power of the water stream (W); ρ - water density (1000 kg/m3); g - Earth's acceleration (9.81 m/s2); Q - the average water quantity which flows through the reviewed section for a certain
period of time (m3/s); H - total pressure. For the reviewed section the theoretical potential for construction of a HPP is: P = 1000.9,81. Qз. Hgr m = 1000.9,81.0,021.80≈16 480 W=16.5 kW, where:
Qз – Constructed water quantity - the water quantity with which the power plant will be working.
Hgr - the gross pressure of the power plant (not accounting for losses) The technological energy potential of a certain section of a hydraulic stream is the quantity
of potential energy of the water stream for one year, defined by the net fall (accounting for pressure losses along the route from water intake to the power plant) and the average multiannual flux of the reviewed section.
The technological energy potential of the selected stream is defined by the formula: P = c. Q. Hn where:
P - average power of the water stream (kW); c – η.g – c≈8÷8,2 for HPP with power less than 5000 kW η - overall quotient accounting for efficiency of energy equipment; ρ - water density (1000 kg/m3); g - Earth's acceleration (9.81 m/s2); Q - the average water quantity which flows through the reviewed section for a certain
period of time (m3/s); Hn - net pressure (Hn = Hn-hloss); hloss - pressure losses from water intake to HPP. For the reviewed section the theoretical potential for construction of a HPP is: P = 8. Qз. Hn m = 8.0,021.80=13.4 kW
3.2.4 Technologies for utilization of the evaluated resource potential The main element in a small HPP is the hydro turbine. The turbines transform energy from
water pressure into torque, but under different circumstances different types of turbines are used. The selection is made according to the characteristics of the spot, the height and volume of the water quantity, the desired rotation speed of the generator and whether the turbine is expected to also work at slower water speeds.
There are two main types of turbines in existence - active and reactive. The active type transforms the potential energy of the water into kinetic energy by a stream of water coming from a nozzle and actuation the turbine's propellers. The reactive type, in turn, uses the pressure of the water, as well as its speed, to create power. The working wheel is entirely submerged and thus both pressure and speed are reduced when exiting the turbine. In the opposite case with the active turbine the propellers are actuated by a stream and are in the air.
The most common may be grouped into three categories:
Kaplan and propeller turbines; Francis turbines;

Assessment of the Renewable Energy Sources Potential in the Cross-Border Region Bulgaria-FYROM by Components
Executive Summary
Page 30 of 44
Pelton and other active turbines. Kaplan and propeller turbines are axial reactive turbines, usually used for small pressures
(usually under 16 m). Francis turbines are reactive turbines with radial stream, with fixed blades and adjustable
angle, which are used for average heights of water pressure. Pelton turbines are impulse turbines with one or more streams. Each stream passes through
a nozzle with a needle valve for stream control. Used for average and high waterfalls. For the reviewed section for production of electrical power from RES in Zrnovtsi
municipality, and with a view of the main parameters, with which the power plant (Q=0.021 m3/s and H=80 m), the use of a Pelton-type turbine is assumed.
HPPs have small operational and maintenance costs. Their lifecycle is very long and they are extremely reliable from an operational point of view, therefore, this is a secure and well-tested technology. Furthermore, small and mini HPPs have a higher return on investment due to their small investment capital and operational costs for maintenance. They a re easier to construct and commission, due to the simplified design, thus keeping the costs low.
The selected turbine will provide high power production and maximum reliability during operation. It ahs high efficiency even when working with 20% of the constructed water quantity. The technology is very well-known and has proven its qualities worldwide.
The return on investment period for such a project may be defined after a detailed feasibility study containing the necessary data. In most cases this period is within the guaranteed period for buying out the electrical power (7÷9 years).
"Zrnovtsi 2" Small Hydro Power Plant is being designed to cover electricity consumed by street lighting, the school and municipal buildings.
It will be built on the existing pipeline that draws water from the water tower and brings it to the Treatment plant. The pipeline has a diameter of 225 mm. Annex 2 (Drawings 3, 4 and 5) shows the location of existing and future facilities.
The new plant "Zrnovtsi 2" will be located immediately by the TP, south of it. The existing site is relatively flat and is located 20 m from the building of the TP. Elevation ± 0 00 of the turbine is 2 ÷ 3 m above the TP itself.
3.2.5 Forecast annual production of energy The main parameters of the new plant are:
Pressure: 80 m Maximum amount of water - 21 l/s Turbine - Pelton Maximum power - 13,4 kW Average annual power production - 80 000 kWh Maximum annual electricity production - 116 640 kWh
3.3 ЕNERGY FROM BIOMASS
3.3.1 Assessment of the area The total area of the municipality is 51 764 ha, split as follows: 28 483 ha is Zrnovtsi
village, 14 522 ha is Morodvis village; 8759 ha is Vidovishte village. Forests cover 3034 ha. Total arable land is 1 692 ha. Main crops are: Maize - sown area of 300 ha, yield 7000 kg/ha; Wheat - sown area of 90 ha, yield 2000 kg/ha; Rice - sown area of 90 ha, yield 5000 kg/ha.

Assessment of the Renewable Energy Sources Potential in the Cross-Border Region Bulgaria-FYROM by Components
Executive Summary
Page 31 of 44
Horticultural crops are grown of which mainly peppers, leek and pink tomatoes. Fruit-growing and viticulture are underdeveloped with production meant for own consumption of the population. Plums, peaches, cherries and pears are grown.
Animal breeding is less developed, split by villages as follows: 1. Morodvis village:
Cows – 700 heads; Sheep – 400 heads; Horses – 20 heads ; Pigs – 150 heads; Goats – 20 heads.
2. Vidovishte village: Cows – 180 heads; Sheep – 1050 heads; Horses – 10 heads ; Pigs – 200 heads; Goats – 300 heads.
3. Zrnovtsi village: Cows – 700 heads; Sheep – 30 heads; Horses – 40 heads ; Pigs – 750 heads; Goats – 600 heads.
There are one large and two smaller companies for wood processing in the municipality, with a capacity of up to 150 m3 of beams and planks.
According to Zrnovtsi Municipality data biomass is collected annually from waste products from agriculture, animal breeding and wood processing, split in quantities as follows:
Sawdust after treatment of wood - about 1800 kg; Pieces of wood - about 450 kg; Straw - 1000 kg/ha, in total 390 000 kg; Corn stalks - 1500 kg/ha, a total of 300 000 kg; Stem and foliage after harvesting of tomatoes and other vegetables - 6800 kg total; Waste of vines - 2500 kg; Out of wood and vines waste material pellets can be produced whose energy value does not
exceed 20 000 kWh per year. Production of pellets or briquettes will have primarily environmental effect in view of utilization of this waste.
In defining the areas for construction of plants for biomass utilization distances between the potential equipment and the biomass source were taken into account in view of minimizing transportation costs and procedures for connection. For the possible sources for utilization of biomass, in particular biogas, cogeneration installation is suggested. Essentially these are internal combustion engines powered by biogas where heat and electricity are obtained as a final product. The advantages of these systems are high efficiency of utilization of primary energy and their capacity to produce electricity that could be sold at preferential prices under the current EU legislation. Due to these peculiarities, cogeneration with inner combustion engines is also commonly used in landfills, wastewater treatment plants and farms.
We suggest following potential areas for: – Cogenerator fuelled by biogas produced from manure collected in the three villages in the
municipality. It is necessary to construct the necessary connection of the biogas production facilities to the electric network, as well as connection to the heating network of municipal

Assessment of the Renewable Energy Sources Potential in the Cross-Border Region Bulgaria-FYROM by Components
Executive Summary
Page 32 of 44
buildings. The heat distribution network may have to be reconstructed with a view of the fact that the heat source - hot water for domestic purposes will be one - the cogenerator facility. The existing ways for hot water supply, if any, will remain and will be used to cover peak heat loads during the winter period. Electricity could be sold or used to cover the own needs of the municipal buildings. Depending on the intended designation of the heat and energy produced, the specific location can either be in immediate proximity to farms or close to consumers, provided that in the latter case collection and disposal of manure is organized.
– Cogenerator fuelled by biogas produced from sewage sludge collected in the WWTP after its construction is finished. The construction site of this cogeneration installation will be next to the future treatment plant. Relevant facilities for biogas production need to be constructed. The point of connection of the cogenerator to the electricity distribution network will determine the possible additional investment in electrical cables and construction of the necessary heating pipeline.
– Installations for the production of biodiesel from rapeseed and paulownia. There are no specific requirements in terms of location of the plant for biodiesel. Location of such a plant can be chosen based on the specific conditions in the municipality (ownership of land, proximity to infrastructure, etc.), as well as the access to raw materials.
3.3.2 Evaluation of the resource Evaluation of the resource was made on the basis of the existing opportunities and the
availability of biomass in the municipality. Thus, several main raw materials for energy production have been defined - rapeseed and paulownia for biodiesel, sawdust and straw for heating, manure and sludge from the wastewater treatment plant for biogas.
3.3.3 Evaluation of the potential Rapeseed and paulownia for production of biodiesel:
For the production of industrial biomass like rapeseed, paulownia and others, the municipality has at its disposal an area of 65 ha.
For sowing of rapeseed in Zrnovci municipality an area of 15 ha has been allocated. It should produce circa 6 315 kg of oil, i.е. 66 310 kWh/g energy.
For sowing of paulownia 50 ha has been allocated. Quantity of expected yield may vary per hectare and it depends on several factors. The first
factor is the choice of plant variety, location, weather conditions, supplementary irrigation and all other factors normally affecting traditional crops. Expected yields of paulownia can vary in the range 30-40 dt / ha/year or up to 80 dt / ha with two-year rotation cycle.
Measured in energy units, dry weight paulownia has an energy content of about 18 MJ per kilo or 42% of the energy contained in an equivalent volume of light fuel. This sets the yield from ha per year as an equivalent to 12,000 ÷ 17,000 liters of fuel from ha. The financial effect can easily be calculated.
The 50 ha of land set for growing of paulownia will yield 850,000 liters of fuel per year, or energy amounting to 8.925 million kWh per year.
The theoretical potential is 89 000 MWh/year, while the technical potential is 8925 MWh / year.
Sludge from wastewater treatment plant for the production of biogas: Upon visiting the municipality of Zrnovtsi it became clear that there is an ongoing project for
treatment plant for wastewater in the municipality. In executing this project, out of the sludge from the treatment plant approx. 390 000 m3 of biogas could be produced, which is about 2 535 000 kWh per year. This determines the power of a boiler or a cogenerator at 300 kW with annual work load of about 8000 hours.
Assessment of the Renewable Energy Sources Potential in the Cross-Border Region Bulgaria-FYROM by Components
Executive Summary
Page 33 of 44
The theoretical potential is 25 000 MWh / year, while technical potential is 2535 MWh/year
Straw and manure for biogas production: The total possible production of biogas from manure on the farms of the municipality is
about 190 m3/h or 1 200 kW. Straw has an energy value of about 23 000 kWh per year. Since it is used for animal bedding it should be used in conjunction with manure for biogas production. Energy value of the produced biogas is estimated at around 2,847,000 kWh per year. This would ensure the operation of a boiler or a cogenerator with a power of 350 kW for 8000 hours work load on annual basis. The risk lies in the organization of delivering manure to the biogas production plant.
Stalks of corn are used for silage. If there are any silage leftovers they can be used for biogas production. The effect would only be environmental.
Stems and foliage of tomatoes and other vegetables could contribute to the production of biogas by about 600 m3 per year, which would also be only an environmental effect.
Technological potential is about 2847 MWh per year, and theoretical is about 30 000 MWh per year.
The lower part of the range of calorific value of biogas depends on the content of methane (50% ÷ 70%) and is in the range of 6 ÷ 8 kWh/m3.
If residues of crops are measured after the harvest an additional quantity of the produced biogas can be determined, whereas the extraction of biogas from tonne of organic dry matter is:
Fresh alfalfa 350 m3 Grass 550 m3 Straw 340 m3 Tree leaves 250m3 Corn stalks 420 m3 Dairy waste 630 m3 Sewage waters 600 m3
3.3.4 Technologies for utilization of the evaluated resource potential
Production of biogas
For the production of biogas in the municipality a bioreactor needs to be built on a previously researched and approved site, near sources of organic waste. A major problem is that consistency in the collection and production of manure from individual farms in Zrnovci municipality needs to be ensured. Disposal should be done regularly and in an organized manner.
– Out of one ton of manure from cattle between 200 ÷ 350 m3 of biogas are obtained with a methane content of 60%;
– Out of one ton of plants 300 ÷ 630 m3 of biogas are obtained with a methane content up to 70%;
Biodiesel production
For the production of biodiesel in the municipality a refinery for biodiesel must be built at a previously researched, approved and coordinated location, with the relevant infrastructure. The main point which should be accounted for is the negotiation of regular supply of raw materials.
3.3.5 Forecast annual production of energy The forecast annual quantities of energy are equal to the technological potential, on the
condition that the requirements and particulars of production are observed:

Assessment of the Renewable Energy Sources Potential in the Cross-Border Region Bulgaria-FYROM by Components
Executive Summary
Page 34 of 44
For biogas from the wastewater treatment plant - 2 535 MWh/year; For straw - 23 MWh/year; For biodiesel - 8 925 MWh/year;
3.4 SOLAR ENERGY
3.4.1 Assessment of the area The considered sites concern flat areas, as mountainous terrains would encumber the
project and make it more expensive.
Area 1
Area 1 is provisionally named Zrnovci 1, in the area of Zrnovci village.
Geographic coordinates
The exact coordinates of the area are shown below, as well as satellite images and photos. N 41°51’17.11” E 22°25’49.64” Altitude - 370 ÷ 375 m. The distance from the area to the center of Zrnovtsi village is about 2 km, immediately on
the main road connecting the village with other settlements in the municipality; from the capital Skopje distance is 125 km.
The place is dominated by low vegetation, as evidenced by the attached photos.

Assessment of the Renewable Energy Sources Potential in the Cross-Border Region Bulgaria-FYROM by Components
Executive Summary
Page 35 of 44
The area is chosen so that it is accessible for installation and operation. It is close to an
asphalt or passable road, with opportunity to facilitate the work of machines. No danger of damming, swamping and fogging.
There is no danger of shading either, as the horizon is clear both to the east and the west. The soil is firm and able to bear concrete foundations on the surface or in non-freezing
depth. In the preliminary survey no signs of shallow underground rocks were found, which makes installation of constructions on pile-driven steel poles or screws possible.
Exact conditions of installation will be clear after a detailed geological survey of the soil.
Area 2
Area 2 is provisionally named Vidovishte (because of its proximity to Vidovishte village), for easier identification on the pictures and in the calculations done.
Geographic coordinates The exact coordinates of the area are shown below, as well as satellite images and photos. N 41°51’5.11” E 22°23’15.36” Altitude - 330 m. Ventilated area, which will provide better cooling of the modules at
higher temperatures of the environment during the summer months. The distance from the area to the center of Vidovishte village is about 2 km, distance from
capital Skopje is 100 km, it is near the asphalt road connecting the settlements in the municipality. The place is dominated by low vegetation, as evidenced by the attached photos.

Assessment of the Renewable Energy Sources Potential in the Cross-Border Region Bulgaria-FYROM by Components
Executive Summary
Page 36 of 44
The area is chosen so that it is accessible for installation and operation. It is close to an
asphalt road to facilitate the work of machines. Large leveling or removal of earth are not required. It is located close to Bregalnitsa river which could be a prerequisite for the formation of fog, thus power productivity might be reduced.
There is no danger of shading because the horizon is relatively clear to the east and west. In the preliminary survey no signs of shallow underground rocks were found, which
makes installation of constructions on pile-driven steel poles or screws possible. Exact conditions of installation will be clear after a detailed geological survey of the soil.
3.4.2 Evaluation of the resource For defining the solar energy resource were used the models embedded in the following
websites, as well as licensed analysis software: Photovoltaic Geographical Information System (PVGIS) –
www.re.jrc.ec.europa.eu/pvgis/ - updated version PVGIS- CMSAF (data on the period from 2006 to 2010 is included)
METEONORM – Global database on solar radiation; www.meteonorm.com; NASA – Database on meteorology and solar energy –
www.eosweb.larc.nasa.gov/cgi-bin/sse/grid.cgi PVSyst V5.20 – Computer program for research/study, measuring, simulations and
analysis of data of entire photovoltaic systems.
3.4.3 Evaluation of the potential The electrical energy generated by the photovoltaic installation will be fed to the electrical
transfer grid. Macedonia as a whole is rich in solar resources, but it is unevenly distributed on its territory, and the quality of solar radiation is different.

Assessment of the Renewable Energy Sources Potential in the Cross-Border Region Bulgaria-FYROM by Components
Executive Summary
Page 37 of 44
This necessitates the carrying out of a solar energy audit evaluating the solar radiation as a resource for production of electrical energy.
Potential of the solar radiation for horizontally-mounted modules

Assessment of the Renewable Energy Sources Potential in the Cross-Border Region Bulgaria-FYROM by Components
Executive Summary
Page 38 of 44
Potential of the solar radiation for optimal incline of the modules
The annexes above show that the reviewed municipality has relatively low values -
between 1125 and 1500 kWh/m2. Production of energy by the photovoltaic power plant is directly influenced by the
geographical position of the site, the daily dose of radiation reaching it and the index of transparency.
Solar energy is the energy that reaches a unit of surface for a unit of time. Measurement unit is kWh/m2 per day.
Index of transparency of the air reflects the solar radiation reaching the Earth surface from the atmosphere which has a value of between 0 and 1.
High index of transparency means that the air has a high level of cleanliness and there are no obstacles for the solar radiation.
Geographical latitude of the site defines the amount of solar radiation and impacts the measuring of strings of the photovoltaic system.
The considered sites concern flat areas, as mountainous terrains would encumber the project and make it more expensive.
The theoretical data and calculations of the solar radiation and the data of its distribution for a static metal construction and such with a tracking system for Area 1 and Area 2 are provided in Annex 7.
3.4.4 Technologies for utilization of the evaluated resource potential The used technologies are provided in Annex 8.

Assessment of the Renewable Energy Sources Potential in the Cross-Border Region Bulgaria-FYROM by Components
Executive Summary
Page 39 of 44
3.4.5 Forecast annual production of energy Based on the results obtained and the recommended technology, the economic forecasts
envisage the following average annual production: For Area 1:
Technology PVGIS-CMSAF
Crystal 1720 kWh/kWp
Losses registered in the system for 1kW: - Temperature losses: - Losses from reflections: - Losses in cables, invertors, transformers
etc.:
8.6% 2.8% 10%
Thin-ply 1720 kWh/kWp
Losses registered in the system for 1kW: - Temperature losses: - Losses from reflections: - Losses in cables, invertors, transformers
etc.:
1.0% 2.8% 10%
For Area 2:
3.5 WIND ENERGY
3.5.1 Assessment of the area Before a wind system is installed, the existence of sufficient potential for its operation
should be verified. Necessary information could be taken from statistical reports or own measurements of the indicators in the selected site could be done.
Locations selected for the installation of wind turbines have been picked according to the theoretical rationale of Bulgarian Academy of Science (return on investment at over 1 000 m above sea level and a certain wind speed), as well as based on their accessibility for transportation and installation of machinery.
Technology PVGIS-CMSAF
Crystal 1700 kWh/kWp
Losses registered in the system for 1kW:
- Temperature losses: - Losses from reflections: - Losses in cables, invertors, transformers
etc.:
9.2% 2.7% 10%
Thin-ply 1700 kWh/kWp
Losses registered in the system for 1kW:
- Temperature losses: - Losses from reflections: - Losses in cables, invertors, transformers
etc.:
0.9% 2.7% 10%

Assessment of the Renewable Energy Sources Potential in the Cross-Border Region Bulgaria-FYROM by Components
Executive Summary
Page 40 of 44
Area 1
(provisionally named WindGenerator1)
Geographic coordinates The exact coordinates of the field are shown below, as well as satellite images and photos. N 41°50’58.52” E 22°22’42.10” Altitude 352 m. The distance from the area to the center of Vidovishte village is about 2 km, distance from
capital Skopje is 100 km, it is near the asphalt road connecting the settlements in the municipality.
The selected location is easily accessible for installations and operation. It is close to a relatively passable asphalt road which facilitates the work of heavy machines.
The soil is firm and able to bear concrete foundations on the surface or in non-freezing depth.
Exact conditions of installation will be clear after a detailed geological survey of the soil.
Area 2
(provisionally named WindGenerator2)
Geographic coordinates
The exact coordinates of the field are shown below, as well as satellite images and photos. N 41°50’25.58” E 22°23’20.45” Altitude 550 m. The distance from the area to the center of Vidovishte village is about 2 km, distance from
capital Skopje is 100 km, it is near the asphalt road connecting the settlements in the municipality.

Assessment of the Renewable Energy Sources Potential in the Cross-Border Region Bulgaria-FYROM by Components
Executive Summary
Page 41 of 44
The selected location is easily accessible for installations and operation. It is close to a relatively passable asphalt road which facilitates the work of heavy machines.
The soil is firm and able to bear concrete foundations on the surface or in non-freezing depth.
Exact conditions of installation will be clear after a detailed geological survey of the soil.
3.5.2 Evaluation of the resource For defining the wind energy resource were used the models embedded in the following
websites:
– www.meteonorm.com; – NASA – Database on meteorology and solar energy –
www.eosweb.larc.nasa.gov/cgi-bin/sse/grid.cgi
3.5.3 Evaluation of the potential Wind and the energy produced thereof prove to be attractive for a several reasons - it is
abundant, cheap, practically inexhaustible source of energy; it does not lead to pollution and climatic anomalies. In short, it has qualities with which none of the traditional energy sources for production of electricity may boast about.
Operational expenditures or rather, the absence thereof, for purchasing fuels in production of energy, make the wind as an energy source, especially attractive for investments.
In Macedonia there is an existing potential for construction of wind parks in the plain areas and in placeas above 1000 meters. The future development in suitable mountain areas and such with lower wind speeds depends on the implementation of new technical solutions.
The operation of the turbine depends on the speed and turbulence of the wind, the height of the tower and density of the air, therefore it is important to know the potential in the area of the country selected for installation, as well as the conditions in which it was established.
The accessible energy potential of the wind energy is defined after taking into account of
the following main factors: - highly difficult construction and operation of wind facilities in urbanized territories,
reserves, military bases and other specific territories; - uneven distribution of wind energy resource during the separate seasons of the year; - physic-geographic peculiarities of the country's territory; - technical requirements for installation of wind generator facilities.
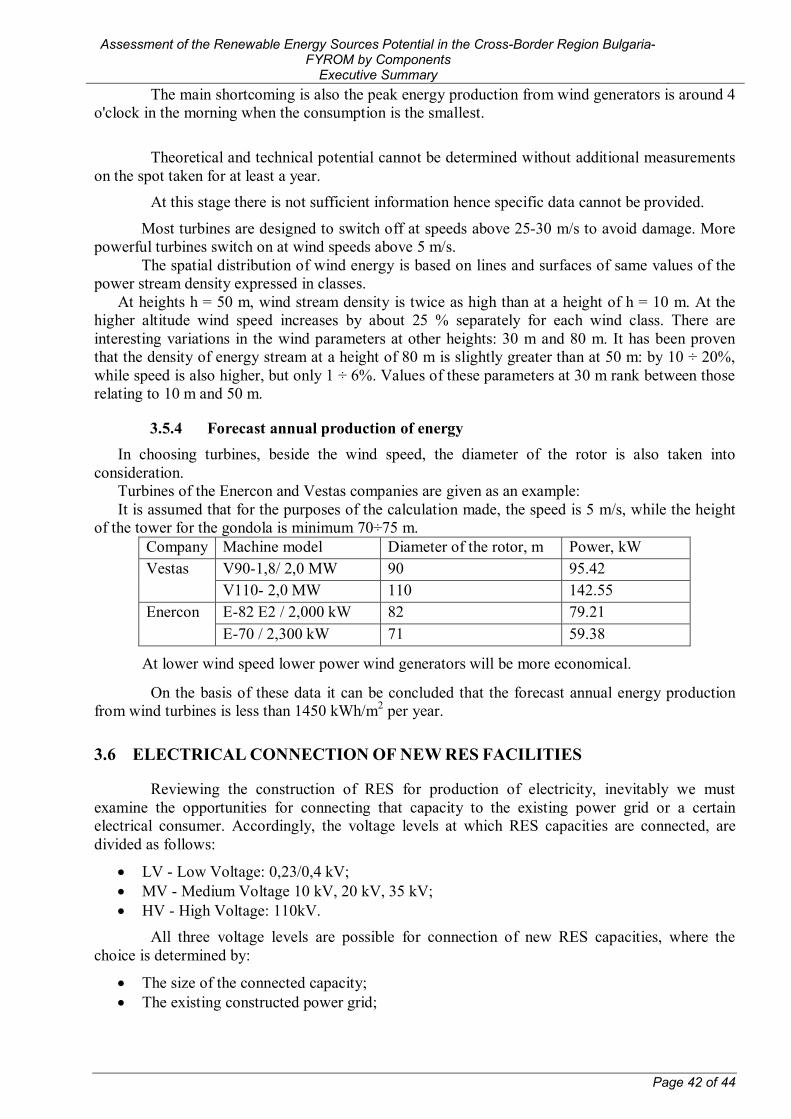
Assessment of the Renewable Energy Sources Potential in the Cross-Border Region Bulgaria-FYROM by Components
Executive Summary
Page 42 of 44
The main shortcoming is also the peak energy production from wind generators is around 4 o'clock in the morning when the consumption is the smallest.
Theoretical and technical potential cannot be determined without additional measurements
on the spot taken for at least a year. At this stage there is not sufficient information hence specific data cannot be provided.
Most turbines are designed to switch off at speeds above 25-30 m/s to avoid damage. More powerful turbines switch on at wind speeds above 5 m/s.
The spatial distribution of wind energy is based on lines and surfaces of same values of the power stream density expressed in classes.
At heights h = 50 m, wind stream density is twice as high than at a height of h = 10 m. At the higher altitude wind speed increases by about 25 % separately for each wind class. There are interesting variations in the wind parameters at other heights: 30 m and 80 m. It has been proven that the density of energy stream at a height of 80 m is slightly greater than at 50 m: by 10 ÷ 20%, while speed is also higher, but only 1 ÷ 6%. Values of these parameters at 30 m rank between those relating to 10 m and 50 m.
3.5.4 Forecast annual production of energy In choosing turbines, beside the wind speed, the diameter of the rotor is also taken into
consideration. Turbines of the Enercon and Vestas companies are given as an example: It is assumed that for the purposes of the calculation made, the speed is 5 m/s, while the height
of the tower for the gondola is minimum 70÷75 m. Company Machine model Diameter of the rotor, m Power, kW Vestas V90-1,8/ 2,0 MW 90 95.42
V110- 2,0 MW 110 142.55 Enercon E-82 E2 / 2,000 kW 82 79.21
E-70 / 2,300 kW 71 59.38
At lower wind speed lower power wind generators will be more economical.
On the basis of these data it can be concluded that the forecast annual energy production from wind turbines is less than 1450 kWh/m2 per year.
3.6 ELECTRICAL CONNECTION OF NEW RES FACILITIES
Reviewing the construction of RES for production of electricity, inevitably we must examine the opportunities for connecting that capacity to the existing power grid or a certain electrical consumer. Accordingly, the voltage levels at which RES capacities are connected, are divided as follows:
LV - Low Voltage: 0,23/0,4 kV; MV - Medium Voltage 10 kV, 20 kV, 35 kV; HV - High Voltage: 110kV.
All three voltage levels are possible for connection of new RES capacities, where the choice is determined by:
The size of the connected capacity; The existing constructed power grid;

Assessment of the Renewable Energy Sources Potential in the Cross-Border Region Bulgaria-FYROM by Components
Executive Summary
Page 43 of 44
The point of connection of the new capacity to the power grid, defined by the relevant electrical company ("MEPSO" AD or "EVN Makedonia" AD).
The points for connection of the new RES capacities are defined following a research by the relevant electrical company ("MEPSO" AD or "EVN Makedonia" AD) concerning the possibility for connecting new RES capacities. The relevant company issues a statement indicating the location and possibility for connecting these capacities.
The possible connection points are:
The existing constructed power grid, at the relevant voltage levels; Existing constructed electrical substations MV/HV, junction stations MV/MV and
substations MV/LV. the manners of connecting new RES capacities are defined after clarification of the exact
place for their connection. The possible connection methods are:
Construction of new power lines (cables or aerial) at the relevant voltage levels, for connection to the existing constructed power grid;
Construction of the necessary new facilities in the existing power grid, in order to carry out the connection;
Reconstruction of the existing electrical installations in the MV/HV substations, junction stations MV/MV and substations MV/LV, defined as connection points.
Construction of the necessary new electrical facilities within the limits (territory) of the new RES capacities, in order to implement the electrical connection.

Assessment of the Renewable Energy Sources Potential in the Cross-Border Region Bulgaria-FYROM by Components
Executive Summary
Page 44 of 44
4 REGULATORY BASELINE AND REFERENCES – Law on Energy from Renewable Sources – Rules on Applying the Law on Promotion of Investments – Law on Energetics – Law on Energy Efficiency – Decree № РД-16-558 от 08.05.2012 on collection and provision of information through the National Information System
about the potential, production and consumption of energy from renewable sources in Republic of Bulgaria – Directive on promotion of use of energy from renewable sources aimed at modification and following revocation of
Directives 2001/77/ЕU and 2003/30/ЕU – Photovoltaic Geographical Information System (PVGIS) – www.re.jrc.ec.europa.eu/pvgis/ - updated version PVGIS-
CMSAF (data on the period from 2006 to 2010 is included) – METEONORM – Global data basis on solar radiation – www.meteonorm.com – NASA – Database on meteorology and solar energy – www.eosweb.larc.nasa.gov/cgi-bin/sse/grid.cgi – PVSyst V5.20 – Computer program for research/study, measuring, simulations and analysis of data of entire
photovoltaic systems. – Directive 2009/38/EC on promotion of use of energy from renewable sources aimed at modification and following
revocation of Directives 2001/77/EU and 2003/30/EU. – Green Paper. European strategy for provision and supply of energy (COM (2000)769). – Biomass action plan (COM(2005) 628). – Еuropean strategy on bio fuels (СОМ(2006) 34). – Еnergy from renewable sources - guidelines, Renewable energies in 21st century : creation of sustainable future
СОМ(2006) 848). – Law on Energetics (″State Gazette of Republic of Macedonia″ issue 63/2006, 36/2007, 106/2008). – Rules on modes and procedures of establishing and approval of preferential rates of purchasing and sale of electrical
power produced by energy production facilities using biogas from biomass as a fuel (″Службен весник на Република Македонија″ бр. 142/2007).
– Rules on the Renewable Sources of Energy for Production of Electricity (″State Gazette of Republic of Macedonia″ issue 127/2008)
– Rules on issuance of warranties on the origin of electrical power produced from renewable energy sources (″State Gazette of Republic of Macedonia″ issue 127/2008) 127/2008).
– Rules on acquisition of status of preferential producer of electrical power from renewable energy sources (″State Gazette of Republic of Macedonia″ issue 29/2009). 29/2009).
– Agreement on Energy community. – Framework Convention of the United Nations on climatic changes from 1997. – Kioto Protocol of 2004. – Strategy for development of energetics in Republic of Macedonia in the period 2008-2020, with perspective till 2030,
Ministry of Economy of Republic of Macedonia. – Base study on renewable sources in Republic of Macedonia, МАНУ, 2010. – Strategy for energy efficiency of Republic of Macedonia till 2020, Ministry of Economy of Republic of Macedonia – Strategy for development in the period 2009-2013 of the East Planning Region