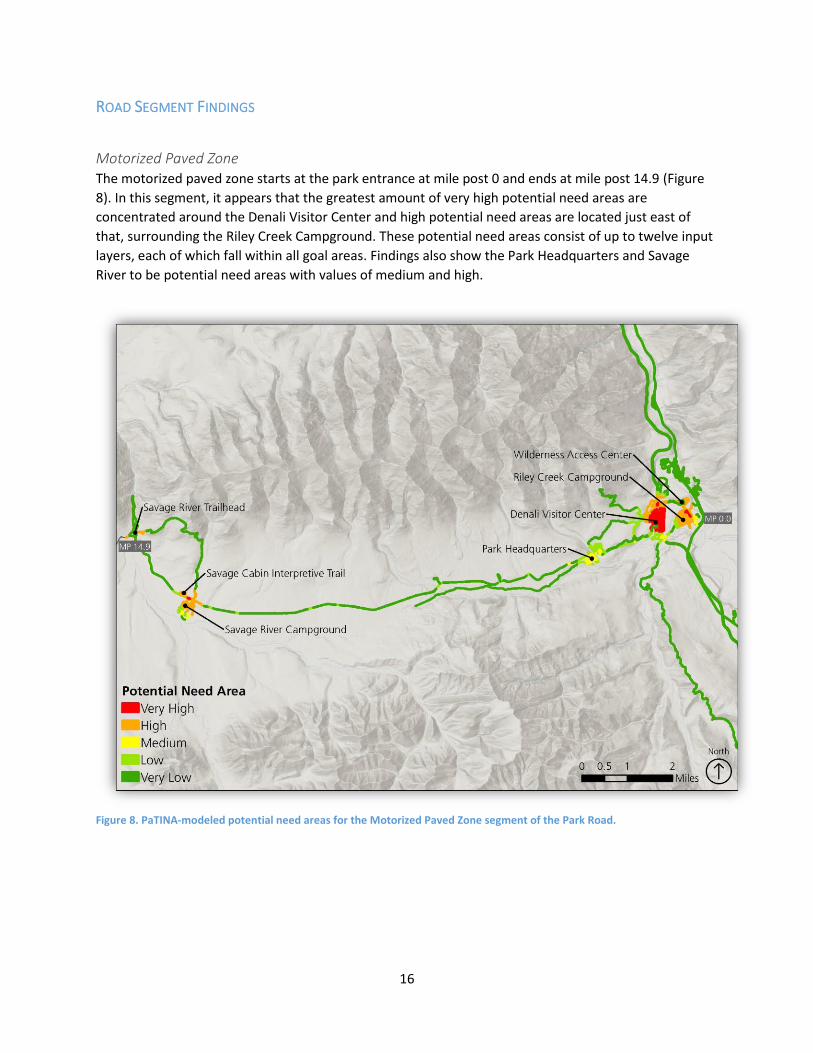
appendix a: literature review summary report
TRANSCRIPT

National Park Service US Department of the Interior
Denali National Park and Preserve Long-Range Transportation Plan
Appendix A Literature Review Summary Report
Denali National Park and Preserve Long Range Transportation Plan Existing Conditions Report
February 27 2015
1 Introduction
This baseline conditions report summarizes the findings of a literature review conducted as part of the
National Park Servicersquos (NPS) Denali National Park and Preserve (Denali NPampP) Long Range
Transportation Plan (LRTP) This review will be used as the foundation for the LRTPrsquos baseline conditions
chapter and consists of existing policies guidelines plans conditions and research related to the Denali
NPampPrsquos transportation system
The vision for the Denali NPampP LRTP reflects the values expressed in the Parkrsquos Foundation Statement
and input received from Park staff and decision makers This vision serves as the basis for the LRTPrsquos goals and objectives The LRTPrsquos vision is
Protect intact the globally significant Denali National Park and Preserve
ecosystems including their cultural aesthetic and wilderness values and ensure
appropriate access to opportunities for inspiration education research recreation
and subsistence for this and future generations
2 Literature Review Composition
The literature review included 16 documents as well as notes from preliminary meetings conducted as
part of the early stages of the LRTP process Documents included in the literature review are
bull Alaska Federal Lands Long Range Transportation Plan 2012
bull National Park Service Alaska Region Long Range Transportation Plan 2012
bull Denali National Park and Preserve Foundation Statement 2014
bull Alternative Funding Opportunities for National Park Service Transit 2014
bull Denali National Park and Preserve Bus Shuttle System Analysis 2013
bull Denali Park Road Visitor Survey 2010
bull Visitor Satisfaction with Transportation Services and Wildlife Viewing Opportunities in Denali
National Park and Preserve 1998
bull Proposed Entrance Station Report 2008
bull Needs Assessment amp Feasibility Study for a Community Transportation System 2006
bull Vehicle Management Plan (VMP) 2012
bull Denali National Park and Preserve Entrance Area Environmental Assessment 2001
bull Denali National Park and Preserve General Management Plan Consolidated 2008
bull Denali Community Transportation Study 2006
bull Denali National Park and Preserve Transportation Needs Assessment 2006
bull Denali National Park and Preserve Winter Plowing Environmental Assessment and Finding of No
Significance 2013
bull Air Tour Operators Best Practices 2012
21 Document Age
The majority of documents analyzed through the literature review were completed within the last 5 to 10
years Occasionally issues highlighted in older documents identify conditions or policies that have
changed and are represented as such in subsequent plans and studies These instances were tracked
through the literature review process This baseline conditions report omits conditions policies or other
conclusions that were made irrelevant by subsequent documentation
1
Denali National Park and Preserve Long Range Transportation Plan Existing Conditions Report
February 27 2015
22 Goal AreaObjective Frequency Distribution
The results of the literature review focused on 90 criteria related to six LRTP goal areas and 16 objectives
within those goals A complete list of goals objectives and criteria are included in Appendix A Each
Denali NPampP planning document was reviewed for instances of where the criteria were met The literature
review resulted in a total of 394 instances of planning documentation relating to goal areas from which to
conduct a baseline study
The chart below shows the distribution of responses among the LRTP goal areas and objectives The
most common topics relating to goals and objectives that appeared in the documents reviewed related to
mobility and user experience These topics make up a combined 64 percent of the responses relating to
goal areas System management accounted for another 18 percent The least frequent were resource
protection and climate change
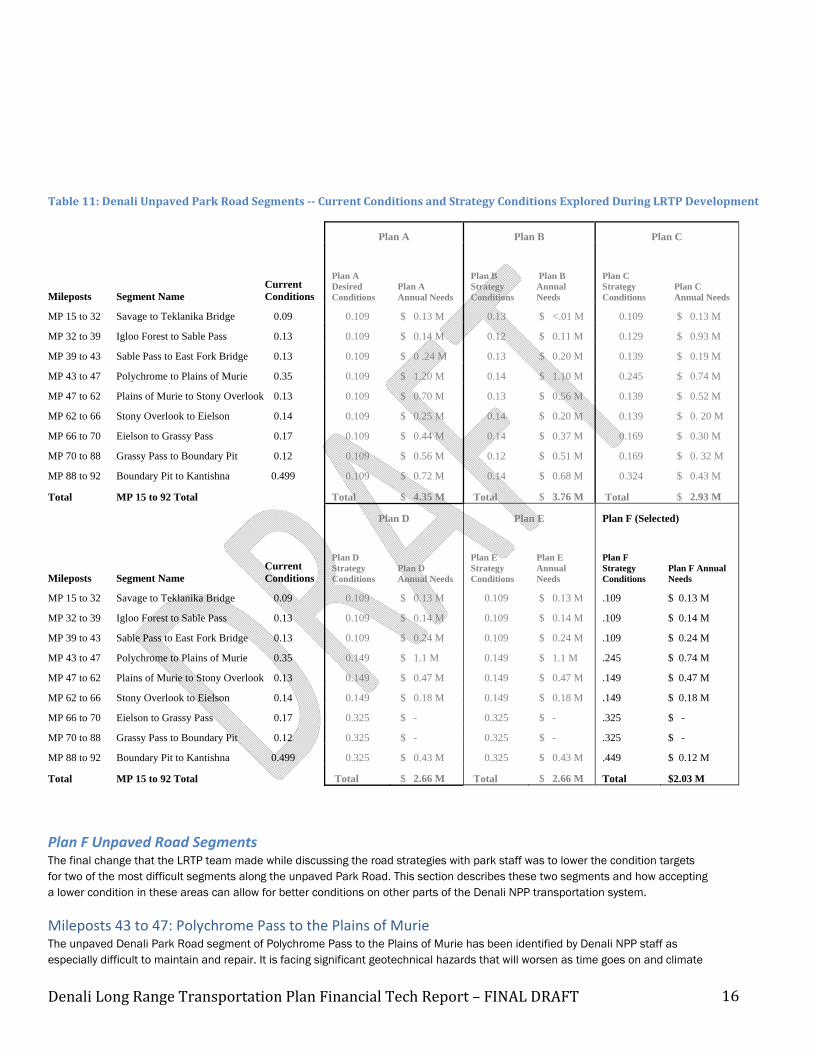
Figure 1 Literature review response frequency by goals and objectives
2
Denali National Park and Preserve Long Range Transportation Plan Existing Conditions Report
February 27 2015
3 Literature Review Results by Goals and Objectives
Literature review results are organized by goals and objectives
31 Resource Protection Goal
Protect Denali National Park and Preserversquos natural cultural and subsistence resources
Wilderness Character Objective Preserve wilderness character and consider cumulative impacts to
wilderness in transportation planning and policy development
The existing literature on the protection of wilderness as it relates Condition
to coordination with neighboring transportation agencies discusses Denali NPampP managers often
some activities that managers are engaging in to better manage engage in coordination efforts
wilderness within Denali NPampP with neighboring organizations
(state local and federal Although Denali NPampP managers currently works with state
agencies local tribal groups federal and local agencies on issues relating to wilderness
and tourism industry) as part of protection there is minimal documentation of these efforts in the
National Environmental Policy catalogue reviewed for this study Documents reviewed note
Act (NEPA) documentation but processes for coordination with other agencies in regards to
there is no formal working groupenvironmental impact statements and environmental assessments
or regular forum for ongoing and projects located on non-NPS owned transportation systems
coordination between Denali The reviewed documents do not indicate that there is an ongoing
NPampP and these groups formalized coordination process for reviewing wilderness protection
Increased coordination is as it relates to transportation impacts
desired
Other wilderness protection efforts include cooperative discussions
with air tour operators about measures to protect wilderness character and to minimize conflicts with land
activities
Transportation factors identified that influence Denali NPampP wilderness character primarily include
interaction between buses and wildlife specifically traffic volume timing and types of vehicle use on
Denali Park Road Impacts from these factors are addressed through the use of road standards gap
spacing nighttime traffic levels and monitoring conditions
3
Denali National Park and Preserve Long Range Transportation Plan Existing Conditions Report
February 27 2015
Natural Resources Objective Understand mitigate and protect wildlife and the physical environment
from adverse transportation system effects
Preservation of natural resources is a top priority for Denali NPampP Condition
Therefore management of visitor access is paramount in the Denali NPampP is home to
discussion of resource protection especially as it relates to populations of wolf caribou Dall
transportation In order to provide a natural environment that sheep grizzly bear moose and
includes largely intact ecosystems for the enjoyment of visitors the some of the most pristine
Park manages daily traffic along Denali Park Road as well as how it wilderness in the NPS system
provides access to backcountry travelers This objective is Environmental protection is the
promoted by continuance of the ldquono formal trails in the backcountryrdquo top priority of Denali NPampP in
policy (General Management Plan 2008) and new vehicle terms of appropriate and
management strategies as discussed in the VMP (2012) effective access and therefore
improvements to the There is increased awareness of the importance of monitoring transportation system are wildlife interactions with vehicles along Denali Park Road Indirect subject to strict environmental disturbances to wilderness include noise from motorized vehicles considerations including overflights fugitive dust obstructed viewsheds social
trails trampled vegetation near transportation hubs and increased signs of disturbance near
transportation hubs
Park staff also coordinate with land managers at other potential Denali NPampP access points specifically
addressing interest in development at the existing Stampede Road In the 2008 General Management
Plan Denali NPampP has noted considerations for wolf moose and caribou habitat in this area
Opportunities for new multimodal access to the south of the Park are also documented but no specific
resource considerations were documented in this area
The 2012 NPS Alaska Region LRTP made coordination with neighboring land and transportation
managers a regional objective for all units in the state The Alaska Federal Lands LRTP established an
ongoing transportation project coordination working group to address such concerns at a regional scale
There is no similar working group for Denali NPampP specific coordination
Cultural Resources Objective Mitigate negative impacts and provide appropriate access to cultural
resources
An inventory of historic properties was developed in 1983 and Condition again in 2000 These studies have led to ongoing protection of Historic sites are well cultural resources within the Park this is a specific objective
documented within Denali outlined in the 2012 VMP to protect and promote historic character
NPampP Denali Park Road itself is
considered an important cultural Several transportation related assets within the Park are
asset considered to be cultural resources The park headquarters district
and dog kennels have been added to the National Register along
with the Denali Park Road
The 2012 NPS Alaska Region LRTP cites the construction of new airstrips for backcountry access as a
threat to cultural resources These threats are of particular concern for cultural resources not only due to
the physical presence of the airstrips but because of the associated soundscape implications that
4
-
Denali National Park and Preserve Long Range Transportation Plan Existing Conditions Report
February 27 2015
additional air traffic may have With increasing popularity of Denali NPampP and limited vehicular access
aircraft facilities are key for accessing the backcountry now and in the future
Subsistence Resources Objective Consider impacts and access to subsistence resources in
transportation planning and policy development
Because subsistence access is authorized by Title VIII of ANILCA Condition most plans refer to the provisions set forth in the implementing Subsistence access is allowed regulations at 36 CFR 13460 Motorboat and snow machine under ANILCA Access rights for access is allowed for traditional subsistence activities in the ldquoOld traditional uses include Parkrdquo and off-road vehicle use is allowed on 5 trails near Cantwell traditional and modern (General Management Plan 2008) ANICLA does not supersede transportation modes the original legislation to create Mt McKinley National Park though Transportation impacts of these it adds authorization for private and commercial air travel through activities are not well permits and concessioner contracts documented
In the Old Park snowmobiling was officially closed to all users in the late 90s and early 2000s The Old
Park was also closed to hunting previous to the passage of ANILCA Planes are allowed in the Old
Park but only non-commercial as it is traditional and customary to pre-ANILCA
Transportation impacts of subsistence activities are not well documented but most plans refer to these
activities taking place
32 Climate Change Goal
Plan for climate change impacts to and from the Parkrsquos transportation system through science
adaptation mitigation and communication
Science Objective Initiate support and participate in scientific research and assessments needed to
understand and respond to relationship between transportation and climate change in Alaska
At this time participation in climate change science still only exists Condition
at the Alaska Region level in terms of climate action plans and Participation in climate change
regional LRTPs Regional plans include goals and objectives for science is mainly conducted at
addressing climate change science These include funding climate the regional NPS level
change research through the Transportation Research Board However regional support for
establishing partnerships to test green technologies and regional these activities has recently led
support for the Climate Friendly Parks certification The Alaska to support for unit level studies
Federal Lands LRTP also sets an objective of participating in at
least one climate change effort per year with documented results If
successful this could increase the amount of information available to Denali NPampP managers
The Alaska Region system has undergone studies to assess climate change scenarios at the unit level
These efforts may also lead to more unit-level planning for transportation assets that include climate
change considerations
5
Denali National Park and Preserve Long Range Transportation Plan Existing Conditions Report
February 27 2015
Adaptation Objective Manage transportation assets and conduct transportation planning for climate
change
Regional transportation planning objectives call for transportation Condition
system adaptation with regard to climate change Specific long-Currently there is limited
term climate change adaptation needs include identifying and transportation planning
prioritizing risk to NPS-owned and non-NPS owned transportation documentation in regards to
assets and systems likely to be affected by climate change and climate change adaptation
determine what management actions are needed and developing Regional planning objectives
adaptive management into LRTP updates as a means of assessing call for increased hazard risk
situations designing implementing monitoring evaluating and assessments for strategic
adjusting management decisions to account for climate change decision making
There is limited language addressing climate change adaptation in
plans specific to Denali NPampP
Mitigation Objective Reduce Denali National Park and Preserversquos carbon footprint by reducing
transportation related greenhouse gas emissions from Park operations and visitation
Denali NPampP is in the process of achieving a Climate Friendly Park Condition
(CFP) certification1 This program established by the NPS sets Denali NPampP is in the process of
performance standards for sustainability in support of NPS goals becoming CFP certified Climate
for reducing greenhouse gas emissions through energy change mitigation activities
conservation and reduction in energy use recycling composting include reduction in energy use
technology upgrades and other actions The NPS Alaska Region and encouraging Park
has a goal of becoming a climate friendly region by 2030 which employees to carpool by
targets expanding regional participation in the Climate Friendly providing carpool vehicles
Parks program and increasing climate related data collection
Some specific climate change mitigation activities underway in Denali NPampP include the availability of an
employee carpool fleet and the use of local gravel sources to minimize maintenance vehicle miles
traveled as well as reduction of idling vehicles during transit operation and winter plowing operations
Future opportunities to reduce its carbon footprint may include upgrades to more fuel efficient transit
vehicles should suitable vehicles become available someday
Communication Objective Share the compelling story of climate change impacts in Alaska and Denali
National Park and Preserve to the public as it relates to transportation
1 The CFP program is one component of the National Park Service Green Parks Plan an integrated approach by the NPS to address climate change through implementing sustainable practices in our operations This effort is an integral part of the larger NPS Climate Change Response Strategy For more information on Climate Friendly Parks certification visit httpwwwnpsgovclimatefriendlyparks
6
Denali National Park and Preserve Long Range Transportation Plan Existing Conditions Report
February 27 2015
At this time there is no formal region-wide communication program Condition to describe the relationship between transportation and climate
Although there is no formal change At the park scale there are interpretive programs within
guideline at the regional level for Denali NPampP to explain the impacts of climate change on the
communicating climate change landscape Because Denali NPampP extensively utilizes transit impacts Denali NPampP has some services to enhance visitor experience opportunities exist to show programs to communicate air quality and other benefits of transit service as compared to
climate change impacts to its personal vehicle use
visitors
Regionally there are efforts underway to communicate with both
external partners and internal staff members about the successes and failures concerning
environmentally sustainable transportation practices and to develop and fund educational materials for
internal and external audiences
33 User Experience Goal
Proactively enhance the Denali National Park and Preserve experience
User Data Objective Collect analyze and use transportation and user information to enhance Park
experiences into the future
Most of the documents reviewed for this baseline conditions report Condition rely on user information to determine a condition or characteristic Denali NPampP collects analyzes Within Denali NPampP there is increased interest in collecting user and uses transportation and information because it informs a more proactive approach to user information to enhance transportation system performance visitor experience and natural Park experiences The Park also resource impacts User data is collected through different methods has a vision for how this practice and is used for numerous ends These include can be improved in the future
bull Visitor surveys are used to gauge visitor satisfaction as
well as transportation system performance The most recent survey was collected in 2006
bull Static visitation collection points at the Savage River Check Station visitor centers and other
travel waypoints are used to track visitor characteristics and behavior
bull As of 2013 transit data is collected on all Park transit vehicles by bus drivers and through mobile
tracking devices On-board devices track the number of tickets sold number of passengers GPS
locations of buses and durations of vehicle stops Bus drivers manually input the purpose of the
stop and information about hiker wait times which is of high importance to the Park Service This
data can be made available in real time and can be used to monitor and respond to varying travel
demands The NPS currently has staff in the Resources Division dedicated to analysis of the data
collected by the transit operation
bull Permits collected for the purpose of either access by private vehicle with right-of-way
authorization for overnight backcountry access or by commercial airplane are useful for tracking
visitation to the most protected areas of the Park
bull Other information currently collected includes Service-wide Traffic Accident Reporting System
(STARS) and Fatal Analysis Reporting System (FARS) data for recording vehicular accidents
7
Denali National Park and Preserve Long Range Transportation Plan Existing Conditions Report
February 27 2015
Needs and opportunities for user data include specifying visitor experience benchmarks for number of
vehicles at wildlife stops and number of vehicles in a viewscape to serve as reliable baseline condition
data Other recommendations include additional road audits to reduce entrance fee non-payment More
flexibility to use franchise fees to fund comprehensive data gathering is seen as an opportunity to improve
visitor experiences while protecting natural resources
Multimodal Transportation Objective Provide an appropriate effective and conflict free multimodal
transportation system to and within Denali National Park and Preserve
For much of the Parkrsquos history maintenance and transportation Condition
improvements focused on Denali Park Road More recently the Multimodal access is historical
emphasis includes the Parkrsquos transit system which increases necessary and desired by
access while minimizing natural resource impacts Much of the recreationalists and subsistence
desired future conditions are related to the Park implementing more users The most common
outcome-based approaches to analyzing user information as multimodal conflicts are due to
opposed to relying solely on historic comparisons crowding at wildlife stops and
rest stops along Denali Park Appropriate multimodal transportation service is often defined by its
Road ability to make Denali NPampP accessible to a wide range of visitors
with overarching consideration for the wilderness character that the system accesses This definition of
appropriate access relates closely to the Denali NPampPrsquos purpose and mission as stated in its Foundation
Statement Appropriate access depends on the observed and anticipated effects to natural resources
(VMP 2012) Increased visitor access is desirable if it does not cause negative impacts on environmental
conditions At locations within the Park where the natural environment is still intact even small increases
in visitation or changes in access can have dramatic impacts on natural systems
Multimodal issues that reoccurred in several reviewed documents and in comments from Park staff
include confusion about shuttle service operation desire for better connections between the Park local
communities and visitor accommodations employee travel to from and within Denali NPampP safety
comfort and quality of interpretive experience and transportation service affordability
Multimodal conflicts identified in plans include general congestion along Denali Park Road and in Nenana
Canyon crowding at wildlife stops and rest stops within the Park narrow roadways for bicycling and
hiking in the ldquofront countryrdquo and at particular locations east of Savage River and conflicts between land
and air visitation in terms of soundscape impacts Congestion challenges are anticipated to grow as
visitation levels increase As a result Park managers may face ongoing decisions about how to balance
environmental priorities and resource protection with transportation system capacity when responding to
increased demand
The Park has several efforts underway to improve multimodal travel opportunities and travel experiences
within Denali NPampP Park managers are using indicators to measure performance of the transit system
and gauge overall user experience These include hiker wait times numbers of vehicles at wildlife stops
number of vehicles in viewsheds numbers of vehicles at rest stops nighttime traffic levels large vehicle
traffic and sheep gap spacing Proposed construction of an eight-foot gravel shoulder along sections of
Denali Park Road from mile eight to Savage River cited in the Final Entrance Area and Road Corridor
Development Plan could provide safety and traveling comfort for bicyclists and hikers and may improve
8
Denali National Park and Preserve Long Range Transportation Plan Existing Conditions Report
February 27 2015
opportunities for wildlife viewing Also modifications to the general management of Denali Park Road
could improve protection of natural habitats beyond Savage River
There is an opportunity to gain efficiency in transit operations by improving consistency in transit seating
and consolidating shuttle services in the entrance area and canyon Also expanding transit service north
to Healy and south to Carlo Creek and Cantwell in addition to increasing shuttle service between the
entrance area and McKinley Village is desired (Needs Assessment and Feasibility Study for a Community
Transportation System 2006)
34 Mobility Goal
Provide safe efficient and appropriate access to and within Denali National Park and Preserve
Safety Objective Provide safe access to and within Denali National Park and Preserve
Between 1990 and 2006 95 percent of all vehicular accidents in Condition NPSrsquos Alaska Region occurred in Denali NPampP with 58 percent of The historic character of Denali these accidents occurring on Denali Park Road (NPS Alaska Park Road creates safety Region LRTP 2012) Of the other accidents reported within Denali issues and due to its popularity NPampP 19 percent were located on the George Parks Highway both as a visitor attraction in the within the Park boundaries The remaining portion of vehicular Alaska Region and within Denali accidents occurred near the visitor parking areas or in NPampP most recorded accidents campgrounds The George Parks Highway is the direct road occur along the road Other connection between Anchorage and Fairbanks and a major travel safety s considerations include corridor for Denali NPampP visitors Between 2007 and 2010 31 total bicycle and pedestrian access in fatalities were reported on the George Parks Highway (NPS Alaska the front country and along Region LRTP 2012) sections of the George Parks
Highway and increased winter As identified in the VMP safety issues are associated with road
access travel along Denali Park Road The historic nature of the road may
in some locations limit sight distance restrict width for passing
vehicles and provide inadequate surface road friction (VMP 2012) Driver behavior is most likely a
contributing factor in vehicular crashes particularly for private vehicles traveling Denali Park Road during
off-peak seasons Impacts of severe weather events for Denali Park Road travelers are another safety
consideration These issues are also a top priority of the Parkrsquos General Management Plan and although very important must be balanced with active preservation of the road as characterized by the philosophy
to retain its telescoping from a full width paved profile at the entrance to the narrower unpaved gravel
profile at the western end
According to the visitor survey highlighted in the VMP the public indicates that they feel safe while using
Denali NPampPrsquos transportation system The most notable safety consideration perceived by the public is
related to travel over Polychrome Pass where Denali Park Road has steep drop-offs and the road is
narrow and winding Park management uses driver training driver spacing and wait times to address
safety issues at this location
9
Denali National Park and Preserve Long Range Transportation Plan Existing Conditions Report
February 27 2015
Safety is also a top priority for flight operations For example recommended flight tour routes are subject
to weather conditions and aircraft may be forced to deviate from planned routes if safety is at risk (Air
Tour Operations Best Practices 2012)
With increased opportunities for vehicular winter access emerging safety improvements related to winter
travel are a growing need Denali NPampP has a goal of minimizing wintertime safety-related incidents and
has an interest in determining baseline conditions so as to monitor future winter safety performance With
the trial winter plowing of the first 15 miles of Denali Park Road the Park continues to monitor visitor
safety during the extended period of winter and early spring driving conditions Commercial operators
also provide multi-modal access to the Park during winter months Denali NPampP staff is working with
commercial operators to implement safety measures for winter operation such as the required use of
emergency communication devices during operation
The collection of safety data and addressing inconsistencies in safety data reporting is identified as an
ongoing need
Access Objective Provide appropriate and efficient access for inspiration education research
recreation and other uses as provided for in ANILCA
Condition As stated in the General Management Plan the primary historic
Within Denali NPampP purpose of access to Denali NPampP is to accommodate viewing of
appropriate and effective access Mount McKinley and the Parkrsquos wildlife As documented
is determined by the assessed appropriateness of access is defined by the balance between
impacts to wildlife and cultural visitor accommodation with active protection of wilderness
resources Where the character The NPS therefore uses the least access restrictive
environmental conditions are management tool possible to maintain and promote the natural
more intact visitor access is resources protected by the area (General Management Plan
more closely managed New 2008)
vehicle management strategies
target this priority The level of appropriate access varies along Denali Park Road
Wildlife Viewing Subzones are used to distinguish appropriate level
of access A notable example includes the Parkrsquos VMP which allows 160 vehicles per 24 hour day
through mile 15 of Denali Park Road period while monitoring for violations of user experience standards
This number was derived through extensive research and rigorous travel modeling of Denali Park Road
and provides an overall increase in capacity for visitors while considering environmental impacts
Visitors typically arrive to the Park by private vehicle bus or train Many visitors arriving by bus or train
are cruise ship passengers and are traveling with fellow passengers as part of cruise packages Park
management desires to provide efficient access to visitors arriving by all modes of travel while also
providing for accessibility as delineated by the Americans with Disabilities Act (ADA) and Architectural
Barriers Acts (ABA) For areas of the Park with additional travel requirements this means ensuring a
transportation system that provides a meaningful high-quality opportunity for viewing scenic landscapes
and wildlife primarily through transit services (VMP 2012) In the future visitation is expected to grow
with a large portion of visitors arriving as part of organized tour companies or organizations
Considerations of access are therefore a topic of long-range concern as Denali NPampP is committed to
balancing access with the responsibilities of managing designated wilderness
10
Denali National Park and Preserve Long Range Transportation Plan Existing Conditions Report
February 27 2015
At the time that the Denali Park Road Visitor Survey (2010) was conducted 71 percent of visitors who
traveled beyond mile 15 were part of organized tours (ie Long Tour) These are highly interpretive trips
with designated stops at rest areas and impromptu stops for wildlife viewing Non-tour transit buses
traveling past mile 15 provide less interpretation and make impromptu stops for hikers and wildlife
viewing
Coordination with the visitor services concessioner is ongoing and the relationship between Denali NPampP
and any concessioner is viewed as integral to providing appropriate and effective access for Park visitors
User Information Objective Provide accurate and accessible information through a variety of means
about how to travel to and within Denali National Park and Preserve
The NPS is interested in providing information to potential and Condition repeat users about its transportation system and services at a Commercial and state tourism national regional and local level The Alaska Federal Lands LRTP initiatives are successful in and NPS Alaska Region LRTP summarize objectives and providing travel information to strategies that specifically address providing accurate and visitors prior to their arrival at accessible information for travel to and within federal lands and the Park Once at Denali NPampP several projects to enhance visitor information services the Park its concessioners and
local businesses provide Much of the marketing and development of traveler information for
interpretation through visitor Denali NPampP is championed by non-NPS organizations such as
centers transit and tour bus the Alaska Railroad concessioners and other area businesses
operations and many others Because Denali NPampP is a regular destination for commercial tour
Interpretation and transit system operations much of the information provided to potential visitors
visitor information improvements and visitors en route to the Park is provided by those organizations
are desired According to the Denali Park Road Visitor Survey issued in 2010
over half of the Denali NPampP transit users had received information from a travel agent about their visit to
the Park Another third of the respondents received information over the internet Denali NPampP maintains
a website with virtual tours guides and resources to help visitors plan trips to the Park Travel guides and
tour books are also popular means of learning about how to travel to and within Denali NPampP (NPS
Alaska Region LRTP 2012)
Traditional means for providing information at visitor centers and Wilderness Access Center are available
upon entering Denali NPampP Once aboard the short-tour and long-tour buses visitors have a wide range
of information available Tour bus drivers and guides provide extensive interpretation while transit drivers
may provide information upon request and at the discretion of a particular driver Several Denali NPampP
plans document the value of retaining experienced drivers This was seen as a major enhancement to the
overall visitor experience (Denali NP Bus Shuttle System Analysis 2013)
The most common need identified in planning documents is the necessity for better wayfinding and user
information about transit in hopes of reducing visitor confusion with the Parkrsquos transportation system
According to the VMP an objective of Denali NPampP management is to ldquoclearly communicate information about the system through a variety of meansrdquo Potential options for sharing information include improving
traditional methods such as maps brochures and signage The Alaska Region is also interested in newer
media options such as implementing intelligent transportation systems linked with websites mobile
devices and other personal communication technology According to a survey in 2010 transit users were
11
Denali National Park and Preserve Long Range Transportation Plan Existing Conditions Report
February 27 2015
not interested in receiving information from a recorded narrative about traveling Denali Park Road
Information delivered by bus drivers was preferred over prerecorded methods
Also with the introduction of enhancements to the off-season access programs Denali NPampP
management is interested in reducing the perception that the Park is closed during off-seasons by
increasing communications about opportunities for visiting the Park during the winter
35 System Management Goal
Develop a long-term transportation system to appropriately satisfy current and future land
management needs
Asset management Objective Apply available financial resources to essential transportation
infrastructure
Relative to other parks in the Alaska Region transportation assets
within Denali NPampP are some of the most costly This is primarily
due to Denali Park Road maintenance needs providing visitor
transit and tour services and experiencing the high visitation levels
during a very short summer season
In general transportation assets within Denali NPampP are
considered to be in good condition Road work is mainly
concentrated on bridge replacement road maintenance and
subgrade improvements In general road widening does not occur
However improving pullouts on the narrowest section of the road
to maintain safety standards des exist in asset planning
documentation The annual operations and maintenance budget for
road assets in Denali NPampP was approximately $12 million in 2010
(NPS Alaska Region LRTP 2012)
Denali NPampP management uses both quantitative and qualitative
measures to prioritize transportation system improvements The
2008 General Management Plan prioritizes road improvement
projects ranking corrective safety projects as the highest priority and other corrective maintenance and
repairs as secondary priorities The General Management Plan provides example projects from Denali
Park Road where potential improvements have been identified for multiple project categories (sight
distance improvements safe vehicle passing enhancements road surface friction improvements culvert
repairs etc) Denali NPampP has incorporated the NPS ldquooptimizer bandrdquo model of asset prioritization In
this model assets are scored by Asset Priority Index (API) to rank how critical assets are used in
accomplishing the Parkrsquos mission and goals In this model Facility Condition Index (FCI) indicates asset
condition and is used to determine eligible fund sources Projects are evaluated based upon their APIFCI
rank Using this method of asset evaluation all of the high priority assets (API of 75 or higher) are in good
or better condition (FCI of 03 or less) (Alaska Federal Lands LRTP 2012) Finally the asset needs are
filtered through the NPS Capital Investment Strategy (CIS) which expresses priorities in the form of
optimizer bands Optimizer bands 1 and 2 are associated with assets that are essential or extremely
important for a park to continue as described in its organic legislation
Condition
The availability of funds
particularly for funding transit
systems has decreased in
recent years Denali NPampP
management is using
quantitative and qualitative
indicators about the
transportation system to
prioritize transportation system
improvements With limitations
to increasing system capacity
Denali NPampP management is
working toward increased
system efficiency and better
coordination with transportation
partners
12
Denali National Park and Preserve Long Range Transportation Plan Existing Conditions Report
February 27 2015
There is a general funding gap projected into the future The most recent congressionally authorized
transportation funding bill Moving Ahead for Progress in the 21st Century (MAP-21) reduces funding for
the NPS transit systems by approximately 28 percent from the previous federal transportation legislature
(Alternative Funding Opportunities for NPS Transit 2014) Regional funding assessments show an
annual funding gap of $720000 for Alaskan ldquoroad parksrdquo the category which Denali NPampP is included
Although park-level funding shortages are not yet documented for Denali NPampP a large portion of the
Alaska Regionrsquos transportation assets are located in Denali NPampP Elimination of the Transportation
Improvement Program (TRIP) has made funding multimodal systems such as the Parkrsquos concessioner-
operated transit more challenging (Alternative Funding Opportunities for NPS Transit 2014)
Because the transit system is operated by a for-profit concessionaire it is not eligible for transportation
funding through MAP-21 however several FHWA funding and grant programs are still applicable and
partnerships with local government cooperation and partnership could increase funding eligibility
Park management is also very interested in finding efficiencies within its current asset portfolio
completing operational modifications that improve the transportation system and promoting the Parkrsquos purpose Recent examples of this include new vehicle management strategies provided in the VMP and
wintertime operation improvements
Asset Investment Planning Objective Consider sustainability of operation and maintenance of new
and existing assets in the planning process
The NPS includes asset investment planning in much of its recent Condition transportation planning documentation At a regional level the NPS Denali NPampP managers are very is using measurements that feed into asset planning processes involved with asset planning for such as total cost facility ownership as well as the project
transportation system prioritization tools mentioned earlier Several strategies identified in maintenance and operations the Alaska Federal Lands LRTP promote asset planning through Relative to other parks in the collaboration with other federal land management agencies and region Denali NPampP has high Alaska Department of Transportation and Public Facilities deferred maintenance needs consideration of lifecycle costs and evaluation of maintenance
resulting largely from challenges costs versus investments in new infrastructure associated with maintaining
Denali Park Road Maintenance In 2010 deferred maintenance in Denali NPampP accounted for 65
and operation are constantly percent approximately $20 million of all deferred maintenance of
weighed against environmental transportation assets in the Alaska Region Deferred maintenance
conservation priorities issues within Denali NPampP could be addressed by treating the
underlying cause of the road failures to reduce the need for
repetitive maintenance according to the General Management Plan
Documents suggest that road repairs and maintenance should follow the 2005 Denali NPampP Road
Maintenance Repair and Operating Standards and the 2007 Denali NPampP Road Design Standards The
total planned transportation assets for Denali NPampP include improvements to access roads parking lots
non-motorized routes and other transportation infrastructure These planned assets are valued at $64
million (NPS Alaska Region LRTP 2012)
13
Denali National Park and Preserve Long Range Transportation Plan Existing Conditions Report
February 27 2015
In terms of operational needs Park managers are actively participating in day to day management of
transit operations and are able to make adjustments based on demand For example real-time
monitoring of the transit system allows the concessionaire to track transit vehicle occupancy and dispatch
additional vehicles during peak demand for return trips Denali NPampP is also actively investigating
opportunities for gaining efficiency in their transit and in their entrance fee collection program
As it is with other goal area topics effective operation and maintenance is balanced with environmental
protection In planning documents the Denali NPampP management is constantly balancing expectations of
visitor experience and safety with deference to natural resource objectives
Coordination Objective Coordinate with local organizations to ensure that nearby transportation
projects are planned with NPS involvement to the mutual benefit of all parties
Coordination with federal state and local agencies is seen as an Condition opportunity for funding and project implementation as well Coordination with federal state managing concessionaire services and expanding local visitor local and private transportation services An ongoing federal land management agency agencies is seen as a need for coordination team was formed as a result of the 2012 Alaska optimizing asset management Federal Lands LRTP The group actively works to coordinate because 21 percent of the transportation project planning across Alaska including in and transportation assets are owned around Denali NPampP These efforts could help organize interest in by non-NPS agencies expanding transit services outside of the Park which is a frequently
cited coordination need as determined by the literature review and
comments from Park staff during LRTP discussions
Needs and opportunities for coordinating with private entities are somewhat unique to Denali NPampP
Denali NPampP is the only park in the Alaska Region to have transportation assets that are not owned by
the NPS Twenty-one percent of the transportation assets in the Park are owned and operated by
concessionaires or owned by others There is a desire to expand partnerships to include other local
businesses and eventually local government agencies The 2006 Needs Assessment and Feasibility
Study for a Community Transportation System provides alternatives for organizing such efforts
Other coordination efforts include involving air tourism operators regular communication with tribal
organizations and land inholders and coordinating access with other area landholders and transportation
agencies such as the Alaska Department of Transportation and Public Facilities
14
Denali National Park and Preserve Long Range Transportation Plan Existing Conditions Report
February 27 2015
4 Conclusions
Common themes encountered throughout the literature review process provide several general baseline
conditions for Denali NPampP These include
Resourc
e P
rote
ctio
n
Clim
ate
Change
User
Experie
nce
Mo
bili
ty
Syste
m M
anagem
ent
The historic character of Denali Park Road and the management thereof are important
factors influencing access and mobility
Denali NPampP is a primary attraction for tourists Many visits are rushed due to the
logistics of popular packaged Alaska tours Visitation is anticipated to increase as tour
companies continue to promote and expand travel options to the Park
With anticipated visitation increases and associated use of the transportation system
Denali NPampP managers may face ongoing decisions about how to best protect the Parkrsquos natural resources as congestion grows and the capacity of Denali Park Road and
transportation system is tested
Travel options are sometimes viewed as limited within the Park but some multimodal
enhancements could increase safety particularly for bicycling and hiking opportunities
The general condition of the transportation system is good but priorities are complex
both in terms of balancing maintenance needs with the care for natural resources and
providing access to view designated wilderness areas
Recent changes to Denali Park Road vehicle management and operations system are
intended to advance the NPSrsquos emerging outcome-driven planning processes As more
data becomes available Denali NPampP managers can better set performance indicators
for operations
Existing transportation plans do not contain much information about climate change but if
the actions recommended and cited in the NPS Alaska Region LRTP are followed there
may be more opportunities to include unit-level strategies for addressing climate change
into asset planning and operation With ongoing progression toward a CFP certification
Denali NPampP is well positioned to incorporate these objectives at a unit-level
15
National Park Service US Department of the Interior
Denali National Park and Preserve Long-Range Transportation Plan
Appendix B Denali Long-Range Transportation Planning and Acoustic Resources
1
Denali Long Range Transportation Planning and Acoustic Resources
Davyd_Betchkalnpsgov NPS Alaska Region Soundscape Specialist Biologist 907‐683‐5754
Research Sets the Stage
Author Eli Seigel wrote in 1970 ldquoall the opposites are two freedoms which question each other and complete each
otherrdquo Transportation and solitude likely represent such a pair of mutually‐exclusive freedoms In Denali and other
Alaskan parks we can immediately recognize a tradeoff between the ability to be easily and quickly transported to
a location and the ability to participate in the tranquility of wilderness beyond the reach of modern technology and
crowds
This recognition is a fundamental drive behind the work of the NPS Natural Sounds and Night Skies Division whose
vision statement is to ensure that ldquoNational parks are enduring sanctuaries for natural sounds and dark
environments where current and future generations have the opportunity to experience undisturbed soundscapes
and an unimpeded view of the cosmos and where the ecological roles and cultural values of acoustics and photics
are understood and appreciatedldquo (NPS 2014)
For the purposes of acoustic planning and research the NPS has developed an autonomous system that can
provide both American National Standards Institute (ANSI) certified acoustic levels (ie numeric measurements of
sound pressure level in decibel units) and audio recordings (ie sound that one can listen back to in headphones)
ANSI also recommends the collection of meteorological data concurrent with measurements of sound pressure
level Thus a simple weather station incorporating wind speed wind direction temperature and relative humidity
is also part of the acoustic monitoring station The photo below shows an external photograph of a typical station
2
Figure 1 NPS Standard Acoustic Monitoring Station ndash equipment is composed of a microphone meteorological instruments
sound level meter digital audio recorder battery bank and solar paneling
Scientific work to understand Denalirsquos acoustic environment began in 1999 in response to a large increase in
aviation and snowmobile noise in the mid‐1990s (Morgan 2001) Early data were incorporated into the
Backcountry Management Plan (BCMP) EIS a supplement to Denalirsquos General Management Plan (NPS 2006e)
After the BCMP was published the park embarked on a decade‐long inventory of the acoustic environment The
project was completed in 2015 and as of 2016 the park has moved into a monitoring phase A basic timeline of
acoustic resource management in Denali is shown below
Figure 2 Timeline of acoustic resource management in Denali 1999 ndash 2016
Denalirsquos acoustic inventory project is unique among park service units in that it was designed as a spatially random
sample on a 20 by 20 kilometer grid This allows inference beyond the local detection radius of each microphone
For example consider the following map that depicts the acoustic metric lsquodaily average noise free intervalrsquo ndash a
measure of how long a typical quiet period is before it is broken by motorized noise Noise free intervals in Denali
are largely determined by the frequency of air traffic Aircraft are very acoustically powerful sources that are
audible at distances similar to the scale of the sampling grid thus mapped measurements of noise free interval
immediately form a discernable pattern to the human eye
3
Figure 3 Daily average noise free intervals measured in hours Data were collected as part of Denalirsquos Soundscape Inventory
project 2006 ndash 2015 Noise free interval is a measure of how long a typical quiet period is before it is broken by motorized
noise
Entering the realm of inference the following map uses observations at specific soundscape inventory points to estimate the noise free interval at a park‐wide scale It uses a spatial smoothing technique called inverse distance weighting to construct new data points between the known values ‐ a method known as interpolation Again
because the scale of the phenomena (aircraft traffic) and the scale of the sample (20 km2 resolution) are comparable noise free interval is a metric well‐suited to interpolation techniques (Peterson 1998 Gergel 2006) Continuous change in the metric is physically sensible and approximate the visual effect of looking at the original point data Denalirsquos soundscape inventory was important for understanding which acoustic metrics are best suited to monitoring change at a landscape scale
4
Figure 4 Average noise free interval values estimated by spatial interpolation Units are in hours This map uses observations
at soundscape inventory points to estimate the average noise free interval at a park‐wide scale It uses a smoothing technique
called inverse distance weighting to construct new data points between the known values ndash a method known as interpolation
The Denali soundscape inventory supplies spatially‐rich information about the current state of the acoustic
environment It also clarifies the choices available to quiet the park as per NPS policy Inventory data have been
(1) Inventory data have been used to review the indicators and standards of the BCMP
They explain how indicators change in response to the acoustic ambience
They explain the relationship between indicators (for example NFI and event rate are inversely related
thus one can be estimated from the other)
They provide an understanding as to which indicators are best suited to the scale of the park
(2) Inventory data have been used as input to the voluntary aviation best practice development process
of the Denali Overflights Advisory Council (2007 ndash 2012)
They provided the basis from which to monitor the effects of aviation best practices
They provided updates to the council directing attention to areas most in need of mitigation
They transcend anecdote as the sole basis for making decisions
(3) Inventory data have been used in predictive acoustic modelling
5
They provide a means to validate noise models of aircraft takeoffs or overflights road noise or other
sources
Data such as event rates or hourly distributions can also be used as inputs to models
Aviation Transportation and NPS Policy
There are currently several types of aviation transport in the park Section 1110(a) of the Alaska National Interest
Lands Conservation Act (ANILCA) provides for aviation access for traditional activities and for travel to and from
homesites which will not be discussed in this document Nor will high‐altitude commercial aviation ndash which does impact the park but would involve participation of the Federal Aviation Administration in the revision of Victor
Airways or Jet Routes within the National Airspace System a process well beyond the scope of this plan
Instead this document seeks to build on discussions of the Denali Overflights Advisory Council
(httpswwwnpsgovarticlesdenali‐aircraft‐overflightshtm)a federal advisory committee chartered by the
Secretary of the Interior from 2007 ndash 2012 The group developed a suite of voluntary aviation best practices that
were adopted by both commercial and government aviators It is fitting that these best practices were broadly
adopted because NPS policy does not distinguish the obligations of governmental and Concessionaire operations
with respect to resource protection NPS Management Policies 2006 sect 10249 states
Concessioners are required to comply with applicable provisions of all laws regulations and policies that
apply to natural and cultural resource protection
It is relevant then to provide a brief policy review NPS Management Policies 2006 sect 823 addresses impacts to
natural sounds directly stating
The Service will strive to preserve or restore the natural quiet and natural sounds associated with the
physical and biological resources of parks To do this superintendents will carefully evaluate and manage
how when and where motorized equipment is used by all who operate equipment in the parks including
park staff Uses and impacts associated with the use of motorized equipment will be addressed in park
planning processes Where such use is necessary and appropriate the least impacting equipment vehicles
and transportation systems should be used consistent with public and employee safety The natural
ambient sound levelmdashthat is the environment of sound that exists in the absence of human‐caused
noisemdashis the baseline condition and the standard against which current conditions in a soundscape will be
measured and evaluated
Further guidance related to aircraft is articulated in sect 6343
Managers contemplating the use of aircraft or other motorized equipment or mechanical transportation within wilderness must consider impacts to the character esthetics and traditions of wilderness before considering the costs and efficiency of the equipment
In evaluating environmental impacts the National Park Service will take into account (1) wilderness characteristics and values including the primeval character and influence of the wilderness (2) the preservation of natural conditions (including the lack of man‐made noise) and (3) assurances that there will be outstanding opportunities for solitude that the public will be provided with a primitive and unconfined type of recreational experience and that wilderness will be preserved and used in an unimpaired condition
6
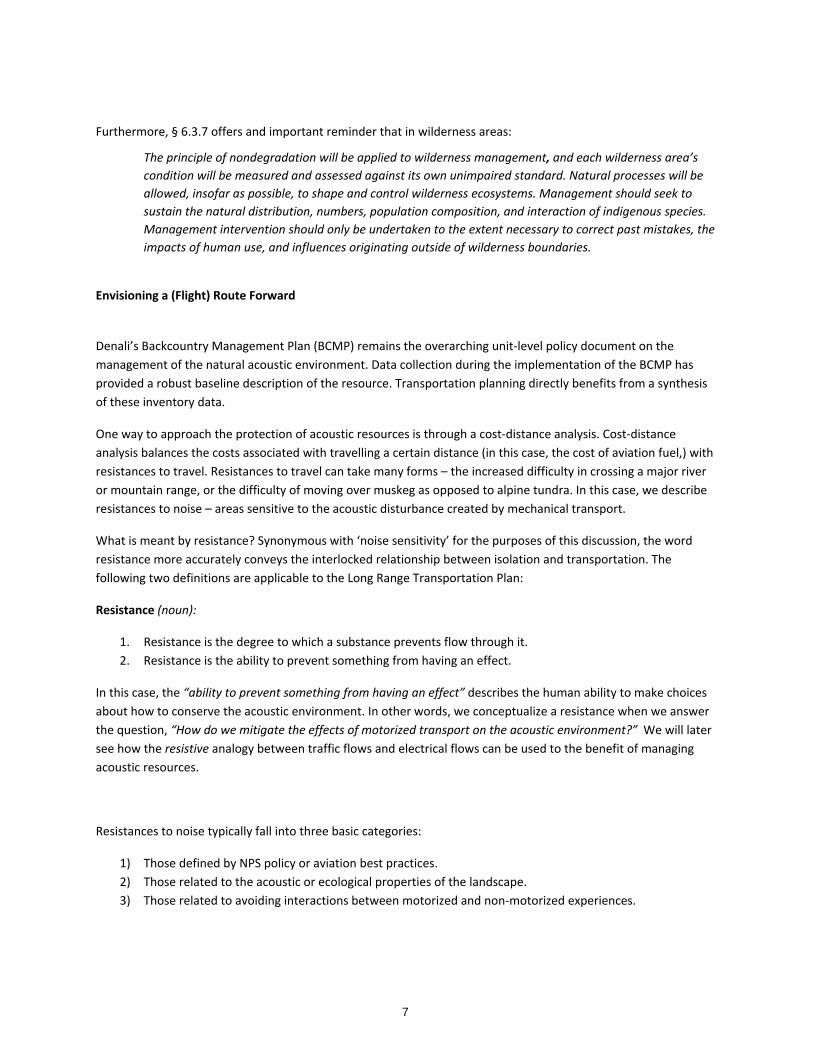
Furthermore sect 637 offers and important reminder that in wilderness areas
The principle of nondegradation will be applied to wilderness management and each wilderness arearsquos condition will be measured and assessed against its own unimpaired standard Natural processes will be allowed insofar as possible to shape and control wilderness ecosystems Management should seek to sustain the natural distribution numbers population composition and interaction of indigenous species Management intervention should only be undertaken to the extent necessary to correct past mistakes the impacts of human use and influences originating outside of wilderness boundaries
Envisioning a (Flight) Route Forward
Denalirsquos Backcountry Management Plan (BCMP) remains the overarching unit‐level policy document on the
management of the natural acoustic environment Data collection during the implementation of the BCMP has
provided a robust baseline description of the resource Transportation planning directly benefits from a synthesis
of these inventory data
One way to approach the protection of acoustic resources is through a cost‐distance analysis Cost‐distance
analysis balances the costs associated with travelling a certain distance (in this case the cost of aviation fuel) with
resistances to travel Resistances to travel can take many forms ndash the increased difficulty in crossing a major river
or mountain range or the difficulty of moving over muskeg as opposed to alpine tundra In this case we describe
resistances to noise ndash areas sensitive to the acoustic disturbance created by mechanical transport
What is meant by resistance Synonymous with lsquonoise sensitivityrsquo for the purposes of this discussion the word
resistance more accurately conveys the interlocked relationship between isolation and transportation The
following two definitions are applicable to the Long Range Transportation Plan
Resistance (noun)
1 Resistance is the degree to which a substance prevents flow through it
2 Resistance is the ability to prevent something from having an effect
In this case the ldquoability to prevent something from having an effectrdquo describes the human ability to make choices
about how to conserve the acoustic environment In other words we conceptualize a resistance when we answer
the question ldquoHow do we mitigate the effects of motorized transport on the acoustic environmentrdquo We will later
see how the resistive analogy between traffic flows and electrical flows can be used to the benefit of managing
acoustic resources
Resistances to noise typically fall into three basic categories
1) Those defined by NPS policy or aviation best practices
2) Those related to the acoustic or ecological properties of the landscape
3) Those related to avoiding interactions between motorized and non‐motorized experiences
7
Resistances to noise can be assigned based on a number of different rationales For instance consider the
following raster dataset that depicts the amount of use by backcountry unit One long‐standing approach to
describing which areas should be protected from noise is to separate backcountry user groups from aviation user
groups in space Lighter areas on the map indicate more backcountry use ndash and thus suggest that aircraft avoid
units along the Denali park road corridor
Figure 4 Backcountry Unit Use resistance layer Lighter values indicate a greater resistance to transportation noise This
suggests that aviation routes should avoid core units around the road corridor
Contrast this with data which show the average noise free interval across the park The layer is normalized to the
same brightness as the backcountry use layer with lighter areas representing a greater resistance to noise and
thus higher resource costs for transportation over the area
The rationale behind the noise free interval map produces different optimal routes than the backcountry user
map This is because resistance is based on the fact that areas with long noise free intervals are sensitive to minor
changes in air traffic and thus traffic should be routed over areas that are already highly fractured In this case
8
areas that already have air traffic would continue to bear the brunt of resource damage allowing the most pristine
acoustic environments of the park to remain intact
Figure 5 Noise Free Interval resistance layer lighter values indicate greater resistance to transportation noise This would
suggest that aircraft routing remain largely the same especially in the areas between the Kahiltna and Ruth glaciers
Backcountry use statistics and noise free intervals are just two of many different ways of assigning resistances to
aviation transport Which strategy is best That depends entirely on the basis of each claim After reviewing both
layers it should be apparent that a wide range of conflicting rationales can be applied to mitigating impacts from
Denalirsquos aviation transportation network Deciding which should be prioritized is a complex decision
Unless the overall aviation traffic volume over the park is reduced displacement in free space is the primary
mitigation technique available to park stewards The most substantial mitigations enacted for the park thus far ndash
the Denali Overflights Advisory Council aviation best practices ndash required the council to weigh certain routing
displacements over others (DOAC 2012)
9
Once a weighting network of resistance layers has been distilled from public and expert opinion it is possible to
use them to envision idealized flight corridors One useful tool for this purpose is the cost‐distance modelling
software Circuitscape (wwwcircuitscapeorg) which uses electrical theory to describe the travel of electrons over
a semiconductor This is analogous to a pilot with knowledge of areas resistant to noise who utilizes this
knowledge while conducting their flight operations Results of a Circuitscape analysis include all the possible routes
a pilot might fly but highlight stewardship‐friendly corridors It allows us to see the conclusions that follow from
our rationale
The following is an example weighting network that can be used as an input for Circuitscape The weights are
chosen in this case to produce a result that is realistic while avoiding the influence of hard discrete edges It
balances nine data sets with widely varying rationales to produce a final summation that can be used to visualize
flight corridors
Figure 6 Example of a weighted network resistance layer Summed data layers include natural ambient acoustic
level travel time backcountry unit use Denali Overflights Advisory Committee aviation best practices and sound
10
sensitive areas BCMP standards noise free interval campgrounds and road corridors The hard edges of polygon
features are especially prominent in the final sum
Dataset Name Description of Dataset Rationale Statement for Noise Resistance Weight
Natural Sound Pressure Level (Median L50)
Typical ambience of the natural acoustic environment (Modelled)
Listening area is reduced in more energetic acoustic environments reducing the impact of human
activities Less natural energy = higher resistance 50
Travel Time Estimated travel time on foot from
portal areas (Modelled)
Backcountry users travelling in more remote areas of the park have a greater motivation to find
solitude Greater travel time = higher resistance 25
Backcountry User Days Utilization of backcountry units of
the park (Empirical)
Areas with a greater amount of backcountry users should be preferrentially avoided More users =
higher resistance 15
Denali Overflights Advisory Council Aviation Best Practices
Best‐practices for mitigating acoustic impacts from aviation (Federal Advisory Committee)
Best‐practices identified by the Denali Overflights Advisory Council should be fully implemented Areas
affected by best‐practices = high resistance 10
Backcountry Management Plan Soundscape Standards
Soundscape standards by spatial region of the park (GMP)
Adherence to NPS policy should be prioritzed Lower impact management zone = Higher resistance
5
Noise Free Interval
Average amount of time before experiencing the next noise disturbance (Empirical
interpolated)
Areas with longer noise‐free intervals are more sensitive to fracturing due to increases in air traffic
Greater noise‐free interval = higher resistance 5
Campground Locations Buffered campground areas
(Empirical)
Campgrounds are places where many people spend time resting and should be preferrentially avoided
Closer to campground = higher resistance 5
Roads Buffered road network (Empirical) Roads are already impacted by noise so aviation
noise will have a lesser impact in proximity to roads Beyond road noise footprint = high resistance
3
Denali Overflights Advisory Council sound sensitive areas
Areas identified by the Denali Overflights Advisory Council as
noise sensitive banded into three categories low medium high (Federal Advisory Committee)
Sound sensitive areas should be preferrentially avoided Higher sensitivity band = higher resistance
2
Table 1 Description of noise resistance rasters that were used to show how varying rationales can be balanced to produce an overall weighted noise resistance layer
Once the weighted resistance layer has been created Circuitscape is used to recognize ideal flight corridors Airports with commercial use represent sources of electrical potential and include Talkeetna Healy McKinley Public ERA helipad McKinley Private Cantwell and Kantishna The sink (ground) of electrical potential is the Denali massif For the example weighting network in this document the following map was produced
11
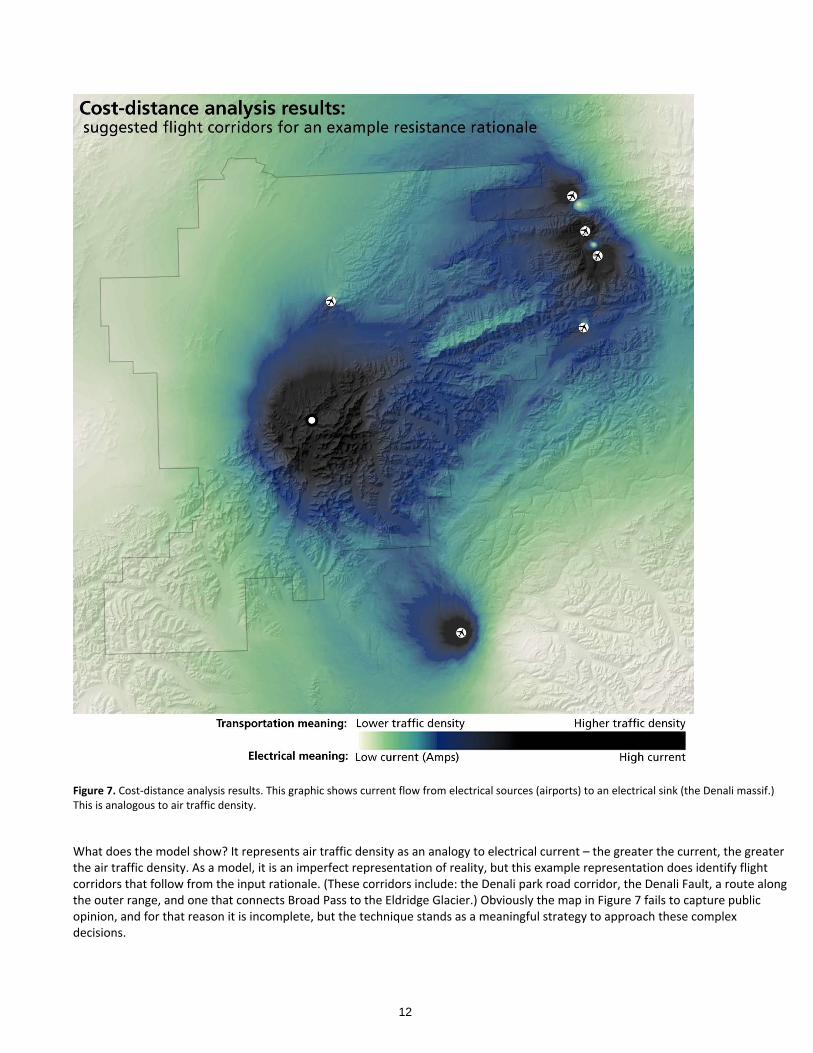
Figure 7 Cost‐distance analysis results This graphic shows current flow from electrical sources (airports) to an electrical sink (the Denali massif) This is analogous to air traffic density
What does the model show It represents air traffic density as an analogy to electrical current ndash the greater the current the greater the air traffic density As a model it is an imperfect representation of reality but this example representation does identify flight corridors that follow from the input rationale (These corridors include the Denali park road corridor the Denali Fault a route along the outer range and one that connects Broad Pass to the Eldridge Glacier) Obviously the map in Figure 7 fails to capture public opinion and for that reason it is incomplete but the technique stands as a meaningful strategy to approach these complex decisions
12
Conclusion
Data from the Denali Soundscape Inventory describe the parkrsquos acoustic environment at a landscape scale These data can be used
for many purposes but their most critical is to provide a baseline from which to monitor the effects of future noise mitigation
efforts
In the preceding section we described a cost‐distance analysis technique that could be utilized to identify the most beneficial long‐
term mitigations for the acoustic environment Such corridors represent opportunities for park management and the aviation
community to work together as stewards What has not been identified in this document is the ldquovalue analysisrdquo process by which
public and expert opinion can be synthesized into an appropriate weighted resistance layer for cost‐distance analysis The overall
strategy may follow a form similar to this
An informal version of this same process was used to by the twelve members of the Denali Overflights Advisory Council to develop
an initial suite of aviation best practices from 2007 ndash 2012 Some of these best practices have produced substantial positive changes
for the park but others have failed to be acoustically effective due to their extent or timing The strategy described in this
document could be used to open the doors of conversation and improve the effectiveness of the mitigations to protect Denalirsquos
acoustic environment
References
Alaska National Interest Lands Conservation Act PL 96‐487 sect 1110(a)
Denali Aircraft Overflights Advisory Committee 2012 Denali air tour operatorsrsquo best practices to minimize sound impacts Available
at httpswwwnpsgovdenagetinvolvedaoachtmCP_JUMP_5151844 September 2013
Gergel S E and M G Turner 2006 Learning landscape ecology a practical guide to concepts and techniques Springer Science amp
Business Media New York
McRae BH VB Shah and TK Mohapatra 2013 Circuitscape 4 User Guide The Nature
Conservancy httpwwwcircuitscapeorg
Morgan D and J Van Horn 2001 Aircraft Overflight Activity in the Denali Wilderness An Analysis of Backcountry Rangers
13
Observations for 1999 and 2000 National Park Service Denali Park Alaska
National Park Service (NPS) 2000 Directorrsquos Order 47 Soundscape Preservation and Noise Management US Department of the
Interior National Park Service Washington DC
National Park Service (NPS) 2006a Management policy 6343 Environmental Compliance in Management policies 2006 US Department of the Interior National Park Service Washington DC
National Park Service (NPS) 2006b Management policy 637 Natural Resources Management in Management policies 2006 US Department of the Interior National Park Service Washington DC
National Park Service (NPS) 2006c Management policy 823 Use of motorized equipment in Management policies 2006 US Department of the Interior National Park Service Washington DC
National Park Service (NPS) 2006d Management policy 10249 Natural and Cultural Resource Management Requirements in Management policies 2006 US Department of the Interior National Park Service Washington DC
National Park Service (NPS) 2006e Denali National Park and Preserve final backcountry management plan environmental impact statement National Park Service Denali Park Alaska
National Park Service (NPS) 2014 Natural Sounds amp Night Skies Division Strategic Plan (2014 ndash 2019) US Department of the Interior National Park Service Natural Resources Stewardship and Science Ft Collins CO
Peterson D L and V T Parker 1998 Ecological scale theory and applications Columbia University Press New York
Siegel E 1970 There Are Two Freedoms Aesthetic Realism Lectures by Eli Siegel Web 1 July 2016
14
National Park Service US Department of the Interior
Denali National Park and Preserve Long-Range Transportation Plan
Appendix C Denali Park Road Risk Assessment Utilizing the Unstable Slope Management Program
1
Denali National Park and Preserve ndash Long Range Transportation Plan
Deterministic Geologic Risk Assessment of the Denali Park Road Utilizing the Unstable Slope Management Program
Authors Russell Rosenberg MSc ndash Physical Science Technician (Geologic Hazards) Denny Capps PhD ndash Park Geologist Heather Rogers MSc ndash Physical Science Technician (Geologic Hazards)
Prepared 080316
Revisions none to date
Introduction and Project Status
The 92‐mile Denali Park Road traverses a highly active geologic landscape and has experienced
numerous documented mass wasting events throughout the history of the road One of the most
dramatic occurred in late October 2013 when a 600‐ft‐long 110‐ft‐wide debris slide blocked the road
near MP 38 Blocks of permafrost‐frozen unconsolidated debris up to 15 ft thick slid on weak unfrozen
clay Frequent but less dramatic events block traffic undermine road surfaces and may cause damage
to vehicles or injuries Many events including the example above are likely triggered or exacerbated by
thawing permafrost and are consistent with the possible effects of anthropogenic climate change With
increases in road use the uncertain effects of climate change and possible changes to maintenance
funding levels National Park Service (NPS) and Federal Highway Administration (FHWA) staff identified
the need for a comprehensive risk analysis of geologic hazards along the Denali Park Road
The risk analysis is scheduled for completion by March 2017 and includes five parts (1) inventory maps
and linked database that illustrate spatialtemporal distribution of geohazards their relative activity
and geomorphic attributes (2) beta testing and implementation of the Unstable Slope Management
Program (USMP) rating criteria (3) geohazard susceptibility models that estimate the spatial probability
of occurrence (4) geohazard risk models that illustrate the potential consequences and (5)
analysesrecommendations to park management regarding other risks the road will exhibit over the
next decade (DENA‐MOA‐208813AB) Currently tasks 1 and 2 are predominately complete tasks 3 and
4 are underway and task 5 will follow the completion of tasks 1‐4 Although final results and
recommendations are still forthcoming the results of tasks 1 and 2 in particular the USMP ranking
scores (discussed below) provide an inventory and a first‐order deterministic risk assessment of
geologic hazards currently affecting the park road
2
The results of the USMP rating criteria provide valuable information on the spatial distribution of
geologic hazards their severity and the associated risk however they do not directly assess the
possible impacts of climate change or provide a detailed outlook of possible future scenarios We utilize
these data to provide a preliminary identification of the areas with the highest relative risk and their
spatial patterns Consideration of this information should be valuable to this Long Range Transportation
Plan (LRTP) and for park managers and planners as future infrastructure plans are being developed
Unstable Slope Management Program Site Rankings
The USMP is a collaboration between the FHWA many other federal agencies including the NPS private
geotechnical consultants and the Alaska Department of Transportation amp Public Facilities (AKDOT) that
ranks geologically unstable slopes for the purpose of facilitating more effective long‐term geotechnical
asset management USMP scores provide a deterministic ranking of agency risk associated with any
particular geologic hazard site These scores consider elements of both the severity and
frequencyprobability of a hazard and the exposure and vulnerability at each particular site Example
elements include the amount of roadway affected by landslide events the frequency of known hazard
events the impact of events on the use of the transportation corridor the maintenance cost and
complexity and annual average daily traffic For detailed information the USMP ranking criteria please
see (httpnlcsmontanaeduusmpRatingManualpdf)
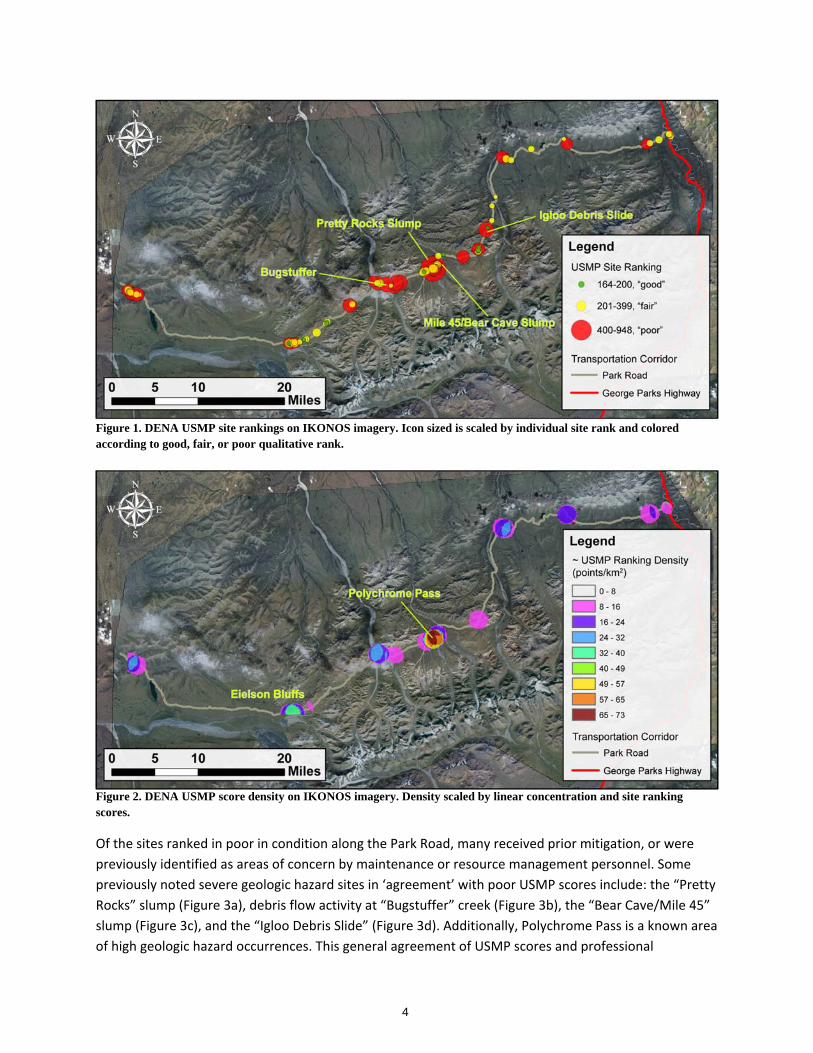
We have currently completed a total of 141 USMP site rankings along the entire 92 miles of the DENA
Park Road (Figure 1) These data represent the vast majority of known geologic hazard sites and include
landslides debris flow drainages rockfall areas frost‐heaves and erosional undercutting due to fluvial
processes It should be noted however that these site rankings are not totally comprehensive instead
they represent our most complete knowledge as of 06292016 The DENA USMP rankings range from
164 to 948 with a mean value of 328 and more variance within higher ranking sites To put these values
in perspective immediately however the USMP qualitatively defines sites that score less than 200 to be
in ldquogoodrdquo condition sites that score between 200 and 399 to be in ldquofairrdquo condition and sites that score
400 or higher to be in ldquopoorrdquo condition
In theory sites in poor condition are more likely to pose persistent andor more serious problems along
the road and areas of higher risk density are more likely to see a higher concentration of problems In
DENA the current majority of our sites 67 rank in fair condition while only 9 are in good condition
and a relatively large number of sites 24 are in poor condition The only significant outlier was the
ldquoPretty Rocksrdquo slump (Figure 3b) with a score of 948 365 points higher than the next highest site
Spatially regions of higher USMP risk density (Figure 2) are most pronounced along Polychrome Pass
and the Eielson Bluffs areas Individual USMP scores represent the relative risk associated with a hazard
site and risk density represents the relative concentration of agency risk
3
Figure 1 DENA USMP site rankings on IKONOS imagery Icon sized is scaled by individual site rank and colored according to good fair or poor qualitative rank
Figure 2 DENA USMP score density on IKONOS imagery Density scaled by linear concentration and site ranking scores
Of the sites ranked in poor in condition along the Park Road many received prior mitigation or were
previously identified as areas of concern by maintenance or resource management personnel Some
previously noted severe geologic hazard sites in lsquoagreementrsquo with poor USMP scores include the ldquoPretty
Rocksrdquo slump (Figure 3a) debris flow activity at ldquoBugstufferrdquo creek (Figure 3b) the ldquoBear CaveMile 45rdquo
slump (Figure 3c) and the ldquoIgloo Debris Sliderdquo (Figure 3d) Additionally Polychrome Pass is a known area
of high geologic hazard occurrences This general agreement of USMP scores and professional
4
judgementinstitutional knowledge within DENA should be reassuring to park managers and help
demonstrate that the USMP ranking scores represent useful information and are based off of many
years of development from similar programs and expertise developed by FHWA AKDOT Oregon Dept
of Transportation and private firms The USMP provides an institutional framework for tracking these
known problem areas and has identified other new examples
A B
C D
A B
Figure 3 Previously recognized sites that rank in poor condition A ndash Pretty Rocks Slump (mile 454 948 points) B ndash Bugstuffer debris flow (mile 519 575 points) C ndash Bear Cave Slump (mile 45 411 points) D ndash Igloo Debris Slide (mile 377 514 points)
Current Applications to the LRTP
The USMP rankings provide a preliminary framework for understanding the relative severity of risk
associated with geologic hazards along the Park Road Although we do not currently make
recommendations tailored to specific sites or address possible future scenarios we suggest that an
awareness of the current results of the USMP rankings is beneficial to this LRTP Likely applications of
the USMP data to the LRTP would involve spatial analysis of USMP rankings as they relate to possible
disruptions in traffic programming of potential mitigation projects and overlap with future
infrastructure planning In order to facilitate this analysis we submitted a spatial database of our USMP
rankings to PaTINA (they are also available on request) We emphasize that these results are
preliminary yet they provide a method for understanding and considering geologic hazards in a broader
context Park planners and managers should continue to work with resource staff in understanding the
5
implications of these results however the following are potential applications to consider for the
current LRTP
All geologic hazards sites but in particular those in poor condition are more likely to pose
persistent andor serious problems along the Park Road These are areas where the
transportation corridor could experience interruptions or incur high maintenance costs as a
result of geologic activity Sites in poor condition should be considered for mitigation and
investigated in more scientific detail (see Future Work)
The USMP rankings may help identify geotechnical assets where hazards do not appear
extremely severe but may be candidates for mitigation from a risk‐based or cost‐based
perspective Rockfall sites that are not capable of producing catastrophic roadway failure but
require very frequent maintenance are good examples of this These sites also rank in poor
condition but may not otherwise receive attention from management
Density analysis of USMP site distribution identifies areas of non‐discrete geologic hazard areas
that may require alternate or more systematic mitigation efforts to increase cost effectiveness
The extreme concentration of hazard sites along Polychrome Pass is an example of such an area
Future Applications to the LRTP
Both the LRTP and USMP have been designed to evolve as new information become available through
time thus allowing for future applications with as new data become available Most transportation
agencies apply transportation asset management (TAM) systems to transportation assets such as
bridges and road surfaces however geotechnical assets such as rock slopes and embankments are
unlikely to be considered with the same detail (Stanley 2010) The USMP provides a system for
geotechnical asset management by creating a framework to establish potential performance measures
and targets for individual geologic hazards and the overall transportation corridor (Federal Highway
Administration‐DRAFT report 2015) We plan to update USMP rankings for the DENA park road as more
information is made available or new events occur and to perform a systematic re‐evaluation once
every five years By tracking USMP rankings over time the following performance measures could be
considered by transportation planners and park managers
Establish targets to reduce the overall number of fair or poor ranking sites along the park road
This could represent a total percentage reduction a maximum target number of poorfair sites
or a certain number of poorfair sites per unit distance along the road
Establish targets to reduce the risk at sites of particular concern (see Future Work)
A benefitcost analysis for all geotechnical assets along the transportation corridor could be
undertaken The USMP group is currently working on developing this tool and the effectiveness
of programmed mitigation projects could be measured by tracking costs vs performance
changes in geotechnical assets recorded by the USMP rankings
6
A method for tracking the performance of assets through time to establish a preferred course of
action As an example USMP scores at the site of the October 2013 slide that blocked the road
(Figure 3d) have been on a downward trend since May 2015 because of relative inactivity while
scores at the Pretty Rocks slump (Figure 3a) have remained higher or increased slightly because
of recent activity Establishing trends in USMP scores through time could be useful for
determining appropriate mitigation priority
Future Work
The USMP risk matrix provides a relatively robust assessment of geotechnical assets based on their
current condition and a way to track their performance through time However because of its
deterministic nature it does not directly consider possible or likely future conditions We hope to
address this limitation through the continued development of the geologic risk assessment Completion
of task 3‐5 of the risk assessment will allow us provide data which will help determine the probability of
future events based on geologic conditions and the associated risk based on transportation
infrastructure and human exposure The results of tasks 3‐5 will allow us to assess the potential outlook
of areas of the road based on their probability to experience new events Additionally we will expand
on the results of the USMP to examine high ranking sites in more scientific depth Examples of this may
include drilling bore holes at the Pretty Rocks slump to determine sub‐surface conditions examining
the relative abundance of fine‐grained sediment in debris flow watersheds or repeat GPS surveys to
ascertain motion rates such as are currently ongoing at the Bear CaveMile 45 slump By using all of
these data sets in conjunction we plan to propose specific recommendations and mitigation
considerations for sites of concern based on their current conditions and future outlook
References Cited
Federal Highway Administration 2015 DRAFT‐Unstable Slope Performance Measures for FLMAs using
USMP Ratings
Federal Highway Administration and National Park Service 2015 Comprehensive Memorandum of
Agreement DENA 208813 AB Denali National Park and Preserve ndash Conduct A Hazard Assessment Of
The Denali Park Road Corridor
Landslide Technology and Federal Highway Administration 2014 Geotechnical Asset Management ndash
Unstable Slope Rating Category Descriptions For Federal Land Management Agencies
Stanley D A 2010 Asset Management In A World Of Dirt ndash Emergence of an Underdeveloped Sector of
Transportation Asset Management TR News no 277 p 18‐22
7
Denali National Park and PreserveLong-Range Transportation Plan
Appendix D Current and Future Partner Projects
National Park ServiceUS Department of the Interior
1
1
Memo
To Denali National Park Long Range Transportation Plan Team
From ATKINS Email
Phone 720-841-2956 Date Sep 19 2014 Modified August 28 2017
Ref cc
Subject Possible Foreseeable ProjectsPlans near Denali National Park
Matanuska Susitna Borough LRTP
Source httpwwwmatsugovusplanslrtp
This transportation plan assesses growth in the Mat-Su Borough over the next 20 years and
identifies the key elements of the Boroughrsquos future transportation system that will be needed to
serve its growing communities The transportation plan will help the residents develop a Borough
that is a pleasure to live in with public infrastructure that supports their daily lives
Alaska Stand Alone Pipeline (ASAP)
Source httpwwwasapeiscom
The Alaska Stand Alone Pipeline (ASAP) Project is a 727-mile long 36-inch-diameter natural gas
transmission mainline extending from the GCF near Prudhoe Bay south to a connection with the
existing ENSTAR pipeline system in the Matanuska-Susitna Borough A 29-mile-long 12-inch-
diameter lateral pipeline will connect the mainline to Fairbanks The proposed pipeline will be
buried except at possible fault crossings elevated bridge stream crossings pigging facilities and
block valve locations
The pipeline will bypass Denali National Park and Preserve to the east and will then generally
parallel the Parks Highway corridor to Willow continuing south to its connection into ENSTARs
distribution system at MP 39 of the Beluga Pipeline southwest of Big Lake
The Alaska District US Army Corps of Engineers (Corps) has been designated the lead federal
agency and the US Bureau of Land Management (BLM) National Park Service (NPS) US
Environmental Protection Agency (EPA) US Fish and Wildlife Service (USFWS) US
Department of Transportation Pipeline and Hazardous Materials Safety Administration (PHMSA)
and the Alaska Department of Natural Resources State Pipeline Coordinators Office (SPCO) are
participating as cooperating agencies in the Supplemental Environmental Impact Statement (SEIS)
development process
2
2
Memo
Alaska LNG project
Source httpwwwarcticgasgovalaska-lng-project
The Alaska LNG export project would be among the worldrsquos largest natural gas-development
projects The project is in the pre-front-end engineering and design phase or pre-FEED The
project consists of constructing a 58-mile pipeline from Point Thomson gas field to Prudhoe Bay
and 800-mile pipeline from Prudhoe Bay to Nikiski
DOT Parks Highway Projects
Source httpdotalaskagovparks2014
The Alaska Department of Transportation and Public Facilities is performing road construction on
the Parks Highway during the construction season Work includes turn lanes passing lanes re-
surfacing bridge repairs
3
3
Memo
ADOTampPF Area Plans
Source httpwwwdotalaskagovstwdplngareaplansarea_regionalindexshtml
These are regional multi-modal transportation plans developed for specific areas of the state
designed to address movement between communities in the region and from the region to points
beyond Each of these plans incorporates economic modeling to evaluate potential projects and
prioritize them to best meet state and regional goals Denali National Park is partially included in
the Interior Alaska Transportation Planning Area The most recent plan for this area was adopted
in 2010 The plan includes transportation impacts to topic areas that include
bull Gas Pipeline
bull Mineral Development
bull Military Training
bull Railroad Development
bull Tourism
4
4
Memo The Plan examines potential impacts of these and other developments to highways rail aviation
and local community roads and although the plan did not fiscally constrain priority projects
several projects were identified as short-term capital improvement needs Among these projects
were recommendations for improvements on the George Parks Highway in the area of Denali
National Park This project as described by the plan includes passing lanes from MP 113 to MP
163 for an estimated cost of $15 million
Alaska Railroad ndash Healy Canyon
Source httpalaskarailroadcomPortals6pdfprojects2012_01_04_Healy_Canyon_Stabilization_FS_PROJpdf
Work is being proposed in Healy Canyon between Denali Park Station at Milepost (MP) 348 and Healy (MP 358) The Alaska Railroad has proposed projects to
bull Stabilize the track bed (ongoing)
bull Control the rock fall problems
bull ldquoDaylightrdquo (remove the top) Moody Tunnel at MP 3536 (complete)
bull Realign tracks around Garner Tunnel (complete)
bull Realign the tracks to enhance safety at MP 3536 (Moody Tunnel) and MP 357 (complete)
Proposed Susitna-Watana Dam
Source httpwwwsusitna-watanahydroorgprojectproject-description
Susitna-Watana Hydro could be a large hydro project on the Susitna River upstream of Denali
National Park This project would provide long-term stable power for generations of Alaskans and
have economic impacts on the area The project would generate 2800000 MWh of annual
energy once it comes online in 2024 The installed capacity is 600 megawatts (MW)
Environmental studies are currently underway
DOT Mile 231 Proposed Pedestrian Project
Source httpawsstateakusOnlinePublicNoticesNoticesViewaspxid=173914
The project scope includes constructing a new pedestrian bridge across the Nenana River trail
connections a rest area and intersection improvements Conceptual designs preliminary
engineering and environmental studies are currently underway
Other Area Energy Projects (Wind Coal Natural Gas exploration)
Eva Creek Wind Project Eva Creek is the largest wind project in Alaska at 25-megawatts It is
located 14 miles from Healy at the top of the 10-mile Ferry mining road
Usibelli Coal Mine Exploration License Plan of Operations Usibelli Coal Mine Inc has
submitted a request to carry out a Coalbed Methane drilling exploration program at a prospect site
approximately seven miles east of the town of Healy The project will consist of a single vertical
coal-bed methane exploratory well drilled inside the exploration license area The exploratory well
5
5
Memo will help determine whether sub-surface coal seams contain sufficient quantities of methane gas to
justify further exploration in the area (Source
httpdogdnralaskagovPermittingDocuments2014UsibelliUsibelli_LOCI_14_002_Drilling_at_H
ealy_Creek_Propect_Noticepdf)
Stampede State Recreation Area There is a potential designation of a Stampede State
Recreation Area west of the Panguingue Creek subdivision In March 2013 Senator
Representative David Guttenberg introduced HB148 in response to requests by the Denali
Borough Assembly
Borough Planning Commissioners are currently working through recommendations for area
management which include details of proposed allowed uses and a plan for land management
(Source httpnorthernorgtake-actionstampede-state-recreation-area-1)
Air Traffic ndash Overflights council
Source httpwwwnpsgovdenaparkmgmtaoachtm
The Denali National Park and Preserve Aircraft Overflights Advisory was established in 2007 to
consider resource conflicts between aircraft tours and park visitors on the ground The group is
charged with advising the National Park Service (NPS) on ways to mitigate (reduce) sound impacts
from aircraft flights over the park develop voluntary measures for assuring the safety of
passengers pilots and mountaineers and achieve desired resource conditions at Denali as
outlined in the Backcountry Management Plan (2006)
6
Denali National Park and PreserveLong-Range Transportation Plan
Appendix EPark Transportation Investment Needs Analysis
National Park ServiceUS Department of the Interior
Appendix E Denali National Park and Preserve Park Transportation
Investment Needs Analysis
Denver Service Center Planning Division | National Park Service | March 2017
1
Contents ABSTRACT 2
INTRODUCTION 2
PATINA DESIGN 3
OVERVIEW 3
VEHICLE MANAGEMENT PLAN 3
VECTOR ANALYSIS 4
DATA COLLECTION 4
TRANSPORTATION NETWORK 4
ASSET METRICS 5
HIGH RISK 5
INVESTMENT RANKING 6
GOAL AREAS 7
METHODOLOGY 8
DATA PREP 8
LAYER WEIGHTING 9
COMPOSITE ANALYSIS STEPS 10
SELECTED RESULTS 14
OUTPUTS 14
ROAD SEGMENT FINDINGS 16
Motorized Paved Zone 16
Wildlife Viewing Subzone 1 17
Wildlife Viewing Subzone 2 18
Wildlife Viewing Subzone 3 19
Wildlife Viewing Subzone 4 20
DISCUSSION 20
INTERNAL WEIGHTING 21
SKEWED DATA 21
SPATIAL SPREAD OF DATA 21
NEXT STEPS 22
2
ABSTRACT A Park Transportation Investment Needs Analysis (PaTINA) was performed in support of the Denali
National Park and Preserve Long Range Transportation Plan The PaTINA spatially models areas of
potential investment need by using a Geographic Information System to overlay geographic data The
data overlays are assigned a weight and added together where they are coincident in space The
resulting model visually depicts areas where multiple complexities occur This is compared with
transportation facility data to inform investment strategies The PaTINA results are shared in an
interactive web mapping environment and may be added to other mapping tools as a map service
INTRODUCTION The Park Transportation Investment Needs Analysis (PaTINA) synthesizes geospatial information to inform transportation planning and investment PaTINA takes into consideration the goals of the National Park Service (NPS) service-wide goals the goals of individual NPS units and the requirements of the Federal Highway Administration The combination of these goals is expressed in the Long Range Transportation Goals PaTINA creates geospatial-based analyses related to these goals and produces high-resolution outcomes that are site specific within the park unit PaTINA models use compiled data sources to create models related to transportation needs and restraints The vision goals and objectives established in the park unitrsquos Long Range Transportation Plan (LRTP) determine the input data for PaTINA As an analysis PaTINA is accomplished by overlaying map themes important to park management within
a Geographic Information System (GIS) and spatially comparing the overlay results to the transportation
network Metrics used by facility managers to rank assets of the transportation network in terms of
needed maintenance are then compared to the PaTINA results The analyses demonstrate where
priority areas may be located and can be compared to financial recommendations of LRTP The resulting
analyses can spatially inform the condition performance assessment needs identification funding
strategies and even funding prioritization
Modeled PaTINA results are shared as map services and presented in an interactive web mapping
application along with park facility and other relevant data The PaTINA process can be repeated with
model inputs and weights adjusted to reflect current park management needs
The PaTINA was originally developed as part of the Golden Gate National Recreation Area LRTP to help identify key areas where a confluence of conditions highlighted the need for investment consideration The recognized utility of the analysis led the Denali National Park and Preserve (Denali or park) LRTP team to request a PaTINA to help identify areas of concern that may not be readily discovered without geospatial tools
3
PATINA DESIGN
OVERVIEW The following are steps used to design create and implement PaTINA for the Denali LRTP At the
beginning stages of the LRTP goals are established for the Park Unit which includes Washington Federal
Highways and the Park Unit input Goal areas for Denali were system optimization resource
protection user experience access climate change and partners Each goal area was assigned
applicable GIS data layers which establish elements of the goal The data layers were given priority
weights depending on their importance on how it affects or is affected by the transportation network
Priority weights were determined with input from Denali park staff specialty experts
Once weights were established spatial analysis was performed to determine the overlap of each input
data layer within each goal area The weights of each input layer were added together where overlap
occurred The overlaying process identified areas where multiple inputs are spatially concurrent as well
as where inputs deemed as a higher prioritymdashmore heavily weighted--occur
The overlay results of each goal area were combined to generate the overall PaTINA composite denoted
as ldquoPotential Need Areasrdquo Throughout the LRTP process additional data themes outside the goal areas
were identified as a need and were categorized into three parts asset metrics high risk and investment
ranking These data were later added to the final web mapping product to compare to the Potential
Need Areas
VEHICLE MANAGEMENT PLAN In 2012 Denali prepared a Vehicle Management Plan (VMP) to evaluate alternatives for managing
vehicle use along the Park Road The preferred alternative of the plan proposed new management
zoning to include additional wildlife viewing subzones According to the VMP these subzones would be
implemented to clarify management objectives necessary to achieve desired conditions within specific
road sections Due to the significance of the segments for management purposes (Figure 1) it was
important to incorporate the sections into the initial design of the Denali PaTINA To do so the PaTINA
was applied independently to each road segment resulting in five separate sets of analyses Wildlife
viewing subzone 2 is split between 2a) from Teklanika River Bridge and the Eielson Visitor Center and
2b) east of Wonder Lake
4
Figure 1 Road segments defined in the Denali Vehicle Management Plan and used as a basis for the PaTINA
VECTOR ANALYSIS Following the methodology of the Golden Gate PaTINA the Denali PaTINA was completed as a vector
analysis Golden Gate was the pilot for the PaTINA effort which led to expectations that the process be
replicable at additional park units Vector analysis also has the added benefit of preserving spatial
geometries and attribution Attribution allows web map users to deconstruct the results to verify inputs
contributing to the composite result
DATA COLLECTION The following sections describe the categories of data that make up PaTINA and are included in the final
product
TRANSPORTATION NETWORK The transportation network for Denali first needed to be defined to create a spatial basis for the overlay
analysis For Denali the transportation network consists of roads trails parking lots railroad and
airstrips Each polyline transportation network features were assigned a width (Table 1) and then
2b
2a
5
buffered to that width to create a polygon input All polygon inputs were merged together to create a
final transportation network data layer
Table 1 Buffers applied to the Denali transportation network
Transportation Feature Width
Roads 11rsquo Trails 8rsquo
Railroad 100rsquo
ASSET METRICS Asset metrics included in the Denali PaTINA show facility condition index (FCI) and optimizer bands The
FCI rates the condition of a facility or asset using a numeric rating system This system reflects the
current replacement value of an asset and its projected cost of repairs Optimizer bands were developed
to divide a parkrsquos asset portfolio into five bands to represent the level of maintenance that each asset
should receive The metrics help staff make informed decisions about the allocation of limited funding
and staff time for maintaining park infrastructure
The FCI and optimizer band data were derived from the facility management software system (FMSS)
Assets in the transportation network data layer were joined together with the FMSS spreadsheet to be
able to show the asset metric information spatially The join was based on the Location ID attribute in
both the spreadsheet and spatial data A number of records in the spatial data were missing Location
IDrsquos so manual matching had to take place This was done by using aerial imagery to identify assets
based off of the FMSS location descriptions Assets that still couldnrsquot be identified through this method
received input from park staff via the web mapping tool by using create new features capability
Create New Features Tool in Web Map Site
The Create New Features tool allows users to generate data within the web map interface The user creates the geometry of the data and can also include information in predefined text boxes that gets added to the feature class attribute table Once the new feature has been created and saved it is automatically stored as a new record in a feature class that sits on a local server This benefits the GIS staff by having quick access to newly created data Because the data is automatically stored users can revisit the web map and see previous created features Geometry and text changes can be made to the feature after it has been created
HIGH RISK In winter of 2016 NPS regional and park staff as well as Federal Highway Administration (FHWA)
conducted a risk assessment workshop for Denali The purpose was to identify risk types and areas to
mitigate risk and provide recommendations to park management Those findings will be included in the
Denali LRTP There were a total of 28 identified risk types that were ranked into prioritization categories
from low to high Because of the importance of understanding where risk occurs and to mitigate future
events it was decided to include this information as spatial data into the PaTINA web map Only the
6
high risk category was added to the analysis due to the significance of these risks on Denalirsquos resources
visitors and staff
In total there were eight high risk types identified only six of which could be mapped Out of the six
remaining risk types three had data available The Create New Feature tool was used by park staff to
generate a data layer identifying locations of gravel production sites but was later omitted by the LRTP
team It was concluded that the site itself is not a risk to the transportation network but rather the
absence of gravel in these pits are The in holder access data was gathered from the NPS Lands
Resources Division to show tracts within Denali Culvert locations were derived from an excel
spreadsheet provided by FHWA ndash Western Federal Lands by plotting XY coordinates Lastly the
unstable slopes data was provided by park staff and was originally generated through FHWA in
collaboration with NPS Table 2 summarizes the risk data included in the PaTINA web map
Table 2 Summary of risk data used in the Denali LRTP
Risk Type Can it be mapped
Is data available
What is the source of the data
Inholder Access yes yes NPS Lands Resources Division
Implementation of LRTP no na
Staff Level Changes no na
Gravel Production Processing or Purchase yes no
Culverts (MampO) yes yes FHWAndash Western Federal Lands
Permafrost degradation yes no
River and Stream Flooding yes no
Unstable Slopes yes yes NPS FHWAndash Western Federal Lands
INVESTMENT RANKING A financial analysis was completed for the Denali LRTP resulting in development of investment
strategies An investment strategy combines goals and objectives of the LRTP agreed upon investments
and other transportation needs and constraints in the current funding environment One investment
strategy category is to Repair and Maintain the Unpaved Portion of the Denali Park Road and focuses on
desired condition targets which change depending on the Park Road segment This strategy aligns with
the VMPrsquos concept that the Park Road is less traveled by visitors farther into the park and those
segments with lower desired conditions can help reserve funding for other transportation asset
priorities
Due to the importance of financial analysis results it was decided to include the information as a spatial
component to PaTINA A table showing current and desired conditions for each segment with associated
milepost numbers was provided by one of the contractors working on the LRTP A GIS layer of mile
markers was used to correlate data from the table and create a new layer representing the financial
analysis Attribute information was added and the layer was symbolized by segment showing highest
priority and lowest priority Table 3 shows current and desired condition information that was
incorporated into the new investment ranking GIS layer These results can easily be compared to other
components such as high risk areas or goal area composites
7
Table 3 Financial analysis data based on mile markers
Mile Post Segment Current
Condition Desired
Condition Annual Needs
Priority Ranking
0 to 15 Entrance area to Savage River Trailhead
na 00 na 5
15 to 32 Savage River Trailhead to Teklanika Bridge
009 109 $013 M 4
32 to 39 Igloo Forest to Sable Pass 013 109 $014 M 4
39 to 43 Sable Pass to East Fork Bridge 013 109 $024 M 4
43 to 47 Polychrome to Plains of Murie 035 245 $074 M 2
47 to 62 Plains of Murie to Stony Overlook 013 149 $047 M 3
62 to 66 Stony Overlook to Eielson 014 149 $018 M 3
66 to 70 Eielson to Grassy Pass 017 325 $ - 2
70 to 88 Grassy Pass to Boundary Pit 012 325 $ - 2
88 to 92 Boundary Pit to Kantishna 0499 449 $012 M 1
GOAL AREAS During the early development of the Denali LRTP team members created six goal areas each with an
associated statement The goal statements represent aspects of the NPS mission and Denali vision
statements to help guide future transportation decisions These goal areas serve as a basis throughout
the LRTP for identifying baseline conditions performance management and implementation Table 4
shows the six goal areas and goal statements
Table 4 Denali LRTP goal statements
Goal Area Goal Statement
Resource Protection Understand and protect Denali NPPrsquos fundamental Park resources and values as they relate to the transportation system
Climate Change Plan for climate change impacts to the Parkrsquos transportation system
User Experience Provide a quality multi-modal Park experience for users
Access Provide safe efficient and appropriate Park access
System Optimization Develop a long-term transportation system to appropriately satisfy current and future Park needs
Partnership Manage formal and informal commercial partnerships to provide a viable transportation system
These goal areas served as a guide for GIS data collection Datasets related to each goal area were
identified collected and formatted as needed for the composite analysis The Partnership goal area is
not included in the PaTINA since no map-able data were identified Future iterations of the Denali
PaTINA may include the Partnership goal area if new data are obtained The System Optimization goal
was also not included in the analysis but rather it was called out separately for comparison in the final
model results This category is referred to as Asset Metrics (described above) and include FMSS-specific
data The purpose of this was to be able to spatially detect and understand the correlation between
FMSS data and the Parkrsquos values stated from the LRTP goal areas In total 26 GIS layers were used as
input layers for the analysis Layers from each goal area were overlaid upon each other so that the goals
8
could be visualized for the LRTP Listed below are the input layers for each of the goal areas used for the
analysis
Resource Protection
bull Sheep Gaps
bull Exotic Species
bull StreamRoad Intersections
bull Vegetation Monitoring Marker
bull Sheep^
bull Moose^
bull Bear^
bull Wolves^
bull Caribou (Aug-Sep)^
bull Caribou (July-Aug)^
bull Caribou (May-June)^
bull Wetlands
bull National Register Structures
bull Historic Districts
User Experience
bull Viewscapes
bull Visitor Services
bull Social Trails
bull Visitor Pattern
bull High Visitor Use Area
Access
bull Safety Areas of Concern
bull Railroad Depot
bull Bus Stops
Climate Change
bull Geohazards
bull Permafrost
^Based on extrapolated observation data reported in the Denali VMP
New data created by park staff for the PaTINA
During the process of collecting data data needs were recognized and collated Identified data gaps
included permafrost degradation river and stream flooding events informal aviation landing areas
congestion hotspots and wildlife patterns To fill certain gaps the Create New Features tool in the web
map was utilized by park staff Layers in the list above with an asterisk represent the ones created by
park staff Other identified data gaps focused on visitor use statistics Examples included dependable
traffic counts visitation numbers by area and visitor numbers on bus types beyond front country area
METHODOLOGY
DATA PREP All input data layers were projected to NAD_1983_Alaska_Albers Point and polyline datasets were
buffered and converted to polygon features and then clipped to the transportation network Figure 2
shows an example of a point layer created by park staff using the Create New Feature tool that was later
buffered and clipped Once the polygon data was created per input layer they were merged together to
create a single polygon layer For example park staff created multiple polylines and points to capture
visitor patterns along the Park Road The polygons were merged together to create a single visitor
pattern input layer under the User Experience goal area
9
Figure 2 Example of Denali staff input used to create data for the PaTINA
LAYER WEIGHTING Within the goal areas each input polygon layer was assigned a value The values ranged from 0 (no
impact) to 05 (lesser impact) to 1 (full impact) and was assigned by park staff Table 5 shows each goal
area and associated weighted values for each road segment The term ldquoimpactrdquo in this setting may refer
to impact the input layer has on the transportation network or conversely impact the transportation
network has on the input layer To align with the VMPrsquos subzones of the Park Road each input layer was
weighted separately for individual road segments Weighted per segment reflects park management
priorities which may vary for a particular input by road segment The High Visitor Use Area input layer is
an example of this where the impact is higher in the front country compared to further west on the Park
Road Therefore the High Visitor Use Area input layer received a higher impact value in the front
country road segment
10
Table 5 Layer input ranks assigned by park staff
RESOURCE PROTECTION GOAL AREA
Motorized Sightseeing
Subzone
Wildlife Viewing
Subzone 1
Wildlife Viewing
Subzone 2a
Wildlife Viewing
Subzone 3
Wildlife Viewing
Subzone 2b
Sheep Gaps 0 05 1 05 0
Exotic Species 1 05 05 05 05
StreamRoad Intersections 1 1 1 05 1
Vegetation Monitoring Marker 0 1 1 05 0
Sheep 05 05 1 0 0
Moose 1 05 05 1 05
Bear 05 05 1 05 05
Wolves 1 05 05 05 05
Caribou (Aug-Sep) 0 0 05 1 0
Caribou (July ndashAug) 0 05 05 1 0
Caribou (May ndash June) 0 0 0 05 0
Wetlands 1 05 1 1 05
National Register Structures 1 1 1 1 1
Historic Districts 1 1 1 1 1
USER EXPERIENCE GOAL AREA
Motorized Sightseeing
Subzone
Wildlife Viewing
Subzone 1
Wildlife Viewing
Subzone 2a
Wildlife Viewing
Subzone 3
Wildlife Viewing
Subzone 2b
Viewscapes 0 05 1 05 0
Visitor Services 1 1 1 1 1
Social Trails 1 1 1 1 1
Visitor Pattern 1 1 0 0 05
High Visitor Use Area 1 05 05 05 05
ACCESS GOAL AREA
Motorized Sightseeing
Subzone
Wildlife Viewing
Subzone 1
Wildlife Viewing
Subzone 2a
Wildlife Viewing
Subzone 3
Wildlife Viewing
Subzone 2b
Safety Areas of Concern 05 0 05 05 0
Railroad Depot 1 0 0 0 0
Bus Stops 1 0 0 0 0
CLIMATE CHANGE GOAL AREA
Motorized Sightseeing
Subzone
Wildlife Viewing
Subzone 1
Wildlife Viewing
Subzone 2a
Wildlife Viewing
Subzone 3
Wildlife Viewing
Subzone 2b
Geohazards 05 05 1 1 05
Permafrost 05 05 1 0 05
COMPOSITE ANALYSIS STEPS 1 Once the input layers were weighted the values were added into new fields in the attribute
table The new field names were abbreviated with each goal area name and input layer number
For example Resource Protectionsheep gaps would read as RP1 since sheep gaps was listed
11
first in the data collection table Another example would be Resource Protectionexotic species
shown as RP2 The following shows goal area abbreviations
a Resource Protection ndash RP
b User Experience ndash UE
c Access ndash AC
d Climate Change ndash CC
2 Within each goal area the input layers were combined with the transportation network layer
using the UNION tool creating a goal area output layer This resulted in the following layers
RP_Union UE_Union AC_Union and CC_Union
3 Using the DELETE tool all fields were deleted except for the five road segment fields This
reduced the file size of the output layer for future geoprocessing steps and faster speeds once
added to the web map
Steps 4-6 refer to only one goal area and one road segment For example Resource Protection
(RP)Motorized Paved Zone (MPZ)
4 A new field called RP_T_MPZ was added to the RP goal area output layer to sum the total
values This was completed by using the FIELD CALCULATOR tool and summing the MPZ value
for each input layer (RP1_MPZ + RP2_MPZ)
5 Due to the goal areas having a different number of inputs the total sum value was normalized
to avoid skewing the outputs to goal areas with more input layers By normalizing the total
values could be shown on a common scale A new field was added and called RP_TN_MPZ Using
the FIELD CALCUALTOR tool the RP_T_MPZ value was divided by the total number of inputs
resulting in a normalized number (RP_T_MPZ14= RP_TN_MPZ)
6 The RP goal area output layer was then clipped to a previously created MPZ road segment layer
(RP_MPZ_Clip)
Steps 1-6 were repeated for each goal area and road segment In total twenty clipped output layers
were created Figure 3 shows steps 1-6 in a flowchart
12
Figure 3 Process diagram for PaTINA steps 1 - 6
Steps 7-9 refer to only the MPZ road segment
7 The next step utilized the UNION tool to union each clipped goal area output layer by road
segment (RP_MPZ_Clip UE_MPZ_Clip AC_MPZ_Clip CC_MPZ_Clip = MPZ_Clip)
8 Once the MPZ_Clip layer was created a new field called All_MPZ was added to sum the total
normalized numbers The FIELD CALCULATOR tool was used and summed each goal areas
normalized number (RP_TN_MPZ + UE_TN_MPZ + AC_TN_MPZ + CC_TN_MPZ = ALL_MPZ)
9 The overall MPZ composite was then symbolized based on the total MPZ normalized values
(ALL_MPZ) and was shown with five classes using Natural Jenks classification The five classes
were symbolized from very low (dark green) low (light green) medium (yellow) high (orange)
to very high (red) which identified potential need areas throughout the transportation network
Figure 4 shows symbolization for the front country area in road segment MPZ
13
Figure 4 Mapped Potential Need Areas for the Motorized Paved Zone
Steps 7-9 shown in Figure 5 were repeated for each road segment In total five segments showed very
low to very high potential need areas
Figure 5 Process diagram for PaTINA steps 7-9
14
SELECTED RESULTS
OUTPUTS The PaTINA analysis resulted in four main output groups which may be viewed individually or compared
to one another These groups are asset metrics high risk areas investment rankings and potential
need areas See the Data Collection section for review of these groups
Figure 6 shows potential need areas against high risk areas located in Wildlife Viewing Subzone 3
segment of the Park Road The results appear to have several high risk areas spatially coincident with
high need areas highlighting locations that may be considered for financial investment Doing so may
help protect park resources and visitor safety
Figure 6 High Risk Areas shown with Potential Need Areas modeled in the PaTINA
15
Figure 7 shows potential need areas against high investment ranking along the Wildlife Viewing Subzone
2 segment of the Park Road The investment ranking displays two sections which are Igloo Forest to
Sable Pass (MP 32 to 39) and Sable Pass to East Fork Bridge (MP 39 to 43) Within the high investment
sections potential needs can be identified for further examination for future investment
Figure 7 Example PaTINA-modeled Potential Needs Areas shown with investment ranking data
16
ROAD SEGMENT FINDINGS
Motorized Paved Zone The motorized paved zone starts at the park entrance at mile post 0 and ends at mile post 149 (Figure
8) In this segment it appears that the greatest amount of very high potential need areas are
concentrated around the Denali Visitor Center and high potential need areas are located just east of
that surrounding the Riley Creek Campground These potential need areas consist of up to twelve input
layers each of which fall within all goal areas Findings also show the Park Headquarters and Savage
River to be potential need areas with values of medium and high
Figure 8 PaTINA-modeled potential need areas for the Motorized Paved Zone segment of the Park Road
17
Wildlife Viewing Subzone 1 The wildlife viewing subzone 1 spans the distance between mile post 149 to mile post 319 (Figure 9)
and includes the Sanctuary River campground and the Teklanika River campground and rest stop The
Teklanika River campground shows the largest very high potential need area Up to twelve input layers
from three of the goal areas cover this segment The access goal is not included Findings also show the
Sanctuary River campground and west of the Primrose Ridge and Mount Margaret rest stop to be a very
high potential need area though the spatial area is smaller compared to the Teklanika River
campground This location is comprised of up to thirteen input layers from all goal areas
Figure 9 PaTINA-modeled potential need areas for the Wildlife Viewing Subzone 1 segment of the Park Road
18
Wildlife Viewing Subzone 2a The wildlife viewing subzone 2a ranges from mile post 319 to mile post 66 (Figure 10) and includes
locations from Igloo Creek campground to Eielson Visitor Center The findings suggest that there are
many high potential need areas along this segment of road The most prominent areas are located
before and after Polychrome Overlook and includes up to ten input layers along this stretch The Eielson
Visitor Center shows very high potential need areas with up to twelve input layers from three goal
areas These findings may suggest future investment at this location due to high use at the visitor center
Figure 10 PaTINA-modeled potential need areas for the Wildlife Viewing Subzone 2 segment of the Park Road
19
Wildlife Viewing Subzone 3 Milepost 66 to mile post 846 is the wildlife viewing subzone 3 segment (Figure 11) which begins east of
the Eielson Visitor Center and goes to the Wonder Lake campground Results show west of the Eielson
visitor center with the greatest concentration of very high potential need areas A majority of this
segment ranges from very low to medium potential need areas until farther west near Wonder Lake
Wonder Lake campground consists of up to ten input layers from three goal areas
Figure 11 PaTINA-modeled potential need areas for the Wildlife Viewing Subzone 3 segment of the Park Road
20
Wildlife Viewing Subzone 2b The wildlife viewing subzone 2b starts at milepost 846 to mile post 920 being the farthest west of all
road segments (Figure 12) The only very high potential need area in this segment is located east of
Kantishna Results display that the very high area has up to 12 input layers from three goal areas The
east side of this area shows high potential need suggesting that this stretch could be identified as an
area for potential future investment
Figure 12 PaTINA-modeled potential need areas for the Wildlife Viewing Subzone 2b segment of the Park Road
DISCUSSION The Park Transportation Investment Needs Analysis (PaTINA) employs standard geospatial methods that can be repeated to reflect changing management goals as well as be applied in different facility management situations and scales The web mapping application deployed with the data allows for frequent review and consultation of the results to inform management decisions
21
Execution of the methods however requires intensive data gathering and formatting Further the
weighting process is currently accomplished in a desktop GIS after subject matter experts are polled for
input weights This process could be improved with tool development in either the desktop environment
or the online web map to streamline how GIS data are included and weighted in the model While the
process in its current state is repeatable in most cases it requires a GIS specialist and a desktop GIS to
complete We foresee improving either the desktop or online tool (or both) to make the process more
accessible and rapid Depending on the data inputs however the overlaying process may still require
extensive data collection and preparation Additionally the overlaying process can be computer
intensive--again depending on the data inputs--and may be prohibitive due to available resources
The data collection process in this analysis identified data needs which are collated separately and listed
above under Goal Areas Acquisition and incorporation of these data may improve the PaTINA results
Visitor use statistics are an especially glaring omission which if obtained will improve future PaTINA
modeling
Seasonal variations in some inputs are not well represented in the analysis Further work may entail
modeling specific seasons to help inform investment strategy throughout the year
INTERNAL WEIGHTING The PaTINA applied to Denali NPampP weighted each input layer uniformly across the spatial extent of the layer However some data contained attributions that could be weighted differently Because the weights were assigned by park staff for each input layer based on the road segments further weighting based on attributes internal to a layer would unnecessarily complicate the composite scoring Future iterations of the model for Denali may consider applying layer attributes to vary weights across the layer instead of applying weights per road segment Alternatively the weights assigned by road segment could be normalized against the attribute weighting but the statistical validity of this needs to be explored
SKEWED DATA The initial run of the PaTINA model showed skewed results within the front country segment NPS staff
clarified that specific locations within the front country segment should have been identified as very
high or high potential need areas instead of low and medium rankings The main concern was around
the Denali Visitor Center and vicinity that included the railroad depot trailheads and visitor amenities
As a known high visitor use area the visitor center and surroundings should be considered a high
potential for investment The data and associated weights were examined and it was concluded that the
user experience goal area was lacking desirable input layers to validate higher rankings Once the
additional input layers were identified they were added to the next run model and results showed
important locations such as the Denali Visitor Center with higher rankings
SPATIAL SPREAD OF DATA Input layers across the goal areas differ spatially within the road segments The resource protection goal
area is the only goal area in which input layers coincide with the transportation network within all five
road segments User experience and climate change goal areas are within four segments with no data in
22
the last segment wildlife viewing subzone 4 The access goal area contains data only within the first
segment motorized sightseeing subzone Although input weights are normalized for each goal area the
spatial spread of the data influences the results where more inputs are occurring
The results show classes of potential need areas throughout the entire transportation network due to
some input layers completely overlaying it These layers are exotic species each of the mammal layer
inputs excepting sheep and permafrost Due to the spatial spread of these data every area of the
transportation network can be classified as at some level of potential need for investment
NEXT STEPS The data and web mapping interface will require maintenance as updated or new data and web
mapping tools become available We see the initial release of the web map for the Denali PaTINA as a
first step toward a more comprehensive tool to aid the park in investment decision making As noted
above stream-lining the weighting and model execution processes would improve the overall utility of
the PaTINA
Additional development of the PaTINA web map may include incorporation of other map services such
as the NPS Road Inventory Program and data services from the Inventory and Monitoring network
Conversely the base PaTINA results can be added to other web map applications that may focus on
other issues
Finally development of instructional materials and accompanying training sessions would bolster and
help maintain the utility of the PaTINA results and its application to park management
National Park Service US Department of the Interior
Denali National Park and Preserve Long-Range Transportation Plan
Appendix F Denali Funding Plan
Denali National Park and Preserve Financial Analysis Technical Report ndash FINAL DRAFT
Introduction This report discusses the transportation funding aspects of the Denali National Park and Preserversquos first Long Range Transportation Plan It includes a retrospective of transportation funding from 2006-2013 a projection of funds expected to be available for transportation during the planrsquos twenty year planning horizon and a summation of the resources necessary to return transportation facilities at Denali National Park and Preserve (Denali NPP) to ideal conditions As is true for all of the National Park Service (NPS) the amount of funding that is needed for transportation at Denali NPP exceeds the amount that will be available in coming years and so this report includes an investment strategy that funds the highest priority needs
The discussion must begin with two of the NPSrsquos guiding transportation investment principles and Denali NPPrsquos primary existing transportation document the Vehicle Management Plan (VMP) It then discusses Denali NPPrsquos place in Alaska Region transportation funding and the expected increase in funding needs due to climate change impacts The middle section of this report discusses the LRTP methodology in general and how the Denali NPP LRTP methodology differs from those used for other NPS LRTPs There is also a discussion of historical forecasted and needed transportation funding that collectively make up the baseline transportation funding report for Denali NPP
This report concludes with a discussion of the funding strategies which were evaluated for the Denali NPP LRTP and how the final strategy was selected The investment strategy prioritizes operations and maintenance the rehabilitation of the paved section of the Park Road funds the unpaved sections of the Park Road to achieve management priorities and provides approximately $1m per year to address other transportation priorities The Denali NPP transportation investment strategy is expressed with respect to each of the four LRTP planning scenarios to guide park management decisions during times when visitation is increasing or decreasing and when funding (or stakeholder support) is higher or lower than average Funding shortfalls means that the condition of all transportation assets cannot be improved but progress can be made to address the highest priorities
Funding Denali Transportation Facilities
Capital Investment Strategy and Total Cost of Facility Ownership As a best practice and formal policy the NPS incorporates strategic facility planning into its asset management decision-making processes including LRTPs Two fundamental concepts the NPS Capital Investment Strategy (CIS) and Total Cost of Facility Ownership (TCFO) underlie those best practices and are drivers of the investment planning and decision-making reflected in the Denali LRTP
The NPS Capital Investment Strategy The CIS is an NPS strategy for prioritizing project investment to ensure effective and responsible project funding The CIS includes a scoring tool that decision-makers at all levels of the NPS have available to them to inform project investments and other asset management needs
The purpose of the CIS is to help prioritize investments focus on mission-critical assets manage operations and maintenance and ensure that the greatest impact can be made with available capital and operational funds The CIS uses a scoring tool to evaluate projects on a number of different criteria Financial Sustainability Visitor Experience Resource Protection and Health amp Safety The four categories are weighted using a predefined algorithm to arrive at an overall project score Projects can then be compared by score as needed in theory the greater the score the higher the priority The scoring strategy supports an asset management approach that emphasizes maintaining key assets and reducing the estimated value of deferred maintenance cost against those key assets
Some of the key objectives in the Financial Sustainability strategy are to build only what can be maintained right-size the asset portfolio reduce liabilities reduce resource consumption to promote sustainability and eliminate non-essential development in order to emphasize the essential natural and cultural experience The Visitor Experience strategy includes investment in assets or resources that enable recreation and serve as gateways to park units contact stations and interpretive assets The Resource
DenaliLong Range Transportation PlanFinancialTechReportndashFINAL DRAFT 1
Protection strategy focuses on those historic cultural and natural resources that the NPS is tasked with protecting and preserving Such tasks supported by the CIS could include preservation repair and restoration of assets Finally the Health amp Safety strategy places an emphasis on correcting unsafe or hazardous conditions within park units that pose a threat to visitors or staff Different parts of the Denali LRTP address these four strategies which are used by fund program managers to allocate limited funding
Total Cost of Facility Ownership Applying the concept of Total Cost of Facility Ownership (TCFO) is considered by the NPS to be a vital part of a financially sustainable infrastructure strategy and practice to truly address transportation asset management1 It aligns closely with the intentions behind the CIS especially the CIS Financial Sustainability component TCFO is the full life-cycle cost of constructing maintaining and operating an asset until it needs replacement This concept recognizes that assets require investment throughout their service lives until they need replacement or disposition and that preventive maintenance and facility operations activities are key to minimizing long-term costs and optimizing the life of said assets Implementation of the TCFO concept involves a shift-away from a ldquojust fix itrdquo or ldquorun to failurerdquo mentality to more holistic planning making cost estimates and decisions that consider not just the deferred maintenance (DM) of an asset but the ongoing OampM need over its service life need for replacement and ultimately disposition
The Denali LRTP team took the concepts inherent to the CIS and TCFO and embedded them into all of its LRTP analyses and planning activities Consequently the resulting investment strategy selected by Denali NPP staff is consistent with the approaches and practices used across the NPS to develop for example the National LRTP and other unit or regional LRTPs
The Denali Park Road and the Vehicle Management Plan Denali NPP is one of the most visited National Park Service units in Alaska and the Denali Park Road is the means for the majority of visitors who wish to traverse deep into the interior by any mode motorized or otherwise For many visitors it is the most readily accessible transportation corridor for them to experience the Alaska wilderness and for some it is their only option Denali NPP is currently several years into the implementation of its VMP the culmination of an intensive planning effort to balance the needs of the parkrsquos natural resources with high visitor demand The Denali LRTP is consistent with the recommendations in the VMP
Generally the VMP recommends limiting vehicle traffic on the Denali Park Road in order to reduce traffic impacts on natural and cultural resources The VMP has a ldquotelescopingrdquo approach where visitor activity is highest and associated development is most extensive in the paved entrance area of the park and declines and lessens respectively as the Park Road heads west As shown later in the section on Funding Strategies the Denali LRTP reflects this by realigning maintenance and rehabilitation investments along the Park Road to concentrate on the areas of highest visitor activity and most extensive development
Funding Trends The Federal Lands Transportation Program in the NPS Alaska Region The Federal Lands Transportation Program (FLTP) is the single largest source of transportation funding for the National Park Service and other Federal land management agencies Project funding decisions are made at the regional level following national guidelines The FLTP at a national scale has recently been reauthorized at a higher funding level than analyzed in this plan However interim program guidance suggests that the majority of the increase will be reserved for nationally significant major projects with only a small increase to regional allocations
Denali NPP has historically been the largest recipient of FLTP funding in Alaska in part because 20 of the Regionrsquos 27 miles of paved roads are within Denali NPP The unpaved Park Road may also be funded by FLTP NPS regional staff indicate that Denali NPP has in the past received all funding from the program by default unless another NPS Alaska Region park unit has eligible needs (which is rare) at which point that project from another park unit moves to the top of the regional FLTP program This means that FLTP will likely be a sustainable funding source for major investments at Denali NPP into the future The next three years of FLTP investment at Denali will be primarily used to rehabilitate the 15 mile paved section of the Park Road from the park entrance to the Savage River checkpoint
1 For example reference ldquoMemorandum Guidance for Addressing Facilities in Planning Documentsrdquo Associate Director Park Planning Facilities and Lands
National Park Service US Department of the Interior January 4 2016
DenaliLong Range Transportation PlanFinancialTechReportndashFINALDRAFT 2
Climate Change and Geotechnical Hazards As explained elsewhere in the LRTP current research indicates climate change is dramatically affecting transportation facilities across Alaska The impacts of climate change relevant to Denali NPPrsquos transportation system include thawing permafrost unstable slopes a lengthening shoulder season and other change indicators Most of these changes will result in higher costs to operate and maintain Denali NPPrsquos transportation network which will further stress already limited funding
Monitoring and evaluation of climate change impacts is an ongoing need and a recommendation of this LRTP Tracking threats and hazards to the transportation system such as unstable slopes requires funding for specialized equipment and the technicians and scientists who collect and analyze the data Funding updates to hydrology models and monitoring permafrost thawing are other near-term relatively inexpensive data needs that can help avoid disastrous impacts over the medium to long term Denali NPP has initiated the effort but funding has not been identified for developing specific plans for how to adapt the transportation system in the park to these expected impacts
In the near term a number of susceptible areas along the Park Road will likely encounter more frequent closures due to intermittent landslides flooding or debris flows with each requiring cleanup and reopening The future impacts of one of the effects of climate change increasing precipitation in the Denali Borough region can already be previewed during excessively wet years 2016 was a particularly wet year and staff were faced with unstable slopes and more frequent and more severe debris flows Beyond the cost of cleaning up after these road closures there are short-term disaster management tasks for which Denali must be ready ndash evacuation or care of visitors staff users and inholders on the far side of an interruption
Some dedicated funding sources are available for recovery costs such as NPS Emergency Storm amp Flood Damage and FHWArsquos Emergency Relief for Federally Owned Roads (ERFO) These programs have limited budgets and will be increasingly strained in an era of continued climate change impacts not just in Denali NPP but across the National Park Service These funding sources are currently limited to recovery costs only and cannot be used for monitoring or preventive work that can anticipate and avoid a future event such as by stabilizing slopes or realigning a road
There are several segments of the Park Road and its associated bridges and structures that may become physically or financially untenable in the next few decades There may come a time when the park will need to consider decommissioning rerouting andor relocating these facilities These costs are not yet known but will likely far exceed Denalirsquos typical past annual funding and may require special major project funding US Department of Transportation (DOT) discretionary grants such as the (unfunded) Nationally Significant Federals Lands and Tribal Projects program or Transportation Investments Generating Economic Recovery (TIGER) are possible sources as is the NPS Line Item Construction program However because these needs are not yet quantified and because they are beyond the capacity of the current funding programs to address the costs of fully adapting the transportation system to climate change are not included in the Denali LRTP financial analysis
Denali LRTP Funding Baseline Financial Analysis Methodology The financial analysis methodology for the Denali LRTP is based on the data and methods first developed for the NPS National LRTP (NLRTP) A much more detailed technical summary is available for the NLRTP and generally applicable to the Denali LRTP but this section will cover the basic steps as well as deviations used to adapt it to the unit level
Historical Investments Establishing a financial baseline of the historical average annual level of regional transportation spending provides a foundation for forecasting the
Annual transportation investments at Denali likely future available funding levels which can be anticipated for Denali NPP averaged $923 M per year from 2006-
NPPrsquos transportation facilities This is important information for developing a 2013 from all funding sources combined fiscally-constrained LRTP The LRTP team analyzed all of the fund sources that had been used for transportation investments at Denali NPP from fiscal year (FY) 2006 through FY 2013 These results provide a vital context for developing the Denali LRTP investment strategy
DenaliLong Range Transportation PlanFinancialTechReportndashFINALDRAFT 3
The LRTP team estimates that approximately $775 M per year will be available to Denali NPP for transportation purposes over the next six years
The financial data was extracted from various financial and project management data tracking systems2 The LRTP team
identified historical expenditures awards and authorizations for transportation assets
adjusted those prior year dollar values to equivalent 2014 values using GDP inflation factors and
calculated an annualized average transportation funding expenditure rate for the period FY 2006 ndash FY 2013
This data was initially prepared by the National LRTP team and then reviewed by the Denali LRTP team to remove any anomalies To simplify reporting the dataset was consolidated coded and grouped by funding authorizations funding programs work types and asset types All identifiable American Recovery and Reinvestment Act (ARRA) investments a one-time extra-ordinary funding source were removed from this analysis A detailed technical methodology document is available from the NLRTP effort
Because the data only includes transportation expenditures made by the National Park Service it does not include transportation
each funding source that Denali NPP has recently used for transportation It
funding and support with an increase in visitation) or ldquoSurplus of Moneyrdquo scenario (increased funding and support with a decrease in visitation) when compared to the historical average However for the purposes of the investment strategy in this plan the funding forecast is considered to be at the center of our ldquoManagement Strategies of no Regretrdquo - those actions that make sense given a normal variation in expected support funding and visitation levels
The Denali LRTP team leveraged the approach applied in the development of the NPS National LRTP to forecast anticipated funding availability for transportation investments in the near future There were two main sources of forecasting information
The NPS budget office The Budget Office conducts forecast exercises servicewide and with individual units The Budget Office suggested the LRTP program assume a one-time reduction to Title 54 (DOI) Non-Fee program fund sources of three percent for ONPS and Cyclic Maintenance programs in the NPS National LRTP The DENA LRTP forecast was based on a combination of actual funding program investment plans where possible and the three percent cut when it wasnrsquot The three percent reduction only applied to programs for which the Denali LRTP project team did not have access to an investment plan (eg Operational Base)
Regional Funding Programs The Denali LRTP project team consulted several regional-level program plans to acquire information on planned investment levels Title 54 Non-Fee programs for Cyclic Maintenance RepairRehabilitation and Line Item Construction Title 16 54 Fee programs for Recreation Fee Transportation Fee and Concession Franchise
investments by third parties The parkrsquos partners such as the Alaska Railroad bus concessioners Denali Borough and the Alaska Department of Transportation and Public Facilities (ADOTampPF) all fund transportation work that helps visitors employees inholders and freight carriers access the park However these investments are not accounted for in this analysis because these data do not enter NPS financial data systems
Forecasted Transportation Funding This section documents the Denali NPP financial forecast for transportation based on anticipated future funding levels that can be reasonably assumed to be available The forecast of available funding provides the principal financial constraint against which future investment plans must be prioritized and represents the result of the most likely funding scenario for
does not include a forecast for work done by other parties such as the State of Alaska or Denali Borough that may benefit Denali NPP and it also doesnrsquot include any unforeseen additional funding which may result in a ldquoPopular Parkrdquo scenario (increased
Fees and the Title 23 Federal Lands Transportation Program These forecasts replaced the National LRTP-style (ie three percent reduction) forecasts for these programs as they provide more certainty than broad program-level authorizations and appropriation amounts
The elimination of the Paul S Sarbanes Transit in the Parks Program (TRIP) is another factor to note in the forecast but the only analysis needed is to not project any future grant awards from this program Denali made use of TRIP in the past but will need to seek other funding sources to fund future transit and trails projects This is also true of various grant programs formerly used by many parks but not Denali NPP such as Scenic Byways or the Public Lands Highway Discretionary Program
2 Systems used included the NPS Administrative Financial System (ie AFS Versions 3 and 4) and the joint Federal Highway Administration (FHWA)NPS Park Roads and Parkways Transportation Allocation and Tracking System aka PTATS
DenaliLong Range Transportation PlanFinancialTechReportndashFINALDRAFT 4
Unfortunately transportation funding for Denali NPP is expected to decline unless additional funding sources are found or funds are redirected from other critical areas The declining funding environment coupled with historically high visitation may result in a ldquoLosing Groundrdquo scenario (decreased funding and support with an increase in visitation) when compared with historical averages These conditions are not dissimilar from recent years (eg 2013-2015)
Transportation Investment Needs Investment needs are defined in this plan as the amount of funding required to bring transportation assets to good condition and sustain them at that level Investment needs also include costs to address programmatic needs such as code compliance structural fire and accessibility Other goal area needs such as resource protection may overlap with asset management (TCFO) needs or may be additional potentially unfunded requirements
The LRTP team estimated an annual need of $1242 M to return the Denali NPP transportation system to good condition and keep it there over six years
The Denali LRTP used a similar methodology as the National LRTP and other Regional LRTPs using needs data from the best available data system or report that covers a particular type of transportation facility and type of work However many of the reports and systems available at the regional or national level do not apply to individual parks The principal difference between the needs in the Denali LRTP is the use of automated systems The data sources used for the Denali LRTP are
Reoptimization File OampM needs for all facilities except the unpaved Park Road
2013 Alaska Region Unpaved Road Analysis (pilot) Detailed analysis for the unpaved Park Road
Facility Management Software System (FMSS) Component renewal and programmatic needs
Project Management Information System (PMIS) Capital investment needs planning naturalcultural resources
National list of megaprojects Paved Park Road repair project and replacement of the Toklat River Bridge
Differences between the needs sources such as timespans and prioritization systems were reconciled in order to create a single set of transportation facility needs for Denali NPP Park staff also reviewed the needs data and removed several projects that were already underway or would be accomplished through partners rather than by the park At $1242 M per year the estimated annual transportation investments needs exceed the annual transportation funding amount by $467 M per year
Transportation Funding for Denali NPP This section discusses the current and near future transportation funding outlook for Denali NPP It covers where funds have come from and how they have been used in terms of what type of transportation facility was funded what type of work was funded and how transportation funding is prioritized
Investments by funding source From 2006-2013 the National Park Service as a whole used more than 60 different funding program and accounts to fund transportation activities but only ten programs funded investments at Denali NPP Table 1 below shows how much each funding program provided in the past how much it is expected to provide in the future and how much would be needed from each funding program to cover Denalirsquos total transportation need each year if past investment patterns were continued
DenaliLong Range Transportation PlanFinancialTechReportndashFINALDRAFT 5
Table 1 Denali NPP Transportation Investments and Needs by Funding Source (in millions of 2013 $)
Investments by funding source
Historical Average Annual Investment
Forecasted Annual Average Investment
Estimated Annual Needs
Title 54 Non‐Fee $175 M $101 M $335 M
Cyclic Maintenance $063 M $004 M $001 M Line Item Construction $034 M $032 M $007 M Operational Base $064 M $055 M $270 M Other NPS Programs $007 M $007 M $019 M
RepairRehab $007 M $002 M $039 M
Title 54 Title 16 Fee $134 M $211 M $261 M
Concessions Franchise Fees $067 M $144 M $051 M
Recreation Fee $067 M $067 M $210 M
Title 23 $601 M $462 M $586 M
FLTP $601 M $462 M $586 M
OtherExternal $014 M $001 M $060 M
FTA TRIPATPPL $012 M ‐‐ ‐‐
Reimbursable Agreements $001 M $001 M $060 M
Grand Total $923 M $775 M $1242 M
Each of these funding programs have a different legislative authorization and project eligibility criteria Title 54 programs are those authorized by Title 54 of the US Code (National Park Service-specific programs) Title 16 includes other relevant Department of the Interior programs (ie Recreation Fee Program) Title 23 includes programs overseen by the Federal Highway Administration and the ldquoOtherExternalrdquo category includes other funding sources such as the discontinued TRIP program as well as reimbursable agreements donations partnerships and other less common sources
Investments by Facility Type
Denali NPP maintains a diverse system of transportation facilities including paved and unpaved roads bridges paved and unpaved transportation trails transit facilities developed airstrips as well as support infrastructure such as a materials (gravel) quarry Table 2 below shows historical investments forecasted investments and the estimated annual investment needs for each of the parkrsquos transportation facility types
Of all historical investments in transportation at Denali NPP in the recent past about 55 went to the Park Road and associated structures and 18 supported parkwide operations that include the Park Road Less than a third was used for separate transportation facilities such as trails and access roads Park Road funding was oriented to the unpaved segments that require frequent repair work to remain in even fair condition given the extreme conditions and heavy vehicle traffic in Denali NPP Recent investments in several difficult sections in the western end of the Park Road helped restore user comfort and safety
DenaliLong Range Transportation PlanFinancialTechReportndashFINALDRAFT 6
Table 2 Denali NPP Transportation Investments and Needs by Asset Type (in millions of 2013 dollars)
Historical Forecasted Average Annual
Average Annual
Estimated Annual
Asset Type Unpaved Roads
Road Bridges
Trails and Transit
Investment $386 M
$184 M
$147 M
Investment $235 M
$042 M
$066 M
Needs $527 M
$135 M
$137 M
Paved Roads $144 M $291 M $297 M
Other3 $051 M $053 M $066 M
Parking $011 M $089 M $081 M
Grand Total $923 M $775 M $1242 M
Historical Forecasted Average Average Estimated Annual Annual Annual
Lifecycle Stage Investment Investment Needs Planning and Administration4 $058 M $057 M
Capital Investment $134 M $259 M $130 M
Operations and Preventive Maintenance $045 M $048 M $186 M
Recurring Maintenance $142 M $083 M $374 M
Component Renewal $527 M $259 M $508 M
Grand Total $923 M $775 M $1242 M
Denali NPPrsquos greatest area of transportation investment need is in heavy repair and rehabilitation work similar to much of the rest of the National Park Service Insufficient funding often leads to smaller routine maintenance work being deferred which causes transportation facilities to fall out of a state of good repair Other significant needs at the park include annual operations and maintenance of transportation facilities and making improvements to culverts that provide for fish passage and building an aircraft hangar
Note that some categories such as capital investment show ldquosurplusesrdquo where more funds are forecasted for investment than are needed This is the result of project programming where several capital investment projects are scheduled for near-term
Investments by Asset Lifecycle stage As discussed in the section on Total Cost of Facility Ownership different types of work are needed at different points in a transportation facilityrsquos lifespan from planning through to rehabilitation or disposition Table 3 below shows historical and forecasted annual investments as well as estimated annual investment needs for each lifecycle stage for all asset types combined
Table 3 Average Annual Investments by Lifecycle Stage (in millions of 2013 dollars)
construction in 2016-2021 whereas the needs represent the average annual needs over twenty years
3 Other category includes aviation buildings that support transportation equipment and multimodal facilities Trails and Transit notably excludes investments and OampM spending made by the transit contractors who operate within Denali NPP but does include Denalirsquos own investment in bus transit facilities such as buildings lots and experimental hybrid buses 4 Routine planning and administration needs are not included in NPS facilities management data systems but can be assumed to continue at historical levels Additional unquantified planning needs are likely in the LRTPrsquos horizon including work in the parkrsquos entrance area coordination with private shuttle services and the Alaska Railroad and transportation planning to maintain park operations in the face of climate change impacts
DenaliLong Range Transportation PlanFinancialTechReportndashFINALDRAFT 7
Priority Estimated Annual Optimizer Band Equivalent Transportation Needs
Highest Priority $377 M Band 1 High Priority $584 M Band 2 Other Priority $281 M Bands 3 4 5
Programmatic Needs Some of the lifecycle stage needs are also considered programmatic needs for transportation facilities at Denali NPP Programmatic needs include work necessary to meet standards set by safety accessibility environmental and fire safety requirements It is generally analogous to code compliance work that would be the responsibility of a facilities manager or an architect hired by a private business
Figure 1 summarizes estimated programmatic needs for the Denali NPP transportation asset portfolio which total less than $300000 Transportation facilities generally have relatively small programmatic needs compared to facilities such as visitor centers housing and offices Although not broken out in the historical and forecast data these types of projects are included in the NPS Facility Management Software System (FMSS) as needs Denali NPPrsquos programmatic needs are included in the overall $1242 M per year needs as capital investment or component renewal needs They are classified as capital investment if plans are to proactively address them as individual projects or as component renewal when addressed through a rehabilitation project that focuses on a low condition rating
Figure 1 Denali NPP Transportation Programmatic Needs
Investments by Asset Priority The final classification for investments is what priority of assets they were used to build maintain or repair NPS financial and asset management systems do not support this analysis for the historical or forecast data Each future investment need at Denali NPP is associated with the priority of the asset or the project itself this is shared below in Table 4 For the purposes of this plan Highest Priority is generally defined as Optimizer Band 1 High Priority is defined as Optimizer Band 2 Optimizer bands 3-5 are defined as ldquoother priorityrdquo Although they are not banded as such critical Park Road work is labeled as Highest Priority consistent with the priorities discussed during the investment strategy section later in this report
Table 4 Estimated Annual Needs by Priority
Denali NPP differs from other National Parks and the NPS as a whole due to the relatively low proportion of the total need in the highest
DenaliLongRangeTransportation PlanFinancialTechReportndashFINALDRAFT 8
priority need category Many transportation facilities in Denali NPP have been categorized in optimizer bands 2-5 This reflects the values laid out in Denali NPPrsquos Foundation Statement that place a high priority on investment in resource protection science and other portfolio areas ahead of transportation and broader visitor use needs As a result the park is able to cover its entire highest priority transportation needs given current funding In fact the $775 M per year in forecasted funding is enough to cover 80 of the highest and high priority transportation needs combined However there are still high priority transportation needs that will remain unmet unless additional funding is found and longer-term and lower-priority needs that cannot be met with forecasted funding
Investment Strategies The final step of the financial planning process for NPS LRTP development is the formulation of an investment strategy It is a synthesis of the planrsquos goals and objectives already formulated projects and other transportation-related needs and the reality of the constraints that exist in the current funding environment This section of the report describes the process used by the Denali LRTP team to identify several potential investment strategies including the strategy selected by Denali NPP staff for the Denali LRTP It also discusses potential alternatives which park management may consider if future funding or visitation deviates significantly from the forecast referencing the planning scenarios used in the development of the Denali LRTP
Methodology The key to understanding the funding strategy process is that funding in a constrained environment is a zero-sum game All investment strategies make use of the same $78 M annual funding amount that is forecasted for the near future Because transportation needs exceed this amount and because moving funds from other purposes deprives those projects of needed funding all investment strategies shift funds from one set of priorities to another The OampM strategy option shown in Table 5 for example focuses on staying current on annual operations and preventive maintenance work at the expense of larger repair projects
Unlike the plans for the National Capital Southeast Midwest Regions and the NPS as a whole the Denali LRTP used a single modeling tool to model the results of the different funding strategies on the Denali NPP transportation system A deferred maintenance (DM) FMSS-based tool was modified by a contractor (Booz Alan Hamilton) to work at the unit level and take into account park specific facilities such as the unpaved Park Road This tool uses extracts from FMSS to estimate Facility Condition Index (FCI) and DM outcomes given a known annual funding level The FCI outcomes reported for this effort are lsquoAdjusted FCIrsquo which includes programmatic needs and an anticipated 35 cost markup in addition to the ldquorawrdquo DM normally used in calculation of the FCI
Strategy Development Process
Methodology and Initial Strategy Concepts The team held several workshops and follow-up discussions with NPS stakeholders and partners to identify candidate strategies and to select the Denali NPP LRTP Investment Strategy (p 12) Internal NPS stakeholders included Denali NPP staff Alaska Region staff and the Washington Support Office (WASO) Partner input included expertise from FHWA Western Federal Lands Highway Division and US DOT Volpe Center staff familiar with the NPS LRTP financial planning process
The team worked with stakeholders to identify potential candidate strategies in light of CIS and TCFO policies best practices and past investment patterns (see Table 2 and Table 3) The initial investments strategies are shown in Table 5 below and were based on trends discussed by the project team early on in the Denali LRTP
DenaliLong Range Transportation PlanFinancialTechReportndashFINALDRAFT 9
The reaction to the strategies from park staff indicated high interest in the OampM strategy ndash if the park is able to at least stem the growth in deferred maintenance using its typical transportation funding sources then the park can later seek out additional funds to rehabilitate facilities that are no longer in a state of good repair The specificity of the three strategies that make different kinds of improvements was eliminated in favor of a general ldquomake improvementsrdquo strategy since transit and trails enhanced ITS and safety and emergency response are all priorities at the park that vary from year to year Finally Denali NPP staff noted that given its current condition the unpaved section of the Denali Park Road could still be one of the best unpaved roads in Alaska even with a reduction in maintenance levels so exploring redirecting some funding from the Park Road to other facilities in the park might be
Table 5 Initial Investment Strategy Concepts
Investment Strategy Option
Invests inhellip At the expense ofhellip
Business as usual Highest priority assets Lower priority assets
OampM emphasis Fund 100 of annual OampM needs for all assets Capital investments and rehabilitation
Transit and trails $1 M for existing transit and trails before other investments $1 M for roads and parking
Make improvements $1 M per year for new assetsservices (eg employee transit real-time bus trackers new trails)
$1 M less for annual OampM and rehabilitation
Safety and programmatic needs
Programmatic and safety needs before everything else (eg accessibility slope stability)
$1 M less for annual OampM rehabilitation
a viable option Various sections of the Park Road meet different condition criteria from good to fair to poor
Refined Investment Strategies No one strategy rose above others as a preferred strategy in the first round of modeling but the number of strategies was narrowed to two Both strategies funded all operations and maintenance needs and ensure that planned projects such as the paved Denali Park Road rehabilitation are completed but one option set aside $1 M per year for improvements or new facilities Table 6 below shows the tradeoffs of the two refined general strategies
Table 6 Refined Investment Strategies
Strategy Invests inhellip At the expense ofhellip
Cover all OampM complete planned projects
OampM and critical near-term repair needs
Making improvements
Cover all OampM complete planned projects and reserve $1Myr for improvements
OampM critical near-term repair needs and improving transportation at Denali
Buying down deferred maintenance
Unpaved Denali Park Road Analysis In addition to these two strategies Denali NPP staff also wanted to test whether transportation funds allocated to the unpaved Park Road in a business as usual approach could be shifted to other purposes The LRTP team as well as staff from Denali NPP and the Alaska Region developed five different options for unpaved road condition targets that could be modeled to estimate costs of different sets of conditions Table 7 below summarizes these five sets of condition targets Each of the two general strategies were tested using the five sets of condition targets for a total of ten investment strategy and condition results The strategies in Table 7 highlighted in red were not achievable give projected funding levels and established higher priorities
DenaliLong Range Transportation PlanFinancialTechReportndashFINALDRAFT 10
Table 7 Unpaved Park Road Conditions
Strategy Goals Annual Cost
Plan A Maintain all Park Road segments in good condition $43 M
Plan B Maintain all Park Road segments in fair condition $37 M
Plan C Set Park Road conditions from segment to segment recognizing that some segments are costlier to maintain in good condition than others
$29 M
Plan D Follow the VMPrsquos ldquotelescopingrdquo approach by keeping conditions good in the first part of the road fair in the middle part and poor at the western end
$25 M
Plan E Follow the VMPrsquos ldquotelescopingrdquo approach by keeping conditions good to fair in the first to middle parts of the road and poor at the western end
$27 M
Plan F VMP ldquotelescopingrdquo approach as in Plan E but with further lowered condition targets for two of the most expensive areas - MP 43-47 and MP 88-92
$20 M
Refined Strategy Results
general strategy was discarded Even without reserving $1 M per year projected funding is insufficient to meet the good to fair
Unlike the initial strategies several of the refined strategies were not viable None of the condition targets on the unpaved Park Road could be met if Denali NPP was to reserve $1 M per year for making improvements elsewhere on the park and so that
conditions proposed under plans A and B for the unpaved park road without scaling back commitments to OampM planned repaving of the paved sections of the Park Road and the rest of Denali NPPrsquos transportation facilities Additional funding could make Plans A and B possible ndash about $13 M per year more would allow for Plan A to be achieved and $07 M more per year would allow plan B to be achieved
Plans C D E and F are viable given currently constrained funding levels Plan C shows that it is possible to meet all of the investment strategyrsquos commitments and still maintain the unpaved Park Road on a segment-by-segment basis The conditions explored in Plan C take the relative expensive of each segment into account and the most difficult segments are allowed to remain in fair to poor condition However modeling showed that meeting these conditions would provide almost no funding for other transportation priorities
Plan D applies the Vehicle Management Planrsquos ldquotelescopingrdquo approach to the maintenance of the unpaved Denali Park Road and targets mid-poor condition for the farthest west segments which are intended to be more rustic and less traveled but keeps the middle and eastern segments in fair to good condition Under this plan nearly $05 M per year would be available for other transportation priorities Plan E made slight changes to keep more of the road in good condition instead of fair
Plan F was ultimately selected as the condition target for the Denali NPP LRTP This option retains the approach of Plan E but reduces condition targets for two sections which are particularly challenging and expensive to maintain Under plan F Polychrome Pass would be improved slightly (but still be in poor condition) while the final stretch of the park road would be allowed to decline to poor condition These two changes free about $06 M per year for use elsewhere on the road and in Denali NPP More information about these two segments is provided in Appendix A at the end of this technical report
Denali LRTP Investment Strategy The refined strategy results narrowed down the policy options for the unpaved Park Road and led to the selection of the Denali LRTP Investment Strategy as the best fiscally-constrained option for meeting the goals and objectives of the plan This strategy
DenaliLong Range Transportation PlanFinancialTechReportndashFINALDRAFT 11
would invest Denalirsquos forecasted $775 M per year in four categories as shown below in Table 8 and Error Reference source not found below
Table 8 Denali NPP LRTP Investment Strategy
Category Estimated share Estimated annual Percentage of of annual funds investment needs met
Operations and Preventive 37 $29 M 100 of needs Maintenance (all met transportation assets)
Rehabilitate Paved Portion of 24 $19 M 100 of needs the Denali Park Road met
Repair and Maintain the 26 $ 20 M 46 of needs met Unpaved Portion of the Denali Park Road
Repair and Improve Other 13 $ 10 M 24 of needs met High-Priority Transportation Assets
Totals 100 $ 78 M 63 of all needs met
The Denali LRTP Investment Strategy strikes a balance between several different priorities for transportation at the park and lies within the ldquoManagement Actions of No Regretrdquo area of the Denali LRTP scenario chart The strategy proposes to fully fund OampM needs in order to slow the decline of facilities and ensure a better visitor experience It continues planned investments on the paved section of the Park Road to achieve a good condition rating and continues to make funding available to address deferred maintenance on the unpaved sections of the Park Road However the strategy sets lower condition targets for sections of the unpaved Park Road which are further into the park and which are less traveled by visitors in order to reserve funding for other segments of the Park Road and for entrance area transportation facilities (eg aviation parking areas new priorities) This approach is consistent with the Vehicle Management Plan which envisions lower traffic volumes and a more rustic experience the further the road extends from the park entrance area
Ultimately because funding needs exceed available resources the condition of transportation facilities at Denali NPP is expected to decline overall FCI ratings across the Denali NPP transportation system today are modeled at 0148 or the low end of fair condition Continued scarce funding for transportation will reduce conditions to 0185 by 20215 However higher priority transportation facilities are expected to remain in fair condition overall as described by the Investment Strategy
5 FCIratings are modeled on a 0‐1 scalewhere0000isperfect conditionand1000iscompletelydegradedcondition
DenaliLong Range Transportation PlanFinancialTechReportndashFINALDRAFT 12
DenaliLRTPInvestment Strategy 13
37
26
24
OperationsandPreventiveMaintenance(all transportationassets)
RehabilitatePavedPortionoftheDenaliParkRoad
RepairandMaintaintheUnpavedPortion ofthe Denali Park Road
RepairandImproveOtherHigh‐PriorityTransportationAssets
The funding forecast in the Denali LRTP is only the most likely scenario for each program and in reality the amount of annual transportation funding will vary as will visitation Table 9Error Reference source not found below shares some management actions for when funding and visitation levels take Denali NPP out of the area of management actions of no regret Generally when visitation is lower it is a better time for disruptive work such as addressing major needs and accomplishing maintenance projects that were deferred Times of high visitation call for more investment in OampM and investment in new services to meet emerging visitor needs When funding prospects are good then more money is available to make improvements catch up on deferred maintenance and prepare plans for the future When funding is short then many necessary improvements have to be delayed and park staff can only fund core operations and critical repair work
Figure 2 Denali LRTP Investment Strategy
Denali Investment Strategy and LRTP Scenarios All of the funding strategies considered for the Denali NPP LRTP assumed the same funding forecast and would fall within the ldquoManagement Actions of No Regretrdquo area on the scenario planning graphic reproduced in Error Reference source not found below This area represents a balance between times of high and low visitation and high and low funding for the park It is calibrated based on an average of funding and visitation over time Years within one standard deviation of these means lie within it if they are more than one standard deviation away from the average then they are said to be in one of the four ldquoquadrantsrdquo
DenaliLong Range Transportation PlanFinancialTechReportndashFINALDRAFT
Figure 3 Denali LRTP Scenarios
13
Table 9 Potential Management Actions by Scenario
Losing Ground Popular Park
Emphasize more of Funding OampM Introducing new services
Emphasize less of Making improvements Funding deferred maintenance Initiating major capitalrehabilitation projects
Emphasize more of Funding OampM Making improvements Introducing new services Planning for future needs
Emphasize less of Funding deferred maintenance Initiating major capitalrehabilitation project
Turn out the lights Surplus of Money
Emphasize more of Funding deferred maintenance
Emphasize less of Funding OampM Making improvements Introducing new services
Emphasize more of Making improvements Funding deferred maintenance Initiating major capitalrehabilitation projects Planning for future needs
Emphasize less of Funding OampM Introducing new services
14DenaliLong Range Transportation PlanFinancialTechReportndashFINALDRAFT
Appendix A Unpaved Park Road Condition Targets
Unpaved Denali Park Road Condition Targets Plans C D and E for the unpaved Denali Park Road examined options for managing each segment of the road to an individually set condition target Each of these targets is based on the overall Vehicle Management Plan and accounts for past challenges or known issues with individual segments Plan F was ultimately selected for its ability to maintain acceptable condition levels while also freeing up funding for other transportation needs In particular Plan F was selected because the condition targets reflect the overall management approach to the road where the western-most sections are desired to be more rustic and remote-feeling and the eastern-most sections are in better conditions to handle more intensive use Tables 10 and 11 below summarizes the conditions for the unpaved segments of the Denali Park Road under the Denali LRTP investment strategy
Conditions are measured in FCI where a higher value represents worse condition and a lower value represents better condition FCI data for the unpaved Park Road is based on estimates by staff responsible for maintaining the unpaved Park Road after the 2016 opening
Table 10 Conditions of Unpaved Segments of Denali Park Road Reflected in Denali LRTP Investment Strategy
Mileposts Segment Name Current Condition
Target Condition
Change in Condition
MP 15 to 32 Savage to Teklanika Bridge Low‐good High‐fair Small decline MP 32 to 39 Igloo Forest to Sable Pass Mid‐fair High‐fair Small improvement MP 39 to 43 Sable Pass to East Fork Bridge Mid‐fair High‐fair Small improvement MP 43 to 47 Polychrome to Plains of Murie Mid‐poor High‐poor Small improvement MP 47 to 62 Plains of Murie to Stony Overlook Mid‐fair Low‐fair Small decline MP 62 to 66 Stony Overlook to Eielson Low‐fair Low‐fair No change MP 66 to 70 Eielson to Grassy Pass High‐poor Mid‐poor Small decline MP 70 to 88 Grassy Pass to Boundary Pit Mid‐fair Mid‐poor Moderate decline MP 88 to 92 Boundary Pit to Kantishna Very‐poor Low‐poor No change
DenaliLong Range Transportation PlanFinancialTechReportndashFINALDRAFT 15
Table 11 Denali Unpaved Park Road Segments ‐‐Current Conditions and Strategy Conditions Explored During LRTP Development
Plan A Plan B Plan C
Plan A Plan B Plan B Plan C Current Desired Plan A Strategy Annual Strategy Plan C
Mileposts Segment Name Conditions Conditions Annual Needs Conditions Needs Conditions Annual Needs
MP 15 to 32 Savage to Teklanika Bridge 009 0109 $ 013 M 013 $ lt01 M 0109 $ 013 M
MP 32 to 39 Igloo Forest to Sable Pass 013 0109 $ 014 M 012 $ 011 M 0129 $ 093 M
MP 39 to 43 Sable Pass to East Fork Bridge 013 0109 $ 0 24 M 013 $ 020 M 0139 $ 019 M
MP 43 to 47 Polychrome to Plains of Murie 035 0109 $ 120 M 014 $ 110 M 0245 $ 074 M
MP 47 to 62 Plains of Murie to Stony Overlook 013 0109 $ 070 M 013 $ 056 M 0139 $ 052 M
MP 62 to 66 Stony Overlook to Eielson 014 0109 $ 025 M 014 $ 020 M 0139 $ 0 20 M
MP 66 to 70 Eielson to Grassy Pass 017 0109 $ 044 M 014 $ 037 M 0169 $ 030 M
MP 70 to 88 Grassy Pass to Boundary Pit 012 0109 $ 056 M 012 $ 051 M 0169 $ 0 32 M
MP 88 to 92 Boundary Pit to Kantishna 0499 0109 $ 072 M 014 $ 068 M 0324 $ 043 M
Total MP 15 to 92 Total Total $ 435 M Total $ 376 M Total $ 293 M
Plan D Plan E Plan F (Selected)
Plan D Plan E Plan E Plan F Current Strategy Plan D Strategy Annual Strategy Plan F Annual
Mileposts Segment Name Conditions Conditions Annual Needs Conditions Needs Conditions Needs
MP 15 to 32 Savage to Teklanika Bridge 009 0109 $ 013 M 0109 $ 013 M 109 $ 013 M
MP 32 to 39 Igloo Forest to Sable Pass 013 0109 $ 014 M 0109 $ 014 M 109 $ 014 M
MP 39 to 43 Sable Pass to East Fork Bridge 013 0109 $ 024 M 0109 $ 024 M 109 $ 024 M
MP 43 to 47 Polychrome to Plains of Murie 035 0149 $ 11 M 0149 $ 11 M 245 $ 074 M
MP 47 to 62 Plains of Murie to Stony Overlook 013 0149 $ 047 M 0149 $ 047 M 149 $ 047 M
MP 62 to 66 Stony Overlook to Eielson 014 0149 $ 018 M 0149 $ 018 M 149 $ 018 M
MP 66 to 70 Eielson to Grassy Pass 017 0325 $ - 0325 $ - 325 $ -
MP 70 to 88 Grassy Pass to Boundary Pit 012 0325 $ - 0325 $ - 325 $ -
MP 88 to 92 Boundary Pit to Kantishna 0499 0325 $ 043 M 0325 $ 043 M 449 $ 012 M
Total MP 15 to 92 Total Total $ 266 M Total $ 266 M Total $203 M
Plan F Unpaved Road Segments The final change that the LRTP team made while discussing the road strategies with park staff was to lower the condition targets for two of the most difficult segments along the unpaved Park Road This section describes these two segments and how accepting a lower condition in these areas can allow for better conditions on other parts of the Denali NPP transportation system
Mileposts 43 to 47 Polychrome Pass to the Plains of Murie The unpaved Denali Park Road segment of Polychrome Pass to the Plains of Murie has been identified by Denali NPP staff as especially difficult to maintain and repair It is facing significant geotechnical hazards that will worsen as time goes on and climate
DenaliLong Range Transportation PlanFinancialTechReportndashFINALDRAFT 16
change accelerates permafrost thaw Making improvements to this section that would take it from the middle of the poor condition band to the low end of fair condition band as explored in Plan D is projected to cost $107 M per year Making lesser improvements from the middle of the poor condition band to the high end of the poor condition band as called for in Plan C would cost $074 M per year instead saving $033 M per year for other uses Thus the selected strategy (Plan F) will target a condition rating at the high end of the poor band instead of a fair rating as with other segments in the central segment of the unpaved Denali Park Road (Igloo Forest to Eielson Visitor Center) This is not an ideal or desired condition for this segment but reflects the challenges of working in this area given limited funding
Mileposts 88 to 92 Boundary Pit to Kantishna The final segment of the unpaved Denali Park Road is currently at the very low end of poor condition and is bordering on severe condition All of the alternative unpaved road plans propose to improve this section However improving the condition from the low end of poor condition to the middle of poor condition as explored in plans C and D is projected to cost $043 M per year Investing this much in one of the least-utilized segments of the Denali Park Road would limit funds for critical investments elsewhere As a result the Denali Investment Strategy proposes lesser improvements at a cost of $012 M per year
DenaliLong Range Transportation PlanFinancialTechReportndashFINALDRAFT 17
National Park Service US Department of the Interior
Denali National Park and Preserve Long-Range Transportation Plan
Appendix G Project Selection Checklist
DENA LRTPProjectSelectionCriteriaChecklist Project Name
PMIS Funding Source(s)
1 Long Range Transportation Plan ndash the project generally adheres to the following
National Long Range Transportation Planrsquos Goals and Objectives (see Attachment A)
Asset Management Transportation Finance Resource Protection
Visitor Experience Safety
Alaska Regional Long Range Transportation Planrsquos Goals and Objectives (see Attachment B)
System Management Mobility User Experience
Resource Protection Climate Change
Denali NPP Long Rang Transportation Planrsquos ldquoactions of no regretrdquo (see Attachment C)
Goal Area ____________________________ Action of No Regret __________
2 Financial Strategy ndash the project meets the following
Capital Investment Strategy score ______________
optimizer band 1 2 3 4 5
Consistent asset investment based on scenario quadrant position (Attachment D)
Consistent with proportionate investment within road management zones (Attachment D)
Milepost or Road Segment ______________________
Consistent with one or more of the following
Operations and Maintenance (OampM)
Rehabilitated Paved Road
Repair amp Maintain the Unpaved Road
Repair amp Improve Other High‐Priority Transportation Assets (bridges transportationmultimodal trail)
3 Risk Priority
Response to current high priority risks based on documented assessment (Attachment E)
Unstable Slopes
River and Stream Flooding
1
Permafrost Subsidence
Culverts ndash Operations and Maintenance (OampM)
Gravel Production Processing or Purchase
Relevance or proximity to mapped hot spot (see Attachment F)
‐ Attachment F should have all the hot spots for Park Road on a map Is this in DNPP LRTP Or do we
give them a link for online info
4 Operations and Maintenance
Investment Type ndash this project is a
New Investment ‐ offset in the cost of OampM
(presumed increase has been addressed by ____________________________________________________)
Replaced investment ‐ offset in the cost of OampM
(presumed decrease or net zero increase has been addressed by ___________________________________)
Eliminated Investment ndash offset in the cost of OampM
(presumed decrease has been addressed by ____________________________________________________)
2
National Park Service US Department of the Interior
Denali National Park and Preserve Long-Range Transportation Plan
Appendix H Public Comment Summary
Public Comment Summary Denali National Park and Preserve Long-Range Transportation Plan
Public comments are organized into two categories common and specific Common comments are
paraphrased themes that appear in multiple comment submissions Responses to common comments
are summarized in Table 1 Specific comments request a particular change When specific comments
seek changes that are accurate reasonable feasible and logically consistent they were made and
included in the final document Other comments include general statements about the quality of the
document suggestions for future plans or ideas for coordination next steps management strategies
park priorities or projects These comments are valued and are available to inform other park planning
efforts and will be referenced during the leadup to this planrsquos eventual update
Table 1 Common Comment
Paraphrased Comment Comment Response
1 Winter or offseason travel is not sufficiently represented in the plan
During the development of this plan numerous issues and needs surfaced as topics that warrant further study and consideration Public comments were an especially meaningful source for identifying topics in need of additional attention These findings will be used to inform the development of the planrsquos update as well as other plans such as the Winter Recreation Plan
2 There is insufficient data or information regarding specific transportation related conditions (eg trail crowding locations of specific facilities rest stop vehicle counts large vehicle counts winter routes locations etc)
The plan relied on facts data and concepts cited in existing park plans studies and other reports No additional data collection or data analysis was conducted as part of this planrsquos development process As such present day conditions or terminology may differ from those described in the plan Gaps in data and understanding will be reassessed in this planrsquos update
3 The plan does not map specific transportation use access facilities for the entirety of the planrsquos 20-year horizon
As a high-level strategic document the plan is not intended to identify specific short-term or long-term project needs or changes park access locations
1
Paraphrased Comment Comment Response
4 If a specific need is not mentioned in the plan (eg backcountry landing strip location) it means that the specific need will be precluded from future project selection and funding
The plan is a high-level strategy document and is not intended to identify and prioritize specific projects While the plan sets high-level goals that are used to evaluate the merits of future projects it is not a project list Whether or not a specific project idea is listed in this plan has no bearing on its ability to be developed or its funding merits
5 The plan does not describe specific actions that the park will take to address a very specific issue (eg plans to address the safety of backcountry landings strips in light of climate change cycling guidelines commercial use authorization for guided hikes off Park Road new parking lot locations more tours etc)
During the development of this plan numerous issues and needs surfaced as topics that warrant further study and consideration Public comments were an especially meaningful source for identifying topics in need of additional attention These findings will be used to inform the development of the planrsquos update
6 Data facts or terminology used in the plan appear to be out dated
The plan relied on facts data and concepts cited in existing park plans studies and other reports No additional data collection was conducted as part of this planrsquos development process As such present day conditions or terminology may differ from those described in the plan
7 The plan does not sufficiently outline specific actions to maintain and improve the parkrsquos soundscape
During the development of this plan numerous issues and needs surfaced as topics that warrant further study and consideration Public comments were an especially meaningful source for identifying topics in need of additional attention These findings will be used to inform the development of the planrsquos update
8 The plan does not go far enough in offering solutions that address threats to park access created by climate change and natural disasters
During the development of this plan numerous issues and needs surfaced as topics that warrant further study and consideration Public comments were an especially meaningful source for identifying topics in need of additional attention These findings will be used to inform the development of the planrsquos update
9 The plan does not go far enough to protect resources
During the development of this plan numerous issues and needs surfaced as topics that warrant further study and consideration Public comments were an especially meaningful source for identifying topics in need of additional attention These findings will be used to inform the development of the planrsquos update
2
Paraphrased Comment Comment Response
10 The plan does not go far enough to protect access
During the development of this plan numerous issues and needs surfaced as topics that warrant further study and consideration Public comments were an especially meaningful source for identifying topics in need of additional attention These findings will be used to inform the development of the planrsquos update
11 Goal andor objective indicators or performance measures are too limited
The plan relied on readily available data and findings cited in existing park plans studies and other reports No additional indicator data was collected as part of this planrsquos development The need for additional data for informing additional indicators will be considered for the planrsquos update
12 Specific details from the Vehicle Management Plan are not reflected in this plan
The long range transportation plan does not supersede the Vehicle Management Plan in any way Omission of Vehicle Management Plan data indicators and conclusions does not negate their significance in how the park is managed
3
- Appendix A - Literature Review Summary Report (1)
- Appendix B - Denali Long-Range Transportation Planning and Acoustic Resources (2)
- Appendix C - Denali Park Road Risk Assessment Utilizing the Unstable Slope Management Program (1)
- Appendix D - Current and Future Partner Projects (3)
- Appendix E - Park Transportation Investment Needs Analysis (1)
-
- Structure Bookmarks
-
- Denali National Park and PreserveLong-Range Transportation Plan
- Appendix EPark Transportation Investment Needs Analysis
- ABSTRACT
- INTRODUCTION
- PATINA DESIGN
- OVERVIEW
- VEHICLE MANAGEMENT PLAN
- VECTOR ANALYSIS
- DATA COLLECTION
- TRANSPORTATION NETWORK
- ASSET METRICS
- HIGH RISK
- INVESTMENT RANKING
- GOAL AREAS
- METHODOLOGY
- DATA PREP
- LAYER WEIGHTING
- COMPOSITE ANALYSIS STEPS
- SELECTED RESULTS
- OUTPUTS
- ROAD SEGMENT FINDINGS
- Motorized Paved Zone
- Wildlife Viewing Subzone 1
- Wildlife Viewing Subzone 2a
- Wildlife Viewing Subzone 3
- Wildlife Viewing Subzone 2b
- DISCUSSION
- INTERNAL WEIGHTING
- SKEWED DATA
- SPATIAL SPREAD OF DATA
- NEXT STEPS
-
- Appendix F _ Denali Funding Plan
- Appendix G - Project Selection Checklist
- Appendix H - Comment Responses (1)
-
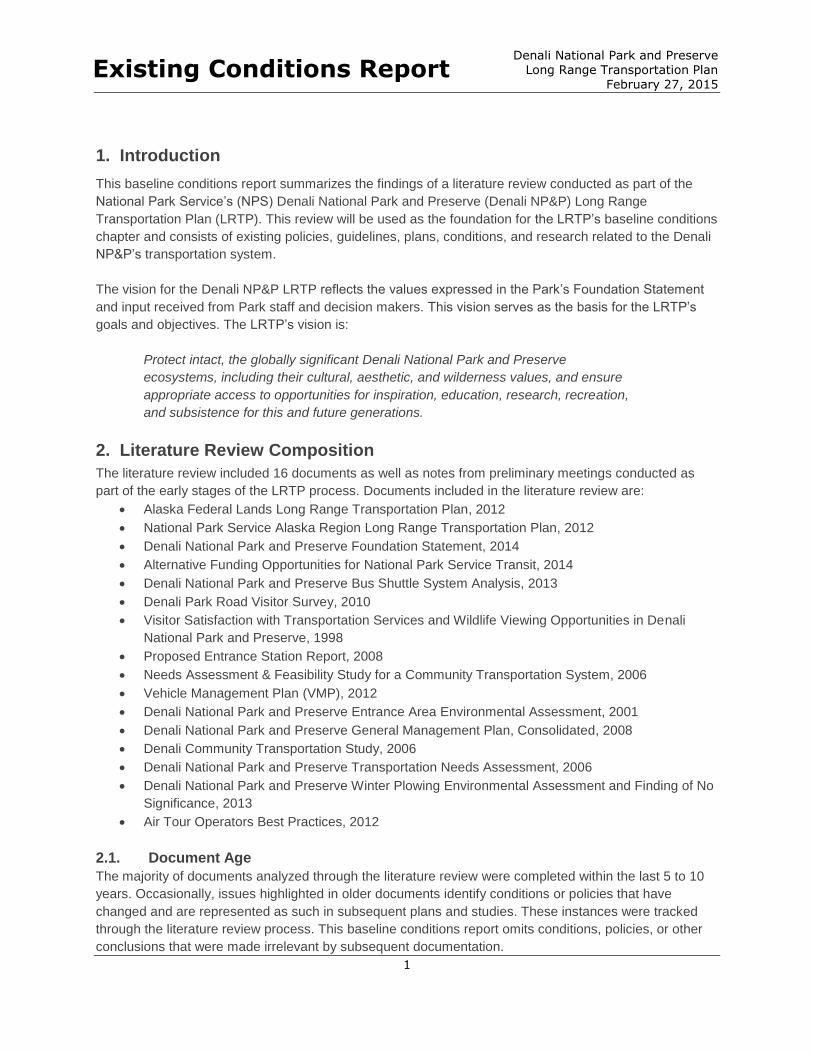
Denali National Park and Preserve Long Range Transportation Plan Existing Conditions Report
February 27 2015
1 Introduction
This baseline conditions report summarizes the findings of a literature review conducted as part of the
National Park Servicersquos (NPS) Denali National Park and Preserve (Denali NPampP) Long Range
Transportation Plan (LRTP) This review will be used as the foundation for the LRTPrsquos baseline conditions
chapter and consists of existing policies guidelines plans conditions and research related to the Denali
NPampPrsquos transportation system
The vision for the Denali NPampP LRTP reflects the values expressed in the Parkrsquos Foundation Statement
and input received from Park staff and decision makers This vision serves as the basis for the LRTPrsquos goals and objectives The LRTPrsquos vision is
Protect intact the globally significant Denali National Park and Preserve
ecosystems including their cultural aesthetic and wilderness values and ensure
appropriate access to opportunities for inspiration education research recreation
and subsistence for this and future generations
2 Literature Review Composition
The literature review included 16 documents as well as notes from preliminary meetings conducted as
part of the early stages of the LRTP process Documents included in the literature review are
bull Alaska Federal Lands Long Range Transportation Plan 2012
bull National Park Service Alaska Region Long Range Transportation Plan 2012
bull Denali National Park and Preserve Foundation Statement 2014
bull Alternative Funding Opportunities for National Park Service Transit 2014
bull Denali National Park and Preserve Bus Shuttle System Analysis 2013
bull Denali Park Road Visitor Survey 2010
bull Visitor Satisfaction with Transportation Services and Wildlife Viewing Opportunities in Denali
National Park and Preserve 1998
bull Proposed Entrance Station Report 2008
bull Needs Assessment amp Feasibility Study for a Community Transportation System 2006
bull Vehicle Management Plan (VMP) 2012
bull Denali National Park and Preserve Entrance Area Environmental Assessment 2001
bull Denali National Park and Preserve General Management Plan Consolidated 2008
bull Denali Community Transportation Study 2006
bull Denali National Park and Preserve Transportation Needs Assessment 2006
bull Denali National Park and Preserve Winter Plowing Environmental Assessment and Finding of No
Significance 2013
bull Air Tour Operators Best Practices 2012
21 Document Age
The majority of documents analyzed through the literature review were completed within the last 5 to 10
years Occasionally issues highlighted in older documents identify conditions or policies that have
changed and are represented as such in subsequent plans and studies These instances were tracked
through the literature review process This baseline conditions report omits conditions policies or other
conclusions that were made irrelevant by subsequent documentation
1
Denali National Park and Preserve Long Range Transportation Plan Existing Conditions Report
February 27 2015
22 Goal AreaObjective Frequency Distribution
The results of the literature review focused on 90 criteria related to six LRTP goal areas and 16 objectives
within those goals A complete list of goals objectives and criteria are included in Appendix A Each
Denali NPampP planning document was reviewed for instances of where the criteria were met The literature
review resulted in a total of 394 instances of planning documentation relating to goal areas from which to
conduct a baseline study
The chart below shows the distribution of responses among the LRTP goal areas and objectives The
most common topics relating to goals and objectives that appeared in the documents reviewed related to
mobility and user experience These topics make up a combined 64 percent of the responses relating to
goal areas System management accounted for another 18 percent The least frequent were resource
protection and climate change
Figure 1 Literature review response frequency by goals and objectives
2
Denali National Park and Preserve Long Range Transportation Plan Existing Conditions Report
February 27 2015
3 Literature Review Results by Goals and Objectives
Literature review results are organized by goals and objectives
31 Resource Protection Goal
Protect Denali National Park and Preserversquos natural cultural and subsistence resources
Wilderness Character Objective Preserve wilderness character and consider cumulative impacts to
wilderness in transportation planning and policy development
The existing literature on the protection of wilderness as it relates Condition
to coordination with neighboring transportation agencies discusses Denali NPampP managers often
some activities that managers are engaging in to better manage engage in coordination efforts
wilderness within Denali NPampP with neighboring organizations
(state local and federal Although Denali NPampP managers currently works with state
agencies local tribal groups federal and local agencies on issues relating to wilderness
and tourism industry) as part of protection there is minimal documentation of these efforts in the
National Environmental Policy catalogue reviewed for this study Documents reviewed note
Act (NEPA) documentation but processes for coordination with other agencies in regards to
there is no formal working groupenvironmental impact statements and environmental assessments
or regular forum for ongoing and projects located on non-NPS owned transportation systems
coordination between Denali The reviewed documents do not indicate that there is an ongoing
NPampP and these groups formalized coordination process for reviewing wilderness protection
Increased coordination is as it relates to transportation impacts
desired
Other wilderness protection efforts include cooperative discussions
with air tour operators about measures to protect wilderness character and to minimize conflicts with land
activities
Transportation factors identified that influence Denali NPampP wilderness character primarily include
interaction between buses and wildlife specifically traffic volume timing and types of vehicle use on
Denali Park Road Impacts from these factors are addressed through the use of road standards gap
spacing nighttime traffic levels and monitoring conditions
3
Denali National Park and Preserve Long Range Transportation Plan Existing Conditions Report
February 27 2015
Natural Resources Objective Understand mitigate and protect wildlife and the physical environment
from adverse transportation system effects
Preservation of natural resources is a top priority for Denali NPampP Condition
Therefore management of visitor access is paramount in the Denali NPampP is home to
discussion of resource protection especially as it relates to populations of wolf caribou Dall
transportation In order to provide a natural environment that sheep grizzly bear moose and
includes largely intact ecosystems for the enjoyment of visitors the some of the most pristine
Park manages daily traffic along Denali Park Road as well as how it wilderness in the NPS system
provides access to backcountry travelers This objective is Environmental protection is the
promoted by continuance of the ldquono formal trails in the backcountryrdquo top priority of Denali NPampP in
policy (General Management Plan 2008) and new vehicle terms of appropriate and
management strategies as discussed in the VMP (2012) effective access and therefore
improvements to the There is increased awareness of the importance of monitoring transportation system are wildlife interactions with vehicles along Denali Park Road Indirect subject to strict environmental disturbances to wilderness include noise from motorized vehicles considerations including overflights fugitive dust obstructed viewsheds social
trails trampled vegetation near transportation hubs and increased signs of disturbance near
transportation hubs
Park staff also coordinate with land managers at other potential Denali NPampP access points specifically
addressing interest in development at the existing Stampede Road In the 2008 General Management
Plan Denali NPampP has noted considerations for wolf moose and caribou habitat in this area
Opportunities for new multimodal access to the south of the Park are also documented but no specific
resource considerations were documented in this area
The 2012 NPS Alaska Region LRTP made coordination with neighboring land and transportation
managers a regional objective for all units in the state The Alaska Federal Lands LRTP established an
ongoing transportation project coordination working group to address such concerns at a regional scale
There is no similar working group for Denali NPampP specific coordination
Cultural Resources Objective Mitigate negative impacts and provide appropriate access to cultural
resources
An inventory of historic properties was developed in 1983 and Condition again in 2000 These studies have led to ongoing protection of Historic sites are well cultural resources within the Park this is a specific objective
documented within Denali outlined in the 2012 VMP to protect and promote historic character
NPampP Denali Park Road itself is
considered an important cultural Several transportation related assets within the Park are
asset considered to be cultural resources The park headquarters district
and dog kennels have been added to the National Register along
with the Denali Park Road
The 2012 NPS Alaska Region LRTP cites the construction of new airstrips for backcountry access as a
threat to cultural resources These threats are of particular concern for cultural resources not only due to
the physical presence of the airstrips but because of the associated soundscape implications that
4
-
Denali National Park and Preserve Long Range Transportation Plan Existing Conditions Report
February 27 2015
additional air traffic may have With increasing popularity of Denali NPampP and limited vehicular access
aircraft facilities are key for accessing the backcountry now and in the future
Subsistence Resources Objective Consider impacts and access to subsistence resources in
transportation planning and policy development
Because subsistence access is authorized by Title VIII of ANILCA Condition most plans refer to the provisions set forth in the implementing Subsistence access is allowed regulations at 36 CFR 13460 Motorboat and snow machine under ANILCA Access rights for access is allowed for traditional subsistence activities in the ldquoOld traditional uses include Parkrdquo and off-road vehicle use is allowed on 5 trails near Cantwell traditional and modern (General Management Plan 2008) ANICLA does not supersede transportation modes the original legislation to create Mt McKinley National Park though Transportation impacts of these it adds authorization for private and commercial air travel through activities are not well permits and concessioner contracts documented
In the Old Park snowmobiling was officially closed to all users in the late 90s and early 2000s The Old
Park was also closed to hunting previous to the passage of ANILCA Planes are allowed in the Old
Park but only non-commercial as it is traditional and customary to pre-ANILCA
Transportation impacts of subsistence activities are not well documented but most plans refer to these
activities taking place
32 Climate Change Goal
Plan for climate change impacts to and from the Parkrsquos transportation system through science
adaptation mitigation and communication
Science Objective Initiate support and participate in scientific research and assessments needed to
understand and respond to relationship between transportation and climate change in Alaska
At this time participation in climate change science still only exists Condition
at the Alaska Region level in terms of climate action plans and Participation in climate change
regional LRTPs Regional plans include goals and objectives for science is mainly conducted at
addressing climate change science These include funding climate the regional NPS level
change research through the Transportation Research Board However regional support for
establishing partnerships to test green technologies and regional these activities has recently led
support for the Climate Friendly Parks certification The Alaska to support for unit level studies
Federal Lands LRTP also sets an objective of participating in at
least one climate change effort per year with documented results If
successful this could increase the amount of information available to Denali NPampP managers
The Alaska Region system has undergone studies to assess climate change scenarios at the unit level
These efforts may also lead to more unit-level planning for transportation assets that include climate
change considerations
5
Denali National Park and Preserve Long Range Transportation Plan Existing Conditions Report
February 27 2015
Adaptation Objective Manage transportation assets and conduct transportation planning for climate
change
Regional transportation planning objectives call for transportation Condition
system adaptation with regard to climate change Specific long-Currently there is limited
term climate change adaptation needs include identifying and transportation planning
prioritizing risk to NPS-owned and non-NPS owned transportation documentation in regards to
assets and systems likely to be affected by climate change and climate change adaptation
determine what management actions are needed and developing Regional planning objectives
adaptive management into LRTP updates as a means of assessing call for increased hazard risk
situations designing implementing monitoring evaluating and assessments for strategic
adjusting management decisions to account for climate change decision making
There is limited language addressing climate change adaptation in
plans specific to Denali NPampP
Mitigation Objective Reduce Denali National Park and Preserversquos carbon footprint by reducing
transportation related greenhouse gas emissions from Park operations and visitation
Denali NPampP is in the process of achieving a Climate Friendly Park Condition
(CFP) certification1 This program established by the NPS sets Denali NPampP is in the process of
performance standards for sustainability in support of NPS goals becoming CFP certified Climate
for reducing greenhouse gas emissions through energy change mitigation activities
conservation and reduction in energy use recycling composting include reduction in energy use
technology upgrades and other actions The NPS Alaska Region and encouraging Park
has a goal of becoming a climate friendly region by 2030 which employees to carpool by
targets expanding regional participation in the Climate Friendly providing carpool vehicles
Parks program and increasing climate related data collection
Some specific climate change mitigation activities underway in Denali NPampP include the availability of an
employee carpool fleet and the use of local gravel sources to minimize maintenance vehicle miles
traveled as well as reduction of idling vehicles during transit operation and winter plowing operations
Future opportunities to reduce its carbon footprint may include upgrades to more fuel efficient transit
vehicles should suitable vehicles become available someday
Communication Objective Share the compelling story of climate change impacts in Alaska and Denali
National Park and Preserve to the public as it relates to transportation
1 The CFP program is one component of the National Park Service Green Parks Plan an integrated approach by the NPS to address climate change through implementing sustainable practices in our operations This effort is an integral part of the larger NPS Climate Change Response Strategy For more information on Climate Friendly Parks certification visit httpwwwnpsgovclimatefriendlyparks
6
Denali National Park and Preserve Long Range Transportation Plan Existing Conditions Report
February 27 2015
At this time there is no formal region-wide communication program Condition to describe the relationship between transportation and climate
Although there is no formal change At the park scale there are interpretive programs within
guideline at the regional level for Denali NPampP to explain the impacts of climate change on the
communicating climate change landscape Because Denali NPampP extensively utilizes transit impacts Denali NPampP has some services to enhance visitor experience opportunities exist to show programs to communicate air quality and other benefits of transit service as compared to
climate change impacts to its personal vehicle use
visitors
Regionally there are efforts underway to communicate with both
external partners and internal staff members about the successes and failures concerning
environmentally sustainable transportation practices and to develop and fund educational materials for
internal and external audiences
33 User Experience Goal
Proactively enhance the Denali National Park and Preserve experience
User Data Objective Collect analyze and use transportation and user information to enhance Park
experiences into the future
Most of the documents reviewed for this baseline conditions report Condition rely on user information to determine a condition or characteristic Denali NPampP collects analyzes Within Denali NPampP there is increased interest in collecting user and uses transportation and information because it informs a more proactive approach to user information to enhance transportation system performance visitor experience and natural Park experiences The Park also resource impacts User data is collected through different methods has a vision for how this practice and is used for numerous ends These include can be improved in the future
bull Visitor surveys are used to gauge visitor satisfaction as
well as transportation system performance The most recent survey was collected in 2006
bull Static visitation collection points at the Savage River Check Station visitor centers and other
travel waypoints are used to track visitor characteristics and behavior
bull As of 2013 transit data is collected on all Park transit vehicles by bus drivers and through mobile
tracking devices On-board devices track the number of tickets sold number of passengers GPS
locations of buses and durations of vehicle stops Bus drivers manually input the purpose of the
stop and information about hiker wait times which is of high importance to the Park Service This
data can be made available in real time and can be used to monitor and respond to varying travel
demands The NPS currently has staff in the Resources Division dedicated to analysis of the data
collected by the transit operation
bull Permits collected for the purpose of either access by private vehicle with right-of-way
authorization for overnight backcountry access or by commercial airplane are useful for tracking
visitation to the most protected areas of the Park
bull Other information currently collected includes Service-wide Traffic Accident Reporting System
(STARS) and Fatal Analysis Reporting System (FARS) data for recording vehicular accidents
7
Denali National Park and Preserve Long Range Transportation Plan Existing Conditions Report
February 27 2015
Needs and opportunities for user data include specifying visitor experience benchmarks for number of
vehicles at wildlife stops and number of vehicles in a viewscape to serve as reliable baseline condition
data Other recommendations include additional road audits to reduce entrance fee non-payment More
flexibility to use franchise fees to fund comprehensive data gathering is seen as an opportunity to improve
visitor experiences while protecting natural resources
Multimodal Transportation Objective Provide an appropriate effective and conflict free multimodal
transportation system to and within Denali National Park and Preserve
For much of the Parkrsquos history maintenance and transportation Condition
improvements focused on Denali Park Road More recently the Multimodal access is historical
emphasis includes the Parkrsquos transit system which increases necessary and desired by
access while minimizing natural resource impacts Much of the recreationalists and subsistence
desired future conditions are related to the Park implementing more users The most common
outcome-based approaches to analyzing user information as multimodal conflicts are due to
opposed to relying solely on historic comparisons crowding at wildlife stops and
rest stops along Denali Park Appropriate multimodal transportation service is often defined by its
Road ability to make Denali NPampP accessible to a wide range of visitors
with overarching consideration for the wilderness character that the system accesses This definition of
appropriate access relates closely to the Denali NPampPrsquos purpose and mission as stated in its Foundation
Statement Appropriate access depends on the observed and anticipated effects to natural resources
(VMP 2012) Increased visitor access is desirable if it does not cause negative impacts on environmental
conditions At locations within the Park where the natural environment is still intact even small increases
in visitation or changes in access can have dramatic impacts on natural systems
Multimodal issues that reoccurred in several reviewed documents and in comments from Park staff
include confusion about shuttle service operation desire for better connections between the Park local
communities and visitor accommodations employee travel to from and within Denali NPampP safety
comfort and quality of interpretive experience and transportation service affordability
Multimodal conflicts identified in plans include general congestion along Denali Park Road and in Nenana
Canyon crowding at wildlife stops and rest stops within the Park narrow roadways for bicycling and
hiking in the ldquofront countryrdquo and at particular locations east of Savage River and conflicts between land
and air visitation in terms of soundscape impacts Congestion challenges are anticipated to grow as
visitation levels increase As a result Park managers may face ongoing decisions about how to balance
environmental priorities and resource protection with transportation system capacity when responding to
increased demand
The Park has several efforts underway to improve multimodal travel opportunities and travel experiences
within Denali NPampP Park managers are using indicators to measure performance of the transit system
and gauge overall user experience These include hiker wait times numbers of vehicles at wildlife stops
number of vehicles in viewsheds numbers of vehicles at rest stops nighttime traffic levels large vehicle
traffic and sheep gap spacing Proposed construction of an eight-foot gravel shoulder along sections of
Denali Park Road from mile eight to Savage River cited in the Final Entrance Area and Road Corridor
Development Plan could provide safety and traveling comfort for bicyclists and hikers and may improve
8
Denali National Park and Preserve Long Range Transportation Plan Existing Conditions Report
February 27 2015
opportunities for wildlife viewing Also modifications to the general management of Denali Park Road
could improve protection of natural habitats beyond Savage River
There is an opportunity to gain efficiency in transit operations by improving consistency in transit seating
and consolidating shuttle services in the entrance area and canyon Also expanding transit service north
to Healy and south to Carlo Creek and Cantwell in addition to increasing shuttle service between the
entrance area and McKinley Village is desired (Needs Assessment and Feasibility Study for a Community
Transportation System 2006)
34 Mobility Goal
Provide safe efficient and appropriate access to and within Denali National Park and Preserve
Safety Objective Provide safe access to and within Denali National Park and Preserve
Between 1990 and 2006 95 percent of all vehicular accidents in Condition NPSrsquos Alaska Region occurred in Denali NPampP with 58 percent of The historic character of Denali these accidents occurring on Denali Park Road (NPS Alaska Park Road creates safety Region LRTP 2012) Of the other accidents reported within Denali issues and due to its popularity NPampP 19 percent were located on the George Parks Highway both as a visitor attraction in the within the Park boundaries The remaining portion of vehicular Alaska Region and within Denali accidents occurred near the visitor parking areas or in NPampP most recorded accidents campgrounds The George Parks Highway is the direct road occur along the road Other connection between Anchorage and Fairbanks and a major travel safety s considerations include corridor for Denali NPampP visitors Between 2007 and 2010 31 total bicycle and pedestrian access in fatalities were reported on the George Parks Highway (NPS Alaska the front country and along Region LRTP 2012) sections of the George Parks
Highway and increased winter As identified in the VMP safety issues are associated with road
access travel along Denali Park Road The historic nature of the road may
in some locations limit sight distance restrict width for passing
vehicles and provide inadequate surface road friction (VMP 2012) Driver behavior is most likely a
contributing factor in vehicular crashes particularly for private vehicles traveling Denali Park Road during
off-peak seasons Impacts of severe weather events for Denali Park Road travelers are another safety
consideration These issues are also a top priority of the Parkrsquos General Management Plan and although very important must be balanced with active preservation of the road as characterized by the philosophy
to retain its telescoping from a full width paved profile at the entrance to the narrower unpaved gravel
profile at the western end
According to the visitor survey highlighted in the VMP the public indicates that they feel safe while using
Denali NPampPrsquos transportation system The most notable safety consideration perceived by the public is
related to travel over Polychrome Pass where Denali Park Road has steep drop-offs and the road is
narrow and winding Park management uses driver training driver spacing and wait times to address
safety issues at this location
9
Denali National Park and Preserve Long Range Transportation Plan Existing Conditions Report
February 27 2015
Safety is also a top priority for flight operations For example recommended flight tour routes are subject
to weather conditions and aircraft may be forced to deviate from planned routes if safety is at risk (Air
Tour Operations Best Practices 2012)
With increased opportunities for vehicular winter access emerging safety improvements related to winter
travel are a growing need Denali NPampP has a goal of minimizing wintertime safety-related incidents and
has an interest in determining baseline conditions so as to monitor future winter safety performance With
the trial winter plowing of the first 15 miles of Denali Park Road the Park continues to monitor visitor
safety during the extended period of winter and early spring driving conditions Commercial operators
also provide multi-modal access to the Park during winter months Denali NPampP staff is working with
commercial operators to implement safety measures for winter operation such as the required use of
emergency communication devices during operation
The collection of safety data and addressing inconsistencies in safety data reporting is identified as an
ongoing need
Access Objective Provide appropriate and efficient access for inspiration education research
recreation and other uses as provided for in ANILCA
Condition As stated in the General Management Plan the primary historic
Within Denali NPampP purpose of access to Denali NPampP is to accommodate viewing of
appropriate and effective access Mount McKinley and the Parkrsquos wildlife As documented
is determined by the assessed appropriateness of access is defined by the balance between
impacts to wildlife and cultural visitor accommodation with active protection of wilderness
resources Where the character The NPS therefore uses the least access restrictive
environmental conditions are management tool possible to maintain and promote the natural
more intact visitor access is resources protected by the area (General Management Plan
more closely managed New 2008)
vehicle management strategies
target this priority The level of appropriate access varies along Denali Park Road
Wildlife Viewing Subzones are used to distinguish appropriate level
of access A notable example includes the Parkrsquos VMP which allows 160 vehicles per 24 hour day
through mile 15 of Denali Park Road period while monitoring for violations of user experience standards
This number was derived through extensive research and rigorous travel modeling of Denali Park Road
and provides an overall increase in capacity for visitors while considering environmental impacts
Visitors typically arrive to the Park by private vehicle bus or train Many visitors arriving by bus or train
are cruise ship passengers and are traveling with fellow passengers as part of cruise packages Park
management desires to provide efficient access to visitors arriving by all modes of travel while also
providing for accessibility as delineated by the Americans with Disabilities Act (ADA) and Architectural
Barriers Acts (ABA) For areas of the Park with additional travel requirements this means ensuring a
transportation system that provides a meaningful high-quality opportunity for viewing scenic landscapes
and wildlife primarily through transit services (VMP 2012) In the future visitation is expected to grow
with a large portion of visitors arriving as part of organized tour companies or organizations
Considerations of access are therefore a topic of long-range concern as Denali NPampP is committed to
balancing access with the responsibilities of managing designated wilderness
10
Denali National Park and Preserve Long Range Transportation Plan Existing Conditions Report
February 27 2015
At the time that the Denali Park Road Visitor Survey (2010) was conducted 71 percent of visitors who
traveled beyond mile 15 were part of organized tours (ie Long Tour) These are highly interpretive trips
with designated stops at rest areas and impromptu stops for wildlife viewing Non-tour transit buses
traveling past mile 15 provide less interpretation and make impromptu stops for hikers and wildlife
viewing
Coordination with the visitor services concessioner is ongoing and the relationship between Denali NPampP
and any concessioner is viewed as integral to providing appropriate and effective access for Park visitors
User Information Objective Provide accurate and accessible information through a variety of means
about how to travel to and within Denali National Park and Preserve
The NPS is interested in providing information to potential and Condition repeat users about its transportation system and services at a Commercial and state tourism national regional and local level The Alaska Federal Lands LRTP initiatives are successful in and NPS Alaska Region LRTP summarize objectives and providing travel information to strategies that specifically address providing accurate and visitors prior to their arrival at accessible information for travel to and within federal lands and the Park Once at Denali NPampP several projects to enhance visitor information services the Park its concessioners and
local businesses provide Much of the marketing and development of traveler information for
interpretation through visitor Denali NPampP is championed by non-NPS organizations such as
centers transit and tour bus the Alaska Railroad concessioners and other area businesses
operations and many others Because Denali NPampP is a regular destination for commercial tour
Interpretation and transit system operations much of the information provided to potential visitors
visitor information improvements and visitors en route to the Park is provided by those organizations
are desired According to the Denali Park Road Visitor Survey issued in 2010
over half of the Denali NPampP transit users had received information from a travel agent about their visit to
the Park Another third of the respondents received information over the internet Denali NPampP maintains
a website with virtual tours guides and resources to help visitors plan trips to the Park Travel guides and
tour books are also popular means of learning about how to travel to and within Denali NPampP (NPS
Alaska Region LRTP 2012)
Traditional means for providing information at visitor centers and Wilderness Access Center are available
upon entering Denali NPampP Once aboard the short-tour and long-tour buses visitors have a wide range
of information available Tour bus drivers and guides provide extensive interpretation while transit drivers
may provide information upon request and at the discretion of a particular driver Several Denali NPampP
plans document the value of retaining experienced drivers This was seen as a major enhancement to the
overall visitor experience (Denali NP Bus Shuttle System Analysis 2013)
The most common need identified in planning documents is the necessity for better wayfinding and user
information about transit in hopes of reducing visitor confusion with the Parkrsquos transportation system
According to the VMP an objective of Denali NPampP management is to ldquoclearly communicate information about the system through a variety of meansrdquo Potential options for sharing information include improving
traditional methods such as maps brochures and signage The Alaska Region is also interested in newer
media options such as implementing intelligent transportation systems linked with websites mobile
devices and other personal communication technology According to a survey in 2010 transit users were
11
Denali National Park and Preserve Long Range Transportation Plan Existing Conditions Report
February 27 2015
not interested in receiving information from a recorded narrative about traveling Denali Park Road
Information delivered by bus drivers was preferred over prerecorded methods
Also with the introduction of enhancements to the off-season access programs Denali NPampP
management is interested in reducing the perception that the Park is closed during off-seasons by
increasing communications about opportunities for visiting the Park during the winter
35 System Management Goal
Develop a long-term transportation system to appropriately satisfy current and future land
management needs
Asset management Objective Apply available financial resources to essential transportation
infrastructure
Relative to other parks in the Alaska Region transportation assets
within Denali NPampP are some of the most costly This is primarily
due to Denali Park Road maintenance needs providing visitor
transit and tour services and experiencing the high visitation levels
during a very short summer season
In general transportation assets within Denali NPampP are
considered to be in good condition Road work is mainly
concentrated on bridge replacement road maintenance and
subgrade improvements In general road widening does not occur
However improving pullouts on the narrowest section of the road
to maintain safety standards des exist in asset planning
documentation The annual operations and maintenance budget for
road assets in Denali NPampP was approximately $12 million in 2010
(NPS Alaska Region LRTP 2012)
Denali NPampP management uses both quantitative and qualitative
measures to prioritize transportation system improvements The
2008 General Management Plan prioritizes road improvement
projects ranking corrective safety projects as the highest priority and other corrective maintenance and
repairs as secondary priorities The General Management Plan provides example projects from Denali
Park Road where potential improvements have been identified for multiple project categories (sight
distance improvements safe vehicle passing enhancements road surface friction improvements culvert
repairs etc) Denali NPampP has incorporated the NPS ldquooptimizer bandrdquo model of asset prioritization In
this model assets are scored by Asset Priority Index (API) to rank how critical assets are used in
accomplishing the Parkrsquos mission and goals In this model Facility Condition Index (FCI) indicates asset
condition and is used to determine eligible fund sources Projects are evaluated based upon their APIFCI
rank Using this method of asset evaluation all of the high priority assets (API of 75 or higher) are in good
or better condition (FCI of 03 or less) (Alaska Federal Lands LRTP 2012) Finally the asset needs are
filtered through the NPS Capital Investment Strategy (CIS) which expresses priorities in the form of
optimizer bands Optimizer bands 1 and 2 are associated with assets that are essential or extremely
important for a park to continue as described in its organic legislation
Condition
The availability of funds
particularly for funding transit
systems has decreased in
recent years Denali NPampP
management is using
quantitative and qualitative
indicators about the
transportation system to
prioritize transportation system
improvements With limitations
to increasing system capacity
Denali NPampP management is
working toward increased
system efficiency and better
coordination with transportation
partners
12
Denali National Park and Preserve Long Range Transportation Plan Existing Conditions Report
February 27 2015
There is a general funding gap projected into the future The most recent congressionally authorized
transportation funding bill Moving Ahead for Progress in the 21st Century (MAP-21) reduces funding for
the NPS transit systems by approximately 28 percent from the previous federal transportation legislature
(Alternative Funding Opportunities for NPS Transit 2014) Regional funding assessments show an
annual funding gap of $720000 for Alaskan ldquoroad parksrdquo the category which Denali NPampP is included
Although park-level funding shortages are not yet documented for Denali NPampP a large portion of the
Alaska Regionrsquos transportation assets are located in Denali NPampP Elimination of the Transportation
Improvement Program (TRIP) has made funding multimodal systems such as the Parkrsquos concessioner-
operated transit more challenging (Alternative Funding Opportunities for NPS Transit 2014)
Because the transit system is operated by a for-profit concessionaire it is not eligible for transportation
funding through MAP-21 however several FHWA funding and grant programs are still applicable and
partnerships with local government cooperation and partnership could increase funding eligibility
Park management is also very interested in finding efficiencies within its current asset portfolio
completing operational modifications that improve the transportation system and promoting the Parkrsquos purpose Recent examples of this include new vehicle management strategies provided in the VMP and
wintertime operation improvements
Asset Investment Planning Objective Consider sustainability of operation and maintenance of new
and existing assets in the planning process
The NPS includes asset investment planning in much of its recent Condition transportation planning documentation At a regional level the NPS Denali NPampP managers are very is using measurements that feed into asset planning processes involved with asset planning for such as total cost facility ownership as well as the project
transportation system prioritization tools mentioned earlier Several strategies identified in maintenance and operations the Alaska Federal Lands LRTP promote asset planning through Relative to other parks in the collaboration with other federal land management agencies and region Denali NPampP has high Alaska Department of Transportation and Public Facilities deferred maintenance needs consideration of lifecycle costs and evaluation of maintenance
resulting largely from challenges costs versus investments in new infrastructure associated with maintaining
Denali Park Road Maintenance In 2010 deferred maintenance in Denali NPampP accounted for 65
and operation are constantly percent approximately $20 million of all deferred maintenance of
weighed against environmental transportation assets in the Alaska Region Deferred maintenance
conservation priorities issues within Denali NPampP could be addressed by treating the
underlying cause of the road failures to reduce the need for
repetitive maintenance according to the General Management Plan
Documents suggest that road repairs and maintenance should follow the 2005 Denali NPampP Road
Maintenance Repair and Operating Standards and the 2007 Denali NPampP Road Design Standards The
total planned transportation assets for Denali NPampP include improvements to access roads parking lots
non-motorized routes and other transportation infrastructure These planned assets are valued at $64
million (NPS Alaska Region LRTP 2012)
13
Denali National Park and Preserve Long Range Transportation Plan Existing Conditions Report
February 27 2015
In terms of operational needs Park managers are actively participating in day to day management of
transit operations and are able to make adjustments based on demand For example real-time
monitoring of the transit system allows the concessionaire to track transit vehicle occupancy and dispatch
additional vehicles during peak demand for return trips Denali NPampP is also actively investigating
opportunities for gaining efficiency in their transit and in their entrance fee collection program
As it is with other goal area topics effective operation and maintenance is balanced with environmental
protection In planning documents the Denali NPampP management is constantly balancing expectations of
visitor experience and safety with deference to natural resource objectives
Coordination Objective Coordinate with local organizations to ensure that nearby transportation
projects are planned with NPS involvement to the mutual benefit of all parties
Coordination with federal state and local agencies is seen as an Condition opportunity for funding and project implementation as well Coordination with federal state managing concessionaire services and expanding local visitor local and private transportation services An ongoing federal land management agency agencies is seen as a need for coordination team was formed as a result of the 2012 Alaska optimizing asset management Federal Lands LRTP The group actively works to coordinate because 21 percent of the transportation project planning across Alaska including in and transportation assets are owned around Denali NPampP These efforts could help organize interest in by non-NPS agencies expanding transit services outside of the Park which is a frequently
cited coordination need as determined by the literature review and
comments from Park staff during LRTP discussions
Needs and opportunities for coordinating with private entities are somewhat unique to Denali NPampP
Denali NPampP is the only park in the Alaska Region to have transportation assets that are not owned by
the NPS Twenty-one percent of the transportation assets in the Park are owned and operated by
concessionaires or owned by others There is a desire to expand partnerships to include other local
businesses and eventually local government agencies The 2006 Needs Assessment and Feasibility
Study for a Community Transportation System provides alternatives for organizing such efforts
Other coordination efforts include involving air tourism operators regular communication with tribal
organizations and land inholders and coordinating access with other area landholders and transportation
agencies such as the Alaska Department of Transportation and Public Facilities
14
Denali National Park and Preserve Long Range Transportation Plan Existing Conditions Report
February 27 2015
4 Conclusions
Common themes encountered throughout the literature review process provide several general baseline
conditions for Denali NPampP These include
Resourc
e P
rote
ctio
n
Clim
ate
Change
User
Experie
nce
Mo
bili
ty
Syste
m M
anagem
ent
The historic character of Denali Park Road and the management thereof are important
factors influencing access and mobility
Denali NPampP is a primary attraction for tourists Many visits are rushed due to the
logistics of popular packaged Alaska tours Visitation is anticipated to increase as tour
companies continue to promote and expand travel options to the Park
With anticipated visitation increases and associated use of the transportation system
Denali NPampP managers may face ongoing decisions about how to best protect the Parkrsquos natural resources as congestion grows and the capacity of Denali Park Road and
transportation system is tested
Travel options are sometimes viewed as limited within the Park but some multimodal
enhancements could increase safety particularly for bicycling and hiking opportunities
The general condition of the transportation system is good but priorities are complex
both in terms of balancing maintenance needs with the care for natural resources and
providing access to view designated wilderness areas
Recent changes to Denali Park Road vehicle management and operations system are
intended to advance the NPSrsquos emerging outcome-driven planning processes As more
data becomes available Denali NPampP managers can better set performance indicators
for operations
Existing transportation plans do not contain much information about climate change but if
the actions recommended and cited in the NPS Alaska Region LRTP are followed there
may be more opportunities to include unit-level strategies for addressing climate change
into asset planning and operation With ongoing progression toward a CFP certification
Denali NPampP is well positioned to incorporate these objectives at a unit-level
15
National Park Service US Department of the Interior
Denali National Park and Preserve Long-Range Transportation Plan
Appendix B Denali Long-Range Transportation Planning and Acoustic Resources
1
Denali Long Range Transportation Planning and Acoustic Resources
Davyd_Betchkalnpsgov NPS Alaska Region Soundscape Specialist Biologist 907‐683‐5754
Research Sets the Stage
Author Eli Seigel wrote in 1970 ldquoall the opposites are two freedoms which question each other and complete each
otherrdquo Transportation and solitude likely represent such a pair of mutually‐exclusive freedoms In Denali and other
Alaskan parks we can immediately recognize a tradeoff between the ability to be easily and quickly transported to
a location and the ability to participate in the tranquility of wilderness beyond the reach of modern technology and
crowds
This recognition is a fundamental drive behind the work of the NPS Natural Sounds and Night Skies Division whose
vision statement is to ensure that ldquoNational parks are enduring sanctuaries for natural sounds and dark
environments where current and future generations have the opportunity to experience undisturbed soundscapes
and an unimpeded view of the cosmos and where the ecological roles and cultural values of acoustics and photics
are understood and appreciatedldquo (NPS 2014)
For the purposes of acoustic planning and research the NPS has developed an autonomous system that can
provide both American National Standards Institute (ANSI) certified acoustic levels (ie numeric measurements of
sound pressure level in decibel units) and audio recordings (ie sound that one can listen back to in headphones)
ANSI also recommends the collection of meteorological data concurrent with measurements of sound pressure
level Thus a simple weather station incorporating wind speed wind direction temperature and relative humidity
is also part of the acoustic monitoring station The photo below shows an external photograph of a typical station
2
Figure 1 NPS Standard Acoustic Monitoring Station ndash equipment is composed of a microphone meteorological instruments
sound level meter digital audio recorder battery bank and solar paneling
Scientific work to understand Denalirsquos acoustic environment began in 1999 in response to a large increase in
aviation and snowmobile noise in the mid‐1990s (Morgan 2001) Early data were incorporated into the
Backcountry Management Plan (BCMP) EIS a supplement to Denalirsquos General Management Plan (NPS 2006e)
After the BCMP was published the park embarked on a decade‐long inventory of the acoustic environment The
project was completed in 2015 and as of 2016 the park has moved into a monitoring phase A basic timeline of
acoustic resource management in Denali is shown below
Figure 2 Timeline of acoustic resource management in Denali 1999 ndash 2016
Denalirsquos acoustic inventory project is unique among park service units in that it was designed as a spatially random
sample on a 20 by 20 kilometer grid This allows inference beyond the local detection radius of each microphone
For example consider the following map that depicts the acoustic metric lsquodaily average noise free intervalrsquo ndash a
measure of how long a typical quiet period is before it is broken by motorized noise Noise free intervals in Denali
are largely determined by the frequency of air traffic Aircraft are very acoustically powerful sources that are
audible at distances similar to the scale of the sampling grid thus mapped measurements of noise free interval
immediately form a discernable pattern to the human eye
3
Figure 3 Daily average noise free intervals measured in hours Data were collected as part of Denalirsquos Soundscape Inventory
project 2006 ndash 2015 Noise free interval is a measure of how long a typical quiet period is before it is broken by motorized
noise
Entering the realm of inference the following map uses observations at specific soundscape inventory points to estimate the noise free interval at a park‐wide scale It uses a spatial smoothing technique called inverse distance weighting to construct new data points between the known values ‐ a method known as interpolation Again
because the scale of the phenomena (aircraft traffic) and the scale of the sample (20 km2 resolution) are comparable noise free interval is a metric well‐suited to interpolation techniques (Peterson 1998 Gergel 2006) Continuous change in the metric is physically sensible and approximate the visual effect of looking at the original point data Denalirsquos soundscape inventory was important for understanding which acoustic metrics are best suited to monitoring change at a landscape scale
4
Figure 4 Average noise free interval values estimated by spatial interpolation Units are in hours This map uses observations
at soundscape inventory points to estimate the average noise free interval at a park‐wide scale It uses a smoothing technique
called inverse distance weighting to construct new data points between the known values ndash a method known as interpolation
The Denali soundscape inventory supplies spatially‐rich information about the current state of the acoustic
environment It also clarifies the choices available to quiet the park as per NPS policy Inventory data have been
(1) Inventory data have been used to review the indicators and standards of the BCMP
They explain how indicators change in response to the acoustic ambience
They explain the relationship between indicators (for example NFI and event rate are inversely related
thus one can be estimated from the other)
They provide an understanding as to which indicators are best suited to the scale of the park
(2) Inventory data have been used as input to the voluntary aviation best practice development process
of the Denali Overflights Advisory Council (2007 ndash 2012)
They provided the basis from which to monitor the effects of aviation best practices
They provided updates to the council directing attention to areas most in need of mitigation
They transcend anecdote as the sole basis for making decisions
(3) Inventory data have been used in predictive acoustic modelling
5
They provide a means to validate noise models of aircraft takeoffs or overflights road noise or other
sources
Data such as event rates or hourly distributions can also be used as inputs to models
Aviation Transportation and NPS Policy
There are currently several types of aviation transport in the park Section 1110(a) of the Alaska National Interest
Lands Conservation Act (ANILCA) provides for aviation access for traditional activities and for travel to and from
homesites which will not be discussed in this document Nor will high‐altitude commercial aviation ndash which does impact the park but would involve participation of the Federal Aviation Administration in the revision of Victor
Airways or Jet Routes within the National Airspace System a process well beyond the scope of this plan
Instead this document seeks to build on discussions of the Denali Overflights Advisory Council
(httpswwwnpsgovarticlesdenali‐aircraft‐overflightshtm)a federal advisory committee chartered by the
Secretary of the Interior from 2007 ndash 2012 The group developed a suite of voluntary aviation best practices that
were adopted by both commercial and government aviators It is fitting that these best practices were broadly
adopted because NPS policy does not distinguish the obligations of governmental and Concessionaire operations
with respect to resource protection NPS Management Policies 2006 sect 10249 states
Concessioners are required to comply with applicable provisions of all laws regulations and policies that
apply to natural and cultural resource protection
It is relevant then to provide a brief policy review NPS Management Policies 2006 sect 823 addresses impacts to
natural sounds directly stating
The Service will strive to preserve or restore the natural quiet and natural sounds associated with the
physical and biological resources of parks To do this superintendents will carefully evaluate and manage
how when and where motorized equipment is used by all who operate equipment in the parks including
park staff Uses and impacts associated with the use of motorized equipment will be addressed in park
planning processes Where such use is necessary and appropriate the least impacting equipment vehicles
and transportation systems should be used consistent with public and employee safety The natural
ambient sound levelmdashthat is the environment of sound that exists in the absence of human‐caused
noisemdashis the baseline condition and the standard against which current conditions in a soundscape will be
measured and evaluated
Further guidance related to aircraft is articulated in sect 6343
Managers contemplating the use of aircraft or other motorized equipment or mechanical transportation within wilderness must consider impacts to the character esthetics and traditions of wilderness before considering the costs and efficiency of the equipment
In evaluating environmental impacts the National Park Service will take into account (1) wilderness characteristics and values including the primeval character and influence of the wilderness (2) the preservation of natural conditions (including the lack of man‐made noise) and (3) assurances that there will be outstanding opportunities for solitude that the public will be provided with a primitive and unconfined type of recreational experience and that wilderness will be preserved and used in an unimpaired condition
6
Furthermore sect 637 offers and important reminder that in wilderness areas
The principle of nondegradation will be applied to wilderness management and each wilderness arearsquos condition will be measured and assessed against its own unimpaired standard Natural processes will be allowed insofar as possible to shape and control wilderness ecosystems Management should seek to sustain the natural distribution numbers population composition and interaction of indigenous species Management intervention should only be undertaken to the extent necessary to correct past mistakes the impacts of human use and influences originating outside of wilderness boundaries
Envisioning a (Flight) Route Forward
Denalirsquos Backcountry Management Plan (BCMP) remains the overarching unit‐level policy document on the
management of the natural acoustic environment Data collection during the implementation of the BCMP has
provided a robust baseline description of the resource Transportation planning directly benefits from a synthesis
of these inventory data
One way to approach the protection of acoustic resources is through a cost‐distance analysis Cost‐distance
analysis balances the costs associated with travelling a certain distance (in this case the cost of aviation fuel) with
resistances to travel Resistances to travel can take many forms ndash the increased difficulty in crossing a major river
or mountain range or the difficulty of moving over muskeg as opposed to alpine tundra In this case we describe
resistances to noise ndash areas sensitive to the acoustic disturbance created by mechanical transport
What is meant by resistance Synonymous with lsquonoise sensitivityrsquo for the purposes of this discussion the word
resistance more accurately conveys the interlocked relationship between isolation and transportation The
following two definitions are applicable to the Long Range Transportation Plan
Resistance (noun)
1 Resistance is the degree to which a substance prevents flow through it
2 Resistance is the ability to prevent something from having an effect
In this case the ldquoability to prevent something from having an effectrdquo describes the human ability to make choices
about how to conserve the acoustic environment In other words we conceptualize a resistance when we answer
the question ldquoHow do we mitigate the effects of motorized transport on the acoustic environmentrdquo We will later
see how the resistive analogy between traffic flows and electrical flows can be used to the benefit of managing
acoustic resources
Resistances to noise typically fall into three basic categories
1) Those defined by NPS policy or aviation best practices
2) Those related to the acoustic or ecological properties of the landscape
3) Those related to avoiding interactions between motorized and non‐motorized experiences
7
Resistances to noise can be assigned based on a number of different rationales For instance consider the
following raster dataset that depicts the amount of use by backcountry unit One long‐standing approach to
describing which areas should be protected from noise is to separate backcountry user groups from aviation user
groups in space Lighter areas on the map indicate more backcountry use ndash and thus suggest that aircraft avoid
units along the Denali park road corridor
Figure 4 Backcountry Unit Use resistance layer Lighter values indicate a greater resistance to transportation noise This
suggests that aviation routes should avoid core units around the road corridor
Contrast this with data which show the average noise free interval across the park The layer is normalized to the
same brightness as the backcountry use layer with lighter areas representing a greater resistance to noise and
thus higher resource costs for transportation over the area
The rationale behind the noise free interval map produces different optimal routes than the backcountry user
map This is because resistance is based on the fact that areas with long noise free intervals are sensitive to minor
changes in air traffic and thus traffic should be routed over areas that are already highly fractured In this case
8
areas that already have air traffic would continue to bear the brunt of resource damage allowing the most pristine
acoustic environments of the park to remain intact
Figure 5 Noise Free Interval resistance layer lighter values indicate greater resistance to transportation noise This would
suggest that aircraft routing remain largely the same especially in the areas between the Kahiltna and Ruth glaciers
Backcountry use statistics and noise free intervals are just two of many different ways of assigning resistances to
aviation transport Which strategy is best That depends entirely on the basis of each claim After reviewing both
layers it should be apparent that a wide range of conflicting rationales can be applied to mitigating impacts from
Denalirsquos aviation transportation network Deciding which should be prioritized is a complex decision
Unless the overall aviation traffic volume over the park is reduced displacement in free space is the primary
mitigation technique available to park stewards The most substantial mitigations enacted for the park thus far ndash
the Denali Overflights Advisory Council aviation best practices ndash required the council to weigh certain routing
displacements over others (DOAC 2012)
9
Once a weighting network of resistance layers has been distilled from public and expert opinion it is possible to
use them to envision idealized flight corridors One useful tool for this purpose is the cost‐distance modelling
software Circuitscape (wwwcircuitscapeorg) which uses electrical theory to describe the travel of electrons over
a semiconductor This is analogous to a pilot with knowledge of areas resistant to noise who utilizes this
knowledge while conducting their flight operations Results of a Circuitscape analysis include all the possible routes
a pilot might fly but highlight stewardship‐friendly corridors It allows us to see the conclusions that follow from
our rationale
The following is an example weighting network that can be used as an input for Circuitscape The weights are
chosen in this case to produce a result that is realistic while avoiding the influence of hard discrete edges It
balances nine data sets with widely varying rationales to produce a final summation that can be used to visualize
flight corridors
Figure 6 Example of a weighted network resistance layer Summed data layers include natural ambient acoustic
level travel time backcountry unit use Denali Overflights Advisory Committee aviation best practices and sound
10
sensitive areas BCMP standards noise free interval campgrounds and road corridors The hard edges of polygon
features are especially prominent in the final sum
Dataset Name Description of Dataset Rationale Statement for Noise Resistance Weight
Natural Sound Pressure Level (Median L50)
Typical ambience of the natural acoustic environment (Modelled)
Listening area is reduced in more energetic acoustic environments reducing the impact of human
activities Less natural energy = higher resistance 50
Travel Time Estimated travel time on foot from
portal areas (Modelled)
Backcountry users travelling in more remote areas of the park have a greater motivation to find
solitude Greater travel time = higher resistance 25
Backcountry User Days Utilization of backcountry units of
the park (Empirical)
Areas with a greater amount of backcountry users should be preferrentially avoided More users =
higher resistance 15
Denali Overflights Advisory Council Aviation Best Practices
Best‐practices for mitigating acoustic impacts from aviation (Federal Advisory Committee)
Best‐practices identified by the Denali Overflights Advisory Council should be fully implemented Areas
affected by best‐practices = high resistance 10
Backcountry Management Plan Soundscape Standards
Soundscape standards by spatial region of the park (GMP)
Adherence to NPS policy should be prioritzed Lower impact management zone = Higher resistance
5
Noise Free Interval
Average amount of time before experiencing the next noise disturbance (Empirical
interpolated)
Areas with longer noise‐free intervals are more sensitive to fracturing due to increases in air traffic
Greater noise‐free interval = higher resistance 5
Campground Locations Buffered campground areas
(Empirical)
Campgrounds are places where many people spend time resting and should be preferrentially avoided
Closer to campground = higher resistance 5
Roads Buffered road network (Empirical) Roads are already impacted by noise so aviation
noise will have a lesser impact in proximity to roads Beyond road noise footprint = high resistance
3
Denali Overflights Advisory Council sound sensitive areas
Areas identified by the Denali Overflights Advisory Council as
noise sensitive banded into three categories low medium high (Federal Advisory Committee)
Sound sensitive areas should be preferrentially avoided Higher sensitivity band = higher resistance
2
Table 1 Description of noise resistance rasters that were used to show how varying rationales can be balanced to produce an overall weighted noise resistance layer
Once the weighted resistance layer has been created Circuitscape is used to recognize ideal flight corridors Airports with commercial use represent sources of electrical potential and include Talkeetna Healy McKinley Public ERA helipad McKinley Private Cantwell and Kantishna The sink (ground) of electrical potential is the Denali massif For the example weighting network in this document the following map was produced
11
Figure 7 Cost‐distance analysis results This graphic shows current flow from electrical sources (airports) to an electrical sink (the Denali massif) This is analogous to air traffic density
What does the model show It represents air traffic density as an analogy to electrical current ndash the greater the current the greater the air traffic density As a model it is an imperfect representation of reality but this example representation does identify flight corridors that follow from the input rationale (These corridors include the Denali park road corridor the Denali Fault a route along the outer range and one that connects Broad Pass to the Eldridge Glacier) Obviously the map in Figure 7 fails to capture public opinion and for that reason it is incomplete but the technique stands as a meaningful strategy to approach these complex decisions
12
Conclusion
Data from the Denali Soundscape Inventory describe the parkrsquos acoustic environment at a landscape scale These data can be used
for many purposes but their most critical is to provide a baseline from which to monitor the effects of future noise mitigation
efforts
In the preceding section we described a cost‐distance analysis technique that could be utilized to identify the most beneficial long‐
term mitigations for the acoustic environment Such corridors represent opportunities for park management and the aviation
community to work together as stewards What has not been identified in this document is the ldquovalue analysisrdquo process by which
public and expert opinion can be synthesized into an appropriate weighted resistance layer for cost‐distance analysis The overall
strategy may follow a form similar to this
An informal version of this same process was used to by the twelve members of the Denali Overflights Advisory Council to develop
an initial suite of aviation best practices from 2007 ndash 2012 Some of these best practices have produced substantial positive changes
for the park but others have failed to be acoustically effective due to their extent or timing The strategy described in this
document could be used to open the doors of conversation and improve the effectiveness of the mitigations to protect Denalirsquos
acoustic environment
References
Alaska National Interest Lands Conservation Act PL 96‐487 sect 1110(a)
Denali Aircraft Overflights Advisory Committee 2012 Denali air tour operatorsrsquo best practices to minimize sound impacts Available
at httpswwwnpsgovdenagetinvolvedaoachtmCP_JUMP_5151844 September 2013
Gergel S E and M G Turner 2006 Learning landscape ecology a practical guide to concepts and techniques Springer Science amp
Business Media New York
McRae BH VB Shah and TK Mohapatra 2013 Circuitscape 4 User Guide The Nature
Conservancy httpwwwcircuitscapeorg
Morgan D and J Van Horn 2001 Aircraft Overflight Activity in the Denali Wilderness An Analysis of Backcountry Rangers
13
Observations for 1999 and 2000 National Park Service Denali Park Alaska
National Park Service (NPS) 2000 Directorrsquos Order 47 Soundscape Preservation and Noise Management US Department of the
Interior National Park Service Washington DC
National Park Service (NPS) 2006a Management policy 6343 Environmental Compliance in Management policies 2006 US Department of the Interior National Park Service Washington DC
National Park Service (NPS) 2006b Management policy 637 Natural Resources Management in Management policies 2006 US Department of the Interior National Park Service Washington DC
National Park Service (NPS) 2006c Management policy 823 Use of motorized equipment in Management policies 2006 US Department of the Interior National Park Service Washington DC
National Park Service (NPS) 2006d Management policy 10249 Natural and Cultural Resource Management Requirements in Management policies 2006 US Department of the Interior National Park Service Washington DC
National Park Service (NPS) 2006e Denali National Park and Preserve final backcountry management plan environmental impact statement National Park Service Denali Park Alaska
National Park Service (NPS) 2014 Natural Sounds amp Night Skies Division Strategic Plan (2014 ndash 2019) US Department of the Interior National Park Service Natural Resources Stewardship and Science Ft Collins CO
Peterson D L and V T Parker 1998 Ecological scale theory and applications Columbia University Press New York
Siegel E 1970 There Are Two Freedoms Aesthetic Realism Lectures by Eli Siegel Web 1 July 2016
14
National Park Service US Department of the Interior
Denali National Park and Preserve Long-Range Transportation Plan
Appendix C Denali Park Road Risk Assessment Utilizing the Unstable Slope Management Program
1
Denali National Park and Preserve ndash Long Range Transportation Plan
Deterministic Geologic Risk Assessment of the Denali Park Road Utilizing the Unstable Slope Management Program
Authors Russell Rosenberg MSc ndash Physical Science Technician (Geologic Hazards) Denny Capps PhD ndash Park Geologist Heather Rogers MSc ndash Physical Science Technician (Geologic Hazards)
Prepared 080316
Revisions none to date
Introduction and Project Status
The 92‐mile Denali Park Road traverses a highly active geologic landscape and has experienced
numerous documented mass wasting events throughout the history of the road One of the most
dramatic occurred in late October 2013 when a 600‐ft‐long 110‐ft‐wide debris slide blocked the road
near MP 38 Blocks of permafrost‐frozen unconsolidated debris up to 15 ft thick slid on weak unfrozen
clay Frequent but less dramatic events block traffic undermine road surfaces and may cause damage
to vehicles or injuries Many events including the example above are likely triggered or exacerbated by
thawing permafrost and are consistent with the possible effects of anthropogenic climate change With
increases in road use the uncertain effects of climate change and possible changes to maintenance
funding levels National Park Service (NPS) and Federal Highway Administration (FHWA) staff identified
the need for a comprehensive risk analysis of geologic hazards along the Denali Park Road
The risk analysis is scheduled for completion by March 2017 and includes five parts (1) inventory maps
and linked database that illustrate spatialtemporal distribution of geohazards their relative activity
and geomorphic attributes (2) beta testing and implementation of the Unstable Slope Management
Program (USMP) rating criteria (3) geohazard susceptibility models that estimate the spatial probability
of occurrence (4) geohazard risk models that illustrate the potential consequences and (5)
analysesrecommendations to park management regarding other risks the road will exhibit over the
next decade (DENA‐MOA‐208813AB) Currently tasks 1 and 2 are predominately complete tasks 3 and
4 are underway and task 5 will follow the completion of tasks 1‐4 Although final results and
recommendations are still forthcoming the results of tasks 1 and 2 in particular the USMP ranking
scores (discussed below) provide an inventory and a first‐order deterministic risk assessment of
geologic hazards currently affecting the park road
2
The results of the USMP rating criteria provide valuable information on the spatial distribution of
geologic hazards their severity and the associated risk however they do not directly assess the
possible impacts of climate change or provide a detailed outlook of possible future scenarios We utilize
these data to provide a preliminary identification of the areas with the highest relative risk and their
spatial patterns Consideration of this information should be valuable to this Long Range Transportation
Plan (LRTP) and for park managers and planners as future infrastructure plans are being developed
Unstable Slope Management Program Site Rankings
The USMP is a collaboration between the FHWA many other federal agencies including the NPS private
geotechnical consultants and the Alaska Department of Transportation amp Public Facilities (AKDOT) that
ranks geologically unstable slopes for the purpose of facilitating more effective long‐term geotechnical
asset management USMP scores provide a deterministic ranking of agency risk associated with any
particular geologic hazard site These scores consider elements of both the severity and
frequencyprobability of a hazard and the exposure and vulnerability at each particular site Example
elements include the amount of roadway affected by landslide events the frequency of known hazard
events the impact of events on the use of the transportation corridor the maintenance cost and
complexity and annual average daily traffic For detailed information the USMP ranking criteria please
see (httpnlcsmontanaeduusmpRatingManualpdf)
We have currently completed a total of 141 USMP site rankings along the entire 92 miles of the DENA
Park Road (Figure 1) These data represent the vast majority of known geologic hazard sites and include
landslides debris flow drainages rockfall areas frost‐heaves and erosional undercutting due to fluvial
processes It should be noted however that these site rankings are not totally comprehensive instead
they represent our most complete knowledge as of 06292016 The DENA USMP rankings range from
164 to 948 with a mean value of 328 and more variance within higher ranking sites To put these values
in perspective immediately however the USMP qualitatively defines sites that score less than 200 to be
in ldquogoodrdquo condition sites that score between 200 and 399 to be in ldquofairrdquo condition and sites that score
400 or higher to be in ldquopoorrdquo condition
In theory sites in poor condition are more likely to pose persistent andor more serious problems along
the road and areas of higher risk density are more likely to see a higher concentration of problems In
DENA the current majority of our sites 67 rank in fair condition while only 9 are in good condition
and a relatively large number of sites 24 are in poor condition The only significant outlier was the
ldquoPretty Rocksrdquo slump (Figure 3b) with a score of 948 365 points higher than the next highest site
Spatially regions of higher USMP risk density (Figure 2) are most pronounced along Polychrome Pass
and the Eielson Bluffs areas Individual USMP scores represent the relative risk associated with a hazard
site and risk density represents the relative concentration of agency risk
3
Figure 1 DENA USMP site rankings on IKONOS imagery Icon sized is scaled by individual site rank and colored according to good fair or poor qualitative rank
Figure 2 DENA USMP score density on IKONOS imagery Density scaled by linear concentration and site ranking scores
Of the sites ranked in poor in condition along the Park Road many received prior mitigation or were
previously identified as areas of concern by maintenance or resource management personnel Some
previously noted severe geologic hazard sites in lsquoagreementrsquo with poor USMP scores include the ldquoPretty
Rocksrdquo slump (Figure 3a) debris flow activity at ldquoBugstufferrdquo creek (Figure 3b) the ldquoBear CaveMile 45rdquo
slump (Figure 3c) and the ldquoIgloo Debris Sliderdquo (Figure 3d) Additionally Polychrome Pass is a known area
of high geologic hazard occurrences This general agreement of USMP scores and professional
4
judgementinstitutional knowledge within DENA should be reassuring to park managers and help
demonstrate that the USMP ranking scores represent useful information and are based off of many
years of development from similar programs and expertise developed by FHWA AKDOT Oregon Dept
of Transportation and private firms The USMP provides an institutional framework for tracking these
known problem areas and has identified other new examples
A B
C D
A B
Figure 3 Previously recognized sites that rank in poor condition A ndash Pretty Rocks Slump (mile 454 948 points) B ndash Bugstuffer debris flow (mile 519 575 points) C ndash Bear Cave Slump (mile 45 411 points) D ndash Igloo Debris Slide (mile 377 514 points)
Current Applications to the LRTP
The USMP rankings provide a preliminary framework for understanding the relative severity of risk
associated with geologic hazards along the Park Road Although we do not currently make
recommendations tailored to specific sites or address possible future scenarios we suggest that an
awareness of the current results of the USMP rankings is beneficial to this LRTP Likely applications of
the USMP data to the LRTP would involve spatial analysis of USMP rankings as they relate to possible
disruptions in traffic programming of potential mitigation projects and overlap with future
infrastructure planning In order to facilitate this analysis we submitted a spatial database of our USMP
rankings to PaTINA (they are also available on request) We emphasize that these results are
preliminary yet they provide a method for understanding and considering geologic hazards in a broader
context Park planners and managers should continue to work with resource staff in understanding the
5
implications of these results however the following are potential applications to consider for the
current LRTP
All geologic hazards sites but in particular those in poor condition are more likely to pose
persistent andor serious problems along the Park Road These are areas where the
transportation corridor could experience interruptions or incur high maintenance costs as a
result of geologic activity Sites in poor condition should be considered for mitigation and
investigated in more scientific detail (see Future Work)
The USMP rankings may help identify geotechnical assets where hazards do not appear
extremely severe but may be candidates for mitigation from a risk‐based or cost‐based
perspective Rockfall sites that are not capable of producing catastrophic roadway failure but
require very frequent maintenance are good examples of this These sites also rank in poor
condition but may not otherwise receive attention from management
Density analysis of USMP site distribution identifies areas of non‐discrete geologic hazard areas
that may require alternate or more systematic mitigation efforts to increase cost effectiveness
The extreme concentration of hazard sites along Polychrome Pass is an example of such an area
Future Applications to the LRTP
Both the LRTP and USMP have been designed to evolve as new information become available through
time thus allowing for future applications with as new data become available Most transportation
agencies apply transportation asset management (TAM) systems to transportation assets such as
bridges and road surfaces however geotechnical assets such as rock slopes and embankments are
unlikely to be considered with the same detail (Stanley 2010) The USMP provides a system for
geotechnical asset management by creating a framework to establish potential performance measures
and targets for individual geologic hazards and the overall transportation corridor (Federal Highway
Administration‐DRAFT report 2015) We plan to update USMP rankings for the DENA park road as more
information is made available or new events occur and to perform a systematic re‐evaluation once
every five years By tracking USMP rankings over time the following performance measures could be
considered by transportation planners and park managers
Establish targets to reduce the overall number of fair or poor ranking sites along the park road
This could represent a total percentage reduction a maximum target number of poorfair sites
or a certain number of poorfair sites per unit distance along the road
Establish targets to reduce the risk at sites of particular concern (see Future Work)
A benefitcost analysis for all geotechnical assets along the transportation corridor could be
undertaken The USMP group is currently working on developing this tool and the effectiveness
of programmed mitigation projects could be measured by tracking costs vs performance
changes in geotechnical assets recorded by the USMP rankings
6
A method for tracking the performance of assets through time to establish a preferred course of
action As an example USMP scores at the site of the October 2013 slide that blocked the road
(Figure 3d) have been on a downward trend since May 2015 because of relative inactivity while
scores at the Pretty Rocks slump (Figure 3a) have remained higher or increased slightly because
of recent activity Establishing trends in USMP scores through time could be useful for
determining appropriate mitigation priority
Future Work
The USMP risk matrix provides a relatively robust assessment of geotechnical assets based on their
current condition and a way to track their performance through time However because of its
deterministic nature it does not directly consider possible or likely future conditions We hope to
address this limitation through the continued development of the geologic risk assessment Completion
of task 3‐5 of the risk assessment will allow us provide data which will help determine the probability of
future events based on geologic conditions and the associated risk based on transportation
infrastructure and human exposure The results of tasks 3‐5 will allow us to assess the potential outlook
of areas of the road based on their probability to experience new events Additionally we will expand
on the results of the USMP to examine high ranking sites in more scientific depth Examples of this may
include drilling bore holes at the Pretty Rocks slump to determine sub‐surface conditions examining
the relative abundance of fine‐grained sediment in debris flow watersheds or repeat GPS surveys to
ascertain motion rates such as are currently ongoing at the Bear CaveMile 45 slump By using all of
these data sets in conjunction we plan to propose specific recommendations and mitigation
considerations for sites of concern based on their current conditions and future outlook
References Cited
Federal Highway Administration 2015 DRAFT‐Unstable Slope Performance Measures for FLMAs using
USMP Ratings
Federal Highway Administration and National Park Service 2015 Comprehensive Memorandum of
Agreement DENA 208813 AB Denali National Park and Preserve ndash Conduct A Hazard Assessment Of
The Denali Park Road Corridor
Landslide Technology and Federal Highway Administration 2014 Geotechnical Asset Management ndash
Unstable Slope Rating Category Descriptions For Federal Land Management Agencies
Stanley D A 2010 Asset Management In A World Of Dirt ndash Emergence of an Underdeveloped Sector of
Transportation Asset Management TR News no 277 p 18‐22
7
Denali National Park and PreserveLong-Range Transportation Plan
Appendix D Current and Future Partner Projects
National Park ServiceUS Department of the Interior
1
1
Memo
To Denali National Park Long Range Transportation Plan Team
From ATKINS Email
Phone 720-841-2956 Date Sep 19 2014 Modified August 28 2017
Ref cc
Subject Possible Foreseeable ProjectsPlans near Denali National Park
Matanuska Susitna Borough LRTP
Source httpwwwmatsugovusplanslrtp
This transportation plan assesses growth in the Mat-Su Borough over the next 20 years and
identifies the key elements of the Boroughrsquos future transportation system that will be needed to
serve its growing communities The transportation plan will help the residents develop a Borough
that is a pleasure to live in with public infrastructure that supports their daily lives
Alaska Stand Alone Pipeline (ASAP)
Source httpwwwasapeiscom
The Alaska Stand Alone Pipeline (ASAP) Project is a 727-mile long 36-inch-diameter natural gas
transmission mainline extending from the GCF near Prudhoe Bay south to a connection with the
existing ENSTAR pipeline system in the Matanuska-Susitna Borough A 29-mile-long 12-inch-
diameter lateral pipeline will connect the mainline to Fairbanks The proposed pipeline will be
buried except at possible fault crossings elevated bridge stream crossings pigging facilities and
block valve locations
The pipeline will bypass Denali National Park and Preserve to the east and will then generally
parallel the Parks Highway corridor to Willow continuing south to its connection into ENSTARs
distribution system at MP 39 of the Beluga Pipeline southwest of Big Lake
The Alaska District US Army Corps of Engineers (Corps) has been designated the lead federal
agency and the US Bureau of Land Management (BLM) National Park Service (NPS) US
Environmental Protection Agency (EPA) US Fish and Wildlife Service (USFWS) US
Department of Transportation Pipeline and Hazardous Materials Safety Administration (PHMSA)
and the Alaska Department of Natural Resources State Pipeline Coordinators Office (SPCO) are
participating as cooperating agencies in the Supplemental Environmental Impact Statement (SEIS)
development process
2
2
Memo
Alaska LNG project
Source httpwwwarcticgasgovalaska-lng-project
The Alaska LNG export project would be among the worldrsquos largest natural gas-development
projects The project is in the pre-front-end engineering and design phase or pre-FEED The
project consists of constructing a 58-mile pipeline from Point Thomson gas field to Prudhoe Bay
and 800-mile pipeline from Prudhoe Bay to Nikiski
DOT Parks Highway Projects
Source httpdotalaskagovparks2014
The Alaska Department of Transportation and Public Facilities is performing road construction on
the Parks Highway during the construction season Work includes turn lanes passing lanes re-
surfacing bridge repairs
3
3
Memo
ADOTampPF Area Plans
Source httpwwwdotalaskagovstwdplngareaplansarea_regionalindexshtml
These are regional multi-modal transportation plans developed for specific areas of the state
designed to address movement between communities in the region and from the region to points
beyond Each of these plans incorporates economic modeling to evaluate potential projects and
prioritize them to best meet state and regional goals Denali National Park is partially included in
the Interior Alaska Transportation Planning Area The most recent plan for this area was adopted
in 2010 The plan includes transportation impacts to topic areas that include
bull Gas Pipeline
bull Mineral Development
bull Military Training
bull Railroad Development
bull Tourism
4
4
Memo The Plan examines potential impacts of these and other developments to highways rail aviation
and local community roads and although the plan did not fiscally constrain priority projects
several projects were identified as short-term capital improvement needs Among these projects
were recommendations for improvements on the George Parks Highway in the area of Denali
National Park This project as described by the plan includes passing lanes from MP 113 to MP
163 for an estimated cost of $15 million
Alaska Railroad ndash Healy Canyon
Source httpalaskarailroadcomPortals6pdfprojects2012_01_04_Healy_Canyon_Stabilization_FS_PROJpdf
Work is being proposed in Healy Canyon between Denali Park Station at Milepost (MP) 348 and Healy (MP 358) The Alaska Railroad has proposed projects to
bull Stabilize the track bed (ongoing)
bull Control the rock fall problems
bull ldquoDaylightrdquo (remove the top) Moody Tunnel at MP 3536 (complete)
bull Realign tracks around Garner Tunnel (complete)
bull Realign the tracks to enhance safety at MP 3536 (Moody Tunnel) and MP 357 (complete)
Proposed Susitna-Watana Dam
Source httpwwwsusitna-watanahydroorgprojectproject-description
Susitna-Watana Hydro could be a large hydro project on the Susitna River upstream of Denali
National Park This project would provide long-term stable power for generations of Alaskans and
have economic impacts on the area The project would generate 2800000 MWh of annual
energy once it comes online in 2024 The installed capacity is 600 megawatts (MW)
Environmental studies are currently underway
DOT Mile 231 Proposed Pedestrian Project
Source httpawsstateakusOnlinePublicNoticesNoticesViewaspxid=173914
The project scope includes constructing a new pedestrian bridge across the Nenana River trail
connections a rest area and intersection improvements Conceptual designs preliminary
engineering and environmental studies are currently underway
Other Area Energy Projects (Wind Coal Natural Gas exploration)
Eva Creek Wind Project Eva Creek is the largest wind project in Alaska at 25-megawatts It is
located 14 miles from Healy at the top of the 10-mile Ferry mining road
Usibelli Coal Mine Exploration License Plan of Operations Usibelli Coal Mine Inc has
submitted a request to carry out a Coalbed Methane drilling exploration program at a prospect site
approximately seven miles east of the town of Healy The project will consist of a single vertical
coal-bed methane exploratory well drilled inside the exploration license area The exploratory well
5
5
Memo will help determine whether sub-surface coal seams contain sufficient quantities of methane gas to
justify further exploration in the area (Source
httpdogdnralaskagovPermittingDocuments2014UsibelliUsibelli_LOCI_14_002_Drilling_at_H
ealy_Creek_Propect_Noticepdf)
Stampede State Recreation Area There is a potential designation of a Stampede State
Recreation Area west of the Panguingue Creek subdivision In March 2013 Senator
Representative David Guttenberg introduced HB148 in response to requests by the Denali
Borough Assembly
Borough Planning Commissioners are currently working through recommendations for area
management which include details of proposed allowed uses and a plan for land management
(Source httpnorthernorgtake-actionstampede-state-recreation-area-1)
Air Traffic ndash Overflights council
Source httpwwwnpsgovdenaparkmgmtaoachtm
The Denali National Park and Preserve Aircraft Overflights Advisory was established in 2007 to
consider resource conflicts between aircraft tours and park visitors on the ground The group is
charged with advising the National Park Service (NPS) on ways to mitigate (reduce) sound impacts
from aircraft flights over the park develop voluntary measures for assuring the safety of
passengers pilots and mountaineers and achieve desired resource conditions at Denali as
outlined in the Backcountry Management Plan (2006)
6
Denali National Park and PreserveLong-Range Transportation Plan
Appendix EPark Transportation Investment Needs Analysis
National Park ServiceUS Department of the Interior
Appendix E Denali National Park and Preserve Park Transportation
Investment Needs Analysis
Denver Service Center Planning Division | National Park Service | March 2017
1
Contents ABSTRACT 2
INTRODUCTION 2
PATINA DESIGN 3
OVERVIEW 3
VEHICLE MANAGEMENT PLAN 3
VECTOR ANALYSIS 4
DATA COLLECTION 4
TRANSPORTATION NETWORK 4
ASSET METRICS 5
HIGH RISK 5
INVESTMENT RANKING 6
GOAL AREAS 7
METHODOLOGY 8
DATA PREP 8
LAYER WEIGHTING 9
COMPOSITE ANALYSIS STEPS 10
SELECTED RESULTS 14
OUTPUTS 14
ROAD SEGMENT FINDINGS 16
Motorized Paved Zone 16
Wildlife Viewing Subzone 1 17
Wildlife Viewing Subzone 2 18
Wildlife Viewing Subzone 3 19
Wildlife Viewing Subzone 4 20
DISCUSSION 20
INTERNAL WEIGHTING 21
SKEWED DATA 21
SPATIAL SPREAD OF DATA 21
NEXT STEPS 22
2
ABSTRACT A Park Transportation Investment Needs Analysis (PaTINA) was performed in support of the Denali
National Park and Preserve Long Range Transportation Plan The PaTINA spatially models areas of
potential investment need by using a Geographic Information System to overlay geographic data The
data overlays are assigned a weight and added together where they are coincident in space The
resulting model visually depicts areas where multiple complexities occur This is compared with
transportation facility data to inform investment strategies The PaTINA results are shared in an
interactive web mapping environment and may be added to other mapping tools as a map service
INTRODUCTION The Park Transportation Investment Needs Analysis (PaTINA) synthesizes geospatial information to inform transportation planning and investment PaTINA takes into consideration the goals of the National Park Service (NPS) service-wide goals the goals of individual NPS units and the requirements of the Federal Highway Administration The combination of these goals is expressed in the Long Range Transportation Goals PaTINA creates geospatial-based analyses related to these goals and produces high-resolution outcomes that are site specific within the park unit PaTINA models use compiled data sources to create models related to transportation needs and restraints The vision goals and objectives established in the park unitrsquos Long Range Transportation Plan (LRTP) determine the input data for PaTINA As an analysis PaTINA is accomplished by overlaying map themes important to park management within
a Geographic Information System (GIS) and spatially comparing the overlay results to the transportation
network Metrics used by facility managers to rank assets of the transportation network in terms of
needed maintenance are then compared to the PaTINA results The analyses demonstrate where
priority areas may be located and can be compared to financial recommendations of LRTP The resulting
analyses can spatially inform the condition performance assessment needs identification funding
strategies and even funding prioritization
Modeled PaTINA results are shared as map services and presented in an interactive web mapping
application along with park facility and other relevant data The PaTINA process can be repeated with
model inputs and weights adjusted to reflect current park management needs
The PaTINA was originally developed as part of the Golden Gate National Recreation Area LRTP to help identify key areas where a confluence of conditions highlighted the need for investment consideration The recognized utility of the analysis led the Denali National Park and Preserve (Denali or park) LRTP team to request a PaTINA to help identify areas of concern that may not be readily discovered without geospatial tools
3
PATINA DESIGN
OVERVIEW The following are steps used to design create and implement PaTINA for the Denali LRTP At the
beginning stages of the LRTP goals are established for the Park Unit which includes Washington Federal
Highways and the Park Unit input Goal areas for Denali were system optimization resource
protection user experience access climate change and partners Each goal area was assigned
applicable GIS data layers which establish elements of the goal The data layers were given priority
weights depending on their importance on how it affects or is affected by the transportation network
Priority weights were determined with input from Denali park staff specialty experts
Once weights were established spatial analysis was performed to determine the overlap of each input
data layer within each goal area The weights of each input layer were added together where overlap
occurred The overlaying process identified areas where multiple inputs are spatially concurrent as well
as where inputs deemed as a higher prioritymdashmore heavily weighted--occur
The overlay results of each goal area were combined to generate the overall PaTINA composite denoted
as ldquoPotential Need Areasrdquo Throughout the LRTP process additional data themes outside the goal areas
were identified as a need and were categorized into three parts asset metrics high risk and investment
ranking These data were later added to the final web mapping product to compare to the Potential
Need Areas
VEHICLE MANAGEMENT PLAN In 2012 Denali prepared a Vehicle Management Plan (VMP) to evaluate alternatives for managing
vehicle use along the Park Road The preferred alternative of the plan proposed new management
zoning to include additional wildlife viewing subzones According to the VMP these subzones would be
implemented to clarify management objectives necessary to achieve desired conditions within specific
road sections Due to the significance of the segments for management purposes (Figure 1) it was
important to incorporate the sections into the initial design of the Denali PaTINA To do so the PaTINA
was applied independently to each road segment resulting in five separate sets of analyses Wildlife
viewing subzone 2 is split between 2a) from Teklanika River Bridge and the Eielson Visitor Center and
2b) east of Wonder Lake
4
Figure 1 Road segments defined in the Denali Vehicle Management Plan and used as a basis for the PaTINA
VECTOR ANALYSIS Following the methodology of the Golden Gate PaTINA the Denali PaTINA was completed as a vector
analysis Golden Gate was the pilot for the PaTINA effort which led to expectations that the process be
replicable at additional park units Vector analysis also has the added benefit of preserving spatial
geometries and attribution Attribution allows web map users to deconstruct the results to verify inputs
contributing to the composite result
DATA COLLECTION The following sections describe the categories of data that make up PaTINA and are included in the final
product
TRANSPORTATION NETWORK The transportation network for Denali first needed to be defined to create a spatial basis for the overlay
analysis For Denali the transportation network consists of roads trails parking lots railroad and
airstrips Each polyline transportation network features were assigned a width (Table 1) and then
2b
2a
5
buffered to that width to create a polygon input All polygon inputs were merged together to create a
final transportation network data layer
Table 1 Buffers applied to the Denali transportation network
Transportation Feature Width
Roads 11rsquo Trails 8rsquo
Railroad 100rsquo
ASSET METRICS Asset metrics included in the Denali PaTINA show facility condition index (FCI) and optimizer bands The
FCI rates the condition of a facility or asset using a numeric rating system This system reflects the
current replacement value of an asset and its projected cost of repairs Optimizer bands were developed
to divide a parkrsquos asset portfolio into five bands to represent the level of maintenance that each asset
should receive The metrics help staff make informed decisions about the allocation of limited funding
and staff time for maintaining park infrastructure
The FCI and optimizer band data were derived from the facility management software system (FMSS)
Assets in the transportation network data layer were joined together with the FMSS spreadsheet to be
able to show the asset metric information spatially The join was based on the Location ID attribute in
both the spreadsheet and spatial data A number of records in the spatial data were missing Location
IDrsquos so manual matching had to take place This was done by using aerial imagery to identify assets
based off of the FMSS location descriptions Assets that still couldnrsquot be identified through this method
received input from park staff via the web mapping tool by using create new features capability
Create New Features Tool in Web Map Site
The Create New Features tool allows users to generate data within the web map interface The user creates the geometry of the data and can also include information in predefined text boxes that gets added to the feature class attribute table Once the new feature has been created and saved it is automatically stored as a new record in a feature class that sits on a local server This benefits the GIS staff by having quick access to newly created data Because the data is automatically stored users can revisit the web map and see previous created features Geometry and text changes can be made to the feature after it has been created
HIGH RISK In winter of 2016 NPS regional and park staff as well as Federal Highway Administration (FHWA)
conducted a risk assessment workshop for Denali The purpose was to identify risk types and areas to
mitigate risk and provide recommendations to park management Those findings will be included in the
Denali LRTP There were a total of 28 identified risk types that were ranked into prioritization categories
from low to high Because of the importance of understanding where risk occurs and to mitigate future
events it was decided to include this information as spatial data into the PaTINA web map Only the
6
high risk category was added to the analysis due to the significance of these risks on Denalirsquos resources
visitors and staff
In total there were eight high risk types identified only six of which could be mapped Out of the six
remaining risk types three had data available The Create New Feature tool was used by park staff to
generate a data layer identifying locations of gravel production sites but was later omitted by the LRTP
team It was concluded that the site itself is not a risk to the transportation network but rather the
absence of gravel in these pits are The in holder access data was gathered from the NPS Lands
Resources Division to show tracts within Denali Culvert locations were derived from an excel
spreadsheet provided by FHWA ndash Western Federal Lands by plotting XY coordinates Lastly the
unstable slopes data was provided by park staff and was originally generated through FHWA in
collaboration with NPS Table 2 summarizes the risk data included in the PaTINA web map
Table 2 Summary of risk data used in the Denali LRTP
Risk Type Can it be mapped
Is data available
What is the source of the data
Inholder Access yes yes NPS Lands Resources Division
Implementation of LRTP no na
Staff Level Changes no na
Gravel Production Processing or Purchase yes no
Culverts (MampO) yes yes FHWAndash Western Federal Lands
Permafrost degradation yes no
River and Stream Flooding yes no
Unstable Slopes yes yes NPS FHWAndash Western Federal Lands
INVESTMENT RANKING A financial analysis was completed for the Denali LRTP resulting in development of investment
strategies An investment strategy combines goals and objectives of the LRTP agreed upon investments
and other transportation needs and constraints in the current funding environment One investment
strategy category is to Repair and Maintain the Unpaved Portion of the Denali Park Road and focuses on
desired condition targets which change depending on the Park Road segment This strategy aligns with
the VMPrsquos concept that the Park Road is less traveled by visitors farther into the park and those
segments with lower desired conditions can help reserve funding for other transportation asset
priorities
Due to the importance of financial analysis results it was decided to include the information as a spatial
component to PaTINA A table showing current and desired conditions for each segment with associated
milepost numbers was provided by one of the contractors working on the LRTP A GIS layer of mile
markers was used to correlate data from the table and create a new layer representing the financial
analysis Attribute information was added and the layer was symbolized by segment showing highest
priority and lowest priority Table 3 shows current and desired condition information that was
incorporated into the new investment ranking GIS layer These results can easily be compared to other
components such as high risk areas or goal area composites
7
Table 3 Financial analysis data based on mile markers
Mile Post Segment Current
Condition Desired
Condition Annual Needs
Priority Ranking
0 to 15 Entrance area to Savage River Trailhead
na 00 na 5
15 to 32 Savage River Trailhead to Teklanika Bridge
009 109 $013 M 4
32 to 39 Igloo Forest to Sable Pass 013 109 $014 M 4
39 to 43 Sable Pass to East Fork Bridge 013 109 $024 M 4
43 to 47 Polychrome to Plains of Murie 035 245 $074 M 2
47 to 62 Plains of Murie to Stony Overlook 013 149 $047 M 3
62 to 66 Stony Overlook to Eielson 014 149 $018 M 3
66 to 70 Eielson to Grassy Pass 017 325 $ - 2
70 to 88 Grassy Pass to Boundary Pit 012 325 $ - 2
88 to 92 Boundary Pit to Kantishna 0499 449 $012 M 1
GOAL AREAS During the early development of the Denali LRTP team members created six goal areas each with an
associated statement The goal statements represent aspects of the NPS mission and Denali vision
statements to help guide future transportation decisions These goal areas serve as a basis throughout
the LRTP for identifying baseline conditions performance management and implementation Table 4
shows the six goal areas and goal statements
Table 4 Denali LRTP goal statements
Goal Area Goal Statement
Resource Protection Understand and protect Denali NPPrsquos fundamental Park resources and values as they relate to the transportation system
Climate Change Plan for climate change impacts to the Parkrsquos transportation system
User Experience Provide a quality multi-modal Park experience for users
Access Provide safe efficient and appropriate Park access
System Optimization Develop a long-term transportation system to appropriately satisfy current and future Park needs
Partnership Manage formal and informal commercial partnerships to provide a viable transportation system
These goal areas served as a guide for GIS data collection Datasets related to each goal area were
identified collected and formatted as needed for the composite analysis The Partnership goal area is
not included in the PaTINA since no map-able data were identified Future iterations of the Denali
PaTINA may include the Partnership goal area if new data are obtained The System Optimization goal
was also not included in the analysis but rather it was called out separately for comparison in the final
model results This category is referred to as Asset Metrics (described above) and include FMSS-specific
data The purpose of this was to be able to spatially detect and understand the correlation between
FMSS data and the Parkrsquos values stated from the LRTP goal areas In total 26 GIS layers were used as
input layers for the analysis Layers from each goal area were overlaid upon each other so that the goals
8
could be visualized for the LRTP Listed below are the input layers for each of the goal areas used for the
analysis
Resource Protection
bull Sheep Gaps
bull Exotic Species
bull StreamRoad Intersections
bull Vegetation Monitoring Marker
bull Sheep^
bull Moose^
bull Bear^
bull Wolves^
bull Caribou (Aug-Sep)^
bull Caribou (July-Aug)^
bull Caribou (May-June)^
bull Wetlands
bull National Register Structures
bull Historic Districts
User Experience
bull Viewscapes
bull Visitor Services
bull Social Trails
bull Visitor Pattern
bull High Visitor Use Area
Access
bull Safety Areas of Concern
bull Railroad Depot
bull Bus Stops
Climate Change
bull Geohazards
bull Permafrost
^Based on extrapolated observation data reported in the Denali VMP
New data created by park staff for the PaTINA
During the process of collecting data data needs were recognized and collated Identified data gaps
included permafrost degradation river and stream flooding events informal aviation landing areas
congestion hotspots and wildlife patterns To fill certain gaps the Create New Features tool in the web
map was utilized by park staff Layers in the list above with an asterisk represent the ones created by
park staff Other identified data gaps focused on visitor use statistics Examples included dependable
traffic counts visitation numbers by area and visitor numbers on bus types beyond front country area
METHODOLOGY
DATA PREP All input data layers were projected to NAD_1983_Alaska_Albers Point and polyline datasets were
buffered and converted to polygon features and then clipped to the transportation network Figure 2
shows an example of a point layer created by park staff using the Create New Feature tool that was later
buffered and clipped Once the polygon data was created per input layer they were merged together to
create a single polygon layer For example park staff created multiple polylines and points to capture
visitor patterns along the Park Road The polygons were merged together to create a single visitor
pattern input layer under the User Experience goal area
9
Figure 2 Example of Denali staff input used to create data for the PaTINA
LAYER WEIGHTING Within the goal areas each input polygon layer was assigned a value The values ranged from 0 (no
impact) to 05 (lesser impact) to 1 (full impact) and was assigned by park staff Table 5 shows each goal
area and associated weighted values for each road segment The term ldquoimpactrdquo in this setting may refer
to impact the input layer has on the transportation network or conversely impact the transportation
network has on the input layer To align with the VMPrsquos subzones of the Park Road each input layer was
weighted separately for individual road segments Weighted per segment reflects park management
priorities which may vary for a particular input by road segment The High Visitor Use Area input layer is
an example of this where the impact is higher in the front country compared to further west on the Park
Road Therefore the High Visitor Use Area input layer received a higher impact value in the front
country road segment
10
Table 5 Layer input ranks assigned by park staff
RESOURCE PROTECTION GOAL AREA
Motorized Sightseeing
Subzone
Wildlife Viewing
Subzone 1
Wildlife Viewing
Subzone 2a
Wildlife Viewing
Subzone 3
Wildlife Viewing
Subzone 2b
Sheep Gaps 0 05 1 05 0
Exotic Species 1 05 05 05 05
StreamRoad Intersections 1 1 1 05 1
Vegetation Monitoring Marker 0 1 1 05 0
Sheep 05 05 1 0 0
Moose 1 05 05 1 05
Bear 05 05 1 05 05
Wolves 1 05 05 05 05
Caribou (Aug-Sep) 0 0 05 1 0
Caribou (July ndashAug) 0 05 05 1 0
Caribou (May ndash June) 0 0 0 05 0
Wetlands 1 05 1 1 05
National Register Structures 1 1 1 1 1
Historic Districts 1 1 1 1 1
USER EXPERIENCE GOAL AREA
Motorized Sightseeing
Subzone
Wildlife Viewing
Subzone 1
Wildlife Viewing
Subzone 2a
Wildlife Viewing
Subzone 3
Wildlife Viewing
Subzone 2b
Viewscapes 0 05 1 05 0
Visitor Services 1 1 1 1 1
Social Trails 1 1 1 1 1
Visitor Pattern 1 1 0 0 05
High Visitor Use Area 1 05 05 05 05
ACCESS GOAL AREA
Motorized Sightseeing
Subzone
Wildlife Viewing
Subzone 1
Wildlife Viewing
Subzone 2a
Wildlife Viewing
Subzone 3
Wildlife Viewing
Subzone 2b
Safety Areas of Concern 05 0 05 05 0
Railroad Depot 1 0 0 0 0
Bus Stops 1 0 0 0 0
CLIMATE CHANGE GOAL AREA
Motorized Sightseeing
Subzone
Wildlife Viewing
Subzone 1
Wildlife Viewing
Subzone 2a
Wildlife Viewing
Subzone 3
Wildlife Viewing
Subzone 2b
Geohazards 05 05 1 1 05
Permafrost 05 05 1 0 05
COMPOSITE ANALYSIS STEPS 1 Once the input layers were weighted the values were added into new fields in the attribute
table The new field names were abbreviated with each goal area name and input layer number
For example Resource Protectionsheep gaps would read as RP1 since sheep gaps was listed
11
first in the data collection table Another example would be Resource Protectionexotic species
shown as RP2 The following shows goal area abbreviations
a Resource Protection ndash RP
b User Experience ndash UE
c Access ndash AC
d Climate Change ndash CC
2 Within each goal area the input layers were combined with the transportation network layer
using the UNION tool creating a goal area output layer This resulted in the following layers
RP_Union UE_Union AC_Union and CC_Union
3 Using the DELETE tool all fields were deleted except for the five road segment fields This
reduced the file size of the output layer for future geoprocessing steps and faster speeds once
added to the web map
Steps 4-6 refer to only one goal area and one road segment For example Resource Protection
(RP)Motorized Paved Zone (MPZ)
4 A new field called RP_T_MPZ was added to the RP goal area output layer to sum the total
values This was completed by using the FIELD CALCULATOR tool and summing the MPZ value
for each input layer (RP1_MPZ + RP2_MPZ)
5 Due to the goal areas having a different number of inputs the total sum value was normalized
to avoid skewing the outputs to goal areas with more input layers By normalizing the total
values could be shown on a common scale A new field was added and called RP_TN_MPZ Using
the FIELD CALCUALTOR tool the RP_T_MPZ value was divided by the total number of inputs
resulting in a normalized number (RP_T_MPZ14= RP_TN_MPZ)
6 The RP goal area output layer was then clipped to a previously created MPZ road segment layer
(RP_MPZ_Clip)
Steps 1-6 were repeated for each goal area and road segment In total twenty clipped output layers
were created Figure 3 shows steps 1-6 in a flowchart
12
Figure 3 Process diagram for PaTINA steps 1 - 6
Steps 7-9 refer to only the MPZ road segment
7 The next step utilized the UNION tool to union each clipped goal area output layer by road
segment (RP_MPZ_Clip UE_MPZ_Clip AC_MPZ_Clip CC_MPZ_Clip = MPZ_Clip)
8 Once the MPZ_Clip layer was created a new field called All_MPZ was added to sum the total
normalized numbers The FIELD CALCULATOR tool was used and summed each goal areas
normalized number (RP_TN_MPZ + UE_TN_MPZ + AC_TN_MPZ + CC_TN_MPZ = ALL_MPZ)
9 The overall MPZ composite was then symbolized based on the total MPZ normalized values
(ALL_MPZ) and was shown with five classes using Natural Jenks classification The five classes
were symbolized from very low (dark green) low (light green) medium (yellow) high (orange)
to very high (red) which identified potential need areas throughout the transportation network
Figure 4 shows symbolization for the front country area in road segment MPZ
13
Figure 4 Mapped Potential Need Areas for the Motorized Paved Zone
Steps 7-9 shown in Figure 5 were repeated for each road segment In total five segments showed very
low to very high potential need areas
Figure 5 Process diagram for PaTINA steps 7-9
14
SELECTED RESULTS
OUTPUTS The PaTINA analysis resulted in four main output groups which may be viewed individually or compared
to one another These groups are asset metrics high risk areas investment rankings and potential
need areas See the Data Collection section for review of these groups
Figure 6 shows potential need areas against high risk areas located in Wildlife Viewing Subzone 3
segment of the Park Road The results appear to have several high risk areas spatially coincident with
high need areas highlighting locations that may be considered for financial investment Doing so may
help protect park resources and visitor safety
Figure 6 High Risk Areas shown with Potential Need Areas modeled in the PaTINA
15
Figure 7 shows potential need areas against high investment ranking along the Wildlife Viewing Subzone
2 segment of the Park Road The investment ranking displays two sections which are Igloo Forest to
Sable Pass (MP 32 to 39) and Sable Pass to East Fork Bridge (MP 39 to 43) Within the high investment
sections potential needs can be identified for further examination for future investment
Figure 7 Example PaTINA-modeled Potential Needs Areas shown with investment ranking data
16
ROAD SEGMENT FINDINGS
Motorized Paved Zone The motorized paved zone starts at the park entrance at mile post 0 and ends at mile post 149 (Figure
8) In this segment it appears that the greatest amount of very high potential need areas are
concentrated around the Denali Visitor Center and high potential need areas are located just east of
that surrounding the Riley Creek Campground These potential need areas consist of up to twelve input
layers each of which fall within all goal areas Findings also show the Park Headquarters and Savage
River to be potential need areas with values of medium and high
Figure 8 PaTINA-modeled potential need areas for the Motorized Paved Zone segment of the Park Road
17
Wildlife Viewing Subzone 1 The wildlife viewing subzone 1 spans the distance between mile post 149 to mile post 319 (Figure 9)
and includes the Sanctuary River campground and the Teklanika River campground and rest stop The
Teklanika River campground shows the largest very high potential need area Up to twelve input layers
from three of the goal areas cover this segment The access goal is not included Findings also show the
Sanctuary River campground and west of the Primrose Ridge and Mount Margaret rest stop to be a very
high potential need area though the spatial area is smaller compared to the Teklanika River
campground This location is comprised of up to thirteen input layers from all goal areas
Figure 9 PaTINA-modeled potential need areas for the Wildlife Viewing Subzone 1 segment of the Park Road
18
Wildlife Viewing Subzone 2a The wildlife viewing subzone 2a ranges from mile post 319 to mile post 66 (Figure 10) and includes
locations from Igloo Creek campground to Eielson Visitor Center The findings suggest that there are
many high potential need areas along this segment of road The most prominent areas are located
before and after Polychrome Overlook and includes up to ten input layers along this stretch The Eielson
Visitor Center shows very high potential need areas with up to twelve input layers from three goal
areas These findings may suggest future investment at this location due to high use at the visitor center
Figure 10 PaTINA-modeled potential need areas for the Wildlife Viewing Subzone 2 segment of the Park Road
19
Wildlife Viewing Subzone 3 Milepost 66 to mile post 846 is the wildlife viewing subzone 3 segment (Figure 11) which begins east of
the Eielson Visitor Center and goes to the Wonder Lake campground Results show west of the Eielson
visitor center with the greatest concentration of very high potential need areas A majority of this
segment ranges from very low to medium potential need areas until farther west near Wonder Lake
Wonder Lake campground consists of up to ten input layers from three goal areas
Figure 11 PaTINA-modeled potential need areas for the Wildlife Viewing Subzone 3 segment of the Park Road
20
Wildlife Viewing Subzone 2b The wildlife viewing subzone 2b starts at milepost 846 to mile post 920 being the farthest west of all
road segments (Figure 12) The only very high potential need area in this segment is located east of
Kantishna Results display that the very high area has up to 12 input layers from three goal areas The
east side of this area shows high potential need suggesting that this stretch could be identified as an
area for potential future investment
Figure 12 PaTINA-modeled potential need areas for the Wildlife Viewing Subzone 2b segment of the Park Road
DISCUSSION The Park Transportation Investment Needs Analysis (PaTINA) employs standard geospatial methods that can be repeated to reflect changing management goals as well as be applied in different facility management situations and scales The web mapping application deployed with the data allows for frequent review and consultation of the results to inform management decisions
21
Execution of the methods however requires intensive data gathering and formatting Further the
weighting process is currently accomplished in a desktop GIS after subject matter experts are polled for
input weights This process could be improved with tool development in either the desktop environment
or the online web map to streamline how GIS data are included and weighted in the model While the
process in its current state is repeatable in most cases it requires a GIS specialist and a desktop GIS to
complete We foresee improving either the desktop or online tool (or both) to make the process more
accessible and rapid Depending on the data inputs however the overlaying process may still require
extensive data collection and preparation Additionally the overlaying process can be computer
intensive--again depending on the data inputs--and may be prohibitive due to available resources
The data collection process in this analysis identified data needs which are collated separately and listed
above under Goal Areas Acquisition and incorporation of these data may improve the PaTINA results
Visitor use statistics are an especially glaring omission which if obtained will improve future PaTINA
modeling
Seasonal variations in some inputs are not well represented in the analysis Further work may entail
modeling specific seasons to help inform investment strategy throughout the year
INTERNAL WEIGHTING The PaTINA applied to Denali NPampP weighted each input layer uniformly across the spatial extent of the layer However some data contained attributions that could be weighted differently Because the weights were assigned by park staff for each input layer based on the road segments further weighting based on attributes internal to a layer would unnecessarily complicate the composite scoring Future iterations of the model for Denali may consider applying layer attributes to vary weights across the layer instead of applying weights per road segment Alternatively the weights assigned by road segment could be normalized against the attribute weighting but the statistical validity of this needs to be explored
SKEWED DATA The initial run of the PaTINA model showed skewed results within the front country segment NPS staff
clarified that specific locations within the front country segment should have been identified as very
high or high potential need areas instead of low and medium rankings The main concern was around
the Denali Visitor Center and vicinity that included the railroad depot trailheads and visitor amenities
As a known high visitor use area the visitor center and surroundings should be considered a high
potential for investment The data and associated weights were examined and it was concluded that the
user experience goal area was lacking desirable input layers to validate higher rankings Once the
additional input layers were identified they were added to the next run model and results showed
important locations such as the Denali Visitor Center with higher rankings
SPATIAL SPREAD OF DATA Input layers across the goal areas differ spatially within the road segments The resource protection goal
area is the only goal area in which input layers coincide with the transportation network within all five
road segments User experience and climate change goal areas are within four segments with no data in
22
the last segment wildlife viewing subzone 4 The access goal area contains data only within the first
segment motorized sightseeing subzone Although input weights are normalized for each goal area the
spatial spread of the data influences the results where more inputs are occurring
The results show classes of potential need areas throughout the entire transportation network due to
some input layers completely overlaying it These layers are exotic species each of the mammal layer
inputs excepting sheep and permafrost Due to the spatial spread of these data every area of the
transportation network can be classified as at some level of potential need for investment
NEXT STEPS The data and web mapping interface will require maintenance as updated or new data and web
mapping tools become available We see the initial release of the web map for the Denali PaTINA as a
first step toward a more comprehensive tool to aid the park in investment decision making As noted
above stream-lining the weighting and model execution processes would improve the overall utility of
the PaTINA
Additional development of the PaTINA web map may include incorporation of other map services such
as the NPS Road Inventory Program and data services from the Inventory and Monitoring network
Conversely the base PaTINA results can be added to other web map applications that may focus on
other issues
Finally development of instructional materials and accompanying training sessions would bolster and
help maintain the utility of the PaTINA results and its application to park management
National Park Service US Department of the Interior
Denali National Park and Preserve Long-Range Transportation Plan
Appendix F Denali Funding Plan
Denali National Park and Preserve Financial Analysis Technical Report ndash FINAL DRAFT
Introduction This report discusses the transportation funding aspects of the Denali National Park and Preserversquos first Long Range Transportation Plan It includes a retrospective of transportation funding from 2006-2013 a projection of funds expected to be available for transportation during the planrsquos twenty year planning horizon and a summation of the resources necessary to return transportation facilities at Denali National Park and Preserve (Denali NPP) to ideal conditions As is true for all of the National Park Service (NPS) the amount of funding that is needed for transportation at Denali NPP exceeds the amount that will be available in coming years and so this report includes an investment strategy that funds the highest priority needs
The discussion must begin with two of the NPSrsquos guiding transportation investment principles and Denali NPPrsquos primary existing transportation document the Vehicle Management Plan (VMP) It then discusses Denali NPPrsquos place in Alaska Region transportation funding and the expected increase in funding needs due to climate change impacts The middle section of this report discusses the LRTP methodology in general and how the Denali NPP LRTP methodology differs from those used for other NPS LRTPs There is also a discussion of historical forecasted and needed transportation funding that collectively make up the baseline transportation funding report for Denali NPP
This report concludes with a discussion of the funding strategies which were evaluated for the Denali NPP LRTP and how the final strategy was selected The investment strategy prioritizes operations and maintenance the rehabilitation of the paved section of the Park Road funds the unpaved sections of the Park Road to achieve management priorities and provides approximately $1m per year to address other transportation priorities The Denali NPP transportation investment strategy is expressed with respect to each of the four LRTP planning scenarios to guide park management decisions during times when visitation is increasing or decreasing and when funding (or stakeholder support) is higher or lower than average Funding shortfalls means that the condition of all transportation assets cannot be improved but progress can be made to address the highest priorities
Funding Denali Transportation Facilities
Capital Investment Strategy and Total Cost of Facility Ownership As a best practice and formal policy the NPS incorporates strategic facility planning into its asset management decision-making processes including LRTPs Two fundamental concepts the NPS Capital Investment Strategy (CIS) and Total Cost of Facility Ownership (TCFO) underlie those best practices and are drivers of the investment planning and decision-making reflected in the Denali LRTP
The NPS Capital Investment Strategy The CIS is an NPS strategy for prioritizing project investment to ensure effective and responsible project funding The CIS includes a scoring tool that decision-makers at all levels of the NPS have available to them to inform project investments and other asset management needs
The purpose of the CIS is to help prioritize investments focus on mission-critical assets manage operations and maintenance and ensure that the greatest impact can be made with available capital and operational funds The CIS uses a scoring tool to evaluate projects on a number of different criteria Financial Sustainability Visitor Experience Resource Protection and Health amp Safety The four categories are weighted using a predefined algorithm to arrive at an overall project score Projects can then be compared by score as needed in theory the greater the score the higher the priority The scoring strategy supports an asset management approach that emphasizes maintaining key assets and reducing the estimated value of deferred maintenance cost against those key assets
Some of the key objectives in the Financial Sustainability strategy are to build only what can be maintained right-size the asset portfolio reduce liabilities reduce resource consumption to promote sustainability and eliminate non-essential development in order to emphasize the essential natural and cultural experience The Visitor Experience strategy includes investment in assets or resources that enable recreation and serve as gateways to park units contact stations and interpretive assets The Resource
DenaliLong Range Transportation PlanFinancialTechReportndashFINAL DRAFT 1
Protection strategy focuses on those historic cultural and natural resources that the NPS is tasked with protecting and preserving Such tasks supported by the CIS could include preservation repair and restoration of assets Finally the Health amp Safety strategy places an emphasis on correcting unsafe or hazardous conditions within park units that pose a threat to visitors or staff Different parts of the Denali LRTP address these four strategies which are used by fund program managers to allocate limited funding
Total Cost of Facility Ownership Applying the concept of Total Cost of Facility Ownership (TCFO) is considered by the NPS to be a vital part of a financially sustainable infrastructure strategy and practice to truly address transportation asset management1 It aligns closely with the intentions behind the CIS especially the CIS Financial Sustainability component TCFO is the full life-cycle cost of constructing maintaining and operating an asset until it needs replacement This concept recognizes that assets require investment throughout their service lives until they need replacement or disposition and that preventive maintenance and facility operations activities are key to minimizing long-term costs and optimizing the life of said assets Implementation of the TCFO concept involves a shift-away from a ldquojust fix itrdquo or ldquorun to failurerdquo mentality to more holistic planning making cost estimates and decisions that consider not just the deferred maintenance (DM) of an asset but the ongoing OampM need over its service life need for replacement and ultimately disposition
The Denali LRTP team took the concepts inherent to the CIS and TCFO and embedded them into all of its LRTP analyses and planning activities Consequently the resulting investment strategy selected by Denali NPP staff is consistent with the approaches and practices used across the NPS to develop for example the National LRTP and other unit or regional LRTPs
The Denali Park Road and the Vehicle Management Plan Denali NPP is one of the most visited National Park Service units in Alaska and the Denali Park Road is the means for the majority of visitors who wish to traverse deep into the interior by any mode motorized or otherwise For many visitors it is the most readily accessible transportation corridor for them to experience the Alaska wilderness and for some it is their only option Denali NPP is currently several years into the implementation of its VMP the culmination of an intensive planning effort to balance the needs of the parkrsquos natural resources with high visitor demand The Denali LRTP is consistent with the recommendations in the VMP
Generally the VMP recommends limiting vehicle traffic on the Denali Park Road in order to reduce traffic impacts on natural and cultural resources The VMP has a ldquotelescopingrdquo approach where visitor activity is highest and associated development is most extensive in the paved entrance area of the park and declines and lessens respectively as the Park Road heads west As shown later in the section on Funding Strategies the Denali LRTP reflects this by realigning maintenance and rehabilitation investments along the Park Road to concentrate on the areas of highest visitor activity and most extensive development
Funding Trends The Federal Lands Transportation Program in the NPS Alaska Region The Federal Lands Transportation Program (FLTP) is the single largest source of transportation funding for the National Park Service and other Federal land management agencies Project funding decisions are made at the regional level following national guidelines The FLTP at a national scale has recently been reauthorized at a higher funding level than analyzed in this plan However interim program guidance suggests that the majority of the increase will be reserved for nationally significant major projects with only a small increase to regional allocations
Denali NPP has historically been the largest recipient of FLTP funding in Alaska in part because 20 of the Regionrsquos 27 miles of paved roads are within Denali NPP The unpaved Park Road may also be funded by FLTP NPS regional staff indicate that Denali NPP has in the past received all funding from the program by default unless another NPS Alaska Region park unit has eligible needs (which is rare) at which point that project from another park unit moves to the top of the regional FLTP program This means that FLTP will likely be a sustainable funding source for major investments at Denali NPP into the future The next three years of FLTP investment at Denali will be primarily used to rehabilitate the 15 mile paved section of the Park Road from the park entrance to the Savage River checkpoint
1 For example reference ldquoMemorandum Guidance for Addressing Facilities in Planning Documentsrdquo Associate Director Park Planning Facilities and Lands
National Park Service US Department of the Interior January 4 2016
DenaliLong Range Transportation PlanFinancialTechReportndashFINALDRAFT 2
Climate Change and Geotechnical Hazards As explained elsewhere in the LRTP current research indicates climate change is dramatically affecting transportation facilities across Alaska The impacts of climate change relevant to Denali NPPrsquos transportation system include thawing permafrost unstable slopes a lengthening shoulder season and other change indicators Most of these changes will result in higher costs to operate and maintain Denali NPPrsquos transportation network which will further stress already limited funding
Monitoring and evaluation of climate change impacts is an ongoing need and a recommendation of this LRTP Tracking threats and hazards to the transportation system such as unstable slopes requires funding for specialized equipment and the technicians and scientists who collect and analyze the data Funding updates to hydrology models and monitoring permafrost thawing are other near-term relatively inexpensive data needs that can help avoid disastrous impacts over the medium to long term Denali NPP has initiated the effort but funding has not been identified for developing specific plans for how to adapt the transportation system in the park to these expected impacts
In the near term a number of susceptible areas along the Park Road will likely encounter more frequent closures due to intermittent landslides flooding or debris flows with each requiring cleanup and reopening The future impacts of one of the effects of climate change increasing precipitation in the Denali Borough region can already be previewed during excessively wet years 2016 was a particularly wet year and staff were faced with unstable slopes and more frequent and more severe debris flows Beyond the cost of cleaning up after these road closures there are short-term disaster management tasks for which Denali must be ready ndash evacuation or care of visitors staff users and inholders on the far side of an interruption
Some dedicated funding sources are available for recovery costs such as NPS Emergency Storm amp Flood Damage and FHWArsquos Emergency Relief for Federally Owned Roads (ERFO) These programs have limited budgets and will be increasingly strained in an era of continued climate change impacts not just in Denali NPP but across the National Park Service These funding sources are currently limited to recovery costs only and cannot be used for monitoring or preventive work that can anticipate and avoid a future event such as by stabilizing slopes or realigning a road
There are several segments of the Park Road and its associated bridges and structures that may become physically or financially untenable in the next few decades There may come a time when the park will need to consider decommissioning rerouting andor relocating these facilities These costs are not yet known but will likely far exceed Denalirsquos typical past annual funding and may require special major project funding US Department of Transportation (DOT) discretionary grants such as the (unfunded) Nationally Significant Federals Lands and Tribal Projects program or Transportation Investments Generating Economic Recovery (TIGER) are possible sources as is the NPS Line Item Construction program However because these needs are not yet quantified and because they are beyond the capacity of the current funding programs to address the costs of fully adapting the transportation system to climate change are not included in the Denali LRTP financial analysis
Denali LRTP Funding Baseline Financial Analysis Methodology The financial analysis methodology for the Denali LRTP is based on the data and methods first developed for the NPS National LRTP (NLRTP) A much more detailed technical summary is available for the NLRTP and generally applicable to the Denali LRTP but this section will cover the basic steps as well as deviations used to adapt it to the unit level
Historical Investments Establishing a financial baseline of the historical average annual level of regional transportation spending provides a foundation for forecasting the
Annual transportation investments at Denali likely future available funding levels which can be anticipated for Denali NPP averaged $923 M per year from 2006-
NPPrsquos transportation facilities This is important information for developing a 2013 from all funding sources combined fiscally-constrained LRTP The LRTP team analyzed all of the fund sources that had been used for transportation investments at Denali NPP from fiscal year (FY) 2006 through FY 2013 These results provide a vital context for developing the Denali LRTP investment strategy
DenaliLong Range Transportation PlanFinancialTechReportndashFINALDRAFT 3
The LRTP team estimates that approximately $775 M per year will be available to Denali NPP for transportation purposes over the next six years
The financial data was extracted from various financial and project management data tracking systems2 The LRTP team
identified historical expenditures awards and authorizations for transportation assets
adjusted those prior year dollar values to equivalent 2014 values using GDP inflation factors and
calculated an annualized average transportation funding expenditure rate for the period FY 2006 ndash FY 2013
This data was initially prepared by the National LRTP team and then reviewed by the Denali LRTP team to remove any anomalies To simplify reporting the dataset was consolidated coded and grouped by funding authorizations funding programs work types and asset types All identifiable American Recovery and Reinvestment Act (ARRA) investments a one-time extra-ordinary funding source were removed from this analysis A detailed technical methodology document is available from the NLRTP effort
Because the data only includes transportation expenditures made by the National Park Service it does not include transportation
each funding source that Denali NPP has recently used for transportation It
funding and support with an increase in visitation) or ldquoSurplus of Moneyrdquo scenario (increased funding and support with a decrease in visitation) when compared to the historical average However for the purposes of the investment strategy in this plan the funding forecast is considered to be at the center of our ldquoManagement Strategies of no Regretrdquo - those actions that make sense given a normal variation in expected support funding and visitation levels
The Denali LRTP team leveraged the approach applied in the development of the NPS National LRTP to forecast anticipated funding availability for transportation investments in the near future There were two main sources of forecasting information
The NPS budget office The Budget Office conducts forecast exercises servicewide and with individual units The Budget Office suggested the LRTP program assume a one-time reduction to Title 54 (DOI) Non-Fee program fund sources of three percent for ONPS and Cyclic Maintenance programs in the NPS National LRTP The DENA LRTP forecast was based on a combination of actual funding program investment plans where possible and the three percent cut when it wasnrsquot The three percent reduction only applied to programs for which the Denali LRTP project team did not have access to an investment plan (eg Operational Base)
Regional Funding Programs The Denali LRTP project team consulted several regional-level program plans to acquire information on planned investment levels Title 54 Non-Fee programs for Cyclic Maintenance RepairRehabilitation and Line Item Construction Title 16 54 Fee programs for Recreation Fee Transportation Fee and Concession Franchise
investments by third parties The parkrsquos partners such as the Alaska Railroad bus concessioners Denali Borough and the Alaska Department of Transportation and Public Facilities (ADOTampPF) all fund transportation work that helps visitors employees inholders and freight carriers access the park However these investments are not accounted for in this analysis because these data do not enter NPS financial data systems
Forecasted Transportation Funding This section documents the Denali NPP financial forecast for transportation based on anticipated future funding levels that can be reasonably assumed to be available The forecast of available funding provides the principal financial constraint against which future investment plans must be prioritized and represents the result of the most likely funding scenario for
does not include a forecast for work done by other parties such as the State of Alaska or Denali Borough that may benefit Denali NPP and it also doesnrsquot include any unforeseen additional funding which may result in a ldquoPopular Parkrdquo scenario (increased
Fees and the Title 23 Federal Lands Transportation Program These forecasts replaced the National LRTP-style (ie three percent reduction) forecasts for these programs as they provide more certainty than broad program-level authorizations and appropriation amounts
The elimination of the Paul S Sarbanes Transit in the Parks Program (TRIP) is another factor to note in the forecast but the only analysis needed is to not project any future grant awards from this program Denali made use of TRIP in the past but will need to seek other funding sources to fund future transit and trails projects This is also true of various grant programs formerly used by many parks but not Denali NPP such as Scenic Byways or the Public Lands Highway Discretionary Program
2 Systems used included the NPS Administrative Financial System (ie AFS Versions 3 and 4) and the joint Federal Highway Administration (FHWA)NPS Park Roads and Parkways Transportation Allocation and Tracking System aka PTATS
DenaliLong Range Transportation PlanFinancialTechReportndashFINALDRAFT 4
Unfortunately transportation funding for Denali NPP is expected to decline unless additional funding sources are found or funds are redirected from other critical areas The declining funding environment coupled with historically high visitation may result in a ldquoLosing Groundrdquo scenario (decreased funding and support with an increase in visitation) when compared with historical averages These conditions are not dissimilar from recent years (eg 2013-2015)
Transportation Investment Needs Investment needs are defined in this plan as the amount of funding required to bring transportation assets to good condition and sustain them at that level Investment needs also include costs to address programmatic needs such as code compliance structural fire and accessibility Other goal area needs such as resource protection may overlap with asset management (TCFO) needs or may be additional potentially unfunded requirements
The LRTP team estimated an annual need of $1242 M to return the Denali NPP transportation system to good condition and keep it there over six years
The Denali LRTP used a similar methodology as the National LRTP and other Regional LRTPs using needs data from the best available data system or report that covers a particular type of transportation facility and type of work However many of the reports and systems available at the regional or national level do not apply to individual parks The principal difference between the needs in the Denali LRTP is the use of automated systems The data sources used for the Denali LRTP are
Reoptimization File OampM needs for all facilities except the unpaved Park Road
2013 Alaska Region Unpaved Road Analysis (pilot) Detailed analysis for the unpaved Park Road
Facility Management Software System (FMSS) Component renewal and programmatic needs
Project Management Information System (PMIS) Capital investment needs planning naturalcultural resources
National list of megaprojects Paved Park Road repair project and replacement of the Toklat River Bridge
Differences between the needs sources such as timespans and prioritization systems were reconciled in order to create a single set of transportation facility needs for Denali NPP Park staff also reviewed the needs data and removed several projects that were already underway or would be accomplished through partners rather than by the park At $1242 M per year the estimated annual transportation investments needs exceed the annual transportation funding amount by $467 M per year
Transportation Funding for Denali NPP This section discusses the current and near future transportation funding outlook for Denali NPP It covers where funds have come from and how they have been used in terms of what type of transportation facility was funded what type of work was funded and how transportation funding is prioritized
Investments by funding source From 2006-2013 the National Park Service as a whole used more than 60 different funding program and accounts to fund transportation activities but only ten programs funded investments at Denali NPP Table 1 below shows how much each funding program provided in the past how much it is expected to provide in the future and how much would be needed from each funding program to cover Denalirsquos total transportation need each year if past investment patterns were continued
DenaliLong Range Transportation PlanFinancialTechReportndashFINALDRAFT 5
Table 1 Denali NPP Transportation Investments and Needs by Funding Source (in millions of 2013 $)
Investments by funding source
Historical Average Annual Investment
Forecasted Annual Average Investment
Estimated Annual Needs
Title 54 Non‐Fee $175 M $101 M $335 M
Cyclic Maintenance $063 M $004 M $001 M Line Item Construction $034 M $032 M $007 M Operational Base $064 M $055 M $270 M Other NPS Programs $007 M $007 M $019 M
RepairRehab $007 M $002 M $039 M
Title 54 Title 16 Fee $134 M $211 M $261 M
Concessions Franchise Fees $067 M $144 M $051 M
Recreation Fee $067 M $067 M $210 M
Title 23 $601 M $462 M $586 M
FLTP $601 M $462 M $586 M
OtherExternal $014 M $001 M $060 M
FTA TRIPATPPL $012 M ‐‐ ‐‐
Reimbursable Agreements $001 M $001 M $060 M
Grand Total $923 M $775 M $1242 M
Each of these funding programs have a different legislative authorization and project eligibility criteria Title 54 programs are those authorized by Title 54 of the US Code (National Park Service-specific programs) Title 16 includes other relevant Department of the Interior programs (ie Recreation Fee Program) Title 23 includes programs overseen by the Federal Highway Administration and the ldquoOtherExternalrdquo category includes other funding sources such as the discontinued TRIP program as well as reimbursable agreements donations partnerships and other less common sources
Investments by Facility Type
Denali NPP maintains a diverse system of transportation facilities including paved and unpaved roads bridges paved and unpaved transportation trails transit facilities developed airstrips as well as support infrastructure such as a materials (gravel) quarry Table 2 below shows historical investments forecasted investments and the estimated annual investment needs for each of the parkrsquos transportation facility types
Of all historical investments in transportation at Denali NPP in the recent past about 55 went to the Park Road and associated structures and 18 supported parkwide operations that include the Park Road Less than a third was used for separate transportation facilities such as trails and access roads Park Road funding was oriented to the unpaved segments that require frequent repair work to remain in even fair condition given the extreme conditions and heavy vehicle traffic in Denali NPP Recent investments in several difficult sections in the western end of the Park Road helped restore user comfort and safety
DenaliLong Range Transportation PlanFinancialTechReportndashFINALDRAFT 6
Table 2 Denali NPP Transportation Investments and Needs by Asset Type (in millions of 2013 dollars)
Historical Forecasted Average Annual
Average Annual
Estimated Annual
Asset Type Unpaved Roads
Road Bridges
Trails and Transit
Investment $386 M
$184 M
$147 M
Investment $235 M
$042 M
$066 M
Needs $527 M
$135 M
$137 M
Paved Roads $144 M $291 M $297 M
Other3 $051 M $053 M $066 M
Parking $011 M $089 M $081 M
Grand Total $923 M $775 M $1242 M
Historical Forecasted Average Average Estimated Annual Annual Annual
Lifecycle Stage Investment Investment Needs Planning and Administration4 $058 M $057 M
Capital Investment $134 M $259 M $130 M
Operations and Preventive Maintenance $045 M $048 M $186 M
Recurring Maintenance $142 M $083 M $374 M
Component Renewal $527 M $259 M $508 M
Grand Total $923 M $775 M $1242 M
Denali NPPrsquos greatest area of transportation investment need is in heavy repair and rehabilitation work similar to much of the rest of the National Park Service Insufficient funding often leads to smaller routine maintenance work being deferred which causes transportation facilities to fall out of a state of good repair Other significant needs at the park include annual operations and maintenance of transportation facilities and making improvements to culverts that provide for fish passage and building an aircraft hangar
Note that some categories such as capital investment show ldquosurplusesrdquo where more funds are forecasted for investment than are needed This is the result of project programming where several capital investment projects are scheduled for near-term
Investments by Asset Lifecycle stage As discussed in the section on Total Cost of Facility Ownership different types of work are needed at different points in a transportation facilityrsquos lifespan from planning through to rehabilitation or disposition Table 3 below shows historical and forecasted annual investments as well as estimated annual investment needs for each lifecycle stage for all asset types combined
Table 3 Average Annual Investments by Lifecycle Stage (in millions of 2013 dollars)
construction in 2016-2021 whereas the needs represent the average annual needs over twenty years
3 Other category includes aviation buildings that support transportation equipment and multimodal facilities Trails and Transit notably excludes investments and OampM spending made by the transit contractors who operate within Denali NPP but does include Denalirsquos own investment in bus transit facilities such as buildings lots and experimental hybrid buses 4 Routine planning and administration needs are not included in NPS facilities management data systems but can be assumed to continue at historical levels Additional unquantified planning needs are likely in the LRTPrsquos horizon including work in the parkrsquos entrance area coordination with private shuttle services and the Alaska Railroad and transportation planning to maintain park operations in the face of climate change impacts
DenaliLong Range Transportation PlanFinancialTechReportndashFINALDRAFT 7
Priority Estimated Annual Optimizer Band Equivalent Transportation Needs
Highest Priority $377 M Band 1 High Priority $584 M Band 2 Other Priority $281 M Bands 3 4 5
Programmatic Needs Some of the lifecycle stage needs are also considered programmatic needs for transportation facilities at Denali NPP Programmatic needs include work necessary to meet standards set by safety accessibility environmental and fire safety requirements It is generally analogous to code compliance work that would be the responsibility of a facilities manager or an architect hired by a private business
Figure 1 summarizes estimated programmatic needs for the Denali NPP transportation asset portfolio which total less than $300000 Transportation facilities generally have relatively small programmatic needs compared to facilities such as visitor centers housing and offices Although not broken out in the historical and forecast data these types of projects are included in the NPS Facility Management Software System (FMSS) as needs Denali NPPrsquos programmatic needs are included in the overall $1242 M per year needs as capital investment or component renewal needs They are classified as capital investment if plans are to proactively address them as individual projects or as component renewal when addressed through a rehabilitation project that focuses on a low condition rating
Figure 1 Denali NPP Transportation Programmatic Needs
Investments by Asset Priority The final classification for investments is what priority of assets they were used to build maintain or repair NPS financial and asset management systems do not support this analysis for the historical or forecast data Each future investment need at Denali NPP is associated with the priority of the asset or the project itself this is shared below in Table 4 For the purposes of this plan Highest Priority is generally defined as Optimizer Band 1 High Priority is defined as Optimizer Band 2 Optimizer bands 3-5 are defined as ldquoother priorityrdquo Although they are not banded as such critical Park Road work is labeled as Highest Priority consistent with the priorities discussed during the investment strategy section later in this report
Table 4 Estimated Annual Needs by Priority
Denali NPP differs from other National Parks and the NPS as a whole due to the relatively low proportion of the total need in the highest
DenaliLongRangeTransportation PlanFinancialTechReportndashFINALDRAFT 8
priority need category Many transportation facilities in Denali NPP have been categorized in optimizer bands 2-5 This reflects the values laid out in Denali NPPrsquos Foundation Statement that place a high priority on investment in resource protection science and other portfolio areas ahead of transportation and broader visitor use needs As a result the park is able to cover its entire highest priority transportation needs given current funding In fact the $775 M per year in forecasted funding is enough to cover 80 of the highest and high priority transportation needs combined However there are still high priority transportation needs that will remain unmet unless additional funding is found and longer-term and lower-priority needs that cannot be met with forecasted funding
Investment Strategies The final step of the financial planning process for NPS LRTP development is the formulation of an investment strategy It is a synthesis of the planrsquos goals and objectives already formulated projects and other transportation-related needs and the reality of the constraints that exist in the current funding environment This section of the report describes the process used by the Denali LRTP team to identify several potential investment strategies including the strategy selected by Denali NPP staff for the Denali LRTP It also discusses potential alternatives which park management may consider if future funding or visitation deviates significantly from the forecast referencing the planning scenarios used in the development of the Denali LRTP
Methodology The key to understanding the funding strategy process is that funding in a constrained environment is a zero-sum game All investment strategies make use of the same $78 M annual funding amount that is forecasted for the near future Because transportation needs exceed this amount and because moving funds from other purposes deprives those projects of needed funding all investment strategies shift funds from one set of priorities to another The OampM strategy option shown in Table 5 for example focuses on staying current on annual operations and preventive maintenance work at the expense of larger repair projects
Unlike the plans for the National Capital Southeast Midwest Regions and the NPS as a whole the Denali LRTP used a single modeling tool to model the results of the different funding strategies on the Denali NPP transportation system A deferred maintenance (DM) FMSS-based tool was modified by a contractor (Booz Alan Hamilton) to work at the unit level and take into account park specific facilities such as the unpaved Park Road This tool uses extracts from FMSS to estimate Facility Condition Index (FCI) and DM outcomes given a known annual funding level The FCI outcomes reported for this effort are lsquoAdjusted FCIrsquo which includes programmatic needs and an anticipated 35 cost markup in addition to the ldquorawrdquo DM normally used in calculation of the FCI
Strategy Development Process
Methodology and Initial Strategy Concepts The team held several workshops and follow-up discussions with NPS stakeholders and partners to identify candidate strategies and to select the Denali NPP LRTP Investment Strategy (p 12) Internal NPS stakeholders included Denali NPP staff Alaska Region staff and the Washington Support Office (WASO) Partner input included expertise from FHWA Western Federal Lands Highway Division and US DOT Volpe Center staff familiar with the NPS LRTP financial planning process
The team worked with stakeholders to identify potential candidate strategies in light of CIS and TCFO policies best practices and past investment patterns (see Table 2 and Table 3) The initial investments strategies are shown in Table 5 below and were based on trends discussed by the project team early on in the Denali LRTP
DenaliLong Range Transportation PlanFinancialTechReportndashFINALDRAFT 9
The reaction to the strategies from park staff indicated high interest in the OampM strategy ndash if the park is able to at least stem the growth in deferred maintenance using its typical transportation funding sources then the park can later seek out additional funds to rehabilitate facilities that are no longer in a state of good repair The specificity of the three strategies that make different kinds of improvements was eliminated in favor of a general ldquomake improvementsrdquo strategy since transit and trails enhanced ITS and safety and emergency response are all priorities at the park that vary from year to year Finally Denali NPP staff noted that given its current condition the unpaved section of the Denali Park Road could still be one of the best unpaved roads in Alaska even with a reduction in maintenance levels so exploring redirecting some funding from the Park Road to other facilities in the park might be
Table 5 Initial Investment Strategy Concepts
Investment Strategy Option
Invests inhellip At the expense ofhellip
Business as usual Highest priority assets Lower priority assets
OampM emphasis Fund 100 of annual OampM needs for all assets Capital investments and rehabilitation
Transit and trails $1 M for existing transit and trails before other investments $1 M for roads and parking
Make improvements $1 M per year for new assetsservices (eg employee transit real-time bus trackers new trails)
$1 M less for annual OampM and rehabilitation
Safety and programmatic needs
Programmatic and safety needs before everything else (eg accessibility slope stability)
$1 M less for annual OampM rehabilitation
a viable option Various sections of the Park Road meet different condition criteria from good to fair to poor
Refined Investment Strategies No one strategy rose above others as a preferred strategy in the first round of modeling but the number of strategies was narrowed to two Both strategies funded all operations and maintenance needs and ensure that planned projects such as the paved Denali Park Road rehabilitation are completed but one option set aside $1 M per year for improvements or new facilities Table 6 below shows the tradeoffs of the two refined general strategies
Table 6 Refined Investment Strategies
Strategy Invests inhellip At the expense ofhellip
Cover all OampM complete planned projects
OampM and critical near-term repair needs
Making improvements
Cover all OampM complete planned projects and reserve $1Myr for improvements
OampM critical near-term repair needs and improving transportation at Denali
Buying down deferred maintenance
Unpaved Denali Park Road Analysis In addition to these two strategies Denali NPP staff also wanted to test whether transportation funds allocated to the unpaved Park Road in a business as usual approach could be shifted to other purposes The LRTP team as well as staff from Denali NPP and the Alaska Region developed five different options for unpaved road condition targets that could be modeled to estimate costs of different sets of conditions Table 7 below summarizes these five sets of condition targets Each of the two general strategies were tested using the five sets of condition targets for a total of ten investment strategy and condition results The strategies in Table 7 highlighted in red were not achievable give projected funding levels and established higher priorities
DenaliLong Range Transportation PlanFinancialTechReportndashFINALDRAFT 10
Table 7 Unpaved Park Road Conditions
Strategy Goals Annual Cost
Plan A Maintain all Park Road segments in good condition $43 M
Plan B Maintain all Park Road segments in fair condition $37 M
Plan C Set Park Road conditions from segment to segment recognizing that some segments are costlier to maintain in good condition than others
$29 M
Plan D Follow the VMPrsquos ldquotelescopingrdquo approach by keeping conditions good in the first part of the road fair in the middle part and poor at the western end
$25 M
Plan E Follow the VMPrsquos ldquotelescopingrdquo approach by keeping conditions good to fair in the first to middle parts of the road and poor at the western end
$27 M
Plan F VMP ldquotelescopingrdquo approach as in Plan E but with further lowered condition targets for two of the most expensive areas - MP 43-47 and MP 88-92
$20 M
Refined Strategy Results
general strategy was discarded Even without reserving $1 M per year projected funding is insufficient to meet the good to fair
Unlike the initial strategies several of the refined strategies were not viable None of the condition targets on the unpaved Park Road could be met if Denali NPP was to reserve $1 M per year for making improvements elsewhere on the park and so that
conditions proposed under plans A and B for the unpaved park road without scaling back commitments to OampM planned repaving of the paved sections of the Park Road and the rest of Denali NPPrsquos transportation facilities Additional funding could make Plans A and B possible ndash about $13 M per year more would allow for Plan A to be achieved and $07 M more per year would allow plan B to be achieved
Plans C D E and F are viable given currently constrained funding levels Plan C shows that it is possible to meet all of the investment strategyrsquos commitments and still maintain the unpaved Park Road on a segment-by-segment basis The conditions explored in Plan C take the relative expensive of each segment into account and the most difficult segments are allowed to remain in fair to poor condition However modeling showed that meeting these conditions would provide almost no funding for other transportation priorities
Plan D applies the Vehicle Management Planrsquos ldquotelescopingrdquo approach to the maintenance of the unpaved Denali Park Road and targets mid-poor condition for the farthest west segments which are intended to be more rustic and less traveled but keeps the middle and eastern segments in fair to good condition Under this plan nearly $05 M per year would be available for other transportation priorities Plan E made slight changes to keep more of the road in good condition instead of fair
Plan F was ultimately selected as the condition target for the Denali NPP LRTP This option retains the approach of Plan E but reduces condition targets for two sections which are particularly challenging and expensive to maintain Under plan F Polychrome Pass would be improved slightly (but still be in poor condition) while the final stretch of the park road would be allowed to decline to poor condition These two changes free about $06 M per year for use elsewhere on the road and in Denali NPP More information about these two segments is provided in Appendix A at the end of this technical report
Denali LRTP Investment Strategy The refined strategy results narrowed down the policy options for the unpaved Park Road and led to the selection of the Denali LRTP Investment Strategy as the best fiscally-constrained option for meeting the goals and objectives of the plan This strategy
DenaliLong Range Transportation PlanFinancialTechReportndashFINALDRAFT 11
would invest Denalirsquos forecasted $775 M per year in four categories as shown below in Table 8 and Error Reference source not found below
Table 8 Denali NPP LRTP Investment Strategy
Category Estimated share Estimated annual Percentage of of annual funds investment needs met
Operations and Preventive 37 $29 M 100 of needs Maintenance (all met transportation assets)
Rehabilitate Paved Portion of 24 $19 M 100 of needs the Denali Park Road met
Repair and Maintain the 26 $ 20 M 46 of needs met Unpaved Portion of the Denali Park Road
Repair and Improve Other 13 $ 10 M 24 of needs met High-Priority Transportation Assets
Totals 100 $ 78 M 63 of all needs met
The Denali LRTP Investment Strategy strikes a balance between several different priorities for transportation at the park and lies within the ldquoManagement Actions of No Regretrdquo area of the Denali LRTP scenario chart The strategy proposes to fully fund OampM needs in order to slow the decline of facilities and ensure a better visitor experience It continues planned investments on the paved section of the Park Road to achieve a good condition rating and continues to make funding available to address deferred maintenance on the unpaved sections of the Park Road However the strategy sets lower condition targets for sections of the unpaved Park Road which are further into the park and which are less traveled by visitors in order to reserve funding for other segments of the Park Road and for entrance area transportation facilities (eg aviation parking areas new priorities) This approach is consistent with the Vehicle Management Plan which envisions lower traffic volumes and a more rustic experience the further the road extends from the park entrance area
Ultimately because funding needs exceed available resources the condition of transportation facilities at Denali NPP is expected to decline overall FCI ratings across the Denali NPP transportation system today are modeled at 0148 or the low end of fair condition Continued scarce funding for transportation will reduce conditions to 0185 by 20215 However higher priority transportation facilities are expected to remain in fair condition overall as described by the Investment Strategy
5 FCIratings are modeled on a 0‐1 scalewhere0000isperfect conditionand1000iscompletelydegradedcondition
DenaliLong Range Transportation PlanFinancialTechReportndashFINALDRAFT 12
DenaliLRTPInvestment Strategy 13
37
26
24
OperationsandPreventiveMaintenance(all transportationassets)
RehabilitatePavedPortionoftheDenaliParkRoad
RepairandMaintaintheUnpavedPortion ofthe Denali Park Road
RepairandImproveOtherHigh‐PriorityTransportationAssets
The funding forecast in the Denali LRTP is only the most likely scenario for each program and in reality the amount of annual transportation funding will vary as will visitation Table 9Error Reference source not found below shares some management actions for when funding and visitation levels take Denali NPP out of the area of management actions of no regret Generally when visitation is lower it is a better time for disruptive work such as addressing major needs and accomplishing maintenance projects that were deferred Times of high visitation call for more investment in OampM and investment in new services to meet emerging visitor needs When funding prospects are good then more money is available to make improvements catch up on deferred maintenance and prepare plans for the future When funding is short then many necessary improvements have to be delayed and park staff can only fund core operations and critical repair work
Figure 2 Denali LRTP Investment Strategy
Denali Investment Strategy and LRTP Scenarios All of the funding strategies considered for the Denali NPP LRTP assumed the same funding forecast and would fall within the ldquoManagement Actions of No Regretrdquo area on the scenario planning graphic reproduced in Error Reference source not found below This area represents a balance between times of high and low visitation and high and low funding for the park It is calibrated based on an average of funding and visitation over time Years within one standard deviation of these means lie within it if they are more than one standard deviation away from the average then they are said to be in one of the four ldquoquadrantsrdquo
DenaliLong Range Transportation PlanFinancialTechReportndashFINALDRAFT
Figure 3 Denali LRTP Scenarios
13
Table 9 Potential Management Actions by Scenario
Losing Ground Popular Park
Emphasize more of Funding OampM Introducing new services
Emphasize less of Making improvements Funding deferred maintenance Initiating major capitalrehabilitation projects
Emphasize more of Funding OampM Making improvements Introducing new services Planning for future needs
Emphasize less of Funding deferred maintenance Initiating major capitalrehabilitation project
Turn out the lights Surplus of Money
Emphasize more of Funding deferred maintenance
Emphasize less of Funding OampM Making improvements Introducing new services
Emphasize more of Making improvements Funding deferred maintenance Initiating major capitalrehabilitation projects Planning for future needs
Emphasize less of Funding OampM Introducing new services
14DenaliLong Range Transportation PlanFinancialTechReportndashFINALDRAFT
Appendix A Unpaved Park Road Condition Targets
Unpaved Denali Park Road Condition Targets Plans C D and E for the unpaved Denali Park Road examined options for managing each segment of the road to an individually set condition target Each of these targets is based on the overall Vehicle Management Plan and accounts for past challenges or known issues with individual segments Plan F was ultimately selected for its ability to maintain acceptable condition levels while also freeing up funding for other transportation needs In particular Plan F was selected because the condition targets reflect the overall management approach to the road where the western-most sections are desired to be more rustic and remote-feeling and the eastern-most sections are in better conditions to handle more intensive use Tables 10 and 11 below summarizes the conditions for the unpaved segments of the Denali Park Road under the Denali LRTP investment strategy
Conditions are measured in FCI where a higher value represents worse condition and a lower value represents better condition FCI data for the unpaved Park Road is based on estimates by staff responsible for maintaining the unpaved Park Road after the 2016 opening
Table 10 Conditions of Unpaved Segments of Denali Park Road Reflected in Denali LRTP Investment Strategy
Mileposts Segment Name Current Condition
Target Condition
Change in Condition
MP 15 to 32 Savage to Teklanika Bridge Low‐good High‐fair Small decline MP 32 to 39 Igloo Forest to Sable Pass Mid‐fair High‐fair Small improvement MP 39 to 43 Sable Pass to East Fork Bridge Mid‐fair High‐fair Small improvement MP 43 to 47 Polychrome to Plains of Murie Mid‐poor High‐poor Small improvement MP 47 to 62 Plains of Murie to Stony Overlook Mid‐fair Low‐fair Small decline MP 62 to 66 Stony Overlook to Eielson Low‐fair Low‐fair No change MP 66 to 70 Eielson to Grassy Pass High‐poor Mid‐poor Small decline MP 70 to 88 Grassy Pass to Boundary Pit Mid‐fair Mid‐poor Moderate decline MP 88 to 92 Boundary Pit to Kantishna Very‐poor Low‐poor No change
DenaliLong Range Transportation PlanFinancialTechReportndashFINALDRAFT 15
Table 11 Denali Unpaved Park Road Segments ‐‐Current Conditions and Strategy Conditions Explored During LRTP Development
Plan A Plan B Plan C
Plan A Plan B Plan B Plan C Current Desired Plan A Strategy Annual Strategy Plan C
Mileposts Segment Name Conditions Conditions Annual Needs Conditions Needs Conditions Annual Needs
MP 15 to 32 Savage to Teklanika Bridge 009 0109 $ 013 M 013 $ lt01 M 0109 $ 013 M
MP 32 to 39 Igloo Forest to Sable Pass 013 0109 $ 014 M 012 $ 011 M 0129 $ 093 M
MP 39 to 43 Sable Pass to East Fork Bridge 013 0109 $ 0 24 M 013 $ 020 M 0139 $ 019 M
MP 43 to 47 Polychrome to Plains of Murie 035 0109 $ 120 M 014 $ 110 M 0245 $ 074 M
MP 47 to 62 Plains of Murie to Stony Overlook 013 0109 $ 070 M 013 $ 056 M 0139 $ 052 M
MP 62 to 66 Stony Overlook to Eielson 014 0109 $ 025 M 014 $ 020 M 0139 $ 0 20 M
MP 66 to 70 Eielson to Grassy Pass 017 0109 $ 044 M 014 $ 037 M 0169 $ 030 M
MP 70 to 88 Grassy Pass to Boundary Pit 012 0109 $ 056 M 012 $ 051 M 0169 $ 0 32 M
MP 88 to 92 Boundary Pit to Kantishna 0499 0109 $ 072 M 014 $ 068 M 0324 $ 043 M
Total MP 15 to 92 Total Total $ 435 M Total $ 376 M Total $ 293 M
Plan D Plan E Plan F (Selected)
Plan D Plan E Plan E Plan F Current Strategy Plan D Strategy Annual Strategy Plan F Annual
Mileposts Segment Name Conditions Conditions Annual Needs Conditions Needs Conditions Needs
MP 15 to 32 Savage to Teklanika Bridge 009 0109 $ 013 M 0109 $ 013 M 109 $ 013 M
MP 32 to 39 Igloo Forest to Sable Pass 013 0109 $ 014 M 0109 $ 014 M 109 $ 014 M
MP 39 to 43 Sable Pass to East Fork Bridge 013 0109 $ 024 M 0109 $ 024 M 109 $ 024 M
MP 43 to 47 Polychrome to Plains of Murie 035 0149 $ 11 M 0149 $ 11 M 245 $ 074 M
MP 47 to 62 Plains of Murie to Stony Overlook 013 0149 $ 047 M 0149 $ 047 M 149 $ 047 M
MP 62 to 66 Stony Overlook to Eielson 014 0149 $ 018 M 0149 $ 018 M 149 $ 018 M
MP 66 to 70 Eielson to Grassy Pass 017 0325 $ - 0325 $ - 325 $ -
MP 70 to 88 Grassy Pass to Boundary Pit 012 0325 $ - 0325 $ - 325 $ -
MP 88 to 92 Boundary Pit to Kantishna 0499 0325 $ 043 M 0325 $ 043 M 449 $ 012 M
Total MP 15 to 92 Total Total $ 266 M Total $ 266 M Total $203 M
Plan F Unpaved Road Segments The final change that the LRTP team made while discussing the road strategies with park staff was to lower the condition targets for two of the most difficult segments along the unpaved Park Road This section describes these two segments and how accepting a lower condition in these areas can allow for better conditions on other parts of the Denali NPP transportation system
Mileposts 43 to 47 Polychrome Pass to the Plains of Murie The unpaved Denali Park Road segment of Polychrome Pass to the Plains of Murie has been identified by Denali NPP staff as especially difficult to maintain and repair It is facing significant geotechnical hazards that will worsen as time goes on and climate
DenaliLong Range Transportation PlanFinancialTechReportndashFINALDRAFT 16
change accelerates permafrost thaw Making improvements to this section that would take it from the middle of the poor condition band to the low end of fair condition band as explored in Plan D is projected to cost $107 M per year Making lesser improvements from the middle of the poor condition band to the high end of the poor condition band as called for in Plan C would cost $074 M per year instead saving $033 M per year for other uses Thus the selected strategy (Plan F) will target a condition rating at the high end of the poor band instead of a fair rating as with other segments in the central segment of the unpaved Denali Park Road (Igloo Forest to Eielson Visitor Center) This is not an ideal or desired condition for this segment but reflects the challenges of working in this area given limited funding
Mileposts 88 to 92 Boundary Pit to Kantishna The final segment of the unpaved Denali Park Road is currently at the very low end of poor condition and is bordering on severe condition All of the alternative unpaved road plans propose to improve this section However improving the condition from the low end of poor condition to the middle of poor condition as explored in plans C and D is projected to cost $043 M per year Investing this much in one of the least-utilized segments of the Denali Park Road would limit funds for critical investments elsewhere As a result the Denali Investment Strategy proposes lesser improvements at a cost of $012 M per year
DenaliLong Range Transportation PlanFinancialTechReportndashFINALDRAFT 17
National Park Service US Department of the Interior
Denali National Park and Preserve Long-Range Transportation Plan
Appendix G Project Selection Checklist
DENA LRTPProjectSelectionCriteriaChecklist Project Name
PMIS Funding Source(s)
1 Long Range Transportation Plan ndash the project generally adheres to the following
National Long Range Transportation Planrsquos Goals and Objectives (see Attachment A)
Asset Management Transportation Finance Resource Protection
Visitor Experience Safety
Alaska Regional Long Range Transportation Planrsquos Goals and Objectives (see Attachment B)
System Management Mobility User Experience
Resource Protection Climate Change
Denali NPP Long Rang Transportation Planrsquos ldquoactions of no regretrdquo (see Attachment C)
Goal Area ____________________________ Action of No Regret __________
2 Financial Strategy ndash the project meets the following
Capital Investment Strategy score ______________
optimizer band 1 2 3 4 5
Consistent asset investment based on scenario quadrant position (Attachment D)
Consistent with proportionate investment within road management zones (Attachment D)
Milepost or Road Segment ______________________
Consistent with one or more of the following
Operations and Maintenance (OampM)
Rehabilitated Paved Road
Repair amp Maintain the Unpaved Road
Repair amp Improve Other High‐Priority Transportation Assets (bridges transportationmultimodal trail)
3 Risk Priority
Response to current high priority risks based on documented assessment (Attachment E)
Unstable Slopes
River and Stream Flooding
1
Permafrost Subsidence
Culverts ndash Operations and Maintenance (OampM)
Gravel Production Processing or Purchase
Relevance or proximity to mapped hot spot (see Attachment F)
‐ Attachment F should have all the hot spots for Park Road on a map Is this in DNPP LRTP Or do we
give them a link for online info
4 Operations and Maintenance
Investment Type ndash this project is a
New Investment ‐ offset in the cost of OampM
(presumed increase has been addressed by ____________________________________________________)
Replaced investment ‐ offset in the cost of OampM
(presumed decrease or net zero increase has been addressed by ___________________________________)
Eliminated Investment ndash offset in the cost of OampM
(presumed decrease has been addressed by ____________________________________________________)
2
National Park Service US Department of the Interior
Denali National Park and Preserve Long-Range Transportation Plan
Appendix H Public Comment Summary
Public Comment Summary Denali National Park and Preserve Long-Range Transportation Plan
Public comments are organized into two categories common and specific Common comments are
paraphrased themes that appear in multiple comment submissions Responses to common comments
are summarized in Table 1 Specific comments request a particular change When specific comments
seek changes that are accurate reasonable feasible and logically consistent they were made and
included in the final document Other comments include general statements about the quality of the
document suggestions for future plans or ideas for coordination next steps management strategies
park priorities or projects These comments are valued and are available to inform other park planning
efforts and will be referenced during the leadup to this planrsquos eventual update
Table 1 Common Comment
Paraphrased Comment Comment Response
1 Winter or offseason travel is not sufficiently represented in the plan
During the development of this plan numerous issues and needs surfaced as topics that warrant further study and consideration Public comments were an especially meaningful source for identifying topics in need of additional attention These findings will be used to inform the development of the planrsquos update as well as other plans such as the Winter Recreation Plan
2 There is insufficient data or information regarding specific transportation related conditions (eg trail crowding locations of specific facilities rest stop vehicle counts large vehicle counts winter routes locations etc)
The plan relied on facts data and concepts cited in existing park plans studies and other reports No additional data collection or data analysis was conducted as part of this planrsquos development process As such present day conditions or terminology may differ from those described in the plan Gaps in data and understanding will be reassessed in this planrsquos update
3 The plan does not map specific transportation use access facilities for the entirety of the planrsquos 20-year horizon
As a high-level strategic document the plan is not intended to identify specific short-term or long-term project needs or changes park access locations
1
Paraphrased Comment Comment Response
4 If a specific need is not mentioned in the plan (eg backcountry landing strip location) it means that the specific need will be precluded from future project selection and funding
The plan is a high-level strategy document and is not intended to identify and prioritize specific projects While the plan sets high-level goals that are used to evaluate the merits of future projects it is not a project list Whether or not a specific project idea is listed in this plan has no bearing on its ability to be developed or its funding merits
5 The plan does not describe specific actions that the park will take to address a very specific issue (eg plans to address the safety of backcountry landings strips in light of climate change cycling guidelines commercial use authorization for guided hikes off Park Road new parking lot locations more tours etc)
During the development of this plan numerous issues and needs surfaced as topics that warrant further study and consideration Public comments were an especially meaningful source for identifying topics in need of additional attention These findings will be used to inform the development of the planrsquos update
6 Data facts or terminology used in the plan appear to be out dated
The plan relied on facts data and concepts cited in existing park plans studies and other reports No additional data collection was conducted as part of this planrsquos development process As such present day conditions or terminology may differ from those described in the plan
7 The plan does not sufficiently outline specific actions to maintain and improve the parkrsquos soundscape
During the development of this plan numerous issues and needs surfaced as topics that warrant further study and consideration Public comments were an especially meaningful source for identifying topics in need of additional attention These findings will be used to inform the development of the planrsquos update
8 The plan does not go far enough in offering solutions that address threats to park access created by climate change and natural disasters
During the development of this plan numerous issues and needs surfaced as topics that warrant further study and consideration Public comments were an especially meaningful source for identifying topics in need of additional attention These findings will be used to inform the development of the planrsquos update
9 The plan does not go far enough to protect resources
During the development of this plan numerous issues and needs surfaced as topics that warrant further study and consideration Public comments were an especially meaningful source for identifying topics in need of additional attention These findings will be used to inform the development of the planrsquos update
2
Paraphrased Comment Comment Response
10 The plan does not go far enough to protect access
During the development of this plan numerous issues and needs surfaced as topics that warrant further study and consideration Public comments were an especially meaningful source for identifying topics in need of additional attention These findings will be used to inform the development of the planrsquos update
11 Goal andor objective indicators or performance measures are too limited
The plan relied on readily available data and findings cited in existing park plans studies and other reports No additional indicator data was collected as part of this planrsquos development The need for additional data for informing additional indicators will be considered for the planrsquos update
12 Specific details from the Vehicle Management Plan are not reflected in this plan
The long range transportation plan does not supersede the Vehicle Management Plan in any way Omission of Vehicle Management Plan data indicators and conclusions does not negate their significance in how the park is managed
3
- Appendix A - Literature Review Summary Report (1)
- Appendix B - Denali Long-Range Transportation Planning and Acoustic Resources (2)
- Appendix C - Denali Park Road Risk Assessment Utilizing the Unstable Slope Management Program (1)
- Appendix D - Current and Future Partner Projects (3)
- Appendix E - Park Transportation Investment Needs Analysis (1)
-
- Structure Bookmarks
-
- Denali National Park and PreserveLong-Range Transportation Plan
- Appendix EPark Transportation Investment Needs Analysis
- ABSTRACT
- INTRODUCTION
- PATINA DESIGN
- OVERVIEW
- VEHICLE MANAGEMENT PLAN
- VECTOR ANALYSIS
- DATA COLLECTION
- TRANSPORTATION NETWORK
- ASSET METRICS
- HIGH RISK
- INVESTMENT RANKING
- GOAL AREAS
- METHODOLOGY
- DATA PREP
- LAYER WEIGHTING
- COMPOSITE ANALYSIS STEPS
- SELECTED RESULTS
- OUTPUTS
- ROAD SEGMENT FINDINGS
- Motorized Paved Zone
- Wildlife Viewing Subzone 1
- Wildlife Viewing Subzone 2a
- Wildlife Viewing Subzone 3
- Wildlife Viewing Subzone 2b
- DISCUSSION
- INTERNAL WEIGHTING
- SKEWED DATA
- SPATIAL SPREAD OF DATA
- NEXT STEPS
-
- Appendix F _ Denali Funding Plan
- Appendix G - Project Selection Checklist
- Appendix H - Comment Responses (1)
-

Denali National Park and Preserve Long Range Transportation Plan Existing Conditions Report
February 27 2015
Natural Resources Objective Understand mitigate and protect wildlife and the physical environment
from adverse transportation system effects
Preservation of natural resources is a top priority for Denali NPampP Condition
Therefore management of visitor access is paramount in the Denali NPampP is home to
discussion of resource protection especially as it relates to populations of wolf caribou Dall
transportation In order to provide a natural environment that sheep grizzly bear moose and
includes largely intact ecosystems for the enjoyment of visitors the some of the most pristine
Park manages daily traffic along Denali Park Road as well as how it wilderness in the NPS system
provides access to backcountry travelers This objective is Environmental protection is the
promoted by continuance of the ldquono formal trails in the backcountryrdquo top priority of Denali NPampP in
policy (General Management Plan 2008) and new vehicle terms of appropriate and
management strategies as discussed in the VMP (2012) effective access and therefore
improvements to the There is increased awareness of the importance of monitoring transportation system are wildlife interactions with vehicles along Denali Park Road Indirect subject to strict environmental disturbances to wilderness include noise from motorized vehicles considerations including overflights fugitive dust obstructed viewsheds social
trails trampled vegetation near transportation hubs and increased signs of disturbance near
transportation hubs
Park staff also coordinate with land managers at other potential Denali NPampP access points specifically
addressing interest in development at the existing Stampede Road In the 2008 General Management
Plan Denali NPampP has noted considerations for wolf moose and caribou habitat in this area
Opportunities for new multimodal access to the south of the Park are also documented but no specific
resource considerations were documented in this area
The 2012 NPS Alaska Region LRTP made coordination with neighboring land and transportation
managers a regional objective for all units in the state The Alaska Federal Lands LRTP established an
ongoing transportation project coordination working group to address such concerns at a regional scale
There is no similar working group for Denali NPampP specific coordination
Cultural Resources Objective Mitigate negative impacts and provide appropriate access to cultural
resources
An inventory of historic properties was developed in 1983 and Condition again in 2000 These studies have led to ongoing protection of Historic sites are well cultural resources within the Park this is a specific objective
documented within Denali outlined in the 2012 VMP to protect and promote historic character
NPampP Denali Park Road itself is
considered an important cultural Several transportation related assets within the Park are
asset considered to be cultural resources The park headquarters district
and dog kennels have been added to the National Register along
with the Denali Park Road
The 2012 NPS Alaska Region LRTP cites the construction of new airstrips for backcountry access as a
threat to cultural resources These threats are of particular concern for cultural resources not only due to
the physical presence of the airstrips but because of the associated soundscape implications that
4
-
Denali National Park and Preserve Long Range Transportation Plan Existing Conditions Report
February 27 2015
additional air traffic may have With increasing popularity of Denali NPampP and limited vehicular access
aircraft facilities are key for accessing the backcountry now and in the future
Subsistence Resources Objective Consider impacts and access to subsistence resources in
transportation planning and policy development
Because subsistence access is authorized by Title VIII of ANILCA Condition most plans refer to the provisions set forth in the implementing Subsistence access is allowed regulations at 36 CFR 13460 Motorboat and snow machine under ANILCA Access rights for access is allowed for traditional subsistence activities in the ldquoOld traditional uses include Parkrdquo and off-road vehicle use is allowed on 5 trails near Cantwell traditional and modern (General Management Plan 2008) ANICLA does not supersede transportation modes the original legislation to create Mt McKinley National Park though Transportation impacts of these it adds authorization for private and commercial air travel through activities are not well permits and concessioner contracts documented
In the Old Park snowmobiling was officially closed to all users in the late 90s and early 2000s The Old
Park was also closed to hunting previous to the passage of ANILCA Planes are allowed in the Old
Park but only non-commercial as it is traditional and customary to pre-ANILCA
Transportation impacts of subsistence activities are not well documented but most plans refer to these
activities taking place
32 Climate Change Goal
Plan for climate change impacts to and from the Parkrsquos transportation system through science
adaptation mitigation and communication
Science Objective Initiate support and participate in scientific research and assessments needed to
understand and respond to relationship between transportation and climate change in Alaska
At this time participation in climate change science still only exists Condition
at the Alaska Region level in terms of climate action plans and Participation in climate change
regional LRTPs Regional plans include goals and objectives for science is mainly conducted at
addressing climate change science These include funding climate the regional NPS level
change research through the Transportation Research Board However regional support for
establishing partnerships to test green technologies and regional these activities has recently led
support for the Climate Friendly Parks certification The Alaska to support for unit level studies
Federal Lands LRTP also sets an objective of participating in at
least one climate change effort per year with documented results If
successful this could increase the amount of information available to Denali NPampP managers
The Alaska Region system has undergone studies to assess climate change scenarios at the unit level
These efforts may also lead to more unit-level planning for transportation assets that include climate
change considerations
5
Denali National Park and Preserve Long Range Transportation Plan Existing Conditions Report
February 27 2015
Adaptation Objective Manage transportation assets and conduct transportation planning for climate
change
Regional transportation planning objectives call for transportation Condition
system adaptation with regard to climate change Specific long-Currently there is limited
term climate change adaptation needs include identifying and transportation planning
prioritizing risk to NPS-owned and non-NPS owned transportation documentation in regards to
assets and systems likely to be affected by climate change and climate change adaptation
determine what management actions are needed and developing Regional planning objectives
adaptive management into LRTP updates as a means of assessing call for increased hazard risk
situations designing implementing monitoring evaluating and assessments for strategic
adjusting management decisions to account for climate change decision making
There is limited language addressing climate change adaptation in
plans specific to Denali NPampP
Mitigation Objective Reduce Denali National Park and Preserversquos carbon footprint by reducing
transportation related greenhouse gas emissions from Park operations and visitation
Denali NPampP is in the process of achieving a Climate Friendly Park Condition
(CFP) certification1 This program established by the NPS sets Denali NPampP is in the process of
performance standards for sustainability in support of NPS goals becoming CFP certified Climate
for reducing greenhouse gas emissions through energy change mitigation activities
conservation and reduction in energy use recycling composting include reduction in energy use
technology upgrades and other actions The NPS Alaska Region and encouraging Park
has a goal of becoming a climate friendly region by 2030 which employees to carpool by
targets expanding regional participation in the Climate Friendly providing carpool vehicles
Parks program and increasing climate related data collection
Some specific climate change mitigation activities underway in Denali NPampP include the availability of an
employee carpool fleet and the use of local gravel sources to minimize maintenance vehicle miles
traveled as well as reduction of idling vehicles during transit operation and winter plowing operations
Future opportunities to reduce its carbon footprint may include upgrades to more fuel efficient transit
vehicles should suitable vehicles become available someday
Communication Objective Share the compelling story of climate change impacts in Alaska and Denali
National Park and Preserve to the public as it relates to transportation
1 The CFP program is one component of the National Park Service Green Parks Plan an integrated approach by the NPS to address climate change through implementing sustainable practices in our operations This effort is an integral part of the larger NPS Climate Change Response Strategy For more information on Climate Friendly Parks certification visit httpwwwnpsgovclimatefriendlyparks
6
Denali National Park and Preserve Long Range Transportation Plan Existing Conditions Report
February 27 2015
At this time there is no formal region-wide communication program Condition to describe the relationship between transportation and climate
Although there is no formal change At the park scale there are interpretive programs within
guideline at the regional level for Denali NPampP to explain the impacts of climate change on the
communicating climate change landscape Because Denali NPampP extensively utilizes transit impacts Denali NPampP has some services to enhance visitor experience opportunities exist to show programs to communicate air quality and other benefits of transit service as compared to
climate change impacts to its personal vehicle use
visitors
Regionally there are efforts underway to communicate with both
external partners and internal staff members about the successes and failures concerning
environmentally sustainable transportation practices and to develop and fund educational materials for
internal and external audiences
33 User Experience Goal
Proactively enhance the Denali National Park and Preserve experience
User Data Objective Collect analyze and use transportation and user information to enhance Park
experiences into the future
Most of the documents reviewed for this baseline conditions report Condition rely on user information to determine a condition or characteristic Denali NPampP collects analyzes Within Denali NPampP there is increased interest in collecting user and uses transportation and information because it informs a more proactive approach to user information to enhance transportation system performance visitor experience and natural Park experiences The Park also resource impacts User data is collected through different methods has a vision for how this practice and is used for numerous ends These include can be improved in the future
bull Visitor surveys are used to gauge visitor satisfaction as
well as transportation system performance The most recent survey was collected in 2006
bull Static visitation collection points at the Savage River Check Station visitor centers and other
travel waypoints are used to track visitor characteristics and behavior
bull As of 2013 transit data is collected on all Park transit vehicles by bus drivers and through mobile
tracking devices On-board devices track the number of tickets sold number of passengers GPS
locations of buses and durations of vehicle stops Bus drivers manually input the purpose of the
stop and information about hiker wait times which is of high importance to the Park Service This
data can be made available in real time and can be used to monitor and respond to varying travel
demands The NPS currently has staff in the Resources Division dedicated to analysis of the data
collected by the transit operation
bull Permits collected for the purpose of either access by private vehicle with right-of-way
authorization for overnight backcountry access or by commercial airplane are useful for tracking
visitation to the most protected areas of the Park
bull Other information currently collected includes Service-wide Traffic Accident Reporting System
(STARS) and Fatal Analysis Reporting System (FARS) data for recording vehicular accidents
7
Denali National Park and Preserve Long Range Transportation Plan Existing Conditions Report
February 27 2015
Needs and opportunities for user data include specifying visitor experience benchmarks for number of
vehicles at wildlife stops and number of vehicles in a viewscape to serve as reliable baseline condition
data Other recommendations include additional road audits to reduce entrance fee non-payment More
flexibility to use franchise fees to fund comprehensive data gathering is seen as an opportunity to improve
visitor experiences while protecting natural resources
Multimodal Transportation Objective Provide an appropriate effective and conflict free multimodal
transportation system to and within Denali National Park and Preserve
For much of the Parkrsquos history maintenance and transportation Condition
improvements focused on Denali Park Road More recently the Multimodal access is historical
emphasis includes the Parkrsquos transit system which increases necessary and desired by
access while minimizing natural resource impacts Much of the recreationalists and subsistence
desired future conditions are related to the Park implementing more users The most common
outcome-based approaches to analyzing user information as multimodal conflicts are due to
opposed to relying solely on historic comparisons crowding at wildlife stops and
rest stops along Denali Park Appropriate multimodal transportation service is often defined by its
Road ability to make Denali NPampP accessible to a wide range of visitors
with overarching consideration for the wilderness character that the system accesses This definition of
appropriate access relates closely to the Denali NPampPrsquos purpose and mission as stated in its Foundation
Statement Appropriate access depends on the observed and anticipated effects to natural resources
(VMP 2012) Increased visitor access is desirable if it does not cause negative impacts on environmental
conditions At locations within the Park where the natural environment is still intact even small increases
in visitation or changes in access can have dramatic impacts on natural systems
Multimodal issues that reoccurred in several reviewed documents and in comments from Park staff
include confusion about shuttle service operation desire for better connections between the Park local
communities and visitor accommodations employee travel to from and within Denali NPampP safety
comfort and quality of interpretive experience and transportation service affordability
Multimodal conflicts identified in plans include general congestion along Denali Park Road and in Nenana
Canyon crowding at wildlife stops and rest stops within the Park narrow roadways for bicycling and
hiking in the ldquofront countryrdquo and at particular locations east of Savage River and conflicts between land
and air visitation in terms of soundscape impacts Congestion challenges are anticipated to grow as
visitation levels increase As a result Park managers may face ongoing decisions about how to balance
environmental priorities and resource protection with transportation system capacity when responding to
increased demand
The Park has several efforts underway to improve multimodal travel opportunities and travel experiences
within Denali NPampP Park managers are using indicators to measure performance of the transit system
and gauge overall user experience These include hiker wait times numbers of vehicles at wildlife stops
number of vehicles in viewsheds numbers of vehicles at rest stops nighttime traffic levels large vehicle
traffic and sheep gap spacing Proposed construction of an eight-foot gravel shoulder along sections of
Denali Park Road from mile eight to Savage River cited in the Final Entrance Area and Road Corridor
Development Plan could provide safety and traveling comfort for bicyclists and hikers and may improve
8
Denali National Park and Preserve Long Range Transportation Plan Existing Conditions Report
February 27 2015
opportunities for wildlife viewing Also modifications to the general management of Denali Park Road
could improve protection of natural habitats beyond Savage River
There is an opportunity to gain efficiency in transit operations by improving consistency in transit seating
and consolidating shuttle services in the entrance area and canyon Also expanding transit service north
to Healy and south to Carlo Creek and Cantwell in addition to increasing shuttle service between the
entrance area and McKinley Village is desired (Needs Assessment and Feasibility Study for a Community
Transportation System 2006)
34 Mobility Goal
Provide safe efficient and appropriate access to and within Denali National Park and Preserve
Safety Objective Provide safe access to and within Denali National Park and Preserve
Between 1990 and 2006 95 percent of all vehicular accidents in Condition NPSrsquos Alaska Region occurred in Denali NPampP with 58 percent of The historic character of Denali these accidents occurring on Denali Park Road (NPS Alaska Park Road creates safety Region LRTP 2012) Of the other accidents reported within Denali issues and due to its popularity NPampP 19 percent were located on the George Parks Highway both as a visitor attraction in the within the Park boundaries The remaining portion of vehicular Alaska Region and within Denali accidents occurred near the visitor parking areas or in NPampP most recorded accidents campgrounds The George Parks Highway is the direct road occur along the road Other connection between Anchorage and Fairbanks and a major travel safety s considerations include corridor for Denali NPampP visitors Between 2007 and 2010 31 total bicycle and pedestrian access in fatalities were reported on the George Parks Highway (NPS Alaska the front country and along Region LRTP 2012) sections of the George Parks
Highway and increased winter As identified in the VMP safety issues are associated with road
access travel along Denali Park Road The historic nature of the road may
in some locations limit sight distance restrict width for passing
vehicles and provide inadequate surface road friction (VMP 2012) Driver behavior is most likely a
contributing factor in vehicular crashes particularly for private vehicles traveling Denali Park Road during
off-peak seasons Impacts of severe weather events for Denali Park Road travelers are another safety
consideration These issues are also a top priority of the Parkrsquos General Management Plan and although very important must be balanced with active preservation of the road as characterized by the philosophy
to retain its telescoping from a full width paved profile at the entrance to the narrower unpaved gravel
profile at the western end
According to the visitor survey highlighted in the VMP the public indicates that they feel safe while using
Denali NPampPrsquos transportation system The most notable safety consideration perceived by the public is
related to travel over Polychrome Pass where Denali Park Road has steep drop-offs and the road is
narrow and winding Park management uses driver training driver spacing and wait times to address
safety issues at this location
9
Denali National Park and Preserve Long Range Transportation Plan Existing Conditions Report
February 27 2015
Safety is also a top priority for flight operations For example recommended flight tour routes are subject
to weather conditions and aircraft may be forced to deviate from planned routes if safety is at risk (Air
Tour Operations Best Practices 2012)
With increased opportunities for vehicular winter access emerging safety improvements related to winter
travel are a growing need Denali NPampP has a goal of minimizing wintertime safety-related incidents and
has an interest in determining baseline conditions so as to monitor future winter safety performance With
the trial winter plowing of the first 15 miles of Denali Park Road the Park continues to monitor visitor
safety during the extended period of winter and early spring driving conditions Commercial operators
also provide multi-modal access to the Park during winter months Denali NPampP staff is working with
commercial operators to implement safety measures for winter operation such as the required use of
emergency communication devices during operation
The collection of safety data and addressing inconsistencies in safety data reporting is identified as an
ongoing need
Access Objective Provide appropriate and efficient access for inspiration education research
recreation and other uses as provided for in ANILCA
Condition As stated in the General Management Plan the primary historic
Within Denali NPampP purpose of access to Denali NPampP is to accommodate viewing of
appropriate and effective access Mount McKinley and the Parkrsquos wildlife As documented
is determined by the assessed appropriateness of access is defined by the balance between
impacts to wildlife and cultural visitor accommodation with active protection of wilderness
resources Where the character The NPS therefore uses the least access restrictive
environmental conditions are management tool possible to maintain and promote the natural
more intact visitor access is resources protected by the area (General Management Plan
more closely managed New 2008)
vehicle management strategies
target this priority The level of appropriate access varies along Denali Park Road
Wildlife Viewing Subzones are used to distinguish appropriate level
of access A notable example includes the Parkrsquos VMP which allows 160 vehicles per 24 hour day
through mile 15 of Denali Park Road period while monitoring for violations of user experience standards
This number was derived through extensive research and rigorous travel modeling of Denali Park Road
and provides an overall increase in capacity for visitors while considering environmental impacts
Visitors typically arrive to the Park by private vehicle bus or train Many visitors arriving by bus or train
are cruise ship passengers and are traveling with fellow passengers as part of cruise packages Park
management desires to provide efficient access to visitors arriving by all modes of travel while also
providing for accessibility as delineated by the Americans with Disabilities Act (ADA) and Architectural
Barriers Acts (ABA) For areas of the Park with additional travel requirements this means ensuring a
transportation system that provides a meaningful high-quality opportunity for viewing scenic landscapes
and wildlife primarily through transit services (VMP 2012) In the future visitation is expected to grow
with a large portion of visitors arriving as part of organized tour companies or organizations
Considerations of access are therefore a topic of long-range concern as Denali NPampP is committed to
balancing access with the responsibilities of managing designated wilderness
10
Denali National Park and Preserve Long Range Transportation Plan Existing Conditions Report
February 27 2015
At the time that the Denali Park Road Visitor Survey (2010) was conducted 71 percent of visitors who
traveled beyond mile 15 were part of organized tours (ie Long Tour) These are highly interpretive trips
with designated stops at rest areas and impromptu stops for wildlife viewing Non-tour transit buses
traveling past mile 15 provide less interpretation and make impromptu stops for hikers and wildlife
viewing
Coordination with the visitor services concessioner is ongoing and the relationship between Denali NPampP
and any concessioner is viewed as integral to providing appropriate and effective access for Park visitors
User Information Objective Provide accurate and accessible information through a variety of means
about how to travel to and within Denali National Park and Preserve
The NPS is interested in providing information to potential and Condition repeat users about its transportation system and services at a Commercial and state tourism national regional and local level The Alaska Federal Lands LRTP initiatives are successful in and NPS Alaska Region LRTP summarize objectives and providing travel information to strategies that specifically address providing accurate and visitors prior to their arrival at accessible information for travel to and within federal lands and the Park Once at Denali NPampP several projects to enhance visitor information services the Park its concessioners and
local businesses provide Much of the marketing and development of traveler information for
interpretation through visitor Denali NPampP is championed by non-NPS organizations such as
centers transit and tour bus the Alaska Railroad concessioners and other area businesses
operations and many others Because Denali NPampP is a regular destination for commercial tour
Interpretation and transit system operations much of the information provided to potential visitors
visitor information improvements and visitors en route to the Park is provided by those organizations
are desired According to the Denali Park Road Visitor Survey issued in 2010
over half of the Denali NPampP transit users had received information from a travel agent about their visit to
the Park Another third of the respondents received information over the internet Denali NPampP maintains
a website with virtual tours guides and resources to help visitors plan trips to the Park Travel guides and
tour books are also popular means of learning about how to travel to and within Denali NPampP (NPS
Alaska Region LRTP 2012)
Traditional means for providing information at visitor centers and Wilderness Access Center are available
upon entering Denali NPampP Once aboard the short-tour and long-tour buses visitors have a wide range
of information available Tour bus drivers and guides provide extensive interpretation while transit drivers
may provide information upon request and at the discretion of a particular driver Several Denali NPampP
plans document the value of retaining experienced drivers This was seen as a major enhancement to the
overall visitor experience (Denali NP Bus Shuttle System Analysis 2013)
The most common need identified in planning documents is the necessity for better wayfinding and user
information about transit in hopes of reducing visitor confusion with the Parkrsquos transportation system
According to the VMP an objective of Denali NPampP management is to ldquoclearly communicate information about the system through a variety of meansrdquo Potential options for sharing information include improving
traditional methods such as maps brochures and signage The Alaska Region is also interested in newer
media options such as implementing intelligent transportation systems linked with websites mobile
devices and other personal communication technology According to a survey in 2010 transit users were
11
Denali National Park and Preserve Long Range Transportation Plan Existing Conditions Report
February 27 2015
not interested in receiving information from a recorded narrative about traveling Denali Park Road
Information delivered by bus drivers was preferred over prerecorded methods
Also with the introduction of enhancements to the off-season access programs Denali NPampP
management is interested in reducing the perception that the Park is closed during off-seasons by
increasing communications about opportunities for visiting the Park during the winter
35 System Management Goal
Develop a long-term transportation system to appropriately satisfy current and future land
management needs
Asset management Objective Apply available financial resources to essential transportation
infrastructure
Relative to other parks in the Alaska Region transportation assets
within Denali NPampP are some of the most costly This is primarily
due to Denali Park Road maintenance needs providing visitor
transit and tour services and experiencing the high visitation levels
during a very short summer season
In general transportation assets within Denali NPampP are
considered to be in good condition Road work is mainly
concentrated on bridge replacement road maintenance and
subgrade improvements In general road widening does not occur
However improving pullouts on the narrowest section of the road
to maintain safety standards des exist in asset planning
documentation The annual operations and maintenance budget for
road assets in Denali NPampP was approximately $12 million in 2010
(NPS Alaska Region LRTP 2012)
Denali NPampP management uses both quantitative and qualitative
measures to prioritize transportation system improvements The
2008 General Management Plan prioritizes road improvement
projects ranking corrective safety projects as the highest priority and other corrective maintenance and
repairs as secondary priorities The General Management Plan provides example projects from Denali
Park Road where potential improvements have been identified for multiple project categories (sight
distance improvements safe vehicle passing enhancements road surface friction improvements culvert
repairs etc) Denali NPampP has incorporated the NPS ldquooptimizer bandrdquo model of asset prioritization In
this model assets are scored by Asset Priority Index (API) to rank how critical assets are used in
accomplishing the Parkrsquos mission and goals In this model Facility Condition Index (FCI) indicates asset
condition and is used to determine eligible fund sources Projects are evaluated based upon their APIFCI
rank Using this method of asset evaluation all of the high priority assets (API of 75 or higher) are in good
or better condition (FCI of 03 or less) (Alaska Federal Lands LRTP 2012) Finally the asset needs are
filtered through the NPS Capital Investment Strategy (CIS) which expresses priorities in the form of
optimizer bands Optimizer bands 1 and 2 are associated with assets that are essential or extremely
important for a park to continue as described in its organic legislation
Condition
The availability of funds
particularly for funding transit
systems has decreased in
recent years Denali NPampP
management is using
quantitative and qualitative
indicators about the
transportation system to
prioritize transportation system
improvements With limitations
to increasing system capacity
Denali NPampP management is
working toward increased
system efficiency and better
coordination with transportation
partners
12
Denali National Park and Preserve Long Range Transportation Plan Existing Conditions Report
February 27 2015
There is a general funding gap projected into the future The most recent congressionally authorized
transportation funding bill Moving Ahead for Progress in the 21st Century (MAP-21) reduces funding for
the NPS transit systems by approximately 28 percent from the previous federal transportation legislature
(Alternative Funding Opportunities for NPS Transit 2014) Regional funding assessments show an
annual funding gap of $720000 for Alaskan ldquoroad parksrdquo the category which Denali NPampP is included
Although park-level funding shortages are not yet documented for Denali NPampP a large portion of the
Alaska Regionrsquos transportation assets are located in Denali NPampP Elimination of the Transportation
Improvement Program (TRIP) has made funding multimodal systems such as the Parkrsquos concessioner-
operated transit more challenging (Alternative Funding Opportunities for NPS Transit 2014)
Because the transit system is operated by a for-profit concessionaire it is not eligible for transportation
funding through MAP-21 however several FHWA funding and grant programs are still applicable and
partnerships with local government cooperation and partnership could increase funding eligibility
Park management is also very interested in finding efficiencies within its current asset portfolio
completing operational modifications that improve the transportation system and promoting the Parkrsquos purpose Recent examples of this include new vehicle management strategies provided in the VMP and
wintertime operation improvements
Asset Investment Planning Objective Consider sustainability of operation and maintenance of new
and existing assets in the planning process
The NPS includes asset investment planning in much of its recent Condition transportation planning documentation At a regional level the NPS Denali NPampP managers are very is using measurements that feed into asset planning processes involved with asset planning for such as total cost facility ownership as well as the project
transportation system prioritization tools mentioned earlier Several strategies identified in maintenance and operations the Alaska Federal Lands LRTP promote asset planning through Relative to other parks in the collaboration with other federal land management agencies and region Denali NPampP has high Alaska Department of Transportation and Public Facilities deferred maintenance needs consideration of lifecycle costs and evaluation of maintenance
resulting largely from challenges costs versus investments in new infrastructure associated with maintaining
Denali Park Road Maintenance In 2010 deferred maintenance in Denali NPampP accounted for 65
and operation are constantly percent approximately $20 million of all deferred maintenance of
weighed against environmental transportation assets in the Alaska Region Deferred maintenance
conservation priorities issues within Denali NPampP could be addressed by treating the
underlying cause of the road failures to reduce the need for
repetitive maintenance according to the General Management Plan
Documents suggest that road repairs and maintenance should follow the 2005 Denali NPampP Road
Maintenance Repair and Operating Standards and the 2007 Denali NPampP Road Design Standards The
total planned transportation assets for Denali NPampP include improvements to access roads parking lots
non-motorized routes and other transportation infrastructure These planned assets are valued at $64
million (NPS Alaska Region LRTP 2012)
13
Denali National Park and Preserve Long Range Transportation Plan Existing Conditions Report
February 27 2015
In terms of operational needs Park managers are actively participating in day to day management of
transit operations and are able to make adjustments based on demand For example real-time
monitoring of the transit system allows the concessionaire to track transit vehicle occupancy and dispatch
additional vehicles during peak demand for return trips Denali NPampP is also actively investigating
opportunities for gaining efficiency in their transit and in their entrance fee collection program
As it is with other goal area topics effective operation and maintenance is balanced with environmental
protection In planning documents the Denali NPampP management is constantly balancing expectations of
visitor experience and safety with deference to natural resource objectives
Coordination Objective Coordinate with local organizations to ensure that nearby transportation
projects are planned with NPS involvement to the mutual benefit of all parties
Coordination with federal state and local agencies is seen as an Condition opportunity for funding and project implementation as well Coordination with federal state managing concessionaire services and expanding local visitor local and private transportation services An ongoing federal land management agency agencies is seen as a need for coordination team was formed as a result of the 2012 Alaska optimizing asset management Federal Lands LRTP The group actively works to coordinate because 21 percent of the transportation project planning across Alaska including in and transportation assets are owned around Denali NPampP These efforts could help organize interest in by non-NPS agencies expanding transit services outside of the Park which is a frequently
cited coordination need as determined by the literature review and
comments from Park staff during LRTP discussions
Needs and opportunities for coordinating with private entities are somewhat unique to Denali NPampP
Denali NPampP is the only park in the Alaska Region to have transportation assets that are not owned by
the NPS Twenty-one percent of the transportation assets in the Park are owned and operated by
concessionaires or owned by others There is a desire to expand partnerships to include other local
businesses and eventually local government agencies The 2006 Needs Assessment and Feasibility
Study for a Community Transportation System provides alternatives for organizing such efforts
Other coordination efforts include involving air tourism operators regular communication with tribal
organizations and land inholders and coordinating access with other area landholders and transportation
agencies such as the Alaska Department of Transportation and Public Facilities
14
Denali National Park and Preserve Long Range Transportation Plan Existing Conditions Report
February 27 2015
4 Conclusions
Common themes encountered throughout the literature review process provide several general baseline
conditions for Denali NPampP These include
Resourc
e P
rote
ctio
n
Clim
ate
Change
User
Experie
nce
Mo
bili
ty
Syste
m M
anagem
ent
The historic character of Denali Park Road and the management thereof are important
factors influencing access and mobility
Denali NPampP is a primary attraction for tourists Many visits are rushed due to the
logistics of popular packaged Alaska tours Visitation is anticipated to increase as tour
companies continue to promote and expand travel options to the Park
With anticipated visitation increases and associated use of the transportation system
Denali NPampP managers may face ongoing decisions about how to best protect the Parkrsquos natural resources as congestion grows and the capacity of Denali Park Road and
transportation system is tested
Travel options are sometimes viewed as limited within the Park but some multimodal
enhancements could increase safety particularly for bicycling and hiking opportunities
The general condition of the transportation system is good but priorities are complex
both in terms of balancing maintenance needs with the care for natural resources and
providing access to view designated wilderness areas
Recent changes to Denali Park Road vehicle management and operations system are
intended to advance the NPSrsquos emerging outcome-driven planning processes As more
data becomes available Denali NPampP managers can better set performance indicators
for operations
Existing transportation plans do not contain much information about climate change but if
the actions recommended and cited in the NPS Alaska Region LRTP are followed there
may be more opportunities to include unit-level strategies for addressing climate change
into asset planning and operation With ongoing progression toward a CFP certification
Denali NPampP is well positioned to incorporate these objectives at a unit-level
15
National Park Service US Department of the Interior
Denali National Park and Preserve Long-Range Transportation Plan
Appendix B Denali Long-Range Transportation Planning and Acoustic Resources
1
Denali Long Range Transportation Planning and Acoustic Resources
Davyd_Betchkalnpsgov NPS Alaska Region Soundscape Specialist Biologist 907‐683‐5754
Research Sets the Stage
Author Eli Seigel wrote in 1970 ldquoall the opposites are two freedoms which question each other and complete each
otherrdquo Transportation and solitude likely represent such a pair of mutually‐exclusive freedoms In Denali and other
Alaskan parks we can immediately recognize a tradeoff between the ability to be easily and quickly transported to
a location and the ability to participate in the tranquility of wilderness beyond the reach of modern technology and
crowds
This recognition is a fundamental drive behind the work of the NPS Natural Sounds and Night Skies Division whose
vision statement is to ensure that ldquoNational parks are enduring sanctuaries for natural sounds and dark
environments where current and future generations have the opportunity to experience undisturbed soundscapes
and an unimpeded view of the cosmos and where the ecological roles and cultural values of acoustics and photics
are understood and appreciatedldquo (NPS 2014)
For the purposes of acoustic planning and research the NPS has developed an autonomous system that can
provide both American National Standards Institute (ANSI) certified acoustic levels (ie numeric measurements of
sound pressure level in decibel units) and audio recordings (ie sound that one can listen back to in headphones)
ANSI also recommends the collection of meteorological data concurrent with measurements of sound pressure
level Thus a simple weather station incorporating wind speed wind direction temperature and relative humidity
is also part of the acoustic monitoring station The photo below shows an external photograph of a typical station
2
Figure 1 NPS Standard Acoustic Monitoring Station ndash equipment is composed of a microphone meteorological instruments
sound level meter digital audio recorder battery bank and solar paneling
Scientific work to understand Denalirsquos acoustic environment began in 1999 in response to a large increase in
aviation and snowmobile noise in the mid‐1990s (Morgan 2001) Early data were incorporated into the
Backcountry Management Plan (BCMP) EIS a supplement to Denalirsquos General Management Plan (NPS 2006e)
After the BCMP was published the park embarked on a decade‐long inventory of the acoustic environment The
project was completed in 2015 and as of 2016 the park has moved into a monitoring phase A basic timeline of
acoustic resource management in Denali is shown below
Figure 2 Timeline of acoustic resource management in Denali 1999 ndash 2016
Denalirsquos acoustic inventory project is unique among park service units in that it was designed as a spatially random
sample on a 20 by 20 kilometer grid This allows inference beyond the local detection radius of each microphone
For example consider the following map that depicts the acoustic metric lsquodaily average noise free intervalrsquo ndash a
measure of how long a typical quiet period is before it is broken by motorized noise Noise free intervals in Denali
are largely determined by the frequency of air traffic Aircraft are very acoustically powerful sources that are
audible at distances similar to the scale of the sampling grid thus mapped measurements of noise free interval
immediately form a discernable pattern to the human eye
3
Figure 3 Daily average noise free intervals measured in hours Data were collected as part of Denalirsquos Soundscape Inventory
project 2006 ndash 2015 Noise free interval is a measure of how long a typical quiet period is before it is broken by motorized
noise
Entering the realm of inference the following map uses observations at specific soundscape inventory points to estimate the noise free interval at a park‐wide scale It uses a spatial smoothing technique called inverse distance weighting to construct new data points between the known values ‐ a method known as interpolation Again
because the scale of the phenomena (aircraft traffic) and the scale of the sample (20 km2 resolution) are comparable noise free interval is a metric well‐suited to interpolation techniques (Peterson 1998 Gergel 2006) Continuous change in the metric is physically sensible and approximate the visual effect of looking at the original point data Denalirsquos soundscape inventory was important for understanding which acoustic metrics are best suited to monitoring change at a landscape scale
4
Figure 4 Average noise free interval values estimated by spatial interpolation Units are in hours This map uses observations
at soundscape inventory points to estimate the average noise free interval at a park‐wide scale It uses a smoothing technique
called inverse distance weighting to construct new data points between the known values ndash a method known as interpolation
The Denali soundscape inventory supplies spatially‐rich information about the current state of the acoustic
environment It also clarifies the choices available to quiet the park as per NPS policy Inventory data have been
(1) Inventory data have been used to review the indicators and standards of the BCMP
They explain how indicators change in response to the acoustic ambience
They explain the relationship between indicators (for example NFI and event rate are inversely related
thus one can be estimated from the other)
They provide an understanding as to which indicators are best suited to the scale of the park
(2) Inventory data have been used as input to the voluntary aviation best practice development process
of the Denali Overflights Advisory Council (2007 ndash 2012)
They provided the basis from which to monitor the effects of aviation best practices
They provided updates to the council directing attention to areas most in need of mitigation
They transcend anecdote as the sole basis for making decisions
(3) Inventory data have been used in predictive acoustic modelling
5
They provide a means to validate noise models of aircraft takeoffs or overflights road noise or other
sources
Data such as event rates or hourly distributions can also be used as inputs to models
Aviation Transportation and NPS Policy
There are currently several types of aviation transport in the park Section 1110(a) of the Alaska National Interest
Lands Conservation Act (ANILCA) provides for aviation access for traditional activities and for travel to and from
homesites which will not be discussed in this document Nor will high‐altitude commercial aviation ndash which does impact the park but would involve participation of the Federal Aviation Administration in the revision of Victor
Airways or Jet Routes within the National Airspace System a process well beyond the scope of this plan
Instead this document seeks to build on discussions of the Denali Overflights Advisory Council
(httpswwwnpsgovarticlesdenali‐aircraft‐overflightshtm)a federal advisory committee chartered by the
Secretary of the Interior from 2007 ndash 2012 The group developed a suite of voluntary aviation best practices that
were adopted by both commercial and government aviators It is fitting that these best practices were broadly
adopted because NPS policy does not distinguish the obligations of governmental and Concessionaire operations
with respect to resource protection NPS Management Policies 2006 sect 10249 states
Concessioners are required to comply with applicable provisions of all laws regulations and policies that
apply to natural and cultural resource protection
It is relevant then to provide a brief policy review NPS Management Policies 2006 sect 823 addresses impacts to
natural sounds directly stating
The Service will strive to preserve or restore the natural quiet and natural sounds associated with the
physical and biological resources of parks To do this superintendents will carefully evaluate and manage
how when and where motorized equipment is used by all who operate equipment in the parks including
park staff Uses and impacts associated with the use of motorized equipment will be addressed in park
planning processes Where such use is necessary and appropriate the least impacting equipment vehicles
and transportation systems should be used consistent with public and employee safety The natural
ambient sound levelmdashthat is the environment of sound that exists in the absence of human‐caused
noisemdashis the baseline condition and the standard against which current conditions in a soundscape will be
measured and evaluated
Further guidance related to aircraft is articulated in sect 6343
Managers contemplating the use of aircraft or other motorized equipment or mechanical transportation within wilderness must consider impacts to the character esthetics and traditions of wilderness before considering the costs and efficiency of the equipment
In evaluating environmental impacts the National Park Service will take into account (1) wilderness characteristics and values including the primeval character and influence of the wilderness (2) the preservation of natural conditions (including the lack of man‐made noise) and (3) assurances that there will be outstanding opportunities for solitude that the public will be provided with a primitive and unconfined type of recreational experience and that wilderness will be preserved and used in an unimpaired condition
6
Furthermore sect 637 offers and important reminder that in wilderness areas
The principle of nondegradation will be applied to wilderness management and each wilderness arearsquos condition will be measured and assessed against its own unimpaired standard Natural processes will be allowed insofar as possible to shape and control wilderness ecosystems Management should seek to sustain the natural distribution numbers population composition and interaction of indigenous species Management intervention should only be undertaken to the extent necessary to correct past mistakes the impacts of human use and influences originating outside of wilderness boundaries
Envisioning a (Flight) Route Forward
Denalirsquos Backcountry Management Plan (BCMP) remains the overarching unit‐level policy document on the
management of the natural acoustic environment Data collection during the implementation of the BCMP has
provided a robust baseline description of the resource Transportation planning directly benefits from a synthesis
of these inventory data
One way to approach the protection of acoustic resources is through a cost‐distance analysis Cost‐distance
analysis balances the costs associated with travelling a certain distance (in this case the cost of aviation fuel) with
resistances to travel Resistances to travel can take many forms ndash the increased difficulty in crossing a major river
or mountain range or the difficulty of moving over muskeg as opposed to alpine tundra In this case we describe
resistances to noise ndash areas sensitive to the acoustic disturbance created by mechanical transport
What is meant by resistance Synonymous with lsquonoise sensitivityrsquo for the purposes of this discussion the word
resistance more accurately conveys the interlocked relationship between isolation and transportation The
following two definitions are applicable to the Long Range Transportation Plan
Resistance (noun)
1 Resistance is the degree to which a substance prevents flow through it
2 Resistance is the ability to prevent something from having an effect
In this case the ldquoability to prevent something from having an effectrdquo describes the human ability to make choices
about how to conserve the acoustic environment In other words we conceptualize a resistance when we answer
the question ldquoHow do we mitigate the effects of motorized transport on the acoustic environmentrdquo We will later
see how the resistive analogy between traffic flows and electrical flows can be used to the benefit of managing
acoustic resources
Resistances to noise typically fall into three basic categories
1) Those defined by NPS policy or aviation best practices
2) Those related to the acoustic or ecological properties of the landscape
3) Those related to avoiding interactions between motorized and non‐motorized experiences
7
Resistances to noise can be assigned based on a number of different rationales For instance consider the
following raster dataset that depicts the amount of use by backcountry unit One long‐standing approach to
describing which areas should be protected from noise is to separate backcountry user groups from aviation user
groups in space Lighter areas on the map indicate more backcountry use ndash and thus suggest that aircraft avoid
units along the Denali park road corridor
Figure 4 Backcountry Unit Use resistance layer Lighter values indicate a greater resistance to transportation noise This
suggests that aviation routes should avoid core units around the road corridor
Contrast this with data which show the average noise free interval across the park The layer is normalized to the
same brightness as the backcountry use layer with lighter areas representing a greater resistance to noise and
thus higher resource costs for transportation over the area
The rationale behind the noise free interval map produces different optimal routes than the backcountry user
map This is because resistance is based on the fact that areas with long noise free intervals are sensitive to minor
changes in air traffic and thus traffic should be routed over areas that are already highly fractured In this case
8
areas that already have air traffic would continue to bear the brunt of resource damage allowing the most pristine
acoustic environments of the park to remain intact
Figure 5 Noise Free Interval resistance layer lighter values indicate greater resistance to transportation noise This would
suggest that aircraft routing remain largely the same especially in the areas between the Kahiltna and Ruth glaciers
Backcountry use statistics and noise free intervals are just two of many different ways of assigning resistances to
aviation transport Which strategy is best That depends entirely on the basis of each claim After reviewing both
layers it should be apparent that a wide range of conflicting rationales can be applied to mitigating impacts from
Denalirsquos aviation transportation network Deciding which should be prioritized is a complex decision
Unless the overall aviation traffic volume over the park is reduced displacement in free space is the primary
mitigation technique available to park stewards The most substantial mitigations enacted for the park thus far ndash
the Denali Overflights Advisory Council aviation best practices ndash required the council to weigh certain routing
displacements over others (DOAC 2012)
9
Once a weighting network of resistance layers has been distilled from public and expert opinion it is possible to
use them to envision idealized flight corridors One useful tool for this purpose is the cost‐distance modelling
software Circuitscape (wwwcircuitscapeorg) which uses electrical theory to describe the travel of electrons over
a semiconductor This is analogous to a pilot with knowledge of areas resistant to noise who utilizes this
knowledge while conducting their flight operations Results of a Circuitscape analysis include all the possible routes
a pilot might fly but highlight stewardship‐friendly corridors It allows us to see the conclusions that follow from
our rationale
The following is an example weighting network that can be used as an input for Circuitscape The weights are
chosen in this case to produce a result that is realistic while avoiding the influence of hard discrete edges It
balances nine data sets with widely varying rationales to produce a final summation that can be used to visualize
flight corridors
Figure 6 Example of a weighted network resistance layer Summed data layers include natural ambient acoustic
level travel time backcountry unit use Denali Overflights Advisory Committee aviation best practices and sound
10
sensitive areas BCMP standards noise free interval campgrounds and road corridors The hard edges of polygon
features are especially prominent in the final sum
Dataset Name Description of Dataset Rationale Statement for Noise Resistance Weight
Natural Sound Pressure Level (Median L50)
Typical ambience of the natural acoustic environment (Modelled)
Listening area is reduced in more energetic acoustic environments reducing the impact of human
activities Less natural energy = higher resistance 50
Travel Time Estimated travel time on foot from
portal areas (Modelled)
Backcountry users travelling in more remote areas of the park have a greater motivation to find
solitude Greater travel time = higher resistance 25
Backcountry User Days Utilization of backcountry units of
the park (Empirical)
Areas with a greater amount of backcountry users should be preferrentially avoided More users =
higher resistance 15
Denali Overflights Advisory Council Aviation Best Practices
Best‐practices for mitigating acoustic impacts from aviation (Federal Advisory Committee)
Best‐practices identified by the Denali Overflights Advisory Council should be fully implemented Areas
affected by best‐practices = high resistance 10
Backcountry Management Plan Soundscape Standards
Soundscape standards by spatial region of the park (GMP)
Adherence to NPS policy should be prioritzed Lower impact management zone = Higher resistance
5
Noise Free Interval
Average amount of time before experiencing the next noise disturbance (Empirical
interpolated)
Areas with longer noise‐free intervals are more sensitive to fracturing due to increases in air traffic
Greater noise‐free interval = higher resistance 5
Campground Locations Buffered campground areas
(Empirical)
Campgrounds are places where many people spend time resting and should be preferrentially avoided
Closer to campground = higher resistance 5
Roads Buffered road network (Empirical) Roads are already impacted by noise so aviation
noise will have a lesser impact in proximity to roads Beyond road noise footprint = high resistance
3
Denali Overflights Advisory Council sound sensitive areas
Areas identified by the Denali Overflights Advisory Council as
noise sensitive banded into three categories low medium high (Federal Advisory Committee)
Sound sensitive areas should be preferrentially avoided Higher sensitivity band = higher resistance
2
Table 1 Description of noise resistance rasters that were used to show how varying rationales can be balanced to produce an overall weighted noise resistance layer
Once the weighted resistance layer has been created Circuitscape is used to recognize ideal flight corridors Airports with commercial use represent sources of electrical potential and include Talkeetna Healy McKinley Public ERA helipad McKinley Private Cantwell and Kantishna The sink (ground) of electrical potential is the Denali massif For the example weighting network in this document the following map was produced
11
Figure 7 Cost‐distance analysis results This graphic shows current flow from electrical sources (airports) to an electrical sink (the Denali massif) This is analogous to air traffic density
What does the model show It represents air traffic density as an analogy to electrical current ndash the greater the current the greater the air traffic density As a model it is an imperfect representation of reality but this example representation does identify flight corridors that follow from the input rationale (These corridors include the Denali park road corridor the Denali Fault a route along the outer range and one that connects Broad Pass to the Eldridge Glacier) Obviously the map in Figure 7 fails to capture public opinion and for that reason it is incomplete but the technique stands as a meaningful strategy to approach these complex decisions
12
Conclusion
Data from the Denali Soundscape Inventory describe the parkrsquos acoustic environment at a landscape scale These data can be used
for many purposes but their most critical is to provide a baseline from which to monitor the effects of future noise mitigation
efforts
In the preceding section we described a cost‐distance analysis technique that could be utilized to identify the most beneficial long‐
term mitigations for the acoustic environment Such corridors represent opportunities for park management and the aviation
community to work together as stewards What has not been identified in this document is the ldquovalue analysisrdquo process by which
public and expert opinion can be synthesized into an appropriate weighted resistance layer for cost‐distance analysis The overall
strategy may follow a form similar to this
An informal version of this same process was used to by the twelve members of the Denali Overflights Advisory Council to develop
an initial suite of aviation best practices from 2007 ndash 2012 Some of these best practices have produced substantial positive changes
for the park but others have failed to be acoustically effective due to their extent or timing The strategy described in this
document could be used to open the doors of conversation and improve the effectiveness of the mitigations to protect Denalirsquos
acoustic environment
References
Alaska National Interest Lands Conservation Act PL 96‐487 sect 1110(a)
Denali Aircraft Overflights Advisory Committee 2012 Denali air tour operatorsrsquo best practices to minimize sound impacts Available
at httpswwwnpsgovdenagetinvolvedaoachtmCP_JUMP_5151844 September 2013
Gergel S E and M G Turner 2006 Learning landscape ecology a practical guide to concepts and techniques Springer Science amp
Business Media New York
McRae BH VB Shah and TK Mohapatra 2013 Circuitscape 4 User Guide The Nature
Conservancy httpwwwcircuitscapeorg
Morgan D and J Van Horn 2001 Aircraft Overflight Activity in the Denali Wilderness An Analysis of Backcountry Rangers
13
Observations for 1999 and 2000 National Park Service Denali Park Alaska
National Park Service (NPS) 2000 Directorrsquos Order 47 Soundscape Preservation and Noise Management US Department of the
Interior National Park Service Washington DC
National Park Service (NPS) 2006a Management policy 6343 Environmental Compliance in Management policies 2006 US Department of the Interior National Park Service Washington DC
National Park Service (NPS) 2006b Management policy 637 Natural Resources Management in Management policies 2006 US Department of the Interior National Park Service Washington DC
National Park Service (NPS) 2006c Management policy 823 Use of motorized equipment in Management policies 2006 US Department of the Interior National Park Service Washington DC
National Park Service (NPS) 2006d Management policy 10249 Natural and Cultural Resource Management Requirements in Management policies 2006 US Department of the Interior National Park Service Washington DC
National Park Service (NPS) 2006e Denali National Park and Preserve final backcountry management plan environmental impact statement National Park Service Denali Park Alaska
National Park Service (NPS) 2014 Natural Sounds amp Night Skies Division Strategic Plan (2014 ndash 2019) US Department of the Interior National Park Service Natural Resources Stewardship and Science Ft Collins CO
Peterson D L and V T Parker 1998 Ecological scale theory and applications Columbia University Press New York
Siegel E 1970 There Are Two Freedoms Aesthetic Realism Lectures by Eli Siegel Web 1 July 2016
14
National Park Service US Department of the Interior
Denali National Park and Preserve Long-Range Transportation Plan
Appendix C Denali Park Road Risk Assessment Utilizing the Unstable Slope Management Program
1
Denali National Park and Preserve ndash Long Range Transportation Plan
Deterministic Geologic Risk Assessment of the Denali Park Road Utilizing the Unstable Slope Management Program
Authors Russell Rosenberg MSc ndash Physical Science Technician (Geologic Hazards) Denny Capps PhD ndash Park Geologist Heather Rogers MSc ndash Physical Science Technician (Geologic Hazards)
Prepared 080316
Revisions none to date
Introduction and Project Status
The 92‐mile Denali Park Road traverses a highly active geologic landscape and has experienced
numerous documented mass wasting events throughout the history of the road One of the most
dramatic occurred in late October 2013 when a 600‐ft‐long 110‐ft‐wide debris slide blocked the road
near MP 38 Blocks of permafrost‐frozen unconsolidated debris up to 15 ft thick slid on weak unfrozen
clay Frequent but less dramatic events block traffic undermine road surfaces and may cause damage
to vehicles or injuries Many events including the example above are likely triggered or exacerbated by
thawing permafrost and are consistent with the possible effects of anthropogenic climate change With
increases in road use the uncertain effects of climate change and possible changes to maintenance
funding levels National Park Service (NPS) and Federal Highway Administration (FHWA) staff identified
the need for a comprehensive risk analysis of geologic hazards along the Denali Park Road
The risk analysis is scheduled for completion by March 2017 and includes five parts (1) inventory maps
and linked database that illustrate spatialtemporal distribution of geohazards their relative activity
and geomorphic attributes (2) beta testing and implementation of the Unstable Slope Management
Program (USMP) rating criteria (3) geohazard susceptibility models that estimate the spatial probability
of occurrence (4) geohazard risk models that illustrate the potential consequences and (5)
analysesrecommendations to park management regarding other risks the road will exhibit over the
next decade (DENA‐MOA‐208813AB) Currently tasks 1 and 2 are predominately complete tasks 3 and
4 are underway and task 5 will follow the completion of tasks 1‐4 Although final results and
recommendations are still forthcoming the results of tasks 1 and 2 in particular the USMP ranking
scores (discussed below) provide an inventory and a first‐order deterministic risk assessment of
geologic hazards currently affecting the park road
2
The results of the USMP rating criteria provide valuable information on the spatial distribution of
geologic hazards their severity and the associated risk however they do not directly assess the
possible impacts of climate change or provide a detailed outlook of possible future scenarios We utilize
these data to provide a preliminary identification of the areas with the highest relative risk and their
spatial patterns Consideration of this information should be valuable to this Long Range Transportation
Plan (LRTP) and for park managers and planners as future infrastructure plans are being developed
Unstable Slope Management Program Site Rankings
The USMP is a collaboration between the FHWA many other federal agencies including the NPS private
geotechnical consultants and the Alaska Department of Transportation amp Public Facilities (AKDOT) that
ranks geologically unstable slopes for the purpose of facilitating more effective long‐term geotechnical
asset management USMP scores provide a deterministic ranking of agency risk associated with any
particular geologic hazard site These scores consider elements of both the severity and
frequencyprobability of a hazard and the exposure and vulnerability at each particular site Example
elements include the amount of roadway affected by landslide events the frequency of known hazard
events the impact of events on the use of the transportation corridor the maintenance cost and
complexity and annual average daily traffic For detailed information the USMP ranking criteria please
see (httpnlcsmontanaeduusmpRatingManualpdf)
We have currently completed a total of 141 USMP site rankings along the entire 92 miles of the DENA
Park Road (Figure 1) These data represent the vast majority of known geologic hazard sites and include
landslides debris flow drainages rockfall areas frost‐heaves and erosional undercutting due to fluvial
processes It should be noted however that these site rankings are not totally comprehensive instead
they represent our most complete knowledge as of 06292016 The DENA USMP rankings range from
164 to 948 with a mean value of 328 and more variance within higher ranking sites To put these values
in perspective immediately however the USMP qualitatively defines sites that score less than 200 to be
in ldquogoodrdquo condition sites that score between 200 and 399 to be in ldquofairrdquo condition and sites that score
400 or higher to be in ldquopoorrdquo condition
In theory sites in poor condition are more likely to pose persistent andor more serious problems along
the road and areas of higher risk density are more likely to see a higher concentration of problems In
DENA the current majority of our sites 67 rank in fair condition while only 9 are in good condition
and a relatively large number of sites 24 are in poor condition The only significant outlier was the
ldquoPretty Rocksrdquo slump (Figure 3b) with a score of 948 365 points higher than the next highest site
Spatially regions of higher USMP risk density (Figure 2) are most pronounced along Polychrome Pass
and the Eielson Bluffs areas Individual USMP scores represent the relative risk associated with a hazard
site and risk density represents the relative concentration of agency risk
3
Figure 1 DENA USMP site rankings on IKONOS imagery Icon sized is scaled by individual site rank and colored according to good fair or poor qualitative rank
Figure 2 DENA USMP score density on IKONOS imagery Density scaled by linear concentration and site ranking scores
Of the sites ranked in poor in condition along the Park Road many received prior mitigation or were
previously identified as areas of concern by maintenance or resource management personnel Some
previously noted severe geologic hazard sites in lsquoagreementrsquo with poor USMP scores include the ldquoPretty
Rocksrdquo slump (Figure 3a) debris flow activity at ldquoBugstufferrdquo creek (Figure 3b) the ldquoBear CaveMile 45rdquo
slump (Figure 3c) and the ldquoIgloo Debris Sliderdquo (Figure 3d) Additionally Polychrome Pass is a known area
of high geologic hazard occurrences This general agreement of USMP scores and professional
4
judgementinstitutional knowledge within DENA should be reassuring to park managers and help
demonstrate that the USMP ranking scores represent useful information and are based off of many
years of development from similar programs and expertise developed by FHWA AKDOT Oregon Dept
of Transportation and private firms The USMP provides an institutional framework for tracking these
known problem areas and has identified other new examples
A B
C D
A B
Figure 3 Previously recognized sites that rank in poor condition A ndash Pretty Rocks Slump (mile 454 948 points) B ndash Bugstuffer debris flow (mile 519 575 points) C ndash Bear Cave Slump (mile 45 411 points) D ndash Igloo Debris Slide (mile 377 514 points)
Current Applications to the LRTP
The USMP rankings provide a preliminary framework for understanding the relative severity of risk
associated with geologic hazards along the Park Road Although we do not currently make
recommendations tailored to specific sites or address possible future scenarios we suggest that an
awareness of the current results of the USMP rankings is beneficial to this LRTP Likely applications of
the USMP data to the LRTP would involve spatial analysis of USMP rankings as they relate to possible
disruptions in traffic programming of potential mitigation projects and overlap with future
infrastructure planning In order to facilitate this analysis we submitted a spatial database of our USMP
rankings to PaTINA (they are also available on request) We emphasize that these results are
preliminary yet they provide a method for understanding and considering geologic hazards in a broader
context Park planners and managers should continue to work with resource staff in understanding the
5
implications of these results however the following are potential applications to consider for the
current LRTP
All geologic hazards sites but in particular those in poor condition are more likely to pose
persistent andor serious problems along the Park Road These are areas where the
transportation corridor could experience interruptions or incur high maintenance costs as a
result of geologic activity Sites in poor condition should be considered for mitigation and
investigated in more scientific detail (see Future Work)
The USMP rankings may help identify geotechnical assets where hazards do not appear
extremely severe but may be candidates for mitigation from a risk‐based or cost‐based
perspective Rockfall sites that are not capable of producing catastrophic roadway failure but
require very frequent maintenance are good examples of this These sites also rank in poor
condition but may not otherwise receive attention from management
Density analysis of USMP site distribution identifies areas of non‐discrete geologic hazard areas
that may require alternate or more systematic mitigation efforts to increase cost effectiveness
The extreme concentration of hazard sites along Polychrome Pass is an example of such an area
Future Applications to the LRTP
Both the LRTP and USMP have been designed to evolve as new information become available through
time thus allowing for future applications with as new data become available Most transportation
agencies apply transportation asset management (TAM) systems to transportation assets such as
bridges and road surfaces however geotechnical assets such as rock slopes and embankments are
unlikely to be considered with the same detail (Stanley 2010) The USMP provides a system for
geotechnical asset management by creating a framework to establish potential performance measures
and targets for individual geologic hazards and the overall transportation corridor (Federal Highway
Administration‐DRAFT report 2015) We plan to update USMP rankings for the DENA park road as more
information is made available or new events occur and to perform a systematic re‐evaluation once
every five years By tracking USMP rankings over time the following performance measures could be
considered by transportation planners and park managers
Establish targets to reduce the overall number of fair or poor ranking sites along the park road
This could represent a total percentage reduction a maximum target number of poorfair sites
or a certain number of poorfair sites per unit distance along the road
Establish targets to reduce the risk at sites of particular concern (see Future Work)
A benefitcost analysis for all geotechnical assets along the transportation corridor could be
undertaken The USMP group is currently working on developing this tool and the effectiveness
of programmed mitigation projects could be measured by tracking costs vs performance
changes in geotechnical assets recorded by the USMP rankings
6
A method for tracking the performance of assets through time to establish a preferred course of
action As an example USMP scores at the site of the October 2013 slide that blocked the road
(Figure 3d) have been on a downward trend since May 2015 because of relative inactivity while
scores at the Pretty Rocks slump (Figure 3a) have remained higher or increased slightly because
of recent activity Establishing trends in USMP scores through time could be useful for
determining appropriate mitigation priority
Future Work
The USMP risk matrix provides a relatively robust assessment of geotechnical assets based on their
current condition and a way to track their performance through time However because of its
deterministic nature it does not directly consider possible or likely future conditions We hope to
address this limitation through the continued development of the geologic risk assessment Completion
of task 3‐5 of the risk assessment will allow us provide data which will help determine the probability of
future events based on geologic conditions and the associated risk based on transportation
infrastructure and human exposure The results of tasks 3‐5 will allow us to assess the potential outlook
of areas of the road based on their probability to experience new events Additionally we will expand
on the results of the USMP to examine high ranking sites in more scientific depth Examples of this may
include drilling bore holes at the Pretty Rocks slump to determine sub‐surface conditions examining
the relative abundance of fine‐grained sediment in debris flow watersheds or repeat GPS surveys to
ascertain motion rates such as are currently ongoing at the Bear CaveMile 45 slump By using all of
these data sets in conjunction we plan to propose specific recommendations and mitigation
considerations for sites of concern based on their current conditions and future outlook
References Cited
Federal Highway Administration 2015 DRAFT‐Unstable Slope Performance Measures for FLMAs using
USMP Ratings
Federal Highway Administration and National Park Service 2015 Comprehensive Memorandum of
Agreement DENA 208813 AB Denali National Park and Preserve ndash Conduct A Hazard Assessment Of
The Denali Park Road Corridor
Landslide Technology and Federal Highway Administration 2014 Geotechnical Asset Management ndash
Unstable Slope Rating Category Descriptions For Federal Land Management Agencies
Stanley D A 2010 Asset Management In A World Of Dirt ndash Emergence of an Underdeveloped Sector of
Transportation Asset Management TR News no 277 p 18‐22
7
Denali National Park and PreserveLong-Range Transportation Plan
Appendix D Current and Future Partner Projects
National Park ServiceUS Department of the Interior
1
1
Memo
To Denali National Park Long Range Transportation Plan Team
From ATKINS Email
Phone 720-841-2956 Date Sep 19 2014 Modified August 28 2017
Ref cc
Subject Possible Foreseeable ProjectsPlans near Denali National Park
Matanuska Susitna Borough LRTP
Source httpwwwmatsugovusplanslrtp
This transportation plan assesses growth in the Mat-Su Borough over the next 20 years and
identifies the key elements of the Boroughrsquos future transportation system that will be needed to
serve its growing communities The transportation plan will help the residents develop a Borough
that is a pleasure to live in with public infrastructure that supports their daily lives
Alaska Stand Alone Pipeline (ASAP)
Source httpwwwasapeiscom
The Alaska Stand Alone Pipeline (ASAP) Project is a 727-mile long 36-inch-diameter natural gas
transmission mainline extending from the GCF near Prudhoe Bay south to a connection with the
existing ENSTAR pipeline system in the Matanuska-Susitna Borough A 29-mile-long 12-inch-
diameter lateral pipeline will connect the mainline to Fairbanks The proposed pipeline will be
buried except at possible fault crossings elevated bridge stream crossings pigging facilities and
block valve locations
The pipeline will bypass Denali National Park and Preserve to the east and will then generally
parallel the Parks Highway corridor to Willow continuing south to its connection into ENSTARs
distribution system at MP 39 of the Beluga Pipeline southwest of Big Lake
The Alaska District US Army Corps of Engineers (Corps) has been designated the lead federal
agency and the US Bureau of Land Management (BLM) National Park Service (NPS) US
Environmental Protection Agency (EPA) US Fish and Wildlife Service (USFWS) US
Department of Transportation Pipeline and Hazardous Materials Safety Administration (PHMSA)
and the Alaska Department of Natural Resources State Pipeline Coordinators Office (SPCO) are
participating as cooperating agencies in the Supplemental Environmental Impact Statement (SEIS)
development process
2
2
Memo
Alaska LNG project
Source httpwwwarcticgasgovalaska-lng-project
The Alaska LNG export project would be among the worldrsquos largest natural gas-development
projects The project is in the pre-front-end engineering and design phase or pre-FEED The
project consists of constructing a 58-mile pipeline from Point Thomson gas field to Prudhoe Bay
and 800-mile pipeline from Prudhoe Bay to Nikiski
DOT Parks Highway Projects
Source httpdotalaskagovparks2014
The Alaska Department of Transportation and Public Facilities is performing road construction on
the Parks Highway during the construction season Work includes turn lanes passing lanes re-
surfacing bridge repairs
3
3
Memo
ADOTampPF Area Plans
Source httpwwwdotalaskagovstwdplngareaplansarea_regionalindexshtml
These are regional multi-modal transportation plans developed for specific areas of the state
designed to address movement between communities in the region and from the region to points
beyond Each of these plans incorporates economic modeling to evaluate potential projects and
prioritize them to best meet state and regional goals Denali National Park is partially included in
the Interior Alaska Transportation Planning Area The most recent plan for this area was adopted
in 2010 The plan includes transportation impacts to topic areas that include
bull Gas Pipeline
bull Mineral Development
bull Military Training
bull Railroad Development
bull Tourism
4
4
Memo The Plan examines potential impacts of these and other developments to highways rail aviation
and local community roads and although the plan did not fiscally constrain priority projects
several projects were identified as short-term capital improvement needs Among these projects
were recommendations for improvements on the George Parks Highway in the area of Denali
National Park This project as described by the plan includes passing lanes from MP 113 to MP
163 for an estimated cost of $15 million
Alaska Railroad ndash Healy Canyon
Source httpalaskarailroadcomPortals6pdfprojects2012_01_04_Healy_Canyon_Stabilization_FS_PROJpdf
Work is being proposed in Healy Canyon between Denali Park Station at Milepost (MP) 348 and Healy (MP 358) The Alaska Railroad has proposed projects to
bull Stabilize the track bed (ongoing)
bull Control the rock fall problems
bull ldquoDaylightrdquo (remove the top) Moody Tunnel at MP 3536 (complete)
bull Realign tracks around Garner Tunnel (complete)
bull Realign the tracks to enhance safety at MP 3536 (Moody Tunnel) and MP 357 (complete)
Proposed Susitna-Watana Dam
Source httpwwwsusitna-watanahydroorgprojectproject-description
Susitna-Watana Hydro could be a large hydro project on the Susitna River upstream of Denali
National Park This project would provide long-term stable power for generations of Alaskans and
have economic impacts on the area The project would generate 2800000 MWh of annual
energy once it comes online in 2024 The installed capacity is 600 megawatts (MW)
Environmental studies are currently underway
DOT Mile 231 Proposed Pedestrian Project
Source httpawsstateakusOnlinePublicNoticesNoticesViewaspxid=173914
The project scope includes constructing a new pedestrian bridge across the Nenana River trail
connections a rest area and intersection improvements Conceptual designs preliminary
engineering and environmental studies are currently underway
Other Area Energy Projects (Wind Coal Natural Gas exploration)
Eva Creek Wind Project Eva Creek is the largest wind project in Alaska at 25-megawatts It is
located 14 miles from Healy at the top of the 10-mile Ferry mining road
Usibelli Coal Mine Exploration License Plan of Operations Usibelli Coal Mine Inc has
submitted a request to carry out a Coalbed Methane drilling exploration program at a prospect site
approximately seven miles east of the town of Healy The project will consist of a single vertical
coal-bed methane exploratory well drilled inside the exploration license area The exploratory well
5
5
Memo will help determine whether sub-surface coal seams contain sufficient quantities of methane gas to
justify further exploration in the area (Source
httpdogdnralaskagovPermittingDocuments2014UsibelliUsibelli_LOCI_14_002_Drilling_at_H
ealy_Creek_Propect_Noticepdf)
Stampede State Recreation Area There is a potential designation of a Stampede State
Recreation Area west of the Panguingue Creek subdivision In March 2013 Senator
Representative David Guttenberg introduced HB148 in response to requests by the Denali
Borough Assembly
Borough Planning Commissioners are currently working through recommendations for area
management which include details of proposed allowed uses and a plan for land management
(Source httpnorthernorgtake-actionstampede-state-recreation-area-1)
Air Traffic ndash Overflights council
Source httpwwwnpsgovdenaparkmgmtaoachtm
The Denali National Park and Preserve Aircraft Overflights Advisory was established in 2007 to
consider resource conflicts between aircraft tours and park visitors on the ground The group is
charged with advising the National Park Service (NPS) on ways to mitigate (reduce) sound impacts
from aircraft flights over the park develop voluntary measures for assuring the safety of
passengers pilots and mountaineers and achieve desired resource conditions at Denali as
outlined in the Backcountry Management Plan (2006)
6
Denali National Park and PreserveLong-Range Transportation Plan
Appendix EPark Transportation Investment Needs Analysis
National Park ServiceUS Department of the Interior
Appendix E Denali National Park and Preserve Park Transportation
Investment Needs Analysis
Denver Service Center Planning Division | National Park Service | March 2017
1
Contents ABSTRACT 2
INTRODUCTION 2
PATINA DESIGN 3
OVERVIEW 3
VEHICLE MANAGEMENT PLAN 3
VECTOR ANALYSIS 4
DATA COLLECTION 4
TRANSPORTATION NETWORK 4
ASSET METRICS 5
HIGH RISK 5
INVESTMENT RANKING 6
GOAL AREAS 7
METHODOLOGY 8
DATA PREP 8
LAYER WEIGHTING 9
COMPOSITE ANALYSIS STEPS 10
SELECTED RESULTS 14
OUTPUTS 14
ROAD SEGMENT FINDINGS 16
Motorized Paved Zone 16
Wildlife Viewing Subzone 1 17
Wildlife Viewing Subzone 2 18
Wildlife Viewing Subzone 3 19
Wildlife Viewing Subzone 4 20
DISCUSSION 20
INTERNAL WEIGHTING 21
SKEWED DATA 21
SPATIAL SPREAD OF DATA 21
NEXT STEPS 22
2
ABSTRACT A Park Transportation Investment Needs Analysis (PaTINA) was performed in support of the Denali
National Park and Preserve Long Range Transportation Plan The PaTINA spatially models areas of
potential investment need by using a Geographic Information System to overlay geographic data The
data overlays are assigned a weight and added together where they are coincident in space The
resulting model visually depicts areas where multiple complexities occur This is compared with
transportation facility data to inform investment strategies The PaTINA results are shared in an
interactive web mapping environment and may be added to other mapping tools as a map service
INTRODUCTION The Park Transportation Investment Needs Analysis (PaTINA) synthesizes geospatial information to inform transportation planning and investment PaTINA takes into consideration the goals of the National Park Service (NPS) service-wide goals the goals of individual NPS units and the requirements of the Federal Highway Administration The combination of these goals is expressed in the Long Range Transportation Goals PaTINA creates geospatial-based analyses related to these goals and produces high-resolution outcomes that are site specific within the park unit PaTINA models use compiled data sources to create models related to transportation needs and restraints The vision goals and objectives established in the park unitrsquos Long Range Transportation Plan (LRTP) determine the input data for PaTINA As an analysis PaTINA is accomplished by overlaying map themes important to park management within
a Geographic Information System (GIS) and spatially comparing the overlay results to the transportation
network Metrics used by facility managers to rank assets of the transportation network in terms of
needed maintenance are then compared to the PaTINA results The analyses demonstrate where
priority areas may be located and can be compared to financial recommendations of LRTP The resulting
analyses can spatially inform the condition performance assessment needs identification funding
strategies and even funding prioritization
Modeled PaTINA results are shared as map services and presented in an interactive web mapping
application along with park facility and other relevant data The PaTINA process can be repeated with
model inputs and weights adjusted to reflect current park management needs
The PaTINA was originally developed as part of the Golden Gate National Recreation Area LRTP to help identify key areas where a confluence of conditions highlighted the need for investment consideration The recognized utility of the analysis led the Denali National Park and Preserve (Denali or park) LRTP team to request a PaTINA to help identify areas of concern that may not be readily discovered without geospatial tools
3
PATINA DESIGN
OVERVIEW The following are steps used to design create and implement PaTINA for the Denali LRTP At the
beginning stages of the LRTP goals are established for the Park Unit which includes Washington Federal
Highways and the Park Unit input Goal areas for Denali were system optimization resource
protection user experience access climate change and partners Each goal area was assigned
applicable GIS data layers which establish elements of the goal The data layers were given priority
weights depending on their importance on how it affects or is affected by the transportation network
Priority weights were determined with input from Denali park staff specialty experts
Once weights were established spatial analysis was performed to determine the overlap of each input
data layer within each goal area The weights of each input layer were added together where overlap
occurred The overlaying process identified areas where multiple inputs are spatially concurrent as well
as where inputs deemed as a higher prioritymdashmore heavily weighted--occur
The overlay results of each goal area were combined to generate the overall PaTINA composite denoted
as ldquoPotential Need Areasrdquo Throughout the LRTP process additional data themes outside the goal areas
were identified as a need and were categorized into three parts asset metrics high risk and investment
ranking These data were later added to the final web mapping product to compare to the Potential
Need Areas
VEHICLE MANAGEMENT PLAN In 2012 Denali prepared a Vehicle Management Plan (VMP) to evaluate alternatives for managing
vehicle use along the Park Road The preferred alternative of the plan proposed new management
zoning to include additional wildlife viewing subzones According to the VMP these subzones would be
implemented to clarify management objectives necessary to achieve desired conditions within specific
road sections Due to the significance of the segments for management purposes (Figure 1) it was
important to incorporate the sections into the initial design of the Denali PaTINA To do so the PaTINA
was applied independently to each road segment resulting in five separate sets of analyses Wildlife
viewing subzone 2 is split between 2a) from Teklanika River Bridge and the Eielson Visitor Center and
2b) east of Wonder Lake
4
Figure 1 Road segments defined in the Denali Vehicle Management Plan and used as a basis for the PaTINA
VECTOR ANALYSIS Following the methodology of the Golden Gate PaTINA the Denali PaTINA was completed as a vector
analysis Golden Gate was the pilot for the PaTINA effort which led to expectations that the process be
replicable at additional park units Vector analysis also has the added benefit of preserving spatial
geometries and attribution Attribution allows web map users to deconstruct the results to verify inputs
contributing to the composite result
DATA COLLECTION The following sections describe the categories of data that make up PaTINA and are included in the final
product
TRANSPORTATION NETWORK The transportation network for Denali first needed to be defined to create a spatial basis for the overlay
analysis For Denali the transportation network consists of roads trails parking lots railroad and
airstrips Each polyline transportation network features were assigned a width (Table 1) and then
2b
2a
5
buffered to that width to create a polygon input All polygon inputs were merged together to create a
final transportation network data layer
Table 1 Buffers applied to the Denali transportation network
Transportation Feature Width
Roads 11rsquo Trails 8rsquo
Railroad 100rsquo
ASSET METRICS Asset metrics included in the Denali PaTINA show facility condition index (FCI) and optimizer bands The
FCI rates the condition of a facility or asset using a numeric rating system This system reflects the
current replacement value of an asset and its projected cost of repairs Optimizer bands were developed
to divide a parkrsquos asset portfolio into five bands to represent the level of maintenance that each asset
should receive The metrics help staff make informed decisions about the allocation of limited funding
and staff time for maintaining park infrastructure
The FCI and optimizer band data were derived from the facility management software system (FMSS)
Assets in the transportation network data layer were joined together with the FMSS spreadsheet to be
able to show the asset metric information spatially The join was based on the Location ID attribute in
both the spreadsheet and spatial data A number of records in the spatial data were missing Location
IDrsquos so manual matching had to take place This was done by using aerial imagery to identify assets
based off of the FMSS location descriptions Assets that still couldnrsquot be identified through this method
received input from park staff via the web mapping tool by using create new features capability
Create New Features Tool in Web Map Site
The Create New Features tool allows users to generate data within the web map interface The user creates the geometry of the data and can also include information in predefined text boxes that gets added to the feature class attribute table Once the new feature has been created and saved it is automatically stored as a new record in a feature class that sits on a local server This benefits the GIS staff by having quick access to newly created data Because the data is automatically stored users can revisit the web map and see previous created features Geometry and text changes can be made to the feature after it has been created
HIGH RISK In winter of 2016 NPS regional and park staff as well as Federal Highway Administration (FHWA)
conducted a risk assessment workshop for Denali The purpose was to identify risk types and areas to
mitigate risk and provide recommendations to park management Those findings will be included in the
Denali LRTP There were a total of 28 identified risk types that were ranked into prioritization categories
from low to high Because of the importance of understanding where risk occurs and to mitigate future
events it was decided to include this information as spatial data into the PaTINA web map Only the
6
high risk category was added to the analysis due to the significance of these risks on Denalirsquos resources
visitors and staff
In total there were eight high risk types identified only six of which could be mapped Out of the six
remaining risk types three had data available The Create New Feature tool was used by park staff to
generate a data layer identifying locations of gravel production sites but was later omitted by the LRTP
team It was concluded that the site itself is not a risk to the transportation network but rather the
absence of gravel in these pits are The in holder access data was gathered from the NPS Lands
Resources Division to show tracts within Denali Culvert locations were derived from an excel
spreadsheet provided by FHWA ndash Western Federal Lands by plotting XY coordinates Lastly the
unstable slopes data was provided by park staff and was originally generated through FHWA in
collaboration with NPS Table 2 summarizes the risk data included in the PaTINA web map
Table 2 Summary of risk data used in the Denali LRTP
Risk Type Can it be mapped
Is data available
What is the source of the data
Inholder Access yes yes NPS Lands Resources Division
Implementation of LRTP no na
Staff Level Changes no na
Gravel Production Processing or Purchase yes no
Culverts (MampO) yes yes FHWAndash Western Federal Lands
Permafrost degradation yes no
River and Stream Flooding yes no
Unstable Slopes yes yes NPS FHWAndash Western Federal Lands
INVESTMENT RANKING A financial analysis was completed for the Denali LRTP resulting in development of investment
strategies An investment strategy combines goals and objectives of the LRTP agreed upon investments
and other transportation needs and constraints in the current funding environment One investment
strategy category is to Repair and Maintain the Unpaved Portion of the Denali Park Road and focuses on
desired condition targets which change depending on the Park Road segment This strategy aligns with
the VMPrsquos concept that the Park Road is less traveled by visitors farther into the park and those
segments with lower desired conditions can help reserve funding for other transportation asset
priorities
Due to the importance of financial analysis results it was decided to include the information as a spatial
component to PaTINA A table showing current and desired conditions for each segment with associated
milepost numbers was provided by one of the contractors working on the LRTP A GIS layer of mile
markers was used to correlate data from the table and create a new layer representing the financial
analysis Attribute information was added and the layer was symbolized by segment showing highest
priority and lowest priority Table 3 shows current and desired condition information that was
incorporated into the new investment ranking GIS layer These results can easily be compared to other
components such as high risk areas or goal area composites
7
Table 3 Financial analysis data based on mile markers
Mile Post Segment Current
Condition Desired
Condition Annual Needs
Priority Ranking
0 to 15 Entrance area to Savage River Trailhead
na 00 na 5
15 to 32 Savage River Trailhead to Teklanika Bridge
009 109 $013 M 4
32 to 39 Igloo Forest to Sable Pass 013 109 $014 M 4
39 to 43 Sable Pass to East Fork Bridge 013 109 $024 M 4
43 to 47 Polychrome to Plains of Murie 035 245 $074 M 2
47 to 62 Plains of Murie to Stony Overlook 013 149 $047 M 3
62 to 66 Stony Overlook to Eielson 014 149 $018 M 3
66 to 70 Eielson to Grassy Pass 017 325 $ - 2
70 to 88 Grassy Pass to Boundary Pit 012 325 $ - 2
88 to 92 Boundary Pit to Kantishna 0499 449 $012 M 1
GOAL AREAS During the early development of the Denali LRTP team members created six goal areas each with an
associated statement The goal statements represent aspects of the NPS mission and Denali vision
statements to help guide future transportation decisions These goal areas serve as a basis throughout
the LRTP for identifying baseline conditions performance management and implementation Table 4
shows the six goal areas and goal statements
Table 4 Denali LRTP goal statements
Goal Area Goal Statement
Resource Protection Understand and protect Denali NPPrsquos fundamental Park resources and values as they relate to the transportation system
Climate Change Plan for climate change impacts to the Parkrsquos transportation system
User Experience Provide a quality multi-modal Park experience for users
Access Provide safe efficient and appropriate Park access
System Optimization Develop a long-term transportation system to appropriately satisfy current and future Park needs
Partnership Manage formal and informal commercial partnerships to provide a viable transportation system
These goal areas served as a guide for GIS data collection Datasets related to each goal area were
identified collected and formatted as needed for the composite analysis The Partnership goal area is
not included in the PaTINA since no map-able data were identified Future iterations of the Denali
PaTINA may include the Partnership goal area if new data are obtained The System Optimization goal
was also not included in the analysis but rather it was called out separately for comparison in the final
model results This category is referred to as Asset Metrics (described above) and include FMSS-specific
data The purpose of this was to be able to spatially detect and understand the correlation between
FMSS data and the Parkrsquos values stated from the LRTP goal areas In total 26 GIS layers were used as
input layers for the analysis Layers from each goal area were overlaid upon each other so that the goals
8
could be visualized for the LRTP Listed below are the input layers for each of the goal areas used for the
analysis
Resource Protection
bull Sheep Gaps
bull Exotic Species
bull StreamRoad Intersections
bull Vegetation Monitoring Marker
bull Sheep^
bull Moose^
bull Bear^
bull Wolves^
bull Caribou (Aug-Sep)^
bull Caribou (July-Aug)^
bull Caribou (May-June)^
bull Wetlands
bull National Register Structures
bull Historic Districts
User Experience
bull Viewscapes
bull Visitor Services
bull Social Trails
bull Visitor Pattern
bull High Visitor Use Area
Access
bull Safety Areas of Concern
bull Railroad Depot
bull Bus Stops
Climate Change
bull Geohazards
bull Permafrost
^Based on extrapolated observation data reported in the Denali VMP
New data created by park staff for the PaTINA
During the process of collecting data data needs were recognized and collated Identified data gaps
included permafrost degradation river and stream flooding events informal aviation landing areas
congestion hotspots and wildlife patterns To fill certain gaps the Create New Features tool in the web
map was utilized by park staff Layers in the list above with an asterisk represent the ones created by
park staff Other identified data gaps focused on visitor use statistics Examples included dependable
traffic counts visitation numbers by area and visitor numbers on bus types beyond front country area
METHODOLOGY
DATA PREP All input data layers were projected to NAD_1983_Alaska_Albers Point and polyline datasets were
buffered and converted to polygon features and then clipped to the transportation network Figure 2
shows an example of a point layer created by park staff using the Create New Feature tool that was later
buffered and clipped Once the polygon data was created per input layer they were merged together to
create a single polygon layer For example park staff created multiple polylines and points to capture
visitor patterns along the Park Road The polygons were merged together to create a single visitor
pattern input layer under the User Experience goal area
9
Figure 2 Example of Denali staff input used to create data for the PaTINA
LAYER WEIGHTING Within the goal areas each input polygon layer was assigned a value The values ranged from 0 (no
impact) to 05 (lesser impact) to 1 (full impact) and was assigned by park staff Table 5 shows each goal
area and associated weighted values for each road segment The term ldquoimpactrdquo in this setting may refer
to impact the input layer has on the transportation network or conversely impact the transportation
network has on the input layer To align with the VMPrsquos subzones of the Park Road each input layer was
weighted separately for individual road segments Weighted per segment reflects park management
priorities which may vary for a particular input by road segment The High Visitor Use Area input layer is
an example of this where the impact is higher in the front country compared to further west on the Park
Road Therefore the High Visitor Use Area input layer received a higher impact value in the front
country road segment
10
Table 5 Layer input ranks assigned by park staff
RESOURCE PROTECTION GOAL AREA
Motorized Sightseeing
Subzone
Wildlife Viewing
Subzone 1
Wildlife Viewing
Subzone 2a
Wildlife Viewing
Subzone 3
Wildlife Viewing
Subzone 2b
Sheep Gaps 0 05 1 05 0
Exotic Species 1 05 05 05 05
StreamRoad Intersections 1 1 1 05 1
Vegetation Monitoring Marker 0 1 1 05 0
Sheep 05 05 1 0 0
Moose 1 05 05 1 05
Bear 05 05 1 05 05
Wolves 1 05 05 05 05
Caribou (Aug-Sep) 0 0 05 1 0
Caribou (July ndashAug) 0 05 05 1 0
Caribou (May ndash June) 0 0 0 05 0
Wetlands 1 05 1 1 05
National Register Structures 1 1 1 1 1
Historic Districts 1 1 1 1 1
USER EXPERIENCE GOAL AREA
Motorized Sightseeing
Subzone
Wildlife Viewing
Subzone 1
Wildlife Viewing
Subzone 2a
Wildlife Viewing
Subzone 3
Wildlife Viewing
Subzone 2b
Viewscapes 0 05 1 05 0
Visitor Services 1 1 1 1 1
Social Trails 1 1 1 1 1
Visitor Pattern 1 1 0 0 05
High Visitor Use Area 1 05 05 05 05
ACCESS GOAL AREA
Motorized Sightseeing
Subzone
Wildlife Viewing
Subzone 1
Wildlife Viewing
Subzone 2a
Wildlife Viewing
Subzone 3
Wildlife Viewing
Subzone 2b
Safety Areas of Concern 05 0 05 05 0
Railroad Depot 1 0 0 0 0
Bus Stops 1 0 0 0 0
CLIMATE CHANGE GOAL AREA
Motorized Sightseeing
Subzone
Wildlife Viewing
Subzone 1
Wildlife Viewing
Subzone 2a
Wildlife Viewing
Subzone 3
Wildlife Viewing
Subzone 2b
Geohazards 05 05 1 1 05
Permafrost 05 05 1 0 05
COMPOSITE ANALYSIS STEPS 1 Once the input layers were weighted the values were added into new fields in the attribute
table The new field names were abbreviated with each goal area name and input layer number
For example Resource Protectionsheep gaps would read as RP1 since sheep gaps was listed
11
first in the data collection table Another example would be Resource Protectionexotic species
shown as RP2 The following shows goal area abbreviations
a Resource Protection ndash RP
b User Experience ndash UE
c Access ndash AC
d Climate Change ndash CC
2 Within each goal area the input layers were combined with the transportation network layer
using the UNION tool creating a goal area output layer This resulted in the following layers
RP_Union UE_Union AC_Union and CC_Union
3 Using the DELETE tool all fields were deleted except for the five road segment fields This
reduced the file size of the output layer for future geoprocessing steps and faster speeds once
added to the web map
Steps 4-6 refer to only one goal area and one road segment For example Resource Protection
(RP)Motorized Paved Zone (MPZ)
4 A new field called RP_T_MPZ was added to the RP goal area output layer to sum the total
values This was completed by using the FIELD CALCULATOR tool and summing the MPZ value
for each input layer (RP1_MPZ + RP2_MPZ)
5 Due to the goal areas having a different number of inputs the total sum value was normalized
to avoid skewing the outputs to goal areas with more input layers By normalizing the total
values could be shown on a common scale A new field was added and called RP_TN_MPZ Using
the FIELD CALCUALTOR tool the RP_T_MPZ value was divided by the total number of inputs
resulting in a normalized number (RP_T_MPZ14= RP_TN_MPZ)
6 The RP goal area output layer was then clipped to a previously created MPZ road segment layer
(RP_MPZ_Clip)
Steps 1-6 were repeated for each goal area and road segment In total twenty clipped output layers
were created Figure 3 shows steps 1-6 in a flowchart
12
Figure 3 Process diagram for PaTINA steps 1 - 6
Steps 7-9 refer to only the MPZ road segment
7 The next step utilized the UNION tool to union each clipped goal area output layer by road
segment (RP_MPZ_Clip UE_MPZ_Clip AC_MPZ_Clip CC_MPZ_Clip = MPZ_Clip)
8 Once the MPZ_Clip layer was created a new field called All_MPZ was added to sum the total
normalized numbers The FIELD CALCULATOR tool was used and summed each goal areas
normalized number (RP_TN_MPZ + UE_TN_MPZ + AC_TN_MPZ + CC_TN_MPZ = ALL_MPZ)
9 The overall MPZ composite was then symbolized based on the total MPZ normalized values
(ALL_MPZ) and was shown with five classes using Natural Jenks classification The five classes
were symbolized from very low (dark green) low (light green) medium (yellow) high (orange)
to very high (red) which identified potential need areas throughout the transportation network
Figure 4 shows symbolization for the front country area in road segment MPZ
13
Figure 4 Mapped Potential Need Areas for the Motorized Paved Zone
Steps 7-9 shown in Figure 5 were repeated for each road segment In total five segments showed very
low to very high potential need areas
Figure 5 Process diagram for PaTINA steps 7-9
14
SELECTED RESULTS
OUTPUTS The PaTINA analysis resulted in four main output groups which may be viewed individually or compared
to one another These groups are asset metrics high risk areas investment rankings and potential
need areas See the Data Collection section for review of these groups
Figure 6 shows potential need areas against high risk areas located in Wildlife Viewing Subzone 3
segment of the Park Road The results appear to have several high risk areas spatially coincident with
high need areas highlighting locations that may be considered for financial investment Doing so may
help protect park resources and visitor safety
Figure 6 High Risk Areas shown with Potential Need Areas modeled in the PaTINA
15
Figure 7 shows potential need areas against high investment ranking along the Wildlife Viewing Subzone
2 segment of the Park Road The investment ranking displays two sections which are Igloo Forest to
Sable Pass (MP 32 to 39) and Sable Pass to East Fork Bridge (MP 39 to 43) Within the high investment
sections potential needs can be identified for further examination for future investment
Figure 7 Example PaTINA-modeled Potential Needs Areas shown with investment ranking data
16
ROAD SEGMENT FINDINGS
Motorized Paved Zone The motorized paved zone starts at the park entrance at mile post 0 and ends at mile post 149 (Figure
8) In this segment it appears that the greatest amount of very high potential need areas are
concentrated around the Denali Visitor Center and high potential need areas are located just east of
that surrounding the Riley Creek Campground These potential need areas consist of up to twelve input
layers each of which fall within all goal areas Findings also show the Park Headquarters and Savage
River to be potential need areas with values of medium and high
Figure 8 PaTINA-modeled potential need areas for the Motorized Paved Zone segment of the Park Road
17
Wildlife Viewing Subzone 1 The wildlife viewing subzone 1 spans the distance between mile post 149 to mile post 319 (Figure 9)
and includes the Sanctuary River campground and the Teklanika River campground and rest stop The
Teklanika River campground shows the largest very high potential need area Up to twelve input layers
from three of the goal areas cover this segment The access goal is not included Findings also show the
Sanctuary River campground and west of the Primrose Ridge and Mount Margaret rest stop to be a very
high potential need area though the spatial area is smaller compared to the Teklanika River
campground This location is comprised of up to thirteen input layers from all goal areas
Figure 9 PaTINA-modeled potential need areas for the Wildlife Viewing Subzone 1 segment of the Park Road
18
Wildlife Viewing Subzone 2a The wildlife viewing subzone 2a ranges from mile post 319 to mile post 66 (Figure 10) and includes
locations from Igloo Creek campground to Eielson Visitor Center The findings suggest that there are
many high potential need areas along this segment of road The most prominent areas are located
before and after Polychrome Overlook and includes up to ten input layers along this stretch The Eielson
Visitor Center shows very high potential need areas with up to twelve input layers from three goal
areas These findings may suggest future investment at this location due to high use at the visitor center
Figure 10 PaTINA-modeled potential need areas for the Wildlife Viewing Subzone 2 segment of the Park Road
19
Wildlife Viewing Subzone 3 Milepost 66 to mile post 846 is the wildlife viewing subzone 3 segment (Figure 11) which begins east of
the Eielson Visitor Center and goes to the Wonder Lake campground Results show west of the Eielson
visitor center with the greatest concentration of very high potential need areas A majority of this
segment ranges from very low to medium potential need areas until farther west near Wonder Lake
Wonder Lake campground consists of up to ten input layers from three goal areas
Figure 11 PaTINA-modeled potential need areas for the Wildlife Viewing Subzone 3 segment of the Park Road
20
Wildlife Viewing Subzone 2b The wildlife viewing subzone 2b starts at milepost 846 to mile post 920 being the farthest west of all
road segments (Figure 12) The only very high potential need area in this segment is located east of
Kantishna Results display that the very high area has up to 12 input layers from three goal areas The
east side of this area shows high potential need suggesting that this stretch could be identified as an
area for potential future investment
Figure 12 PaTINA-modeled potential need areas for the Wildlife Viewing Subzone 2b segment of the Park Road
DISCUSSION The Park Transportation Investment Needs Analysis (PaTINA) employs standard geospatial methods that can be repeated to reflect changing management goals as well as be applied in different facility management situations and scales The web mapping application deployed with the data allows for frequent review and consultation of the results to inform management decisions
21
Execution of the methods however requires intensive data gathering and formatting Further the
weighting process is currently accomplished in a desktop GIS after subject matter experts are polled for
input weights This process could be improved with tool development in either the desktop environment
or the online web map to streamline how GIS data are included and weighted in the model While the
process in its current state is repeatable in most cases it requires a GIS specialist and a desktop GIS to
complete We foresee improving either the desktop or online tool (or both) to make the process more
accessible and rapid Depending on the data inputs however the overlaying process may still require
extensive data collection and preparation Additionally the overlaying process can be computer
intensive--again depending on the data inputs--and may be prohibitive due to available resources
The data collection process in this analysis identified data needs which are collated separately and listed
above under Goal Areas Acquisition and incorporation of these data may improve the PaTINA results
Visitor use statistics are an especially glaring omission which if obtained will improve future PaTINA
modeling
Seasonal variations in some inputs are not well represented in the analysis Further work may entail
modeling specific seasons to help inform investment strategy throughout the year
INTERNAL WEIGHTING The PaTINA applied to Denali NPampP weighted each input layer uniformly across the spatial extent of the layer However some data contained attributions that could be weighted differently Because the weights were assigned by park staff for each input layer based on the road segments further weighting based on attributes internal to a layer would unnecessarily complicate the composite scoring Future iterations of the model for Denali may consider applying layer attributes to vary weights across the layer instead of applying weights per road segment Alternatively the weights assigned by road segment could be normalized against the attribute weighting but the statistical validity of this needs to be explored
SKEWED DATA The initial run of the PaTINA model showed skewed results within the front country segment NPS staff
clarified that specific locations within the front country segment should have been identified as very
high or high potential need areas instead of low and medium rankings The main concern was around
the Denali Visitor Center and vicinity that included the railroad depot trailheads and visitor amenities
As a known high visitor use area the visitor center and surroundings should be considered a high
potential for investment The data and associated weights were examined and it was concluded that the
user experience goal area was lacking desirable input layers to validate higher rankings Once the
additional input layers were identified they were added to the next run model and results showed
important locations such as the Denali Visitor Center with higher rankings
SPATIAL SPREAD OF DATA Input layers across the goal areas differ spatially within the road segments The resource protection goal
area is the only goal area in which input layers coincide with the transportation network within all five
road segments User experience and climate change goal areas are within four segments with no data in
22
the last segment wildlife viewing subzone 4 The access goal area contains data only within the first
segment motorized sightseeing subzone Although input weights are normalized for each goal area the
spatial spread of the data influences the results where more inputs are occurring
The results show classes of potential need areas throughout the entire transportation network due to
some input layers completely overlaying it These layers are exotic species each of the mammal layer
inputs excepting sheep and permafrost Due to the spatial spread of these data every area of the
transportation network can be classified as at some level of potential need for investment
NEXT STEPS The data and web mapping interface will require maintenance as updated or new data and web
mapping tools become available We see the initial release of the web map for the Denali PaTINA as a
first step toward a more comprehensive tool to aid the park in investment decision making As noted
above stream-lining the weighting and model execution processes would improve the overall utility of
the PaTINA
Additional development of the PaTINA web map may include incorporation of other map services such
as the NPS Road Inventory Program and data services from the Inventory and Monitoring network
Conversely the base PaTINA results can be added to other web map applications that may focus on
other issues
Finally development of instructional materials and accompanying training sessions would bolster and
help maintain the utility of the PaTINA results and its application to park management
National Park Service US Department of the Interior
Denali National Park and Preserve Long-Range Transportation Plan
Appendix F Denali Funding Plan
Denali National Park and Preserve Financial Analysis Technical Report ndash FINAL DRAFT
Introduction This report discusses the transportation funding aspects of the Denali National Park and Preserversquos first Long Range Transportation Plan It includes a retrospective of transportation funding from 2006-2013 a projection of funds expected to be available for transportation during the planrsquos twenty year planning horizon and a summation of the resources necessary to return transportation facilities at Denali National Park and Preserve (Denali NPP) to ideal conditions As is true for all of the National Park Service (NPS) the amount of funding that is needed for transportation at Denali NPP exceeds the amount that will be available in coming years and so this report includes an investment strategy that funds the highest priority needs
The discussion must begin with two of the NPSrsquos guiding transportation investment principles and Denali NPPrsquos primary existing transportation document the Vehicle Management Plan (VMP) It then discusses Denali NPPrsquos place in Alaska Region transportation funding and the expected increase in funding needs due to climate change impacts The middle section of this report discusses the LRTP methodology in general and how the Denali NPP LRTP methodology differs from those used for other NPS LRTPs There is also a discussion of historical forecasted and needed transportation funding that collectively make up the baseline transportation funding report for Denali NPP
This report concludes with a discussion of the funding strategies which were evaluated for the Denali NPP LRTP and how the final strategy was selected The investment strategy prioritizes operations and maintenance the rehabilitation of the paved section of the Park Road funds the unpaved sections of the Park Road to achieve management priorities and provides approximately $1m per year to address other transportation priorities The Denali NPP transportation investment strategy is expressed with respect to each of the four LRTP planning scenarios to guide park management decisions during times when visitation is increasing or decreasing and when funding (or stakeholder support) is higher or lower than average Funding shortfalls means that the condition of all transportation assets cannot be improved but progress can be made to address the highest priorities
Funding Denali Transportation Facilities
Capital Investment Strategy and Total Cost of Facility Ownership As a best practice and formal policy the NPS incorporates strategic facility planning into its asset management decision-making processes including LRTPs Two fundamental concepts the NPS Capital Investment Strategy (CIS) and Total Cost of Facility Ownership (TCFO) underlie those best practices and are drivers of the investment planning and decision-making reflected in the Denali LRTP
The NPS Capital Investment Strategy The CIS is an NPS strategy for prioritizing project investment to ensure effective and responsible project funding The CIS includes a scoring tool that decision-makers at all levels of the NPS have available to them to inform project investments and other asset management needs
The purpose of the CIS is to help prioritize investments focus on mission-critical assets manage operations and maintenance and ensure that the greatest impact can be made with available capital and operational funds The CIS uses a scoring tool to evaluate projects on a number of different criteria Financial Sustainability Visitor Experience Resource Protection and Health amp Safety The four categories are weighted using a predefined algorithm to arrive at an overall project score Projects can then be compared by score as needed in theory the greater the score the higher the priority The scoring strategy supports an asset management approach that emphasizes maintaining key assets and reducing the estimated value of deferred maintenance cost against those key assets
Some of the key objectives in the Financial Sustainability strategy are to build only what can be maintained right-size the asset portfolio reduce liabilities reduce resource consumption to promote sustainability and eliminate non-essential development in order to emphasize the essential natural and cultural experience The Visitor Experience strategy includes investment in assets or resources that enable recreation and serve as gateways to park units contact stations and interpretive assets The Resource
DenaliLong Range Transportation PlanFinancialTechReportndashFINAL DRAFT 1
Protection strategy focuses on those historic cultural and natural resources that the NPS is tasked with protecting and preserving Such tasks supported by the CIS could include preservation repair and restoration of assets Finally the Health amp Safety strategy places an emphasis on correcting unsafe or hazardous conditions within park units that pose a threat to visitors or staff Different parts of the Denali LRTP address these four strategies which are used by fund program managers to allocate limited funding
Total Cost of Facility Ownership Applying the concept of Total Cost of Facility Ownership (TCFO) is considered by the NPS to be a vital part of a financially sustainable infrastructure strategy and practice to truly address transportation asset management1 It aligns closely with the intentions behind the CIS especially the CIS Financial Sustainability component TCFO is the full life-cycle cost of constructing maintaining and operating an asset until it needs replacement This concept recognizes that assets require investment throughout their service lives until they need replacement or disposition and that preventive maintenance and facility operations activities are key to minimizing long-term costs and optimizing the life of said assets Implementation of the TCFO concept involves a shift-away from a ldquojust fix itrdquo or ldquorun to failurerdquo mentality to more holistic planning making cost estimates and decisions that consider not just the deferred maintenance (DM) of an asset but the ongoing OampM need over its service life need for replacement and ultimately disposition
The Denali LRTP team took the concepts inherent to the CIS and TCFO and embedded them into all of its LRTP analyses and planning activities Consequently the resulting investment strategy selected by Denali NPP staff is consistent with the approaches and practices used across the NPS to develop for example the National LRTP and other unit or regional LRTPs
The Denali Park Road and the Vehicle Management Plan Denali NPP is one of the most visited National Park Service units in Alaska and the Denali Park Road is the means for the majority of visitors who wish to traverse deep into the interior by any mode motorized or otherwise For many visitors it is the most readily accessible transportation corridor for them to experience the Alaska wilderness and for some it is their only option Denali NPP is currently several years into the implementation of its VMP the culmination of an intensive planning effort to balance the needs of the parkrsquos natural resources with high visitor demand The Denali LRTP is consistent with the recommendations in the VMP
Generally the VMP recommends limiting vehicle traffic on the Denali Park Road in order to reduce traffic impacts on natural and cultural resources The VMP has a ldquotelescopingrdquo approach where visitor activity is highest and associated development is most extensive in the paved entrance area of the park and declines and lessens respectively as the Park Road heads west As shown later in the section on Funding Strategies the Denali LRTP reflects this by realigning maintenance and rehabilitation investments along the Park Road to concentrate on the areas of highest visitor activity and most extensive development
Funding Trends The Federal Lands Transportation Program in the NPS Alaska Region The Federal Lands Transportation Program (FLTP) is the single largest source of transportation funding for the National Park Service and other Federal land management agencies Project funding decisions are made at the regional level following national guidelines The FLTP at a national scale has recently been reauthorized at a higher funding level than analyzed in this plan However interim program guidance suggests that the majority of the increase will be reserved for nationally significant major projects with only a small increase to regional allocations
Denali NPP has historically been the largest recipient of FLTP funding in Alaska in part because 20 of the Regionrsquos 27 miles of paved roads are within Denali NPP The unpaved Park Road may also be funded by FLTP NPS regional staff indicate that Denali NPP has in the past received all funding from the program by default unless another NPS Alaska Region park unit has eligible needs (which is rare) at which point that project from another park unit moves to the top of the regional FLTP program This means that FLTP will likely be a sustainable funding source for major investments at Denali NPP into the future The next three years of FLTP investment at Denali will be primarily used to rehabilitate the 15 mile paved section of the Park Road from the park entrance to the Savage River checkpoint
1 For example reference ldquoMemorandum Guidance for Addressing Facilities in Planning Documentsrdquo Associate Director Park Planning Facilities and Lands
National Park Service US Department of the Interior January 4 2016
DenaliLong Range Transportation PlanFinancialTechReportndashFINALDRAFT 2
Climate Change and Geotechnical Hazards As explained elsewhere in the LRTP current research indicates climate change is dramatically affecting transportation facilities across Alaska The impacts of climate change relevant to Denali NPPrsquos transportation system include thawing permafrost unstable slopes a lengthening shoulder season and other change indicators Most of these changes will result in higher costs to operate and maintain Denali NPPrsquos transportation network which will further stress already limited funding
Monitoring and evaluation of climate change impacts is an ongoing need and a recommendation of this LRTP Tracking threats and hazards to the transportation system such as unstable slopes requires funding for specialized equipment and the technicians and scientists who collect and analyze the data Funding updates to hydrology models and monitoring permafrost thawing are other near-term relatively inexpensive data needs that can help avoid disastrous impacts over the medium to long term Denali NPP has initiated the effort but funding has not been identified for developing specific plans for how to adapt the transportation system in the park to these expected impacts
In the near term a number of susceptible areas along the Park Road will likely encounter more frequent closures due to intermittent landslides flooding or debris flows with each requiring cleanup and reopening The future impacts of one of the effects of climate change increasing precipitation in the Denali Borough region can already be previewed during excessively wet years 2016 was a particularly wet year and staff were faced with unstable slopes and more frequent and more severe debris flows Beyond the cost of cleaning up after these road closures there are short-term disaster management tasks for which Denali must be ready ndash evacuation or care of visitors staff users and inholders on the far side of an interruption
Some dedicated funding sources are available for recovery costs such as NPS Emergency Storm amp Flood Damage and FHWArsquos Emergency Relief for Federally Owned Roads (ERFO) These programs have limited budgets and will be increasingly strained in an era of continued climate change impacts not just in Denali NPP but across the National Park Service These funding sources are currently limited to recovery costs only and cannot be used for monitoring or preventive work that can anticipate and avoid a future event such as by stabilizing slopes or realigning a road
There are several segments of the Park Road and its associated bridges and structures that may become physically or financially untenable in the next few decades There may come a time when the park will need to consider decommissioning rerouting andor relocating these facilities These costs are not yet known but will likely far exceed Denalirsquos typical past annual funding and may require special major project funding US Department of Transportation (DOT) discretionary grants such as the (unfunded) Nationally Significant Federals Lands and Tribal Projects program or Transportation Investments Generating Economic Recovery (TIGER) are possible sources as is the NPS Line Item Construction program However because these needs are not yet quantified and because they are beyond the capacity of the current funding programs to address the costs of fully adapting the transportation system to climate change are not included in the Denali LRTP financial analysis
Denali LRTP Funding Baseline Financial Analysis Methodology The financial analysis methodology for the Denali LRTP is based on the data and methods first developed for the NPS National LRTP (NLRTP) A much more detailed technical summary is available for the NLRTP and generally applicable to the Denali LRTP but this section will cover the basic steps as well as deviations used to adapt it to the unit level
Historical Investments Establishing a financial baseline of the historical average annual level of regional transportation spending provides a foundation for forecasting the
Annual transportation investments at Denali likely future available funding levels which can be anticipated for Denali NPP averaged $923 M per year from 2006-
NPPrsquos transportation facilities This is important information for developing a 2013 from all funding sources combined fiscally-constrained LRTP The LRTP team analyzed all of the fund sources that had been used for transportation investments at Denali NPP from fiscal year (FY) 2006 through FY 2013 These results provide a vital context for developing the Denali LRTP investment strategy
DenaliLong Range Transportation PlanFinancialTechReportndashFINALDRAFT 3
The LRTP team estimates that approximately $775 M per year will be available to Denali NPP for transportation purposes over the next six years
The financial data was extracted from various financial and project management data tracking systems2 The LRTP team
identified historical expenditures awards and authorizations for transportation assets
adjusted those prior year dollar values to equivalent 2014 values using GDP inflation factors and
calculated an annualized average transportation funding expenditure rate for the period FY 2006 ndash FY 2013
This data was initially prepared by the National LRTP team and then reviewed by the Denali LRTP team to remove any anomalies To simplify reporting the dataset was consolidated coded and grouped by funding authorizations funding programs work types and asset types All identifiable American Recovery and Reinvestment Act (ARRA) investments a one-time extra-ordinary funding source were removed from this analysis A detailed technical methodology document is available from the NLRTP effort
Because the data only includes transportation expenditures made by the National Park Service it does not include transportation
each funding source that Denali NPP has recently used for transportation It
funding and support with an increase in visitation) or ldquoSurplus of Moneyrdquo scenario (increased funding and support with a decrease in visitation) when compared to the historical average However for the purposes of the investment strategy in this plan the funding forecast is considered to be at the center of our ldquoManagement Strategies of no Regretrdquo - those actions that make sense given a normal variation in expected support funding and visitation levels
The Denali LRTP team leveraged the approach applied in the development of the NPS National LRTP to forecast anticipated funding availability for transportation investments in the near future There were two main sources of forecasting information
The NPS budget office The Budget Office conducts forecast exercises servicewide and with individual units The Budget Office suggested the LRTP program assume a one-time reduction to Title 54 (DOI) Non-Fee program fund sources of three percent for ONPS and Cyclic Maintenance programs in the NPS National LRTP The DENA LRTP forecast was based on a combination of actual funding program investment plans where possible and the three percent cut when it wasnrsquot The three percent reduction only applied to programs for which the Denali LRTP project team did not have access to an investment plan (eg Operational Base)
Regional Funding Programs The Denali LRTP project team consulted several regional-level program plans to acquire information on planned investment levels Title 54 Non-Fee programs for Cyclic Maintenance RepairRehabilitation and Line Item Construction Title 16 54 Fee programs for Recreation Fee Transportation Fee and Concession Franchise
investments by third parties The parkrsquos partners such as the Alaska Railroad bus concessioners Denali Borough and the Alaska Department of Transportation and Public Facilities (ADOTampPF) all fund transportation work that helps visitors employees inholders and freight carriers access the park However these investments are not accounted for in this analysis because these data do not enter NPS financial data systems
Forecasted Transportation Funding This section documents the Denali NPP financial forecast for transportation based on anticipated future funding levels that can be reasonably assumed to be available The forecast of available funding provides the principal financial constraint against which future investment plans must be prioritized and represents the result of the most likely funding scenario for
does not include a forecast for work done by other parties such as the State of Alaska or Denali Borough that may benefit Denali NPP and it also doesnrsquot include any unforeseen additional funding which may result in a ldquoPopular Parkrdquo scenario (increased
Fees and the Title 23 Federal Lands Transportation Program These forecasts replaced the National LRTP-style (ie three percent reduction) forecasts for these programs as they provide more certainty than broad program-level authorizations and appropriation amounts
The elimination of the Paul S Sarbanes Transit in the Parks Program (TRIP) is another factor to note in the forecast but the only analysis needed is to not project any future grant awards from this program Denali made use of TRIP in the past but will need to seek other funding sources to fund future transit and trails projects This is also true of various grant programs formerly used by many parks but not Denali NPP such as Scenic Byways or the Public Lands Highway Discretionary Program
2 Systems used included the NPS Administrative Financial System (ie AFS Versions 3 and 4) and the joint Federal Highway Administration (FHWA)NPS Park Roads and Parkways Transportation Allocation and Tracking System aka PTATS
DenaliLong Range Transportation PlanFinancialTechReportndashFINALDRAFT 4
Unfortunately transportation funding for Denali NPP is expected to decline unless additional funding sources are found or funds are redirected from other critical areas The declining funding environment coupled with historically high visitation may result in a ldquoLosing Groundrdquo scenario (decreased funding and support with an increase in visitation) when compared with historical averages These conditions are not dissimilar from recent years (eg 2013-2015)
Transportation Investment Needs Investment needs are defined in this plan as the amount of funding required to bring transportation assets to good condition and sustain them at that level Investment needs also include costs to address programmatic needs such as code compliance structural fire and accessibility Other goal area needs such as resource protection may overlap with asset management (TCFO) needs or may be additional potentially unfunded requirements
The LRTP team estimated an annual need of $1242 M to return the Denali NPP transportation system to good condition and keep it there over six years
The Denali LRTP used a similar methodology as the National LRTP and other Regional LRTPs using needs data from the best available data system or report that covers a particular type of transportation facility and type of work However many of the reports and systems available at the regional or national level do not apply to individual parks The principal difference between the needs in the Denali LRTP is the use of automated systems The data sources used for the Denali LRTP are
Reoptimization File OampM needs for all facilities except the unpaved Park Road
2013 Alaska Region Unpaved Road Analysis (pilot) Detailed analysis for the unpaved Park Road
Facility Management Software System (FMSS) Component renewal and programmatic needs
Project Management Information System (PMIS) Capital investment needs planning naturalcultural resources
National list of megaprojects Paved Park Road repair project and replacement of the Toklat River Bridge
Differences between the needs sources such as timespans and prioritization systems were reconciled in order to create a single set of transportation facility needs for Denali NPP Park staff also reviewed the needs data and removed several projects that were already underway or would be accomplished through partners rather than by the park At $1242 M per year the estimated annual transportation investments needs exceed the annual transportation funding amount by $467 M per year
Transportation Funding for Denali NPP This section discusses the current and near future transportation funding outlook for Denali NPP It covers where funds have come from and how they have been used in terms of what type of transportation facility was funded what type of work was funded and how transportation funding is prioritized
Investments by funding source From 2006-2013 the National Park Service as a whole used more than 60 different funding program and accounts to fund transportation activities but only ten programs funded investments at Denali NPP Table 1 below shows how much each funding program provided in the past how much it is expected to provide in the future and how much would be needed from each funding program to cover Denalirsquos total transportation need each year if past investment patterns were continued
DenaliLong Range Transportation PlanFinancialTechReportndashFINALDRAFT 5
Table 1 Denali NPP Transportation Investments and Needs by Funding Source (in millions of 2013 $)
Investments by funding source
Historical Average Annual Investment
Forecasted Annual Average Investment
Estimated Annual Needs
Title 54 Non‐Fee $175 M $101 M $335 M
Cyclic Maintenance $063 M $004 M $001 M Line Item Construction $034 M $032 M $007 M Operational Base $064 M $055 M $270 M Other NPS Programs $007 M $007 M $019 M
RepairRehab $007 M $002 M $039 M
Title 54 Title 16 Fee $134 M $211 M $261 M
Concessions Franchise Fees $067 M $144 M $051 M
Recreation Fee $067 M $067 M $210 M
Title 23 $601 M $462 M $586 M
FLTP $601 M $462 M $586 M
OtherExternal $014 M $001 M $060 M
FTA TRIPATPPL $012 M ‐‐ ‐‐
Reimbursable Agreements $001 M $001 M $060 M
Grand Total $923 M $775 M $1242 M
Each of these funding programs have a different legislative authorization and project eligibility criteria Title 54 programs are those authorized by Title 54 of the US Code (National Park Service-specific programs) Title 16 includes other relevant Department of the Interior programs (ie Recreation Fee Program) Title 23 includes programs overseen by the Federal Highway Administration and the ldquoOtherExternalrdquo category includes other funding sources such as the discontinued TRIP program as well as reimbursable agreements donations partnerships and other less common sources
Investments by Facility Type
Denali NPP maintains a diverse system of transportation facilities including paved and unpaved roads bridges paved and unpaved transportation trails transit facilities developed airstrips as well as support infrastructure such as a materials (gravel) quarry Table 2 below shows historical investments forecasted investments and the estimated annual investment needs for each of the parkrsquos transportation facility types
Of all historical investments in transportation at Denali NPP in the recent past about 55 went to the Park Road and associated structures and 18 supported parkwide operations that include the Park Road Less than a third was used for separate transportation facilities such as trails and access roads Park Road funding was oriented to the unpaved segments that require frequent repair work to remain in even fair condition given the extreme conditions and heavy vehicle traffic in Denali NPP Recent investments in several difficult sections in the western end of the Park Road helped restore user comfort and safety
DenaliLong Range Transportation PlanFinancialTechReportndashFINALDRAFT 6
Table 2 Denali NPP Transportation Investments and Needs by Asset Type (in millions of 2013 dollars)
Historical Forecasted Average Annual
Average Annual
Estimated Annual
Asset Type Unpaved Roads
Road Bridges
Trails and Transit
Investment $386 M
$184 M
$147 M
Investment $235 M
$042 M
$066 M
Needs $527 M
$135 M
$137 M
Paved Roads $144 M $291 M $297 M
Other3 $051 M $053 M $066 M
Parking $011 M $089 M $081 M
Grand Total $923 M $775 M $1242 M
Historical Forecasted Average Average Estimated Annual Annual Annual
Lifecycle Stage Investment Investment Needs Planning and Administration4 $058 M $057 M
Capital Investment $134 M $259 M $130 M
Operations and Preventive Maintenance $045 M $048 M $186 M
Recurring Maintenance $142 M $083 M $374 M
Component Renewal $527 M $259 M $508 M
Grand Total $923 M $775 M $1242 M
Denali NPPrsquos greatest area of transportation investment need is in heavy repair and rehabilitation work similar to much of the rest of the National Park Service Insufficient funding often leads to smaller routine maintenance work being deferred which causes transportation facilities to fall out of a state of good repair Other significant needs at the park include annual operations and maintenance of transportation facilities and making improvements to culverts that provide for fish passage and building an aircraft hangar
Note that some categories such as capital investment show ldquosurplusesrdquo where more funds are forecasted for investment than are needed This is the result of project programming where several capital investment projects are scheduled for near-term
Investments by Asset Lifecycle stage As discussed in the section on Total Cost of Facility Ownership different types of work are needed at different points in a transportation facilityrsquos lifespan from planning through to rehabilitation or disposition Table 3 below shows historical and forecasted annual investments as well as estimated annual investment needs for each lifecycle stage for all asset types combined
Table 3 Average Annual Investments by Lifecycle Stage (in millions of 2013 dollars)
construction in 2016-2021 whereas the needs represent the average annual needs over twenty years
3 Other category includes aviation buildings that support transportation equipment and multimodal facilities Trails and Transit notably excludes investments and OampM spending made by the transit contractors who operate within Denali NPP but does include Denalirsquos own investment in bus transit facilities such as buildings lots and experimental hybrid buses 4 Routine planning and administration needs are not included in NPS facilities management data systems but can be assumed to continue at historical levels Additional unquantified planning needs are likely in the LRTPrsquos horizon including work in the parkrsquos entrance area coordination with private shuttle services and the Alaska Railroad and transportation planning to maintain park operations in the face of climate change impacts
DenaliLong Range Transportation PlanFinancialTechReportndashFINALDRAFT 7
Priority Estimated Annual Optimizer Band Equivalent Transportation Needs
Highest Priority $377 M Band 1 High Priority $584 M Band 2 Other Priority $281 M Bands 3 4 5
Programmatic Needs Some of the lifecycle stage needs are also considered programmatic needs for transportation facilities at Denali NPP Programmatic needs include work necessary to meet standards set by safety accessibility environmental and fire safety requirements It is generally analogous to code compliance work that would be the responsibility of a facilities manager or an architect hired by a private business
Figure 1 summarizes estimated programmatic needs for the Denali NPP transportation asset portfolio which total less than $300000 Transportation facilities generally have relatively small programmatic needs compared to facilities such as visitor centers housing and offices Although not broken out in the historical and forecast data these types of projects are included in the NPS Facility Management Software System (FMSS) as needs Denali NPPrsquos programmatic needs are included in the overall $1242 M per year needs as capital investment or component renewal needs They are classified as capital investment if plans are to proactively address them as individual projects or as component renewal when addressed through a rehabilitation project that focuses on a low condition rating
Figure 1 Denali NPP Transportation Programmatic Needs
Investments by Asset Priority The final classification for investments is what priority of assets they were used to build maintain or repair NPS financial and asset management systems do not support this analysis for the historical or forecast data Each future investment need at Denali NPP is associated with the priority of the asset or the project itself this is shared below in Table 4 For the purposes of this plan Highest Priority is generally defined as Optimizer Band 1 High Priority is defined as Optimizer Band 2 Optimizer bands 3-5 are defined as ldquoother priorityrdquo Although they are not banded as such critical Park Road work is labeled as Highest Priority consistent with the priorities discussed during the investment strategy section later in this report
Table 4 Estimated Annual Needs by Priority
Denali NPP differs from other National Parks and the NPS as a whole due to the relatively low proportion of the total need in the highest
DenaliLongRangeTransportation PlanFinancialTechReportndashFINALDRAFT 8
priority need category Many transportation facilities in Denali NPP have been categorized in optimizer bands 2-5 This reflects the values laid out in Denali NPPrsquos Foundation Statement that place a high priority on investment in resource protection science and other portfolio areas ahead of transportation and broader visitor use needs As a result the park is able to cover its entire highest priority transportation needs given current funding In fact the $775 M per year in forecasted funding is enough to cover 80 of the highest and high priority transportation needs combined However there are still high priority transportation needs that will remain unmet unless additional funding is found and longer-term and lower-priority needs that cannot be met with forecasted funding
Investment Strategies The final step of the financial planning process for NPS LRTP development is the formulation of an investment strategy It is a synthesis of the planrsquos goals and objectives already formulated projects and other transportation-related needs and the reality of the constraints that exist in the current funding environment This section of the report describes the process used by the Denali LRTP team to identify several potential investment strategies including the strategy selected by Denali NPP staff for the Denali LRTP It also discusses potential alternatives which park management may consider if future funding or visitation deviates significantly from the forecast referencing the planning scenarios used in the development of the Denali LRTP
Methodology The key to understanding the funding strategy process is that funding in a constrained environment is a zero-sum game All investment strategies make use of the same $78 M annual funding amount that is forecasted for the near future Because transportation needs exceed this amount and because moving funds from other purposes deprives those projects of needed funding all investment strategies shift funds from one set of priorities to another The OampM strategy option shown in Table 5 for example focuses on staying current on annual operations and preventive maintenance work at the expense of larger repair projects
Unlike the plans for the National Capital Southeast Midwest Regions and the NPS as a whole the Denali LRTP used a single modeling tool to model the results of the different funding strategies on the Denali NPP transportation system A deferred maintenance (DM) FMSS-based tool was modified by a contractor (Booz Alan Hamilton) to work at the unit level and take into account park specific facilities such as the unpaved Park Road This tool uses extracts from FMSS to estimate Facility Condition Index (FCI) and DM outcomes given a known annual funding level The FCI outcomes reported for this effort are lsquoAdjusted FCIrsquo which includes programmatic needs and an anticipated 35 cost markup in addition to the ldquorawrdquo DM normally used in calculation of the FCI
Strategy Development Process
Methodology and Initial Strategy Concepts The team held several workshops and follow-up discussions with NPS stakeholders and partners to identify candidate strategies and to select the Denali NPP LRTP Investment Strategy (p 12) Internal NPS stakeholders included Denali NPP staff Alaska Region staff and the Washington Support Office (WASO) Partner input included expertise from FHWA Western Federal Lands Highway Division and US DOT Volpe Center staff familiar with the NPS LRTP financial planning process
The team worked with stakeholders to identify potential candidate strategies in light of CIS and TCFO policies best practices and past investment patterns (see Table 2 and Table 3) The initial investments strategies are shown in Table 5 below and were based on trends discussed by the project team early on in the Denali LRTP
DenaliLong Range Transportation PlanFinancialTechReportndashFINALDRAFT 9
The reaction to the strategies from park staff indicated high interest in the OampM strategy ndash if the park is able to at least stem the growth in deferred maintenance using its typical transportation funding sources then the park can later seek out additional funds to rehabilitate facilities that are no longer in a state of good repair The specificity of the three strategies that make different kinds of improvements was eliminated in favor of a general ldquomake improvementsrdquo strategy since transit and trails enhanced ITS and safety and emergency response are all priorities at the park that vary from year to year Finally Denali NPP staff noted that given its current condition the unpaved section of the Denali Park Road could still be one of the best unpaved roads in Alaska even with a reduction in maintenance levels so exploring redirecting some funding from the Park Road to other facilities in the park might be
Table 5 Initial Investment Strategy Concepts
Investment Strategy Option
Invests inhellip At the expense ofhellip
Business as usual Highest priority assets Lower priority assets
OampM emphasis Fund 100 of annual OampM needs for all assets Capital investments and rehabilitation
Transit and trails $1 M for existing transit and trails before other investments $1 M for roads and parking
Make improvements $1 M per year for new assetsservices (eg employee transit real-time bus trackers new trails)
$1 M less for annual OampM and rehabilitation
Safety and programmatic needs
Programmatic and safety needs before everything else (eg accessibility slope stability)
$1 M less for annual OampM rehabilitation
a viable option Various sections of the Park Road meet different condition criteria from good to fair to poor
Refined Investment Strategies No one strategy rose above others as a preferred strategy in the first round of modeling but the number of strategies was narrowed to two Both strategies funded all operations and maintenance needs and ensure that planned projects such as the paved Denali Park Road rehabilitation are completed but one option set aside $1 M per year for improvements or new facilities Table 6 below shows the tradeoffs of the two refined general strategies
Table 6 Refined Investment Strategies
Strategy Invests inhellip At the expense ofhellip
Cover all OampM complete planned projects
OampM and critical near-term repair needs
Making improvements
Cover all OampM complete planned projects and reserve $1Myr for improvements
OampM critical near-term repair needs and improving transportation at Denali
Buying down deferred maintenance
Unpaved Denali Park Road Analysis In addition to these two strategies Denali NPP staff also wanted to test whether transportation funds allocated to the unpaved Park Road in a business as usual approach could be shifted to other purposes The LRTP team as well as staff from Denali NPP and the Alaska Region developed five different options for unpaved road condition targets that could be modeled to estimate costs of different sets of conditions Table 7 below summarizes these five sets of condition targets Each of the two general strategies were tested using the five sets of condition targets for a total of ten investment strategy and condition results The strategies in Table 7 highlighted in red were not achievable give projected funding levels and established higher priorities
DenaliLong Range Transportation PlanFinancialTechReportndashFINALDRAFT 10
Table 7 Unpaved Park Road Conditions
Strategy Goals Annual Cost
Plan A Maintain all Park Road segments in good condition $43 M
Plan B Maintain all Park Road segments in fair condition $37 M
Plan C Set Park Road conditions from segment to segment recognizing that some segments are costlier to maintain in good condition than others
$29 M
Plan D Follow the VMPrsquos ldquotelescopingrdquo approach by keeping conditions good in the first part of the road fair in the middle part and poor at the western end
$25 M
Plan E Follow the VMPrsquos ldquotelescopingrdquo approach by keeping conditions good to fair in the first to middle parts of the road and poor at the western end
$27 M
Plan F VMP ldquotelescopingrdquo approach as in Plan E but with further lowered condition targets for two of the most expensive areas - MP 43-47 and MP 88-92
$20 M
Refined Strategy Results
general strategy was discarded Even without reserving $1 M per year projected funding is insufficient to meet the good to fair
Unlike the initial strategies several of the refined strategies were not viable None of the condition targets on the unpaved Park Road could be met if Denali NPP was to reserve $1 M per year for making improvements elsewhere on the park and so that
conditions proposed under plans A and B for the unpaved park road without scaling back commitments to OampM planned repaving of the paved sections of the Park Road and the rest of Denali NPPrsquos transportation facilities Additional funding could make Plans A and B possible ndash about $13 M per year more would allow for Plan A to be achieved and $07 M more per year would allow plan B to be achieved
Plans C D E and F are viable given currently constrained funding levels Plan C shows that it is possible to meet all of the investment strategyrsquos commitments and still maintain the unpaved Park Road on a segment-by-segment basis The conditions explored in Plan C take the relative expensive of each segment into account and the most difficult segments are allowed to remain in fair to poor condition However modeling showed that meeting these conditions would provide almost no funding for other transportation priorities
Plan D applies the Vehicle Management Planrsquos ldquotelescopingrdquo approach to the maintenance of the unpaved Denali Park Road and targets mid-poor condition for the farthest west segments which are intended to be more rustic and less traveled but keeps the middle and eastern segments in fair to good condition Under this plan nearly $05 M per year would be available for other transportation priorities Plan E made slight changes to keep more of the road in good condition instead of fair
Plan F was ultimately selected as the condition target for the Denali NPP LRTP This option retains the approach of Plan E but reduces condition targets for two sections which are particularly challenging and expensive to maintain Under plan F Polychrome Pass would be improved slightly (but still be in poor condition) while the final stretch of the park road would be allowed to decline to poor condition These two changes free about $06 M per year for use elsewhere on the road and in Denali NPP More information about these two segments is provided in Appendix A at the end of this technical report
Denali LRTP Investment Strategy The refined strategy results narrowed down the policy options for the unpaved Park Road and led to the selection of the Denali LRTP Investment Strategy as the best fiscally-constrained option for meeting the goals and objectives of the plan This strategy
DenaliLong Range Transportation PlanFinancialTechReportndashFINALDRAFT 11
would invest Denalirsquos forecasted $775 M per year in four categories as shown below in Table 8 and Error Reference source not found below
Table 8 Denali NPP LRTP Investment Strategy
Category Estimated share Estimated annual Percentage of of annual funds investment needs met
Operations and Preventive 37 $29 M 100 of needs Maintenance (all met transportation assets)
Rehabilitate Paved Portion of 24 $19 M 100 of needs the Denali Park Road met
Repair and Maintain the 26 $ 20 M 46 of needs met Unpaved Portion of the Denali Park Road
Repair and Improve Other 13 $ 10 M 24 of needs met High-Priority Transportation Assets
Totals 100 $ 78 M 63 of all needs met
The Denali LRTP Investment Strategy strikes a balance between several different priorities for transportation at the park and lies within the ldquoManagement Actions of No Regretrdquo area of the Denali LRTP scenario chart The strategy proposes to fully fund OampM needs in order to slow the decline of facilities and ensure a better visitor experience It continues planned investments on the paved section of the Park Road to achieve a good condition rating and continues to make funding available to address deferred maintenance on the unpaved sections of the Park Road However the strategy sets lower condition targets for sections of the unpaved Park Road which are further into the park and which are less traveled by visitors in order to reserve funding for other segments of the Park Road and for entrance area transportation facilities (eg aviation parking areas new priorities) This approach is consistent with the Vehicle Management Plan which envisions lower traffic volumes and a more rustic experience the further the road extends from the park entrance area
Ultimately because funding needs exceed available resources the condition of transportation facilities at Denali NPP is expected to decline overall FCI ratings across the Denali NPP transportation system today are modeled at 0148 or the low end of fair condition Continued scarce funding for transportation will reduce conditions to 0185 by 20215 However higher priority transportation facilities are expected to remain in fair condition overall as described by the Investment Strategy
5 FCIratings are modeled on a 0‐1 scalewhere0000isperfect conditionand1000iscompletelydegradedcondition
DenaliLong Range Transportation PlanFinancialTechReportndashFINALDRAFT 12
DenaliLRTPInvestment Strategy 13
37
26
24
OperationsandPreventiveMaintenance(all transportationassets)
RehabilitatePavedPortionoftheDenaliParkRoad
RepairandMaintaintheUnpavedPortion ofthe Denali Park Road
RepairandImproveOtherHigh‐PriorityTransportationAssets
The funding forecast in the Denali LRTP is only the most likely scenario for each program and in reality the amount of annual transportation funding will vary as will visitation Table 9Error Reference source not found below shares some management actions for when funding and visitation levels take Denali NPP out of the area of management actions of no regret Generally when visitation is lower it is a better time for disruptive work such as addressing major needs and accomplishing maintenance projects that were deferred Times of high visitation call for more investment in OampM and investment in new services to meet emerging visitor needs When funding prospects are good then more money is available to make improvements catch up on deferred maintenance and prepare plans for the future When funding is short then many necessary improvements have to be delayed and park staff can only fund core operations and critical repair work
Figure 2 Denali LRTP Investment Strategy
Denali Investment Strategy and LRTP Scenarios All of the funding strategies considered for the Denali NPP LRTP assumed the same funding forecast and would fall within the ldquoManagement Actions of No Regretrdquo area on the scenario planning graphic reproduced in Error Reference source not found below This area represents a balance between times of high and low visitation and high and low funding for the park It is calibrated based on an average of funding and visitation over time Years within one standard deviation of these means lie within it if they are more than one standard deviation away from the average then they are said to be in one of the four ldquoquadrantsrdquo
DenaliLong Range Transportation PlanFinancialTechReportndashFINALDRAFT
Figure 3 Denali LRTP Scenarios
13
Table 9 Potential Management Actions by Scenario
Losing Ground Popular Park
Emphasize more of Funding OampM Introducing new services
Emphasize less of Making improvements Funding deferred maintenance Initiating major capitalrehabilitation projects
Emphasize more of Funding OampM Making improvements Introducing new services Planning for future needs
Emphasize less of Funding deferred maintenance Initiating major capitalrehabilitation project
Turn out the lights Surplus of Money
Emphasize more of Funding deferred maintenance
Emphasize less of Funding OampM Making improvements Introducing new services
Emphasize more of Making improvements Funding deferred maintenance Initiating major capitalrehabilitation projects Planning for future needs
Emphasize less of Funding OampM Introducing new services
14DenaliLong Range Transportation PlanFinancialTechReportndashFINALDRAFT
Appendix A Unpaved Park Road Condition Targets
Unpaved Denali Park Road Condition Targets Plans C D and E for the unpaved Denali Park Road examined options for managing each segment of the road to an individually set condition target Each of these targets is based on the overall Vehicle Management Plan and accounts for past challenges or known issues with individual segments Plan F was ultimately selected for its ability to maintain acceptable condition levels while also freeing up funding for other transportation needs In particular Plan F was selected because the condition targets reflect the overall management approach to the road where the western-most sections are desired to be more rustic and remote-feeling and the eastern-most sections are in better conditions to handle more intensive use Tables 10 and 11 below summarizes the conditions for the unpaved segments of the Denali Park Road under the Denali LRTP investment strategy
Conditions are measured in FCI where a higher value represents worse condition and a lower value represents better condition FCI data for the unpaved Park Road is based on estimates by staff responsible for maintaining the unpaved Park Road after the 2016 opening
Table 10 Conditions of Unpaved Segments of Denali Park Road Reflected in Denali LRTP Investment Strategy
Mileposts Segment Name Current Condition
Target Condition
Change in Condition
MP 15 to 32 Savage to Teklanika Bridge Low‐good High‐fair Small decline MP 32 to 39 Igloo Forest to Sable Pass Mid‐fair High‐fair Small improvement MP 39 to 43 Sable Pass to East Fork Bridge Mid‐fair High‐fair Small improvement MP 43 to 47 Polychrome to Plains of Murie Mid‐poor High‐poor Small improvement MP 47 to 62 Plains of Murie to Stony Overlook Mid‐fair Low‐fair Small decline MP 62 to 66 Stony Overlook to Eielson Low‐fair Low‐fair No change MP 66 to 70 Eielson to Grassy Pass High‐poor Mid‐poor Small decline MP 70 to 88 Grassy Pass to Boundary Pit Mid‐fair Mid‐poor Moderate decline MP 88 to 92 Boundary Pit to Kantishna Very‐poor Low‐poor No change
DenaliLong Range Transportation PlanFinancialTechReportndashFINALDRAFT 15
Table 11 Denali Unpaved Park Road Segments ‐‐Current Conditions and Strategy Conditions Explored During LRTP Development
Plan A Plan B Plan C
Plan A Plan B Plan B Plan C Current Desired Plan A Strategy Annual Strategy Plan C
Mileposts Segment Name Conditions Conditions Annual Needs Conditions Needs Conditions Annual Needs
MP 15 to 32 Savage to Teklanika Bridge 009 0109 $ 013 M 013 $ lt01 M 0109 $ 013 M
MP 32 to 39 Igloo Forest to Sable Pass 013 0109 $ 014 M 012 $ 011 M 0129 $ 093 M
MP 39 to 43 Sable Pass to East Fork Bridge 013 0109 $ 0 24 M 013 $ 020 M 0139 $ 019 M
MP 43 to 47 Polychrome to Plains of Murie 035 0109 $ 120 M 014 $ 110 M 0245 $ 074 M
MP 47 to 62 Plains of Murie to Stony Overlook 013 0109 $ 070 M 013 $ 056 M 0139 $ 052 M
MP 62 to 66 Stony Overlook to Eielson 014 0109 $ 025 M 014 $ 020 M 0139 $ 0 20 M
MP 66 to 70 Eielson to Grassy Pass 017 0109 $ 044 M 014 $ 037 M 0169 $ 030 M
MP 70 to 88 Grassy Pass to Boundary Pit 012 0109 $ 056 M 012 $ 051 M 0169 $ 0 32 M
MP 88 to 92 Boundary Pit to Kantishna 0499 0109 $ 072 M 014 $ 068 M 0324 $ 043 M
Total MP 15 to 92 Total Total $ 435 M Total $ 376 M Total $ 293 M
Plan D Plan E Plan F (Selected)
Plan D Plan E Plan E Plan F Current Strategy Plan D Strategy Annual Strategy Plan F Annual
Mileposts Segment Name Conditions Conditions Annual Needs Conditions Needs Conditions Needs
MP 15 to 32 Savage to Teklanika Bridge 009 0109 $ 013 M 0109 $ 013 M 109 $ 013 M
MP 32 to 39 Igloo Forest to Sable Pass 013 0109 $ 014 M 0109 $ 014 M 109 $ 014 M
MP 39 to 43 Sable Pass to East Fork Bridge 013 0109 $ 024 M 0109 $ 024 M 109 $ 024 M
MP 43 to 47 Polychrome to Plains of Murie 035 0149 $ 11 M 0149 $ 11 M 245 $ 074 M
MP 47 to 62 Plains of Murie to Stony Overlook 013 0149 $ 047 M 0149 $ 047 M 149 $ 047 M
MP 62 to 66 Stony Overlook to Eielson 014 0149 $ 018 M 0149 $ 018 M 149 $ 018 M
MP 66 to 70 Eielson to Grassy Pass 017 0325 $ - 0325 $ - 325 $ -
MP 70 to 88 Grassy Pass to Boundary Pit 012 0325 $ - 0325 $ - 325 $ -
MP 88 to 92 Boundary Pit to Kantishna 0499 0325 $ 043 M 0325 $ 043 M 449 $ 012 M
Total MP 15 to 92 Total Total $ 266 M Total $ 266 M Total $203 M
Plan F Unpaved Road Segments The final change that the LRTP team made while discussing the road strategies with park staff was to lower the condition targets for two of the most difficult segments along the unpaved Park Road This section describes these two segments and how accepting a lower condition in these areas can allow for better conditions on other parts of the Denali NPP transportation system
Mileposts 43 to 47 Polychrome Pass to the Plains of Murie The unpaved Denali Park Road segment of Polychrome Pass to the Plains of Murie has been identified by Denali NPP staff as especially difficult to maintain and repair It is facing significant geotechnical hazards that will worsen as time goes on and climate
DenaliLong Range Transportation PlanFinancialTechReportndashFINALDRAFT 16
change accelerates permafrost thaw Making improvements to this section that would take it from the middle of the poor condition band to the low end of fair condition band as explored in Plan D is projected to cost $107 M per year Making lesser improvements from the middle of the poor condition band to the high end of the poor condition band as called for in Plan C would cost $074 M per year instead saving $033 M per year for other uses Thus the selected strategy (Plan F) will target a condition rating at the high end of the poor band instead of a fair rating as with other segments in the central segment of the unpaved Denali Park Road (Igloo Forest to Eielson Visitor Center) This is not an ideal or desired condition for this segment but reflects the challenges of working in this area given limited funding
Mileposts 88 to 92 Boundary Pit to Kantishna The final segment of the unpaved Denali Park Road is currently at the very low end of poor condition and is bordering on severe condition All of the alternative unpaved road plans propose to improve this section However improving the condition from the low end of poor condition to the middle of poor condition as explored in plans C and D is projected to cost $043 M per year Investing this much in one of the least-utilized segments of the Denali Park Road would limit funds for critical investments elsewhere As a result the Denali Investment Strategy proposes lesser improvements at a cost of $012 M per year
DenaliLong Range Transportation PlanFinancialTechReportndashFINALDRAFT 17
National Park Service US Department of the Interior
Denali National Park and Preserve Long-Range Transportation Plan
Appendix G Project Selection Checklist
DENA LRTPProjectSelectionCriteriaChecklist Project Name
PMIS Funding Source(s)
1 Long Range Transportation Plan ndash the project generally adheres to the following
National Long Range Transportation Planrsquos Goals and Objectives (see Attachment A)
Asset Management Transportation Finance Resource Protection
Visitor Experience Safety
Alaska Regional Long Range Transportation Planrsquos Goals and Objectives (see Attachment B)
System Management Mobility User Experience
Resource Protection Climate Change
Denali NPP Long Rang Transportation Planrsquos ldquoactions of no regretrdquo (see Attachment C)
Goal Area ____________________________ Action of No Regret __________
2 Financial Strategy ndash the project meets the following
Capital Investment Strategy score ______________
optimizer band 1 2 3 4 5
Consistent asset investment based on scenario quadrant position (Attachment D)
Consistent with proportionate investment within road management zones (Attachment D)
Milepost or Road Segment ______________________
Consistent with one or more of the following
Operations and Maintenance (OampM)
Rehabilitated Paved Road
Repair amp Maintain the Unpaved Road
Repair amp Improve Other High‐Priority Transportation Assets (bridges transportationmultimodal trail)
3 Risk Priority
Response to current high priority risks based on documented assessment (Attachment E)
Unstable Slopes
River and Stream Flooding
1
Permafrost Subsidence
Culverts ndash Operations and Maintenance (OampM)
Gravel Production Processing or Purchase
Relevance or proximity to mapped hot spot (see Attachment F)
‐ Attachment F should have all the hot spots for Park Road on a map Is this in DNPP LRTP Or do we
give them a link for online info
4 Operations and Maintenance
Investment Type ndash this project is a
New Investment ‐ offset in the cost of OampM
(presumed increase has been addressed by ____________________________________________________)
Replaced investment ‐ offset in the cost of OampM
(presumed decrease or net zero increase has been addressed by ___________________________________)
Eliminated Investment ndash offset in the cost of OampM
(presumed decrease has been addressed by ____________________________________________________)
2
National Park Service US Department of the Interior
Denali National Park and Preserve Long-Range Transportation Plan
Appendix H Public Comment Summary
Public Comment Summary Denali National Park and Preserve Long-Range Transportation Plan
Public comments are organized into two categories common and specific Common comments are
paraphrased themes that appear in multiple comment submissions Responses to common comments
are summarized in Table 1 Specific comments request a particular change When specific comments
seek changes that are accurate reasonable feasible and logically consistent they were made and
included in the final document Other comments include general statements about the quality of the
document suggestions for future plans or ideas for coordination next steps management strategies
park priorities or projects These comments are valued and are available to inform other park planning
efforts and will be referenced during the leadup to this planrsquos eventual update
Table 1 Common Comment
Paraphrased Comment Comment Response
1 Winter or offseason travel is not sufficiently represented in the plan
During the development of this plan numerous issues and needs surfaced as topics that warrant further study and consideration Public comments were an especially meaningful source for identifying topics in need of additional attention These findings will be used to inform the development of the planrsquos update as well as other plans such as the Winter Recreation Plan
2 There is insufficient data or information regarding specific transportation related conditions (eg trail crowding locations of specific facilities rest stop vehicle counts large vehicle counts winter routes locations etc)
The plan relied on facts data and concepts cited in existing park plans studies and other reports No additional data collection or data analysis was conducted as part of this planrsquos development process As such present day conditions or terminology may differ from those described in the plan Gaps in data and understanding will be reassessed in this planrsquos update
3 The plan does not map specific transportation use access facilities for the entirety of the planrsquos 20-year horizon
As a high-level strategic document the plan is not intended to identify specific short-term or long-term project needs or changes park access locations
1
Paraphrased Comment Comment Response
4 If a specific need is not mentioned in the plan (eg backcountry landing strip location) it means that the specific need will be precluded from future project selection and funding
The plan is a high-level strategy document and is not intended to identify and prioritize specific projects While the plan sets high-level goals that are used to evaluate the merits of future projects it is not a project list Whether or not a specific project idea is listed in this plan has no bearing on its ability to be developed or its funding merits
5 The plan does not describe specific actions that the park will take to address a very specific issue (eg plans to address the safety of backcountry landings strips in light of climate change cycling guidelines commercial use authorization for guided hikes off Park Road new parking lot locations more tours etc)
During the development of this plan numerous issues and needs surfaced as topics that warrant further study and consideration Public comments were an especially meaningful source for identifying topics in need of additional attention These findings will be used to inform the development of the planrsquos update
6 Data facts or terminology used in the plan appear to be out dated
The plan relied on facts data and concepts cited in existing park plans studies and other reports No additional data collection was conducted as part of this planrsquos development process As such present day conditions or terminology may differ from those described in the plan
7 The plan does not sufficiently outline specific actions to maintain and improve the parkrsquos soundscape
During the development of this plan numerous issues and needs surfaced as topics that warrant further study and consideration Public comments were an especially meaningful source for identifying topics in need of additional attention These findings will be used to inform the development of the planrsquos update
8 The plan does not go far enough in offering solutions that address threats to park access created by climate change and natural disasters
During the development of this plan numerous issues and needs surfaced as topics that warrant further study and consideration Public comments were an especially meaningful source for identifying topics in need of additional attention These findings will be used to inform the development of the planrsquos update
9 The plan does not go far enough to protect resources
During the development of this plan numerous issues and needs surfaced as topics that warrant further study and consideration Public comments were an especially meaningful source for identifying topics in need of additional attention These findings will be used to inform the development of the planrsquos update
2
Paraphrased Comment Comment Response
10 The plan does not go far enough to protect access
During the development of this plan numerous issues and needs surfaced as topics that warrant further study and consideration Public comments were an especially meaningful source for identifying topics in need of additional attention These findings will be used to inform the development of the planrsquos update
11 Goal andor objective indicators or performance measures are too limited
The plan relied on readily available data and findings cited in existing park plans studies and other reports No additional indicator data was collected as part of this planrsquos development The need for additional data for informing additional indicators will be considered for the planrsquos update
12 Specific details from the Vehicle Management Plan are not reflected in this plan
The long range transportation plan does not supersede the Vehicle Management Plan in any way Omission of Vehicle Management Plan data indicators and conclusions does not negate their significance in how the park is managed
3
- Appendix A - Literature Review Summary Report (1)
- Appendix B - Denali Long-Range Transportation Planning and Acoustic Resources (2)
- Appendix C - Denali Park Road Risk Assessment Utilizing the Unstable Slope Management Program (1)
- Appendix D - Current and Future Partner Projects (3)
- Appendix E - Park Transportation Investment Needs Analysis (1)
-
- Structure Bookmarks
-
- Denali National Park and PreserveLong-Range Transportation Plan
- Appendix EPark Transportation Investment Needs Analysis
- ABSTRACT
- INTRODUCTION
- PATINA DESIGN
- OVERVIEW
- VEHICLE MANAGEMENT PLAN
- VECTOR ANALYSIS
- DATA COLLECTION
- TRANSPORTATION NETWORK
- ASSET METRICS
- HIGH RISK
- INVESTMENT RANKING
- GOAL AREAS
- METHODOLOGY
- DATA PREP
- LAYER WEIGHTING
- COMPOSITE ANALYSIS STEPS
- SELECTED RESULTS
- OUTPUTS
- ROAD SEGMENT FINDINGS
- Motorized Paved Zone
- Wildlife Viewing Subzone 1
- Wildlife Viewing Subzone 2a
- Wildlife Viewing Subzone 3
- Wildlife Viewing Subzone 2b
- DISCUSSION
- INTERNAL WEIGHTING
- SKEWED DATA
- SPATIAL SPREAD OF DATA
- NEXT STEPS
-
- Appendix F _ Denali Funding Plan
- Appendix G - Project Selection Checklist
- Appendix H - Comment Responses (1)
-

-
Denali National Park and Preserve Long Range Transportation Plan Existing Conditions Report
February 27 2015
additional air traffic may have With increasing popularity of Denali NPampP and limited vehicular access
aircraft facilities are key for accessing the backcountry now and in the future
Subsistence Resources Objective Consider impacts and access to subsistence resources in
transportation planning and policy development
Because subsistence access is authorized by Title VIII of ANILCA Condition most plans refer to the provisions set forth in the implementing Subsistence access is allowed regulations at 36 CFR 13460 Motorboat and snow machine under ANILCA Access rights for access is allowed for traditional subsistence activities in the ldquoOld traditional uses include Parkrdquo and off-road vehicle use is allowed on 5 trails near Cantwell traditional and modern (General Management Plan 2008) ANICLA does not supersede transportation modes the original legislation to create Mt McKinley National Park though Transportation impacts of these it adds authorization for private and commercial air travel through activities are not well permits and concessioner contracts documented
In the Old Park snowmobiling was officially closed to all users in the late 90s and early 2000s The Old
Park was also closed to hunting previous to the passage of ANILCA Planes are allowed in the Old
Park but only non-commercial as it is traditional and customary to pre-ANILCA
Transportation impacts of subsistence activities are not well documented but most plans refer to these
activities taking place
32 Climate Change Goal
Plan for climate change impacts to and from the Parkrsquos transportation system through science
adaptation mitigation and communication
Science Objective Initiate support and participate in scientific research and assessments needed to
understand and respond to relationship between transportation and climate change in Alaska
At this time participation in climate change science still only exists Condition
at the Alaska Region level in terms of climate action plans and Participation in climate change
regional LRTPs Regional plans include goals and objectives for science is mainly conducted at
addressing climate change science These include funding climate the regional NPS level
change research through the Transportation Research Board However regional support for
establishing partnerships to test green technologies and regional these activities has recently led
support for the Climate Friendly Parks certification The Alaska to support for unit level studies
Federal Lands LRTP also sets an objective of participating in at
least one climate change effort per year with documented results If
successful this could increase the amount of information available to Denali NPampP managers
The Alaska Region system has undergone studies to assess climate change scenarios at the unit level
These efforts may also lead to more unit-level planning for transportation assets that include climate
change considerations
5
Denali National Park and Preserve Long Range Transportation Plan Existing Conditions Report
February 27 2015
Adaptation Objective Manage transportation assets and conduct transportation planning for climate
change
Regional transportation planning objectives call for transportation Condition
system adaptation with regard to climate change Specific long-Currently there is limited
term climate change adaptation needs include identifying and transportation planning
prioritizing risk to NPS-owned and non-NPS owned transportation documentation in regards to
assets and systems likely to be affected by climate change and climate change adaptation
determine what management actions are needed and developing Regional planning objectives
adaptive management into LRTP updates as a means of assessing call for increased hazard risk
situations designing implementing monitoring evaluating and assessments for strategic
adjusting management decisions to account for climate change decision making
There is limited language addressing climate change adaptation in
plans specific to Denali NPampP
Mitigation Objective Reduce Denali National Park and Preserversquos carbon footprint by reducing
transportation related greenhouse gas emissions from Park operations and visitation
Denali NPampP is in the process of achieving a Climate Friendly Park Condition
(CFP) certification1 This program established by the NPS sets Denali NPampP is in the process of
performance standards for sustainability in support of NPS goals becoming CFP certified Climate
for reducing greenhouse gas emissions through energy change mitigation activities
conservation and reduction in energy use recycling composting include reduction in energy use
technology upgrades and other actions The NPS Alaska Region and encouraging Park
has a goal of becoming a climate friendly region by 2030 which employees to carpool by
targets expanding regional participation in the Climate Friendly providing carpool vehicles
Parks program and increasing climate related data collection
Some specific climate change mitigation activities underway in Denali NPampP include the availability of an
employee carpool fleet and the use of local gravel sources to minimize maintenance vehicle miles
traveled as well as reduction of idling vehicles during transit operation and winter plowing operations
Future opportunities to reduce its carbon footprint may include upgrades to more fuel efficient transit
vehicles should suitable vehicles become available someday
Communication Objective Share the compelling story of climate change impacts in Alaska and Denali
National Park and Preserve to the public as it relates to transportation
1 The CFP program is one component of the National Park Service Green Parks Plan an integrated approach by the NPS to address climate change through implementing sustainable practices in our operations This effort is an integral part of the larger NPS Climate Change Response Strategy For more information on Climate Friendly Parks certification visit httpwwwnpsgovclimatefriendlyparks
6
Denali National Park and Preserve Long Range Transportation Plan Existing Conditions Report
February 27 2015
At this time there is no formal region-wide communication program Condition to describe the relationship between transportation and climate
Although there is no formal change At the park scale there are interpretive programs within
guideline at the regional level for Denali NPampP to explain the impacts of climate change on the
communicating climate change landscape Because Denali NPampP extensively utilizes transit impacts Denali NPampP has some services to enhance visitor experience opportunities exist to show programs to communicate air quality and other benefits of transit service as compared to
climate change impacts to its personal vehicle use
visitors
Regionally there are efforts underway to communicate with both
external partners and internal staff members about the successes and failures concerning
environmentally sustainable transportation practices and to develop and fund educational materials for
internal and external audiences
33 User Experience Goal
Proactively enhance the Denali National Park and Preserve experience
User Data Objective Collect analyze and use transportation and user information to enhance Park
experiences into the future
Most of the documents reviewed for this baseline conditions report Condition rely on user information to determine a condition or characteristic Denali NPampP collects analyzes Within Denali NPampP there is increased interest in collecting user and uses transportation and information because it informs a more proactive approach to user information to enhance transportation system performance visitor experience and natural Park experiences The Park also resource impacts User data is collected through different methods has a vision for how this practice and is used for numerous ends These include can be improved in the future
bull Visitor surveys are used to gauge visitor satisfaction as
well as transportation system performance The most recent survey was collected in 2006
bull Static visitation collection points at the Savage River Check Station visitor centers and other
travel waypoints are used to track visitor characteristics and behavior
bull As of 2013 transit data is collected on all Park transit vehicles by bus drivers and through mobile
tracking devices On-board devices track the number of tickets sold number of passengers GPS
locations of buses and durations of vehicle stops Bus drivers manually input the purpose of the
stop and information about hiker wait times which is of high importance to the Park Service This
data can be made available in real time and can be used to monitor and respond to varying travel
demands The NPS currently has staff in the Resources Division dedicated to analysis of the data
collected by the transit operation
bull Permits collected for the purpose of either access by private vehicle with right-of-way
authorization for overnight backcountry access or by commercial airplane are useful for tracking
visitation to the most protected areas of the Park
bull Other information currently collected includes Service-wide Traffic Accident Reporting System
(STARS) and Fatal Analysis Reporting System (FARS) data for recording vehicular accidents
7
Denali National Park and Preserve Long Range Transportation Plan Existing Conditions Report
February 27 2015
Needs and opportunities for user data include specifying visitor experience benchmarks for number of
vehicles at wildlife stops and number of vehicles in a viewscape to serve as reliable baseline condition
data Other recommendations include additional road audits to reduce entrance fee non-payment More
flexibility to use franchise fees to fund comprehensive data gathering is seen as an opportunity to improve
visitor experiences while protecting natural resources
Multimodal Transportation Objective Provide an appropriate effective and conflict free multimodal
transportation system to and within Denali National Park and Preserve
For much of the Parkrsquos history maintenance and transportation Condition
improvements focused on Denali Park Road More recently the Multimodal access is historical
emphasis includes the Parkrsquos transit system which increases necessary and desired by
access while minimizing natural resource impacts Much of the recreationalists and subsistence
desired future conditions are related to the Park implementing more users The most common
outcome-based approaches to analyzing user information as multimodal conflicts are due to
opposed to relying solely on historic comparisons crowding at wildlife stops and
rest stops along Denali Park Appropriate multimodal transportation service is often defined by its
Road ability to make Denali NPampP accessible to a wide range of visitors
with overarching consideration for the wilderness character that the system accesses This definition of
appropriate access relates closely to the Denali NPampPrsquos purpose and mission as stated in its Foundation
Statement Appropriate access depends on the observed and anticipated effects to natural resources
(VMP 2012) Increased visitor access is desirable if it does not cause negative impacts on environmental
conditions At locations within the Park where the natural environment is still intact even small increases
in visitation or changes in access can have dramatic impacts on natural systems
Multimodal issues that reoccurred in several reviewed documents and in comments from Park staff
include confusion about shuttle service operation desire for better connections between the Park local
communities and visitor accommodations employee travel to from and within Denali NPampP safety
comfort and quality of interpretive experience and transportation service affordability
Multimodal conflicts identified in plans include general congestion along Denali Park Road and in Nenana
Canyon crowding at wildlife stops and rest stops within the Park narrow roadways for bicycling and
hiking in the ldquofront countryrdquo and at particular locations east of Savage River and conflicts between land
and air visitation in terms of soundscape impacts Congestion challenges are anticipated to grow as
visitation levels increase As a result Park managers may face ongoing decisions about how to balance
environmental priorities and resource protection with transportation system capacity when responding to
increased demand
The Park has several efforts underway to improve multimodal travel opportunities and travel experiences
within Denali NPampP Park managers are using indicators to measure performance of the transit system
and gauge overall user experience These include hiker wait times numbers of vehicles at wildlife stops
number of vehicles in viewsheds numbers of vehicles at rest stops nighttime traffic levels large vehicle
traffic and sheep gap spacing Proposed construction of an eight-foot gravel shoulder along sections of
Denali Park Road from mile eight to Savage River cited in the Final Entrance Area and Road Corridor
Development Plan could provide safety and traveling comfort for bicyclists and hikers and may improve
8
Denali National Park and Preserve Long Range Transportation Plan Existing Conditions Report
February 27 2015
opportunities for wildlife viewing Also modifications to the general management of Denali Park Road
could improve protection of natural habitats beyond Savage River
There is an opportunity to gain efficiency in transit operations by improving consistency in transit seating
and consolidating shuttle services in the entrance area and canyon Also expanding transit service north
to Healy and south to Carlo Creek and Cantwell in addition to increasing shuttle service between the
entrance area and McKinley Village is desired (Needs Assessment and Feasibility Study for a Community
Transportation System 2006)
34 Mobility Goal
Provide safe efficient and appropriate access to and within Denali National Park and Preserve
Safety Objective Provide safe access to and within Denali National Park and Preserve
Between 1990 and 2006 95 percent of all vehicular accidents in Condition NPSrsquos Alaska Region occurred in Denali NPampP with 58 percent of The historic character of Denali these accidents occurring on Denali Park Road (NPS Alaska Park Road creates safety Region LRTP 2012) Of the other accidents reported within Denali issues and due to its popularity NPampP 19 percent were located on the George Parks Highway both as a visitor attraction in the within the Park boundaries The remaining portion of vehicular Alaska Region and within Denali accidents occurred near the visitor parking areas or in NPampP most recorded accidents campgrounds The George Parks Highway is the direct road occur along the road Other connection between Anchorage and Fairbanks and a major travel safety s considerations include corridor for Denali NPampP visitors Between 2007 and 2010 31 total bicycle and pedestrian access in fatalities were reported on the George Parks Highway (NPS Alaska the front country and along Region LRTP 2012) sections of the George Parks
Highway and increased winter As identified in the VMP safety issues are associated with road
access travel along Denali Park Road The historic nature of the road may
in some locations limit sight distance restrict width for passing
vehicles and provide inadequate surface road friction (VMP 2012) Driver behavior is most likely a
contributing factor in vehicular crashes particularly for private vehicles traveling Denali Park Road during
off-peak seasons Impacts of severe weather events for Denali Park Road travelers are another safety
consideration These issues are also a top priority of the Parkrsquos General Management Plan and although very important must be balanced with active preservation of the road as characterized by the philosophy
to retain its telescoping from a full width paved profile at the entrance to the narrower unpaved gravel
profile at the western end
According to the visitor survey highlighted in the VMP the public indicates that they feel safe while using
Denali NPampPrsquos transportation system The most notable safety consideration perceived by the public is
related to travel over Polychrome Pass where Denali Park Road has steep drop-offs and the road is
narrow and winding Park management uses driver training driver spacing and wait times to address
safety issues at this location
9
Denali National Park and Preserve Long Range Transportation Plan Existing Conditions Report
February 27 2015
Safety is also a top priority for flight operations For example recommended flight tour routes are subject
to weather conditions and aircraft may be forced to deviate from planned routes if safety is at risk (Air
Tour Operations Best Practices 2012)
With increased opportunities for vehicular winter access emerging safety improvements related to winter
travel are a growing need Denali NPampP has a goal of minimizing wintertime safety-related incidents and
has an interest in determining baseline conditions so as to monitor future winter safety performance With
the trial winter plowing of the first 15 miles of Denali Park Road the Park continues to monitor visitor
safety during the extended period of winter and early spring driving conditions Commercial operators
also provide multi-modal access to the Park during winter months Denali NPampP staff is working with
commercial operators to implement safety measures for winter operation such as the required use of
emergency communication devices during operation
The collection of safety data and addressing inconsistencies in safety data reporting is identified as an
ongoing need
Access Objective Provide appropriate and efficient access for inspiration education research
recreation and other uses as provided for in ANILCA
Condition As stated in the General Management Plan the primary historic
Within Denali NPampP purpose of access to Denali NPampP is to accommodate viewing of
appropriate and effective access Mount McKinley and the Parkrsquos wildlife As documented
is determined by the assessed appropriateness of access is defined by the balance between
impacts to wildlife and cultural visitor accommodation with active protection of wilderness
resources Where the character The NPS therefore uses the least access restrictive
environmental conditions are management tool possible to maintain and promote the natural
more intact visitor access is resources protected by the area (General Management Plan
more closely managed New 2008)
vehicle management strategies
target this priority The level of appropriate access varies along Denali Park Road
Wildlife Viewing Subzones are used to distinguish appropriate level
of access A notable example includes the Parkrsquos VMP which allows 160 vehicles per 24 hour day
through mile 15 of Denali Park Road period while monitoring for violations of user experience standards
This number was derived through extensive research and rigorous travel modeling of Denali Park Road
and provides an overall increase in capacity for visitors while considering environmental impacts
Visitors typically arrive to the Park by private vehicle bus or train Many visitors arriving by bus or train
are cruise ship passengers and are traveling with fellow passengers as part of cruise packages Park
management desires to provide efficient access to visitors arriving by all modes of travel while also
providing for accessibility as delineated by the Americans with Disabilities Act (ADA) and Architectural
Barriers Acts (ABA) For areas of the Park with additional travel requirements this means ensuring a
transportation system that provides a meaningful high-quality opportunity for viewing scenic landscapes
and wildlife primarily through transit services (VMP 2012) In the future visitation is expected to grow
with a large portion of visitors arriving as part of organized tour companies or organizations
Considerations of access are therefore a topic of long-range concern as Denali NPampP is committed to
balancing access with the responsibilities of managing designated wilderness
10
Denali National Park and Preserve Long Range Transportation Plan Existing Conditions Report
February 27 2015
At the time that the Denali Park Road Visitor Survey (2010) was conducted 71 percent of visitors who
traveled beyond mile 15 were part of organized tours (ie Long Tour) These are highly interpretive trips
with designated stops at rest areas and impromptu stops for wildlife viewing Non-tour transit buses
traveling past mile 15 provide less interpretation and make impromptu stops for hikers and wildlife
viewing
Coordination with the visitor services concessioner is ongoing and the relationship between Denali NPampP
and any concessioner is viewed as integral to providing appropriate and effective access for Park visitors
User Information Objective Provide accurate and accessible information through a variety of means
about how to travel to and within Denali National Park and Preserve
The NPS is interested in providing information to potential and Condition repeat users about its transportation system and services at a Commercial and state tourism national regional and local level The Alaska Federal Lands LRTP initiatives are successful in and NPS Alaska Region LRTP summarize objectives and providing travel information to strategies that specifically address providing accurate and visitors prior to their arrival at accessible information for travel to and within federal lands and the Park Once at Denali NPampP several projects to enhance visitor information services the Park its concessioners and
local businesses provide Much of the marketing and development of traveler information for
interpretation through visitor Denali NPampP is championed by non-NPS organizations such as
centers transit and tour bus the Alaska Railroad concessioners and other area businesses
operations and many others Because Denali NPampP is a regular destination for commercial tour
Interpretation and transit system operations much of the information provided to potential visitors
visitor information improvements and visitors en route to the Park is provided by those organizations
are desired According to the Denali Park Road Visitor Survey issued in 2010
over half of the Denali NPampP transit users had received information from a travel agent about their visit to
the Park Another third of the respondents received information over the internet Denali NPampP maintains
a website with virtual tours guides and resources to help visitors plan trips to the Park Travel guides and
tour books are also popular means of learning about how to travel to and within Denali NPampP (NPS
Alaska Region LRTP 2012)
Traditional means for providing information at visitor centers and Wilderness Access Center are available
upon entering Denali NPampP Once aboard the short-tour and long-tour buses visitors have a wide range
of information available Tour bus drivers and guides provide extensive interpretation while transit drivers
may provide information upon request and at the discretion of a particular driver Several Denali NPampP
plans document the value of retaining experienced drivers This was seen as a major enhancement to the
overall visitor experience (Denali NP Bus Shuttle System Analysis 2013)
The most common need identified in planning documents is the necessity for better wayfinding and user
information about transit in hopes of reducing visitor confusion with the Parkrsquos transportation system
According to the VMP an objective of Denali NPampP management is to ldquoclearly communicate information about the system through a variety of meansrdquo Potential options for sharing information include improving
traditional methods such as maps brochures and signage The Alaska Region is also interested in newer
media options such as implementing intelligent transportation systems linked with websites mobile
devices and other personal communication technology According to a survey in 2010 transit users were
11
Denali National Park and Preserve Long Range Transportation Plan Existing Conditions Report
February 27 2015
not interested in receiving information from a recorded narrative about traveling Denali Park Road
Information delivered by bus drivers was preferred over prerecorded methods
Also with the introduction of enhancements to the off-season access programs Denali NPampP
management is interested in reducing the perception that the Park is closed during off-seasons by
increasing communications about opportunities for visiting the Park during the winter
35 System Management Goal
Develop a long-term transportation system to appropriately satisfy current and future land
management needs
Asset management Objective Apply available financial resources to essential transportation
infrastructure
Relative to other parks in the Alaska Region transportation assets
within Denali NPampP are some of the most costly This is primarily
due to Denali Park Road maintenance needs providing visitor
transit and tour services and experiencing the high visitation levels
during a very short summer season
In general transportation assets within Denali NPampP are
considered to be in good condition Road work is mainly
concentrated on bridge replacement road maintenance and
subgrade improvements In general road widening does not occur
However improving pullouts on the narrowest section of the road
to maintain safety standards des exist in asset planning
documentation The annual operations and maintenance budget for
road assets in Denali NPampP was approximately $12 million in 2010
(NPS Alaska Region LRTP 2012)
Denali NPampP management uses both quantitative and qualitative
measures to prioritize transportation system improvements The
2008 General Management Plan prioritizes road improvement
projects ranking corrective safety projects as the highest priority and other corrective maintenance and
repairs as secondary priorities The General Management Plan provides example projects from Denali
Park Road where potential improvements have been identified for multiple project categories (sight
distance improvements safe vehicle passing enhancements road surface friction improvements culvert
repairs etc) Denali NPampP has incorporated the NPS ldquooptimizer bandrdquo model of asset prioritization In
this model assets are scored by Asset Priority Index (API) to rank how critical assets are used in
accomplishing the Parkrsquos mission and goals In this model Facility Condition Index (FCI) indicates asset
condition and is used to determine eligible fund sources Projects are evaluated based upon their APIFCI
rank Using this method of asset evaluation all of the high priority assets (API of 75 or higher) are in good
or better condition (FCI of 03 or less) (Alaska Federal Lands LRTP 2012) Finally the asset needs are
filtered through the NPS Capital Investment Strategy (CIS) which expresses priorities in the form of
optimizer bands Optimizer bands 1 and 2 are associated with assets that are essential or extremely
important for a park to continue as described in its organic legislation
Condition
The availability of funds
particularly for funding transit
systems has decreased in
recent years Denali NPampP
management is using
quantitative and qualitative
indicators about the
transportation system to
prioritize transportation system
improvements With limitations
to increasing system capacity
Denali NPampP management is
working toward increased
system efficiency and better
coordination with transportation
partners
12
Denali National Park and Preserve Long Range Transportation Plan Existing Conditions Report
February 27 2015
There is a general funding gap projected into the future The most recent congressionally authorized
transportation funding bill Moving Ahead for Progress in the 21st Century (MAP-21) reduces funding for
the NPS transit systems by approximately 28 percent from the previous federal transportation legislature
(Alternative Funding Opportunities for NPS Transit 2014) Regional funding assessments show an
annual funding gap of $720000 for Alaskan ldquoroad parksrdquo the category which Denali NPampP is included
Although park-level funding shortages are not yet documented for Denali NPampP a large portion of the
Alaska Regionrsquos transportation assets are located in Denali NPampP Elimination of the Transportation
Improvement Program (TRIP) has made funding multimodal systems such as the Parkrsquos concessioner-
operated transit more challenging (Alternative Funding Opportunities for NPS Transit 2014)
Because the transit system is operated by a for-profit concessionaire it is not eligible for transportation
funding through MAP-21 however several FHWA funding and grant programs are still applicable and
partnerships with local government cooperation and partnership could increase funding eligibility
Park management is also very interested in finding efficiencies within its current asset portfolio
completing operational modifications that improve the transportation system and promoting the Parkrsquos purpose Recent examples of this include new vehicle management strategies provided in the VMP and
wintertime operation improvements
Asset Investment Planning Objective Consider sustainability of operation and maintenance of new
and existing assets in the planning process
The NPS includes asset investment planning in much of its recent Condition transportation planning documentation At a regional level the NPS Denali NPampP managers are very is using measurements that feed into asset planning processes involved with asset planning for such as total cost facility ownership as well as the project
transportation system prioritization tools mentioned earlier Several strategies identified in maintenance and operations the Alaska Federal Lands LRTP promote asset planning through Relative to other parks in the collaboration with other federal land management agencies and region Denali NPampP has high Alaska Department of Transportation and Public Facilities deferred maintenance needs consideration of lifecycle costs and evaluation of maintenance
resulting largely from challenges costs versus investments in new infrastructure associated with maintaining
Denali Park Road Maintenance In 2010 deferred maintenance in Denali NPampP accounted for 65
and operation are constantly percent approximately $20 million of all deferred maintenance of
weighed against environmental transportation assets in the Alaska Region Deferred maintenance
conservation priorities issues within Denali NPampP could be addressed by treating the
underlying cause of the road failures to reduce the need for
repetitive maintenance according to the General Management Plan
Documents suggest that road repairs and maintenance should follow the 2005 Denali NPampP Road
Maintenance Repair and Operating Standards and the 2007 Denali NPampP Road Design Standards The
total planned transportation assets for Denali NPampP include improvements to access roads parking lots
non-motorized routes and other transportation infrastructure These planned assets are valued at $64
million (NPS Alaska Region LRTP 2012)
13
Denali National Park and Preserve Long Range Transportation Plan Existing Conditions Report
February 27 2015
In terms of operational needs Park managers are actively participating in day to day management of
transit operations and are able to make adjustments based on demand For example real-time
monitoring of the transit system allows the concessionaire to track transit vehicle occupancy and dispatch
additional vehicles during peak demand for return trips Denali NPampP is also actively investigating
opportunities for gaining efficiency in their transit and in their entrance fee collection program
As it is with other goal area topics effective operation and maintenance is balanced with environmental
protection In planning documents the Denali NPampP management is constantly balancing expectations of
visitor experience and safety with deference to natural resource objectives
Coordination Objective Coordinate with local organizations to ensure that nearby transportation
projects are planned with NPS involvement to the mutual benefit of all parties
Coordination with federal state and local agencies is seen as an Condition opportunity for funding and project implementation as well Coordination with federal state managing concessionaire services and expanding local visitor local and private transportation services An ongoing federal land management agency agencies is seen as a need for coordination team was formed as a result of the 2012 Alaska optimizing asset management Federal Lands LRTP The group actively works to coordinate because 21 percent of the transportation project planning across Alaska including in and transportation assets are owned around Denali NPampP These efforts could help organize interest in by non-NPS agencies expanding transit services outside of the Park which is a frequently
cited coordination need as determined by the literature review and
comments from Park staff during LRTP discussions
Needs and opportunities for coordinating with private entities are somewhat unique to Denali NPampP
Denali NPampP is the only park in the Alaska Region to have transportation assets that are not owned by
the NPS Twenty-one percent of the transportation assets in the Park are owned and operated by
concessionaires or owned by others There is a desire to expand partnerships to include other local
businesses and eventually local government agencies The 2006 Needs Assessment and Feasibility
Study for a Community Transportation System provides alternatives for organizing such efforts
Other coordination efforts include involving air tourism operators regular communication with tribal
organizations and land inholders and coordinating access with other area landholders and transportation
agencies such as the Alaska Department of Transportation and Public Facilities
14
Denali National Park and Preserve Long Range Transportation Plan Existing Conditions Report
February 27 2015
4 Conclusions
Common themes encountered throughout the literature review process provide several general baseline
conditions for Denali NPampP These include
Resourc
e P
rote
ctio
n
Clim
ate
Change
User
Experie
nce
Mo
bili
ty
Syste
m M
anagem
ent
The historic character of Denali Park Road and the management thereof are important
factors influencing access and mobility
Denali NPampP is a primary attraction for tourists Many visits are rushed due to the
logistics of popular packaged Alaska tours Visitation is anticipated to increase as tour
companies continue to promote and expand travel options to the Park
With anticipated visitation increases and associated use of the transportation system
Denali NPampP managers may face ongoing decisions about how to best protect the Parkrsquos natural resources as congestion grows and the capacity of Denali Park Road and
transportation system is tested
Travel options are sometimes viewed as limited within the Park but some multimodal
enhancements could increase safety particularly for bicycling and hiking opportunities
The general condition of the transportation system is good but priorities are complex
both in terms of balancing maintenance needs with the care for natural resources and
providing access to view designated wilderness areas
Recent changes to Denali Park Road vehicle management and operations system are
intended to advance the NPSrsquos emerging outcome-driven planning processes As more
data becomes available Denali NPampP managers can better set performance indicators
for operations
Existing transportation plans do not contain much information about climate change but if
the actions recommended and cited in the NPS Alaska Region LRTP are followed there
may be more opportunities to include unit-level strategies for addressing climate change
into asset planning and operation With ongoing progression toward a CFP certification
Denali NPampP is well positioned to incorporate these objectives at a unit-level
15
National Park Service US Department of the Interior
Denali National Park and Preserve Long-Range Transportation Plan
Appendix B Denali Long-Range Transportation Planning and Acoustic Resources
1
Denali Long Range Transportation Planning and Acoustic Resources
Davyd_Betchkalnpsgov NPS Alaska Region Soundscape Specialist Biologist 907‐683‐5754
Research Sets the Stage
Author Eli Seigel wrote in 1970 ldquoall the opposites are two freedoms which question each other and complete each
otherrdquo Transportation and solitude likely represent such a pair of mutually‐exclusive freedoms In Denali and other
Alaskan parks we can immediately recognize a tradeoff between the ability to be easily and quickly transported to
a location and the ability to participate in the tranquility of wilderness beyond the reach of modern technology and
crowds
This recognition is a fundamental drive behind the work of the NPS Natural Sounds and Night Skies Division whose
vision statement is to ensure that ldquoNational parks are enduring sanctuaries for natural sounds and dark
environments where current and future generations have the opportunity to experience undisturbed soundscapes
and an unimpeded view of the cosmos and where the ecological roles and cultural values of acoustics and photics
are understood and appreciatedldquo (NPS 2014)
For the purposes of acoustic planning and research the NPS has developed an autonomous system that can
provide both American National Standards Institute (ANSI) certified acoustic levels (ie numeric measurements of
sound pressure level in decibel units) and audio recordings (ie sound that one can listen back to in headphones)
ANSI also recommends the collection of meteorological data concurrent with measurements of sound pressure
level Thus a simple weather station incorporating wind speed wind direction temperature and relative humidity
is also part of the acoustic monitoring station The photo below shows an external photograph of a typical station
2
Figure 1 NPS Standard Acoustic Monitoring Station ndash equipment is composed of a microphone meteorological instruments
sound level meter digital audio recorder battery bank and solar paneling
Scientific work to understand Denalirsquos acoustic environment began in 1999 in response to a large increase in
aviation and snowmobile noise in the mid‐1990s (Morgan 2001) Early data were incorporated into the
Backcountry Management Plan (BCMP) EIS a supplement to Denalirsquos General Management Plan (NPS 2006e)
After the BCMP was published the park embarked on a decade‐long inventory of the acoustic environment The
project was completed in 2015 and as of 2016 the park has moved into a monitoring phase A basic timeline of
acoustic resource management in Denali is shown below
Figure 2 Timeline of acoustic resource management in Denali 1999 ndash 2016
Denalirsquos acoustic inventory project is unique among park service units in that it was designed as a spatially random
sample on a 20 by 20 kilometer grid This allows inference beyond the local detection radius of each microphone
For example consider the following map that depicts the acoustic metric lsquodaily average noise free intervalrsquo ndash a
measure of how long a typical quiet period is before it is broken by motorized noise Noise free intervals in Denali
are largely determined by the frequency of air traffic Aircraft are very acoustically powerful sources that are
audible at distances similar to the scale of the sampling grid thus mapped measurements of noise free interval
immediately form a discernable pattern to the human eye
3
Figure 3 Daily average noise free intervals measured in hours Data were collected as part of Denalirsquos Soundscape Inventory
project 2006 ndash 2015 Noise free interval is a measure of how long a typical quiet period is before it is broken by motorized
noise
Entering the realm of inference the following map uses observations at specific soundscape inventory points to estimate the noise free interval at a park‐wide scale It uses a spatial smoothing technique called inverse distance weighting to construct new data points between the known values ‐ a method known as interpolation Again
because the scale of the phenomena (aircraft traffic) and the scale of the sample (20 km2 resolution) are comparable noise free interval is a metric well‐suited to interpolation techniques (Peterson 1998 Gergel 2006) Continuous change in the metric is physically sensible and approximate the visual effect of looking at the original point data Denalirsquos soundscape inventory was important for understanding which acoustic metrics are best suited to monitoring change at a landscape scale
4
Figure 4 Average noise free interval values estimated by spatial interpolation Units are in hours This map uses observations
at soundscape inventory points to estimate the average noise free interval at a park‐wide scale It uses a smoothing technique
called inverse distance weighting to construct new data points between the known values ndash a method known as interpolation
The Denali soundscape inventory supplies spatially‐rich information about the current state of the acoustic
environment It also clarifies the choices available to quiet the park as per NPS policy Inventory data have been
(1) Inventory data have been used to review the indicators and standards of the BCMP
They explain how indicators change in response to the acoustic ambience
They explain the relationship between indicators (for example NFI and event rate are inversely related
thus one can be estimated from the other)
They provide an understanding as to which indicators are best suited to the scale of the park
(2) Inventory data have been used as input to the voluntary aviation best practice development process
of the Denali Overflights Advisory Council (2007 ndash 2012)
They provided the basis from which to monitor the effects of aviation best practices
They provided updates to the council directing attention to areas most in need of mitigation
They transcend anecdote as the sole basis for making decisions
(3) Inventory data have been used in predictive acoustic modelling
5
They provide a means to validate noise models of aircraft takeoffs or overflights road noise or other
sources
Data such as event rates or hourly distributions can also be used as inputs to models
Aviation Transportation and NPS Policy
There are currently several types of aviation transport in the park Section 1110(a) of the Alaska National Interest
Lands Conservation Act (ANILCA) provides for aviation access for traditional activities and for travel to and from
homesites which will not be discussed in this document Nor will high‐altitude commercial aviation ndash which does impact the park but would involve participation of the Federal Aviation Administration in the revision of Victor
Airways or Jet Routes within the National Airspace System a process well beyond the scope of this plan
Instead this document seeks to build on discussions of the Denali Overflights Advisory Council
(httpswwwnpsgovarticlesdenali‐aircraft‐overflightshtm)a federal advisory committee chartered by the
Secretary of the Interior from 2007 ndash 2012 The group developed a suite of voluntary aviation best practices that
were adopted by both commercial and government aviators It is fitting that these best practices were broadly
adopted because NPS policy does not distinguish the obligations of governmental and Concessionaire operations
with respect to resource protection NPS Management Policies 2006 sect 10249 states
Concessioners are required to comply with applicable provisions of all laws regulations and policies that
apply to natural and cultural resource protection
It is relevant then to provide a brief policy review NPS Management Policies 2006 sect 823 addresses impacts to
natural sounds directly stating
The Service will strive to preserve or restore the natural quiet and natural sounds associated with the
physical and biological resources of parks To do this superintendents will carefully evaluate and manage
how when and where motorized equipment is used by all who operate equipment in the parks including
park staff Uses and impacts associated with the use of motorized equipment will be addressed in park
planning processes Where such use is necessary and appropriate the least impacting equipment vehicles
and transportation systems should be used consistent with public and employee safety The natural
ambient sound levelmdashthat is the environment of sound that exists in the absence of human‐caused
noisemdashis the baseline condition and the standard against which current conditions in a soundscape will be
measured and evaluated
Further guidance related to aircraft is articulated in sect 6343
Managers contemplating the use of aircraft or other motorized equipment or mechanical transportation within wilderness must consider impacts to the character esthetics and traditions of wilderness before considering the costs and efficiency of the equipment
In evaluating environmental impacts the National Park Service will take into account (1) wilderness characteristics and values including the primeval character and influence of the wilderness (2) the preservation of natural conditions (including the lack of man‐made noise) and (3) assurances that there will be outstanding opportunities for solitude that the public will be provided with a primitive and unconfined type of recreational experience and that wilderness will be preserved and used in an unimpaired condition
6
Furthermore sect 637 offers and important reminder that in wilderness areas
The principle of nondegradation will be applied to wilderness management and each wilderness arearsquos condition will be measured and assessed against its own unimpaired standard Natural processes will be allowed insofar as possible to shape and control wilderness ecosystems Management should seek to sustain the natural distribution numbers population composition and interaction of indigenous species Management intervention should only be undertaken to the extent necessary to correct past mistakes the impacts of human use and influences originating outside of wilderness boundaries
Envisioning a (Flight) Route Forward
Denalirsquos Backcountry Management Plan (BCMP) remains the overarching unit‐level policy document on the
management of the natural acoustic environment Data collection during the implementation of the BCMP has
provided a robust baseline description of the resource Transportation planning directly benefits from a synthesis
of these inventory data
One way to approach the protection of acoustic resources is through a cost‐distance analysis Cost‐distance
analysis balances the costs associated with travelling a certain distance (in this case the cost of aviation fuel) with
resistances to travel Resistances to travel can take many forms ndash the increased difficulty in crossing a major river
or mountain range or the difficulty of moving over muskeg as opposed to alpine tundra In this case we describe
resistances to noise ndash areas sensitive to the acoustic disturbance created by mechanical transport
What is meant by resistance Synonymous with lsquonoise sensitivityrsquo for the purposes of this discussion the word
resistance more accurately conveys the interlocked relationship between isolation and transportation The
following two definitions are applicable to the Long Range Transportation Plan
Resistance (noun)
1 Resistance is the degree to which a substance prevents flow through it
2 Resistance is the ability to prevent something from having an effect
In this case the ldquoability to prevent something from having an effectrdquo describes the human ability to make choices
about how to conserve the acoustic environment In other words we conceptualize a resistance when we answer
the question ldquoHow do we mitigate the effects of motorized transport on the acoustic environmentrdquo We will later
see how the resistive analogy between traffic flows and electrical flows can be used to the benefit of managing
acoustic resources
Resistances to noise typically fall into three basic categories
1) Those defined by NPS policy or aviation best practices
2) Those related to the acoustic or ecological properties of the landscape
3) Those related to avoiding interactions between motorized and non‐motorized experiences
7
Resistances to noise can be assigned based on a number of different rationales For instance consider the
following raster dataset that depicts the amount of use by backcountry unit One long‐standing approach to
describing which areas should be protected from noise is to separate backcountry user groups from aviation user
groups in space Lighter areas on the map indicate more backcountry use ndash and thus suggest that aircraft avoid
units along the Denali park road corridor
Figure 4 Backcountry Unit Use resistance layer Lighter values indicate a greater resistance to transportation noise This
suggests that aviation routes should avoid core units around the road corridor
Contrast this with data which show the average noise free interval across the park The layer is normalized to the
same brightness as the backcountry use layer with lighter areas representing a greater resistance to noise and
thus higher resource costs for transportation over the area
The rationale behind the noise free interval map produces different optimal routes than the backcountry user
map This is because resistance is based on the fact that areas with long noise free intervals are sensitive to minor
changes in air traffic and thus traffic should be routed over areas that are already highly fractured In this case
8
areas that already have air traffic would continue to bear the brunt of resource damage allowing the most pristine
acoustic environments of the park to remain intact
Figure 5 Noise Free Interval resistance layer lighter values indicate greater resistance to transportation noise This would
suggest that aircraft routing remain largely the same especially in the areas between the Kahiltna and Ruth glaciers
Backcountry use statistics and noise free intervals are just two of many different ways of assigning resistances to
aviation transport Which strategy is best That depends entirely on the basis of each claim After reviewing both
layers it should be apparent that a wide range of conflicting rationales can be applied to mitigating impacts from
Denalirsquos aviation transportation network Deciding which should be prioritized is a complex decision
Unless the overall aviation traffic volume over the park is reduced displacement in free space is the primary
mitigation technique available to park stewards The most substantial mitigations enacted for the park thus far ndash
the Denali Overflights Advisory Council aviation best practices ndash required the council to weigh certain routing
displacements over others (DOAC 2012)
9
Once a weighting network of resistance layers has been distilled from public and expert opinion it is possible to
use them to envision idealized flight corridors One useful tool for this purpose is the cost‐distance modelling
software Circuitscape (wwwcircuitscapeorg) which uses electrical theory to describe the travel of electrons over
a semiconductor This is analogous to a pilot with knowledge of areas resistant to noise who utilizes this
knowledge while conducting their flight operations Results of a Circuitscape analysis include all the possible routes
a pilot might fly but highlight stewardship‐friendly corridors It allows us to see the conclusions that follow from
our rationale
The following is an example weighting network that can be used as an input for Circuitscape The weights are
chosen in this case to produce a result that is realistic while avoiding the influence of hard discrete edges It
balances nine data sets with widely varying rationales to produce a final summation that can be used to visualize
flight corridors
Figure 6 Example of a weighted network resistance layer Summed data layers include natural ambient acoustic
level travel time backcountry unit use Denali Overflights Advisory Committee aviation best practices and sound
10
sensitive areas BCMP standards noise free interval campgrounds and road corridors The hard edges of polygon
features are especially prominent in the final sum
Dataset Name Description of Dataset Rationale Statement for Noise Resistance Weight
Natural Sound Pressure Level (Median L50)
Typical ambience of the natural acoustic environment (Modelled)
Listening area is reduced in more energetic acoustic environments reducing the impact of human
activities Less natural energy = higher resistance 50
Travel Time Estimated travel time on foot from
portal areas (Modelled)
Backcountry users travelling in more remote areas of the park have a greater motivation to find
solitude Greater travel time = higher resistance 25
Backcountry User Days Utilization of backcountry units of
the park (Empirical)
Areas with a greater amount of backcountry users should be preferrentially avoided More users =
higher resistance 15
Denali Overflights Advisory Council Aviation Best Practices
Best‐practices for mitigating acoustic impacts from aviation (Federal Advisory Committee)
Best‐practices identified by the Denali Overflights Advisory Council should be fully implemented Areas
affected by best‐practices = high resistance 10
Backcountry Management Plan Soundscape Standards
Soundscape standards by spatial region of the park (GMP)
Adherence to NPS policy should be prioritzed Lower impact management zone = Higher resistance
5
Noise Free Interval
Average amount of time before experiencing the next noise disturbance (Empirical
interpolated)
Areas with longer noise‐free intervals are more sensitive to fracturing due to increases in air traffic
Greater noise‐free interval = higher resistance 5
Campground Locations Buffered campground areas
(Empirical)
Campgrounds are places where many people spend time resting and should be preferrentially avoided
Closer to campground = higher resistance 5
Roads Buffered road network (Empirical) Roads are already impacted by noise so aviation
noise will have a lesser impact in proximity to roads Beyond road noise footprint = high resistance
3
Denali Overflights Advisory Council sound sensitive areas
Areas identified by the Denali Overflights Advisory Council as
noise sensitive banded into three categories low medium high (Federal Advisory Committee)
Sound sensitive areas should be preferrentially avoided Higher sensitivity band = higher resistance
2
Table 1 Description of noise resistance rasters that were used to show how varying rationales can be balanced to produce an overall weighted noise resistance layer
Once the weighted resistance layer has been created Circuitscape is used to recognize ideal flight corridors Airports with commercial use represent sources of electrical potential and include Talkeetna Healy McKinley Public ERA helipad McKinley Private Cantwell and Kantishna The sink (ground) of electrical potential is the Denali massif For the example weighting network in this document the following map was produced
11
Figure 7 Cost‐distance analysis results This graphic shows current flow from electrical sources (airports) to an electrical sink (the Denali massif) This is analogous to air traffic density
What does the model show It represents air traffic density as an analogy to electrical current ndash the greater the current the greater the air traffic density As a model it is an imperfect representation of reality but this example representation does identify flight corridors that follow from the input rationale (These corridors include the Denali park road corridor the Denali Fault a route along the outer range and one that connects Broad Pass to the Eldridge Glacier) Obviously the map in Figure 7 fails to capture public opinion and for that reason it is incomplete but the technique stands as a meaningful strategy to approach these complex decisions
12
Conclusion
Data from the Denali Soundscape Inventory describe the parkrsquos acoustic environment at a landscape scale These data can be used
for many purposes but their most critical is to provide a baseline from which to monitor the effects of future noise mitigation
efforts
In the preceding section we described a cost‐distance analysis technique that could be utilized to identify the most beneficial long‐
term mitigations for the acoustic environment Such corridors represent opportunities for park management and the aviation
community to work together as stewards What has not been identified in this document is the ldquovalue analysisrdquo process by which
public and expert opinion can be synthesized into an appropriate weighted resistance layer for cost‐distance analysis The overall
strategy may follow a form similar to this
An informal version of this same process was used to by the twelve members of the Denali Overflights Advisory Council to develop
an initial suite of aviation best practices from 2007 ndash 2012 Some of these best practices have produced substantial positive changes
for the park but others have failed to be acoustically effective due to their extent or timing The strategy described in this
document could be used to open the doors of conversation and improve the effectiveness of the mitigations to protect Denalirsquos
acoustic environment
References
Alaska National Interest Lands Conservation Act PL 96‐487 sect 1110(a)
Denali Aircraft Overflights Advisory Committee 2012 Denali air tour operatorsrsquo best practices to minimize sound impacts Available
at httpswwwnpsgovdenagetinvolvedaoachtmCP_JUMP_5151844 September 2013
Gergel S E and M G Turner 2006 Learning landscape ecology a practical guide to concepts and techniques Springer Science amp
Business Media New York
McRae BH VB Shah and TK Mohapatra 2013 Circuitscape 4 User Guide The Nature
Conservancy httpwwwcircuitscapeorg
Morgan D and J Van Horn 2001 Aircraft Overflight Activity in the Denali Wilderness An Analysis of Backcountry Rangers
13
Observations for 1999 and 2000 National Park Service Denali Park Alaska
National Park Service (NPS) 2000 Directorrsquos Order 47 Soundscape Preservation and Noise Management US Department of the
Interior National Park Service Washington DC
National Park Service (NPS) 2006a Management policy 6343 Environmental Compliance in Management policies 2006 US Department of the Interior National Park Service Washington DC
National Park Service (NPS) 2006b Management policy 637 Natural Resources Management in Management policies 2006 US Department of the Interior National Park Service Washington DC
National Park Service (NPS) 2006c Management policy 823 Use of motorized equipment in Management policies 2006 US Department of the Interior National Park Service Washington DC
National Park Service (NPS) 2006d Management policy 10249 Natural and Cultural Resource Management Requirements in Management policies 2006 US Department of the Interior National Park Service Washington DC
National Park Service (NPS) 2006e Denali National Park and Preserve final backcountry management plan environmental impact statement National Park Service Denali Park Alaska
National Park Service (NPS) 2014 Natural Sounds amp Night Skies Division Strategic Plan (2014 ndash 2019) US Department of the Interior National Park Service Natural Resources Stewardship and Science Ft Collins CO
Peterson D L and V T Parker 1998 Ecological scale theory and applications Columbia University Press New York
Siegel E 1970 There Are Two Freedoms Aesthetic Realism Lectures by Eli Siegel Web 1 July 2016
14
National Park Service US Department of the Interior
Denali National Park and Preserve Long-Range Transportation Plan
Appendix C Denali Park Road Risk Assessment Utilizing the Unstable Slope Management Program
1
Denali National Park and Preserve ndash Long Range Transportation Plan
Deterministic Geologic Risk Assessment of the Denali Park Road Utilizing the Unstable Slope Management Program
Authors Russell Rosenberg MSc ndash Physical Science Technician (Geologic Hazards) Denny Capps PhD ndash Park Geologist Heather Rogers MSc ndash Physical Science Technician (Geologic Hazards)
Prepared 080316
Revisions none to date
Introduction and Project Status
The 92‐mile Denali Park Road traverses a highly active geologic landscape and has experienced
numerous documented mass wasting events throughout the history of the road One of the most
dramatic occurred in late October 2013 when a 600‐ft‐long 110‐ft‐wide debris slide blocked the road
near MP 38 Blocks of permafrost‐frozen unconsolidated debris up to 15 ft thick slid on weak unfrozen
clay Frequent but less dramatic events block traffic undermine road surfaces and may cause damage
to vehicles or injuries Many events including the example above are likely triggered or exacerbated by
thawing permafrost and are consistent with the possible effects of anthropogenic climate change With
increases in road use the uncertain effects of climate change and possible changes to maintenance
funding levels National Park Service (NPS) and Federal Highway Administration (FHWA) staff identified
the need for a comprehensive risk analysis of geologic hazards along the Denali Park Road
The risk analysis is scheduled for completion by March 2017 and includes five parts (1) inventory maps
and linked database that illustrate spatialtemporal distribution of geohazards their relative activity
and geomorphic attributes (2) beta testing and implementation of the Unstable Slope Management
Program (USMP) rating criteria (3) geohazard susceptibility models that estimate the spatial probability
of occurrence (4) geohazard risk models that illustrate the potential consequences and (5)
analysesrecommendations to park management regarding other risks the road will exhibit over the
next decade (DENA‐MOA‐208813AB) Currently tasks 1 and 2 are predominately complete tasks 3 and
4 are underway and task 5 will follow the completion of tasks 1‐4 Although final results and
recommendations are still forthcoming the results of tasks 1 and 2 in particular the USMP ranking
scores (discussed below) provide an inventory and a first‐order deterministic risk assessment of
geologic hazards currently affecting the park road
2
The results of the USMP rating criteria provide valuable information on the spatial distribution of
geologic hazards their severity and the associated risk however they do not directly assess the
possible impacts of climate change or provide a detailed outlook of possible future scenarios We utilize
these data to provide a preliminary identification of the areas with the highest relative risk and their
spatial patterns Consideration of this information should be valuable to this Long Range Transportation
Plan (LRTP) and for park managers and planners as future infrastructure plans are being developed
Unstable Slope Management Program Site Rankings
The USMP is a collaboration between the FHWA many other federal agencies including the NPS private
geotechnical consultants and the Alaska Department of Transportation amp Public Facilities (AKDOT) that
ranks geologically unstable slopes for the purpose of facilitating more effective long‐term geotechnical
asset management USMP scores provide a deterministic ranking of agency risk associated with any
particular geologic hazard site These scores consider elements of both the severity and
frequencyprobability of a hazard and the exposure and vulnerability at each particular site Example
elements include the amount of roadway affected by landslide events the frequency of known hazard
events the impact of events on the use of the transportation corridor the maintenance cost and
complexity and annual average daily traffic For detailed information the USMP ranking criteria please
see (httpnlcsmontanaeduusmpRatingManualpdf)
We have currently completed a total of 141 USMP site rankings along the entire 92 miles of the DENA
Park Road (Figure 1) These data represent the vast majority of known geologic hazard sites and include
landslides debris flow drainages rockfall areas frost‐heaves and erosional undercutting due to fluvial
processes It should be noted however that these site rankings are not totally comprehensive instead
they represent our most complete knowledge as of 06292016 The DENA USMP rankings range from
164 to 948 with a mean value of 328 and more variance within higher ranking sites To put these values
in perspective immediately however the USMP qualitatively defines sites that score less than 200 to be
in ldquogoodrdquo condition sites that score between 200 and 399 to be in ldquofairrdquo condition and sites that score
400 or higher to be in ldquopoorrdquo condition
In theory sites in poor condition are more likely to pose persistent andor more serious problems along
the road and areas of higher risk density are more likely to see a higher concentration of problems In
DENA the current majority of our sites 67 rank in fair condition while only 9 are in good condition
and a relatively large number of sites 24 are in poor condition The only significant outlier was the
ldquoPretty Rocksrdquo slump (Figure 3b) with a score of 948 365 points higher than the next highest site
Spatially regions of higher USMP risk density (Figure 2) are most pronounced along Polychrome Pass
and the Eielson Bluffs areas Individual USMP scores represent the relative risk associated with a hazard
site and risk density represents the relative concentration of agency risk
3
Figure 1 DENA USMP site rankings on IKONOS imagery Icon sized is scaled by individual site rank and colored according to good fair or poor qualitative rank
Figure 2 DENA USMP score density on IKONOS imagery Density scaled by linear concentration and site ranking scores
Of the sites ranked in poor in condition along the Park Road many received prior mitigation or were
previously identified as areas of concern by maintenance or resource management personnel Some
previously noted severe geologic hazard sites in lsquoagreementrsquo with poor USMP scores include the ldquoPretty
Rocksrdquo slump (Figure 3a) debris flow activity at ldquoBugstufferrdquo creek (Figure 3b) the ldquoBear CaveMile 45rdquo
slump (Figure 3c) and the ldquoIgloo Debris Sliderdquo (Figure 3d) Additionally Polychrome Pass is a known area
of high geologic hazard occurrences This general agreement of USMP scores and professional
4
judgementinstitutional knowledge within DENA should be reassuring to park managers and help
demonstrate that the USMP ranking scores represent useful information and are based off of many
years of development from similar programs and expertise developed by FHWA AKDOT Oregon Dept
of Transportation and private firms The USMP provides an institutional framework for tracking these
known problem areas and has identified other new examples
A B
C D
A B
Figure 3 Previously recognized sites that rank in poor condition A ndash Pretty Rocks Slump (mile 454 948 points) B ndash Bugstuffer debris flow (mile 519 575 points) C ndash Bear Cave Slump (mile 45 411 points) D ndash Igloo Debris Slide (mile 377 514 points)
Current Applications to the LRTP
The USMP rankings provide a preliminary framework for understanding the relative severity of risk
associated with geologic hazards along the Park Road Although we do not currently make
recommendations tailored to specific sites or address possible future scenarios we suggest that an
awareness of the current results of the USMP rankings is beneficial to this LRTP Likely applications of
the USMP data to the LRTP would involve spatial analysis of USMP rankings as they relate to possible
disruptions in traffic programming of potential mitigation projects and overlap with future
infrastructure planning In order to facilitate this analysis we submitted a spatial database of our USMP
rankings to PaTINA (they are also available on request) We emphasize that these results are
preliminary yet they provide a method for understanding and considering geologic hazards in a broader
context Park planners and managers should continue to work with resource staff in understanding the
5
implications of these results however the following are potential applications to consider for the
current LRTP
All geologic hazards sites but in particular those in poor condition are more likely to pose
persistent andor serious problems along the Park Road These are areas where the
transportation corridor could experience interruptions or incur high maintenance costs as a
result of geologic activity Sites in poor condition should be considered for mitigation and
investigated in more scientific detail (see Future Work)
The USMP rankings may help identify geotechnical assets where hazards do not appear
extremely severe but may be candidates for mitigation from a risk‐based or cost‐based
perspective Rockfall sites that are not capable of producing catastrophic roadway failure but
require very frequent maintenance are good examples of this These sites also rank in poor
condition but may not otherwise receive attention from management
Density analysis of USMP site distribution identifies areas of non‐discrete geologic hazard areas
that may require alternate or more systematic mitigation efforts to increase cost effectiveness
The extreme concentration of hazard sites along Polychrome Pass is an example of such an area
Future Applications to the LRTP
Both the LRTP and USMP have been designed to evolve as new information become available through
time thus allowing for future applications with as new data become available Most transportation
agencies apply transportation asset management (TAM) systems to transportation assets such as
bridges and road surfaces however geotechnical assets such as rock slopes and embankments are
unlikely to be considered with the same detail (Stanley 2010) The USMP provides a system for
geotechnical asset management by creating a framework to establish potential performance measures
and targets for individual geologic hazards and the overall transportation corridor (Federal Highway
Administration‐DRAFT report 2015) We plan to update USMP rankings for the DENA park road as more
information is made available or new events occur and to perform a systematic re‐evaluation once
every five years By tracking USMP rankings over time the following performance measures could be
considered by transportation planners and park managers
Establish targets to reduce the overall number of fair or poor ranking sites along the park road
This could represent a total percentage reduction a maximum target number of poorfair sites
or a certain number of poorfair sites per unit distance along the road
Establish targets to reduce the risk at sites of particular concern (see Future Work)
A benefitcost analysis for all geotechnical assets along the transportation corridor could be
undertaken The USMP group is currently working on developing this tool and the effectiveness
of programmed mitigation projects could be measured by tracking costs vs performance
changes in geotechnical assets recorded by the USMP rankings
6
A method for tracking the performance of assets through time to establish a preferred course of
action As an example USMP scores at the site of the October 2013 slide that blocked the road
(Figure 3d) have been on a downward trend since May 2015 because of relative inactivity while
scores at the Pretty Rocks slump (Figure 3a) have remained higher or increased slightly because
of recent activity Establishing trends in USMP scores through time could be useful for
determining appropriate mitigation priority
Future Work
The USMP risk matrix provides a relatively robust assessment of geotechnical assets based on their
current condition and a way to track their performance through time However because of its
deterministic nature it does not directly consider possible or likely future conditions We hope to
address this limitation through the continued development of the geologic risk assessment Completion
of task 3‐5 of the risk assessment will allow us provide data which will help determine the probability of
future events based on geologic conditions and the associated risk based on transportation
infrastructure and human exposure The results of tasks 3‐5 will allow us to assess the potential outlook
of areas of the road based on their probability to experience new events Additionally we will expand
on the results of the USMP to examine high ranking sites in more scientific depth Examples of this may
include drilling bore holes at the Pretty Rocks slump to determine sub‐surface conditions examining
the relative abundance of fine‐grained sediment in debris flow watersheds or repeat GPS surveys to
ascertain motion rates such as are currently ongoing at the Bear CaveMile 45 slump By using all of
these data sets in conjunction we plan to propose specific recommendations and mitigation
considerations for sites of concern based on their current conditions and future outlook
References Cited
Federal Highway Administration 2015 DRAFT‐Unstable Slope Performance Measures for FLMAs using
USMP Ratings
Federal Highway Administration and National Park Service 2015 Comprehensive Memorandum of
Agreement DENA 208813 AB Denali National Park and Preserve ndash Conduct A Hazard Assessment Of
The Denali Park Road Corridor
Landslide Technology and Federal Highway Administration 2014 Geotechnical Asset Management ndash
Unstable Slope Rating Category Descriptions For Federal Land Management Agencies
Stanley D A 2010 Asset Management In A World Of Dirt ndash Emergence of an Underdeveloped Sector of
Transportation Asset Management TR News no 277 p 18‐22
7
Denali National Park and PreserveLong-Range Transportation Plan
Appendix D Current and Future Partner Projects
National Park ServiceUS Department of the Interior
1
1
Memo
To Denali National Park Long Range Transportation Plan Team
From ATKINS Email
Phone 720-841-2956 Date Sep 19 2014 Modified August 28 2017
Ref cc
Subject Possible Foreseeable ProjectsPlans near Denali National Park
Matanuska Susitna Borough LRTP
Source httpwwwmatsugovusplanslrtp
This transportation plan assesses growth in the Mat-Su Borough over the next 20 years and
identifies the key elements of the Boroughrsquos future transportation system that will be needed to
serve its growing communities The transportation plan will help the residents develop a Borough
that is a pleasure to live in with public infrastructure that supports their daily lives
Alaska Stand Alone Pipeline (ASAP)
Source httpwwwasapeiscom
The Alaska Stand Alone Pipeline (ASAP) Project is a 727-mile long 36-inch-diameter natural gas
transmission mainline extending from the GCF near Prudhoe Bay south to a connection with the
existing ENSTAR pipeline system in the Matanuska-Susitna Borough A 29-mile-long 12-inch-
diameter lateral pipeline will connect the mainline to Fairbanks The proposed pipeline will be
buried except at possible fault crossings elevated bridge stream crossings pigging facilities and
block valve locations
The pipeline will bypass Denali National Park and Preserve to the east and will then generally
parallel the Parks Highway corridor to Willow continuing south to its connection into ENSTARs
distribution system at MP 39 of the Beluga Pipeline southwest of Big Lake
The Alaska District US Army Corps of Engineers (Corps) has been designated the lead federal
agency and the US Bureau of Land Management (BLM) National Park Service (NPS) US
Environmental Protection Agency (EPA) US Fish and Wildlife Service (USFWS) US
Department of Transportation Pipeline and Hazardous Materials Safety Administration (PHMSA)
and the Alaska Department of Natural Resources State Pipeline Coordinators Office (SPCO) are
participating as cooperating agencies in the Supplemental Environmental Impact Statement (SEIS)
development process
2
2
Memo
Alaska LNG project
Source httpwwwarcticgasgovalaska-lng-project
The Alaska LNG export project would be among the worldrsquos largest natural gas-development
projects The project is in the pre-front-end engineering and design phase or pre-FEED The
project consists of constructing a 58-mile pipeline from Point Thomson gas field to Prudhoe Bay
and 800-mile pipeline from Prudhoe Bay to Nikiski
DOT Parks Highway Projects
Source httpdotalaskagovparks2014
The Alaska Department of Transportation and Public Facilities is performing road construction on
the Parks Highway during the construction season Work includes turn lanes passing lanes re-
surfacing bridge repairs
3
3
Memo
ADOTampPF Area Plans
Source httpwwwdotalaskagovstwdplngareaplansarea_regionalindexshtml
These are regional multi-modal transportation plans developed for specific areas of the state
designed to address movement between communities in the region and from the region to points
beyond Each of these plans incorporates economic modeling to evaluate potential projects and
prioritize them to best meet state and regional goals Denali National Park is partially included in
the Interior Alaska Transportation Planning Area The most recent plan for this area was adopted
in 2010 The plan includes transportation impacts to topic areas that include
bull Gas Pipeline
bull Mineral Development
bull Military Training
bull Railroad Development
bull Tourism
4
4
Memo The Plan examines potential impacts of these and other developments to highways rail aviation
and local community roads and although the plan did not fiscally constrain priority projects
several projects were identified as short-term capital improvement needs Among these projects
were recommendations for improvements on the George Parks Highway in the area of Denali
National Park This project as described by the plan includes passing lanes from MP 113 to MP
163 for an estimated cost of $15 million
Alaska Railroad ndash Healy Canyon
Source httpalaskarailroadcomPortals6pdfprojects2012_01_04_Healy_Canyon_Stabilization_FS_PROJpdf
Work is being proposed in Healy Canyon between Denali Park Station at Milepost (MP) 348 and Healy (MP 358) The Alaska Railroad has proposed projects to
bull Stabilize the track bed (ongoing)
bull Control the rock fall problems
bull ldquoDaylightrdquo (remove the top) Moody Tunnel at MP 3536 (complete)
bull Realign tracks around Garner Tunnel (complete)
bull Realign the tracks to enhance safety at MP 3536 (Moody Tunnel) and MP 357 (complete)
Proposed Susitna-Watana Dam
Source httpwwwsusitna-watanahydroorgprojectproject-description
Susitna-Watana Hydro could be a large hydro project on the Susitna River upstream of Denali
National Park This project would provide long-term stable power for generations of Alaskans and
have economic impacts on the area The project would generate 2800000 MWh of annual
energy once it comes online in 2024 The installed capacity is 600 megawatts (MW)
Environmental studies are currently underway
DOT Mile 231 Proposed Pedestrian Project
Source httpawsstateakusOnlinePublicNoticesNoticesViewaspxid=173914
The project scope includes constructing a new pedestrian bridge across the Nenana River trail
connections a rest area and intersection improvements Conceptual designs preliminary
engineering and environmental studies are currently underway
Other Area Energy Projects (Wind Coal Natural Gas exploration)
Eva Creek Wind Project Eva Creek is the largest wind project in Alaska at 25-megawatts It is
located 14 miles from Healy at the top of the 10-mile Ferry mining road
Usibelli Coal Mine Exploration License Plan of Operations Usibelli Coal Mine Inc has
submitted a request to carry out a Coalbed Methane drilling exploration program at a prospect site
approximately seven miles east of the town of Healy The project will consist of a single vertical
coal-bed methane exploratory well drilled inside the exploration license area The exploratory well
5
5
Memo will help determine whether sub-surface coal seams contain sufficient quantities of methane gas to
justify further exploration in the area (Source
httpdogdnralaskagovPermittingDocuments2014UsibelliUsibelli_LOCI_14_002_Drilling_at_H
ealy_Creek_Propect_Noticepdf)
Stampede State Recreation Area There is a potential designation of a Stampede State
Recreation Area west of the Panguingue Creek subdivision In March 2013 Senator
Representative David Guttenberg introduced HB148 in response to requests by the Denali
Borough Assembly
Borough Planning Commissioners are currently working through recommendations for area
management which include details of proposed allowed uses and a plan for land management
(Source httpnorthernorgtake-actionstampede-state-recreation-area-1)
Air Traffic ndash Overflights council
Source httpwwwnpsgovdenaparkmgmtaoachtm
The Denali National Park and Preserve Aircraft Overflights Advisory was established in 2007 to
consider resource conflicts between aircraft tours and park visitors on the ground The group is
charged with advising the National Park Service (NPS) on ways to mitigate (reduce) sound impacts
from aircraft flights over the park develop voluntary measures for assuring the safety of
passengers pilots and mountaineers and achieve desired resource conditions at Denali as
outlined in the Backcountry Management Plan (2006)
6
Denali National Park and PreserveLong-Range Transportation Plan
Appendix EPark Transportation Investment Needs Analysis
National Park ServiceUS Department of the Interior
Appendix E Denali National Park and Preserve Park Transportation
Investment Needs Analysis
Denver Service Center Planning Division | National Park Service | March 2017
1
Contents ABSTRACT 2
INTRODUCTION 2
PATINA DESIGN 3
OVERVIEW 3
VEHICLE MANAGEMENT PLAN 3
VECTOR ANALYSIS 4
DATA COLLECTION 4
TRANSPORTATION NETWORK 4
ASSET METRICS 5
HIGH RISK 5
INVESTMENT RANKING 6
GOAL AREAS 7
METHODOLOGY 8
DATA PREP 8
LAYER WEIGHTING 9
COMPOSITE ANALYSIS STEPS 10
SELECTED RESULTS 14
OUTPUTS 14
ROAD SEGMENT FINDINGS 16
Motorized Paved Zone 16
Wildlife Viewing Subzone 1 17
Wildlife Viewing Subzone 2 18
Wildlife Viewing Subzone 3 19
Wildlife Viewing Subzone 4 20
DISCUSSION 20
INTERNAL WEIGHTING 21
SKEWED DATA 21
SPATIAL SPREAD OF DATA 21
NEXT STEPS 22
2
ABSTRACT A Park Transportation Investment Needs Analysis (PaTINA) was performed in support of the Denali
National Park and Preserve Long Range Transportation Plan The PaTINA spatially models areas of
potential investment need by using a Geographic Information System to overlay geographic data The
data overlays are assigned a weight and added together where they are coincident in space The
resulting model visually depicts areas where multiple complexities occur This is compared with
transportation facility data to inform investment strategies The PaTINA results are shared in an
interactive web mapping environment and may be added to other mapping tools as a map service
INTRODUCTION The Park Transportation Investment Needs Analysis (PaTINA) synthesizes geospatial information to inform transportation planning and investment PaTINA takes into consideration the goals of the National Park Service (NPS) service-wide goals the goals of individual NPS units and the requirements of the Federal Highway Administration The combination of these goals is expressed in the Long Range Transportation Goals PaTINA creates geospatial-based analyses related to these goals and produces high-resolution outcomes that are site specific within the park unit PaTINA models use compiled data sources to create models related to transportation needs and restraints The vision goals and objectives established in the park unitrsquos Long Range Transportation Plan (LRTP) determine the input data for PaTINA As an analysis PaTINA is accomplished by overlaying map themes important to park management within
a Geographic Information System (GIS) and spatially comparing the overlay results to the transportation
network Metrics used by facility managers to rank assets of the transportation network in terms of
needed maintenance are then compared to the PaTINA results The analyses demonstrate where
priority areas may be located and can be compared to financial recommendations of LRTP The resulting
analyses can spatially inform the condition performance assessment needs identification funding
strategies and even funding prioritization
Modeled PaTINA results are shared as map services and presented in an interactive web mapping
application along with park facility and other relevant data The PaTINA process can be repeated with
model inputs and weights adjusted to reflect current park management needs
The PaTINA was originally developed as part of the Golden Gate National Recreation Area LRTP to help identify key areas where a confluence of conditions highlighted the need for investment consideration The recognized utility of the analysis led the Denali National Park and Preserve (Denali or park) LRTP team to request a PaTINA to help identify areas of concern that may not be readily discovered without geospatial tools
3
PATINA DESIGN
OVERVIEW The following are steps used to design create and implement PaTINA for the Denali LRTP At the
beginning stages of the LRTP goals are established for the Park Unit which includes Washington Federal
Highways and the Park Unit input Goal areas for Denali were system optimization resource
protection user experience access climate change and partners Each goal area was assigned
applicable GIS data layers which establish elements of the goal The data layers were given priority
weights depending on their importance on how it affects or is affected by the transportation network
Priority weights were determined with input from Denali park staff specialty experts
Once weights were established spatial analysis was performed to determine the overlap of each input
data layer within each goal area The weights of each input layer were added together where overlap
occurred The overlaying process identified areas where multiple inputs are spatially concurrent as well
as where inputs deemed as a higher prioritymdashmore heavily weighted--occur
The overlay results of each goal area were combined to generate the overall PaTINA composite denoted
as ldquoPotential Need Areasrdquo Throughout the LRTP process additional data themes outside the goal areas
were identified as a need and were categorized into three parts asset metrics high risk and investment
ranking These data were later added to the final web mapping product to compare to the Potential
Need Areas
VEHICLE MANAGEMENT PLAN In 2012 Denali prepared a Vehicle Management Plan (VMP) to evaluate alternatives for managing
vehicle use along the Park Road The preferred alternative of the plan proposed new management
zoning to include additional wildlife viewing subzones According to the VMP these subzones would be
implemented to clarify management objectives necessary to achieve desired conditions within specific
road sections Due to the significance of the segments for management purposes (Figure 1) it was
important to incorporate the sections into the initial design of the Denali PaTINA To do so the PaTINA
was applied independently to each road segment resulting in five separate sets of analyses Wildlife
viewing subzone 2 is split between 2a) from Teklanika River Bridge and the Eielson Visitor Center and
2b) east of Wonder Lake
4
Figure 1 Road segments defined in the Denali Vehicle Management Plan and used as a basis for the PaTINA
VECTOR ANALYSIS Following the methodology of the Golden Gate PaTINA the Denali PaTINA was completed as a vector
analysis Golden Gate was the pilot for the PaTINA effort which led to expectations that the process be
replicable at additional park units Vector analysis also has the added benefit of preserving spatial
geometries and attribution Attribution allows web map users to deconstruct the results to verify inputs
contributing to the composite result
DATA COLLECTION The following sections describe the categories of data that make up PaTINA and are included in the final
product
TRANSPORTATION NETWORK The transportation network for Denali first needed to be defined to create a spatial basis for the overlay
analysis For Denali the transportation network consists of roads trails parking lots railroad and
airstrips Each polyline transportation network features were assigned a width (Table 1) and then
2b
2a
5
buffered to that width to create a polygon input All polygon inputs were merged together to create a
final transportation network data layer
Table 1 Buffers applied to the Denali transportation network
Transportation Feature Width
Roads 11rsquo Trails 8rsquo
Railroad 100rsquo
ASSET METRICS Asset metrics included in the Denali PaTINA show facility condition index (FCI) and optimizer bands The
FCI rates the condition of a facility or asset using a numeric rating system This system reflects the
current replacement value of an asset and its projected cost of repairs Optimizer bands were developed
to divide a parkrsquos asset portfolio into five bands to represent the level of maintenance that each asset
should receive The metrics help staff make informed decisions about the allocation of limited funding
and staff time for maintaining park infrastructure
The FCI and optimizer band data were derived from the facility management software system (FMSS)
Assets in the transportation network data layer were joined together with the FMSS spreadsheet to be
able to show the asset metric information spatially The join was based on the Location ID attribute in
both the spreadsheet and spatial data A number of records in the spatial data were missing Location
IDrsquos so manual matching had to take place This was done by using aerial imagery to identify assets
based off of the FMSS location descriptions Assets that still couldnrsquot be identified through this method
received input from park staff via the web mapping tool by using create new features capability
Create New Features Tool in Web Map Site
The Create New Features tool allows users to generate data within the web map interface The user creates the geometry of the data and can also include information in predefined text boxes that gets added to the feature class attribute table Once the new feature has been created and saved it is automatically stored as a new record in a feature class that sits on a local server This benefits the GIS staff by having quick access to newly created data Because the data is automatically stored users can revisit the web map and see previous created features Geometry and text changes can be made to the feature after it has been created
HIGH RISK In winter of 2016 NPS regional and park staff as well as Federal Highway Administration (FHWA)
conducted a risk assessment workshop for Denali The purpose was to identify risk types and areas to
mitigate risk and provide recommendations to park management Those findings will be included in the
Denali LRTP There were a total of 28 identified risk types that were ranked into prioritization categories
from low to high Because of the importance of understanding where risk occurs and to mitigate future
events it was decided to include this information as spatial data into the PaTINA web map Only the
6
high risk category was added to the analysis due to the significance of these risks on Denalirsquos resources
visitors and staff
In total there were eight high risk types identified only six of which could be mapped Out of the six
remaining risk types three had data available The Create New Feature tool was used by park staff to
generate a data layer identifying locations of gravel production sites but was later omitted by the LRTP
team It was concluded that the site itself is not a risk to the transportation network but rather the
absence of gravel in these pits are The in holder access data was gathered from the NPS Lands
Resources Division to show tracts within Denali Culvert locations were derived from an excel
spreadsheet provided by FHWA ndash Western Federal Lands by plotting XY coordinates Lastly the
unstable slopes data was provided by park staff and was originally generated through FHWA in
collaboration with NPS Table 2 summarizes the risk data included in the PaTINA web map
Table 2 Summary of risk data used in the Denali LRTP
Risk Type Can it be mapped
Is data available
What is the source of the data
Inholder Access yes yes NPS Lands Resources Division
Implementation of LRTP no na
Staff Level Changes no na
Gravel Production Processing or Purchase yes no
Culverts (MampO) yes yes FHWAndash Western Federal Lands
Permafrost degradation yes no
River and Stream Flooding yes no
Unstable Slopes yes yes NPS FHWAndash Western Federal Lands
INVESTMENT RANKING A financial analysis was completed for the Denali LRTP resulting in development of investment
strategies An investment strategy combines goals and objectives of the LRTP agreed upon investments
and other transportation needs and constraints in the current funding environment One investment
strategy category is to Repair and Maintain the Unpaved Portion of the Denali Park Road and focuses on
desired condition targets which change depending on the Park Road segment This strategy aligns with
the VMPrsquos concept that the Park Road is less traveled by visitors farther into the park and those
segments with lower desired conditions can help reserve funding for other transportation asset
priorities
Due to the importance of financial analysis results it was decided to include the information as a spatial
component to PaTINA A table showing current and desired conditions for each segment with associated
milepost numbers was provided by one of the contractors working on the LRTP A GIS layer of mile
markers was used to correlate data from the table and create a new layer representing the financial
analysis Attribute information was added and the layer was symbolized by segment showing highest
priority and lowest priority Table 3 shows current and desired condition information that was
incorporated into the new investment ranking GIS layer These results can easily be compared to other
components such as high risk areas or goal area composites
7
Table 3 Financial analysis data based on mile markers
Mile Post Segment Current
Condition Desired
Condition Annual Needs
Priority Ranking
0 to 15 Entrance area to Savage River Trailhead
na 00 na 5
15 to 32 Savage River Trailhead to Teklanika Bridge
009 109 $013 M 4
32 to 39 Igloo Forest to Sable Pass 013 109 $014 M 4
39 to 43 Sable Pass to East Fork Bridge 013 109 $024 M 4
43 to 47 Polychrome to Plains of Murie 035 245 $074 M 2
47 to 62 Plains of Murie to Stony Overlook 013 149 $047 M 3
62 to 66 Stony Overlook to Eielson 014 149 $018 M 3
66 to 70 Eielson to Grassy Pass 017 325 $ - 2
70 to 88 Grassy Pass to Boundary Pit 012 325 $ - 2
88 to 92 Boundary Pit to Kantishna 0499 449 $012 M 1
GOAL AREAS During the early development of the Denali LRTP team members created six goal areas each with an
associated statement The goal statements represent aspects of the NPS mission and Denali vision
statements to help guide future transportation decisions These goal areas serve as a basis throughout
the LRTP for identifying baseline conditions performance management and implementation Table 4
shows the six goal areas and goal statements
Table 4 Denali LRTP goal statements
Goal Area Goal Statement
Resource Protection Understand and protect Denali NPPrsquos fundamental Park resources and values as they relate to the transportation system
Climate Change Plan for climate change impacts to the Parkrsquos transportation system
User Experience Provide a quality multi-modal Park experience for users
Access Provide safe efficient and appropriate Park access
System Optimization Develop a long-term transportation system to appropriately satisfy current and future Park needs
Partnership Manage formal and informal commercial partnerships to provide a viable transportation system
These goal areas served as a guide for GIS data collection Datasets related to each goal area were
identified collected and formatted as needed for the composite analysis The Partnership goal area is
not included in the PaTINA since no map-able data were identified Future iterations of the Denali
PaTINA may include the Partnership goal area if new data are obtained The System Optimization goal
was also not included in the analysis but rather it was called out separately for comparison in the final
model results This category is referred to as Asset Metrics (described above) and include FMSS-specific
data The purpose of this was to be able to spatially detect and understand the correlation between
FMSS data and the Parkrsquos values stated from the LRTP goal areas In total 26 GIS layers were used as
input layers for the analysis Layers from each goal area were overlaid upon each other so that the goals
8
could be visualized for the LRTP Listed below are the input layers for each of the goal areas used for the
analysis
Resource Protection
bull Sheep Gaps
bull Exotic Species
bull StreamRoad Intersections
bull Vegetation Monitoring Marker
bull Sheep^
bull Moose^
bull Bear^
bull Wolves^
bull Caribou (Aug-Sep)^
bull Caribou (July-Aug)^
bull Caribou (May-June)^
bull Wetlands
bull National Register Structures
bull Historic Districts
User Experience
bull Viewscapes
bull Visitor Services
bull Social Trails
bull Visitor Pattern
bull High Visitor Use Area
Access
bull Safety Areas of Concern
bull Railroad Depot
bull Bus Stops
Climate Change
bull Geohazards
bull Permafrost
^Based on extrapolated observation data reported in the Denali VMP
New data created by park staff for the PaTINA
During the process of collecting data data needs were recognized and collated Identified data gaps
included permafrost degradation river and stream flooding events informal aviation landing areas
congestion hotspots and wildlife patterns To fill certain gaps the Create New Features tool in the web
map was utilized by park staff Layers in the list above with an asterisk represent the ones created by
park staff Other identified data gaps focused on visitor use statistics Examples included dependable
traffic counts visitation numbers by area and visitor numbers on bus types beyond front country area
METHODOLOGY
DATA PREP All input data layers were projected to NAD_1983_Alaska_Albers Point and polyline datasets were
buffered and converted to polygon features and then clipped to the transportation network Figure 2
shows an example of a point layer created by park staff using the Create New Feature tool that was later
buffered and clipped Once the polygon data was created per input layer they were merged together to
create a single polygon layer For example park staff created multiple polylines and points to capture
visitor patterns along the Park Road The polygons were merged together to create a single visitor
pattern input layer under the User Experience goal area
9
Figure 2 Example of Denali staff input used to create data for the PaTINA
LAYER WEIGHTING Within the goal areas each input polygon layer was assigned a value The values ranged from 0 (no
impact) to 05 (lesser impact) to 1 (full impact) and was assigned by park staff Table 5 shows each goal
area and associated weighted values for each road segment The term ldquoimpactrdquo in this setting may refer
to impact the input layer has on the transportation network or conversely impact the transportation
network has on the input layer To align with the VMPrsquos subzones of the Park Road each input layer was
weighted separately for individual road segments Weighted per segment reflects park management
priorities which may vary for a particular input by road segment The High Visitor Use Area input layer is
an example of this where the impact is higher in the front country compared to further west on the Park
Road Therefore the High Visitor Use Area input layer received a higher impact value in the front
country road segment
10
Table 5 Layer input ranks assigned by park staff
RESOURCE PROTECTION GOAL AREA
Motorized Sightseeing
Subzone
Wildlife Viewing
Subzone 1
Wildlife Viewing
Subzone 2a
Wildlife Viewing
Subzone 3
Wildlife Viewing
Subzone 2b
Sheep Gaps 0 05 1 05 0
Exotic Species 1 05 05 05 05
StreamRoad Intersections 1 1 1 05 1
Vegetation Monitoring Marker 0 1 1 05 0
Sheep 05 05 1 0 0
Moose 1 05 05 1 05
Bear 05 05 1 05 05
Wolves 1 05 05 05 05
Caribou (Aug-Sep) 0 0 05 1 0
Caribou (July ndashAug) 0 05 05 1 0
Caribou (May ndash June) 0 0 0 05 0
Wetlands 1 05 1 1 05
National Register Structures 1 1 1 1 1
Historic Districts 1 1 1 1 1
USER EXPERIENCE GOAL AREA
Motorized Sightseeing
Subzone
Wildlife Viewing
Subzone 1
Wildlife Viewing
Subzone 2a
Wildlife Viewing
Subzone 3
Wildlife Viewing
Subzone 2b
Viewscapes 0 05 1 05 0
Visitor Services 1 1 1 1 1
Social Trails 1 1 1 1 1
Visitor Pattern 1 1 0 0 05
High Visitor Use Area 1 05 05 05 05
ACCESS GOAL AREA
Motorized Sightseeing
Subzone
Wildlife Viewing
Subzone 1
Wildlife Viewing
Subzone 2a
Wildlife Viewing
Subzone 3
Wildlife Viewing
Subzone 2b
Safety Areas of Concern 05 0 05 05 0
Railroad Depot 1 0 0 0 0
Bus Stops 1 0 0 0 0
CLIMATE CHANGE GOAL AREA
Motorized Sightseeing
Subzone
Wildlife Viewing
Subzone 1
Wildlife Viewing
Subzone 2a
Wildlife Viewing
Subzone 3
Wildlife Viewing
Subzone 2b
Geohazards 05 05 1 1 05
Permafrost 05 05 1 0 05
COMPOSITE ANALYSIS STEPS 1 Once the input layers were weighted the values were added into new fields in the attribute
table The new field names were abbreviated with each goal area name and input layer number
For example Resource Protectionsheep gaps would read as RP1 since sheep gaps was listed
11
first in the data collection table Another example would be Resource Protectionexotic species
shown as RP2 The following shows goal area abbreviations
a Resource Protection ndash RP
b User Experience ndash UE
c Access ndash AC
d Climate Change ndash CC
2 Within each goal area the input layers were combined with the transportation network layer
using the UNION tool creating a goal area output layer This resulted in the following layers
RP_Union UE_Union AC_Union and CC_Union
3 Using the DELETE tool all fields were deleted except for the five road segment fields This
reduced the file size of the output layer for future geoprocessing steps and faster speeds once
added to the web map
Steps 4-6 refer to only one goal area and one road segment For example Resource Protection
(RP)Motorized Paved Zone (MPZ)
4 A new field called RP_T_MPZ was added to the RP goal area output layer to sum the total
values This was completed by using the FIELD CALCULATOR tool and summing the MPZ value
for each input layer (RP1_MPZ + RP2_MPZ)
5 Due to the goal areas having a different number of inputs the total sum value was normalized
to avoid skewing the outputs to goal areas with more input layers By normalizing the total
values could be shown on a common scale A new field was added and called RP_TN_MPZ Using
the FIELD CALCUALTOR tool the RP_T_MPZ value was divided by the total number of inputs
resulting in a normalized number (RP_T_MPZ14= RP_TN_MPZ)
6 The RP goal area output layer was then clipped to a previously created MPZ road segment layer
(RP_MPZ_Clip)
Steps 1-6 were repeated for each goal area and road segment In total twenty clipped output layers
were created Figure 3 shows steps 1-6 in a flowchart
12
Figure 3 Process diagram for PaTINA steps 1 - 6
Steps 7-9 refer to only the MPZ road segment
7 The next step utilized the UNION tool to union each clipped goal area output layer by road
segment (RP_MPZ_Clip UE_MPZ_Clip AC_MPZ_Clip CC_MPZ_Clip = MPZ_Clip)
8 Once the MPZ_Clip layer was created a new field called All_MPZ was added to sum the total
normalized numbers The FIELD CALCULATOR tool was used and summed each goal areas
normalized number (RP_TN_MPZ + UE_TN_MPZ + AC_TN_MPZ + CC_TN_MPZ = ALL_MPZ)
9 The overall MPZ composite was then symbolized based on the total MPZ normalized values
(ALL_MPZ) and was shown with five classes using Natural Jenks classification The five classes
were symbolized from very low (dark green) low (light green) medium (yellow) high (orange)
to very high (red) which identified potential need areas throughout the transportation network
Figure 4 shows symbolization for the front country area in road segment MPZ
13
Figure 4 Mapped Potential Need Areas for the Motorized Paved Zone
Steps 7-9 shown in Figure 5 were repeated for each road segment In total five segments showed very
low to very high potential need areas
Figure 5 Process diagram for PaTINA steps 7-9
14
SELECTED RESULTS
OUTPUTS The PaTINA analysis resulted in four main output groups which may be viewed individually or compared
to one another These groups are asset metrics high risk areas investment rankings and potential
need areas See the Data Collection section for review of these groups
Figure 6 shows potential need areas against high risk areas located in Wildlife Viewing Subzone 3
segment of the Park Road The results appear to have several high risk areas spatially coincident with
high need areas highlighting locations that may be considered for financial investment Doing so may
help protect park resources and visitor safety
Figure 6 High Risk Areas shown with Potential Need Areas modeled in the PaTINA
15
Figure 7 shows potential need areas against high investment ranking along the Wildlife Viewing Subzone
2 segment of the Park Road The investment ranking displays two sections which are Igloo Forest to
Sable Pass (MP 32 to 39) and Sable Pass to East Fork Bridge (MP 39 to 43) Within the high investment
sections potential needs can be identified for further examination for future investment
Figure 7 Example PaTINA-modeled Potential Needs Areas shown with investment ranking data
16
ROAD SEGMENT FINDINGS
Motorized Paved Zone The motorized paved zone starts at the park entrance at mile post 0 and ends at mile post 149 (Figure
8) In this segment it appears that the greatest amount of very high potential need areas are
concentrated around the Denali Visitor Center and high potential need areas are located just east of
that surrounding the Riley Creek Campground These potential need areas consist of up to twelve input
layers each of which fall within all goal areas Findings also show the Park Headquarters and Savage
River to be potential need areas with values of medium and high
Figure 8 PaTINA-modeled potential need areas for the Motorized Paved Zone segment of the Park Road
17
Wildlife Viewing Subzone 1 The wildlife viewing subzone 1 spans the distance between mile post 149 to mile post 319 (Figure 9)
and includes the Sanctuary River campground and the Teklanika River campground and rest stop The
Teklanika River campground shows the largest very high potential need area Up to twelve input layers
from three of the goal areas cover this segment The access goal is not included Findings also show the
Sanctuary River campground and west of the Primrose Ridge and Mount Margaret rest stop to be a very
high potential need area though the spatial area is smaller compared to the Teklanika River
campground This location is comprised of up to thirteen input layers from all goal areas
Figure 9 PaTINA-modeled potential need areas for the Wildlife Viewing Subzone 1 segment of the Park Road
18
Wildlife Viewing Subzone 2a The wildlife viewing subzone 2a ranges from mile post 319 to mile post 66 (Figure 10) and includes
locations from Igloo Creek campground to Eielson Visitor Center The findings suggest that there are
many high potential need areas along this segment of road The most prominent areas are located
before and after Polychrome Overlook and includes up to ten input layers along this stretch The Eielson
Visitor Center shows very high potential need areas with up to twelve input layers from three goal
areas These findings may suggest future investment at this location due to high use at the visitor center
Figure 10 PaTINA-modeled potential need areas for the Wildlife Viewing Subzone 2 segment of the Park Road
19
Wildlife Viewing Subzone 3 Milepost 66 to mile post 846 is the wildlife viewing subzone 3 segment (Figure 11) which begins east of
the Eielson Visitor Center and goes to the Wonder Lake campground Results show west of the Eielson
visitor center with the greatest concentration of very high potential need areas A majority of this
segment ranges from very low to medium potential need areas until farther west near Wonder Lake
Wonder Lake campground consists of up to ten input layers from three goal areas
Figure 11 PaTINA-modeled potential need areas for the Wildlife Viewing Subzone 3 segment of the Park Road
20
Wildlife Viewing Subzone 2b The wildlife viewing subzone 2b starts at milepost 846 to mile post 920 being the farthest west of all
road segments (Figure 12) The only very high potential need area in this segment is located east of
Kantishna Results display that the very high area has up to 12 input layers from three goal areas The
east side of this area shows high potential need suggesting that this stretch could be identified as an
area for potential future investment
Figure 12 PaTINA-modeled potential need areas for the Wildlife Viewing Subzone 2b segment of the Park Road
DISCUSSION The Park Transportation Investment Needs Analysis (PaTINA) employs standard geospatial methods that can be repeated to reflect changing management goals as well as be applied in different facility management situations and scales The web mapping application deployed with the data allows for frequent review and consultation of the results to inform management decisions
21
Execution of the methods however requires intensive data gathering and formatting Further the
weighting process is currently accomplished in a desktop GIS after subject matter experts are polled for
input weights This process could be improved with tool development in either the desktop environment
or the online web map to streamline how GIS data are included and weighted in the model While the
process in its current state is repeatable in most cases it requires a GIS specialist and a desktop GIS to
complete We foresee improving either the desktop or online tool (or both) to make the process more
accessible and rapid Depending on the data inputs however the overlaying process may still require
extensive data collection and preparation Additionally the overlaying process can be computer
intensive--again depending on the data inputs--and may be prohibitive due to available resources
The data collection process in this analysis identified data needs which are collated separately and listed
above under Goal Areas Acquisition and incorporation of these data may improve the PaTINA results
Visitor use statistics are an especially glaring omission which if obtained will improve future PaTINA
modeling
Seasonal variations in some inputs are not well represented in the analysis Further work may entail
modeling specific seasons to help inform investment strategy throughout the year
INTERNAL WEIGHTING The PaTINA applied to Denali NPampP weighted each input layer uniformly across the spatial extent of the layer However some data contained attributions that could be weighted differently Because the weights were assigned by park staff for each input layer based on the road segments further weighting based on attributes internal to a layer would unnecessarily complicate the composite scoring Future iterations of the model for Denali may consider applying layer attributes to vary weights across the layer instead of applying weights per road segment Alternatively the weights assigned by road segment could be normalized against the attribute weighting but the statistical validity of this needs to be explored
SKEWED DATA The initial run of the PaTINA model showed skewed results within the front country segment NPS staff
clarified that specific locations within the front country segment should have been identified as very
high or high potential need areas instead of low and medium rankings The main concern was around
the Denali Visitor Center and vicinity that included the railroad depot trailheads and visitor amenities
As a known high visitor use area the visitor center and surroundings should be considered a high
potential for investment The data and associated weights were examined and it was concluded that the
user experience goal area was lacking desirable input layers to validate higher rankings Once the
additional input layers were identified they were added to the next run model and results showed
important locations such as the Denali Visitor Center with higher rankings
SPATIAL SPREAD OF DATA Input layers across the goal areas differ spatially within the road segments The resource protection goal
area is the only goal area in which input layers coincide with the transportation network within all five
road segments User experience and climate change goal areas are within four segments with no data in
22
the last segment wildlife viewing subzone 4 The access goal area contains data only within the first
segment motorized sightseeing subzone Although input weights are normalized for each goal area the
spatial spread of the data influences the results where more inputs are occurring
The results show classes of potential need areas throughout the entire transportation network due to
some input layers completely overlaying it These layers are exotic species each of the mammal layer
inputs excepting sheep and permafrost Due to the spatial spread of these data every area of the
transportation network can be classified as at some level of potential need for investment
NEXT STEPS The data and web mapping interface will require maintenance as updated or new data and web
mapping tools become available We see the initial release of the web map for the Denali PaTINA as a
first step toward a more comprehensive tool to aid the park in investment decision making As noted
above stream-lining the weighting and model execution processes would improve the overall utility of
the PaTINA
Additional development of the PaTINA web map may include incorporation of other map services such
as the NPS Road Inventory Program and data services from the Inventory and Monitoring network
Conversely the base PaTINA results can be added to other web map applications that may focus on
other issues
Finally development of instructional materials and accompanying training sessions would bolster and
help maintain the utility of the PaTINA results and its application to park management
National Park Service US Department of the Interior
Denali National Park and Preserve Long-Range Transportation Plan
Appendix F Denali Funding Plan
Denali National Park and Preserve Financial Analysis Technical Report ndash FINAL DRAFT
Introduction This report discusses the transportation funding aspects of the Denali National Park and Preserversquos first Long Range Transportation Plan It includes a retrospective of transportation funding from 2006-2013 a projection of funds expected to be available for transportation during the planrsquos twenty year planning horizon and a summation of the resources necessary to return transportation facilities at Denali National Park and Preserve (Denali NPP) to ideal conditions As is true for all of the National Park Service (NPS) the amount of funding that is needed for transportation at Denali NPP exceeds the amount that will be available in coming years and so this report includes an investment strategy that funds the highest priority needs
The discussion must begin with two of the NPSrsquos guiding transportation investment principles and Denali NPPrsquos primary existing transportation document the Vehicle Management Plan (VMP) It then discusses Denali NPPrsquos place in Alaska Region transportation funding and the expected increase in funding needs due to climate change impacts The middle section of this report discusses the LRTP methodology in general and how the Denali NPP LRTP methodology differs from those used for other NPS LRTPs There is also a discussion of historical forecasted and needed transportation funding that collectively make up the baseline transportation funding report for Denali NPP
This report concludes with a discussion of the funding strategies which were evaluated for the Denali NPP LRTP and how the final strategy was selected The investment strategy prioritizes operations and maintenance the rehabilitation of the paved section of the Park Road funds the unpaved sections of the Park Road to achieve management priorities and provides approximately $1m per year to address other transportation priorities The Denali NPP transportation investment strategy is expressed with respect to each of the four LRTP planning scenarios to guide park management decisions during times when visitation is increasing or decreasing and when funding (or stakeholder support) is higher or lower than average Funding shortfalls means that the condition of all transportation assets cannot be improved but progress can be made to address the highest priorities
Funding Denali Transportation Facilities
Capital Investment Strategy and Total Cost of Facility Ownership As a best practice and formal policy the NPS incorporates strategic facility planning into its asset management decision-making processes including LRTPs Two fundamental concepts the NPS Capital Investment Strategy (CIS) and Total Cost of Facility Ownership (TCFO) underlie those best practices and are drivers of the investment planning and decision-making reflected in the Denali LRTP
The NPS Capital Investment Strategy The CIS is an NPS strategy for prioritizing project investment to ensure effective and responsible project funding The CIS includes a scoring tool that decision-makers at all levels of the NPS have available to them to inform project investments and other asset management needs
The purpose of the CIS is to help prioritize investments focus on mission-critical assets manage operations and maintenance and ensure that the greatest impact can be made with available capital and operational funds The CIS uses a scoring tool to evaluate projects on a number of different criteria Financial Sustainability Visitor Experience Resource Protection and Health amp Safety The four categories are weighted using a predefined algorithm to arrive at an overall project score Projects can then be compared by score as needed in theory the greater the score the higher the priority The scoring strategy supports an asset management approach that emphasizes maintaining key assets and reducing the estimated value of deferred maintenance cost against those key assets
Some of the key objectives in the Financial Sustainability strategy are to build only what can be maintained right-size the asset portfolio reduce liabilities reduce resource consumption to promote sustainability and eliminate non-essential development in order to emphasize the essential natural and cultural experience The Visitor Experience strategy includes investment in assets or resources that enable recreation and serve as gateways to park units contact stations and interpretive assets The Resource
DenaliLong Range Transportation PlanFinancialTechReportndashFINAL DRAFT 1
Protection strategy focuses on those historic cultural and natural resources that the NPS is tasked with protecting and preserving Such tasks supported by the CIS could include preservation repair and restoration of assets Finally the Health amp Safety strategy places an emphasis on correcting unsafe or hazardous conditions within park units that pose a threat to visitors or staff Different parts of the Denali LRTP address these four strategies which are used by fund program managers to allocate limited funding
Total Cost of Facility Ownership Applying the concept of Total Cost of Facility Ownership (TCFO) is considered by the NPS to be a vital part of a financially sustainable infrastructure strategy and practice to truly address transportation asset management1 It aligns closely with the intentions behind the CIS especially the CIS Financial Sustainability component TCFO is the full life-cycle cost of constructing maintaining and operating an asset until it needs replacement This concept recognizes that assets require investment throughout their service lives until they need replacement or disposition and that preventive maintenance and facility operations activities are key to minimizing long-term costs and optimizing the life of said assets Implementation of the TCFO concept involves a shift-away from a ldquojust fix itrdquo or ldquorun to failurerdquo mentality to more holistic planning making cost estimates and decisions that consider not just the deferred maintenance (DM) of an asset but the ongoing OampM need over its service life need for replacement and ultimately disposition
The Denali LRTP team took the concepts inherent to the CIS and TCFO and embedded them into all of its LRTP analyses and planning activities Consequently the resulting investment strategy selected by Denali NPP staff is consistent with the approaches and practices used across the NPS to develop for example the National LRTP and other unit or regional LRTPs
The Denali Park Road and the Vehicle Management Plan Denali NPP is one of the most visited National Park Service units in Alaska and the Denali Park Road is the means for the majority of visitors who wish to traverse deep into the interior by any mode motorized or otherwise For many visitors it is the most readily accessible transportation corridor for them to experience the Alaska wilderness and for some it is their only option Denali NPP is currently several years into the implementation of its VMP the culmination of an intensive planning effort to balance the needs of the parkrsquos natural resources with high visitor demand The Denali LRTP is consistent with the recommendations in the VMP
Generally the VMP recommends limiting vehicle traffic on the Denali Park Road in order to reduce traffic impacts on natural and cultural resources The VMP has a ldquotelescopingrdquo approach where visitor activity is highest and associated development is most extensive in the paved entrance area of the park and declines and lessens respectively as the Park Road heads west As shown later in the section on Funding Strategies the Denali LRTP reflects this by realigning maintenance and rehabilitation investments along the Park Road to concentrate on the areas of highest visitor activity and most extensive development
Funding Trends The Federal Lands Transportation Program in the NPS Alaska Region The Federal Lands Transportation Program (FLTP) is the single largest source of transportation funding for the National Park Service and other Federal land management agencies Project funding decisions are made at the regional level following national guidelines The FLTP at a national scale has recently been reauthorized at a higher funding level than analyzed in this plan However interim program guidance suggests that the majority of the increase will be reserved for nationally significant major projects with only a small increase to regional allocations
Denali NPP has historically been the largest recipient of FLTP funding in Alaska in part because 20 of the Regionrsquos 27 miles of paved roads are within Denali NPP The unpaved Park Road may also be funded by FLTP NPS regional staff indicate that Denali NPP has in the past received all funding from the program by default unless another NPS Alaska Region park unit has eligible needs (which is rare) at which point that project from another park unit moves to the top of the regional FLTP program This means that FLTP will likely be a sustainable funding source for major investments at Denali NPP into the future The next three years of FLTP investment at Denali will be primarily used to rehabilitate the 15 mile paved section of the Park Road from the park entrance to the Savage River checkpoint
1 For example reference ldquoMemorandum Guidance for Addressing Facilities in Planning Documentsrdquo Associate Director Park Planning Facilities and Lands
National Park Service US Department of the Interior January 4 2016
DenaliLong Range Transportation PlanFinancialTechReportndashFINALDRAFT 2
Climate Change and Geotechnical Hazards As explained elsewhere in the LRTP current research indicates climate change is dramatically affecting transportation facilities across Alaska The impacts of climate change relevant to Denali NPPrsquos transportation system include thawing permafrost unstable slopes a lengthening shoulder season and other change indicators Most of these changes will result in higher costs to operate and maintain Denali NPPrsquos transportation network which will further stress already limited funding
Monitoring and evaluation of climate change impacts is an ongoing need and a recommendation of this LRTP Tracking threats and hazards to the transportation system such as unstable slopes requires funding for specialized equipment and the technicians and scientists who collect and analyze the data Funding updates to hydrology models and monitoring permafrost thawing are other near-term relatively inexpensive data needs that can help avoid disastrous impacts over the medium to long term Denali NPP has initiated the effort but funding has not been identified for developing specific plans for how to adapt the transportation system in the park to these expected impacts
In the near term a number of susceptible areas along the Park Road will likely encounter more frequent closures due to intermittent landslides flooding or debris flows with each requiring cleanup and reopening The future impacts of one of the effects of climate change increasing precipitation in the Denali Borough region can already be previewed during excessively wet years 2016 was a particularly wet year and staff were faced with unstable slopes and more frequent and more severe debris flows Beyond the cost of cleaning up after these road closures there are short-term disaster management tasks for which Denali must be ready ndash evacuation or care of visitors staff users and inholders on the far side of an interruption
Some dedicated funding sources are available for recovery costs such as NPS Emergency Storm amp Flood Damage and FHWArsquos Emergency Relief for Federally Owned Roads (ERFO) These programs have limited budgets and will be increasingly strained in an era of continued climate change impacts not just in Denali NPP but across the National Park Service These funding sources are currently limited to recovery costs only and cannot be used for monitoring or preventive work that can anticipate and avoid a future event such as by stabilizing slopes or realigning a road
There are several segments of the Park Road and its associated bridges and structures that may become physically or financially untenable in the next few decades There may come a time when the park will need to consider decommissioning rerouting andor relocating these facilities These costs are not yet known but will likely far exceed Denalirsquos typical past annual funding and may require special major project funding US Department of Transportation (DOT) discretionary grants such as the (unfunded) Nationally Significant Federals Lands and Tribal Projects program or Transportation Investments Generating Economic Recovery (TIGER) are possible sources as is the NPS Line Item Construction program However because these needs are not yet quantified and because they are beyond the capacity of the current funding programs to address the costs of fully adapting the transportation system to climate change are not included in the Denali LRTP financial analysis
Denali LRTP Funding Baseline Financial Analysis Methodology The financial analysis methodology for the Denali LRTP is based on the data and methods first developed for the NPS National LRTP (NLRTP) A much more detailed technical summary is available for the NLRTP and generally applicable to the Denali LRTP but this section will cover the basic steps as well as deviations used to adapt it to the unit level
Historical Investments Establishing a financial baseline of the historical average annual level of regional transportation spending provides a foundation for forecasting the
Annual transportation investments at Denali likely future available funding levels which can be anticipated for Denali NPP averaged $923 M per year from 2006-
NPPrsquos transportation facilities This is important information for developing a 2013 from all funding sources combined fiscally-constrained LRTP The LRTP team analyzed all of the fund sources that had been used for transportation investments at Denali NPP from fiscal year (FY) 2006 through FY 2013 These results provide a vital context for developing the Denali LRTP investment strategy
DenaliLong Range Transportation PlanFinancialTechReportndashFINALDRAFT 3
The LRTP team estimates that approximately $775 M per year will be available to Denali NPP for transportation purposes over the next six years
The financial data was extracted from various financial and project management data tracking systems2 The LRTP team
identified historical expenditures awards and authorizations for transportation assets
adjusted those prior year dollar values to equivalent 2014 values using GDP inflation factors and
calculated an annualized average transportation funding expenditure rate for the period FY 2006 ndash FY 2013
This data was initially prepared by the National LRTP team and then reviewed by the Denali LRTP team to remove any anomalies To simplify reporting the dataset was consolidated coded and grouped by funding authorizations funding programs work types and asset types All identifiable American Recovery and Reinvestment Act (ARRA) investments a one-time extra-ordinary funding source were removed from this analysis A detailed technical methodology document is available from the NLRTP effort
Because the data only includes transportation expenditures made by the National Park Service it does not include transportation
each funding source that Denali NPP has recently used for transportation It
funding and support with an increase in visitation) or ldquoSurplus of Moneyrdquo scenario (increased funding and support with a decrease in visitation) when compared to the historical average However for the purposes of the investment strategy in this plan the funding forecast is considered to be at the center of our ldquoManagement Strategies of no Regretrdquo - those actions that make sense given a normal variation in expected support funding and visitation levels
The Denali LRTP team leveraged the approach applied in the development of the NPS National LRTP to forecast anticipated funding availability for transportation investments in the near future There were two main sources of forecasting information
The NPS budget office The Budget Office conducts forecast exercises servicewide and with individual units The Budget Office suggested the LRTP program assume a one-time reduction to Title 54 (DOI) Non-Fee program fund sources of three percent for ONPS and Cyclic Maintenance programs in the NPS National LRTP The DENA LRTP forecast was based on a combination of actual funding program investment plans where possible and the three percent cut when it wasnrsquot The three percent reduction only applied to programs for which the Denali LRTP project team did not have access to an investment plan (eg Operational Base)
Regional Funding Programs The Denali LRTP project team consulted several regional-level program plans to acquire information on planned investment levels Title 54 Non-Fee programs for Cyclic Maintenance RepairRehabilitation and Line Item Construction Title 16 54 Fee programs for Recreation Fee Transportation Fee and Concession Franchise
investments by third parties The parkrsquos partners such as the Alaska Railroad bus concessioners Denali Borough and the Alaska Department of Transportation and Public Facilities (ADOTampPF) all fund transportation work that helps visitors employees inholders and freight carriers access the park However these investments are not accounted for in this analysis because these data do not enter NPS financial data systems
Forecasted Transportation Funding This section documents the Denali NPP financial forecast for transportation based on anticipated future funding levels that can be reasonably assumed to be available The forecast of available funding provides the principal financial constraint against which future investment plans must be prioritized and represents the result of the most likely funding scenario for
does not include a forecast for work done by other parties such as the State of Alaska or Denali Borough that may benefit Denali NPP and it also doesnrsquot include any unforeseen additional funding which may result in a ldquoPopular Parkrdquo scenario (increased
Fees and the Title 23 Federal Lands Transportation Program These forecasts replaced the National LRTP-style (ie three percent reduction) forecasts for these programs as they provide more certainty than broad program-level authorizations and appropriation amounts
The elimination of the Paul S Sarbanes Transit in the Parks Program (TRIP) is another factor to note in the forecast but the only analysis needed is to not project any future grant awards from this program Denali made use of TRIP in the past but will need to seek other funding sources to fund future transit and trails projects This is also true of various grant programs formerly used by many parks but not Denali NPP such as Scenic Byways or the Public Lands Highway Discretionary Program
2 Systems used included the NPS Administrative Financial System (ie AFS Versions 3 and 4) and the joint Federal Highway Administration (FHWA)NPS Park Roads and Parkways Transportation Allocation and Tracking System aka PTATS
DenaliLong Range Transportation PlanFinancialTechReportndashFINALDRAFT 4
Unfortunately transportation funding for Denali NPP is expected to decline unless additional funding sources are found or funds are redirected from other critical areas The declining funding environment coupled with historically high visitation may result in a ldquoLosing Groundrdquo scenario (decreased funding and support with an increase in visitation) when compared with historical averages These conditions are not dissimilar from recent years (eg 2013-2015)
Transportation Investment Needs Investment needs are defined in this plan as the amount of funding required to bring transportation assets to good condition and sustain them at that level Investment needs also include costs to address programmatic needs such as code compliance structural fire and accessibility Other goal area needs such as resource protection may overlap with asset management (TCFO) needs or may be additional potentially unfunded requirements
The LRTP team estimated an annual need of $1242 M to return the Denali NPP transportation system to good condition and keep it there over six years
The Denali LRTP used a similar methodology as the National LRTP and other Regional LRTPs using needs data from the best available data system or report that covers a particular type of transportation facility and type of work However many of the reports and systems available at the regional or national level do not apply to individual parks The principal difference between the needs in the Denali LRTP is the use of automated systems The data sources used for the Denali LRTP are
Reoptimization File OampM needs for all facilities except the unpaved Park Road
2013 Alaska Region Unpaved Road Analysis (pilot) Detailed analysis for the unpaved Park Road
Facility Management Software System (FMSS) Component renewal and programmatic needs
Project Management Information System (PMIS) Capital investment needs planning naturalcultural resources
National list of megaprojects Paved Park Road repair project and replacement of the Toklat River Bridge
Differences between the needs sources such as timespans and prioritization systems were reconciled in order to create a single set of transportation facility needs for Denali NPP Park staff also reviewed the needs data and removed several projects that were already underway or would be accomplished through partners rather than by the park At $1242 M per year the estimated annual transportation investments needs exceed the annual transportation funding amount by $467 M per year
Transportation Funding for Denali NPP This section discusses the current and near future transportation funding outlook for Denali NPP It covers where funds have come from and how they have been used in terms of what type of transportation facility was funded what type of work was funded and how transportation funding is prioritized
Investments by funding source From 2006-2013 the National Park Service as a whole used more than 60 different funding program and accounts to fund transportation activities but only ten programs funded investments at Denali NPP Table 1 below shows how much each funding program provided in the past how much it is expected to provide in the future and how much would be needed from each funding program to cover Denalirsquos total transportation need each year if past investment patterns were continued
DenaliLong Range Transportation PlanFinancialTechReportndashFINALDRAFT 5
Table 1 Denali NPP Transportation Investments and Needs by Funding Source (in millions of 2013 $)
Investments by funding source
Historical Average Annual Investment
Forecasted Annual Average Investment
Estimated Annual Needs
Title 54 Non‐Fee $175 M $101 M $335 M
Cyclic Maintenance $063 M $004 M $001 M Line Item Construction $034 M $032 M $007 M Operational Base $064 M $055 M $270 M Other NPS Programs $007 M $007 M $019 M
RepairRehab $007 M $002 M $039 M
Title 54 Title 16 Fee $134 M $211 M $261 M
Concessions Franchise Fees $067 M $144 M $051 M
Recreation Fee $067 M $067 M $210 M
Title 23 $601 M $462 M $586 M
FLTP $601 M $462 M $586 M
OtherExternal $014 M $001 M $060 M
FTA TRIPATPPL $012 M ‐‐ ‐‐
Reimbursable Agreements $001 M $001 M $060 M
Grand Total $923 M $775 M $1242 M
Each of these funding programs have a different legislative authorization and project eligibility criteria Title 54 programs are those authorized by Title 54 of the US Code (National Park Service-specific programs) Title 16 includes other relevant Department of the Interior programs (ie Recreation Fee Program) Title 23 includes programs overseen by the Federal Highway Administration and the ldquoOtherExternalrdquo category includes other funding sources such as the discontinued TRIP program as well as reimbursable agreements donations partnerships and other less common sources
Investments by Facility Type
Denali NPP maintains a diverse system of transportation facilities including paved and unpaved roads bridges paved and unpaved transportation trails transit facilities developed airstrips as well as support infrastructure such as a materials (gravel) quarry Table 2 below shows historical investments forecasted investments and the estimated annual investment needs for each of the parkrsquos transportation facility types
Of all historical investments in transportation at Denali NPP in the recent past about 55 went to the Park Road and associated structures and 18 supported parkwide operations that include the Park Road Less than a third was used for separate transportation facilities such as trails and access roads Park Road funding was oriented to the unpaved segments that require frequent repair work to remain in even fair condition given the extreme conditions and heavy vehicle traffic in Denali NPP Recent investments in several difficult sections in the western end of the Park Road helped restore user comfort and safety
DenaliLong Range Transportation PlanFinancialTechReportndashFINALDRAFT 6
Table 2 Denali NPP Transportation Investments and Needs by Asset Type (in millions of 2013 dollars)
Historical Forecasted Average Annual
Average Annual
Estimated Annual
Asset Type Unpaved Roads
Road Bridges
Trails and Transit
Investment $386 M
$184 M
$147 M
Investment $235 M
$042 M
$066 M
Needs $527 M
$135 M
$137 M
Paved Roads $144 M $291 M $297 M
Other3 $051 M $053 M $066 M
Parking $011 M $089 M $081 M
Grand Total $923 M $775 M $1242 M
Historical Forecasted Average Average Estimated Annual Annual Annual
Lifecycle Stage Investment Investment Needs Planning and Administration4 $058 M $057 M
Capital Investment $134 M $259 M $130 M
Operations and Preventive Maintenance $045 M $048 M $186 M
Recurring Maintenance $142 M $083 M $374 M
Component Renewal $527 M $259 M $508 M
Grand Total $923 M $775 M $1242 M
Denali NPPrsquos greatest area of transportation investment need is in heavy repair and rehabilitation work similar to much of the rest of the National Park Service Insufficient funding often leads to smaller routine maintenance work being deferred which causes transportation facilities to fall out of a state of good repair Other significant needs at the park include annual operations and maintenance of transportation facilities and making improvements to culverts that provide for fish passage and building an aircraft hangar
Note that some categories such as capital investment show ldquosurplusesrdquo where more funds are forecasted for investment than are needed This is the result of project programming where several capital investment projects are scheduled for near-term
Investments by Asset Lifecycle stage As discussed in the section on Total Cost of Facility Ownership different types of work are needed at different points in a transportation facilityrsquos lifespan from planning through to rehabilitation or disposition Table 3 below shows historical and forecasted annual investments as well as estimated annual investment needs for each lifecycle stage for all asset types combined
Table 3 Average Annual Investments by Lifecycle Stage (in millions of 2013 dollars)
construction in 2016-2021 whereas the needs represent the average annual needs over twenty years
3 Other category includes aviation buildings that support transportation equipment and multimodal facilities Trails and Transit notably excludes investments and OampM spending made by the transit contractors who operate within Denali NPP but does include Denalirsquos own investment in bus transit facilities such as buildings lots and experimental hybrid buses 4 Routine planning and administration needs are not included in NPS facilities management data systems but can be assumed to continue at historical levels Additional unquantified planning needs are likely in the LRTPrsquos horizon including work in the parkrsquos entrance area coordination with private shuttle services and the Alaska Railroad and transportation planning to maintain park operations in the face of climate change impacts
DenaliLong Range Transportation PlanFinancialTechReportndashFINALDRAFT 7
Priority Estimated Annual Optimizer Band Equivalent Transportation Needs
Highest Priority $377 M Band 1 High Priority $584 M Band 2 Other Priority $281 M Bands 3 4 5
Programmatic Needs Some of the lifecycle stage needs are also considered programmatic needs for transportation facilities at Denali NPP Programmatic needs include work necessary to meet standards set by safety accessibility environmental and fire safety requirements It is generally analogous to code compliance work that would be the responsibility of a facilities manager or an architect hired by a private business
Figure 1 summarizes estimated programmatic needs for the Denali NPP transportation asset portfolio which total less than $300000 Transportation facilities generally have relatively small programmatic needs compared to facilities such as visitor centers housing and offices Although not broken out in the historical and forecast data these types of projects are included in the NPS Facility Management Software System (FMSS) as needs Denali NPPrsquos programmatic needs are included in the overall $1242 M per year needs as capital investment or component renewal needs They are classified as capital investment if plans are to proactively address them as individual projects or as component renewal when addressed through a rehabilitation project that focuses on a low condition rating
Figure 1 Denali NPP Transportation Programmatic Needs
Investments by Asset Priority The final classification for investments is what priority of assets they were used to build maintain or repair NPS financial and asset management systems do not support this analysis for the historical or forecast data Each future investment need at Denali NPP is associated with the priority of the asset or the project itself this is shared below in Table 4 For the purposes of this plan Highest Priority is generally defined as Optimizer Band 1 High Priority is defined as Optimizer Band 2 Optimizer bands 3-5 are defined as ldquoother priorityrdquo Although they are not banded as such critical Park Road work is labeled as Highest Priority consistent with the priorities discussed during the investment strategy section later in this report
Table 4 Estimated Annual Needs by Priority
Denali NPP differs from other National Parks and the NPS as a whole due to the relatively low proportion of the total need in the highest
DenaliLongRangeTransportation PlanFinancialTechReportndashFINALDRAFT 8
priority need category Many transportation facilities in Denali NPP have been categorized in optimizer bands 2-5 This reflects the values laid out in Denali NPPrsquos Foundation Statement that place a high priority on investment in resource protection science and other portfolio areas ahead of transportation and broader visitor use needs As a result the park is able to cover its entire highest priority transportation needs given current funding In fact the $775 M per year in forecasted funding is enough to cover 80 of the highest and high priority transportation needs combined However there are still high priority transportation needs that will remain unmet unless additional funding is found and longer-term and lower-priority needs that cannot be met with forecasted funding
Investment Strategies The final step of the financial planning process for NPS LRTP development is the formulation of an investment strategy It is a synthesis of the planrsquos goals and objectives already formulated projects and other transportation-related needs and the reality of the constraints that exist in the current funding environment This section of the report describes the process used by the Denali LRTP team to identify several potential investment strategies including the strategy selected by Denali NPP staff for the Denali LRTP It also discusses potential alternatives which park management may consider if future funding or visitation deviates significantly from the forecast referencing the planning scenarios used in the development of the Denali LRTP
Methodology The key to understanding the funding strategy process is that funding in a constrained environment is a zero-sum game All investment strategies make use of the same $78 M annual funding amount that is forecasted for the near future Because transportation needs exceed this amount and because moving funds from other purposes deprives those projects of needed funding all investment strategies shift funds from one set of priorities to another The OampM strategy option shown in Table 5 for example focuses on staying current on annual operations and preventive maintenance work at the expense of larger repair projects
Unlike the plans for the National Capital Southeast Midwest Regions and the NPS as a whole the Denali LRTP used a single modeling tool to model the results of the different funding strategies on the Denali NPP transportation system A deferred maintenance (DM) FMSS-based tool was modified by a contractor (Booz Alan Hamilton) to work at the unit level and take into account park specific facilities such as the unpaved Park Road This tool uses extracts from FMSS to estimate Facility Condition Index (FCI) and DM outcomes given a known annual funding level The FCI outcomes reported for this effort are lsquoAdjusted FCIrsquo which includes programmatic needs and an anticipated 35 cost markup in addition to the ldquorawrdquo DM normally used in calculation of the FCI
Strategy Development Process
Methodology and Initial Strategy Concepts The team held several workshops and follow-up discussions with NPS stakeholders and partners to identify candidate strategies and to select the Denali NPP LRTP Investment Strategy (p 12) Internal NPS stakeholders included Denali NPP staff Alaska Region staff and the Washington Support Office (WASO) Partner input included expertise from FHWA Western Federal Lands Highway Division and US DOT Volpe Center staff familiar with the NPS LRTP financial planning process
The team worked with stakeholders to identify potential candidate strategies in light of CIS and TCFO policies best practices and past investment patterns (see Table 2 and Table 3) The initial investments strategies are shown in Table 5 below and were based on trends discussed by the project team early on in the Denali LRTP
DenaliLong Range Transportation PlanFinancialTechReportndashFINALDRAFT 9
The reaction to the strategies from park staff indicated high interest in the OampM strategy ndash if the park is able to at least stem the growth in deferred maintenance using its typical transportation funding sources then the park can later seek out additional funds to rehabilitate facilities that are no longer in a state of good repair The specificity of the three strategies that make different kinds of improvements was eliminated in favor of a general ldquomake improvementsrdquo strategy since transit and trails enhanced ITS and safety and emergency response are all priorities at the park that vary from year to year Finally Denali NPP staff noted that given its current condition the unpaved section of the Denali Park Road could still be one of the best unpaved roads in Alaska even with a reduction in maintenance levels so exploring redirecting some funding from the Park Road to other facilities in the park might be
Table 5 Initial Investment Strategy Concepts
Investment Strategy Option
Invests inhellip At the expense ofhellip
Business as usual Highest priority assets Lower priority assets
OampM emphasis Fund 100 of annual OampM needs for all assets Capital investments and rehabilitation
Transit and trails $1 M for existing transit and trails before other investments $1 M for roads and parking
Make improvements $1 M per year for new assetsservices (eg employee transit real-time bus trackers new trails)
$1 M less for annual OampM and rehabilitation
Safety and programmatic needs
Programmatic and safety needs before everything else (eg accessibility slope stability)
$1 M less for annual OampM rehabilitation
a viable option Various sections of the Park Road meet different condition criteria from good to fair to poor
Refined Investment Strategies No one strategy rose above others as a preferred strategy in the first round of modeling but the number of strategies was narrowed to two Both strategies funded all operations and maintenance needs and ensure that planned projects such as the paved Denali Park Road rehabilitation are completed but one option set aside $1 M per year for improvements or new facilities Table 6 below shows the tradeoffs of the two refined general strategies
Table 6 Refined Investment Strategies
Strategy Invests inhellip At the expense ofhellip
Cover all OampM complete planned projects
OampM and critical near-term repair needs
Making improvements
Cover all OampM complete planned projects and reserve $1Myr for improvements
OampM critical near-term repair needs and improving transportation at Denali
Buying down deferred maintenance
Unpaved Denali Park Road Analysis In addition to these two strategies Denali NPP staff also wanted to test whether transportation funds allocated to the unpaved Park Road in a business as usual approach could be shifted to other purposes The LRTP team as well as staff from Denali NPP and the Alaska Region developed five different options for unpaved road condition targets that could be modeled to estimate costs of different sets of conditions Table 7 below summarizes these five sets of condition targets Each of the two general strategies were tested using the five sets of condition targets for a total of ten investment strategy and condition results The strategies in Table 7 highlighted in red were not achievable give projected funding levels and established higher priorities
DenaliLong Range Transportation PlanFinancialTechReportndashFINALDRAFT 10
Table 7 Unpaved Park Road Conditions
Strategy Goals Annual Cost
Plan A Maintain all Park Road segments in good condition $43 M
Plan B Maintain all Park Road segments in fair condition $37 M
Plan C Set Park Road conditions from segment to segment recognizing that some segments are costlier to maintain in good condition than others
$29 M
Plan D Follow the VMPrsquos ldquotelescopingrdquo approach by keeping conditions good in the first part of the road fair in the middle part and poor at the western end
$25 M
Plan E Follow the VMPrsquos ldquotelescopingrdquo approach by keeping conditions good to fair in the first to middle parts of the road and poor at the western end
$27 M
Plan F VMP ldquotelescopingrdquo approach as in Plan E but with further lowered condition targets for two of the most expensive areas - MP 43-47 and MP 88-92
$20 M
Refined Strategy Results
general strategy was discarded Even without reserving $1 M per year projected funding is insufficient to meet the good to fair
Unlike the initial strategies several of the refined strategies were not viable None of the condition targets on the unpaved Park Road could be met if Denali NPP was to reserve $1 M per year for making improvements elsewhere on the park and so that
conditions proposed under plans A and B for the unpaved park road without scaling back commitments to OampM planned repaving of the paved sections of the Park Road and the rest of Denali NPPrsquos transportation facilities Additional funding could make Plans A and B possible ndash about $13 M per year more would allow for Plan A to be achieved and $07 M more per year would allow plan B to be achieved
Plans C D E and F are viable given currently constrained funding levels Plan C shows that it is possible to meet all of the investment strategyrsquos commitments and still maintain the unpaved Park Road on a segment-by-segment basis The conditions explored in Plan C take the relative expensive of each segment into account and the most difficult segments are allowed to remain in fair to poor condition However modeling showed that meeting these conditions would provide almost no funding for other transportation priorities
Plan D applies the Vehicle Management Planrsquos ldquotelescopingrdquo approach to the maintenance of the unpaved Denali Park Road and targets mid-poor condition for the farthest west segments which are intended to be more rustic and less traveled but keeps the middle and eastern segments in fair to good condition Under this plan nearly $05 M per year would be available for other transportation priorities Plan E made slight changes to keep more of the road in good condition instead of fair
Plan F was ultimately selected as the condition target for the Denali NPP LRTP This option retains the approach of Plan E but reduces condition targets for two sections which are particularly challenging and expensive to maintain Under plan F Polychrome Pass would be improved slightly (but still be in poor condition) while the final stretch of the park road would be allowed to decline to poor condition These two changes free about $06 M per year for use elsewhere on the road and in Denali NPP More information about these two segments is provided in Appendix A at the end of this technical report
Denali LRTP Investment Strategy The refined strategy results narrowed down the policy options for the unpaved Park Road and led to the selection of the Denali LRTP Investment Strategy as the best fiscally-constrained option for meeting the goals and objectives of the plan This strategy
DenaliLong Range Transportation PlanFinancialTechReportndashFINALDRAFT 11
would invest Denalirsquos forecasted $775 M per year in four categories as shown below in Table 8 and Error Reference source not found below
Table 8 Denali NPP LRTP Investment Strategy
Category Estimated share Estimated annual Percentage of of annual funds investment needs met
Operations and Preventive 37 $29 M 100 of needs Maintenance (all met transportation assets)
Rehabilitate Paved Portion of 24 $19 M 100 of needs the Denali Park Road met
Repair and Maintain the 26 $ 20 M 46 of needs met Unpaved Portion of the Denali Park Road
Repair and Improve Other 13 $ 10 M 24 of needs met High-Priority Transportation Assets
Totals 100 $ 78 M 63 of all needs met
The Denali LRTP Investment Strategy strikes a balance between several different priorities for transportation at the park and lies within the ldquoManagement Actions of No Regretrdquo area of the Denali LRTP scenario chart The strategy proposes to fully fund OampM needs in order to slow the decline of facilities and ensure a better visitor experience It continues planned investments on the paved section of the Park Road to achieve a good condition rating and continues to make funding available to address deferred maintenance on the unpaved sections of the Park Road However the strategy sets lower condition targets for sections of the unpaved Park Road which are further into the park and which are less traveled by visitors in order to reserve funding for other segments of the Park Road and for entrance area transportation facilities (eg aviation parking areas new priorities) This approach is consistent with the Vehicle Management Plan which envisions lower traffic volumes and a more rustic experience the further the road extends from the park entrance area
Ultimately because funding needs exceed available resources the condition of transportation facilities at Denali NPP is expected to decline overall FCI ratings across the Denali NPP transportation system today are modeled at 0148 or the low end of fair condition Continued scarce funding for transportation will reduce conditions to 0185 by 20215 However higher priority transportation facilities are expected to remain in fair condition overall as described by the Investment Strategy
5 FCIratings are modeled on a 0‐1 scalewhere0000isperfect conditionand1000iscompletelydegradedcondition
DenaliLong Range Transportation PlanFinancialTechReportndashFINALDRAFT 12
DenaliLRTPInvestment Strategy 13
37
26
24
OperationsandPreventiveMaintenance(all transportationassets)
RehabilitatePavedPortionoftheDenaliParkRoad
RepairandMaintaintheUnpavedPortion ofthe Denali Park Road
RepairandImproveOtherHigh‐PriorityTransportationAssets
The funding forecast in the Denali LRTP is only the most likely scenario for each program and in reality the amount of annual transportation funding will vary as will visitation Table 9Error Reference source not found below shares some management actions for when funding and visitation levels take Denali NPP out of the area of management actions of no regret Generally when visitation is lower it is a better time for disruptive work such as addressing major needs and accomplishing maintenance projects that were deferred Times of high visitation call for more investment in OampM and investment in new services to meet emerging visitor needs When funding prospects are good then more money is available to make improvements catch up on deferred maintenance and prepare plans for the future When funding is short then many necessary improvements have to be delayed and park staff can only fund core operations and critical repair work
Figure 2 Denali LRTP Investment Strategy
Denali Investment Strategy and LRTP Scenarios All of the funding strategies considered for the Denali NPP LRTP assumed the same funding forecast and would fall within the ldquoManagement Actions of No Regretrdquo area on the scenario planning graphic reproduced in Error Reference source not found below This area represents a balance between times of high and low visitation and high and low funding for the park It is calibrated based on an average of funding and visitation over time Years within one standard deviation of these means lie within it if they are more than one standard deviation away from the average then they are said to be in one of the four ldquoquadrantsrdquo
DenaliLong Range Transportation PlanFinancialTechReportndashFINALDRAFT
Figure 3 Denali LRTP Scenarios
13
Table 9 Potential Management Actions by Scenario
Losing Ground Popular Park
Emphasize more of Funding OampM Introducing new services
Emphasize less of Making improvements Funding deferred maintenance Initiating major capitalrehabilitation projects
Emphasize more of Funding OampM Making improvements Introducing new services Planning for future needs
Emphasize less of Funding deferred maintenance Initiating major capitalrehabilitation project
Turn out the lights Surplus of Money
Emphasize more of Funding deferred maintenance
Emphasize less of Funding OampM Making improvements Introducing new services
Emphasize more of Making improvements Funding deferred maintenance Initiating major capitalrehabilitation projects Planning for future needs
Emphasize less of Funding OampM Introducing new services
14DenaliLong Range Transportation PlanFinancialTechReportndashFINALDRAFT
Appendix A Unpaved Park Road Condition Targets
Unpaved Denali Park Road Condition Targets Plans C D and E for the unpaved Denali Park Road examined options for managing each segment of the road to an individually set condition target Each of these targets is based on the overall Vehicle Management Plan and accounts for past challenges or known issues with individual segments Plan F was ultimately selected for its ability to maintain acceptable condition levels while also freeing up funding for other transportation needs In particular Plan F was selected because the condition targets reflect the overall management approach to the road where the western-most sections are desired to be more rustic and remote-feeling and the eastern-most sections are in better conditions to handle more intensive use Tables 10 and 11 below summarizes the conditions for the unpaved segments of the Denali Park Road under the Denali LRTP investment strategy
Conditions are measured in FCI where a higher value represents worse condition and a lower value represents better condition FCI data for the unpaved Park Road is based on estimates by staff responsible for maintaining the unpaved Park Road after the 2016 opening
Table 10 Conditions of Unpaved Segments of Denali Park Road Reflected in Denali LRTP Investment Strategy
Mileposts Segment Name Current Condition
Target Condition
Change in Condition
MP 15 to 32 Savage to Teklanika Bridge Low‐good High‐fair Small decline MP 32 to 39 Igloo Forest to Sable Pass Mid‐fair High‐fair Small improvement MP 39 to 43 Sable Pass to East Fork Bridge Mid‐fair High‐fair Small improvement MP 43 to 47 Polychrome to Plains of Murie Mid‐poor High‐poor Small improvement MP 47 to 62 Plains of Murie to Stony Overlook Mid‐fair Low‐fair Small decline MP 62 to 66 Stony Overlook to Eielson Low‐fair Low‐fair No change MP 66 to 70 Eielson to Grassy Pass High‐poor Mid‐poor Small decline MP 70 to 88 Grassy Pass to Boundary Pit Mid‐fair Mid‐poor Moderate decline MP 88 to 92 Boundary Pit to Kantishna Very‐poor Low‐poor No change
DenaliLong Range Transportation PlanFinancialTechReportndashFINALDRAFT 15
Table 11 Denali Unpaved Park Road Segments ‐‐Current Conditions and Strategy Conditions Explored During LRTP Development
Plan A Plan B Plan C
Plan A Plan B Plan B Plan C Current Desired Plan A Strategy Annual Strategy Plan C
Mileposts Segment Name Conditions Conditions Annual Needs Conditions Needs Conditions Annual Needs
MP 15 to 32 Savage to Teklanika Bridge 009 0109 $ 013 M 013 $ lt01 M 0109 $ 013 M
MP 32 to 39 Igloo Forest to Sable Pass 013 0109 $ 014 M 012 $ 011 M 0129 $ 093 M
MP 39 to 43 Sable Pass to East Fork Bridge 013 0109 $ 0 24 M 013 $ 020 M 0139 $ 019 M
MP 43 to 47 Polychrome to Plains of Murie 035 0109 $ 120 M 014 $ 110 M 0245 $ 074 M
MP 47 to 62 Plains of Murie to Stony Overlook 013 0109 $ 070 M 013 $ 056 M 0139 $ 052 M
MP 62 to 66 Stony Overlook to Eielson 014 0109 $ 025 M 014 $ 020 M 0139 $ 0 20 M
MP 66 to 70 Eielson to Grassy Pass 017 0109 $ 044 M 014 $ 037 M 0169 $ 030 M
MP 70 to 88 Grassy Pass to Boundary Pit 012 0109 $ 056 M 012 $ 051 M 0169 $ 0 32 M
MP 88 to 92 Boundary Pit to Kantishna 0499 0109 $ 072 M 014 $ 068 M 0324 $ 043 M
Total MP 15 to 92 Total Total $ 435 M Total $ 376 M Total $ 293 M
Plan D Plan E Plan F (Selected)
Plan D Plan E Plan E Plan F Current Strategy Plan D Strategy Annual Strategy Plan F Annual
Mileposts Segment Name Conditions Conditions Annual Needs Conditions Needs Conditions Needs
MP 15 to 32 Savage to Teklanika Bridge 009 0109 $ 013 M 0109 $ 013 M 109 $ 013 M
MP 32 to 39 Igloo Forest to Sable Pass 013 0109 $ 014 M 0109 $ 014 M 109 $ 014 M
MP 39 to 43 Sable Pass to East Fork Bridge 013 0109 $ 024 M 0109 $ 024 M 109 $ 024 M
MP 43 to 47 Polychrome to Plains of Murie 035 0149 $ 11 M 0149 $ 11 M 245 $ 074 M
MP 47 to 62 Plains of Murie to Stony Overlook 013 0149 $ 047 M 0149 $ 047 M 149 $ 047 M
MP 62 to 66 Stony Overlook to Eielson 014 0149 $ 018 M 0149 $ 018 M 149 $ 018 M
MP 66 to 70 Eielson to Grassy Pass 017 0325 $ - 0325 $ - 325 $ -
MP 70 to 88 Grassy Pass to Boundary Pit 012 0325 $ - 0325 $ - 325 $ -
MP 88 to 92 Boundary Pit to Kantishna 0499 0325 $ 043 M 0325 $ 043 M 449 $ 012 M
Total MP 15 to 92 Total Total $ 266 M Total $ 266 M Total $203 M
Plan F Unpaved Road Segments The final change that the LRTP team made while discussing the road strategies with park staff was to lower the condition targets for two of the most difficult segments along the unpaved Park Road This section describes these two segments and how accepting a lower condition in these areas can allow for better conditions on other parts of the Denali NPP transportation system
Mileposts 43 to 47 Polychrome Pass to the Plains of Murie The unpaved Denali Park Road segment of Polychrome Pass to the Plains of Murie has been identified by Denali NPP staff as especially difficult to maintain and repair It is facing significant geotechnical hazards that will worsen as time goes on and climate
DenaliLong Range Transportation PlanFinancialTechReportndashFINALDRAFT 16
change accelerates permafrost thaw Making improvements to this section that would take it from the middle of the poor condition band to the low end of fair condition band as explored in Plan D is projected to cost $107 M per year Making lesser improvements from the middle of the poor condition band to the high end of the poor condition band as called for in Plan C would cost $074 M per year instead saving $033 M per year for other uses Thus the selected strategy (Plan F) will target a condition rating at the high end of the poor band instead of a fair rating as with other segments in the central segment of the unpaved Denali Park Road (Igloo Forest to Eielson Visitor Center) This is not an ideal or desired condition for this segment but reflects the challenges of working in this area given limited funding
Mileposts 88 to 92 Boundary Pit to Kantishna The final segment of the unpaved Denali Park Road is currently at the very low end of poor condition and is bordering on severe condition All of the alternative unpaved road plans propose to improve this section However improving the condition from the low end of poor condition to the middle of poor condition as explored in plans C and D is projected to cost $043 M per year Investing this much in one of the least-utilized segments of the Denali Park Road would limit funds for critical investments elsewhere As a result the Denali Investment Strategy proposes lesser improvements at a cost of $012 M per year
DenaliLong Range Transportation PlanFinancialTechReportndashFINALDRAFT 17
National Park Service US Department of the Interior
Denali National Park and Preserve Long-Range Transportation Plan
Appendix G Project Selection Checklist
DENA LRTPProjectSelectionCriteriaChecklist Project Name
PMIS Funding Source(s)
1 Long Range Transportation Plan ndash the project generally adheres to the following
National Long Range Transportation Planrsquos Goals and Objectives (see Attachment A)
Asset Management Transportation Finance Resource Protection
Visitor Experience Safety
Alaska Regional Long Range Transportation Planrsquos Goals and Objectives (see Attachment B)
System Management Mobility User Experience
Resource Protection Climate Change
Denali NPP Long Rang Transportation Planrsquos ldquoactions of no regretrdquo (see Attachment C)
Goal Area ____________________________ Action of No Regret __________
2 Financial Strategy ndash the project meets the following
Capital Investment Strategy score ______________
optimizer band 1 2 3 4 5
Consistent asset investment based on scenario quadrant position (Attachment D)
Consistent with proportionate investment within road management zones (Attachment D)
Milepost or Road Segment ______________________
Consistent with one or more of the following
Operations and Maintenance (OampM)
Rehabilitated Paved Road
Repair amp Maintain the Unpaved Road
Repair amp Improve Other High‐Priority Transportation Assets (bridges transportationmultimodal trail)
3 Risk Priority
Response to current high priority risks based on documented assessment (Attachment E)
Unstable Slopes
River and Stream Flooding
1
Permafrost Subsidence
Culverts ndash Operations and Maintenance (OampM)
Gravel Production Processing or Purchase
Relevance or proximity to mapped hot spot (see Attachment F)
‐ Attachment F should have all the hot spots for Park Road on a map Is this in DNPP LRTP Or do we
give them a link for online info
4 Operations and Maintenance
Investment Type ndash this project is a
New Investment ‐ offset in the cost of OampM
(presumed increase has been addressed by ____________________________________________________)
Replaced investment ‐ offset in the cost of OampM
(presumed decrease or net zero increase has been addressed by ___________________________________)
Eliminated Investment ndash offset in the cost of OampM
(presumed decrease has been addressed by ____________________________________________________)
2
National Park Service US Department of the Interior
Denali National Park and Preserve Long-Range Transportation Plan
Appendix H Public Comment Summary
Public Comment Summary Denali National Park and Preserve Long-Range Transportation Plan
Public comments are organized into two categories common and specific Common comments are
paraphrased themes that appear in multiple comment submissions Responses to common comments
are summarized in Table 1 Specific comments request a particular change When specific comments
seek changes that are accurate reasonable feasible and logically consistent they were made and
included in the final document Other comments include general statements about the quality of the
document suggestions for future plans or ideas for coordination next steps management strategies
park priorities or projects These comments are valued and are available to inform other park planning
efforts and will be referenced during the leadup to this planrsquos eventual update
Table 1 Common Comment
Paraphrased Comment Comment Response
1 Winter or offseason travel is not sufficiently represented in the plan
During the development of this plan numerous issues and needs surfaced as topics that warrant further study and consideration Public comments were an especially meaningful source for identifying topics in need of additional attention These findings will be used to inform the development of the planrsquos update as well as other plans such as the Winter Recreation Plan
2 There is insufficient data or information regarding specific transportation related conditions (eg trail crowding locations of specific facilities rest stop vehicle counts large vehicle counts winter routes locations etc)
The plan relied on facts data and concepts cited in existing park plans studies and other reports No additional data collection or data analysis was conducted as part of this planrsquos development process As such present day conditions or terminology may differ from those described in the plan Gaps in data and understanding will be reassessed in this planrsquos update
3 The plan does not map specific transportation use access facilities for the entirety of the planrsquos 20-year horizon
As a high-level strategic document the plan is not intended to identify specific short-term or long-term project needs or changes park access locations
1
Paraphrased Comment Comment Response
4 If a specific need is not mentioned in the plan (eg backcountry landing strip location) it means that the specific need will be precluded from future project selection and funding
The plan is a high-level strategy document and is not intended to identify and prioritize specific projects While the plan sets high-level goals that are used to evaluate the merits of future projects it is not a project list Whether or not a specific project idea is listed in this plan has no bearing on its ability to be developed or its funding merits
5 The plan does not describe specific actions that the park will take to address a very specific issue (eg plans to address the safety of backcountry landings strips in light of climate change cycling guidelines commercial use authorization for guided hikes off Park Road new parking lot locations more tours etc)
During the development of this plan numerous issues and needs surfaced as topics that warrant further study and consideration Public comments were an especially meaningful source for identifying topics in need of additional attention These findings will be used to inform the development of the planrsquos update
6 Data facts or terminology used in the plan appear to be out dated
The plan relied on facts data and concepts cited in existing park plans studies and other reports No additional data collection was conducted as part of this planrsquos development process As such present day conditions or terminology may differ from those described in the plan
7 The plan does not sufficiently outline specific actions to maintain and improve the parkrsquos soundscape
During the development of this plan numerous issues and needs surfaced as topics that warrant further study and consideration Public comments were an especially meaningful source for identifying topics in need of additional attention These findings will be used to inform the development of the planrsquos update
8 The plan does not go far enough in offering solutions that address threats to park access created by climate change and natural disasters
During the development of this plan numerous issues and needs surfaced as topics that warrant further study and consideration Public comments were an especially meaningful source for identifying topics in need of additional attention These findings will be used to inform the development of the planrsquos update
9 The plan does not go far enough to protect resources
During the development of this plan numerous issues and needs surfaced as topics that warrant further study and consideration Public comments were an especially meaningful source for identifying topics in need of additional attention These findings will be used to inform the development of the planrsquos update
2
Paraphrased Comment Comment Response
10 The plan does not go far enough to protect access
During the development of this plan numerous issues and needs surfaced as topics that warrant further study and consideration Public comments were an especially meaningful source for identifying topics in need of additional attention These findings will be used to inform the development of the planrsquos update
11 Goal andor objective indicators or performance measures are too limited
The plan relied on readily available data and findings cited in existing park plans studies and other reports No additional indicator data was collected as part of this planrsquos development The need for additional data for informing additional indicators will be considered for the planrsquos update
12 Specific details from the Vehicle Management Plan are not reflected in this plan
The long range transportation plan does not supersede the Vehicle Management Plan in any way Omission of Vehicle Management Plan data indicators and conclusions does not negate their significance in how the park is managed
3
- Appendix A - Literature Review Summary Report (1)
- Appendix B - Denali Long-Range Transportation Planning and Acoustic Resources (2)
- Appendix C - Denali Park Road Risk Assessment Utilizing the Unstable Slope Management Program (1)
- Appendix D - Current and Future Partner Projects (3)
- Appendix E - Park Transportation Investment Needs Analysis (1)
-
- Structure Bookmarks
-
- Denali National Park and PreserveLong-Range Transportation Plan
- Appendix EPark Transportation Investment Needs Analysis
- ABSTRACT
- INTRODUCTION
- PATINA DESIGN
- OVERVIEW
- VEHICLE MANAGEMENT PLAN
- VECTOR ANALYSIS
- DATA COLLECTION
- TRANSPORTATION NETWORK
- ASSET METRICS
- HIGH RISK
- INVESTMENT RANKING
- GOAL AREAS
- METHODOLOGY
- DATA PREP
- LAYER WEIGHTING
- COMPOSITE ANALYSIS STEPS
- SELECTED RESULTS
- OUTPUTS
- ROAD SEGMENT FINDINGS
- Motorized Paved Zone
- Wildlife Viewing Subzone 1
- Wildlife Viewing Subzone 2a
- Wildlife Viewing Subzone 3
- Wildlife Viewing Subzone 2b
- DISCUSSION
- INTERNAL WEIGHTING
- SKEWED DATA
- SPATIAL SPREAD OF DATA
- NEXT STEPS
-
- Appendix F _ Denali Funding Plan
- Appendix G - Project Selection Checklist
- Appendix H - Comment Responses (1)
-
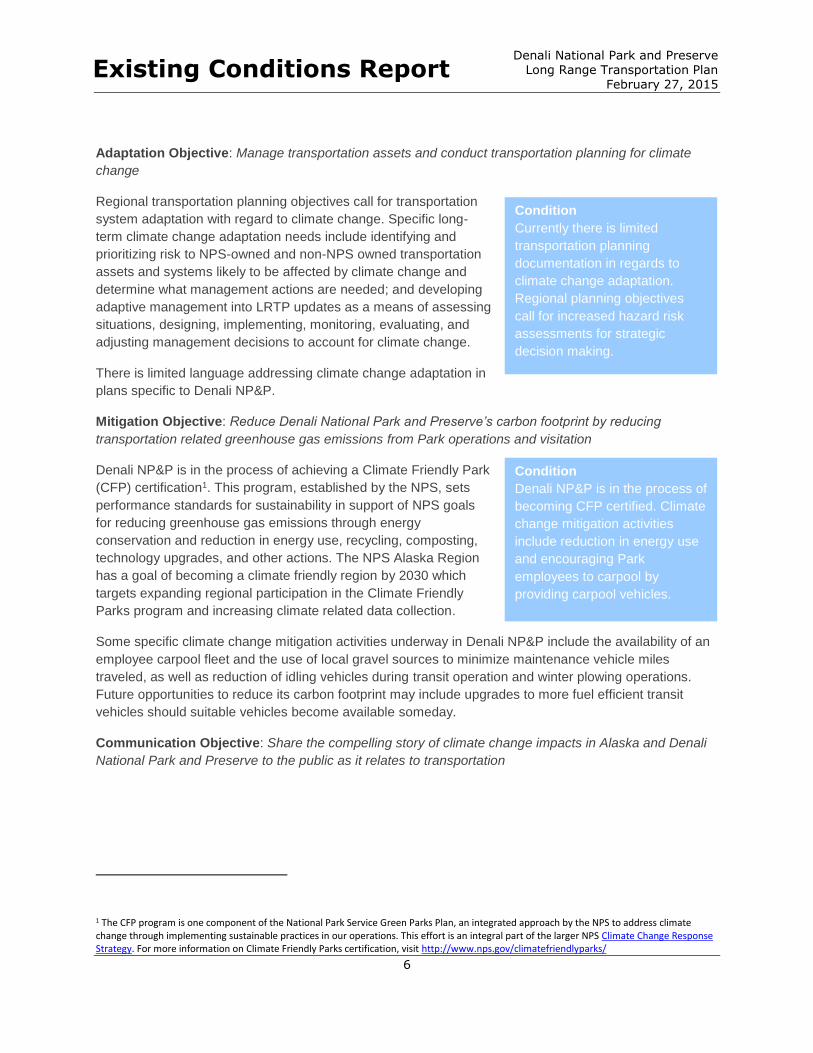
Denali National Park and Preserve Long Range Transportation Plan Existing Conditions Report
February 27 2015
At this time there is no formal region-wide communication program Condition to describe the relationship between transportation and climate
Although there is no formal change At the park scale there are interpretive programs within
guideline at the regional level for Denali NPampP to explain the impacts of climate change on the
communicating climate change landscape Because Denali NPampP extensively utilizes transit impacts Denali NPampP has some services to enhance visitor experience opportunities exist to show programs to communicate air quality and other benefits of transit service as compared to
climate change impacts to its personal vehicle use
visitors
Regionally there are efforts underway to communicate with both
external partners and internal staff members about the successes and failures concerning
environmentally sustainable transportation practices and to develop and fund educational materials for
internal and external audiences
33 User Experience Goal
Proactively enhance the Denali National Park and Preserve experience
User Data Objective Collect analyze and use transportation and user information to enhance Park
experiences into the future
Most of the documents reviewed for this baseline conditions report Condition rely on user information to determine a condition or characteristic Denali NPampP collects analyzes Within Denali NPampP there is increased interest in collecting user and uses transportation and information because it informs a more proactive approach to user information to enhance transportation system performance visitor experience and natural Park experiences The Park also resource impacts User data is collected through different methods has a vision for how this practice and is used for numerous ends These include can be improved in the future
bull Visitor surveys are used to gauge visitor satisfaction as
well as transportation system performance The most recent survey was collected in 2006
bull Static visitation collection points at the Savage River Check Station visitor centers and other
travel waypoints are used to track visitor characteristics and behavior
bull As of 2013 transit data is collected on all Park transit vehicles by bus drivers and through mobile
tracking devices On-board devices track the number of tickets sold number of passengers GPS
locations of buses and durations of vehicle stops Bus drivers manually input the purpose of the
stop and information about hiker wait times which is of high importance to the Park Service This
data can be made available in real time and can be used to monitor and respond to varying travel
demands The NPS currently has staff in the Resources Division dedicated to analysis of the data
collected by the transit operation
bull Permits collected for the purpose of either access by private vehicle with right-of-way
authorization for overnight backcountry access or by commercial airplane are useful for tracking
visitation to the most protected areas of the Park
bull Other information currently collected includes Service-wide Traffic Accident Reporting System
(STARS) and Fatal Analysis Reporting System (FARS) data for recording vehicular accidents
7
Denali National Park and Preserve Long Range Transportation Plan Existing Conditions Report
February 27 2015
Needs and opportunities for user data include specifying visitor experience benchmarks for number of
vehicles at wildlife stops and number of vehicles in a viewscape to serve as reliable baseline condition
data Other recommendations include additional road audits to reduce entrance fee non-payment More
flexibility to use franchise fees to fund comprehensive data gathering is seen as an opportunity to improve
visitor experiences while protecting natural resources
Multimodal Transportation Objective Provide an appropriate effective and conflict free multimodal
transportation system to and within Denali National Park and Preserve
For much of the Parkrsquos history maintenance and transportation Condition
improvements focused on Denali Park Road More recently the Multimodal access is historical
emphasis includes the Parkrsquos transit system which increases necessary and desired by
access while minimizing natural resource impacts Much of the recreationalists and subsistence
desired future conditions are related to the Park implementing more users The most common
outcome-based approaches to analyzing user information as multimodal conflicts are due to
opposed to relying solely on historic comparisons crowding at wildlife stops and
rest stops along Denali Park Appropriate multimodal transportation service is often defined by its
Road ability to make Denali NPampP accessible to a wide range of visitors
with overarching consideration for the wilderness character that the system accesses This definition of
appropriate access relates closely to the Denali NPampPrsquos purpose and mission as stated in its Foundation
Statement Appropriate access depends on the observed and anticipated effects to natural resources
(VMP 2012) Increased visitor access is desirable if it does not cause negative impacts on environmental
conditions At locations within the Park where the natural environment is still intact even small increases
in visitation or changes in access can have dramatic impacts on natural systems
Multimodal issues that reoccurred in several reviewed documents and in comments from Park staff
include confusion about shuttle service operation desire for better connections between the Park local
communities and visitor accommodations employee travel to from and within Denali NPampP safety
comfort and quality of interpretive experience and transportation service affordability
Multimodal conflicts identified in plans include general congestion along Denali Park Road and in Nenana
Canyon crowding at wildlife stops and rest stops within the Park narrow roadways for bicycling and
hiking in the ldquofront countryrdquo and at particular locations east of Savage River and conflicts between land
and air visitation in terms of soundscape impacts Congestion challenges are anticipated to grow as
visitation levels increase As a result Park managers may face ongoing decisions about how to balance
environmental priorities and resource protection with transportation system capacity when responding to
increased demand
The Park has several efforts underway to improve multimodal travel opportunities and travel experiences
within Denali NPampP Park managers are using indicators to measure performance of the transit system
and gauge overall user experience These include hiker wait times numbers of vehicles at wildlife stops
number of vehicles in viewsheds numbers of vehicles at rest stops nighttime traffic levels large vehicle
traffic and sheep gap spacing Proposed construction of an eight-foot gravel shoulder along sections of
Denali Park Road from mile eight to Savage River cited in the Final Entrance Area and Road Corridor
Development Plan could provide safety and traveling comfort for bicyclists and hikers and may improve
8
Denali National Park and Preserve Long Range Transportation Plan Existing Conditions Report
February 27 2015
opportunities for wildlife viewing Also modifications to the general management of Denali Park Road
could improve protection of natural habitats beyond Savage River
There is an opportunity to gain efficiency in transit operations by improving consistency in transit seating
and consolidating shuttle services in the entrance area and canyon Also expanding transit service north
to Healy and south to Carlo Creek and Cantwell in addition to increasing shuttle service between the
entrance area and McKinley Village is desired (Needs Assessment and Feasibility Study for a Community
Transportation System 2006)
34 Mobility Goal
Provide safe efficient and appropriate access to and within Denali National Park and Preserve
Safety Objective Provide safe access to and within Denali National Park and Preserve
Between 1990 and 2006 95 percent of all vehicular accidents in Condition NPSrsquos Alaska Region occurred in Denali NPampP with 58 percent of The historic character of Denali these accidents occurring on Denali Park Road (NPS Alaska Park Road creates safety Region LRTP 2012) Of the other accidents reported within Denali issues and due to its popularity NPampP 19 percent were located on the George Parks Highway both as a visitor attraction in the within the Park boundaries The remaining portion of vehicular Alaska Region and within Denali accidents occurred near the visitor parking areas or in NPampP most recorded accidents campgrounds The George Parks Highway is the direct road occur along the road Other connection between Anchorage and Fairbanks and a major travel safety s considerations include corridor for Denali NPampP visitors Between 2007 and 2010 31 total bicycle and pedestrian access in fatalities were reported on the George Parks Highway (NPS Alaska the front country and along Region LRTP 2012) sections of the George Parks
Highway and increased winter As identified in the VMP safety issues are associated with road
access travel along Denali Park Road The historic nature of the road may
in some locations limit sight distance restrict width for passing
vehicles and provide inadequate surface road friction (VMP 2012) Driver behavior is most likely a
contributing factor in vehicular crashes particularly for private vehicles traveling Denali Park Road during
off-peak seasons Impacts of severe weather events for Denali Park Road travelers are another safety
consideration These issues are also a top priority of the Parkrsquos General Management Plan and although very important must be balanced with active preservation of the road as characterized by the philosophy
to retain its telescoping from a full width paved profile at the entrance to the narrower unpaved gravel
profile at the western end
According to the visitor survey highlighted in the VMP the public indicates that they feel safe while using
Denali NPampPrsquos transportation system The most notable safety consideration perceived by the public is
related to travel over Polychrome Pass where Denali Park Road has steep drop-offs and the road is
narrow and winding Park management uses driver training driver spacing and wait times to address
safety issues at this location
9
Denali National Park and Preserve Long Range Transportation Plan Existing Conditions Report
February 27 2015
Safety is also a top priority for flight operations For example recommended flight tour routes are subject
to weather conditions and aircraft may be forced to deviate from planned routes if safety is at risk (Air
Tour Operations Best Practices 2012)
With increased opportunities for vehicular winter access emerging safety improvements related to winter
travel are a growing need Denali NPampP has a goal of minimizing wintertime safety-related incidents and
has an interest in determining baseline conditions so as to monitor future winter safety performance With
the trial winter plowing of the first 15 miles of Denali Park Road the Park continues to monitor visitor
safety during the extended period of winter and early spring driving conditions Commercial operators
also provide multi-modal access to the Park during winter months Denali NPampP staff is working with
commercial operators to implement safety measures for winter operation such as the required use of
emergency communication devices during operation
The collection of safety data and addressing inconsistencies in safety data reporting is identified as an
ongoing need
Access Objective Provide appropriate and efficient access for inspiration education research
recreation and other uses as provided for in ANILCA
Condition As stated in the General Management Plan the primary historic
Within Denali NPampP purpose of access to Denali NPampP is to accommodate viewing of
appropriate and effective access Mount McKinley and the Parkrsquos wildlife As documented
is determined by the assessed appropriateness of access is defined by the balance between
impacts to wildlife and cultural visitor accommodation with active protection of wilderness
resources Where the character The NPS therefore uses the least access restrictive
environmental conditions are management tool possible to maintain and promote the natural
more intact visitor access is resources protected by the area (General Management Plan
more closely managed New 2008)
vehicle management strategies
target this priority The level of appropriate access varies along Denali Park Road
Wildlife Viewing Subzones are used to distinguish appropriate level
of access A notable example includes the Parkrsquos VMP which allows 160 vehicles per 24 hour day
through mile 15 of Denali Park Road period while monitoring for violations of user experience standards
This number was derived through extensive research and rigorous travel modeling of Denali Park Road
and provides an overall increase in capacity for visitors while considering environmental impacts
Visitors typically arrive to the Park by private vehicle bus or train Many visitors arriving by bus or train
are cruise ship passengers and are traveling with fellow passengers as part of cruise packages Park
management desires to provide efficient access to visitors arriving by all modes of travel while also
providing for accessibility as delineated by the Americans with Disabilities Act (ADA) and Architectural
Barriers Acts (ABA) For areas of the Park with additional travel requirements this means ensuring a
transportation system that provides a meaningful high-quality opportunity for viewing scenic landscapes
and wildlife primarily through transit services (VMP 2012) In the future visitation is expected to grow
with a large portion of visitors arriving as part of organized tour companies or organizations
Considerations of access are therefore a topic of long-range concern as Denali NPampP is committed to
balancing access with the responsibilities of managing designated wilderness
10
Denali National Park and Preserve Long Range Transportation Plan Existing Conditions Report
February 27 2015
At the time that the Denali Park Road Visitor Survey (2010) was conducted 71 percent of visitors who
traveled beyond mile 15 were part of organized tours (ie Long Tour) These are highly interpretive trips
with designated stops at rest areas and impromptu stops for wildlife viewing Non-tour transit buses
traveling past mile 15 provide less interpretation and make impromptu stops for hikers and wildlife
viewing
Coordination with the visitor services concessioner is ongoing and the relationship between Denali NPampP
and any concessioner is viewed as integral to providing appropriate and effective access for Park visitors
User Information Objective Provide accurate and accessible information through a variety of means
about how to travel to and within Denali National Park and Preserve
The NPS is interested in providing information to potential and Condition repeat users about its transportation system and services at a Commercial and state tourism national regional and local level The Alaska Federal Lands LRTP initiatives are successful in and NPS Alaska Region LRTP summarize objectives and providing travel information to strategies that specifically address providing accurate and visitors prior to their arrival at accessible information for travel to and within federal lands and the Park Once at Denali NPampP several projects to enhance visitor information services the Park its concessioners and
local businesses provide Much of the marketing and development of traveler information for
interpretation through visitor Denali NPampP is championed by non-NPS organizations such as
centers transit and tour bus the Alaska Railroad concessioners and other area businesses
operations and many others Because Denali NPampP is a regular destination for commercial tour
Interpretation and transit system operations much of the information provided to potential visitors
visitor information improvements and visitors en route to the Park is provided by those organizations
are desired According to the Denali Park Road Visitor Survey issued in 2010
over half of the Denali NPampP transit users had received information from a travel agent about their visit to
the Park Another third of the respondents received information over the internet Denali NPampP maintains
a website with virtual tours guides and resources to help visitors plan trips to the Park Travel guides and
tour books are also popular means of learning about how to travel to and within Denali NPampP (NPS
Alaska Region LRTP 2012)
Traditional means for providing information at visitor centers and Wilderness Access Center are available
upon entering Denali NPampP Once aboard the short-tour and long-tour buses visitors have a wide range
of information available Tour bus drivers and guides provide extensive interpretation while transit drivers
may provide information upon request and at the discretion of a particular driver Several Denali NPampP
plans document the value of retaining experienced drivers This was seen as a major enhancement to the
overall visitor experience (Denali NP Bus Shuttle System Analysis 2013)
The most common need identified in planning documents is the necessity for better wayfinding and user
information about transit in hopes of reducing visitor confusion with the Parkrsquos transportation system
According to the VMP an objective of Denali NPampP management is to ldquoclearly communicate information about the system through a variety of meansrdquo Potential options for sharing information include improving
traditional methods such as maps brochures and signage The Alaska Region is also interested in newer
media options such as implementing intelligent transportation systems linked with websites mobile
devices and other personal communication technology According to a survey in 2010 transit users were
11
Denali National Park and Preserve Long Range Transportation Plan Existing Conditions Report
February 27 2015
not interested in receiving information from a recorded narrative about traveling Denali Park Road
Information delivered by bus drivers was preferred over prerecorded methods
Also with the introduction of enhancements to the off-season access programs Denali NPampP
management is interested in reducing the perception that the Park is closed during off-seasons by
increasing communications about opportunities for visiting the Park during the winter
35 System Management Goal
Develop a long-term transportation system to appropriately satisfy current and future land
management needs
Asset management Objective Apply available financial resources to essential transportation
infrastructure
Relative to other parks in the Alaska Region transportation assets
within Denali NPampP are some of the most costly This is primarily
due to Denali Park Road maintenance needs providing visitor
transit and tour services and experiencing the high visitation levels
during a very short summer season
In general transportation assets within Denali NPampP are
considered to be in good condition Road work is mainly
concentrated on bridge replacement road maintenance and
subgrade improvements In general road widening does not occur
However improving pullouts on the narrowest section of the road
to maintain safety standards des exist in asset planning
documentation The annual operations and maintenance budget for
road assets in Denali NPampP was approximately $12 million in 2010
(NPS Alaska Region LRTP 2012)
Denali NPampP management uses both quantitative and qualitative
measures to prioritize transportation system improvements The
2008 General Management Plan prioritizes road improvement
projects ranking corrective safety projects as the highest priority and other corrective maintenance and
repairs as secondary priorities The General Management Plan provides example projects from Denali
Park Road where potential improvements have been identified for multiple project categories (sight
distance improvements safe vehicle passing enhancements road surface friction improvements culvert
repairs etc) Denali NPampP has incorporated the NPS ldquooptimizer bandrdquo model of asset prioritization In
this model assets are scored by Asset Priority Index (API) to rank how critical assets are used in
accomplishing the Parkrsquos mission and goals In this model Facility Condition Index (FCI) indicates asset
condition and is used to determine eligible fund sources Projects are evaluated based upon their APIFCI
rank Using this method of asset evaluation all of the high priority assets (API of 75 or higher) are in good
or better condition (FCI of 03 or less) (Alaska Federal Lands LRTP 2012) Finally the asset needs are
filtered through the NPS Capital Investment Strategy (CIS) which expresses priorities in the form of
optimizer bands Optimizer bands 1 and 2 are associated with assets that are essential or extremely
important for a park to continue as described in its organic legislation
Condition
The availability of funds
particularly for funding transit
systems has decreased in
recent years Denali NPampP
management is using
quantitative and qualitative
indicators about the
transportation system to
prioritize transportation system
improvements With limitations
to increasing system capacity
Denali NPampP management is
working toward increased
system efficiency and better
coordination with transportation
partners
12
Denali National Park and Preserve Long Range Transportation Plan Existing Conditions Report
February 27 2015
There is a general funding gap projected into the future The most recent congressionally authorized
transportation funding bill Moving Ahead for Progress in the 21st Century (MAP-21) reduces funding for
the NPS transit systems by approximately 28 percent from the previous federal transportation legislature
(Alternative Funding Opportunities for NPS Transit 2014) Regional funding assessments show an
annual funding gap of $720000 for Alaskan ldquoroad parksrdquo the category which Denali NPampP is included
Although park-level funding shortages are not yet documented for Denali NPampP a large portion of the
Alaska Regionrsquos transportation assets are located in Denali NPampP Elimination of the Transportation
Improvement Program (TRIP) has made funding multimodal systems such as the Parkrsquos concessioner-
operated transit more challenging (Alternative Funding Opportunities for NPS Transit 2014)
Because the transit system is operated by a for-profit concessionaire it is not eligible for transportation
funding through MAP-21 however several FHWA funding and grant programs are still applicable and
partnerships with local government cooperation and partnership could increase funding eligibility
Park management is also very interested in finding efficiencies within its current asset portfolio
completing operational modifications that improve the transportation system and promoting the Parkrsquos purpose Recent examples of this include new vehicle management strategies provided in the VMP and
wintertime operation improvements
Asset Investment Planning Objective Consider sustainability of operation and maintenance of new
and existing assets in the planning process
The NPS includes asset investment planning in much of its recent Condition transportation planning documentation At a regional level the NPS Denali NPampP managers are very is using measurements that feed into asset planning processes involved with asset planning for such as total cost facility ownership as well as the project
transportation system prioritization tools mentioned earlier Several strategies identified in maintenance and operations the Alaska Federal Lands LRTP promote asset planning through Relative to other parks in the collaboration with other federal land management agencies and region Denali NPampP has high Alaska Department of Transportation and Public Facilities deferred maintenance needs consideration of lifecycle costs and evaluation of maintenance
resulting largely from challenges costs versus investments in new infrastructure associated with maintaining
Denali Park Road Maintenance In 2010 deferred maintenance in Denali NPampP accounted for 65
and operation are constantly percent approximately $20 million of all deferred maintenance of
weighed against environmental transportation assets in the Alaska Region Deferred maintenance
conservation priorities issues within Denali NPampP could be addressed by treating the
underlying cause of the road failures to reduce the need for
repetitive maintenance according to the General Management Plan
Documents suggest that road repairs and maintenance should follow the 2005 Denali NPampP Road
Maintenance Repair and Operating Standards and the 2007 Denali NPampP Road Design Standards The
total planned transportation assets for Denali NPampP include improvements to access roads parking lots
non-motorized routes and other transportation infrastructure These planned assets are valued at $64
million (NPS Alaska Region LRTP 2012)
13
Denali National Park and Preserve Long Range Transportation Plan Existing Conditions Report
February 27 2015
In terms of operational needs Park managers are actively participating in day to day management of
transit operations and are able to make adjustments based on demand For example real-time
monitoring of the transit system allows the concessionaire to track transit vehicle occupancy and dispatch
additional vehicles during peak demand for return trips Denali NPampP is also actively investigating
opportunities for gaining efficiency in their transit and in their entrance fee collection program
As it is with other goal area topics effective operation and maintenance is balanced with environmental
protection In planning documents the Denali NPampP management is constantly balancing expectations of
visitor experience and safety with deference to natural resource objectives
Coordination Objective Coordinate with local organizations to ensure that nearby transportation
projects are planned with NPS involvement to the mutual benefit of all parties
Coordination with federal state and local agencies is seen as an Condition opportunity for funding and project implementation as well Coordination with federal state managing concessionaire services and expanding local visitor local and private transportation services An ongoing federal land management agency agencies is seen as a need for coordination team was formed as a result of the 2012 Alaska optimizing asset management Federal Lands LRTP The group actively works to coordinate because 21 percent of the transportation project planning across Alaska including in and transportation assets are owned around Denali NPampP These efforts could help organize interest in by non-NPS agencies expanding transit services outside of the Park which is a frequently
cited coordination need as determined by the literature review and
comments from Park staff during LRTP discussions
Needs and opportunities for coordinating with private entities are somewhat unique to Denali NPampP
Denali NPampP is the only park in the Alaska Region to have transportation assets that are not owned by
the NPS Twenty-one percent of the transportation assets in the Park are owned and operated by
concessionaires or owned by others There is a desire to expand partnerships to include other local
businesses and eventually local government agencies The 2006 Needs Assessment and Feasibility
Study for a Community Transportation System provides alternatives for organizing such efforts
Other coordination efforts include involving air tourism operators regular communication with tribal
organizations and land inholders and coordinating access with other area landholders and transportation
agencies such as the Alaska Department of Transportation and Public Facilities
14
Denali National Park and Preserve Long Range Transportation Plan Existing Conditions Report
February 27 2015
4 Conclusions
Common themes encountered throughout the literature review process provide several general baseline
conditions for Denali NPampP These include
Resourc
e P
rote
ctio
n
Clim
ate
Change
User
Experie
nce
Mo
bili
ty
Syste
m M
anagem
ent
The historic character of Denali Park Road and the management thereof are important
factors influencing access and mobility
Denali NPampP is a primary attraction for tourists Many visits are rushed due to the
logistics of popular packaged Alaska tours Visitation is anticipated to increase as tour
companies continue to promote and expand travel options to the Park
With anticipated visitation increases and associated use of the transportation system
Denali NPampP managers may face ongoing decisions about how to best protect the Parkrsquos natural resources as congestion grows and the capacity of Denali Park Road and
transportation system is tested
Travel options are sometimes viewed as limited within the Park but some multimodal
enhancements could increase safety particularly for bicycling and hiking opportunities
The general condition of the transportation system is good but priorities are complex
both in terms of balancing maintenance needs with the care for natural resources and
providing access to view designated wilderness areas
Recent changes to Denali Park Road vehicle management and operations system are
intended to advance the NPSrsquos emerging outcome-driven planning processes As more
data becomes available Denali NPampP managers can better set performance indicators
for operations
Existing transportation plans do not contain much information about climate change but if
the actions recommended and cited in the NPS Alaska Region LRTP are followed there
may be more opportunities to include unit-level strategies for addressing climate change
into asset planning and operation With ongoing progression toward a CFP certification
Denali NPampP is well positioned to incorporate these objectives at a unit-level
15
National Park Service US Department of the Interior
Denali National Park and Preserve Long-Range Transportation Plan
Appendix B Denali Long-Range Transportation Planning and Acoustic Resources
1
Denali Long Range Transportation Planning and Acoustic Resources
Davyd_Betchkalnpsgov NPS Alaska Region Soundscape Specialist Biologist 907‐683‐5754
Research Sets the Stage
Author Eli Seigel wrote in 1970 ldquoall the opposites are two freedoms which question each other and complete each
otherrdquo Transportation and solitude likely represent such a pair of mutually‐exclusive freedoms In Denali and other
Alaskan parks we can immediately recognize a tradeoff between the ability to be easily and quickly transported to
a location and the ability to participate in the tranquility of wilderness beyond the reach of modern technology and
crowds
This recognition is a fundamental drive behind the work of the NPS Natural Sounds and Night Skies Division whose
vision statement is to ensure that ldquoNational parks are enduring sanctuaries for natural sounds and dark
environments where current and future generations have the opportunity to experience undisturbed soundscapes
and an unimpeded view of the cosmos and where the ecological roles and cultural values of acoustics and photics
are understood and appreciatedldquo (NPS 2014)
For the purposes of acoustic planning and research the NPS has developed an autonomous system that can
provide both American National Standards Institute (ANSI) certified acoustic levels (ie numeric measurements of
sound pressure level in decibel units) and audio recordings (ie sound that one can listen back to in headphones)
ANSI also recommends the collection of meteorological data concurrent with measurements of sound pressure
level Thus a simple weather station incorporating wind speed wind direction temperature and relative humidity
is also part of the acoustic monitoring station The photo below shows an external photograph of a typical station
2
Figure 1 NPS Standard Acoustic Monitoring Station ndash equipment is composed of a microphone meteorological instruments
sound level meter digital audio recorder battery bank and solar paneling
Scientific work to understand Denalirsquos acoustic environment began in 1999 in response to a large increase in
aviation and snowmobile noise in the mid‐1990s (Morgan 2001) Early data were incorporated into the
Backcountry Management Plan (BCMP) EIS a supplement to Denalirsquos General Management Plan (NPS 2006e)
After the BCMP was published the park embarked on a decade‐long inventory of the acoustic environment The
project was completed in 2015 and as of 2016 the park has moved into a monitoring phase A basic timeline of
acoustic resource management in Denali is shown below
Figure 2 Timeline of acoustic resource management in Denali 1999 ndash 2016
Denalirsquos acoustic inventory project is unique among park service units in that it was designed as a spatially random
sample on a 20 by 20 kilometer grid This allows inference beyond the local detection radius of each microphone
For example consider the following map that depicts the acoustic metric lsquodaily average noise free intervalrsquo ndash a
measure of how long a typical quiet period is before it is broken by motorized noise Noise free intervals in Denali
are largely determined by the frequency of air traffic Aircraft are very acoustically powerful sources that are
audible at distances similar to the scale of the sampling grid thus mapped measurements of noise free interval
immediately form a discernable pattern to the human eye
3
Figure 3 Daily average noise free intervals measured in hours Data were collected as part of Denalirsquos Soundscape Inventory
project 2006 ndash 2015 Noise free interval is a measure of how long a typical quiet period is before it is broken by motorized
noise
Entering the realm of inference the following map uses observations at specific soundscape inventory points to estimate the noise free interval at a park‐wide scale It uses a spatial smoothing technique called inverse distance weighting to construct new data points between the known values ‐ a method known as interpolation Again
because the scale of the phenomena (aircraft traffic) and the scale of the sample (20 km2 resolution) are comparable noise free interval is a metric well‐suited to interpolation techniques (Peterson 1998 Gergel 2006) Continuous change in the metric is physically sensible and approximate the visual effect of looking at the original point data Denalirsquos soundscape inventory was important for understanding which acoustic metrics are best suited to monitoring change at a landscape scale
4
Figure 4 Average noise free interval values estimated by spatial interpolation Units are in hours This map uses observations
at soundscape inventory points to estimate the average noise free interval at a park‐wide scale It uses a smoothing technique
called inverse distance weighting to construct new data points between the known values ndash a method known as interpolation
The Denali soundscape inventory supplies spatially‐rich information about the current state of the acoustic
environment It also clarifies the choices available to quiet the park as per NPS policy Inventory data have been
(1) Inventory data have been used to review the indicators and standards of the BCMP
They explain how indicators change in response to the acoustic ambience
They explain the relationship between indicators (for example NFI and event rate are inversely related
thus one can be estimated from the other)
They provide an understanding as to which indicators are best suited to the scale of the park
(2) Inventory data have been used as input to the voluntary aviation best practice development process
of the Denali Overflights Advisory Council (2007 ndash 2012)
They provided the basis from which to monitor the effects of aviation best practices
They provided updates to the council directing attention to areas most in need of mitigation
They transcend anecdote as the sole basis for making decisions
(3) Inventory data have been used in predictive acoustic modelling
5
They provide a means to validate noise models of aircraft takeoffs or overflights road noise or other
sources
Data such as event rates or hourly distributions can also be used as inputs to models
Aviation Transportation and NPS Policy
There are currently several types of aviation transport in the park Section 1110(a) of the Alaska National Interest
Lands Conservation Act (ANILCA) provides for aviation access for traditional activities and for travel to and from
homesites which will not be discussed in this document Nor will high‐altitude commercial aviation ndash which does impact the park but would involve participation of the Federal Aviation Administration in the revision of Victor
Airways or Jet Routes within the National Airspace System a process well beyond the scope of this plan
Instead this document seeks to build on discussions of the Denali Overflights Advisory Council
(httpswwwnpsgovarticlesdenali‐aircraft‐overflightshtm)a federal advisory committee chartered by the
Secretary of the Interior from 2007 ndash 2012 The group developed a suite of voluntary aviation best practices that
were adopted by both commercial and government aviators It is fitting that these best practices were broadly
adopted because NPS policy does not distinguish the obligations of governmental and Concessionaire operations
with respect to resource protection NPS Management Policies 2006 sect 10249 states
Concessioners are required to comply with applicable provisions of all laws regulations and policies that
apply to natural and cultural resource protection
It is relevant then to provide a brief policy review NPS Management Policies 2006 sect 823 addresses impacts to
natural sounds directly stating
The Service will strive to preserve or restore the natural quiet and natural sounds associated with the
physical and biological resources of parks To do this superintendents will carefully evaluate and manage
how when and where motorized equipment is used by all who operate equipment in the parks including
park staff Uses and impacts associated with the use of motorized equipment will be addressed in park
planning processes Where such use is necessary and appropriate the least impacting equipment vehicles
and transportation systems should be used consistent with public and employee safety The natural
ambient sound levelmdashthat is the environment of sound that exists in the absence of human‐caused
noisemdashis the baseline condition and the standard against which current conditions in a soundscape will be
measured and evaluated
Further guidance related to aircraft is articulated in sect 6343
Managers contemplating the use of aircraft or other motorized equipment or mechanical transportation within wilderness must consider impacts to the character esthetics and traditions of wilderness before considering the costs and efficiency of the equipment
In evaluating environmental impacts the National Park Service will take into account (1) wilderness characteristics and values including the primeval character and influence of the wilderness (2) the preservation of natural conditions (including the lack of man‐made noise) and (3) assurances that there will be outstanding opportunities for solitude that the public will be provided with a primitive and unconfined type of recreational experience and that wilderness will be preserved and used in an unimpaired condition
6
Furthermore sect 637 offers and important reminder that in wilderness areas
The principle of nondegradation will be applied to wilderness management and each wilderness arearsquos condition will be measured and assessed against its own unimpaired standard Natural processes will be allowed insofar as possible to shape and control wilderness ecosystems Management should seek to sustain the natural distribution numbers population composition and interaction of indigenous species Management intervention should only be undertaken to the extent necessary to correct past mistakes the impacts of human use and influences originating outside of wilderness boundaries
Envisioning a (Flight) Route Forward
Denalirsquos Backcountry Management Plan (BCMP) remains the overarching unit‐level policy document on the
management of the natural acoustic environment Data collection during the implementation of the BCMP has
provided a robust baseline description of the resource Transportation planning directly benefits from a synthesis
of these inventory data
One way to approach the protection of acoustic resources is through a cost‐distance analysis Cost‐distance
analysis balances the costs associated with travelling a certain distance (in this case the cost of aviation fuel) with
resistances to travel Resistances to travel can take many forms ndash the increased difficulty in crossing a major river
or mountain range or the difficulty of moving over muskeg as opposed to alpine tundra In this case we describe
resistances to noise ndash areas sensitive to the acoustic disturbance created by mechanical transport
What is meant by resistance Synonymous with lsquonoise sensitivityrsquo for the purposes of this discussion the word
resistance more accurately conveys the interlocked relationship between isolation and transportation The
following two definitions are applicable to the Long Range Transportation Plan
Resistance (noun)
1 Resistance is the degree to which a substance prevents flow through it
2 Resistance is the ability to prevent something from having an effect
In this case the ldquoability to prevent something from having an effectrdquo describes the human ability to make choices
about how to conserve the acoustic environment In other words we conceptualize a resistance when we answer
the question ldquoHow do we mitigate the effects of motorized transport on the acoustic environmentrdquo We will later
see how the resistive analogy between traffic flows and electrical flows can be used to the benefit of managing
acoustic resources
Resistances to noise typically fall into three basic categories
1) Those defined by NPS policy or aviation best practices
2) Those related to the acoustic or ecological properties of the landscape
3) Those related to avoiding interactions between motorized and non‐motorized experiences
7
Resistances to noise can be assigned based on a number of different rationales For instance consider the
following raster dataset that depicts the amount of use by backcountry unit One long‐standing approach to
describing which areas should be protected from noise is to separate backcountry user groups from aviation user
groups in space Lighter areas on the map indicate more backcountry use ndash and thus suggest that aircraft avoid
units along the Denali park road corridor
Figure 4 Backcountry Unit Use resistance layer Lighter values indicate a greater resistance to transportation noise This
suggests that aviation routes should avoid core units around the road corridor
Contrast this with data which show the average noise free interval across the park The layer is normalized to the
same brightness as the backcountry use layer with lighter areas representing a greater resistance to noise and
thus higher resource costs for transportation over the area
The rationale behind the noise free interval map produces different optimal routes than the backcountry user
map This is because resistance is based on the fact that areas with long noise free intervals are sensitive to minor
changes in air traffic and thus traffic should be routed over areas that are already highly fractured In this case
8
areas that already have air traffic would continue to bear the brunt of resource damage allowing the most pristine
acoustic environments of the park to remain intact
Figure 5 Noise Free Interval resistance layer lighter values indicate greater resistance to transportation noise This would
suggest that aircraft routing remain largely the same especially in the areas between the Kahiltna and Ruth glaciers
Backcountry use statistics and noise free intervals are just two of many different ways of assigning resistances to
aviation transport Which strategy is best That depends entirely on the basis of each claim After reviewing both
layers it should be apparent that a wide range of conflicting rationales can be applied to mitigating impacts from
Denalirsquos aviation transportation network Deciding which should be prioritized is a complex decision
Unless the overall aviation traffic volume over the park is reduced displacement in free space is the primary
mitigation technique available to park stewards The most substantial mitigations enacted for the park thus far ndash
the Denali Overflights Advisory Council aviation best practices ndash required the council to weigh certain routing
displacements over others (DOAC 2012)
9
Once a weighting network of resistance layers has been distilled from public and expert opinion it is possible to
use them to envision idealized flight corridors One useful tool for this purpose is the cost‐distance modelling
software Circuitscape (wwwcircuitscapeorg) which uses electrical theory to describe the travel of electrons over
a semiconductor This is analogous to a pilot with knowledge of areas resistant to noise who utilizes this
knowledge while conducting their flight operations Results of a Circuitscape analysis include all the possible routes
a pilot might fly but highlight stewardship‐friendly corridors It allows us to see the conclusions that follow from
our rationale
The following is an example weighting network that can be used as an input for Circuitscape The weights are
chosen in this case to produce a result that is realistic while avoiding the influence of hard discrete edges It
balances nine data sets with widely varying rationales to produce a final summation that can be used to visualize
flight corridors
Figure 6 Example of a weighted network resistance layer Summed data layers include natural ambient acoustic
level travel time backcountry unit use Denali Overflights Advisory Committee aviation best practices and sound
10
sensitive areas BCMP standards noise free interval campgrounds and road corridors The hard edges of polygon
features are especially prominent in the final sum
Dataset Name Description of Dataset Rationale Statement for Noise Resistance Weight
Natural Sound Pressure Level (Median L50)
Typical ambience of the natural acoustic environment (Modelled)
Listening area is reduced in more energetic acoustic environments reducing the impact of human
activities Less natural energy = higher resistance 50
Travel Time Estimated travel time on foot from
portal areas (Modelled)
Backcountry users travelling in more remote areas of the park have a greater motivation to find
solitude Greater travel time = higher resistance 25
Backcountry User Days Utilization of backcountry units of
the park (Empirical)
Areas with a greater amount of backcountry users should be preferrentially avoided More users =
higher resistance 15
Denali Overflights Advisory Council Aviation Best Practices
Best‐practices for mitigating acoustic impacts from aviation (Federal Advisory Committee)
Best‐practices identified by the Denali Overflights Advisory Council should be fully implemented Areas
affected by best‐practices = high resistance 10
Backcountry Management Plan Soundscape Standards
Soundscape standards by spatial region of the park (GMP)
Adherence to NPS policy should be prioritzed Lower impact management zone = Higher resistance
5
Noise Free Interval
Average amount of time before experiencing the next noise disturbance (Empirical
interpolated)
Areas with longer noise‐free intervals are more sensitive to fracturing due to increases in air traffic
Greater noise‐free interval = higher resistance 5
Campground Locations Buffered campground areas
(Empirical)
Campgrounds are places where many people spend time resting and should be preferrentially avoided
Closer to campground = higher resistance 5
Roads Buffered road network (Empirical) Roads are already impacted by noise so aviation
noise will have a lesser impact in proximity to roads Beyond road noise footprint = high resistance
3
Denali Overflights Advisory Council sound sensitive areas
Areas identified by the Denali Overflights Advisory Council as
noise sensitive banded into three categories low medium high (Federal Advisory Committee)
Sound sensitive areas should be preferrentially avoided Higher sensitivity band = higher resistance
2
Table 1 Description of noise resistance rasters that were used to show how varying rationales can be balanced to produce an overall weighted noise resistance layer
Once the weighted resistance layer has been created Circuitscape is used to recognize ideal flight corridors Airports with commercial use represent sources of electrical potential and include Talkeetna Healy McKinley Public ERA helipad McKinley Private Cantwell and Kantishna The sink (ground) of electrical potential is the Denali massif For the example weighting network in this document the following map was produced
11
Figure 7 Cost‐distance analysis results This graphic shows current flow from electrical sources (airports) to an electrical sink (the Denali massif) This is analogous to air traffic density
What does the model show It represents air traffic density as an analogy to electrical current ndash the greater the current the greater the air traffic density As a model it is an imperfect representation of reality but this example representation does identify flight corridors that follow from the input rationale (These corridors include the Denali park road corridor the Denali Fault a route along the outer range and one that connects Broad Pass to the Eldridge Glacier) Obviously the map in Figure 7 fails to capture public opinion and for that reason it is incomplete but the technique stands as a meaningful strategy to approach these complex decisions
12
Conclusion
Data from the Denali Soundscape Inventory describe the parkrsquos acoustic environment at a landscape scale These data can be used
for many purposes but their most critical is to provide a baseline from which to monitor the effects of future noise mitigation
efforts
In the preceding section we described a cost‐distance analysis technique that could be utilized to identify the most beneficial long‐
term mitigations for the acoustic environment Such corridors represent opportunities for park management and the aviation
community to work together as stewards What has not been identified in this document is the ldquovalue analysisrdquo process by which
public and expert opinion can be synthesized into an appropriate weighted resistance layer for cost‐distance analysis The overall
strategy may follow a form similar to this
An informal version of this same process was used to by the twelve members of the Denali Overflights Advisory Council to develop
an initial suite of aviation best practices from 2007 ndash 2012 Some of these best practices have produced substantial positive changes
for the park but others have failed to be acoustically effective due to their extent or timing The strategy described in this
document could be used to open the doors of conversation and improve the effectiveness of the mitigations to protect Denalirsquos
acoustic environment
References
Alaska National Interest Lands Conservation Act PL 96‐487 sect 1110(a)
Denali Aircraft Overflights Advisory Committee 2012 Denali air tour operatorsrsquo best practices to minimize sound impacts Available
at httpswwwnpsgovdenagetinvolvedaoachtmCP_JUMP_5151844 September 2013
Gergel S E and M G Turner 2006 Learning landscape ecology a practical guide to concepts and techniques Springer Science amp
Business Media New York
McRae BH VB Shah and TK Mohapatra 2013 Circuitscape 4 User Guide The Nature
Conservancy httpwwwcircuitscapeorg
Morgan D and J Van Horn 2001 Aircraft Overflight Activity in the Denali Wilderness An Analysis of Backcountry Rangers
13
Observations for 1999 and 2000 National Park Service Denali Park Alaska
National Park Service (NPS) 2000 Directorrsquos Order 47 Soundscape Preservation and Noise Management US Department of the
Interior National Park Service Washington DC
National Park Service (NPS) 2006a Management policy 6343 Environmental Compliance in Management policies 2006 US Department of the Interior National Park Service Washington DC
National Park Service (NPS) 2006b Management policy 637 Natural Resources Management in Management policies 2006 US Department of the Interior National Park Service Washington DC
National Park Service (NPS) 2006c Management policy 823 Use of motorized equipment in Management policies 2006 US Department of the Interior National Park Service Washington DC
National Park Service (NPS) 2006d Management policy 10249 Natural and Cultural Resource Management Requirements in Management policies 2006 US Department of the Interior National Park Service Washington DC
National Park Service (NPS) 2006e Denali National Park and Preserve final backcountry management plan environmental impact statement National Park Service Denali Park Alaska
National Park Service (NPS) 2014 Natural Sounds amp Night Skies Division Strategic Plan (2014 ndash 2019) US Department of the Interior National Park Service Natural Resources Stewardship and Science Ft Collins CO
Peterson D L and V T Parker 1998 Ecological scale theory and applications Columbia University Press New York
Siegel E 1970 There Are Two Freedoms Aesthetic Realism Lectures by Eli Siegel Web 1 July 2016
14
National Park Service US Department of the Interior
Denali National Park and Preserve Long-Range Transportation Plan
Appendix C Denali Park Road Risk Assessment Utilizing the Unstable Slope Management Program
1
Denali National Park and Preserve ndash Long Range Transportation Plan
Deterministic Geologic Risk Assessment of the Denali Park Road Utilizing the Unstable Slope Management Program
Authors Russell Rosenberg MSc ndash Physical Science Technician (Geologic Hazards) Denny Capps PhD ndash Park Geologist Heather Rogers MSc ndash Physical Science Technician (Geologic Hazards)
Prepared 080316
Revisions none to date
Introduction and Project Status
The 92‐mile Denali Park Road traverses a highly active geologic landscape and has experienced
numerous documented mass wasting events throughout the history of the road One of the most
dramatic occurred in late October 2013 when a 600‐ft‐long 110‐ft‐wide debris slide blocked the road
near MP 38 Blocks of permafrost‐frozen unconsolidated debris up to 15 ft thick slid on weak unfrozen
clay Frequent but less dramatic events block traffic undermine road surfaces and may cause damage
to vehicles or injuries Many events including the example above are likely triggered or exacerbated by
thawing permafrost and are consistent with the possible effects of anthropogenic climate change With
increases in road use the uncertain effects of climate change and possible changes to maintenance
funding levels National Park Service (NPS) and Federal Highway Administration (FHWA) staff identified
the need for a comprehensive risk analysis of geologic hazards along the Denali Park Road
The risk analysis is scheduled for completion by March 2017 and includes five parts (1) inventory maps
and linked database that illustrate spatialtemporal distribution of geohazards their relative activity
and geomorphic attributes (2) beta testing and implementation of the Unstable Slope Management
Program (USMP) rating criteria (3) geohazard susceptibility models that estimate the spatial probability
of occurrence (4) geohazard risk models that illustrate the potential consequences and (5)
analysesrecommendations to park management regarding other risks the road will exhibit over the
next decade (DENA‐MOA‐208813AB) Currently tasks 1 and 2 are predominately complete tasks 3 and
4 are underway and task 5 will follow the completion of tasks 1‐4 Although final results and
recommendations are still forthcoming the results of tasks 1 and 2 in particular the USMP ranking
scores (discussed below) provide an inventory and a first‐order deterministic risk assessment of
geologic hazards currently affecting the park road
2
The results of the USMP rating criteria provide valuable information on the spatial distribution of
geologic hazards their severity and the associated risk however they do not directly assess the
possible impacts of climate change or provide a detailed outlook of possible future scenarios We utilize
these data to provide a preliminary identification of the areas with the highest relative risk and their
spatial patterns Consideration of this information should be valuable to this Long Range Transportation
Plan (LRTP) and for park managers and planners as future infrastructure plans are being developed
Unstable Slope Management Program Site Rankings
The USMP is a collaboration between the FHWA many other federal agencies including the NPS private
geotechnical consultants and the Alaska Department of Transportation amp Public Facilities (AKDOT) that
ranks geologically unstable slopes for the purpose of facilitating more effective long‐term geotechnical
asset management USMP scores provide a deterministic ranking of agency risk associated with any
particular geologic hazard site These scores consider elements of both the severity and
frequencyprobability of a hazard and the exposure and vulnerability at each particular site Example
elements include the amount of roadway affected by landslide events the frequency of known hazard
events the impact of events on the use of the transportation corridor the maintenance cost and
complexity and annual average daily traffic For detailed information the USMP ranking criteria please
see (httpnlcsmontanaeduusmpRatingManualpdf)
We have currently completed a total of 141 USMP site rankings along the entire 92 miles of the DENA
Park Road (Figure 1) These data represent the vast majority of known geologic hazard sites and include
landslides debris flow drainages rockfall areas frost‐heaves and erosional undercutting due to fluvial
processes It should be noted however that these site rankings are not totally comprehensive instead
they represent our most complete knowledge as of 06292016 The DENA USMP rankings range from
164 to 948 with a mean value of 328 and more variance within higher ranking sites To put these values
in perspective immediately however the USMP qualitatively defines sites that score less than 200 to be
in ldquogoodrdquo condition sites that score between 200 and 399 to be in ldquofairrdquo condition and sites that score
400 or higher to be in ldquopoorrdquo condition
In theory sites in poor condition are more likely to pose persistent andor more serious problems along
the road and areas of higher risk density are more likely to see a higher concentration of problems In
DENA the current majority of our sites 67 rank in fair condition while only 9 are in good condition
and a relatively large number of sites 24 are in poor condition The only significant outlier was the
ldquoPretty Rocksrdquo slump (Figure 3b) with a score of 948 365 points higher than the next highest site
Spatially regions of higher USMP risk density (Figure 2) are most pronounced along Polychrome Pass
and the Eielson Bluffs areas Individual USMP scores represent the relative risk associated with a hazard
site and risk density represents the relative concentration of agency risk
3
Figure 1 DENA USMP site rankings on IKONOS imagery Icon sized is scaled by individual site rank and colored according to good fair or poor qualitative rank
Figure 2 DENA USMP score density on IKONOS imagery Density scaled by linear concentration and site ranking scores
Of the sites ranked in poor in condition along the Park Road many received prior mitigation or were
previously identified as areas of concern by maintenance or resource management personnel Some
previously noted severe geologic hazard sites in lsquoagreementrsquo with poor USMP scores include the ldquoPretty
Rocksrdquo slump (Figure 3a) debris flow activity at ldquoBugstufferrdquo creek (Figure 3b) the ldquoBear CaveMile 45rdquo
slump (Figure 3c) and the ldquoIgloo Debris Sliderdquo (Figure 3d) Additionally Polychrome Pass is a known area
of high geologic hazard occurrences This general agreement of USMP scores and professional
4
judgementinstitutional knowledge within DENA should be reassuring to park managers and help
demonstrate that the USMP ranking scores represent useful information and are based off of many
years of development from similar programs and expertise developed by FHWA AKDOT Oregon Dept
of Transportation and private firms The USMP provides an institutional framework for tracking these
known problem areas and has identified other new examples
A B
C D
A B
Figure 3 Previously recognized sites that rank in poor condition A ndash Pretty Rocks Slump (mile 454 948 points) B ndash Bugstuffer debris flow (mile 519 575 points) C ndash Bear Cave Slump (mile 45 411 points) D ndash Igloo Debris Slide (mile 377 514 points)
Current Applications to the LRTP
The USMP rankings provide a preliminary framework for understanding the relative severity of risk
associated with geologic hazards along the Park Road Although we do not currently make
recommendations tailored to specific sites or address possible future scenarios we suggest that an
awareness of the current results of the USMP rankings is beneficial to this LRTP Likely applications of
the USMP data to the LRTP would involve spatial analysis of USMP rankings as they relate to possible
disruptions in traffic programming of potential mitigation projects and overlap with future
infrastructure planning In order to facilitate this analysis we submitted a spatial database of our USMP
rankings to PaTINA (they are also available on request) We emphasize that these results are
preliminary yet they provide a method for understanding and considering geologic hazards in a broader
context Park planners and managers should continue to work with resource staff in understanding the
5
implications of these results however the following are potential applications to consider for the
current LRTP
All geologic hazards sites but in particular those in poor condition are more likely to pose
persistent andor serious problems along the Park Road These are areas where the
transportation corridor could experience interruptions or incur high maintenance costs as a
result of geologic activity Sites in poor condition should be considered for mitigation and
investigated in more scientific detail (see Future Work)
The USMP rankings may help identify geotechnical assets where hazards do not appear
extremely severe but may be candidates for mitigation from a risk‐based or cost‐based
perspective Rockfall sites that are not capable of producing catastrophic roadway failure but
require very frequent maintenance are good examples of this These sites also rank in poor
condition but may not otherwise receive attention from management
Density analysis of USMP site distribution identifies areas of non‐discrete geologic hazard areas
that may require alternate or more systematic mitigation efforts to increase cost effectiveness
The extreme concentration of hazard sites along Polychrome Pass is an example of such an area
Future Applications to the LRTP
Both the LRTP and USMP have been designed to evolve as new information become available through
time thus allowing for future applications with as new data become available Most transportation
agencies apply transportation asset management (TAM) systems to transportation assets such as
bridges and road surfaces however geotechnical assets such as rock slopes and embankments are
unlikely to be considered with the same detail (Stanley 2010) The USMP provides a system for
geotechnical asset management by creating a framework to establish potential performance measures
and targets for individual geologic hazards and the overall transportation corridor (Federal Highway
Administration‐DRAFT report 2015) We plan to update USMP rankings for the DENA park road as more
information is made available or new events occur and to perform a systematic re‐evaluation once
every five years By tracking USMP rankings over time the following performance measures could be
considered by transportation planners and park managers
Establish targets to reduce the overall number of fair or poor ranking sites along the park road
This could represent a total percentage reduction a maximum target number of poorfair sites
or a certain number of poorfair sites per unit distance along the road
Establish targets to reduce the risk at sites of particular concern (see Future Work)
A benefitcost analysis for all geotechnical assets along the transportation corridor could be
undertaken The USMP group is currently working on developing this tool and the effectiveness
of programmed mitigation projects could be measured by tracking costs vs performance
changes in geotechnical assets recorded by the USMP rankings
6
A method for tracking the performance of assets through time to establish a preferred course of
action As an example USMP scores at the site of the October 2013 slide that blocked the road
(Figure 3d) have been on a downward trend since May 2015 because of relative inactivity while
scores at the Pretty Rocks slump (Figure 3a) have remained higher or increased slightly because
of recent activity Establishing trends in USMP scores through time could be useful for
determining appropriate mitigation priority
Future Work
The USMP risk matrix provides a relatively robust assessment of geotechnical assets based on their
current condition and a way to track their performance through time However because of its
deterministic nature it does not directly consider possible or likely future conditions We hope to
address this limitation through the continued development of the geologic risk assessment Completion
of task 3‐5 of the risk assessment will allow us provide data which will help determine the probability of
future events based on geologic conditions and the associated risk based on transportation
infrastructure and human exposure The results of tasks 3‐5 will allow us to assess the potential outlook
of areas of the road based on their probability to experience new events Additionally we will expand
on the results of the USMP to examine high ranking sites in more scientific depth Examples of this may
include drilling bore holes at the Pretty Rocks slump to determine sub‐surface conditions examining
the relative abundance of fine‐grained sediment in debris flow watersheds or repeat GPS surveys to
ascertain motion rates such as are currently ongoing at the Bear CaveMile 45 slump By using all of
these data sets in conjunction we plan to propose specific recommendations and mitigation
considerations for sites of concern based on their current conditions and future outlook
References Cited
Federal Highway Administration 2015 DRAFT‐Unstable Slope Performance Measures for FLMAs using
USMP Ratings
Federal Highway Administration and National Park Service 2015 Comprehensive Memorandum of
Agreement DENA 208813 AB Denali National Park and Preserve ndash Conduct A Hazard Assessment Of
The Denali Park Road Corridor
Landslide Technology and Federal Highway Administration 2014 Geotechnical Asset Management ndash
Unstable Slope Rating Category Descriptions For Federal Land Management Agencies
Stanley D A 2010 Asset Management In A World Of Dirt ndash Emergence of an Underdeveloped Sector of
Transportation Asset Management TR News no 277 p 18‐22
7
Denali National Park and PreserveLong-Range Transportation Plan
Appendix D Current and Future Partner Projects
National Park ServiceUS Department of the Interior
1
1
Memo
To Denali National Park Long Range Transportation Plan Team
From ATKINS Email
Phone 720-841-2956 Date Sep 19 2014 Modified August 28 2017
Ref cc
Subject Possible Foreseeable ProjectsPlans near Denali National Park
Matanuska Susitna Borough LRTP
Source httpwwwmatsugovusplanslrtp
This transportation plan assesses growth in the Mat-Su Borough over the next 20 years and
identifies the key elements of the Boroughrsquos future transportation system that will be needed to
serve its growing communities The transportation plan will help the residents develop a Borough
that is a pleasure to live in with public infrastructure that supports their daily lives
Alaska Stand Alone Pipeline (ASAP)
Source httpwwwasapeiscom
The Alaska Stand Alone Pipeline (ASAP) Project is a 727-mile long 36-inch-diameter natural gas
transmission mainline extending from the GCF near Prudhoe Bay south to a connection with the
existing ENSTAR pipeline system in the Matanuska-Susitna Borough A 29-mile-long 12-inch-
diameter lateral pipeline will connect the mainline to Fairbanks The proposed pipeline will be
buried except at possible fault crossings elevated bridge stream crossings pigging facilities and
block valve locations
The pipeline will bypass Denali National Park and Preserve to the east and will then generally
parallel the Parks Highway corridor to Willow continuing south to its connection into ENSTARs
distribution system at MP 39 of the Beluga Pipeline southwest of Big Lake
The Alaska District US Army Corps of Engineers (Corps) has been designated the lead federal
agency and the US Bureau of Land Management (BLM) National Park Service (NPS) US
Environmental Protection Agency (EPA) US Fish and Wildlife Service (USFWS) US
Department of Transportation Pipeline and Hazardous Materials Safety Administration (PHMSA)
and the Alaska Department of Natural Resources State Pipeline Coordinators Office (SPCO) are
participating as cooperating agencies in the Supplemental Environmental Impact Statement (SEIS)
development process
2
2
Memo
Alaska LNG project
Source httpwwwarcticgasgovalaska-lng-project
The Alaska LNG export project would be among the worldrsquos largest natural gas-development
projects The project is in the pre-front-end engineering and design phase or pre-FEED The
project consists of constructing a 58-mile pipeline from Point Thomson gas field to Prudhoe Bay
and 800-mile pipeline from Prudhoe Bay to Nikiski
DOT Parks Highway Projects
Source httpdotalaskagovparks2014
The Alaska Department of Transportation and Public Facilities is performing road construction on
the Parks Highway during the construction season Work includes turn lanes passing lanes re-
surfacing bridge repairs
3
3
Memo
ADOTampPF Area Plans
Source httpwwwdotalaskagovstwdplngareaplansarea_regionalindexshtml
These are regional multi-modal transportation plans developed for specific areas of the state
designed to address movement between communities in the region and from the region to points
beyond Each of these plans incorporates economic modeling to evaluate potential projects and
prioritize them to best meet state and regional goals Denali National Park is partially included in
the Interior Alaska Transportation Planning Area The most recent plan for this area was adopted
in 2010 The plan includes transportation impacts to topic areas that include
bull Gas Pipeline
bull Mineral Development
bull Military Training
bull Railroad Development
bull Tourism
4
4
Memo The Plan examines potential impacts of these and other developments to highways rail aviation
and local community roads and although the plan did not fiscally constrain priority projects
several projects were identified as short-term capital improvement needs Among these projects
were recommendations for improvements on the George Parks Highway in the area of Denali
National Park This project as described by the plan includes passing lanes from MP 113 to MP
163 for an estimated cost of $15 million
Alaska Railroad ndash Healy Canyon
Source httpalaskarailroadcomPortals6pdfprojects2012_01_04_Healy_Canyon_Stabilization_FS_PROJpdf
Work is being proposed in Healy Canyon between Denali Park Station at Milepost (MP) 348 and Healy (MP 358) The Alaska Railroad has proposed projects to
bull Stabilize the track bed (ongoing)
bull Control the rock fall problems
bull ldquoDaylightrdquo (remove the top) Moody Tunnel at MP 3536 (complete)
bull Realign tracks around Garner Tunnel (complete)
bull Realign the tracks to enhance safety at MP 3536 (Moody Tunnel) and MP 357 (complete)
Proposed Susitna-Watana Dam
Source httpwwwsusitna-watanahydroorgprojectproject-description
Susitna-Watana Hydro could be a large hydro project on the Susitna River upstream of Denali
National Park This project would provide long-term stable power for generations of Alaskans and
have economic impacts on the area The project would generate 2800000 MWh of annual
energy once it comes online in 2024 The installed capacity is 600 megawatts (MW)
Environmental studies are currently underway
DOT Mile 231 Proposed Pedestrian Project
Source httpawsstateakusOnlinePublicNoticesNoticesViewaspxid=173914
The project scope includes constructing a new pedestrian bridge across the Nenana River trail
connections a rest area and intersection improvements Conceptual designs preliminary
engineering and environmental studies are currently underway
Other Area Energy Projects (Wind Coal Natural Gas exploration)
Eva Creek Wind Project Eva Creek is the largest wind project in Alaska at 25-megawatts It is
located 14 miles from Healy at the top of the 10-mile Ferry mining road
Usibelli Coal Mine Exploration License Plan of Operations Usibelli Coal Mine Inc has
submitted a request to carry out a Coalbed Methane drilling exploration program at a prospect site
approximately seven miles east of the town of Healy The project will consist of a single vertical
coal-bed methane exploratory well drilled inside the exploration license area The exploratory well
5
5
Memo will help determine whether sub-surface coal seams contain sufficient quantities of methane gas to
justify further exploration in the area (Source
httpdogdnralaskagovPermittingDocuments2014UsibelliUsibelli_LOCI_14_002_Drilling_at_H
ealy_Creek_Propect_Noticepdf)
Stampede State Recreation Area There is a potential designation of a Stampede State
Recreation Area west of the Panguingue Creek subdivision In March 2013 Senator
Representative David Guttenberg introduced HB148 in response to requests by the Denali
Borough Assembly
Borough Planning Commissioners are currently working through recommendations for area
management which include details of proposed allowed uses and a plan for land management
(Source httpnorthernorgtake-actionstampede-state-recreation-area-1)
Air Traffic ndash Overflights council
Source httpwwwnpsgovdenaparkmgmtaoachtm
The Denali National Park and Preserve Aircraft Overflights Advisory was established in 2007 to
consider resource conflicts between aircraft tours and park visitors on the ground The group is
charged with advising the National Park Service (NPS) on ways to mitigate (reduce) sound impacts
from aircraft flights over the park develop voluntary measures for assuring the safety of
passengers pilots and mountaineers and achieve desired resource conditions at Denali as
outlined in the Backcountry Management Plan (2006)
6
Denali National Park and PreserveLong-Range Transportation Plan
Appendix EPark Transportation Investment Needs Analysis
National Park ServiceUS Department of the Interior
Appendix E Denali National Park and Preserve Park Transportation
Investment Needs Analysis
Denver Service Center Planning Division | National Park Service | March 2017
1
Contents ABSTRACT 2
INTRODUCTION 2
PATINA DESIGN 3
OVERVIEW 3
VEHICLE MANAGEMENT PLAN 3
VECTOR ANALYSIS 4
DATA COLLECTION 4
TRANSPORTATION NETWORK 4
ASSET METRICS 5
HIGH RISK 5
INVESTMENT RANKING 6
GOAL AREAS 7
METHODOLOGY 8
DATA PREP 8
LAYER WEIGHTING 9
COMPOSITE ANALYSIS STEPS 10
SELECTED RESULTS 14
OUTPUTS 14
ROAD SEGMENT FINDINGS 16
Motorized Paved Zone 16
Wildlife Viewing Subzone 1 17
Wildlife Viewing Subzone 2 18
Wildlife Viewing Subzone 3 19
Wildlife Viewing Subzone 4 20
DISCUSSION 20
INTERNAL WEIGHTING 21
SKEWED DATA 21
SPATIAL SPREAD OF DATA 21
NEXT STEPS 22
2
ABSTRACT A Park Transportation Investment Needs Analysis (PaTINA) was performed in support of the Denali
National Park and Preserve Long Range Transportation Plan The PaTINA spatially models areas of
potential investment need by using a Geographic Information System to overlay geographic data The
data overlays are assigned a weight and added together where they are coincident in space The
resulting model visually depicts areas where multiple complexities occur This is compared with
transportation facility data to inform investment strategies The PaTINA results are shared in an
interactive web mapping environment and may be added to other mapping tools as a map service
INTRODUCTION The Park Transportation Investment Needs Analysis (PaTINA) synthesizes geospatial information to inform transportation planning and investment PaTINA takes into consideration the goals of the National Park Service (NPS) service-wide goals the goals of individual NPS units and the requirements of the Federal Highway Administration The combination of these goals is expressed in the Long Range Transportation Goals PaTINA creates geospatial-based analyses related to these goals and produces high-resolution outcomes that are site specific within the park unit PaTINA models use compiled data sources to create models related to transportation needs and restraints The vision goals and objectives established in the park unitrsquos Long Range Transportation Plan (LRTP) determine the input data for PaTINA As an analysis PaTINA is accomplished by overlaying map themes important to park management within
a Geographic Information System (GIS) and spatially comparing the overlay results to the transportation
network Metrics used by facility managers to rank assets of the transportation network in terms of
needed maintenance are then compared to the PaTINA results The analyses demonstrate where
priority areas may be located and can be compared to financial recommendations of LRTP The resulting
analyses can spatially inform the condition performance assessment needs identification funding
strategies and even funding prioritization
Modeled PaTINA results are shared as map services and presented in an interactive web mapping
application along with park facility and other relevant data The PaTINA process can be repeated with
model inputs and weights adjusted to reflect current park management needs
The PaTINA was originally developed as part of the Golden Gate National Recreation Area LRTP to help identify key areas where a confluence of conditions highlighted the need for investment consideration The recognized utility of the analysis led the Denali National Park and Preserve (Denali or park) LRTP team to request a PaTINA to help identify areas of concern that may not be readily discovered without geospatial tools
3
PATINA DESIGN
OVERVIEW The following are steps used to design create and implement PaTINA for the Denali LRTP At the
beginning stages of the LRTP goals are established for the Park Unit which includes Washington Federal
Highways and the Park Unit input Goal areas for Denali were system optimization resource
protection user experience access climate change and partners Each goal area was assigned
applicable GIS data layers which establish elements of the goal The data layers were given priority
weights depending on their importance on how it affects or is affected by the transportation network
Priority weights were determined with input from Denali park staff specialty experts
Once weights were established spatial analysis was performed to determine the overlap of each input
data layer within each goal area The weights of each input layer were added together where overlap
occurred The overlaying process identified areas where multiple inputs are spatially concurrent as well
as where inputs deemed as a higher prioritymdashmore heavily weighted--occur
The overlay results of each goal area were combined to generate the overall PaTINA composite denoted
as ldquoPotential Need Areasrdquo Throughout the LRTP process additional data themes outside the goal areas
were identified as a need and were categorized into three parts asset metrics high risk and investment
ranking These data were later added to the final web mapping product to compare to the Potential
Need Areas
VEHICLE MANAGEMENT PLAN In 2012 Denali prepared a Vehicle Management Plan (VMP) to evaluate alternatives for managing
vehicle use along the Park Road The preferred alternative of the plan proposed new management
zoning to include additional wildlife viewing subzones According to the VMP these subzones would be
implemented to clarify management objectives necessary to achieve desired conditions within specific
road sections Due to the significance of the segments for management purposes (Figure 1) it was
important to incorporate the sections into the initial design of the Denali PaTINA To do so the PaTINA
was applied independently to each road segment resulting in five separate sets of analyses Wildlife
viewing subzone 2 is split between 2a) from Teklanika River Bridge and the Eielson Visitor Center and
2b) east of Wonder Lake
4
Figure 1 Road segments defined in the Denali Vehicle Management Plan and used as a basis for the PaTINA
VECTOR ANALYSIS Following the methodology of the Golden Gate PaTINA the Denali PaTINA was completed as a vector
analysis Golden Gate was the pilot for the PaTINA effort which led to expectations that the process be
replicable at additional park units Vector analysis also has the added benefit of preserving spatial
geometries and attribution Attribution allows web map users to deconstruct the results to verify inputs
contributing to the composite result
DATA COLLECTION The following sections describe the categories of data that make up PaTINA and are included in the final
product
TRANSPORTATION NETWORK The transportation network for Denali first needed to be defined to create a spatial basis for the overlay
analysis For Denali the transportation network consists of roads trails parking lots railroad and
airstrips Each polyline transportation network features were assigned a width (Table 1) and then
2b
2a
5
buffered to that width to create a polygon input All polygon inputs were merged together to create a
final transportation network data layer
Table 1 Buffers applied to the Denali transportation network
Transportation Feature Width
Roads 11rsquo Trails 8rsquo
Railroad 100rsquo
ASSET METRICS Asset metrics included in the Denali PaTINA show facility condition index (FCI) and optimizer bands The
FCI rates the condition of a facility or asset using a numeric rating system This system reflects the
current replacement value of an asset and its projected cost of repairs Optimizer bands were developed
to divide a parkrsquos asset portfolio into five bands to represent the level of maintenance that each asset
should receive The metrics help staff make informed decisions about the allocation of limited funding
and staff time for maintaining park infrastructure
The FCI and optimizer band data were derived from the facility management software system (FMSS)
Assets in the transportation network data layer were joined together with the FMSS spreadsheet to be
able to show the asset metric information spatially The join was based on the Location ID attribute in
both the spreadsheet and spatial data A number of records in the spatial data were missing Location
IDrsquos so manual matching had to take place This was done by using aerial imagery to identify assets
based off of the FMSS location descriptions Assets that still couldnrsquot be identified through this method
received input from park staff via the web mapping tool by using create new features capability
Create New Features Tool in Web Map Site
The Create New Features tool allows users to generate data within the web map interface The user creates the geometry of the data and can also include information in predefined text boxes that gets added to the feature class attribute table Once the new feature has been created and saved it is automatically stored as a new record in a feature class that sits on a local server This benefits the GIS staff by having quick access to newly created data Because the data is automatically stored users can revisit the web map and see previous created features Geometry and text changes can be made to the feature after it has been created
HIGH RISK In winter of 2016 NPS regional and park staff as well as Federal Highway Administration (FHWA)
conducted a risk assessment workshop for Denali The purpose was to identify risk types and areas to
mitigate risk and provide recommendations to park management Those findings will be included in the
Denali LRTP There were a total of 28 identified risk types that were ranked into prioritization categories
from low to high Because of the importance of understanding where risk occurs and to mitigate future
events it was decided to include this information as spatial data into the PaTINA web map Only the
6
high risk category was added to the analysis due to the significance of these risks on Denalirsquos resources
visitors and staff
In total there were eight high risk types identified only six of which could be mapped Out of the six
remaining risk types three had data available The Create New Feature tool was used by park staff to
generate a data layer identifying locations of gravel production sites but was later omitted by the LRTP
team It was concluded that the site itself is not a risk to the transportation network but rather the
absence of gravel in these pits are The in holder access data was gathered from the NPS Lands
Resources Division to show tracts within Denali Culvert locations were derived from an excel
spreadsheet provided by FHWA ndash Western Federal Lands by plotting XY coordinates Lastly the
unstable slopes data was provided by park staff and was originally generated through FHWA in
collaboration with NPS Table 2 summarizes the risk data included in the PaTINA web map
Table 2 Summary of risk data used in the Denali LRTP
Risk Type Can it be mapped
Is data available
What is the source of the data
Inholder Access yes yes NPS Lands Resources Division
Implementation of LRTP no na
Staff Level Changes no na
Gravel Production Processing or Purchase yes no
Culverts (MampO) yes yes FHWAndash Western Federal Lands
Permafrost degradation yes no
River and Stream Flooding yes no
Unstable Slopes yes yes NPS FHWAndash Western Federal Lands
INVESTMENT RANKING A financial analysis was completed for the Denali LRTP resulting in development of investment
strategies An investment strategy combines goals and objectives of the LRTP agreed upon investments
and other transportation needs and constraints in the current funding environment One investment
strategy category is to Repair and Maintain the Unpaved Portion of the Denali Park Road and focuses on
desired condition targets which change depending on the Park Road segment This strategy aligns with
the VMPrsquos concept that the Park Road is less traveled by visitors farther into the park and those
segments with lower desired conditions can help reserve funding for other transportation asset
priorities
Due to the importance of financial analysis results it was decided to include the information as a spatial
component to PaTINA A table showing current and desired conditions for each segment with associated
milepost numbers was provided by one of the contractors working on the LRTP A GIS layer of mile
markers was used to correlate data from the table and create a new layer representing the financial
analysis Attribute information was added and the layer was symbolized by segment showing highest
priority and lowest priority Table 3 shows current and desired condition information that was
incorporated into the new investment ranking GIS layer These results can easily be compared to other
components such as high risk areas or goal area composites
7
Table 3 Financial analysis data based on mile markers
Mile Post Segment Current
Condition Desired
Condition Annual Needs
Priority Ranking
0 to 15 Entrance area to Savage River Trailhead
na 00 na 5
15 to 32 Savage River Trailhead to Teklanika Bridge
009 109 $013 M 4
32 to 39 Igloo Forest to Sable Pass 013 109 $014 M 4
39 to 43 Sable Pass to East Fork Bridge 013 109 $024 M 4
43 to 47 Polychrome to Plains of Murie 035 245 $074 M 2
47 to 62 Plains of Murie to Stony Overlook 013 149 $047 M 3
62 to 66 Stony Overlook to Eielson 014 149 $018 M 3
66 to 70 Eielson to Grassy Pass 017 325 $ - 2
70 to 88 Grassy Pass to Boundary Pit 012 325 $ - 2
88 to 92 Boundary Pit to Kantishna 0499 449 $012 M 1
GOAL AREAS During the early development of the Denali LRTP team members created six goal areas each with an
associated statement The goal statements represent aspects of the NPS mission and Denali vision
statements to help guide future transportation decisions These goal areas serve as a basis throughout
the LRTP for identifying baseline conditions performance management and implementation Table 4
shows the six goal areas and goal statements
Table 4 Denali LRTP goal statements
Goal Area Goal Statement
Resource Protection Understand and protect Denali NPPrsquos fundamental Park resources and values as they relate to the transportation system
Climate Change Plan for climate change impacts to the Parkrsquos transportation system
User Experience Provide a quality multi-modal Park experience for users
Access Provide safe efficient and appropriate Park access
System Optimization Develop a long-term transportation system to appropriately satisfy current and future Park needs
Partnership Manage formal and informal commercial partnerships to provide a viable transportation system
These goal areas served as a guide for GIS data collection Datasets related to each goal area were
identified collected and formatted as needed for the composite analysis The Partnership goal area is
not included in the PaTINA since no map-able data were identified Future iterations of the Denali
PaTINA may include the Partnership goal area if new data are obtained The System Optimization goal
was also not included in the analysis but rather it was called out separately for comparison in the final
model results This category is referred to as Asset Metrics (described above) and include FMSS-specific
data The purpose of this was to be able to spatially detect and understand the correlation between
FMSS data and the Parkrsquos values stated from the LRTP goal areas In total 26 GIS layers were used as
input layers for the analysis Layers from each goal area were overlaid upon each other so that the goals
8
could be visualized for the LRTP Listed below are the input layers for each of the goal areas used for the
analysis
Resource Protection
bull Sheep Gaps
bull Exotic Species
bull StreamRoad Intersections
bull Vegetation Monitoring Marker
bull Sheep^
bull Moose^
bull Bear^
bull Wolves^
bull Caribou (Aug-Sep)^
bull Caribou (July-Aug)^
bull Caribou (May-June)^
bull Wetlands
bull National Register Structures
bull Historic Districts
User Experience
bull Viewscapes
bull Visitor Services
bull Social Trails
bull Visitor Pattern
bull High Visitor Use Area
Access
bull Safety Areas of Concern
bull Railroad Depot
bull Bus Stops
Climate Change
bull Geohazards
bull Permafrost
^Based on extrapolated observation data reported in the Denali VMP
New data created by park staff for the PaTINA
During the process of collecting data data needs were recognized and collated Identified data gaps
included permafrost degradation river and stream flooding events informal aviation landing areas
congestion hotspots and wildlife patterns To fill certain gaps the Create New Features tool in the web
map was utilized by park staff Layers in the list above with an asterisk represent the ones created by
park staff Other identified data gaps focused on visitor use statistics Examples included dependable
traffic counts visitation numbers by area and visitor numbers on bus types beyond front country area
METHODOLOGY
DATA PREP All input data layers were projected to NAD_1983_Alaska_Albers Point and polyline datasets were
buffered and converted to polygon features and then clipped to the transportation network Figure 2
shows an example of a point layer created by park staff using the Create New Feature tool that was later
buffered and clipped Once the polygon data was created per input layer they were merged together to
create a single polygon layer For example park staff created multiple polylines and points to capture
visitor patterns along the Park Road The polygons were merged together to create a single visitor
pattern input layer under the User Experience goal area
9
Figure 2 Example of Denali staff input used to create data for the PaTINA
LAYER WEIGHTING Within the goal areas each input polygon layer was assigned a value The values ranged from 0 (no
impact) to 05 (lesser impact) to 1 (full impact) and was assigned by park staff Table 5 shows each goal
area and associated weighted values for each road segment The term ldquoimpactrdquo in this setting may refer
to impact the input layer has on the transportation network or conversely impact the transportation
network has on the input layer To align with the VMPrsquos subzones of the Park Road each input layer was
weighted separately for individual road segments Weighted per segment reflects park management
priorities which may vary for a particular input by road segment The High Visitor Use Area input layer is
an example of this where the impact is higher in the front country compared to further west on the Park
Road Therefore the High Visitor Use Area input layer received a higher impact value in the front
country road segment
10
Table 5 Layer input ranks assigned by park staff
RESOURCE PROTECTION GOAL AREA
Motorized Sightseeing
Subzone
Wildlife Viewing
Subzone 1
Wildlife Viewing
Subzone 2a
Wildlife Viewing
Subzone 3
Wildlife Viewing
Subzone 2b
Sheep Gaps 0 05 1 05 0
Exotic Species 1 05 05 05 05
StreamRoad Intersections 1 1 1 05 1
Vegetation Monitoring Marker 0 1 1 05 0
Sheep 05 05 1 0 0
Moose 1 05 05 1 05
Bear 05 05 1 05 05
Wolves 1 05 05 05 05
Caribou (Aug-Sep) 0 0 05 1 0
Caribou (July ndashAug) 0 05 05 1 0
Caribou (May ndash June) 0 0 0 05 0
Wetlands 1 05 1 1 05
National Register Structures 1 1 1 1 1
Historic Districts 1 1 1 1 1
USER EXPERIENCE GOAL AREA
Motorized Sightseeing
Subzone
Wildlife Viewing
Subzone 1
Wildlife Viewing
Subzone 2a
Wildlife Viewing
Subzone 3
Wildlife Viewing
Subzone 2b
Viewscapes 0 05 1 05 0
Visitor Services 1 1 1 1 1
Social Trails 1 1 1 1 1
Visitor Pattern 1 1 0 0 05
High Visitor Use Area 1 05 05 05 05
ACCESS GOAL AREA
Motorized Sightseeing
Subzone
Wildlife Viewing
Subzone 1
Wildlife Viewing
Subzone 2a
Wildlife Viewing
Subzone 3
Wildlife Viewing
Subzone 2b
Safety Areas of Concern 05 0 05 05 0
Railroad Depot 1 0 0 0 0
Bus Stops 1 0 0 0 0
CLIMATE CHANGE GOAL AREA
Motorized Sightseeing
Subzone
Wildlife Viewing
Subzone 1
Wildlife Viewing
Subzone 2a
Wildlife Viewing
Subzone 3
Wildlife Viewing
Subzone 2b
Geohazards 05 05 1 1 05
Permafrost 05 05 1 0 05
COMPOSITE ANALYSIS STEPS 1 Once the input layers were weighted the values were added into new fields in the attribute
table The new field names were abbreviated with each goal area name and input layer number
For example Resource Protectionsheep gaps would read as RP1 since sheep gaps was listed
11
first in the data collection table Another example would be Resource Protectionexotic species
shown as RP2 The following shows goal area abbreviations
a Resource Protection ndash RP
b User Experience ndash UE
c Access ndash AC
d Climate Change ndash CC
2 Within each goal area the input layers were combined with the transportation network layer
using the UNION tool creating a goal area output layer This resulted in the following layers
RP_Union UE_Union AC_Union and CC_Union
3 Using the DELETE tool all fields were deleted except for the five road segment fields This
reduced the file size of the output layer for future geoprocessing steps and faster speeds once
added to the web map
Steps 4-6 refer to only one goal area and one road segment For example Resource Protection
(RP)Motorized Paved Zone (MPZ)
4 A new field called RP_T_MPZ was added to the RP goal area output layer to sum the total
values This was completed by using the FIELD CALCULATOR tool and summing the MPZ value
for each input layer (RP1_MPZ + RP2_MPZ)
5 Due to the goal areas having a different number of inputs the total sum value was normalized
to avoid skewing the outputs to goal areas with more input layers By normalizing the total
values could be shown on a common scale A new field was added and called RP_TN_MPZ Using
the FIELD CALCUALTOR tool the RP_T_MPZ value was divided by the total number of inputs
resulting in a normalized number (RP_T_MPZ14= RP_TN_MPZ)
6 The RP goal area output layer was then clipped to a previously created MPZ road segment layer
(RP_MPZ_Clip)
Steps 1-6 were repeated for each goal area and road segment In total twenty clipped output layers
were created Figure 3 shows steps 1-6 in a flowchart
12
Figure 3 Process diagram for PaTINA steps 1 - 6
Steps 7-9 refer to only the MPZ road segment
7 The next step utilized the UNION tool to union each clipped goal area output layer by road
segment (RP_MPZ_Clip UE_MPZ_Clip AC_MPZ_Clip CC_MPZ_Clip = MPZ_Clip)
8 Once the MPZ_Clip layer was created a new field called All_MPZ was added to sum the total
normalized numbers The FIELD CALCULATOR tool was used and summed each goal areas
normalized number (RP_TN_MPZ + UE_TN_MPZ + AC_TN_MPZ + CC_TN_MPZ = ALL_MPZ)
9 The overall MPZ composite was then symbolized based on the total MPZ normalized values
(ALL_MPZ) and was shown with five classes using Natural Jenks classification The five classes
were symbolized from very low (dark green) low (light green) medium (yellow) high (orange)
to very high (red) which identified potential need areas throughout the transportation network
Figure 4 shows symbolization for the front country area in road segment MPZ
13
Figure 4 Mapped Potential Need Areas for the Motorized Paved Zone
Steps 7-9 shown in Figure 5 were repeated for each road segment In total five segments showed very
low to very high potential need areas
Figure 5 Process diagram for PaTINA steps 7-9
14
SELECTED RESULTS
OUTPUTS The PaTINA analysis resulted in four main output groups which may be viewed individually or compared
to one another These groups are asset metrics high risk areas investment rankings and potential
need areas See the Data Collection section for review of these groups
Figure 6 shows potential need areas against high risk areas located in Wildlife Viewing Subzone 3
segment of the Park Road The results appear to have several high risk areas spatially coincident with
high need areas highlighting locations that may be considered for financial investment Doing so may
help protect park resources and visitor safety
Figure 6 High Risk Areas shown with Potential Need Areas modeled in the PaTINA
15
Figure 7 shows potential need areas against high investment ranking along the Wildlife Viewing Subzone
2 segment of the Park Road The investment ranking displays two sections which are Igloo Forest to
Sable Pass (MP 32 to 39) and Sable Pass to East Fork Bridge (MP 39 to 43) Within the high investment
sections potential needs can be identified for further examination for future investment
Figure 7 Example PaTINA-modeled Potential Needs Areas shown with investment ranking data
16
ROAD SEGMENT FINDINGS
Motorized Paved Zone The motorized paved zone starts at the park entrance at mile post 0 and ends at mile post 149 (Figure
8) In this segment it appears that the greatest amount of very high potential need areas are
concentrated around the Denali Visitor Center and high potential need areas are located just east of
that surrounding the Riley Creek Campground These potential need areas consist of up to twelve input
layers each of which fall within all goal areas Findings also show the Park Headquarters and Savage
River to be potential need areas with values of medium and high
Figure 8 PaTINA-modeled potential need areas for the Motorized Paved Zone segment of the Park Road
17
Wildlife Viewing Subzone 1 The wildlife viewing subzone 1 spans the distance between mile post 149 to mile post 319 (Figure 9)
and includes the Sanctuary River campground and the Teklanika River campground and rest stop The
Teklanika River campground shows the largest very high potential need area Up to twelve input layers
from three of the goal areas cover this segment The access goal is not included Findings also show the
Sanctuary River campground and west of the Primrose Ridge and Mount Margaret rest stop to be a very
high potential need area though the spatial area is smaller compared to the Teklanika River
campground This location is comprised of up to thirteen input layers from all goal areas
Figure 9 PaTINA-modeled potential need areas for the Wildlife Viewing Subzone 1 segment of the Park Road
18
Wildlife Viewing Subzone 2a The wildlife viewing subzone 2a ranges from mile post 319 to mile post 66 (Figure 10) and includes
locations from Igloo Creek campground to Eielson Visitor Center The findings suggest that there are
many high potential need areas along this segment of road The most prominent areas are located
before and after Polychrome Overlook and includes up to ten input layers along this stretch The Eielson
Visitor Center shows very high potential need areas with up to twelve input layers from three goal
areas These findings may suggest future investment at this location due to high use at the visitor center
Figure 10 PaTINA-modeled potential need areas for the Wildlife Viewing Subzone 2 segment of the Park Road
19
Wildlife Viewing Subzone 3 Milepost 66 to mile post 846 is the wildlife viewing subzone 3 segment (Figure 11) which begins east of
the Eielson Visitor Center and goes to the Wonder Lake campground Results show west of the Eielson
visitor center with the greatest concentration of very high potential need areas A majority of this
segment ranges from very low to medium potential need areas until farther west near Wonder Lake
Wonder Lake campground consists of up to ten input layers from three goal areas
Figure 11 PaTINA-modeled potential need areas for the Wildlife Viewing Subzone 3 segment of the Park Road
20
Wildlife Viewing Subzone 2b The wildlife viewing subzone 2b starts at milepost 846 to mile post 920 being the farthest west of all
road segments (Figure 12) The only very high potential need area in this segment is located east of
Kantishna Results display that the very high area has up to 12 input layers from three goal areas The
east side of this area shows high potential need suggesting that this stretch could be identified as an
area for potential future investment
Figure 12 PaTINA-modeled potential need areas for the Wildlife Viewing Subzone 2b segment of the Park Road
DISCUSSION The Park Transportation Investment Needs Analysis (PaTINA) employs standard geospatial methods that can be repeated to reflect changing management goals as well as be applied in different facility management situations and scales The web mapping application deployed with the data allows for frequent review and consultation of the results to inform management decisions
21
Execution of the methods however requires intensive data gathering and formatting Further the
weighting process is currently accomplished in a desktop GIS after subject matter experts are polled for
input weights This process could be improved with tool development in either the desktop environment
or the online web map to streamline how GIS data are included and weighted in the model While the
process in its current state is repeatable in most cases it requires a GIS specialist and a desktop GIS to
complete We foresee improving either the desktop or online tool (or both) to make the process more
accessible and rapid Depending on the data inputs however the overlaying process may still require
extensive data collection and preparation Additionally the overlaying process can be computer
intensive--again depending on the data inputs--and may be prohibitive due to available resources
The data collection process in this analysis identified data needs which are collated separately and listed
above under Goal Areas Acquisition and incorporation of these data may improve the PaTINA results
Visitor use statistics are an especially glaring omission which if obtained will improve future PaTINA
modeling
Seasonal variations in some inputs are not well represented in the analysis Further work may entail
modeling specific seasons to help inform investment strategy throughout the year
INTERNAL WEIGHTING The PaTINA applied to Denali NPampP weighted each input layer uniformly across the spatial extent of the layer However some data contained attributions that could be weighted differently Because the weights were assigned by park staff for each input layer based on the road segments further weighting based on attributes internal to a layer would unnecessarily complicate the composite scoring Future iterations of the model for Denali may consider applying layer attributes to vary weights across the layer instead of applying weights per road segment Alternatively the weights assigned by road segment could be normalized against the attribute weighting but the statistical validity of this needs to be explored
SKEWED DATA The initial run of the PaTINA model showed skewed results within the front country segment NPS staff
clarified that specific locations within the front country segment should have been identified as very
high or high potential need areas instead of low and medium rankings The main concern was around
the Denali Visitor Center and vicinity that included the railroad depot trailheads and visitor amenities
As a known high visitor use area the visitor center and surroundings should be considered a high
potential for investment The data and associated weights were examined and it was concluded that the
user experience goal area was lacking desirable input layers to validate higher rankings Once the
additional input layers were identified they were added to the next run model and results showed
important locations such as the Denali Visitor Center with higher rankings
SPATIAL SPREAD OF DATA Input layers across the goal areas differ spatially within the road segments The resource protection goal
area is the only goal area in which input layers coincide with the transportation network within all five
road segments User experience and climate change goal areas are within four segments with no data in
22
the last segment wildlife viewing subzone 4 The access goal area contains data only within the first
segment motorized sightseeing subzone Although input weights are normalized for each goal area the
spatial spread of the data influences the results where more inputs are occurring
The results show classes of potential need areas throughout the entire transportation network due to
some input layers completely overlaying it These layers are exotic species each of the mammal layer
inputs excepting sheep and permafrost Due to the spatial spread of these data every area of the
transportation network can be classified as at some level of potential need for investment
NEXT STEPS The data and web mapping interface will require maintenance as updated or new data and web
mapping tools become available We see the initial release of the web map for the Denali PaTINA as a
first step toward a more comprehensive tool to aid the park in investment decision making As noted
above stream-lining the weighting and model execution processes would improve the overall utility of
the PaTINA
Additional development of the PaTINA web map may include incorporation of other map services such
as the NPS Road Inventory Program and data services from the Inventory and Monitoring network
Conversely the base PaTINA results can be added to other web map applications that may focus on
other issues
Finally development of instructional materials and accompanying training sessions would bolster and
help maintain the utility of the PaTINA results and its application to park management
National Park Service US Department of the Interior
Denali National Park and Preserve Long-Range Transportation Plan
Appendix F Denali Funding Plan
Denali National Park and Preserve Financial Analysis Technical Report ndash FINAL DRAFT
Introduction This report discusses the transportation funding aspects of the Denali National Park and Preserversquos first Long Range Transportation Plan It includes a retrospective of transportation funding from 2006-2013 a projection of funds expected to be available for transportation during the planrsquos twenty year planning horizon and a summation of the resources necessary to return transportation facilities at Denali National Park and Preserve (Denali NPP) to ideal conditions As is true for all of the National Park Service (NPS) the amount of funding that is needed for transportation at Denali NPP exceeds the amount that will be available in coming years and so this report includes an investment strategy that funds the highest priority needs
The discussion must begin with two of the NPSrsquos guiding transportation investment principles and Denali NPPrsquos primary existing transportation document the Vehicle Management Plan (VMP) It then discusses Denali NPPrsquos place in Alaska Region transportation funding and the expected increase in funding needs due to climate change impacts The middle section of this report discusses the LRTP methodology in general and how the Denali NPP LRTP methodology differs from those used for other NPS LRTPs There is also a discussion of historical forecasted and needed transportation funding that collectively make up the baseline transportation funding report for Denali NPP
This report concludes with a discussion of the funding strategies which were evaluated for the Denali NPP LRTP and how the final strategy was selected The investment strategy prioritizes operations and maintenance the rehabilitation of the paved section of the Park Road funds the unpaved sections of the Park Road to achieve management priorities and provides approximately $1m per year to address other transportation priorities The Denali NPP transportation investment strategy is expressed with respect to each of the four LRTP planning scenarios to guide park management decisions during times when visitation is increasing or decreasing and when funding (or stakeholder support) is higher or lower than average Funding shortfalls means that the condition of all transportation assets cannot be improved but progress can be made to address the highest priorities
Funding Denali Transportation Facilities
Capital Investment Strategy and Total Cost of Facility Ownership As a best practice and formal policy the NPS incorporates strategic facility planning into its asset management decision-making processes including LRTPs Two fundamental concepts the NPS Capital Investment Strategy (CIS) and Total Cost of Facility Ownership (TCFO) underlie those best practices and are drivers of the investment planning and decision-making reflected in the Denali LRTP
The NPS Capital Investment Strategy The CIS is an NPS strategy for prioritizing project investment to ensure effective and responsible project funding The CIS includes a scoring tool that decision-makers at all levels of the NPS have available to them to inform project investments and other asset management needs
The purpose of the CIS is to help prioritize investments focus on mission-critical assets manage operations and maintenance and ensure that the greatest impact can be made with available capital and operational funds The CIS uses a scoring tool to evaluate projects on a number of different criteria Financial Sustainability Visitor Experience Resource Protection and Health amp Safety The four categories are weighted using a predefined algorithm to arrive at an overall project score Projects can then be compared by score as needed in theory the greater the score the higher the priority The scoring strategy supports an asset management approach that emphasizes maintaining key assets and reducing the estimated value of deferred maintenance cost against those key assets
Some of the key objectives in the Financial Sustainability strategy are to build only what can be maintained right-size the asset portfolio reduce liabilities reduce resource consumption to promote sustainability and eliminate non-essential development in order to emphasize the essential natural and cultural experience The Visitor Experience strategy includes investment in assets or resources that enable recreation and serve as gateways to park units contact stations and interpretive assets The Resource
DenaliLong Range Transportation PlanFinancialTechReportndashFINAL DRAFT 1
Protection strategy focuses on those historic cultural and natural resources that the NPS is tasked with protecting and preserving Such tasks supported by the CIS could include preservation repair and restoration of assets Finally the Health amp Safety strategy places an emphasis on correcting unsafe or hazardous conditions within park units that pose a threat to visitors or staff Different parts of the Denali LRTP address these four strategies which are used by fund program managers to allocate limited funding
Total Cost of Facility Ownership Applying the concept of Total Cost of Facility Ownership (TCFO) is considered by the NPS to be a vital part of a financially sustainable infrastructure strategy and practice to truly address transportation asset management1 It aligns closely with the intentions behind the CIS especially the CIS Financial Sustainability component TCFO is the full life-cycle cost of constructing maintaining and operating an asset until it needs replacement This concept recognizes that assets require investment throughout their service lives until they need replacement or disposition and that preventive maintenance and facility operations activities are key to minimizing long-term costs and optimizing the life of said assets Implementation of the TCFO concept involves a shift-away from a ldquojust fix itrdquo or ldquorun to failurerdquo mentality to more holistic planning making cost estimates and decisions that consider not just the deferred maintenance (DM) of an asset but the ongoing OampM need over its service life need for replacement and ultimately disposition
The Denali LRTP team took the concepts inherent to the CIS and TCFO and embedded them into all of its LRTP analyses and planning activities Consequently the resulting investment strategy selected by Denali NPP staff is consistent with the approaches and practices used across the NPS to develop for example the National LRTP and other unit or regional LRTPs
The Denali Park Road and the Vehicle Management Plan Denali NPP is one of the most visited National Park Service units in Alaska and the Denali Park Road is the means for the majority of visitors who wish to traverse deep into the interior by any mode motorized or otherwise For many visitors it is the most readily accessible transportation corridor for them to experience the Alaska wilderness and for some it is their only option Denali NPP is currently several years into the implementation of its VMP the culmination of an intensive planning effort to balance the needs of the parkrsquos natural resources with high visitor demand The Denali LRTP is consistent with the recommendations in the VMP
Generally the VMP recommends limiting vehicle traffic on the Denali Park Road in order to reduce traffic impacts on natural and cultural resources The VMP has a ldquotelescopingrdquo approach where visitor activity is highest and associated development is most extensive in the paved entrance area of the park and declines and lessens respectively as the Park Road heads west As shown later in the section on Funding Strategies the Denali LRTP reflects this by realigning maintenance and rehabilitation investments along the Park Road to concentrate on the areas of highest visitor activity and most extensive development
Funding Trends The Federal Lands Transportation Program in the NPS Alaska Region The Federal Lands Transportation Program (FLTP) is the single largest source of transportation funding for the National Park Service and other Federal land management agencies Project funding decisions are made at the regional level following national guidelines The FLTP at a national scale has recently been reauthorized at a higher funding level than analyzed in this plan However interim program guidance suggests that the majority of the increase will be reserved for nationally significant major projects with only a small increase to regional allocations
Denali NPP has historically been the largest recipient of FLTP funding in Alaska in part because 20 of the Regionrsquos 27 miles of paved roads are within Denali NPP The unpaved Park Road may also be funded by FLTP NPS regional staff indicate that Denali NPP has in the past received all funding from the program by default unless another NPS Alaska Region park unit has eligible needs (which is rare) at which point that project from another park unit moves to the top of the regional FLTP program This means that FLTP will likely be a sustainable funding source for major investments at Denali NPP into the future The next three years of FLTP investment at Denali will be primarily used to rehabilitate the 15 mile paved section of the Park Road from the park entrance to the Savage River checkpoint
1 For example reference ldquoMemorandum Guidance for Addressing Facilities in Planning Documentsrdquo Associate Director Park Planning Facilities and Lands
National Park Service US Department of the Interior January 4 2016
DenaliLong Range Transportation PlanFinancialTechReportndashFINALDRAFT 2
Climate Change and Geotechnical Hazards As explained elsewhere in the LRTP current research indicates climate change is dramatically affecting transportation facilities across Alaska The impacts of climate change relevant to Denali NPPrsquos transportation system include thawing permafrost unstable slopes a lengthening shoulder season and other change indicators Most of these changes will result in higher costs to operate and maintain Denali NPPrsquos transportation network which will further stress already limited funding
Monitoring and evaluation of climate change impacts is an ongoing need and a recommendation of this LRTP Tracking threats and hazards to the transportation system such as unstable slopes requires funding for specialized equipment and the technicians and scientists who collect and analyze the data Funding updates to hydrology models and monitoring permafrost thawing are other near-term relatively inexpensive data needs that can help avoid disastrous impacts over the medium to long term Denali NPP has initiated the effort but funding has not been identified for developing specific plans for how to adapt the transportation system in the park to these expected impacts
In the near term a number of susceptible areas along the Park Road will likely encounter more frequent closures due to intermittent landslides flooding or debris flows with each requiring cleanup and reopening The future impacts of one of the effects of climate change increasing precipitation in the Denali Borough region can already be previewed during excessively wet years 2016 was a particularly wet year and staff were faced with unstable slopes and more frequent and more severe debris flows Beyond the cost of cleaning up after these road closures there are short-term disaster management tasks for which Denali must be ready ndash evacuation or care of visitors staff users and inholders on the far side of an interruption
Some dedicated funding sources are available for recovery costs such as NPS Emergency Storm amp Flood Damage and FHWArsquos Emergency Relief for Federally Owned Roads (ERFO) These programs have limited budgets and will be increasingly strained in an era of continued climate change impacts not just in Denali NPP but across the National Park Service These funding sources are currently limited to recovery costs only and cannot be used for monitoring or preventive work that can anticipate and avoid a future event such as by stabilizing slopes or realigning a road
There are several segments of the Park Road and its associated bridges and structures that may become physically or financially untenable in the next few decades There may come a time when the park will need to consider decommissioning rerouting andor relocating these facilities These costs are not yet known but will likely far exceed Denalirsquos typical past annual funding and may require special major project funding US Department of Transportation (DOT) discretionary grants such as the (unfunded) Nationally Significant Federals Lands and Tribal Projects program or Transportation Investments Generating Economic Recovery (TIGER) are possible sources as is the NPS Line Item Construction program However because these needs are not yet quantified and because they are beyond the capacity of the current funding programs to address the costs of fully adapting the transportation system to climate change are not included in the Denali LRTP financial analysis
Denali LRTP Funding Baseline Financial Analysis Methodology The financial analysis methodology for the Denali LRTP is based on the data and methods first developed for the NPS National LRTP (NLRTP) A much more detailed technical summary is available for the NLRTP and generally applicable to the Denali LRTP but this section will cover the basic steps as well as deviations used to adapt it to the unit level
Historical Investments Establishing a financial baseline of the historical average annual level of regional transportation spending provides a foundation for forecasting the
Annual transportation investments at Denali likely future available funding levels which can be anticipated for Denali NPP averaged $923 M per year from 2006-
NPPrsquos transportation facilities This is important information for developing a 2013 from all funding sources combined fiscally-constrained LRTP The LRTP team analyzed all of the fund sources that had been used for transportation investments at Denali NPP from fiscal year (FY) 2006 through FY 2013 These results provide a vital context for developing the Denali LRTP investment strategy
DenaliLong Range Transportation PlanFinancialTechReportndashFINALDRAFT 3
The LRTP team estimates that approximately $775 M per year will be available to Denali NPP for transportation purposes over the next six years
The financial data was extracted from various financial and project management data tracking systems2 The LRTP team
identified historical expenditures awards and authorizations for transportation assets
adjusted those prior year dollar values to equivalent 2014 values using GDP inflation factors and
calculated an annualized average transportation funding expenditure rate for the period FY 2006 ndash FY 2013
This data was initially prepared by the National LRTP team and then reviewed by the Denali LRTP team to remove any anomalies To simplify reporting the dataset was consolidated coded and grouped by funding authorizations funding programs work types and asset types All identifiable American Recovery and Reinvestment Act (ARRA) investments a one-time extra-ordinary funding source were removed from this analysis A detailed technical methodology document is available from the NLRTP effort
Because the data only includes transportation expenditures made by the National Park Service it does not include transportation
each funding source that Denali NPP has recently used for transportation It
funding and support with an increase in visitation) or ldquoSurplus of Moneyrdquo scenario (increased funding and support with a decrease in visitation) when compared to the historical average However for the purposes of the investment strategy in this plan the funding forecast is considered to be at the center of our ldquoManagement Strategies of no Regretrdquo - those actions that make sense given a normal variation in expected support funding and visitation levels
The Denali LRTP team leveraged the approach applied in the development of the NPS National LRTP to forecast anticipated funding availability for transportation investments in the near future There were two main sources of forecasting information
The NPS budget office The Budget Office conducts forecast exercises servicewide and with individual units The Budget Office suggested the LRTP program assume a one-time reduction to Title 54 (DOI) Non-Fee program fund sources of three percent for ONPS and Cyclic Maintenance programs in the NPS National LRTP The DENA LRTP forecast was based on a combination of actual funding program investment plans where possible and the three percent cut when it wasnrsquot The three percent reduction only applied to programs for which the Denali LRTP project team did not have access to an investment plan (eg Operational Base)
Regional Funding Programs The Denali LRTP project team consulted several regional-level program plans to acquire information on planned investment levels Title 54 Non-Fee programs for Cyclic Maintenance RepairRehabilitation and Line Item Construction Title 16 54 Fee programs for Recreation Fee Transportation Fee and Concession Franchise
investments by third parties The parkrsquos partners such as the Alaska Railroad bus concessioners Denali Borough and the Alaska Department of Transportation and Public Facilities (ADOTampPF) all fund transportation work that helps visitors employees inholders and freight carriers access the park However these investments are not accounted for in this analysis because these data do not enter NPS financial data systems
Forecasted Transportation Funding This section documents the Denali NPP financial forecast for transportation based on anticipated future funding levels that can be reasonably assumed to be available The forecast of available funding provides the principal financial constraint against which future investment plans must be prioritized and represents the result of the most likely funding scenario for
does not include a forecast for work done by other parties such as the State of Alaska or Denali Borough that may benefit Denali NPP and it also doesnrsquot include any unforeseen additional funding which may result in a ldquoPopular Parkrdquo scenario (increased
Fees and the Title 23 Federal Lands Transportation Program These forecasts replaced the National LRTP-style (ie three percent reduction) forecasts for these programs as they provide more certainty than broad program-level authorizations and appropriation amounts
The elimination of the Paul S Sarbanes Transit in the Parks Program (TRIP) is another factor to note in the forecast but the only analysis needed is to not project any future grant awards from this program Denali made use of TRIP in the past but will need to seek other funding sources to fund future transit and trails projects This is also true of various grant programs formerly used by many parks but not Denali NPP such as Scenic Byways or the Public Lands Highway Discretionary Program
2 Systems used included the NPS Administrative Financial System (ie AFS Versions 3 and 4) and the joint Federal Highway Administration (FHWA)NPS Park Roads and Parkways Transportation Allocation and Tracking System aka PTATS
DenaliLong Range Transportation PlanFinancialTechReportndashFINALDRAFT 4
Unfortunately transportation funding for Denali NPP is expected to decline unless additional funding sources are found or funds are redirected from other critical areas The declining funding environment coupled with historically high visitation may result in a ldquoLosing Groundrdquo scenario (decreased funding and support with an increase in visitation) when compared with historical averages These conditions are not dissimilar from recent years (eg 2013-2015)
Transportation Investment Needs Investment needs are defined in this plan as the amount of funding required to bring transportation assets to good condition and sustain them at that level Investment needs also include costs to address programmatic needs such as code compliance structural fire and accessibility Other goal area needs such as resource protection may overlap with asset management (TCFO) needs or may be additional potentially unfunded requirements
The LRTP team estimated an annual need of $1242 M to return the Denali NPP transportation system to good condition and keep it there over six years
The Denali LRTP used a similar methodology as the National LRTP and other Regional LRTPs using needs data from the best available data system or report that covers a particular type of transportation facility and type of work However many of the reports and systems available at the regional or national level do not apply to individual parks The principal difference between the needs in the Denali LRTP is the use of automated systems The data sources used for the Denali LRTP are
Reoptimization File OampM needs for all facilities except the unpaved Park Road
2013 Alaska Region Unpaved Road Analysis (pilot) Detailed analysis for the unpaved Park Road
Facility Management Software System (FMSS) Component renewal and programmatic needs
Project Management Information System (PMIS) Capital investment needs planning naturalcultural resources
National list of megaprojects Paved Park Road repair project and replacement of the Toklat River Bridge
Differences between the needs sources such as timespans and prioritization systems were reconciled in order to create a single set of transportation facility needs for Denali NPP Park staff also reviewed the needs data and removed several projects that were already underway or would be accomplished through partners rather than by the park At $1242 M per year the estimated annual transportation investments needs exceed the annual transportation funding amount by $467 M per year
Transportation Funding for Denali NPP This section discusses the current and near future transportation funding outlook for Denali NPP It covers where funds have come from and how they have been used in terms of what type of transportation facility was funded what type of work was funded and how transportation funding is prioritized
Investments by funding source From 2006-2013 the National Park Service as a whole used more than 60 different funding program and accounts to fund transportation activities but only ten programs funded investments at Denali NPP Table 1 below shows how much each funding program provided in the past how much it is expected to provide in the future and how much would be needed from each funding program to cover Denalirsquos total transportation need each year if past investment patterns were continued
DenaliLong Range Transportation PlanFinancialTechReportndashFINALDRAFT 5
Table 1 Denali NPP Transportation Investments and Needs by Funding Source (in millions of 2013 $)
Investments by funding source
Historical Average Annual Investment
Forecasted Annual Average Investment
Estimated Annual Needs
Title 54 Non‐Fee $175 M $101 M $335 M
Cyclic Maintenance $063 M $004 M $001 M Line Item Construction $034 M $032 M $007 M Operational Base $064 M $055 M $270 M Other NPS Programs $007 M $007 M $019 M
RepairRehab $007 M $002 M $039 M
Title 54 Title 16 Fee $134 M $211 M $261 M
Concessions Franchise Fees $067 M $144 M $051 M
Recreation Fee $067 M $067 M $210 M
Title 23 $601 M $462 M $586 M
FLTP $601 M $462 M $586 M
OtherExternal $014 M $001 M $060 M
FTA TRIPATPPL $012 M ‐‐ ‐‐
Reimbursable Agreements $001 M $001 M $060 M
Grand Total $923 M $775 M $1242 M
Each of these funding programs have a different legislative authorization and project eligibility criteria Title 54 programs are those authorized by Title 54 of the US Code (National Park Service-specific programs) Title 16 includes other relevant Department of the Interior programs (ie Recreation Fee Program) Title 23 includes programs overseen by the Federal Highway Administration and the ldquoOtherExternalrdquo category includes other funding sources such as the discontinued TRIP program as well as reimbursable agreements donations partnerships and other less common sources
Investments by Facility Type
Denali NPP maintains a diverse system of transportation facilities including paved and unpaved roads bridges paved and unpaved transportation trails transit facilities developed airstrips as well as support infrastructure such as a materials (gravel) quarry Table 2 below shows historical investments forecasted investments and the estimated annual investment needs for each of the parkrsquos transportation facility types
Of all historical investments in transportation at Denali NPP in the recent past about 55 went to the Park Road and associated structures and 18 supported parkwide operations that include the Park Road Less than a third was used for separate transportation facilities such as trails and access roads Park Road funding was oriented to the unpaved segments that require frequent repair work to remain in even fair condition given the extreme conditions and heavy vehicle traffic in Denali NPP Recent investments in several difficult sections in the western end of the Park Road helped restore user comfort and safety
DenaliLong Range Transportation PlanFinancialTechReportndashFINALDRAFT 6
Table 2 Denali NPP Transportation Investments and Needs by Asset Type (in millions of 2013 dollars)
Historical Forecasted Average Annual
Average Annual
Estimated Annual
Asset Type Unpaved Roads
Road Bridges
Trails and Transit
Investment $386 M
$184 M
$147 M
Investment $235 M
$042 M
$066 M
Needs $527 M
$135 M
$137 M
Paved Roads $144 M $291 M $297 M
Other3 $051 M $053 M $066 M
Parking $011 M $089 M $081 M
Grand Total $923 M $775 M $1242 M
Historical Forecasted Average Average Estimated Annual Annual Annual
Lifecycle Stage Investment Investment Needs Planning and Administration4 $058 M $057 M
Capital Investment $134 M $259 M $130 M
Operations and Preventive Maintenance $045 M $048 M $186 M
Recurring Maintenance $142 M $083 M $374 M
Component Renewal $527 M $259 M $508 M
Grand Total $923 M $775 M $1242 M
Denali NPPrsquos greatest area of transportation investment need is in heavy repair and rehabilitation work similar to much of the rest of the National Park Service Insufficient funding often leads to smaller routine maintenance work being deferred which causes transportation facilities to fall out of a state of good repair Other significant needs at the park include annual operations and maintenance of transportation facilities and making improvements to culverts that provide for fish passage and building an aircraft hangar
Note that some categories such as capital investment show ldquosurplusesrdquo where more funds are forecasted for investment than are needed This is the result of project programming where several capital investment projects are scheduled for near-term
Investments by Asset Lifecycle stage As discussed in the section on Total Cost of Facility Ownership different types of work are needed at different points in a transportation facilityrsquos lifespan from planning through to rehabilitation or disposition Table 3 below shows historical and forecasted annual investments as well as estimated annual investment needs for each lifecycle stage for all asset types combined
Table 3 Average Annual Investments by Lifecycle Stage (in millions of 2013 dollars)
construction in 2016-2021 whereas the needs represent the average annual needs over twenty years
3 Other category includes aviation buildings that support transportation equipment and multimodal facilities Trails and Transit notably excludes investments and OampM spending made by the transit contractors who operate within Denali NPP but does include Denalirsquos own investment in bus transit facilities such as buildings lots and experimental hybrid buses 4 Routine planning and administration needs are not included in NPS facilities management data systems but can be assumed to continue at historical levels Additional unquantified planning needs are likely in the LRTPrsquos horizon including work in the parkrsquos entrance area coordination with private shuttle services and the Alaska Railroad and transportation planning to maintain park operations in the face of climate change impacts
DenaliLong Range Transportation PlanFinancialTechReportndashFINALDRAFT 7
Priority Estimated Annual Optimizer Band Equivalent Transportation Needs
Highest Priority $377 M Band 1 High Priority $584 M Band 2 Other Priority $281 M Bands 3 4 5
Programmatic Needs Some of the lifecycle stage needs are also considered programmatic needs for transportation facilities at Denali NPP Programmatic needs include work necessary to meet standards set by safety accessibility environmental and fire safety requirements It is generally analogous to code compliance work that would be the responsibility of a facilities manager or an architect hired by a private business
Figure 1 summarizes estimated programmatic needs for the Denali NPP transportation asset portfolio which total less than $300000 Transportation facilities generally have relatively small programmatic needs compared to facilities such as visitor centers housing and offices Although not broken out in the historical and forecast data these types of projects are included in the NPS Facility Management Software System (FMSS) as needs Denali NPPrsquos programmatic needs are included in the overall $1242 M per year needs as capital investment or component renewal needs They are classified as capital investment if plans are to proactively address them as individual projects or as component renewal when addressed through a rehabilitation project that focuses on a low condition rating
Figure 1 Denali NPP Transportation Programmatic Needs
Investments by Asset Priority The final classification for investments is what priority of assets they were used to build maintain or repair NPS financial and asset management systems do not support this analysis for the historical or forecast data Each future investment need at Denali NPP is associated with the priority of the asset or the project itself this is shared below in Table 4 For the purposes of this plan Highest Priority is generally defined as Optimizer Band 1 High Priority is defined as Optimizer Band 2 Optimizer bands 3-5 are defined as ldquoother priorityrdquo Although they are not banded as such critical Park Road work is labeled as Highest Priority consistent with the priorities discussed during the investment strategy section later in this report
Table 4 Estimated Annual Needs by Priority
Denali NPP differs from other National Parks and the NPS as a whole due to the relatively low proportion of the total need in the highest
DenaliLongRangeTransportation PlanFinancialTechReportndashFINALDRAFT 8
priority need category Many transportation facilities in Denali NPP have been categorized in optimizer bands 2-5 This reflects the values laid out in Denali NPPrsquos Foundation Statement that place a high priority on investment in resource protection science and other portfolio areas ahead of transportation and broader visitor use needs As a result the park is able to cover its entire highest priority transportation needs given current funding In fact the $775 M per year in forecasted funding is enough to cover 80 of the highest and high priority transportation needs combined However there are still high priority transportation needs that will remain unmet unless additional funding is found and longer-term and lower-priority needs that cannot be met with forecasted funding
Investment Strategies The final step of the financial planning process for NPS LRTP development is the formulation of an investment strategy It is a synthesis of the planrsquos goals and objectives already formulated projects and other transportation-related needs and the reality of the constraints that exist in the current funding environment This section of the report describes the process used by the Denali LRTP team to identify several potential investment strategies including the strategy selected by Denali NPP staff for the Denali LRTP It also discusses potential alternatives which park management may consider if future funding or visitation deviates significantly from the forecast referencing the planning scenarios used in the development of the Denali LRTP
Methodology The key to understanding the funding strategy process is that funding in a constrained environment is a zero-sum game All investment strategies make use of the same $78 M annual funding amount that is forecasted for the near future Because transportation needs exceed this amount and because moving funds from other purposes deprives those projects of needed funding all investment strategies shift funds from one set of priorities to another The OampM strategy option shown in Table 5 for example focuses on staying current on annual operations and preventive maintenance work at the expense of larger repair projects
Unlike the plans for the National Capital Southeast Midwest Regions and the NPS as a whole the Denali LRTP used a single modeling tool to model the results of the different funding strategies on the Denali NPP transportation system A deferred maintenance (DM) FMSS-based tool was modified by a contractor (Booz Alan Hamilton) to work at the unit level and take into account park specific facilities such as the unpaved Park Road This tool uses extracts from FMSS to estimate Facility Condition Index (FCI) and DM outcomes given a known annual funding level The FCI outcomes reported for this effort are lsquoAdjusted FCIrsquo which includes programmatic needs and an anticipated 35 cost markup in addition to the ldquorawrdquo DM normally used in calculation of the FCI
Strategy Development Process
Methodology and Initial Strategy Concepts The team held several workshops and follow-up discussions with NPS stakeholders and partners to identify candidate strategies and to select the Denali NPP LRTP Investment Strategy (p 12) Internal NPS stakeholders included Denali NPP staff Alaska Region staff and the Washington Support Office (WASO) Partner input included expertise from FHWA Western Federal Lands Highway Division and US DOT Volpe Center staff familiar with the NPS LRTP financial planning process
The team worked with stakeholders to identify potential candidate strategies in light of CIS and TCFO policies best practices and past investment patterns (see Table 2 and Table 3) The initial investments strategies are shown in Table 5 below and were based on trends discussed by the project team early on in the Denali LRTP
DenaliLong Range Transportation PlanFinancialTechReportndashFINALDRAFT 9
The reaction to the strategies from park staff indicated high interest in the OampM strategy ndash if the park is able to at least stem the growth in deferred maintenance using its typical transportation funding sources then the park can later seek out additional funds to rehabilitate facilities that are no longer in a state of good repair The specificity of the three strategies that make different kinds of improvements was eliminated in favor of a general ldquomake improvementsrdquo strategy since transit and trails enhanced ITS and safety and emergency response are all priorities at the park that vary from year to year Finally Denali NPP staff noted that given its current condition the unpaved section of the Denali Park Road could still be one of the best unpaved roads in Alaska even with a reduction in maintenance levels so exploring redirecting some funding from the Park Road to other facilities in the park might be
Table 5 Initial Investment Strategy Concepts
Investment Strategy Option
Invests inhellip At the expense ofhellip
Business as usual Highest priority assets Lower priority assets
OampM emphasis Fund 100 of annual OampM needs for all assets Capital investments and rehabilitation
Transit and trails $1 M for existing transit and trails before other investments $1 M for roads and parking
Make improvements $1 M per year for new assetsservices (eg employee transit real-time bus trackers new trails)
$1 M less for annual OampM and rehabilitation
Safety and programmatic needs
Programmatic and safety needs before everything else (eg accessibility slope stability)
$1 M less for annual OampM rehabilitation
a viable option Various sections of the Park Road meet different condition criteria from good to fair to poor
Refined Investment Strategies No one strategy rose above others as a preferred strategy in the first round of modeling but the number of strategies was narrowed to two Both strategies funded all operations and maintenance needs and ensure that planned projects such as the paved Denali Park Road rehabilitation are completed but one option set aside $1 M per year for improvements or new facilities Table 6 below shows the tradeoffs of the two refined general strategies
Table 6 Refined Investment Strategies
Strategy Invests inhellip At the expense ofhellip
Cover all OampM complete planned projects
OampM and critical near-term repair needs
Making improvements
Cover all OampM complete planned projects and reserve $1Myr for improvements
OampM critical near-term repair needs and improving transportation at Denali
Buying down deferred maintenance
Unpaved Denali Park Road Analysis In addition to these two strategies Denali NPP staff also wanted to test whether transportation funds allocated to the unpaved Park Road in a business as usual approach could be shifted to other purposes The LRTP team as well as staff from Denali NPP and the Alaska Region developed five different options for unpaved road condition targets that could be modeled to estimate costs of different sets of conditions Table 7 below summarizes these five sets of condition targets Each of the two general strategies were tested using the five sets of condition targets for a total of ten investment strategy and condition results The strategies in Table 7 highlighted in red were not achievable give projected funding levels and established higher priorities
DenaliLong Range Transportation PlanFinancialTechReportndashFINALDRAFT 10
Table 7 Unpaved Park Road Conditions
Strategy Goals Annual Cost
Plan A Maintain all Park Road segments in good condition $43 M
Plan B Maintain all Park Road segments in fair condition $37 M
Plan C Set Park Road conditions from segment to segment recognizing that some segments are costlier to maintain in good condition than others
$29 M
Plan D Follow the VMPrsquos ldquotelescopingrdquo approach by keeping conditions good in the first part of the road fair in the middle part and poor at the western end
$25 M
Plan E Follow the VMPrsquos ldquotelescopingrdquo approach by keeping conditions good to fair in the first to middle parts of the road and poor at the western end
$27 M
Plan F VMP ldquotelescopingrdquo approach as in Plan E but with further lowered condition targets for two of the most expensive areas - MP 43-47 and MP 88-92
$20 M
Refined Strategy Results
general strategy was discarded Even without reserving $1 M per year projected funding is insufficient to meet the good to fair
Unlike the initial strategies several of the refined strategies were not viable None of the condition targets on the unpaved Park Road could be met if Denali NPP was to reserve $1 M per year for making improvements elsewhere on the park and so that
conditions proposed under plans A and B for the unpaved park road without scaling back commitments to OampM planned repaving of the paved sections of the Park Road and the rest of Denali NPPrsquos transportation facilities Additional funding could make Plans A and B possible ndash about $13 M per year more would allow for Plan A to be achieved and $07 M more per year would allow plan B to be achieved
Plans C D E and F are viable given currently constrained funding levels Plan C shows that it is possible to meet all of the investment strategyrsquos commitments and still maintain the unpaved Park Road on a segment-by-segment basis The conditions explored in Plan C take the relative expensive of each segment into account and the most difficult segments are allowed to remain in fair to poor condition However modeling showed that meeting these conditions would provide almost no funding for other transportation priorities
Plan D applies the Vehicle Management Planrsquos ldquotelescopingrdquo approach to the maintenance of the unpaved Denali Park Road and targets mid-poor condition for the farthest west segments which are intended to be more rustic and less traveled but keeps the middle and eastern segments in fair to good condition Under this plan nearly $05 M per year would be available for other transportation priorities Plan E made slight changes to keep more of the road in good condition instead of fair
Plan F was ultimately selected as the condition target for the Denali NPP LRTP This option retains the approach of Plan E but reduces condition targets for two sections which are particularly challenging and expensive to maintain Under plan F Polychrome Pass would be improved slightly (but still be in poor condition) while the final stretch of the park road would be allowed to decline to poor condition These two changes free about $06 M per year for use elsewhere on the road and in Denali NPP More information about these two segments is provided in Appendix A at the end of this technical report
Denali LRTP Investment Strategy The refined strategy results narrowed down the policy options for the unpaved Park Road and led to the selection of the Denali LRTP Investment Strategy as the best fiscally-constrained option for meeting the goals and objectives of the plan This strategy
DenaliLong Range Transportation PlanFinancialTechReportndashFINALDRAFT 11
would invest Denalirsquos forecasted $775 M per year in four categories as shown below in Table 8 and Error Reference source not found below
Table 8 Denali NPP LRTP Investment Strategy
Category Estimated share Estimated annual Percentage of of annual funds investment needs met
Operations and Preventive 37 $29 M 100 of needs Maintenance (all met transportation assets)
Rehabilitate Paved Portion of 24 $19 M 100 of needs the Denali Park Road met
Repair and Maintain the 26 $ 20 M 46 of needs met Unpaved Portion of the Denali Park Road
Repair and Improve Other 13 $ 10 M 24 of needs met High-Priority Transportation Assets
Totals 100 $ 78 M 63 of all needs met
The Denali LRTP Investment Strategy strikes a balance between several different priorities for transportation at the park and lies within the ldquoManagement Actions of No Regretrdquo area of the Denali LRTP scenario chart The strategy proposes to fully fund OampM needs in order to slow the decline of facilities and ensure a better visitor experience It continues planned investments on the paved section of the Park Road to achieve a good condition rating and continues to make funding available to address deferred maintenance on the unpaved sections of the Park Road However the strategy sets lower condition targets for sections of the unpaved Park Road which are further into the park and which are less traveled by visitors in order to reserve funding for other segments of the Park Road and for entrance area transportation facilities (eg aviation parking areas new priorities) This approach is consistent with the Vehicle Management Plan which envisions lower traffic volumes and a more rustic experience the further the road extends from the park entrance area
Ultimately because funding needs exceed available resources the condition of transportation facilities at Denali NPP is expected to decline overall FCI ratings across the Denali NPP transportation system today are modeled at 0148 or the low end of fair condition Continued scarce funding for transportation will reduce conditions to 0185 by 20215 However higher priority transportation facilities are expected to remain in fair condition overall as described by the Investment Strategy
5 FCIratings are modeled on a 0‐1 scalewhere0000isperfect conditionand1000iscompletelydegradedcondition
DenaliLong Range Transportation PlanFinancialTechReportndashFINALDRAFT 12
DenaliLRTPInvestment Strategy 13
37
26
24
OperationsandPreventiveMaintenance(all transportationassets)
RehabilitatePavedPortionoftheDenaliParkRoad
RepairandMaintaintheUnpavedPortion ofthe Denali Park Road
RepairandImproveOtherHigh‐PriorityTransportationAssets
The funding forecast in the Denali LRTP is only the most likely scenario for each program and in reality the amount of annual transportation funding will vary as will visitation Table 9Error Reference source not found below shares some management actions for when funding and visitation levels take Denali NPP out of the area of management actions of no regret Generally when visitation is lower it is a better time for disruptive work such as addressing major needs and accomplishing maintenance projects that were deferred Times of high visitation call for more investment in OampM and investment in new services to meet emerging visitor needs When funding prospects are good then more money is available to make improvements catch up on deferred maintenance and prepare plans for the future When funding is short then many necessary improvements have to be delayed and park staff can only fund core operations and critical repair work
Figure 2 Denali LRTP Investment Strategy
Denali Investment Strategy and LRTP Scenarios All of the funding strategies considered for the Denali NPP LRTP assumed the same funding forecast and would fall within the ldquoManagement Actions of No Regretrdquo area on the scenario planning graphic reproduced in Error Reference source not found below This area represents a balance between times of high and low visitation and high and low funding for the park It is calibrated based on an average of funding and visitation over time Years within one standard deviation of these means lie within it if they are more than one standard deviation away from the average then they are said to be in one of the four ldquoquadrantsrdquo
DenaliLong Range Transportation PlanFinancialTechReportndashFINALDRAFT
Figure 3 Denali LRTP Scenarios
13
Table 9 Potential Management Actions by Scenario
Losing Ground Popular Park
Emphasize more of Funding OampM Introducing new services
Emphasize less of Making improvements Funding deferred maintenance Initiating major capitalrehabilitation projects
Emphasize more of Funding OampM Making improvements Introducing new services Planning for future needs
Emphasize less of Funding deferred maintenance Initiating major capitalrehabilitation project
Turn out the lights Surplus of Money
Emphasize more of Funding deferred maintenance
Emphasize less of Funding OampM Making improvements Introducing new services
Emphasize more of Making improvements Funding deferred maintenance Initiating major capitalrehabilitation projects Planning for future needs
Emphasize less of Funding OampM Introducing new services
14DenaliLong Range Transportation PlanFinancialTechReportndashFINALDRAFT
Appendix A Unpaved Park Road Condition Targets
Unpaved Denali Park Road Condition Targets Plans C D and E for the unpaved Denali Park Road examined options for managing each segment of the road to an individually set condition target Each of these targets is based on the overall Vehicle Management Plan and accounts for past challenges or known issues with individual segments Plan F was ultimately selected for its ability to maintain acceptable condition levels while also freeing up funding for other transportation needs In particular Plan F was selected because the condition targets reflect the overall management approach to the road where the western-most sections are desired to be more rustic and remote-feeling and the eastern-most sections are in better conditions to handle more intensive use Tables 10 and 11 below summarizes the conditions for the unpaved segments of the Denali Park Road under the Denali LRTP investment strategy
Conditions are measured in FCI where a higher value represents worse condition and a lower value represents better condition FCI data for the unpaved Park Road is based on estimates by staff responsible for maintaining the unpaved Park Road after the 2016 opening
Table 10 Conditions of Unpaved Segments of Denali Park Road Reflected in Denali LRTP Investment Strategy
Mileposts Segment Name Current Condition
Target Condition
Change in Condition
MP 15 to 32 Savage to Teklanika Bridge Low‐good High‐fair Small decline MP 32 to 39 Igloo Forest to Sable Pass Mid‐fair High‐fair Small improvement MP 39 to 43 Sable Pass to East Fork Bridge Mid‐fair High‐fair Small improvement MP 43 to 47 Polychrome to Plains of Murie Mid‐poor High‐poor Small improvement MP 47 to 62 Plains of Murie to Stony Overlook Mid‐fair Low‐fair Small decline MP 62 to 66 Stony Overlook to Eielson Low‐fair Low‐fair No change MP 66 to 70 Eielson to Grassy Pass High‐poor Mid‐poor Small decline MP 70 to 88 Grassy Pass to Boundary Pit Mid‐fair Mid‐poor Moderate decline MP 88 to 92 Boundary Pit to Kantishna Very‐poor Low‐poor No change
DenaliLong Range Transportation PlanFinancialTechReportndashFINALDRAFT 15
Table 11 Denali Unpaved Park Road Segments ‐‐Current Conditions and Strategy Conditions Explored During LRTP Development
Plan A Plan B Plan C
Plan A Plan B Plan B Plan C Current Desired Plan A Strategy Annual Strategy Plan C
Mileposts Segment Name Conditions Conditions Annual Needs Conditions Needs Conditions Annual Needs
MP 15 to 32 Savage to Teklanika Bridge 009 0109 $ 013 M 013 $ lt01 M 0109 $ 013 M
MP 32 to 39 Igloo Forest to Sable Pass 013 0109 $ 014 M 012 $ 011 M 0129 $ 093 M
MP 39 to 43 Sable Pass to East Fork Bridge 013 0109 $ 0 24 M 013 $ 020 M 0139 $ 019 M
MP 43 to 47 Polychrome to Plains of Murie 035 0109 $ 120 M 014 $ 110 M 0245 $ 074 M
MP 47 to 62 Plains of Murie to Stony Overlook 013 0109 $ 070 M 013 $ 056 M 0139 $ 052 M
MP 62 to 66 Stony Overlook to Eielson 014 0109 $ 025 M 014 $ 020 M 0139 $ 0 20 M
MP 66 to 70 Eielson to Grassy Pass 017 0109 $ 044 M 014 $ 037 M 0169 $ 030 M
MP 70 to 88 Grassy Pass to Boundary Pit 012 0109 $ 056 M 012 $ 051 M 0169 $ 0 32 M
MP 88 to 92 Boundary Pit to Kantishna 0499 0109 $ 072 M 014 $ 068 M 0324 $ 043 M
Total MP 15 to 92 Total Total $ 435 M Total $ 376 M Total $ 293 M
Plan D Plan E Plan F (Selected)
Plan D Plan E Plan E Plan F Current Strategy Plan D Strategy Annual Strategy Plan F Annual
Mileposts Segment Name Conditions Conditions Annual Needs Conditions Needs Conditions Needs
MP 15 to 32 Savage to Teklanika Bridge 009 0109 $ 013 M 0109 $ 013 M 109 $ 013 M
MP 32 to 39 Igloo Forest to Sable Pass 013 0109 $ 014 M 0109 $ 014 M 109 $ 014 M
MP 39 to 43 Sable Pass to East Fork Bridge 013 0109 $ 024 M 0109 $ 024 M 109 $ 024 M
MP 43 to 47 Polychrome to Plains of Murie 035 0149 $ 11 M 0149 $ 11 M 245 $ 074 M
MP 47 to 62 Plains of Murie to Stony Overlook 013 0149 $ 047 M 0149 $ 047 M 149 $ 047 M
MP 62 to 66 Stony Overlook to Eielson 014 0149 $ 018 M 0149 $ 018 M 149 $ 018 M
MP 66 to 70 Eielson to Grassy Pass 017 0325 $ - 0325 $ - 325 $ -
MP 70 to 88 Grassy Pass to Boundary Pit 012 0325 $ - 0325 $ - 325 $ -
MP 88 to 92 Boundary Pit to Kantishna 0499 0325 $ 043 M 0325 $ 043 M 449 $ 012 M
Total MP 15 to 92 Total Total $ 266 M Total $ 266 M Total $203 M
Plan F Unpaved Road Segments The final change that the LRTP team made while discussing the road strategies with park staff was to lower the condition targets for two of the most difficult segments along the unpaved Park Road This section describes these two segments and how accepting a lower condition in these areas can allow for better conditions on other parts of the Denali NPP transportation system
Mileposts 43 to 47 Polychrome Pass to the Plains of Murie The unpaved Denali Park Road segment of Polychrome Pass to the Plains of Murie has been identified by Denali NPP staff as especially difficult to maintain and repair It is facing significant geotechnical hazards that will worsen as time goes on and climate
DenaliLong Range Transportation PlanFinancialTechReportndashFINALDRAFT 16
change accelerates permafrost thaw Making improvements to this section that would take it from the middle of the poor condition band to the low end of fair condition band as explored in Plan D is projected to cost $107 M per year Making lesser improvements from the middle of the poor condition band to the high end of the poor condition band as called for in Plan C would cost $074 M per year instead saving $033 M per year for other uses Thus the selected strategy (Plan F) will target a condition rating at the high end of the poor band instead of a fair rating as with other segments in the central segment of the unpaved Denali Park Road (Igloo Forest to Eielson Visitor Center) This is not an ideal or desired condition for this segment but reflects the challenges of working in this area given limited funding
Mileposts 88 to 92 Boundary Pit to Kantishna The final segment of the unpaved Denali Park Road is currently at the very low end of poor condition and is bordering on severe condition All of the alternative unpaved road plans propose to improve this section However improving the condition from the low end of poor condition to the middle of poor condition as explored in plans C and D is projected to cost $043 M per year Investing this much in one of the least-utilized segments of the Denali Park Road would limit funds for critical investments elsewhere As a result the Denali Investment Strategy proposes lesser improvements at a cost of $012 M per year
DenaliLong Range Transportation PlanFinancialTechReportndashFINALDRAFT 17
National Park Service US Department of the Interior
Denali National Park and Preserve Long-Range Transportation Plan
Appendix G Project Selection Checklist
DENA LRTPProjectSelectionCriteriaChecklist Project Name
PMIS Funding Source(s)
1 Long Range Transportation Plan ndash the project generally adheres to the following
National Long Range Transportation Planrsquos Goals and Objectives (see Attachment A)
Asset Management Transportation Finance Resource Protection
Visitor Experience Safety
Alaska Regional Long Range Transportation Planrsquos Goals and Objectives (see Attachment B)
System Management Mobility User Experience
Resource Protection Climate Change
Denali NPP Long Rang Transportation Planrsquos ldquoactions of no regretrdquo (see Attachment C)
Goal Area ____________________________ Action of No Regret __________
2 Financial Strategy ndash the project meets the following
Capital Investment Strategy score ______________
optimizer band 1 2 3 4 5
Consistent asset investment based on scenario quadrant position (Attachment D)
Consistent with proportionate investment within road management zones (Attachment D)
Milepost or Road Segment ______________________
Consistent with one or more of the following
Operations and Maintenance (OampM)
Rehabilitated Paved Road
Repair amp Maintain the Unpaved Road
Repair amp Improve Other High‐Priority Transportation Assets (bridges transportationmultimodal trail)
3 Risk Priority
Response to current high priority risks based on documented assessment (Attachment E)
Unstable Slopes
River and Stream Flooding
1
Permafrost Subsidence
Culverts ndash Operations and Maintenance (OampM)
Gravel Production Processing or Purchase
Relevance or proximity to mapped hot spot (see Attachment F)
‐ Attachment F should have all the hot spots for Park Road on a map Is this in DNPP LRTP Or do we
give them a link for online info
4 Operations and Maintenance
Investment Type ndash this project is a
New Investment ‐ offset in the cost of OampM
(presumed increase has been addressed by ____________________________________________________)
Replaced investment ‐ offset in the cost of OampM
(presumed decrease or net zero increase has been addressed by ___________________________________)
Eliminated Investment ndash offset in the cost of OampM
(presumed decrease has been addressed by ____________________________________________________)
2
National Park Service US Department of the Interior
Denali National Park and Preserve Long-Range Transportation Plan
Appendix H Public Comment Summary
Public Comment Summary Denali National Park and Preserve Long-Range Transportation Plan
Public comments are organized into two categories common and specific Common comments are
paraphrased themes that appear in multiple comment submissions Responses to common comments
are summarized in Table 1 Specific comments request a particular change When specific comments
seek changes that are accurate reasonable feasible and logically consistent they were made and
included in the final document Other comments include general statements about the quality of the
document suggestions for future plans or ideas for coordination next steps management strategies
park priorities or projects These comments are valued and are available to inform other park planning
efforts and will be referenced during the leadup to this planrsquos eventual update
Table 1 Common Comment
Paraphrased Comment Comment Response
1 Winter or offseason travel is not sufficiently represented in the plan
During the development of this plan numerous issues and needs surfaced as topics that warrant further study and consideration Public comments were an especially meaningful source for identifying topics in need of additional attention These findings will be used to inform the development of the planrsquos update as well as other plans such as the Winter Recreation Plan
2 There is insufficient data or information regarding specific transportation related conditions (eg trail crowding locations of specific facilities rest stop vehicle counts large vehicle counts winter routes locations etc)
The plan relied on facts data and concepts cited in existing park plans studies and other reports No additional data collection or data analysis was conducted as part of this planrsquos development process As such present day conditions or terminology may differ from those described in the plan Gaps in data and understanding will be reassessed in this planrsquos update
3 The plan does not map specific transportation use access facilities for the entirety of the planrsquos 20-year horizon
As a high-level strategic document the plan is not intended to identify specific short-term or long-term project needs or changes park access locations
1
Paraphrased Comment Comment Response
4 If a specific need is not mentioned in the plan (eg backcountry landing strip location) it means that the specific need will be precluded from future project selection and funding
The plan is a high-level strategy document and is not intended to identify and prioritize specific projects While the plan sets high-level goals that are used to evaluate the merits of future projects it is not a project list Whether or not a specific project idea is listed in this plan has no bearing on its ability to be developed or its funding merits
5 The plan does not describe specific actions that the park will take to address a very specific issue (eg plans to address the safety of backcountry landings strips in light of climate change cycling guidelines commercial use authorization for guided hikes off Park Road new parking lot locations more tours etc)
During the development of this plan numerous issues and needs surfaced as topics that warrant further study and consideration Public comments were an especially meaningful source for identifying topics in need of additional attention These findings will be used to inform the development of the planrsquos update
6 Data facts or terminology used in the plan appear to be out dated
The plan relied on facts data and concepts cited in existing park plans studies and other reports No additional data collection was conducted as part of this planrsquos development process As such present day conditions or terminology may differ from those described in the plan
7 The plan does not sufficiently outline specific actions to maintain and improve the parkrsquos soundscape
During the development of this plan numerous issues and needs surfaced as topics that warrant further study and consideration Public comments were an especially meaningful source for identifying topics in need of additional attention These findings will be used to inform the development of the planrsquos update
8 The plan does not go far enough in offering solutions that address threats to park access created by climate change and natural disasters
During the development of this plan numerous issues and needs surfaced as topics that warrant further study and consideration Public comments were an especially meaningful source for identifying topics in need of additional attention These findings will be used to inform the development of the planrsquos update
9 The plan does not go far enough to protect resources
During the development of this plan numerous issues and needs surfaced as topics that warrant further study and consideration Public comments were an especially meaningful source for identifying topics in need of additional attention These findings will be used to inform the development of the planrsquos update
2
Paraphrased Comment Comment Response
10 The plan does not go far enough to protect access
During the development of this plan numerous issues and needs surfaced as topics that warrant further study and consideration Public comments were an especially meaningful source for identifying topics in need of additional attention These findings will be used to inform the development of the planrsquos update
11 Goal andor objective indicators or performance measures are too limited
The plan relied on readily available data and findings cited in existing park plans studies and other reports No additional indicator data was collected as part of this planrsquos development The need for additional data for informing additional indicators will be considered for the planrsquos update
12 Specific details from the Vehicle Management Plan are not reflected in this plan
The long range transportation plan does not supersede the Vehicle Management Plan in any way Omission of Vehicle Management Plan data indicators and conclusions does not negate their significance in how the park is managed
3
- Appendix A - Literature Review Summary Report (1)
- Appendix B - Denali Long-Range Transportation Planning and Acoustic Resources (2)
- Appendix C - Denali Park Road Risk Assessment Utilizing the Unstable Slope Management Program (1)
- Appendix D - Current and Future Partner Projects (3)
- Appendix E - Park Transportation Investment Needs Analysis (1)
-
- Structure Bookmarks
-
- Denali National Park and PreserveLong-Range Transportation Plan
- Appendix EPark Transportation Investment Needs Analysis
- ABSTRACT
- INTRODUCTION
- PATINA DESIGN
- OVERVIEW
- VEHICLE MANAGEMENT PLAN
- VECTOR ANALYSIS
- DATA COLLECTION
- TRANSPORTATION NETWORK
- ASSET METRICS
- HIGH RISK
- INVESTMENT RANKING
- GOAL AREAS
- METHODOLOGY
- DATA PREP
- LAYER WEIGHTING
- COMPOSITE ANALYSIS STEPS
- SELECTED RESULTS
- OUTPUTS
- ROAD SEGMENT FINDINGS
- Motorized Paved Zone
- Wildlife Viewing Subzone 1
- Wildlife Viewing Subzone 2a
- Wildlife Viewing Subzone 3
- Wildlife Viewing Subzone 2b
- DISCUSSION
- INTERNAL WEIGHTING
- SKEWED DATA
- SPATIAL SPREAD OF DATA
- NEXT STEPS
-
- Appendix F _ Denali Funding Plan
- Appendix G - Project Selection Checklist
- Appendix H - Comment Responses (1)
-
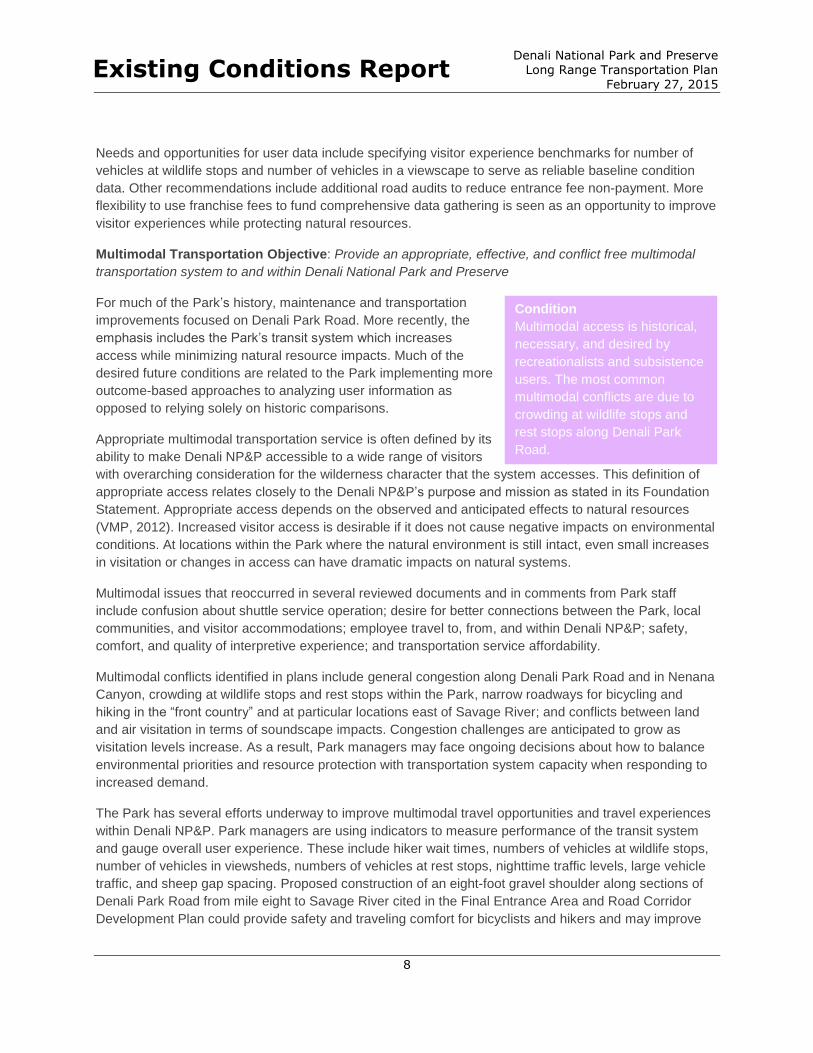
Denali National Park and Preserve Long Range Transportation Plan Existing Conditions Report
February 27 2015
opportunities for wildlife viewing Also modifications to the general management of Denali Park Road
could improve protection of natural habitats beyond Savage River
There is an opportunity to gain efficiency in transit operations by improving consistency in transit seating
and consolidating shuttle services in the entrance area and canyon Also expanding transit service north
to Healy and south to Carlo Creek and Cantwell in addition to increasing shuttle service between the
entrance area and McKinley Village is desired (Needs Assessment and Feasibility Study for a Community
Transportation System 2006)
34 Mobility Goal
Provide safe efficient and appropriate access to and within Denali National Park and Preserve
Safety Objective Provide safe access to and within Denali National Park and Preserve
Between 1990 and 2006 95 percent of all vehicular accidents in Condition NPSrsquos Alaska Region occurred in Denali NPampP with 58 percent of The historic character of Denali these accidents occurring on Denali Park Road (NPS Alaska Park Road creates safety Region LRTP 2012) Of the other accidents reported within Denali issues and due to its popularity NPampP 19 percent were located on the George Parks Highway both as a visitor attraction in the within the Park boundaries The remaining portion of vehicular Alaska Region and within Denali accidents occurred near the visitor parking areas or in NPampP most recorded accidents campgrounds The George Parks Highway is the direct road occur along the road Other connection between Anchorage and Fairbanks and a major travel safety s considerations include corridor for Denali NPampP visitors Between 2007 and 2010 31 total bicycle and pedestrian access in fatalities were reported on the George Parks Highway (NPS Alaska the front country and along Region LRTP 2012) sections of the George Parks
Highway and increased winter As identified in the VMP safety issues are associated with road
access travel along Denali Park Road The historic nature of the road may
in some locations limit sight distance restrict width for passing
vehicles and provide inadequate surface road friction (VMP 2012) Driver behavior is most likely a
contributing factor in vehicular crashes particularly for private vehicles traveling Denali Park Road during
off-peak seasons Impacts of severe weather events for Denali Park Road travelers are another safety
consideration These issues are also a top priority of the Parkrsquos General Management Plan and although very important must be balanced with active preservation of the road as characterized by the philosophy
to retain its telescoping from a full width paved profile at the entrance to the narrower unpaved gravel
profile at the western end
According to the visitor survey highlighted in the VMP the public indicates that they feel safe while using
Denali NPampPrsquos transportation system The most notable safety consideration perceived by the public is
related to travel over Polychrome Pass where Denali Park Road has steep drop-offs and the road is
narrow and winding Park management uses driver training driver spacing and wait times to address
safety issues at this location
9
Denali National Park and Preserve Long Range Transportation Plan Existing Conditions Report
February 27 2015
Safety is also a top priority for flight operations For example recommended flight tour routes are subject
to weather conditions and aircraft may be forced to deviate from planned routes if safety is at risk (Air
Tour Operations Best Practices 2012)
With increased opportunities for vehicular winter access emerging safety improvements related to winter
travel are a growing need Denali NPampP has a goal of minimizing wintertime safety-related incidents and
has an interest in determining baseline conditions so as to monitor future winter safety performance With
the trial winter plowing of the first 15 miles of Denali Park Road the Park continues to monitor visitor
safety during the extended period of winter and early spring driving conditions Commercial operators
also provide multi-modal access to the Park during winter months Denali NPampP staff is working with
commercial operators to implement safety measures for winter operation such as the required use of
emergency communication devices during operation
The collection of safety data and addressing inconsistencies in safety data reporting is identified as an
ongoing need
Access Objective Provide appropriate and efficient access for inspiration education research
recreation and other uses as provided for in ANILCA
Condition As stated in the General Management Plan the primary historic
Within Denali NPampP purpose of access to Denali NPampP is to accommodate viewing of
appropriate and effective access Mount McKinley and the Parkrsquos wildlife As documented
is determined by the assessed appropriateness of access is defined by the balance between
impacts to wildlife and cultural visitor accommodation with active protection of wilderness
resources Where the character The NPS therefore uses the least access restrictive
environmental conditions are management tool possible to maintain and promote the natural
more intact visitor access is resources protected by the area (General Management Plan
more closely managed New 2008)
vehicle management strategies
target this priority The level of appropriate access varies along Denali Park Road
Wildlife Viewing Subzones are used to distinguish appropriate level
of access A notable example includes the Parkrsquos VMP which allows 160 vehicles per 24 hour day
through mile 15 of Denali Park Road period while monitoring for violations of user experience standards
This number was derived through extensive research and rigorous travel modeling of Denali Park Road
and provides an overall increase in capacity for visitors while considering environmental impacts
Visitors typically arrive to the Park by private vehicle bus or train Many visitors arriving by bus or train
are cruise ship passengers and are traveling with fellow passengers as part of cruise packages Park
management desires to provide efficient access to visitors arriving by all modes of travel while also
providing for accessibility as delineated by the Americans with Disabilities Act (ADA) and Architectural
Barriers Acts (ABA) For areas of the Park with additional travel requirements this means ensuring a
transportation system that provides a meaningful high-quality opportunity for viewing scenic landscapes
and wildlife primarily through transit services (VMP 2012) In the future visitation is expected to grow
with a large portion of visitors arriving as part of organized tour companies or organizations
Considerations of access are therefore a topic of long-range concern as Denali NPampP is committed to
balancing access with the responsibilities of managing designated wilderness
10
Denali National Park and Preserve Long Range Transportation Plan Existing Conditions Report
February 27 2015
At the time that the Denali Park Road Visitor Survey (2010) was conducted 71 percent of visitors who
traveled beyond mile 15 were part of organized tours (ie Long Tour) These are highly interpretive trips
with designated stops at rest areas and impromptu stops for wildlife viewing Non-tour transit buses
traveling past mile 15 provide less interpretation and make impromptu stops for hikers and wildlife
viewing
Coordination with the visitor services concessioner is ongoing and the relationship between Denali NPampP
and any concessioner is viewed as integral to providing appropriate and effective access for Park visitors
User Information Objective Provide accurate and accessible information through a variety of means
about how to travel to and within Denali National Park and Preserve
The NPS is interested in providing information to potential and Condition repeat users about its transportation system and services at a Commercial and state tourism national regional and local level The Alaska Federal Lands LRTP initiatives are successful in and NPS Alaska Region LRTP summarize objectives and providing travel information to strategies that specifically address providing accurate and visitors prior to their arrival at accessible information for travel to and within federal lands and the Park Once at Denali NPampP several projects to enhance visitor information services the Park its concessioners and
local businesses provide Much of the marketing and development of traveler information for
interpretation through visitor Denali NPampP is championed by non-NPS organizations such as
centers transit and tour bus the Alaska Railroad concessioners and other area businesses
operations and many others Because Denali NPampP is a regular destination for commercial tour
Interpretation and transit system operations much of the information provided to potential visitors
visitor information improvements and visitors en route to the Park is provided by those organizations
are desired According to the Denali Park Road Visitor Survey issued in 2010
over half of the Denali NPampP transit users had received information from a travel agent about their visit to
the Park Another third of the respondents received information over the internet Denali NPampP maintains
a website with virtual tours guides and resources to help visitors plan trips to the Park Travel guides and
tour books are also popular means of learning about how to travel to and within Denali NPampP (NPS
Alaska Region LRTP 2012)
Traditional means for providing information at visitor centers and Wilderness Access Center are available
upon entering Denali NPampP Once aboard the short-tour and long-tour buses visitors have a wide range
of information available Tour bus drivers and guides provide extensive interpretation while transit drivers
may provide information upon request and at the discretion of a particular driver Several Denali NPampP
plans document the value of retaining experienced drivers This was seen as a major enhancement to the
overall visitor experience (Denali NP Bus Shuttle System Analysis 2013)
The most common need identified in planning documents is the necessity for better wayfinding and user
information about transit in hopes of reducing visitor confusion with the Parkrsquos transportation system
According to the VMP an objective of Denali NPampP management is to ldquoclearly communicate information about the system through a variety of meansrdquo Potential options for sharing information include improving
traditional methods such as maps brochures and signage The Alaska Region is also interested in newer
media options such as implementing intelligent transportation systems linked with websites mobile
devices and other personal communication technology According to a survey in 2010 transit users were
11
Denali National Park and Preserve Long Range Transportation Plan Existing Conditions Report
February 27 2015
not interested in receiving information from a recorded narrative about traveling Denali Park Road
Information delivered by bus drivers was preferred over prerecorded methods
Also with the introduction of enhancements to the off-season access programs Denali NPampP
management is interested in reducing the perception that the Park is closed during off-seasons by
increasing communications about opportunities for visiting the Park during the winter
35 System Management Goal
Develop a long-term transportation system to appropriately satisfy current and future land
management needs
Asset management Objective Apply available financial resources to essential transportation
infrastructure
Relative to other parks in the Alaska Region transportation assets
within Denali NPampP are some of the most costly This is primarily
due to Denali Park Road maintenance needs providing visitor
transit and tour services and experiencing the high visitation levels
during a very short summer season
In general transportation assets within Denali NPampP are
considered to be in good condition Road work is mainly
concentrated on bridge replacement road maintenance and
subgrade improvements In general road widening does not occur
However improving pullouts on the narrowest section of the road
to maintain safety standards des exist in asset planning
documentation The annual operations and maintenance budget for
road assets in Denali NPampP was approximately $12 million in 2010
(NPS Alaska Region LRTP 2012)
Denali NPampP management uses both quantitative and qualitative
measures to prioritize transportation system improvements The
2008 General Management Plan prioritizes road improvement
projects ranking corrective safety projects as the highest priority and other corrective maintenance and
repairs as secondary priorities The General Management Plan provides example projects from Denali
Park Road where potential improvements have been identified for multiple project categories (sight
distance improvements safe vehicle passing enhancements road surface friction improvements culvert
repairs etc) Denali NPampP has incorporated the NPS ldquooptimizer bandrdquo model of asset prioritization In
this model assets are scored by Asset Priority Index (API) to rank how critical assets are used in
accomplishing the Parkrsquos mission and goals In this model Facility Condition Index (FCI) indicates asset
condition and is used to determine eligible fund sources Projects are evaluated based upon their APIFCI
rank Using this method of asset evaluation all of the high priority assets (API of 75 or higher) are in good
or better condition (FCI of 03 or less) (Alaska Federal Lands LRTP 2012) Finally the asset needs are
filtered through the NPS Capital Investment Strategy (CIS) which expresses priorities in the form of
optimizer bands Optimizer bands 1 and 2 are associated with assets that are essential or extremely
important for a park to continue as described in its organic legislation
Condition
The availability of funds
particularly for funding transit
systems has decreased in
recent years Denali NPampP
management is using
quantitative and qualitative
indicators about the
transportation system to
prioritize transportation system
improvements With limitations
to increasing system capacity
Denali NPampP management is
working toward increased
system efficiency and better
coordination with transportation
partners
12
Denali National Park and Preserve Long Range Transportation Plan Existing Conditions Report
February 27 2015
There is a general funding gap projected into the future The most recent congressionally authorized
transportation funding bill Moving Ahead for Progress in the 21st Century (MAP-21) reduces funding for
the NPS transit systems by approximately 28 percent from the previous federal transportation legislature
(Alternative Funding Opportunities for NPS Transit 2014) Regional funding assessments show an
annual funding gap of $720000 for Alaskan ldquoroad parksrdquo the category which Denali NPampP is included
Although park-level funding shortages are not yet documented for Denali NPampP a large portion of the
Alaska Regionrsquos transportation assets are located in Denali NPampP Elimination of the Transportation
Improvement Program (TRIP) has made funding multimodal systems such as the Parkrsquos concessioner-
operated transit more challenging (Alternative Funding Opportunities for NPS Transit 2014)
Because the transit system is operated by a for-profit concessionaire it is not eligible for transportation
funding through MAP-21 however several FHWA funding and grant programs are still applicable and
partnerships with local government cooperation and partnership could increase funding eligibility
Park management is also very interested in finding efficiencies within its current asset portfolio
completing operational modifications that improve the transportation system and promoting the Parkrsquos purpose Recent examples of this include new vehicle management strategies provided in the VMP and
wintertime operation improvements
Asset Investment Planning Objective Consider sustainability of operation and maintenance of new
and existing assets in the planning process
The NPS includes asset investment planning in much of its recent Condition transportation planning documentation At a regional level the NPS Denali NPampP managers are very is using measurements that feed into asset planning processes involved with asset planning for such as total cost facility ownership as well as the project
transportation system prioritization tools mentioned earlier Several strategies identified in maintenance and operations the Alaska Federal Lands LRTP promote asset planning through Relative to other parks in the collaboration with other federal land management agencies and region Denali NPampP has high Alaska Department of Transportation and Public Facilities deferred maintenance needs consideration of lifecycle costs and evaluation of maintenance
resulting largely from challenges costs versus investments in new infrastructure associated with maintaining
Denali Park Road Maintenance In 2010 deferred maintenance in Denali NPampP accounted for 65
and operation are constantly percent approximately $20 million of all deferred maintenance of
weighed against environmental transportation assets in the Alaska Region Deferred maintenance
conservation priorities issues within Denali NPampP could be addressed by treating the
underlying cause of the road failures to reduce the need for
repetitive maintenance according to the General Management Plan
Documents suggest that road repairs and maintenance should follow the 2005 Denali NPampP Road
Maintenance Repair and Operating Standards and the 2007 Denali NPampP Road Design Standards The
total planned transportation assets for Denali NPampP include improvements to access roads parking lots
non-motorized routes and other transportation infrastructure These planned assets are valued at $64
million (NPS Alaska Region LRTP 2012)
13
Denali National Park and Preserve Long Range Transportation Plan Existing Conditions Report
February 27 2015
In terms of operational needs Park managers are actively participating in day to day management of
transit operations and are able to make adjustments based on demand For example real-time
monitoring of the transit system allows the concessionaire to track transit vehicle occupancy and dispatch
additional vehicles during peak demand for return trips Denali NPampP is also actively investigating
opportunities for gaining efficiency in their transit and in their entrance fee collection program
As it is with other goal area topics effective operation and maintenance is balanced with environmental
protection In planning documents the Denali NPampP management is constantly balancing expectations of
visitor experience and safety with deference to natural resource objectives
Coordination Objective Coordinate with local organizations to ensure that nearby transportation
projects are planned with NPS involvement to the mutual benefit of all parties
Coordination with federal state and local agencies is seen as an Condition opportunity for funding and project implementation as well Coordination with federal state managing concessionaire services and expanding local visitor local and private transportation services An ongoing federal land management agency agencies is seen as a need for coordination team was formed as a result of the 2012 Alaska optimizing asset management Federal Lands LRTP The group actively works to coordinate because 21 percent of the transportation project planning across Alaska including in and transportation assets are owned around Denali NPampP These efforts could help organize interest in by non-NPS agencies expanding transit services outside of the Park which is a frequently
cited coordination need as determined by the literature review and
comments from Park staff during LRTP discussions
Needs and opportunities for coordinating with private entities are somewhat unique to Denali NPampP
Denali NPampP is the only park in the Alaska Region to have transportation assets that are not owned by
the NPS Twenty-one percent of the transportation assets in the Park are owned and operated by
concessionaires or owned by others There is a desire to expand partnerships to include other local
businesses and eventually local government agencies The 2006 Needs Assessment and Feasibility
Study for a Community Transportation System provides alternatives for organizing such efforts
Other coordination efforts include involving air tourism operators regular communication with tribal
organizations and land inholders and coordinating access with other area landholders and transportation
agencies such as the Alaska Department of Transportation and Public Facilities
14
Denali National Park and Preserve Long Range Transportation Plan Existing Conditions Report
February 27 2015
4 Conclusions
Common themes encountered throughout the literature review process provide several general baseline
conditions for Denali NPampP These include
Resourc
e P
rote
ctio
n
Clim
ate
Change
User
Experie
nce
Mo
bili
ty
Syste
m M
anagem
ent
The historic character of Denali Park Road and the management thereof are important
factors influencing access and mobility
Denali NPampP is a primary attraction for tourists Many visits are rushed due to the
logistics of popular packaged Alaska tours Visitation is anticipated to increase as tour
companies continue to promote and expand travel options to the Park
With anticipated visitation increases and associated use of the transportation system
Denali NPampP managers may face ongoing decisions about how to best protect the Parkrsquos natural resources as congestion grows and the capacity of Denali Park Road and
transportation system is tested
Travel options are sometimes viewed as limited within the Park but some multimodal
enhancements could increase safety particularly for bicycling and hiking opportunities
The general condition of the transportation system is good but priorities are complex
both in terms of balancing maintenance needs with the care for natural resources and
providing access to view designated wilderness areas
Recent changes to Denali Park Road vehicle management and operations system are
intended to advance the NPSrsquos emerging outcome-driven planning processes As more
data becomes available Denali NPampP managers can better set performance indicators
for operations
Existing transportation plans do not contain much information about climate change but if
the actions recommended and cited in the NPS Alaska Region LRTP are followed there
may be more opportunities to include unit-level strategies for addressing climate change
into asset planning and operation With ongoing progression toward a CFP certification
Denali NPampP is well positioned to incorporate these objectives at a unit-level
15
National Park Service US Department of the Interior
Denali National Park and Preserve Long-Range Transportation Plan
Appendix B Denali Long-Range Transportation Planning and Acoustic Resources
1
Denali Long Range Transportation Planning and Acoustic Resources
Davyd_Betchkalnpsgov NPS Alaska Region Soundscape Specialist Biologist 907‐683‐5754
Research Sets the Stage
Author Eli Seigel wrote in 1970 ldquoall the opposites are two freedoms which question each other and complete each
otherrdquo Transportation and solitude likely represent such a pair of mutually‐exclusive freedoms In Denali and other
Alaskan parks we can immediately recognize a tradeoff between the ability to be easily and quickly transported to
a location and the ability to participate in the tranquility of wilderness beyond the reach of modern technology and
crowds
This recognition is a fundamental drive behind the work of the NPS Natural Sounds and Night Skies Division whose
vision statement is to ensure that ldquoNational parks are enduring sanctuaries for natural sounds and dark
environments where current and future generations have the opportunity to experience undisturbed soundscapes
and an unimpeded view of the cosmos and where the ecological roles and cultural values of acoustics and photics
are understood and appreciatedldquo (NPS 2014)
For the purposes of acoustic planning and research the NPS has developed an autonomous system that can
provide both American National Standards Institute (ANSI) certified acoustic levels (ie numeric measurements of
sound pressure level in decibel units) and audio recordings (ie sound that one can listen back to in headphones)
ANSI also recommends the collection of meteorological data concurrent with measurements of sound pressure
level Thus a simple weather station incorporating wind speed wind direction temperature and relative humidity
is also part of the acoustic monitoring station The photo below shows an external photograph of a typical station
2
Figure 1 NPS Standard Acoustic Monitoring Station ndash equipment is composed of a microphone meteorological instruments
sound level meter digital audio recorder battery bank and solar paneling
Scientific work to understand Denalirsquos acoustic environment began in 1999 in response to a large increase in
aviation and snowmobile noise in the mid‐1990s (Morgan 2001) Early data were incorporated into the
Backcountry Management Plan (BCMP) EIS a supplement to Denalirsquos General Management Plan (NPS 2006e)
After the BCMP was published the park embarked on a decade‐long inventory of the acoustic environment The
project was completed in 2015 and as of 2016 the park has moved into a monitoring phase A basic timeline of
acoustic resource management in Denali is shown below
Figure 2 Timeline of acoustic resource management in Denali 1999 ndash 2016
Denalirsquos acoustic inventory project is unique among park service units in that it was designed as a spatially random
sample on a 20 by 20 kilometer grid This allows inference beyond the local detection radius of each microphone
For example consider the following map that depicts the acoustic metric lsquodaily average noise free intervalrsquo ndash a
measure of how long a typical quiet period is before it is broken by motorized noise Noise free intervals in Denali
are largely determined by the frequency of air traffic Aircraft are very acoustically powerful sources that are
audible at distances similar to the scale of the sampling grid thus mapped measurements of noise free interval
immediately form a discernable pattern to the human eye
3
Figure 3 Daily average noise free intervals measured in hours Data were collected as part of Denalirsquos Soundscape Inventory
project 2006 ndash 2015 Noise free interval is a measure of how long a typical quiet period is before it is broken by motorized
noise
Entering the realm of inference the following map uses observations at specific soundscape inventory points to estimate the noise free interval at a park‐wide scale It uses a spatial smoothing technique called inverse distance weighting to construct new data points between the known values ‐ a method known as interpolation Again
because the scale of the phenomena (aircraft traffic) and the scale of the sample (20 km2 resolution) are comparable noise free interval is a metric well‐suited to interpolation techniques (Peterson 1998 Gergel 2006) Continuous change in the metric is physically sensible and approximate the visual effect of looking at the original point data Denalirsquos soundscape inventory was important for understanding which acoustic metrics are best suited to monitoring change at a landscape scale
4
Figure 4 Average noise free interval values estimated by spatial interpolation Units are in hours This map uses observations
at soundscape inventory points to estimate the average noise free interval at a park‐wide scale It uses a smoothing technique
called inverse distance weighting to construct new data points between the known values ndash a method known as interpolation
The Denali soundscape inventory supplies spatially‐rich information about the current state of the acoustic
environment It also clarifies the choices available to quiet the park as per NPS policy Inventory data have been
(1) Inventory data have been used to review the indicators and standards of the BCMP
They explain how indicators change in response to the acoustic ambience
They explain the relationship between indicators (for example NFI and event rate are inversely related
thus one can be estimated from the other)
They provide an understanding as to which indicators are best suited to the scale of the park
(2) Inventory data have been used as input to the voluntary aviation best practice development process
of the Denali Overflights Advisory Council (2007 ndash 2012)
They provided the basis from which to monitor the effects of aviation best practices
They provided updates to the council directing attention to areas most in need of mitigation
They transcend anecdote as the sole basis for making decisions
(3) Inventory data have been used in predictive acoustic modelling
5
They provide a means to validate noise models of aircraft takeoffs or overflights road noise or other
sources
Data such as event rates or hourly distributions can also be used as inputs to models
Aviation Transportation and NPS Policy
There are currently several types of aviation transport in the park Section 1110(a) of the Alaska National Interest
Lands Conservation Act (ANILCA) provides for aviation access for traditional activities and for travel to and from
homesites which will not be discussed in this document Nor will high‐altitude commercial aviation ndash which does impact the park but would involve participation of the Federal Aviation Administration in the revision of Victor
Airways or Jet Routes within the National Airspace System a process well beyond the scope of this plan
Instead this document seeks to build on discussions of the Denali Overflights Advisory Council
(httpswwwnpsgovarticlesdenali‐aircraft‐overflightshtm)a federal advisory committee chartered by the
Secretary of the Interior from 2007 ndash 2012 The group developed a suite of voluntary aviation best practices that
were adopted by both commercial and government aviators It is fitting that these best practices were broadly
adopted because NPS policy does not distinguish the obligations of governmental and Concessionaire operations
with respect to resource protection NPS Management Policies 2006 sect 10249 states
Concessioners are required to comply with applicable provisions of all laws regulations and policies that
apply to natural and cultural resource protection
It is relevant then to provide a brief policy review NPS Management Policies 2006 sect 823 addresses impacts to
natural sounds directly stating
The Service will strive to preserve or restore the natural quiet and natural sounds associated with the
physical and biological resources of parks To do this superintendents will carefully evaluate and manage
how when and where motorized equipment is used by all who operate equipment in the parks including
park staff Uses and impacts associated with the use of motorized equipment will be addressed in park
planning processes Where such use is necessary and appropriate the least impacting equipment vehicles
and transportation systems should be used consistent with public and employee safety The natural
ambient sound levelmdashthat is the environment of sound that exists in the absence of human‐caused
noisemdashis the baseline condition and the standard against which current conditions in a soundscape will be
measured and evaluated
Further guidance related to aircraft is articulated in sect 6343
Managers contemplating the use of aircraft or other motorized equipment or mechanical transportation within wilderness must consider impacts to the character esthetics and traditions of wilderness before considering the costs and efficiency of the equipment
In evaluating environmental impacts the National Park Service will take into account (1) wilderness characteristics and values including the primeval character and influence of the wilderness (2) the preservation of natural conditions (including the lack of man‐made noise) and (3) assurances that there will be outstanding opportunities for solitude that the public will be provided with a primitive and unconfined type of recreational experience and that wilderness will be preserved and used in an unimpaired condition
6
Furthermore sect 637 offers and important reminder that in wilderness areas
The principle of nondegradation will be applied to wilderness management and each wilderness arearsquos condition will be measured and assessed against its own unimpaired standard Natural processes will be allowed insofar as possible to shape and control wilderness ecosystems Management should seek to sustain the natural distribution numbers population composition and interaction of indigenous species Management intervention should only be undertaken to the extent necessary to correct past mistakes the impacts of human use and influences originating outside of wilderness boundaries
Envisioning a (Flight) Route Forward
Denalirsquos Backcountry Management Plan (BCMP) remains the overarching unit‐level policy document on the
management of the natural acoustic environment Data collection during the implementation of the BCMP has
provided a robust baseline description of the resource Transportation planning directly benefits from a synthesis
of these inventory data
One way to approach the protection of acoustic resources is through a cost‐distance analysis Cost‐distance
analysis balances the costs associated with travelling a certain distance (in this case the cost of aviation fuel) with
resistances to travel Resistances to travel can take many forms ndash the increased difficulty in crossing a major river
or mountain range or the difficulty of moving over muskeg as opposed to alpine tundra In this case we describe
resistances to noise ndash areas sensitive to the acoustic disturbance created by mechanical transport
What is meant by resistance Synonymous with lsquonoise sensitivityrsquo for the purposes of this discussion the word
resistance more accurately conveys the interlocked relationship between isolation and transportation The
following two definitions are applicable to the Long Range Transportation Plan
Resistance (noun)
1 Resistance is the degree to which a substance prevents flow through it
2 Resistance is the ability to prevent something from having an effect
In this case the ldquoability to prevent something from having an effectrdquo describes the human ability to make choices
about how to conserve the acoustic environment In other words we conceptualize a resistance when we answer
the question ldquoHow do we mitigate the effects of motorized transport on the acoustic environmentrdquo We will later
see how the resistive analogy between traffic flows and electrical flows can be used to the benefit of managing
acoustic resources
Resistances to noise typically fall into three basic categories
1) Those defined by NPS policy or aviation best practices
2) Those related to the acoustic or ecological properties of the landscape
3) Those related to avoiding interactions between motorized and non‐motorized experiences
7
Resistances to noise can be assigned based on a number of different rationales For instance consider the
following raster dataset that depicts the amount of use by backcountry unit One long‐standing approach to
describing which areas should be protected from noise is to separate backcountry user groups from aviation user
groups in space Lighter areas on the map indicate more backcountry use ndash and thus suggest that aircraft avoid
units along the Denali park road corridor
Figure 4 Backcountry Unit Use resistance layer Lighter values indicate a greater resistance to transportation noise This
suggests that aviation routes should avoid core units around the road corridor
Contrast this with data which show the average noise free interval across the park The layer is normalized to the
same brightness as the backcountry use layer with lighter areas representing a greater resistance to noise and
thus higher resource costs for transportation over the area
The rationale behind the noise free interval map produces different optimal routes than the backcountry user
map This is because resistance is based on the fact that areas with long noise free intervals are sensitive to minor
changes in air traffic and thus traffic should be routed over areas that are already highly fractured In this case
8
areas that already have air traffic would continue to bear the brunt of resource damage allowing the most pristine
acoustic environments of the park to remain intact
Figure 5 Noise Free Interval resistance layer lighter values indicate greater resistance to transportation noise This would
suggest that aircraft routing remain largely the same especially in the areas between the Kahiltna and Ruth glaciers
Backcountry use statistics and noise free intervals are just two of many different ways of assigning resistances to
aviation transport Which strategy is best That depends entirely on the basis of each claim After reviewing both
layers it should be apparent that a wide range of conflicting rationales can be applied to mitigating impacts from
Denalirsquos aviation transportation network Deciding which should be prioritized is a complex decision
Unless the overall aviation traffic volume over the park is reduced displacement in free space is the primary
mitigation technique available to park stewards The most substantial mitigations enacted for the park thus far ndash
the Denali Overflights Advisory Council aviation best practices ndash required the council to weigh certain routing
displacements over others (DOAC 2012)
9
Once a weighting network of resistance layers has been distilled from public and expert opinion it is possible to
use them to envision idealized flight corridors One useful tool for this purpose is the cost‐distance modelling
software Circuitscape (wwwcircuitscapeorg) which uses electrical theory to describe the travel of electrons over
a semiconductor This is analogous to a pilot with knowledge of areas resistant to noise who utilizes this
knowledge while conducting their flight operations Results of a Circuitscape analysis include all the possible routes
a pilot might fly but highlight stewardship‐friendly corridors It allows us to see the conclusions that follow from
our rationale
The following is an example weighting network that can be used as an input for Circuitscape The weights are
chosen in this case to produce a result that is realistic while avoiding the influence of hard discrete edges It
balances nine data sets with widely varying rationales to produce a final summation that can be used to visualize
flight corridors
Figure 6 Example of a weighted network resistance layer Summed data layers include natural ambient acoustic
level travel time backcountry unit use Denali Overflights Advisory Committee aviation best practices and sound
10
sensitive areas BCMP standards noise free interval campgrounds and road corridors The hard edges of polygon
features are especially prominent in the final sum
Dataset Name Description of Dataset Rationale Statement for Noise Resistance Weight
Natural Sound Pressure Level (Median L50)
Typical ambience of the natural acoustic environment (Modelled)
Listening area is reduced in more energetic acoustic environments reducing the impact of human
activities Less natural energy = higher resistance 50
Travel Time Estimated travel time on foot from
portal areas (Modelled)
Backcountry users travelling in more remote areas of the park have a greater motivation to find
solitude Greater travel time = higher resistance 25
Backcountry User Days Utilization of backcountry units of
the park (Empirical)
Areas with a greater amount of backcountry users should be preferrentially avoided More users =
higher resistance 15
Denali Overflights Advisory Council Aviation Best Practices
Best‐practices for mitigating acoustic impacts from aviation (Federal Advisory Committee)
Best‐practices identified by the Denali Overflights Advisory Council should be fully implemented Areas
affected by best‐practices = high resistance 10
Backcountry Management Plan Soundscape Standards
Soundscape standards by spatial region of the park (GMP)
Adherence to NPS policy should be prioritzed Lower impact management zone = Higher resistance
5
Noise Free Interval
Average amount of time before experiencing the next noise disturbance (Empirical
interpolated)
Areas with longer noise‐free intervals are more sensitive to fracturing due to increases in air traffic
Greater noise‐free interval = higher resistance 5
Campground Locations Buffered campground areas
(Empirical)
Campgrounds are places where many people spend time resting and should be preferrentially avoided
Closer to campground = higher resistance 5
Roads Buffered road network (Empirical) Roads are already impacted by noise so aviation
noise will have a lesser impact in proximity to roads Beyond road noise footprint = high resistance
3
Denali Overflights Advisory Council sound sensitive areas
Areas identified by the Denali Overflights Advisory Council as
noise sensitive banded into three categories low medium high (Federal Advisory Committee)
Sound sensitive areas should be preferrentially avoided Higher sensitivity band = higher resistance
2
Table 1 Description of noise resistance rasters that were used to show how varying rationales can be balanced to produce an overall weighted noise resistance layer
Once the weighted resistance layer has been created Circuitscape is used to recognize ideal flight corridors Airports with commercial use represent sources of electrical potential and include Talkeetna Healy McKinley Public ERA helipad McKinley Private Cantwell and Kantishna The sink (ground) of electrical potential is the Denali massif For the example weighting network in this document the following map was produced
11
Figure 7 Cost‐distance analysis results This graphic shows current flow from electrical sources (airports) to an electrical sink (the Denali massif) This is analogous to air traffic density
What does the model show It represents air traffic density as an analogy to electrical current ndash the greater the current the greater the air traffic density As a model it is an imperfect representation of reality but this example representation does identify flight corridors that follow from the input rationale (These corridors include the Denali park road corridor the Denali Fault a route along the outer range and one that connects Broad Pass to the Eldridge Glacier) Obviously the map in Figure 7 fails to capture public opinion and for that reason it is incomplete but the technique stands as a meaningful strategy to approach these complex decisions
12
Conclusion
Data from the Denali Soundscape Inventory describe the parkrsquos acoustic environment at a landscape scale These data can be used
for many purposes but their most critical is to provide a baseline from which to monitor the effects of future noise mitigation
efforts
In the preceding section we described a cost‐distance analysis technique that could be utilized to identify the most beneficial long‐
term mitigations for the acoustic environment Such corridors represent opportunities for park management and the aviation
community to work together as stewards What has not been identified in this document is the ldquovalue analysisrdquo process by which
public and expert opinion can be synthesized into an appropriate weighted resistance layer for cost‐distance analysis The overall
strategy may follow a form similar to this
An informal version of this same process was used to by the twelve members of the Denali Overflights Advisory Council to develop
an initial suite of aviation best practices from 2007 ndash 2012 Some of these best practices have produced substantial positive changes
for the park but others have failed to be acoustically effective due to their extent or timing The strategy described in this
document could be used to open the doors of conversation and improve the effectiveness of the mitigations to protect Denalirsquos
acoustic environment
References
Alaska National Interest Lands Conservation Act PL 96‐487 sect 1110(a)
Denali Aircraft Overflights Advisory Committee 2012 Denali air tour operatorsrsquo best practices to minimize sound impacts Available
at httpswwwnpsgovdenagetinvolvedaoachtmCP_JUMP_5151844 September 2013
Gergel S E and M G Turner 2006 Learning landscape ecology a practical guide to concepts and techniques Springer Science amp
Business Media New York
McRae BH VB Shah and TK Mohapatra 2013 Circuitscape 4 User Guide The Nature
Conservancy httpwwwcircuitscapeorg
Morgan D and J Van Horn 2001 Aircraft Overflight Activity in the Denali Wilderness An Analysis of Backcountry Rangers
13
Observations for 1999 and 2000 National Park Service Denali Park Alaska
National Park Service (NPS) 2000 Directorrsquos Order 47 Soundscape Preservation and Noise Management US Department of the
Interior National Park Service Washington DC
National Park Service (NPS) 2006a Management policy 6343 Environmental Compliance in Management policies 2006 US Department of the Interior National Park Service Washington DC
National Park Service (NPS) 2006b Management policy 637 Natural Resources Management in Management policies 2006 US Department of the Interior National Park Service Washington DC
National Park Service (NPS) 2006c Management policy 823 Use of motorized equipment in Management policies 2006 US Department of the Interior National Park Service Washington DC
National Park Service (NPS) 2006d Management policy 10249 Natural and Cultural Resource Management Requirements in Management policies 2006 US Department of the Interior National Park Service Washington DC
National Park Service (NPS) 2006e Denali National Park and Preserve final backcountry management plan environmental impact statement National Park Service Denali Park Alaska
National Park Service (NPS) 2014 Natural Sounds amp Night Skies Division Strategic Plan (2014 ndash 2019) US Department of the Interior National Park Service Natural Resources Stewardship and Science Ft Collins CO
Peterson D L and V T Parker 1998 Ecological scale theory and applications Columbia University Press New York
Siegel E 1970 There Are Two Freedoms Aesthetic Realism Lectures by Eli Siegel Web 1 July 2016
14
National Park Service US Department of the Interior
Denali National Park and Preserve Long-Range Transportation Plan
Appendix C Denali Park Road Risk Assessment Utilizing the Unstable Slope Management Program
1
Denali National Park and Preserve ndash Long Range Transportation Plan
Deterministic Geologic Risk Assessment of the Denali Park Road Utilizing the Unstable Slope Management Program
Authors Russell Rosenberg MSc ndash Physical Science Technician (Geologic Hazards) Denny Capps PhD ndash Park Geologist Heather Rogers MSc ndash Physical Science Technician (Geologic Hazards)
Prepared 080316
Revisions none to date
Introduction and Project Status
The 92‐mile Denali Park Road traverses a highly active geologic landscape and has experienced
numerous documented mass wasting events throughout the history of the road One of the most
dramatic occurred in late October 2013 when a 600‐ft‐long 110‐ft‐wide debris slide blocked the road
near MP 38 Blocks of permafrost‐frozen unconsolidated debris up to 15 ft thick slid on weak unfrozen
clay Frequent but less dramatic events block traffic undermine road surfaces and may cause damage
to vehicles or injuries Many events including the example above are likely triggered or exacerbated by
thawing permafrost and are consistent with the possible effects of anthropogenic climate change With
increases in road use the uncertain effects of climate change and possible changes to maintenance
funding levels National Park Service (NPS) and Federal Highway Administration (FHWA) staff identified
the need for a comprehensive risk analysis of geologic hazards along the Denali Park Road
The risk analysis is scheduled for completion by March 2017 and includes five parts (1) inventory maps
and linked database that illustrate spatialtemporal distribution of geohazards their relative activity
and geomorphic attributes (2) beta testing and implementation of the Unstable Slope Management
Program (USMP) rating criteria (3) geohazard susceptibility models that estimate the spatial probability
of occurrence (4) geohazard risk models that illustrate the potential consequences and (5)
analysesrecommendations to park management regarding other risks the road will exhibit over the
next decade (DENA‐MOA‐208813AB) Currently tasks 1 and 2 are predominately complete tasks 3 and
4 are underway and task 5 will follow the completion of tasks 1‐4 Although final results and
recommendations are still forthcoming the results of tasks 1 and 2 in particular the USMP ranking
scores (discussed below) provide an inventory and a first‐order deterministic risk assessment of
geologic hazards currently affecting the park road
2
The results of the USMP rating criteria provide valuable information on the spatial distribution of
geologic hazards their severity and the associated risk however they do not directly assess the
possible impacts of climate change or provide a detailed outlook of possible future scenarios We utilize
these data to provide a preliminary identification of the areas with the highest relative risk and their
spatial patterns Consideration of this information should be valuable to this Long Range Transportation
Plan (LRTP) and for park managers and planners as future infrastructure plans are being developed
Unstable Slope Management Program Site Rankings
The USMP is a collaboration between the FHWA many other federal agencies including the NPS private
geotechnical consultants and the Alaska Department of Transportation amp Public Facilities (AKDOT) that
ranks geologically unstable slopes for the purpose of facilitating more effective long‐term geotechnical
asset management USMP scores provide a deterministic ranking of agency risk associated with any
particular geologic hazard site These scores consider elements of both the severity and
frequencyprobability of a hazard and the exposure and vulnerability at each particular site Example
elements include the amount of roadway affected by landslide events the frequency of known hazard
events the impact of events on the use of the transportation corridor the maintenance cost and
complexity and annual average daily traffic For detailed information the USMP ranking criteria please
see (httpnlcsmontanaeduusmpRatingManualpdf)
We have currently completed a total of 141 USMP site rankings along the entire 92 miles of the DENA
Park Road (Figure 1) These data represent the vast majority of known geologic hazard sites and include
landslides debris flow drainages rockfall areas frost‐heaves and erosional undercutting due to fluvial
processes It should be noted however that these site rankings are not totally comprehensive instead
they represent our most complete knowledge as of 06292016 The DENA USMP rankings range from
164 to 948 with a mean value of 328 and more variance within higher ranking sites To put these values
in perspective immediately however the USMP qualitatively defines sites that score less than 200 to be
in ldquogoodrdquo condition sites that score between 200 and 399 to be in ldquofairrdquo condition and sites that score
400 or higher to be in ldquopoorrdquo condition
In theory sites in poor condition are more likely to pose persistent andor more serious problems along
the road and areas of higher risk density are more likely to see a higher concentration of problems In
DENA the current majority of our sites 67 rank in fair condition while only 9 are in good condition
and a relatively large number of sites 24 are in poor condition The only significant outlier was the
ldquoPretty Rocksrdquo slump (Figure 3b) with a score of 948 365 points higher than the next highest site
Spatially regions of higher USMP risk density (Figure 2) are most pronounced along Polychrome Pass
and the Eielson Bluffs areas Individual USMP scores represent the relative risk associated with a hazard
site and risk density represents the relative concentration of agency risk
3
Figure 1 DENA USMP site rankings on IKONOS imagery Icon sized is scaled by individual site rank and colored according to good fair or poor qualitative rank
Figure 2 DENA USMP score density on IKONOS imagery Density scaled by linear concentration and site ranking scores
Of the sites ranked in poor in condition along the Park Road many received prior mitigation or were
previously identified as areas of concern by maintenance or resource management personnel Some
previously noted severe geologic hazard sites in lsquoagreementrsquo with poor USMP scores include the ldquoPretty
Rocksrdquo slump (Figure 3a) debris flow activity at ldquoBugstufferrdquo creek (Figure 3b) the ldquoBear CaveMile 45rdquo
slump (Figure 3c) and the ldquoIgloo Debris Sliderdquo (Figure 3d) Additionally Polychrome Pass is a known area
of high geologic hazard occurrences This general agreement of USMP scores and professional
4
judgementinstitutional knowledge within DENA should be reassuring to park managers and help
demonstrate that the USMP ranking scores represent useful information and are based off of many
years of development from similar programs and expertise developed by FHWA AKDOT Oregon Dept
of Transportation and private firms The USMP provides an institutional framework for tracking these
known problem areas and has identified other new examples
A B
C D
A B
Figure 3 Previously recognized sites that rank in poor condition A ndash Pretty Rocks Slump (mile 454 948 points) B ndash Bugstuffer debris flow (mile 519 575 points) C ndash Bear Cave Slump (mile 45 411 points) D ndash Igloo Debris Slide (mile 377 514 points)
Current Applications to the LRTP
The USMP rankings provide a preliminary framework for understanding the relative severity of risk
associated with geologic hazards along the Park Road Although we do not currently make
recommendations tailored to specific sites or address possible future scenarios we suggest that an
awareness of the current results of the USMP rankings is beneficial to this LRTP Likely applications of
the USMP data to the LRTP would involve spatial analysis of USMP rankings as they relate to possible
disruptions in traffic programming of potential mitigation projects and overlap with future
infrastructure planning In order to facilitate this analysis we submitted a spatial database of our USMP
rankings to PaTINA (they are also available on request) We emphasize that these results are
preliminary yet they provide a method for understanding and considering geologic hazards in a broader
context Park planners and managers should continue to work with resource staff in understanding the
5
implications of these results however the following are potential applications to consider for the
current LRTP
All geologic hazards sites but in particular those in poor condition are more likely to pose
persistent andor serious problems along the Park Road These are areas where the
transportation corridor could experience interruptions or incur high maintenance costs as a
result of geologic activity Sites in poor condition should be considered for mitigation and
investigated in more scientific detail (see Future Work)
The USMP rankings may help identify geotechnical assets where hazards do not appear
extremely severe but may be candidates for mitigation from a risk‐based or cost‐based
perspective Rockfall sites that are not capable of producing catastrophic roadway failure but
require very frequent maintenance are good examples of this These sites also rank in poor
condition but may not otherwise receive attention from management
Density analysis of USMP site distribution identifies areas of non‐discrete geologic hazard areas
that may require alternate or more systematic mitigation efforts to increase cost effectiveness
The extreme concentration of hazard sites along Polychrome Pass is an example of such an area
Future Applications to the LRTP
Both the LRTP and USMP have been designed to evolve as new information become available through
time thus allowing for future applications with as new data become available Most transportation
agencies apply transportation asset management (TAM) systems to transportation assets such as
bridges and road surfaces however geotechnical assets such as rock slopes and embankments are
unlikely to be considered with the same detail (Stanley 2010) The USMP provides a system for
geotechnical asset management by creating a framework to establish potential performance measures
and targets for individual geologic hazards and the overall transportation corridor (Federal Highway
Administration‐DRAFT report 2015) We plan to update USMP rankings for the DENA park road as more
information is made available or new events occur and to perform a systematic re‐evaluation once
every five years By tracking USMP rankings over time the following performance measures could be
considered by transportation planners and park managers
Establish targets to reduce the overall number of fair or poor ranking sites along the park road
This could represent a total percentage reduction a maximum target number of poorfair sites
or a certain number of poorfair sites per unit distance along the road
Establish targets to reduce the risk at sites of particular concern (see Future Work)
A benefitcost analysis for all geotechnical assets along the transportation corridor could be
undertaken The USMP group is currently working on developing this tool and the effectiveness
of programmed mitigation projects could be measured by tracking costs vs performance
changes in geotechnical assets recorded by the USMP rankings
6
A method for tracking the performance of assets through time to establish a preferred course of
action As an example USMP scores at the site of the October 2013 slide that blocked the road
(Figure 3d) have been on a downward trend since May 2015 because of relative inactivity while
scores at the Pretty Rocks slump (Figure 3a) have remained higher or increased slightly because
of recent activity Establishing trends in USMP scores through time could be useful for
determining appropriate mitigation priority
Future Work
The USMP risk matrix provides a relatively robust assessment of geotechnical assets based on their
current condition and a way to track their performance through time However because of its
deterministic nature it does not directly consider possible or likely future conditions We hope to
address this limitation through the continued development of the geologic risk assessment Completion
of task 3‐5 of the risk assessment will allow us provide data which will help determine the probability of
future events based on geologic conditions and the associated risk based on transportation
infrastructure and human exposure The results of tasks 3‐5 will allow us to assess the potential outlook
of areas of the road based on their probability to experience new events Additionally we will expand
on the results of the USMP to examine high ranking sites in more scientific depth Examples of this may
include drilling bore holes at the Pretty Rocks slump to determine sub‐surface conditions examining
the relative abundance of fine‐grained sediment in debris flow watersheds or repeat GPS surveys to
ascertain motion rates such as are currently ongoing at the Bear CaveMile 45 slump By using all of
these data sets in conjunction we plan to propose specific recommendations and mitigation
considerations for sites of concern based on their current conditions and future outlook
References Cited
Federal Highway Administration 2015 DRAFT‐Unstable Slope Performance Measures for FLMAs using
USMP Ratings
Federal Highway Administration and National Park Service 2015 Comprehensive Memorandum of
Agreement DENA 208813 AB Denali National Park and Preserve ndash Conduct A Hazard Assessment Of
The Denali Park Road Corridor
Landslide Technology and Federal Highway Administration 2014 Geotechnical Asset Management ndash
Unstable Slope Rating Category Descriptions For Federal Land Management Agencies
Stanley D A 2010 Asset Management In A World Of Dirt ndash Emergence of an Underdeveloped Sector of
Transportation Asset Management TR News no 277 p 18‐22
7
Denali National Park and PreserveLong-Range Transportation Plan
Appendix D Current and Future Partner Projects
National Park ServiceUS Department of the Interior
1
1
Memo
To Denali National Park Long Range Transportation Plan Team
From ATKINS Email
Phone 720-841-2956 Date Sep 19 2014 Modified August 28 2017
Ref cc
Subject Possible Foreseeable ProjectsPlans near Denali National Park
Matanuska Susitna Borough LRTP
Source httpwwwmatsugovusplanslrtp
This transportation plan assesses growth in the Mat-Su Borough over the next 20 years and
identifies the key elements of the Boroughrsquos future transportation system that will be needed to
serve its growing communities The transportation plan will help the residents develop a Borough
that is a pleasure to live in with public infrastructure that supports their daily lives
Alaska Stand Alone Pipeline (ASAP)
Source httpwwwasapeiscom
The Alaska Stand Alone Pipeline (ASAP) Project is a 727-mile long 36-inch-diameter natural gas
transmission mainline extending from the GCF near Prudhoe Bay south to a connection with the
existing ENSTAR pipeline system in the Matanuska-Susitna Borough A 29-mile-long 12-inch-
diameter lateral pipeline will connect the mainline to Fairbanks The proposed pipeline will be
buried except at possible fault crossings elevated bridge stream crossings pigging facilities and
block valve locations
The pipeline will bypass Denali National Park and Preserve to the east and will then generally
parallel the Parks Highway corridor to Willow continuing south to its connection into ENSTARs
distribution system at MP 39 of the Beluga Pipeline southwest of Big Lake
The Alaska District US Army Corps of Engineers (Corps) has been designated the lead federal
agency and the US Bureau of Land Management (BLM) National Park Service (NPS) US
Environmental Protection Agency (EPA) US Fish and Wildlife Service (USFWS) US
Department of Transportation Pipeline and Hazardous Materials Safety Administration (PHMSA)
and the Alaska Department of Natural Resources State Pipeline Coordinators Office (SPCO) are
participating as cooperating agencies in the Supplemental Environmental Impact Statement (SEIS)
development process
2
2
Memo
Alaska LNG project
Source httpwwwarcticgasgovalaska-lng-project
The Alaska LNG export project would be among the worldrsquos largest natural gas-development
projects The project is in the pre-front-end engineering and design phase or pre-FEED The
project consists of constructing a 58-mile pipeline from Point Thomson gas field to Prudhoe Bay
and 800-mile pipeline from Prudhoe Bay to Nikiski
DOT Parks Highway Projects
Source httpdotalaskagovparks2014
The Alaska Department of Transportation and Public Facilities is performing road construction on
the Parks Highway during the construction season Work includes turn lanes passing lanes re-
surfacing bridge repairs
3
3
Memo
ADOTampPF Area Plans
Source httpwwwdotalaskagovstwdplngareaplansarea_regionalindexshtml
These are regional multi-modal transportation plans developed for specific areas of the state
designed to address movement between communities in the region and from the region to points
beyond Each of these plans incorporates economic modeling to evaluate potential projects and
prioritize them to best meet state and regional goals Denali National Park is partially included in
the Interior Alaska Transportation Planning Area The most recent plan for this area was adopted
in 2010 The plan includes transportation impacts to topic areas that include
bull Gas Pipeline
bull Mineral Development
bull Military Training
bull Railroad Development
bull Tourism
4
4
Memo The Plan examines potential impacts of these and other developments to highways rail aviation
and local community roads and although the plan did not fiscally constrain priority projects
several projects were identified as short-term capital improvement needs Among these projects
were recommendations for improvements on the George Parks Highway in the area of Denali
National Park This project as described by the plan includes passing lanes from MP 113 to MP
163 for an estimated cost of $15 million
Alaska Railroad ndash Healy Canyon
Source httpalaskarailroadcomPortals6pdfprojects2012_01_04_Healy_Canyon_Stabilization_FS_PROJpdf
Work is being proposed in Healy Canyon between Denali Park Station at Milepost (MP) 348 and Healy (MP 358) The Alaska Railroad has proposed projects to
bull Stabilize the track bed (ongoing)
bull Control the rock fall problems
bull ldquoDaylightrdquo (remove the top) Moody Tunnel at MP 3536 (complete)
bull Realign tracks around Garner Tunnel (complete)
bull Realign the tracks to enhance safety at MP 3536 (Moody Tunnel) and MP 357 (complete)
Proposed Susitna-Watana Dam
Source httpwwwsusitna-watanahydroorgprojectproject-description
Susitna-Watana Hydro could be a large hydro project on the Susitna River upstream of Denali
National Park This project would provide long-term stable power for generations of Alaskans and
have economic impacts on the area The project would generate 2800000 MWh of annual
energy once it comes online in 2024 The installed capacity is 600 megawatts (MW)
Environmental studies are currently underway
DOT Mile 231 Proposed Pedestrian Project
Source httpawsstateakusOnlinePublicNoticesNoticesViewaspxid=173914
The project scope includes constructing a new pedestrian bridge across the Nenana River trail
connections a rest area and intersection improvements Conceptual designs preliminary
engineering and environmental studies are currently underway
Other Area Energy Projects (Wind Coal Natural Gas exploration)
Eva Creek Wind Project Eva Creek is the largest wind project in Alaska at 25-megawatts It is
located 14 miles from Healy at the top of the 10-mile Ferry mining road
Usibelli Coal Mine Exploration License Plan of Operations Usibelli Coal Mine Inc has
submitted a request to carry out a Coalbed Methane drilling exploration program at a prospect site
approximately seven miles east of the town of Healy The project will consist of a single vertical
coal-bed methane exploratory well drilled inside the exploration license area The exploratory well
5
5
Memo will help determine whether sub-surface coal seams contain sufficient quantities of methane gas to
justify further exploration in the area (Source
httpdogdnralaskagovPermittingDocuments2014UsibelliUsibelli_LOCI_14_002_Drilling_at_H
ealy_Creek_Propect_Noticepdf)
Stampede State Recreation Area There is a potential designation of a Stampede State
Recreation Area west of the Panguingue Creek subdivision In March 2013 Senator
Representative David Guttenberg introduced HB148 in response to requests by the Denali
Borough Assembly
Borough Planning Commissioners are currently working through recommendations for area
management which include details of proposed allowed uses and a plan for land management
(Source httpnorthernorgtake-actionstampede-state-recreation-area-1)
Air Traffic ndash Overflights council
Source httpwwwnpsgovdenaparkmgmtaoachtm
The Denali National Park and Preserve Aircraft Overflights Advisory was established in 2007 to
consider resource conflicts between aircraft tours and park visitors on the ground The group is
charged with advising the National Park Service (NPS) on ways to mitigate (reduce) sound impacts
from aircraft flights over the park develop voluntary measures for assuring the safety of
passengers pilots and mountaineers and achieve desired resource conditions at Denali as
outlined in the Backcountry Management Plan (2006)
6
Denali National Park and PreserveLong-Range Transportation Plan
Appendix EPark Transportation Investment Needs Analysis
National Park ServiceUS Department of the Interior
Appendix E Denali National Park and Preserve Park Transportation
Investment Needs Analysis
Denver Service Center Planning Division | National Park Service | March 2017
1
Contents ABSTRACT 2
INTRODUCTION 2
PATINA DESIGN 3
OVERVIEW 3
VEHICLE MANAGEMENT PLAN 3
VECTOR ANALYSIS 4
DATA COLLECTION 4
TRANSPORTATION NETWORK 4
ASSET METRICS 5
HIGH RISK 5
INVESTMENT RANKING 6
GOAL AREAS 7
METHODOLOGY 8
DATA PREP 8
LAYER WEIGHTING 9
COMPOSITE ANALYSIS STEPS 10
SELECTED RESULTS 14
OUTPUTS 14
ROAD SEGMENT FINDINGS 16
Motorized Paved Zone 16
Wildlife Viewing Subzone 1 17
Wildlife Viewing Subzone 2 18
Wildlife Viewing Subzone 3 19
Wildlife Viewing Subzone 4 20
DISCUSSION 20
INTERNAL WEIGHTING 21
SKEWED DATA 21
SPATIAL SPREAD OF DATA 21
NEXT STEPS 22
2
ABSTRACT A Park Transportation Investment Needs Analysis (PaTINA) was performed in support of the Denali
National Park and Preserve Long Range Transportation Plan The PaTINA spatially models areas of
potential investment need by using a Geographic Information System to overlay geographic data The
data overlays are assigned a weight and added together where they are coincident in space The
resulting model visually depicts areas where multiple complexities occur This is compared with
transportation facility data to inform investment strategies The PaTINA results are shared in an
interactive web mapping environment and may be added to other mapping tools as a map service
INTRODUCTION The Park Transportation Investment Needs Analysis (PaTINA) synthesizes geospatial information to inform transportation planning and investment PaTINA takes into consideration the goals of the National Park Service (NPS) service-wide goals the goals of individual NPS units and the requirements of the Federal Highway Administration The combination of these goals is expressed in the Long Range Transportation Goals PaTINA creates geospatial-based analyses related to these goals and produces high-resolution outcomes that are site specific within the park unit PaTINA models use compiled data sources to create models related to transportation needs and restraints The vision goals and objectives established in the park unitrsquos Long Range Transportation Plan (LRTP) determine the input data for PaTINA As an analysis PaTINA is accomplished by overlaying map themes important to park management within
a Geographic Information System (GIS) and spatially comparing the overlay results to the transportation
network Metrics used by facility managers to rank assets of the transportation network in terms of
needed maintenance are then compared to the PaTINA results The analyses demonstrate where
priority areas may be located and can be compared to financial recommendations of LRTP The resulting
analyses can spatially inform the condition performance assessment needs identification funding
strategies and even funding prioritization
Modeled PaTINA results are shared as map services and presented in an interactive web mapping
application along with park facility and other relevant data The PaTINA process can be repeated with
model inputs and weights adjusted to reflect current park management needs
The PaTINA was originally developed as part of the Golden Gate National Recreation Area LRTP to help identify key areas where a confluence of conditions highlighted the need for investment consideration The recognized utility of the analysis led the Denali National Park and Preserve (Denali or park) LRTP team to request a PaTINA to help identify areas of concern that may not be readily discovered without geospatial tools
3
PATINA DESIGN
OVERVIEW The following are steps used to design create and implement PaTINA for the Denali LRTP At the
beginning stages of the LRTP goals are established for the Park Unit which includes Washington Federal
Highways and the Park Unit input Goal areas for Denali were system optimization resource
protection user experience access climate change and partners Each goal area was assigned
applicable GIS data layers which establish elements of the goal The data layers were given priority
weights depending on their importance on how it affects or is affected by the transportation network
Priority weights were determined with input from Denali park staff specialty experts
Once weights were established spatial analysis was performed to determine the overlap of each input
data layer within each goal area The weights of each input layer were added together where overlap
occurred The overlaying process identified areas where multiple inputs are spatially concurrent as well
as where inputs deemed as a higher prioritymdashmore heavily weighted--occur
The overlay results of each goal area were combined to generate the overall PaTINA composite denoted
as ldquoPotential Need Areasrdquo Throughout the LRTP process additional data themes outside the goal areas
were identified as a need and were categorized into three parts asset metrics high risk and investment
ranking These data were later added to the final web mapping product to compare to the Potential
Need Areas
VEHICLE MANAGEMENT PLAN In 2012 Denali prepared a Vehicle Management Plan (VMP) to evaluate alternatives for managing
vehicle use along the Park Road The preferred alternative of the plan proposed new management
zoning to include additional wildlife viewing subzones According to the VMP these subzones would be
implemented to clarify management objectives necessary to achieve desired conditions within specific
road sections Due to the significance of the segments for management purposes (Figure 1) it was
important to incorporate the sections into the initial design of the Denali PaTINA To do so the PaTINA
was applied independently to each road segment resulting in five separate sets of analyses Wildlife
viewing subzone 2 is split between 2a) from Teklanika River Bridge and the Eielson Visitor Center and
2b) east of Wonder Lake
4
Figure 1 Road segments defined in the Denali Vehicle Management Plan and used as a basis for the PaTINA
VECTOR ANALYSIS Following the methodology of the Golden Gate PaTINA the Denali PaTINA was completed as a vector
analysis Golden Gate was the pilot for the PaTINA effort which led to expectations that the process be
replicable at additional park units Vector analysis also has the added benefit of preserving spatial
geometries and attribution Attribution allows web map users to deconstruct the results to verify inputs
contributing to the composite result
DATA COLLECTION The following sections describe the categories of data that make up PaTINA and are included in the final
product
TRANSPORTATION NETWORK The transportation network for Denali first needed to be defined to create a spatial basis for the overlay
analysis For Denali the transportation network consists of roads trails parking lots railroad and
airstrips Each polyline transportation network features were assigned a width (Table 1) and then
2b
2a
5
buffered to that width to create a polygon input All polygon inputs were merged together to create a
final transportation network data layer
Table 1 Buffers applied to the Denali transportation network
Transportation Feature Width
Roads 11rsquo Trails 8rsquo
Railroad 100rsquo
ASSET METRICS Asset metrics included in the Denali PaTINA show facility condition index (FCI) and optimizer bands The
FCI rates the condition of a facility or asset using a numeric rating system This system reflects the
current replacement value of an asset and its projected cost of repairs Optimizer bands were developed
to divide a parkrsquos asset portfolio into five bands to represent the level of maintenance that each asset
should receive The metrics help staff make informed decisions about the allocation of limited funding
and staff time for maintaining park infrastructure
The FCI and optimizer band data were derived from the facility management software system (FMSS)
Assets in the transportation network data layer were joined together with the FMSS spreadsheet to be
able to show the asset metric information spatially The join was based on the Location ID attribute in
both the spreadsheet and spatial data A number of records in the spatial data were missing Location
IDrsquos so manual matching had to take place This was done by using aerial imagery to identify assets
based off of the FMSS location descriptions Assets that still couldnrsquot be identified through this method
received input from park staff via the web mapping tool by using create new features capability
Create New Features Tool in Web Map Site
The Create New Features tool allows users to generate data within the web map interface The user creates the geometry of the data and can also include information in predefined text boxes that gets added to the feature class attribute table Once the new feature has been created and saved it is automatically stored as a new record in a feature class that sits on a local server This benefits the GIS staff by having quick access to newly created data Because the data is automatically stored users can revisit the web map and see previous created features Geometry and text changes can be made to the feature after it has been created
HIGH RISK In winter of 2016 NPS regional and park staff as well as Federal Highway Administration (FHWA)
conducted a risk assessment workshop for Denali The purpose was to identify risk types and areas to
mitigate risk and provide recommendations to park management Those findings will be included in the
Denali LRTP There were a total of 28 identified risk types that were ranked into prioritization categories
from low to high Because of the importance of understanding where risk occurs and to mitigate future
events it was decided to include this information as spatial data into the PaTINA web map Only the
6
high risk category was added to the analysis due to the significance of these risks on Denalirsquos resources
visitors and staff
In total there were eight high risk types identified only six of which could be mapped Out of the six
remaining risk types three had data available The Create New Feature tool was used by park staff to
generate a data layer identifying locations of gravel production sites but was later omitted by the LRTP
team It was concluded that the site itself is not a risk to the transportation network but rather the
absence of gravel in these pits are The in holder access data was gathered from the NPS Lands
Resources Division to show tracts within Denali Culvert locations were derived from an excel
spreadsheet provided by FHWA ndash Western Federal Lands by plotting XY coordinates Lastly the
unstable slopes data was provided by park staff and was originally generated through FHWA in
collaboration with NPS Table 2 summarizes the risk data included in the PaTINA web map
Table 2 Summary of risk data used in the Denali LRTP
Risk Type Can it be mapped
Is data available
What is the source of the data
Inholder Access yes yes NPS Lands Resources Division
Implementation of LRTP no na
Staff Level Changes no na
Gravel Production Processing or Purchase yes no
Culverts (MampO) yes yes FHWAndash Western Federal Lands
Permafrost degradation yes no
River and Stream Flooding yes no
Unstable Slopes yes yes NPS FHWAndash Western Federal Lands
INVESTMENT RANKING A financial analysis was completed for the Denali LRTP resulting in development of investment
strategies An investment strategy combines goals and objectives of the LRTP agreed upon investments
and other transportation needs and constraints in the current funding environment One investment
strategy category is to Repair and Maintain the Unpaved Portion of the Denali Park Road and focuses on
desired condition targets which change depending on the Park Road segment This strategy aligns with
the VMPrsquos concept that the Park Road is less traveled by visitors farther into the park and those
segments with lower desired conditions can help reserve funding for other transportation asset
priorities
Due to the importance of financial analysis results it was decided to include the information as a spatial
component to PaTINA A table showing current and desired conditions for each segment with associated
milepost numbers was provided by one of the contractors working on the LRTP A GIS layer of mile
markers was used to correlate data from the table and create a new layer representing the financial
analysis Attribute information was added and the layer was symbolized by segment showing highest
priority and lowest priority Table 3 shows current and desired condition information that was
incorporated into the new investment ranking GIS layer These results can easily be compared to other
components such as high risk areas or goal area composites
7
Table 3 Financial analysis data based on mile markers
Mile Post Segment Current
Condition Desired
Condition Annual Needs
Priority Ranking
0 to 15 Entrance area to Savage River Trailhead
na 00 na 5
15 to 32 Savage River Trailhead to Teklanika Bridge
009 109 $013 M 4
32 to 39 Igloo Forest to Sable Pass 013 109 $014 M 4
39 to 43 Sable Pass to East Fork Bridge 013 109 $024 M 4
43 to 47 Polychrome to Plains of Murie 035 245 $074 M 2
47 to 62 Plains of Murie to Stony Overlook 013 149 $047 M 3
62 to 66 Stony Overlook to Eielson 014 149 $018 M 3
66 to 70 Eielson to Grassy Pass 017 325 $ - 2
70 to 88 Grassy Pass to Boundary Pit 012 325 $ - 2
88 to 92 Boundary Pit to Kantishna 0499 449 $012 M 1
GOAL AREAS During the early development of the Denali LRTP team members created six goal areas each with an
associated statement The goal statements represent aspects of the NPS mission and Denali vision
statements to help guide future transportation decisions These goal areas serve as a basis throughout
the LRTP for identifying baseline conditions performance management and implementation Table 4
shows the six goal areas and goal statements
Table 4 Denali LRTP goal statements
Goal Area Goal Statement
Resource Protection Understand and protect Denali NPPrsquos fundamental Park resources and values as they relate to the transportation system
Climate Change Plan for climate change impacts to the Parkrsquos transportation system
User Experience Provide a quality multi-modal Park experience for users
Access Provide safe efficient and appropriate Park access
System Optimization Develop a long-term transportation system to appropriately satisfy current and future Park needs
Partnership Manage formal and informal commercial partnerships to provide a viable transportation system
These goal areas served as a guide for GIS data collection Datasets related to each goal area were
identified collected and formatted as needed for the composite analysis The Partnership goal area is
not included in the PaTINA since no map-able data were identified Future iterations of the Denali
PaTINA may include the Partnership goal area if new data are obtained The System Optimization goal
was also not included in the analysis but rather it was called out separately for comparison in the final
model results This category is referred to as Asset Metrics (described above) and include FMSS-specific
data The purpose of this was to be able to spatially detect and understand the correlation between
FMSS data and the Parkrsquos values stated from the LRTP goal areas In total 26 GIS layers were used as
input layers for the analysis Layers from each goal area were overlaid upon each other so that the goals
8
could be visualized for the LRTP Listed below are the input layers for each of the goal areas used for the
analysis
Resource Protection
bull Sheep Gaps
bull Exotic Species
bull StreamRoad Intersections
bull Vegetation Monitoring Marker
bull Sheep^
bull Moose^
bull Bear^
bull Wolves^
bull Caribou (Aug-Sep)^
bull Caribou (July-Aug)^
bull Caribou (May-June)^
bull Wetlands
bull National Register Structures
bull Historic Districts
User Experience
bull Viewscapes
bull Visitor Services
bull Social Trails
bull Visitor Pattern
bull High Visitor Use Area
Access
bull Safety Areas of Concern
bull Railroad Depot
bull Bus Stops
Climate Change
bull Geohazards
bull Permafrost
^Based on extrapolated observation data reported in the Denali VMP
New data created by park staff for the PaTINA
During the process of collecting data data needs were recognized and collated Identified data gaps
included permafrost degradation river and stream flooding events informal aviation landing areas
congestion hotspots and wildlife patterns To fill certain gaps the Create New Features tool in the web
map was utilized by park staff Layers in the list above with an asterisk represent the ones created by
park staff Other identified data gaps focused on visitor use statistics Examples included dependable
traffic counts visitation numbers by area and visitor numbers on bus types beyond front country area
METHODOLOGY
DATA PREP All input data layers were projected to NAD_1983_Alaska_Albers Point and polyline datasets were
buffered and converted to polygon features and then clipped to the transportation network Figure 2
shows an example of a point layer created by park staff using the Create New Feature tool that was later
buffered and clipped Once the polygon data was created per input layer they were merged together to
create a single polygon layer For example park staff created multiple polylines and points to capture
visitor patterns along the Park Road The polygons were merged together to create a single visitor
pattern input layer under the User Experience goal area
9
Figure 2 Example of Denali staff input used to create data for the PaTINA
LAYER WEIGHTING Within the goal areas each input polygon layer was assigned a value The values ranged from 0 (no
impact) to 05 (lesser impact) to 1 (full impact) and was assigned by park staff Table 5 shows each goal
area and associated weighted values for each road segment The term ldquoimpactrdquo in this setting may refer
to impact the input layer has on the transportation network or conversely impact the transportation
network has on the input layer To align with the VMPrsquos subzones of the Park Road each input layer was
weighted separately for individual road segments Weighted per segment reflects park management
priorities which may vary for a particular input by road segment The High Visitor Use Area input layer is
an example of this where the impact is higher in the front country compared to further west on the Park
Road Therefore the High Visitor Use Area input layer received a higher impact value in the front
country road segment
10
Table 5 Layer input ranks assigned by park staff
RESOURCE PROTECTION GOAL AREA
Motorized Sightseeing
Subzone
Wildlife Viewing
Subzone 1
Wildlife Viewing
Subzone 2a
Wildlife Viewing
Subzone 3
Wildlife Viewing
Subzone 2b
Sheep Gaps 0 05 1 05 0
Exotic Species 1 05 05 05 05
StreamRoad Intersections 1 1 1 05 1
Vegetation Monitoring Marker 0 1 1 05 0
Sheep 05 05 1 0 0
Moose 1 05 05 1 05
Bear 05 05 1 05 05
Wolves 1 05 05 05 05
Caribou (Aug-Sep) 0 0 05 1 0
Caribou (July ndashAug) 0 05 05 1 0
Caribou (May ndash June) 0 0 0 05 0
Wetlands 1 05 1 1 05
National Register Structures 1 1 1 1 1
Historic Districts 1 1 1 1 1
USER EXPERIENCE GOAL AREA
Motorized Sightseeing
Subzone
Wildlife Viewing
Subzone 1
Wildlife Viewing
Subzone 2a
Wildlife Viewing
Subzone 3
Wildlife Viewing
Subzone 2b
Viewscapes 0 05 1 05 0
Visitor Services 1 1 1 1 1
Social Trails 1 1 1 1 1
Visitor Pattern 1 1 0 0 05
High Visitor Use Area 1 05 05 05 05
ACCESS GOAL AREA
Motorized Sightseeing
Subzone
Wildlife Viewing
Subzone 1
Wildlife Viewing
Subzone 2a
Wildlife Viewing
Subzone 3
Wildlife Viewing
Subzone 2b
Safety Areas of Concern 05 0 05 05 0
Railroad Depot 1 0 0 0 0
Bus Stops 1 0 0 0 0
CLIMATE CHANGE GOAL AREA
Motorized Sightseeing
Subzone
Wildlife Viewing
Subzone 1
Wildlife Viewing
Subzone 2a
Wildlife Viewing
Subzone 3
Wildlife Viewing
Subzone 2b
Geohazards 05 05 1 1 05
Permafrost 05 05 1 0 05
COMPOSITE ANALYSIS STEPS 1 Once the input layers were weighted the values were added into new fields in the attribute
table The new field names were abbreviated with each goal area name and input layer number
For example Resource Protectionsheep gaps would read as RP1 since sheep gaps was listed
11
first in the data collection table Another example would be Resource Protectionexotic species
shown as RP2 The following shows goal area abbreviations
a Resource Protection ndash RP
b User Experience ndash UE
c Access ndash AC
d Climate Change ndash CC
2 Within each goal area the input layers were combined with the transportation network layer
using the UNION tool creating a goal area output layer This resulted in the following layers
RP_Union UE_Union AC_Union and CC_Union
3 Using the DELETE tool all fields were deleted except for the five road segment fields This
reduced the file size of the output layer for future geoprocessing steps and faster speeds once
added to the web map
Steps 4-6 refer to only one goal area and one road segment For example Resource Protection
(RP)Motorized Paved Zone (MPZ)
4 A new field called RP_T_MPZ was added to the RP goal area output layer to sum the total
values This was completed by using the FIELD CALCULATOR tool and summing the MPZ value
for each input layer (RP1_MPZ + RP2_MPZ)
5 Due to the goal areas having a different number of inputs the total sum value was normalized
to avoid skewing the outputs to goal areas with more input layers By normalizing the total
values could be shown on a common scale A new field was added and called RP_TN_MPZ Using
the FIELD CALCUALTOR tool the RP_T_MPZ value was divided by the total number of inputs
resulting in a normalized number (RP_T_MPZ14= RP_TN_MPZ)
6 The RP goal area output layer was then clipped to a previously created MPZ road segment layer
(RP_MPZ_Clip)
Steps 1-6 were repeated for each goal area and road segment In total twenty clipped output layers
were created Figure 3 shows steps 1-6 in a flowchart
12
Figure 3 Process diagram for PaTINA steps 1 - 6
Steps 7-9 refer to only the MPZ road segment
7 The next step utilized the UNION tool to union each clipped goal area output layer by road
segment (RP_MPZ_Clip UE_MPZ_Clip AC_MPZ_Clip CC_MPZ_Clip = MPZ_Clip)
8 Once the MPZ_Clip layer was created a new field called All_MPZ was added to sum the total
normalized numbers The FIELD CALCULATOR tool was used and summed each goal areas
normalized number (RP_TN_MPZ + UE_TN_MPZ + AC_TN_MPZ + CC_TN_MPZ = ALL_MPZ)
9 The overall MPZ composite was then symbolized based on the total MPZ normalized values
(ALL_MPZ) and was shown with five classes using Natural Jenks classification The five classes
were symbolized from very low (dark green) low (light green) medium (yellow) high (orange)
to very high (red) which identified potential need areas throughout the transportation network
Figure 4 shows symbolization for the front country area in road segment MPZ
13
Figure 4 Mapped Potential Need Areas for the Motorized Paved Zone
Steps 7-9 shown in Figure 5 were repeated for each road segment In total five segments showed very
low to very high potential need areas
Figure 5 Process diagram for PaTINA steps 7-9
14
SELECTED RESULTS
OUTPUTS The PaTINA analysis resulted in four main output groups which may be viewed individually or compared
to one another These groups are asset metrics high risk areas investment rankings and potential
need areas See the Data Collection section for review of these groups
Figure 6 shows potential need areas against high risk areas located in Wildlife Viewing Subzone 3
segment of the Park Road The results appear to have several high risk areas spatially coincident with
high need areas highlighting locations that may be considered for financial investment Doing so may
help protect park resources and visitor safety
Figure 6 High Risk Areas shown with Potential Need Areas modeled in the PaTINA
15
Figure 7 shows potential need areas against high investment ranking along the Wildlife Viewing Subzone
2 segment of the Park Road The investment ranking displays two sections which are Igloo Forest to
Sable Pass (MP 32 to 39) and Sable Pass to East Fork Bridge (MP 39 to 43) Within the high investment
sections potential needs can be identified for further examination for future investment
Figure 7 Example PaTINA-modeled Potential Needs Areas shown with investment ranking data
16
ROAD SEGMENT FINDINGS
Motorized Paved Zone The motorized paved zone starts at the park entrance at mile post 0 and ends at mile post 149 (Figure
8) In this segment it appears that the greatest amount of very high potential need areas are
concentrated around the Denali Visitor Center and high potential need areas are located just east of
that surrounding the Riley Creek Campground These potential need areas consist of up to twelve input
layers each of which fall within all goal areas Findings also show the Park Headquarters and Savage
River to be potential need areas with values of medium and high
Figure 8 PaTINA-modeled potential need areas for the Motorized Paved Zone segment of the Park Road
17
Wildlife Viewing Subzone 1 The wildlife viewing subzone 1 spans the distance between mile post 149 to mile post 319 (Figure 9)
and includes the Sanctuary River campground and the Teklanika River campground and rest stop The
Teklanika River campground shows the largest very high potential need area Up to twelve input layers
from three of the goal areas cover this segment The access goal is not included Findings also show the
Sanctuary River campground and west of the Primrose Ridge and Mount Margaret rest stop to be a very
high potential need area though the spatial area is smaller compared to the Teklanika River
campground This location is comprised of up to thirteen input layers from all goal areas
Figure 9 PaTINA-modeled potential need areas for the Wildlife Viewing Subzone 1 segment of the Park Road
18
Wildlife Viewing Subzone 2a The wildlife viewing subzone 2a ranges from mile post 319 to mile post 66 (Figure 10) and includes
locations from Igloo Creek campground to Eielson Visitor Center The findings suggest that there are
many high potential need areas along this segment of road The most prominent areas are located
before and after Polychrome Overlook and includes up to ten input layers along this stretch The Eielson
Visitor Center shows very high potential need areas with up to twelve input layers from three goal
areas These findings may suggest future investment at this location due to high use at the visitor center
Figure 10 PaTINA-modeled potential need areas for the Wildlife Viewing Subzone 2 segment of the Park Road
19
Wildlife Viewing Subzone 3 Milepost 66 to mile post 846 is the wildlife viewing subzone 3 segment (Figure 11) which begins east of
the Eielson Visitor Center and goes to the Wonder Lake campground Results show west of the Eielson
visitor center with the greatest concentration of very high potential need areas A majority of this
segment ranges from very low to medium potential need areas until farther west near Wonder Lake
Wonder Lake campground consists of up to ten input layers from three goal areas
Figure 11 PaTINA-modeled potential need areas for the Wildlife Viewing Subzone 3 segment of the Park Road
20
Wildlife Viewing Subzone 2b The wildlife viewing subzone 2b starts at milepost 846 to mile post 920 being the farthest west of all
road segments (Figure 12) The only very high potential need area in this segment is located east of
Kantishna Results display that the very high area has up to 12 input layers from three goal areas The
east side of this area shows high potential need suggesting that this stretch could be identified as an
area for potential future investment
Figure 12 PaTINA-modeled potential need areas for the Wildlife Viewing Subzone 2b segment of the Park Road
DISCUSSION The Park Transportation Investment Needs Analysis (PaTINA) employs standard geospatial methods that can be repeated to reflect changing management goals as well as be applied in different facility management situations and scales The web mapping application deployed with the data allows for frequent review and consultation of the results to inform management decisions
21
Execution of the methods however requires intensive data gathering and formatting Further the
weighting process is currently accomplished in a desktop GIS after subject matter experts are polled for
input weights This process could be improved with tool development in either the desktop environment
or the online web map to streamline how GIS data are included and weighted in the model While the
process in its current state is repeatable in most cases it requires a GIS specialist and a desktop GIS to
complete We foresee improving either the desktop or online tool (or both) to make the process more
accessible and rapid Depending on the data inputs however the overlaying process may still require
extensive data collection and preparation Additionally the overlaying process can be computer
intensive--again depending on the data inputs--and may be prohibitive due to available resources
The data collection process in this analysis identified data needs which are collated separately and listed
above under Goal Areas Acquisition and incorporation of these data may improve the PaTINA results
Visitor use statistics are an especially glaring omission which if obtained will improve future PaTINA
modeling
Seasonal variations in some inputs are not well represented in the analysis Further work may entail
modeling specific seasons to help inform investment strategy throughout the year
INTERNAL WEIGHTING The PaTINA applied to Denali NPampP weighted each input layer uniformly across the spatial extent of the layer However some data contained attributions that could be weighted differently Because the weights were assigned by park staff for each input layer based on the road segments further weighting based on attributes internal to a layer would unnecessarily complicate the composite scoring Future iterations of the model for Denali may consider applying layer attributes to vary weights across the layer instead of applying weights per road segment Alternatively the weights assigned by road segment could be normalized against the attribute weighting but the statistical validity of this needs to be explored
SKEWED DATA The initial run of the PaTINA model showed skewed results within the front country segment NPS staff
clarified that specific locations within the front country segment should have been identified as very
high or high potential need areas instead of low and medium rankings The main concern was around
the Denali Visitor Center and vicinity that included the railroad depot trailheads and visitor amenities
As a known high visitor use area the visitor center and surroundings should be considered a high
potential for investment The data and associated weights were examined and it was concluded that the
user experience goal area was lacking desirable input layers to validate higher rankings Once the
additional input layers were identified they were added to the next run model and results showed
important locations such as the Denali Visitor Center with higher rankings
SPATIAL SPREAD OF DATA Input layers across the goal areas differ spatially within the road segments The resource protection goal
area is the only goal area in which input layers coincide with the transportation network within all five
road segments User experience and climate change goal areas are within four segments with no data in
22
the last segment wildlife viewing subzone 4 The access goal area contains data only within the first
segment motorized sightseeing subzone Although input weights are normalized for each goal area the
spatial spread of the data influences the results where more inputs are occurring
The results show classes of potential need areas throughout the entire transportation network due to
some input layers completely overlaying it These layers are exotic species each of the mammal layer
inputs excepting sheep and permafrost Due to the spatial spread of these data every area of the
transportation network can be classified as at some level of potential need for investment
NEXT STEPS The data and web mapping interface will require maintenance as updated or new data and web
mapping tools become available We see the initial release of the web map for the Denali PaTINA as a
first step toward a more comprehensive tool to aid the park in investment decision making As noted
above stream-lining the weighting and model execution processes would improve the overall utility of
the PaTINA
Additional development of the PaTINA web map may include incorporation of other map services such
as the NPS Road Inventory Program and data services from the Inventory and Monitoring network
Conversely the base PaTINA results can be added to other web map applications that may focus on
other issues
Finally development of instructional materials and accompanying training sessions would bolster and
help maintain the utility of the PaTINA results and its application to park management
National Park Service US Department of the Interior
Denali National Park and Preserve Long-Range Transportation Plan
Appendix F Denali Funding Plan
Denali National Park and Preserve Financial Analysis Technical Report ndash FINAL DRAFT
Introduction This report discusses the transportation funding aspects of the Denali National Park and Preserversquos first Long Range Transportation Plan It includes a retrospective of transportation funding from 2006-2013 a projection of funds expected to be available for transportation during the planrsquos twenty year planning horizon and a summation of the resources necessary to return transportation facilities at Denali National Park and Preserve (Denali NPP) to ideal conditions As is true for all of the National Park Service (NPS) the amount of funding that is needed for transportation at Denali NPP exceeds the amount that will be available in coming years and so this report includes an investment strategy that funds the highest priority needs
The discussion must begin with two of the NPSrsquos guiding transportation investment principles and Denali NPPrsquos primary existing transportation document the Vehicle Management Plan (VMP) It then discusses Denali NPPrsquos place in Alaska Region transportation funding and the expected increase in funding needs due to climate change impacts The middle section of this report discusses the LRTP methodology in general and how the Denali NPP LRTP methodology differs from those used for other NPS LRTPs There is also a discussion of historical forecasted and needed transportation funding that collectively make up the baseline transportation funding report for Denali NPP
This report concludes with a discussion of the funding strategies which were evaluated for the Denali NPP LRTP and how the final strategy was selected The investment strategy prioritizes operations and maintenance the rehabilitation of the paved section of the Park Road funds the unpaved sections of the Park Road to achieve management priorities and provides approximately $1m per year to address other transportation priorities The Denali NPP transportation investment strategy is expressed with respect to each of the four LRTP planning scenarios to guide park management decisions during times when visitation is increasing or decreasing and when funding (or stakeholder support) is higher or lower than average Funding shortfalls means that the condition of all transportation assets cannot be improved but progress can be made to address the highest priorities
Funding Denali Transportation Facilities
Capital Investment Strategy and Total Cost of Facility Ownership As a best practice and formal policy the NPS incorporates strategic facility planning into its asset management decision-making processes including LRTPs Two fundamental concepts the NPS Capital Investment Strategy (CIS) and Total Cost of Facility Ownership (TCFO) underlie those best practices and are drivers of the investment planning and decision-making reflected in the Denali LRTP
The NPS Capital Investment Strategy The CIS is an NPS strategy for prioritizing project investment to ensure effective and responsible project funding The CIS includes a scoring tool that decision-makers at all levels of the NPS have available to them to inform project investments and other asset management needs
The purpose of the CIS is to help prioritize investments focus on mission-critical assets manage operations and maintenance and ensure that the greatest impact can be made with available capital and operational funds The CIS uses a scoring tool to evaluate projects on a number of different criteria Financial Sustainability Visitor Experience Resource Protection and Health amp Safety The four categories are weighted using a predefined algorithm to arrive at an overall project score Projects can then be compared by score as needed in theory the greater the score the higher the priority The scoring strategy supports an asset management approach that emphasizes maintaining key assets and reducing the estimated value of deferred maintenance cost against those key assets
Some of the key objectives in the Financial Sustainability strategy are to build only what can be maintained right-size the asset portfolio reduce liabilities reduce resource consumption to promote sustainability and eliminate non-essential development in order to emphasize the essential natural and cultural experience The Visitor Experience strategy includes investment in assets or resources that enable recreation and serve as gateways to park units contact stations and interpretive assets The Resource
DenaliLong Range Transportation PlanFinancialTechReportndashFINAL DRAFT 1
Protection strategy focuses on those historic cultural and natural resources that the NPS is tasked with protecting and preserving Such tasks supported by the CIS could include preservation repair and restoration of assets Finally the Health amp Safety strategy places an emphasis on correcting unsafe or hazardous conditions within park units that pose a threat to visitors or staff Different parts of the Denali LRTP address these four strategies which are used by fund program managers to allocate limited funding
Total Cost of Facility Ownership Applying the concept of Total Cost of Facility Ownership (TCFO) is considered by the NPS to be a vital part of a financially sustainable infrastructure strategy and practice to truly address transportation asset management1 It aligns closely with the intentions behind the CIS especially the CIS Financial Sustainability component TCFO is the full life-cycle cost of constructing maintaining and operating an asset until it needs replacement This concept recognizes that assets require investment throughout their service lives until they need replacement or disposition and that preventive maintenance and facility operations activities are key to minimizing long-term costs and optimizing the life of said assets Implementation of the TCFO concept involves a shift-away from a ldquojust fix itrdquo or ldquorun to failurerdquo mentality to more holistic planning making cost estimates and decisions that consider not just the deferred maintenance (DM) of an asset but the ongoing OampM need over its service life need for replacement and ultimately disposition
The Denali LRTP team took the concepts inherent to the CIS and TCFO and embedded them into all of its LRTP analyses and planning activities Consequently the resulting investment strategy selected by Denali NPP staff is consistent with the approaches and practices used across the NPS to develop for example the National LRTP and other unit or regional LRTPs
The Denali Park Road and the Vehicle Management Plan Denali NPP is one of the most visited National Park Service units in Alaska and the Denali Park Road is the means for the majority of visitors who wish to traverse deep into the interior by any mode motorized or otherwise For many visitors it is the most readily accessible transportation corridor for them to experience the Alaska wilderness and for some it is their only option Denali NPP is currently several years into the implementation of its VMP the culmination of an intensive planning effort to balance the needs of the parkrsquos natural resources with high visitor demand The Denali LRTP is consistent with the recommendations in the VMP
Generally the VMP recommends limiting vehicle traffic on the Denali Park Road in order to reduce traffic impacts on natural and cultural resources The VMP has a ldquotelescopingrdquo approach where visitor activity is highest and associated development is most extensive in the paved entrance area of the park and declines and lessens respectively as the Park Road heads west As shown later in the section on Funding Strategies the Denali LRTP reflects this by realigning maintenance and rehabilitation investments along the Park Road to concentrate on the areas of highest visitor activity and most extensive development
Funding Trends The Federal Lands Transportation Program in the NPS Alaska Region The Federal Lands Transportation Program (FLTP) is the single largest source of transportation funding for the National Park Service and other Federal land management agencies Project funding decisions are made at the regional level following national guidelines The FLTP at a national scale has recently been reauthorized at a higher funding level than analyzed in this plan However interim program guidance suggests that the majority of the increase will be reserved for nationally significant major projects with only a small increase to regional allocations
Denali NPP has historically been the largest recipient of FLTP funding in Alaska in part because 20 of the Regionrsquos 27 miles of paved roads are within Denali NPP The unpaved Park Road may also be funded by FLTP NPS regional staff indicate that Denali NPP has in the past received all funding from the program by default unless another NPS Alaska Region park unit has eligible needs (which is rare) at which point that project from another park unit moves to the top of the regional FLTP program This means that FLTP will likely be a sustainable funding source for major investments at Denali NPP into the future The next three years of FLTP investment at Denali will be primarily used to rehabilitate the 15 mile paved section of the Park Road from the park entrance to the Savage River checkpoint
1 For example reference ldquoMemorandum Guidance for Addressing Facilities in Planning Documentsrdquo Associate Director Park Planning Facilities and Lands
National Park Service US Department of the Interior January 4 2016
DenaliLong Range Transportation PlanFinancialTechReportndashFINALDRAFT 2
Climate Change and Geotechnical Hazards As explained elsewhere in the LRTP current research indicates climate change is dramatically affecting transportation facilities across Alaska The impacts of climate change relevant to Denali NPPrsquos transportation system include thawing permafrost unstable slopes a lengthening shoulder season and other change indicators Most of these changes will result in higher costs to operate and maintain Denali NPPrsquos transportation network which will further stress already limited funding
Monitoring and evaluation of climate change impacts is an ongoing need and a recommendation of this LRTP Tracking threats and hazards to the transportation system such as unstable slopes requires funding for specialized equipment and the technicians and scientists who collect and analyze the data Funding updates to hydrology models and monitoring permafrost thawing are other near-term relatively inexpensive data needs that can help avoid disastrous impacts over the medium to long term Denali NPP has initiated the effort but funding has not been identified for developing specific plans for how to adapt the transportation system in the park to these expected impacts
In the near term a number of susceptible areas along the Park Road will likely encounter more frequent closures due to intermittent landslides flooding or debris flows with each requiring cleanup and reopening The future impacts of one of the effects of climate change increasing precipitation in the Denali Borough region can already be previewed during excessively wet years 2016 was a particularly wet year and staff were faced with unstable slopes and more frequent and more severe debris flows Beyond the cost of cleaning up after these road closures there are short-term disaster management tasks for which Denali must be ready ndash evacuation or care of visitors staff users and inholders on the far side of an interruption
Some dedicated funding sources are available for recovery costs such as NPS Emergency Storm amp Flood Damage and FHWArsquos Emergency Relief for Federally Owned Roads (ERFO) These programs have limited budgets and will be increasingly strained in an era of continued climate change impacts not just in Denali NPP but across the National Park Service These funding sources are currently limited to recovery costs only and cannot be used for monitoring or preventive work that can anticipate and avoid a future event such as by stabilizing slopes or realigning a road
There are several segments of the Park Road and its associated bridges and structures that may become physically or financially untenable in the next few decades There may come a time when the park will need to consider decommissioning rerouting andor relocating these facilities These costs are not yet known but will likely far exceed Denalirsquos typical past annual funding and may require special major project funding US Department of Transportation (DOT) discretionary grants such as the (unfunded) Nationally Significant Federals Lands and Tribal Projects program or Transportation Investments Generating Economic Recovery (TIGER) are possible sources as is the NPS Line Item Construction program However because these needs are not yet quantified and because they are beyond the capacity of the current funding programs to address the costs of fully adapting the transportation system to climate change are not included in the Denali LRTP financial analysis
Denali LRTP Funding Baseline Financial Analysis Methodology The financial analysis methodology for the Denali LRTP is based on the data and methods first developed for the NPS National LRTP (NLRTP) A much more detailed technical summary is available for the NLRTP and generally applicable to the Denali LRTP but this section will cover the basic steps as well as deviations used to adapt it to the unit level
Historical Investments Establishing a financial baseline of the historical average annual level of regional transportation spending provides a foundation for forecasting the
Annual transportation investments at Denali likely future available funding levels which can be anticipated for Denali NPP averaged $923 M per year from 2006-
NPPrsquos transportation facilities This is important information for developing a 2013 from all funding sources combined fiscally-constrained LRTP The LRTP team analyzed all of the fund sources that had been used for transportation investments at Denali NPP from fiscal year (FY) 2006 through FY 2013 These results provide a vital context for developing the Denali LRTP investment strategy
DenaliLong Range Transportation PlanFinancialTechReportndashFINALDRAFT 3
The LRTP team estimates that approximately $775 M per year will be available to Denali NPP for transportation purposes over the next six years
The financial data was extracted from various financial and project management data tracking systems2 The LRTP team
identified historical expenditures awards and authorizations for transportation assets
adjusted those prior year dollar values to equivalent 2014 values using GDP inflation factors and
calculated an annualized average transportation funding expenditure rate for the period FY 2006 ndash FY 2013
This data was initially prepared by the National LRTP team and then reviewed by the Denali LRTP team to remove any anomalies To simplify reporting the dataset was consolidated coded and grouped by funding authorizations funding programs work types and asset types All identifiable American Recovery and Reinvestment Act (ARRA) investments a one-time extra-ordinary funding source were removed from this analysis A detailed technical methodology document is available from the NLRTP effort
Because the data only includes transportation expenditures made by the National Park Service it does not include transportation
each funding source that Denali NPP has recently used for transportation It
funding and support with an increase in visitation) or ldquoSurplus of Moneyrdquo scenario (increased funding and support with a decrease in visitation) when compared to the historical average However for the purposes of the investment strategy in this plan the funding forecast is considered to be at the center of our ldquoManagement Strategies of no Regretrdquo - those actions that make sense given a normal variation in expected support funding and visitation levels
The Denali LRTP team leveraged the approach applied in the development of the NPS National LRTP to forecast anticipated funding availability for transportation investments in the near future There were two main sources of forecasting information
The NPS budget office The Budget Office conducts forecast exercises servicewide and with individual units The Budget Office suggested the LRTP program assume a one-time reduction to Title 54 (DOI) Non-Fee program fund sources of three percent for ONPS and Cyclic Maintenance programs in the NPS National LRTP The DENA LRTP forecast was based on a combination of actual funding program investment plans where possible and the three percent cut when it wasnrsquot The three percent reduction only applied to programs for which the Denali LRTP project team did not have access to an investment plan (eg Operational Base)
Regional Funding Programs The Denali LRTP project team consulted several regional-level program plans to acquire information on planned investment levels Title 54 Non-Fee programs for Cyclic Maintenance RepairRehabilitation and Line Item Construction Title 16 54 Fee programs for Recreation Fee Transportation Fee and Concession Franchise
investments by third parties The parkrsquos partners such as the Alaska Railroad bus concessioners Denali Borough and the Alaska Department of Transportation and Public Facilities (ADOTampPF) all fund transportation work that helps visitors employees inholders and freight carriers access the park However these investments are not accounted for in this analysis because these data do not enter NPS financial data systems
Forecasted Transportation Funding This section documents the Denali NPP financial forecast for transportation based on anticipated future funding levels that can be reasonably assumed to be available The forecast of available funding provides the principal financial constraint against which future investment plans must be prioritized and represents the result of the most likely funding scenario for
does not include a forecast for work done by other parties such as the State of Alaska or Denali Borough that may benefit Denali NPP and it also doesnrsquot include any unforeseen additional funding which may result in a ldquoPopular Parkrdquo scenario (increased
Fees and the Title 23 Federal Lands Transportation Program These forecasts replaced the National LRTP-style (ie three percent reduction) forecasts for these programs as they provide more certainty than broad program-level authorizations and appropriation amounts
The elimination of the Paul S Sarbanes Transit in the Parks Program (TRIP) is another factor to note in the forecast but the only analysis needed is to not project any future grant awards from this program Denali made use of TRIP in the past but will need to seek other funding sources to fund future transit and trails projects This is also true of various grant programs formerly used by many parks but not Denali NPP such as Scenic Byways or the Public Lands Highway Discretionary Program
2 Systems used included the NPS Administrative Financial System (ie AFS Versions 3 and 4) and the joint Federal Highway Administration (FHWA)NPS Park Roads and Parkways Transportation Allocation and Tracking System aka PTATS
DenaliLong Range Transportation PlanFinancialTechReportndashFINALDRAFT 4
Unfortunately transportation funding for Denali NPP is expected to decline unless additional funding sources are found or funds are redirected from other critical areas The declining funding environment coupled with historically high visitation may result in a ldquoLosing Groundrdquo scenario (decreased funding and support with an increase in visitation) when compared with historical averages These conditions are not dissimilar from recent years (eg 2013-2015)
Transportation Investment Needs Investment needs are defined in this plan as the amount of funding required to bring transportation assets to good condition and sustain them at that level Investment needs also include costs to address programmatic needs such as code compliance structural fire and accessibility Other goal area needs such as resource protection may overlap with asset management (TCFO) needs or may be additional potentially unfunded requirements
The LRTP team estimated an annual need of $1242 M to return the Denali NPP transportation system to good condition and keep it there over six years
The Denali LRTP used a similar methodology as the National LRTP and other Regional LRTPs using needs data from the best available data system or report that covers a particular type of transportation facility and type of work However many of the reports and systems available at the regional or national level do not apply to individual parks The principal difference between the needs in the Denali LRTP is the use of automated systems The data sources used for the Denali LRTP are
Reoptimization File OampM needs for all facilities except the unpaved Park Road
2013 Alaska Region Unpaved Road Analysis (pilot) Detailed analysis for the unpaved Park Road
Facility Management Software System (FMSS) Component renewal and programmatic needs
Project Management Information System (PMIS) Capital investment needs planning naturalcultural resources
National list of megaprojects Paved Park Road repair project and replacement of the Toklat River Bridge
Differences between the needs sources such as timespans and prioritization systems were reconciled in order to create a single set of transportation facility needs for Denali NPP Park staff also reviewed the needs data and removed several projects that were already underway or would be accomplished through partners rather than by the park At $1242 M per year the estimated annual transportation investments needs exceed the annual transportation funding amount by $467 M per year
Transportation Funding for Denali NPP This section discusses the current and near future transportation funding outlook for Denali NPP It covers where funds have come from and how they have been used in terms of what type of transportation facility was funded what type of work was funded and how transportation funding is prioritized
Investments by funding source From 2006-2013 the National Park Service as a whole used more than 60 different funding program and accounts to fund transportation activities but only ten programs funded investments at Denali NPP Table 1 below shows how much each funding program provided in the past how much it is expected to provide in the future and how much would be needed from each funding program to cover Denalirsquos total transportation need each year if past investment patterns were continued
DenaliLong Range Transportation PlanFinancialTechReportndashFINALDRAFT 5
Table 1 Denali NPP Transportation Investments and Needs by Funding Source (in millions of 2013 $)
Investments by funding source
Historical Average Annual Investment
Forecasted Annual Average Investment
Estimated Annual Needs
Title 54 Non‐Fee $175 M $101 M $335 M
Cyclic Maintenance $063 M $004 M $001 M Line Item Construction $034 M $032 M $007 M Operational Base $064 M $055 M $270 M Other NPS Programs $007 M $007 M $019 M
RepairRehab $007 M $002 M $039 M
Title 54 Title 16 Fee $134 M $211 M $261 M
Concessions Franchise Fees $067 M $144 M $051 M
Recreation Fee $067 M $067 M $210 M
Title 23 $601 M $462 M $586 M
FLTP $601 M $462 M $586 M
OtherExternal $014 M $001 M $060 M
FTA TRIPATPPL $012 M ‐‐ ‐‐
Reimbursable Agreements $001 M $001 M $060 M
Grand Total $923 M $775 M $1242 M
Each of these funding programs have a different legislative authorization and project eligibility criteria Title 54 programs are those authorized by Title 54 of the US Code (National Park Service-specific programs) Title 16 includes other relevant Department of the Interior programs (ie Recreation Fee Program) Title 23 includes programs overseen by the Federal Highway Administration and the ldquoOtherExternalrdquo category includes other funding sources such as the discontinued TRIP program as well as reimbursable agreements donations partnerships and other less common sources
Investments by Facility Type
Denali NPP maintains a diverse system of transportation facilities including paved and unpaved roads bridges paved and unpaved transportation trails transit facilities developed airstrips as well as support infrastructure such as a materials (gravel) quarry Table 2 below shows historical investments forecasted investments and the estimated annual investment needs for each of the parkrsquos transportation facility types
Of all historical investments in transportation at Denali NPP in the recent past about 55 went to the Park Road and associated structures and 18 supported parkwide operations that include the Park Road Less than a third was used for separate transportation facilities such as trails and access roads Park Road funding was oriented to the unpaved segments that require frequent repair work to remain in even fair condition given the extreme conditions and heavy vehicle traffic in Denali NPP Recent investments in several difficult sections in the western end of the Park Road helped restore user comfort and safety
DenaliLong Range Transportation PlanFinancialTechReportndashFINALDRAFT 6
Table 2 Denali NPP Transportation Investments and Needs by Asset Type (in millions of 2013 dollars)
Historical Forecasted Average Annual
Average Annual
Estimated Annual
Asset Type Unpaved Roads
Road Bridges
Trails and Transit
Investment $386 M
$184 M
$147 M
Investment $235 M
$042 M
$066 M
Needs $527 M
$135 M
$137 M
Paved Roads $144 M $291 M $297 M
Other3 $051 M $053 M $066 M
Parking $011 M $089 M $081 M
Grand Total $923 M $775 M $1242 M
Historical Forecasted Average Average Estimated Annual Annual Annual
Lifecycle Stage Investment Investment Needs Planning and Administration4 $058 M $057 M
Capital Investment $134 M $259 M $130 M
Operations and Preventive Maintenance $045 M $048 M $186 M
Recurring Maintenance $142 M $083 M $374 M
Component Renewal $527 M $259 M $508 M
Grand Total $923 M $775 M $1242 M
Denali NPPrsquos greatest area of transportation investment need is in heavy repair and rehabilitation work similar to much of the rest of the National Park Service Insufficient funding often leads to smaller routine maintenance work being deferred which causes transportation facilities to fall out of a state of good repair Other significant needs at the park include annual operations and maintenance of transportation facilities and making improvements to culverts that provide for fish passage and building an aircraft hangar
Note that some categories such as capital investment show ldquosurplusesrdquo where more funds are forecasted for investment than are needed This is the result of project programming where several capital investment projects are scheduled for near-term
Investments by Asset Lifecycle stage As discussed in the section on Total Cost of Facility Ownership different types of work are needed at different points in a transportation facilityrsquos lifespan from planning through to rehabilitation or disposition Table 3 below shows historical and forecasted annual investments as well as estimated annual investment needs for each lifecycle stage for all asset types combined
Table 3 Average Annual Investments by Lifecycle Stage (in millions of 2013 dollars)
construction in 2016-2021 whereas the needs represent the average annual needs over twenty years
3 Other category includes aviation buildings that support transportation equipment and multimodal facilities Trails and Transit notably excludes investments and OampM spending made by the transit contractors who operate within Denali NPP but does include Denalirsquos own investment in bus transit facilities such as buildings lots and experimental hybrid buses 4 Routine planning and administration needs are not included in NPS facilities management data systems but can be assumed to continue at historical levels Additional unquantified planning needs are likely in the LRTPrsquos horizon including work in the parkrsquos entrance area coordination with private shuttle services and the Alaska Railroad and transportation planning to maintain park operations in the face of climate change impacts
DenaliLong Range Transportation PlanFinancialTechReportndashFINALDRAFT 7
Priority Estimated Annual Optimizer Band Equivalent Transportation Needs
Highest Priority $377 M Band 1 High Priority $584 M Band 2 Other Priority $281 M Bands 3 4 5
Programmatic Needs Some of the lifecycle stage needs are also considered programmatic needs for transportation facilities at Denali NPP Programmatic needs include work necessary to meet standards set by safety accessibility environmental and fire safety requirements It is generally analogous to code compliance work that would be the responsibility of a facilities manager or an architect hired by a private business
Figure 1 summarizes estimated programmatic needs for the Denali NPP transportation asset portfolio which total less than $300000 Transportation facilities generally have relatively small programmatic needs compared to facilities such as visitor centers housing and offices Although not broken out in the historical and forecast data these types of projects are included in the NPS Facility Management Software System (FMSS) as needs Denali NPPrsquos programmatic needs are included in the overall $1242 M per year needs as capital investment or component renewal needs They are classified as capital investment if plans are to proactively address them as individual projects or as component renewal when addressed through a rehabilitation project that focuses on a low condition rating
Figure 1 Denali NPP Transportation Programmatic Needs
Investments by Asset Priority The final classification for investments is what priority of assets they were used to build maintain or repair NPS financial and asset management systems do not support this analysis for the historical or forecast data Each future investment need at Denali NPP is associated with the priority of the asset or the project itself this is shared below in Table 4 For the purposes of this plan Highest Priority is generally defined as Optimizer Band 1 High Priority is defined as Optimizer Band 2 Optimizer bands 3-5 are defined as ldquoother priorityrdquo Although they are not banded as such critical Park Road work is labeled as Highest Priority consistent with the priorities discussed during the investment strategy section later in this report
Table 4 Estimated Annual Needs by Priority
Denali NPP differs from other National Parks and the NPS as a whole due to the relatively low proportion of the total need in the highest
DenaliLongRangeTransportation PlanFinancialTechReportndashFINALDRAFT 8
priority need category Many transportation facilities in Denali NPP have been categorized in optimizer bands 2-5 This reflects the values laid out in Denali NPPrsquos Foundation Statement that place a high priority on investment in resource protection science and other portfolio areas ahead of transportation and broader visitor use needs As a result the park is able to cover its entire highest priority transportation needs given current funding In fact the $775 M per year in forecasted funding is enough to cover 80 of the highest and high priority transportation needs combined However there are still high priority transportation needs that will remain unmet unless additional funding is found and longer-term and lower-priority needs that cannot be met with forecasted funding
Investment Strategies The final step of the financial planning process for NPS LRTP development is the formulation of an investment strategy It is a synthesis of the planrsquos goals and objectives already formulated projects and other transportation-related needs and the reality of the constraints that exist in the current funding environment This section of the report describes the process used by the Denali LRTP team to identify several potential investment strategies including the strategy selected by Denali NPP staff for the Denali LRTP It also discusses potential alternatives which park management may consider if future funding or visitation deviates significantly from the forecast referencing the planning scenarios used in the development of the Denali LRTP
Methodology The key to understanding the funding strategy process is that funding in a constrained environment is a zero-sum game All investment strategies make use of the same $78 M annual funding amount that is forecasted for the near future Because transportation needs exceed this amount and because moving funds from other purposes deprives those projects of needed funding all investment strategies shift funds from one set of priorities to another The OampM strategy option shown in Table 5 for example focuses on staying current on annual operations and preventive maintenance work at the expense of larger repair projects
Unlike the plans for the National Capital Southeast Midwest Regions and the NPS as a whole the Denali LRTP used a single modeling tool to model the results of the different funding strategies on the Denali NPP transportation system A deferred maintenance (DM) FMSS-based tool was modified by a contractor (Booz Alan Hamilton) to work at the unit level and take into account park specific facilities such as the unpaved Park Road This tool uses extracts from FMSS to estimate Facility Condition Index (FCI) and DM outcomes given a known annual funding level The FCI outcomes reported for this effort are lsquoAdjusted FCIrsquo which includes programmatic needs and an anticipated 35 cost markup in addition to the ldquorawrdquo DM normally used in calculation of the FCI
Strategy Development Process
Methodology and Initial Strategy Concepts The team held several workshops and follow-up discussions with NPS stakeholders and partners to identify candidate strategies and to select the Denali NPP LRTP Investment Strategy (p 12) Internal NPS stakeholders included Denali NPP staff Alaska Region staff and the Washington Support Office (WASO) Partner input included expertise from FHWA Western Federal Lands Highway Division and US DOT Volpe Center staff familiar with the NPS LRTP financial planning process
The team worked with stakeholders to identify potential candidate strategies in light of CIS and TCFO policies best practices and past investment patterns (see Table 2 and Table 3) The initial investments strategies are shown in Table 5 below and were based on trends discussed by the project team early on in the Denali LRTP
DenaliLong Range Transportation PlanFinancialTechReportndashFINALDRAFT 9
The reaction to the strategies from park staff indicated high interest in the OampM strategy ndash if the park is able to at least stem the growth in deferred maintenance using its typical transportation funding sources then the park can later seek out additional funds to rehabilitate facilities that are no longer in a state of good repair The specificity of the three strategies that make different kinds of improvements was eliminated in favor of a general ldquomake improvementsrdquo strategy since transit and trails enhanced ITS and safety and emergency response are all priorities at the park that vary from year to year Finally Denali NPP staff noted that given its current condition the unpaved section of the Denali Park Road could still be one of the best unpaved roads in Alaska even with a reduction in maintenance levels so exploring redirecting some funding from the Park Road to other facilities in the park might be
Table 5 Initial Investment Strategy Concepts
Investment Strategy Option
Invests inhellip At the expense ofhellip
Business as usual Highest priority assets Lower priority assets
OampM emphasis Fund 100 of annual OampM needs for all assets Capital investments and rehabilitation
Transit and trails $1 M for existing transit and trails before other investments $1 M for roads and parking
Make improvements $1 M per year for new assetsservices (eg employee transit real-time bus trackers new trails)
$1 M less for annual OampM and rehabilitation
Safety and programmatic needs
Programmatic and safety needs before everything else (eg accessibility slope stability)
$1 M less for annual OampM rehabilitation
a viable option Various sections of the Park Road meet different condition criteria from good to fair to poor
Refined Investment Strategies No one strategy rose above others as a preferred strategy in the first round of modeling but the number of strategies was narrowed to two Both strategies funded all operations and maintenance needs and ensure that planned projects such as the paved Denali Park Road rehabilitation are completed but one option set aside $1 M per year for improvements or new facilities Table 6 below shows the tradeoffs of the two refined general strategies
Table 6 Refined Investment Strategies
Strategy Invests inhellip At the expense ofhellip
Cover all OampM complete planned projects
OampM and critical near-term repair needs
Making improvements
Cover all OampM complete planned projects and reserve $1Myr for improvements
OampM critical near-term repair needs and improving transportation at Denali
Buying down deferred maintenance
Unpaved Denali Park Road Analysis In addition to these two strategies Denali NPP staff also wanted to test whether transportation funds allocated to the unpaved Park Road in a business as usual approach could be shifted to other purposes The LRTP team as well as staff from Denali NPP and the Alaska Region developed five different options for unpaved road condition targets that could be modeled to estimate costs of different sets of conditions Table 7 below summarizes these five sets of condition targets Each of the two general strategies were tested using the five sets of condition targets for a total of ten investment strategy and condition results The strategies in Table 7 highlighted in red were not achievable give projected funding levels and established higher priorities
DenaliLong Range Transportation PlanFinancialTechReportndashFINALDRAFT 10
Table 7 Unpaved Park Road Conditions
Strategy Goals Annual Cost
Plan A Maintain all Park Road segments in good condition $43 M
Plan B Maintain all Park Road segments in fair condition $37 M
Plan C Set Park Road conditions from segment to segment recognizing that some segments are costlier to maintain in good condition than others
$29 M
Plan D Follow the VMPrsquos ldquotelescopingrdquo approach by keeping conditions good in the first part of the road fair in the middle part and poor at the western end
$25 M
Plan E Follow the VMPrsquos ldquotelescopingrdquo approach by keeping conditions good to fair in the first to middle parts of the road and poor at the western end
$27 M
Plan F VMP ldquotelescopingrdquo approach as in Plan E but with further lowered condition targets for two of the most expensive areas - MP 43-47 and MP 88-92
$20 M
Refined Strategy Results
general strategy was discarded Even without reserving $1 M per year projected funding is insufficient to meet the good to fair
Unlike the initial strategies several of the refined strategies were not viable None of the condition targets on the unpaved Park Road could be met if Denali NPP was to reserve $1 M per year for making improvements elsewhere on the park and so that
conditions proposed under plans A and B for the unpaved park road without scaling back commitments to OampM planned repaving of the paved sections of the Park Road and the rest of Denali NPPrsquos transportation facilities Additional funding could make Plans A and B possible ndash about $13 M per year more would allow for Plan A to be achieved and $07 M more per year would allow plan B to be achieved
Plans C D E and F are viable given currently constrained funding levels Plan C shows that it is possible to meet all of the investment strategyrsquos commitments and still maintain the unpaved Park Road on a segment-by-segment basis The conditions explored in Plan C take the relative expensive of each segment into account and the most difficult segments are allowed to remain in fair to poor condition However modeling showed that meeting these conditions would provide almost no funding for other transportation priorities
Plan D applies the Vehicle Management Planrsquos ldquotelescopingrdquo approach to the maintenance of the unpaved Denali Park Road and targets mid-poor condition for the farthest west segments which are intended to be more rustic and less traveled but keeps the middle and eastern segments in fair to good condition Under this plan nearly $05 M per year would be available for other transportation priorities Plan E made slight changes to keep more of the road in good condition instead of fair
Plan F was ultimately selected as the condition target for the Denali NPP LRTP This option retains the approach of Plan E but reduces condition targets for two sections which are particularly challenging and expensive to maintain Under plan F Polychrome Pass would be improved slightly (but still be in poor condition) while the final stretch of the park road would be allowed to decline to poor condition These two changes free about $06 M per year for use elsewhere on the road and in Denali NPP More information about these two segments is provided in Appendix A at the end of this technical report
Denali LRTP Investment Strategy The refined strategy results narrowed down the policy options for the unpaved Park Road and led to the selection of the Denali LRTP Investment Strategy as the best fiscally-constrained option for meeting the goals and objectives of the plan This strategy
DenaliLong Range Transportation PlanFinancialTechReportndashFINALDRAFT 11
would invest Denalirsquos forecasted $775 M per year in four categories as shown below in Table 8 and Error Reference source not found below
Table 8 Denali NPP LRTP Investment Strategy
Category Estimated share Estimated annual Percentage of of annual funds investment needs met
Operations and Preventive 37 $29 M 100 of needs Maintenance (all met transportation assets)
Rehabilitate Paved Portion of 24 $19 M 100 of needs the Denali Park Road met
Repair and Maintain the 26 $ 20 M 46 of needs met Unpaved Portion of the Denali Park Road
Repair and Improve Other 13 $ 10 M 24 of needs met High-Priority Transportation Assets
Totals 100 $ 78 M 63 of all needs met
The Denali LRTP Investment Strategy strikes a balance between several different priorities for transportation at the park and lies within the ldquoManagement Actions of No Regretrdquo area of the Denali LRTP scenario chart The strategy proposes to fully fund OampM needs in order to slow the decline of facilities and ensure a better visitor experience It continues planned investments on the paved section of the Park Road to achieve a good condition rating and continues to make funding available to address deferred maintenance on the unpaved sections of the Park Road However the strategy sets lower condition targets for sections of the unpaved Park Road which are further into the park and which are less traveled by visitors in order to reserve funding for other segments of the Park Road and for entrance area transportation facilities (eg aviation parking areas new priorities) This approach is consistent with the Vehicle Management Plan which envisions lower traffic volumes and a more rustic experience the further the road extends from the park entrance area
Ultimately because funding needs exceed available resources the condition of transportation facilities at Denali NPP is expected to decline overall FCI ratings across the Denali NPP transportation system today are modeled at 0148 or the low end of fair condition Continued scarce funding for transportation will reduce conditions to 0185 by 20215 However higher priority transportation facilities are expected to remain in fair condition overall as described by the Investment Strategy
5 FCIratings are modeled on a 0‐1 scalewhere0000isperfect conditionand1000iscompletelydegradedcondition
DenaliLong Range Transportation PlanFinancialTechReportndashFINALDRAFT 12
DenaliLRTPInvestment Strategy 13
37
26
24
OperationsandPreventiveMaintenance(all transportationassets)
RehabilitatePavedPortionoftheDenaliParkRoad
RepairandMaintaintheUnpavedPortion ofthe Denali Park Road
RepairandImproveOtherHigh‐PriorityTransportationAssets
The funding forecast in the Denali LRTP is only the most likely scenario for each program and in reality the amount of annual transportation funding will vary as will visitation Table 9Error Reference source not found below shares some management actions for when funding and visitation levels take Denali NPP out of the area of management actions of no regret Generally when visitation is lower it is a better time for disruptive work such as addressing major needs and accomplishing maintenance projects that were deferred Times of high visitation call for more investment in OampM and investment in new services to meet emerging visitor needs When funding prospects are good then more money is available to make improvements catch up on deferred maintenance and prepare plans for the future When funding is short then many necessary improvements have to be delayed and park staff can only fund core operations and critical repair work
Figure 2 Denali LRTP Investment Strategy
Denali Investment Strategy and LRTP Scenarios All of the funding strategies considered for the Denali NPP LRTP assumed the same funding forecast and would fall within the ldquoManagement Actions of No Regretrdquo area on the scenario planning graphic reproduced in Error Reference source not found below This area represents a balance between times of high and low visitation and high and low funding for the park It is calibrated based on an average of funding and visitation over time Years within one standard deviation of these means lie within it if they are more than one standard deviation away from the average then they are said to be in one of the four ldquoquadrantsrdquo
DenaliLong Range Transportation PlanFinancialTechReportndashFINALDRAFT
Figure 3 Denali LRTP Scenarios
13
Table 9 Potential Management Actions by Scenario
Losing Ground Popular Park
Emphasize more of Funding OampM Introducing new services
Emphasize less of Making improvements Funding deferred maintenance Initiating major capitalrehabilitation projects
Emphasize more of Funding OampM Making improvements Introducing new services Planning for future needs
Emphasize less of Funding deferred maintenance Initiating major capitalrehabilitation project
Turn out the lights Surplus of Money
Emphasize more of Funding deferred maintenance
Emphasize less of Funding OampM Making improvements Introducing new services
Emphasize more of Making improvements Funding deferred maintenance Initiating major capitalrehabilitation projects Planning for future needs
Emphasize less of Funding OampM Introducing new services
14DenaliLong Range Transportation PlanFinancialTechReportndashFINALDRAFT
Appendix A Unpaved Park Road Condition Targets
Unpaved Denali Park Road Condition Targets Plans C D and E for the unpaved Denali Park Road examined options for managing each segment of the road to an individually set condition target Each of these targets is based on the overall Vehicle Management Plan and accounts for past challenges or known issues with individual segments Plan F was ultimately selected for its ability to maintain acceptable condition levels while also freeing up funding for other transportation needs In particular Plan F was selected because the condition targets reflect the overall management approach to the road where the western-most sections are desired to be more rustic and remote-feeling and the eastern-most sections are in better conditions to handle more intensive use Tables 10 and 11 below summarizes the conditions for the unpaved segments of the Denali Park Road under the Denali LRTP investment strategy
Conditions are measured in FCI where a higher value represents worse condition and a lower value represents better condition FCI data for the unpaved Park Road is based on estimates by staff responsible for maintaining the unpaved Park Road after the 2016 opening
Table 10 Conditions of Unpaved Segments of Denali Park Road Reflected in Denali LRTP Investment Strategy
Mileposts Segment Name Current Condition
Target Condition
Change in Condition
MP 15 to 32 Savage to Teklanika Bridge Low‐good High‐fair Small decline MP 32 to 39 Igloo Forest to Sable Pass Mid‐fair High‐fair Small improvement MP 39 to 43 Sable Pass to East Fork Bridge Mid‐fair High‐fair Small improvement MP 43 to 47 Polychrome to Plains of Murie Mid‐poor High‐poor Small improvement MP 47 to 62 Plains of Murie to Stony Overlook Mid‐fair Low‐fair Small decline MP 62 to 66 Stony Overlook to Eielson Low‐fair Low‐fair No change MP 66 to 70 Eielson to Grassy Pass High‐poor Mid‐poor Small decline MP 70 to 88 Grassy Pass to Boundary Pit Mid‐fair Mid‐poor Moderate decline MP 88 to 92 Boundary Pit to Kantishna Very‐poor Low‐poor No change
DenaliLong Range Transportation PlanFinancialTechReportndashFINALDRAFT 15
Table 11 Denali Unpaved Park Road Segments ‐‐Current Conditions and Strategy Conditions Explored During LRTP Development
Plan A Plan B Plan C
Plan A Plan B Plan B Plan C Current Desired Plan A Strategy Annual Strategy Plan C
Mileposts Segment Name Conditions Conditions Annual Needs Conditions Needs Conditions Annual Needs
MP 15 to 32 Savage to Teklanika Bridge 009 0109 $ 013 M 013 $ lt01 M 0109 $ 013 M
MP 32 to 39 Igloo Forest to Sable Pass 013 0109 $ 014 M 012 $ 011 M 0129 $ 093 M
MP 39 to 43 Sable Pass to East Fork Bridge 013 0109 $ 0 24 M 013 $ 020 M 0139 $ 019 M
MP 43 to 47 Polychrome to Plains of Murie 035 0109 $ 120 M 014 $ 110 M 0245 $ 074 M
MP 47 to 62 Plains of Murie to Stony Overlook 013 0109 $ 070 M 013 $ 056 M 0139 $ 052 M
MP 62 to 66 Stony Overlook to Eielson 014 0109 $ 025 M 014 $ 020 M 0139 $ 0 20 M
MP 66 to 70 Eielson to Grassy Pass 017 0109 $ 044 M 014 $ 037 M 0169 $ 030 M
MP 70 to 88 Grassy Pass to Boundary Pit 012 0109 $ 056 M 012 $ 051 M 0169 $ 0 32 M
MP 88 to 92 Boundary Pit to Kantishna 0499 0109 $ 072 M 014 $ 068 M 0324 $ 043 M
Total MP 15 to 92 Total Total $ 435 M Total $ 376 M Total $ 293 M
Plan D Plan E Plan F (Selected)
Plan D Plan E Plan E Plan F Current Strategy Plan D Strategy Annual Strategy Plan F Annual
Mileposts Segment Name Conditions Conditions Annual Needs Conditions Needs Conditions Needs
MP 15 to 32 Savage to Teklanika Bridge 009 0109 $ 013 M 0109 $ 013 M 109 $ 013 M
MP 32 to 39 Igloo Forest to Sable Pass 013 0109 $ 014 M 0109 $ 014 M 109 $ 014 M
MP 39 to 43 Sable Pass to East Fork Bridge 013 0109 $ 024 M 0109 $ 024 M 109 $ 024 M
MP 43 to 47 Polychrome to Plains of Murie 035 0149 $ 11 M 0149 $ 11 M 245 $ 074 M
MP 47 to 62 Plains of Murie to Stony Overlook 013 0149 $ 047 M 0149 $ 047 M 149 $ 047 M
MP 62 to 66 Stony Overlook to Eielson 014 0149 $ 018 M 0149 $ 018 M 149 $ 018 M
MP 66 to 70 Eielson to Grassy Pass 017 0325 $ - 0325 $ - 325 $ -
MP 70 to 88 Grassy Pass to Boundary Pit 012 0325 $ - 0325 $ - 325 $ -
MP 88 to 92 Boundary Pit to Kantishna 0499 0325 $ 043 M 0325 $ 043 M 449 $ 012 M
Total MP 15 to 92 Total Total $ 266 M Total $ 266 M Total $203 M
Plan F Unpaved Road Segments The final change that the LRTP team made while discussing the road strategies with park staff was to lower the condition targets for two of the most difficult segments along the unpaved Park Road This section describes these two segments and how accepting a lower condition in these areas can allow for better conditions on other parts of the Denali NPP transportation system
Mileposts 43 to 47 Polychrome Pass to the Plains of Murie The unpaved Denali Park Road segment of Polychrome Pass to the Plains of Murie has been identified by Denali NPP staff as especially difficult to maintain and repair It is facing significant geotechnical hazards that will worsen as time goes on and climate
DenaliLong Range Transportation PlanFinancialTechReportndashFINALDRAFT 16
change accelerates permafrost thaw Making improvements to this section that would take it from the middle of the poor condition band to the low end of fair condition band as explored in Plan D is projected to cost $107 M per year Making lesser improvements from the middle of the poor condition band to the high end of the poor condition band as called for in Plan C would cost $074 M per year instead saving $033 M per year for other uses Thus the selected strategy (Plan F) will target a condition rating at the high end of the poor band instead of a fair rating as with other segments in the central segment of the unpaved Denali Park Road (Igloo Forest to Eielson Visitor Center) This is not an ideal or desired condition for this segment but reflects the challenges of working in this area given limited funding
Mileposts 88 to 92 Boundary Pit to Kantishna The final segment of the unpaved Denali Park Road is currently at the very low end of poor condition and is bordering on severe condition All of the alternative unpaved road plans propose to improve this section However improving the condition from the low end of poor condition to the middle of poor condition as explored in plans C and D is projected to cost $043 M per year Investing this much in one of the least-utilized segments of the Denali Park Road would limit funds for critical investments elsewhere As a result the Denali Investment Strategy proposes lesser improvements at a cost of $012 M per year
DenaliLong Range Transportation PlanFinancialTechReportndashFINALDRAFT 17
National Park Service US Department of the Interior
Denali National Park and Preserve Long-Range Transportation Plan
Appendix G Project Selection Checklist
DENA LRTPProjectSelectionCriteriaChecklist Project Name
PMIS Funding Source(s)
1 Long Range Transportation Plan ndash the project generally adheres to the following
National Long Range Transportation Planrsquos Goals and Objectives (see Attachment A)
Asset Management Transportation Finance Resource Protection
Visitor Experience Safety
Alaska Regional Long Range Transportation Planrsquos Goals and Objectives (see Attachment B)
System Management Mobility User Experience
Resource Protection Climate Change
Denali NPP Long Rang Transportation Planrsquos ldquoactions of no regretrdquo (see Attachment C)
Goal Area ____________________________ Action of No Regret __________
2 Financial Strategy ndash the project meets the following
Capital Investment Strategy score ______________
optimizer band 1 2 3 4 5
Consistent asset investment based on scenario quadrant position (Attachment D)
Consistent with proportionate investment within road management zones (Attachment D)
Milepost or Road Segment ______________________
Consistent with one or more of the following
Operations and Maintenance (OampM)
Rehabilitated Paved Road
Repair amp Maintain the Unpaved Road
Repair amp Improve Other High‐Priority Transportation Assets (bridges transportationmultimodal trail)
3 Risk Priority
Response to current high priority risks based on documented assessment (Attachment E)
Unstable Slopes
River and Stream Flooding
1
Permafrost Subsidence
Culverts ndash Operations and Maintenance (OampM)
Gravel Production Processing or Purchase
Relevance or proximity to mapped hot spot (see Attachment F)
‐ Attachment F should have all the hot spots for Park Road on a map Is this in DNPP LRTP Or do we
give them a link for online info
4 Operations and Maintenance
Investment Type ndash this project is a
New Investment ‐ offset in the cost of OampM
(presumed increase has been addressed by ____________________________________________________)
Replaced investment ‐ offset in the cost of OampM
(presumed decrease or net zero increase has been addressed by ___________________________________)
Eliminated Investment ndash offset in the cost of OampM
(presumed decrease has been addressed by ____________________________________________________)
2
National Park Service US Department of the Interior
Denali National Park and Preserve Long-Range Transportation Plan
Appendix H Public Comment Summary
Public Comment Summary Denali National Park and Preserve Long-Range Transportation Plan
Public comments are organized into two categories common and specific Common comments are
paraphrased themes that appear in multiple comment submissions Responses to common comments
are summarized in Table 1 Specific comments request a particular change When specific comments
seek changes that are accurate reasonable feasible and logically consistent they were made and
included in the final document Other comments include general statements about the quality of the
document suggestions for future plans or ideas for coordination next steps management strategies
park priorities or projects These comments are valued and are available to inform other park planning
efforts and will be referenced during the leadup to this planrsquos eventual update
Table 1 Common Comment
Paraphrased Comment Comment Response
1 Winter or offseason travel is not sufficiently represented in the plan
During the development of this plan numerous issues and needs surfaced as topics that warrant further study and consideration Public comments were an especially meaningful source for identifying topics in need of additional attention These findings will be used to inform the development of the planrsquos update as well as other plans such as the Winter Recreation Plan
2 There is insufficient data or information regarding specific transportation related conditions (eg trail crowding locations of specific facilities rest stop vehicle counts large vehicle counts winter routes locations etc)
The plan relied on facts data and concepts cited in existing park plans studies and other reports No additional data collection or data analysis was conducted as part of this planrsquos development process As such present day conditions or terminology may differ from those described in the plan Gaps in data and understanding will be reassessed in this planrsquos update
3 The plan does not map specific transportation use access facilities for the entirety of the planrsquos 20-year horizon
As a high-level strategic document the plan is not intended to identify specific short-term or long-term project needs or changes park access locations
1
Paraphrased Comment Comment Response
4 If a specific need is not mentioned in the plan (eg backcountry landing strip location) it means that the specific need will be precluded from future project selection and funding
The plan is a high-level strategy document and is not intended to identify and prioritize specific projects While the plan sets high-level goals that are used to evaluate the merits of future projects it is not a project list Whether or not a specific project idea is listed in this plan has no bearing on its ability to be developed or its funding merits
5 The plan does not describe specific actions that the park will take to address a very specific issue (eg plans to address the safety of backcountry landings strips in light of climate change cycling guidelines commercial use authorization for guided hikes off Park Road new parking lot locations more tours etc)
During the development of this plan numerous issues and needs surfaced as topics that warrant further study and consideration Public comments were an especially meaningful source for identifying topics in need of additional attention These findings will be used to inform the development of the planrsquos update
6 Data facts or terminology used in the plan appear to be out dated
The plan relied on facts data and concepts cited in existing park plans studies and other reports No additional data collection was conducted as part of this planrsquos development process As such present day conditions or terminology may differ from those described in the plan
7 The plan does not sufficiently outline specific actions to maintain and improve the parkrsquos soundscape
During the development of this plan numerous issues and needs surfaced as topics that warrant further study and consideration Public comments were an especially meaningful source for identifying topics in need of additional attention These findings will be used to inform the development of the planrsquos update
8 The plan does not go far enough in offering solutions that address threats to park access created by climate change and natural disasters
During the development of this plan numerous issues and needs surfaced as topics that warrant further study and consideration Public comments were an especially meaningful source for identifying topics in need of additional attention These findings will be used to inform the development of the planrsquos update
9 The plan does not go far enough to protect resources
During the development of this plan numerous issues and needs surfaced as topics that warrant further study and consideration Public comments were an especially meaningful source for identifying topics in need of additional attention These findings will be used to inform the development of the planrsquos update
2
Paraphrased Comment Comment Response
10 The plan does not go far enough to protect access
During the development of this plan numerous issues and needs surfaced as topics that warrant further study and consideration Public comments were an especially meaningful source for identifying topics in need of additional attention These findings will be used to inform the development of the planrsquos update
11 Goal andor objective indicators or performance measures are too limited
The plan relied on readily available data and findings cited in existing park plans studies and other reports No additional indicator data was collected as part of this planrsquos development The need for additional data for informing additional indicators will be considered for the planrsquos update
12 Specific details from the Vehicle Management Plan are not reflected in this plan
The long range transportation plan does not supersede the Vehicle Management Plan in any way Omission of Vehicle Management Plan data indicators and conclusions does not negate their significance in how the park is managed
3
- Appendix A - Literature Review Summary Report (1)
- Appendix B - Denali Long-Range Transportation Planning and Acoustic Resources (2)
- Appendix C - Denali Park Road Risk Assessment Utilizing the Unstable Slope Management Program (1)
- Appendix D - Current and Future Partner Projects (3)
- Appendix E - Park Transportation Investment Needs Analysis (1)
-
- Structure Bookmarks
-
- Denali National Park and PreserveLong-Range Transportation Plan
- Appendix EPark Transportation Investment Needs Analysis
- ABSTRACT
- INTRODUCTION
- PATINA DESIGN
- OVERVIEW
- VEHICLE MANAGEMENT PLAN
- VECTOR ANALYSIS
- DATA COLLECTION
- TRANSPORTATION NETWORK
- ASSET METRICS
- HIGH RISK
- INVESTMENT RANKING
- GOAL AREAS
- METHODOLOGY
- DATA PREP
- LAYER WEIGHTING
- COMPOSITE ANALYSIS STEPS
- SELECTED RESULTS
- OUTPUTS
- ROAD SEGMENT FINDINGS
- Motorized Paved Zone
- Wildlife Viewing Subzone 1
- Wildlife Viewing Subzone 2a
- Wildlife Viewing Subzone 3
- Wildlife Viewing Subzone 2b
- DISCUSSION
- INTERNAL WEIGHTING
- SKEWED DATA
- SPATIAL SPREAD OF DATA
- NEXT STEPS
-
- Appendix F _ Denali Funding Plan
- Appendix G - Project Selection Checklist
- Appendix H - Comment Responses (1)
-
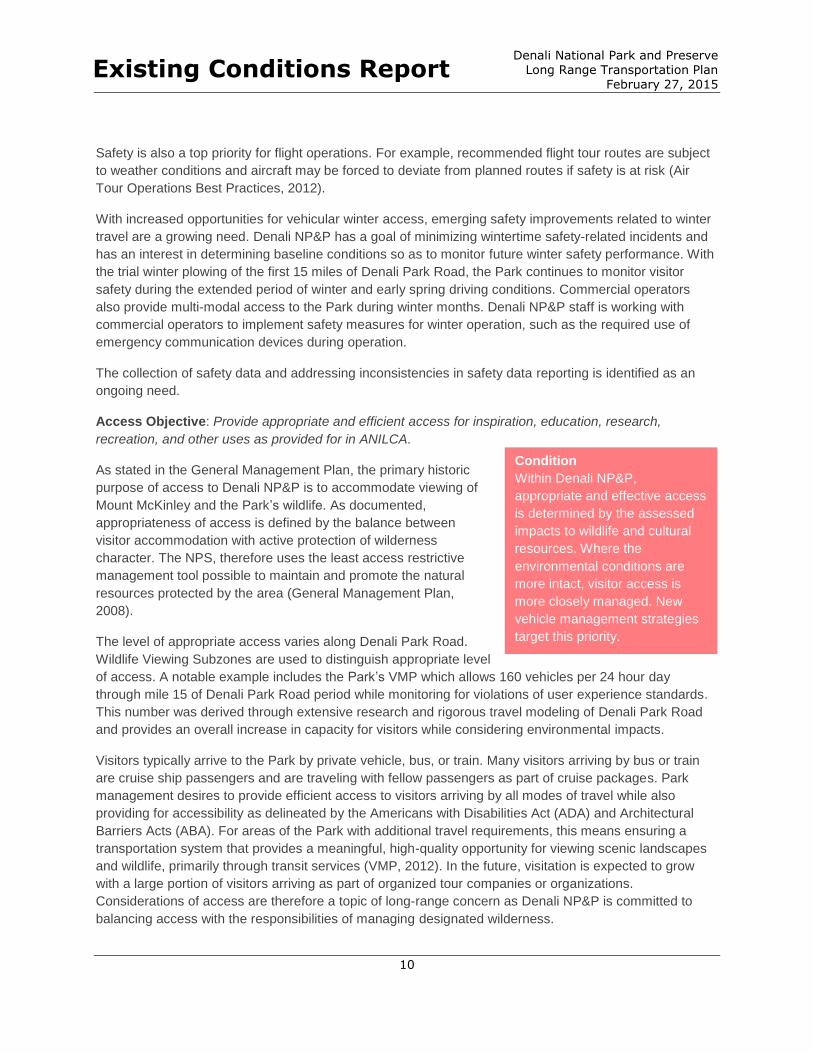
Denali National Park and Preserve Long Range Transportation Plan Existing Conditions Report
February 27 2015
Safety is also a top priority for flight operations For example recommended flight tour routes are subject
to weather conditions and aircraft may be forced to deviate from planned routes if safety is at risk (Air
Tour Operations Best Practices 2012)
With increased opportunities for vehicular winter access emerging safety improvements related to winter
travel are a growing need Denali NPampP has a goal of minimizing wintertime safety-related incidents and
has an interest in determining baseline conditions so as to monitor future winter safety performance With
the trial winter plowing of the first 15 miles of Denali Park Road the Park continues to monitor visitor
safety during the extended period of winter and early spring driving conditions Commercial operators
also provide multi-modal access to the Park during winter months Denali NPampP staff is working with
commercial operators to implement safety measures for winter operation such as the required use of
emergency communication devices during operation
The collection of safety data and addressing inconsistencies in safety data reporting is identified as an
ongoing need
Access Objective Provide appropriate and efficient access for inspiration education research
recreation and other uses as provided for in ANILCA
Condition As stated in the General Management Plan the primary historic
Within Denali NPampP purpose of access to Denali NPampP is to accommodate viewing of
appropriate and effective access Mount McKinley and the Parkrsquos wildlife As documented
is determined by the assessed appropriateness of access is defined by the balance between
impacts to wildlife and cultural visitor accommodation with active protection of wilderness
resources Where the character The NPS therefore uses the least access restrictive
environmental conditions are management tool possible to maintain and promote the natural
more intact visitor access is resources protected by the area (General Management Plan
more closely managed New 2008)
vehicle management strategies
target this priority The level of appropriate access varies along Denali Park Road
Wildlife Viewing Subzones are used to distinguish appropriate level
of access A notable example includes the Parkrsquos VMP which allows 160 vehicles per 24 hour day
through mile 15 of Denali Park Road period while monitoring for violations of user experience standards
This number was derived through extensive research and rigorous travel modeling of Denali Park Road
and provides an overall increase in capacity for visitors while considering environmental impacts
Visitors typically arrive to the Park by private vehicle bus or train Many visitors arriving by bus or train
are cruise ship passengers and are traveling with fellow passengers as part of cruise packages Park
management desires to provide efficient access to visitors arriving by all modes of travel while also
providing for accessibility as delineated by the Americans with Disabilities Act (ADA) and Architectural
Barriers Acts (ABA) For areas of the Park with additional travel requirements this means ensuring a
transportation system that provides a meaningful high-quality opportunity for viewing scenic landscapes
and wildlife primarily through transit services (VMP 2012) In the future visitation is expected to grow
with a large portion of visitors arriving as part of organized tour companies or organizations
Considerations of access are therefore a topic of long-range concern as Denali NPampP is committed to
balancing access with the responsibilities of managing designated wilderness
10
Denali National Park and Preserve Long Range Transportation Plan Existing Conditions Report
February 27 2015
At the time that the Denali Park Road Visitor Survey (2010) was conducted 71 percent of visitors who
traveled beyond mile 15 were part of organized tours (ie Long Tour) These are highly interpretive trips
with designated stops at rest areas and impromptu stops for wildlife viewing Non-tour transit buses
traveling past mile 15 provide less interpretation and make impromptu stops for hikers and wildlife
viewing
Coordination with the visitor services concessioner is ongoing and the relationship between Denali NPampP
and any concessioner is viewed as integral to providing appropriate and effective access for Park visitors
User Information Objective Provide accurate and accessible information through a variety of means
about how to travel to and within Denali National Park and Preserve
The NPS is interested in providing information to potential and Condition repeat users about its transportation system and services at a Commercial and state tourism national regional and local level The Alaska Federal Lands LRTP initiatives are successful in and NPS Alaska Region LRTP summarize objectives and providing travel information to strategies that specifically address providing accurate and visitors prior to their arrival at accessible information for travel to and within federal lands and the Park Once at Denali NPampP several projects to enhance visitor information services the Park its concessioners and
local businesses provide Much of the marketing and development of traveler information for
interpretation through visitor Denali NPampP is championed by non-NPS organizations such as
centers transit and tour bus the Alaska Railroad concessioners and other area businesses
operations and many others Because Denali NPampP is a regular destination for commercial tour
Interpretation and transit system operations much of the information provided to potential visitors
visitor information improvements and visitors en route to the Park is provided by those organizations
are desired According to the Denali Park Road Visitor Survey issued in 2010
over half of the Denali NPampP transit users had received information from a travel agent about their visit to
the Park Another third of the respondents received information over the internet Denali NPampP maintains
a website with virtual tours guides and resources to help visitors plan trips to the Park Travel guides and
tour books are also popular means of learning about how to travel to and within Denali NPampP (NPS
Alaska Region LRTP 2012)
Traditional means for providing information at visitor centers and Wilderness Access Center are available
upon entering Denali NPampP Once aboard the short-tour and long-tour buses visitors have a wide range
of information available Tour bus drivers and guides provide extensive interpretation while transit drivers
may provide information upon request and at the discretion of a particular driver Several Denali NPampP
plans document the value of retaining experienced drivers This was seen as a major enhancement to the
overall visitor experience (Denali NP Bus Shuttle System Analysis 2013)
The most common need identified in planning documents is the necessity for better wayfinding and user
information about transit in hopes of reducing visitor confusion with the Parkrsquos transportation system
According to the VMP an objective of Denali NPampP management is to ldquoclearly communicate information about the system through a variety of meansrdquo Potential options for sharing information include improving
traditional methods such as maps brochures and signage The Alaska Region is also interested in newer
media options such as implementing intelligent transportation systems linked with websites mobile
devices and other personal communication technology According to a survey in 2010 transit users were
11
Denali National Park and Preserve Long Range Transportation Plan Existing Conditions Report
February 27 2015
not interested in receiving information from a recorded narrative about traveling Denali Park Road
Information delivered by bus drivers was preferred over prerecorded methods
Also with the introduction of enhancements to the off-season access programs Denali NPampP
management is interested in reducing the perception that the Park is closed during off-seasons by
increasing communications about opportunities for visiting the Park during the winter
35 System Management Goal
Develop a long-term transportation system to appropriately satisfy current and future land
management needs
Asset management Objective Apply available financial resources to essential transportation
infrastructure
Relative to other parks in the Alaska Region transportation assets
within Denali NPampP are some of the most costly This is primarily
due to Denali Park Road maintenance needs providing visitor
transit and tour services and experiencing the high visitation levels
during a very short summer season
In general transportation assets within Denali NPampP are
considered to be in good condition Road work is mainly
concentrated on bridge replacement road maintenance and
subgrade improvements In general road widening does not occur
However improving pullouts on the narrowest section of the road
to maintain safety standards des exist in asset planning
documentation The annual operations and maintenance budget for
road assets in Denali NPampP was approximately $12 million in 2010
(NPS Alaska Region LRTP 2012)
Denali NPampP management uses both quantitative and qualitative
measures to prioritize transportation system improvements The
2008 General Management Plan prioritizes road improvement
projects ranking corrective safety projects as the highest priority and other corrective maintenance and
repairs as secondary priorities The General Management Plan provides example projects from Denali
Park Road where potential improvements have been identified for multiple project categories (sight
distance improvements safe vehicle passing enhancements road surface friction improvements culvert
repairs etc) Denali NPampP has incorporated the NPS ldquooptimizer bandrdquo model of asset prioritization In
this model assets are scored by Asset Priority Index (API) to rank how critical assets are used in
accomplishing the Parkrsquos mission and goals In this model Facility Condition Index (FCI) indicates asset
condition and is used to determine eligible fund sources Projects are evaluated based upon their APIFCI
rank Using this method of asset evaluation all of the high priority assets (API of 75 or higher) are in good
or better condition (FCI of 03 or less) (Alaska Federal Lands LRTP 2012) Finally the asset needs are
filtered through the NPS Capital Investment Strategy (CIS) which expresses priorities in the form of
optimizer bands Optimizer bands 1 and 2 are associated with assets that are essential or extremely
important for a park to continue as described in its organic legislation
Condition
The availability of funds
particularly for funding transit
systems has decreased in
recent years Denali NPampP
management is using
quantitative and qualitative
indicators about the
transportation system to
prioritize transportation system
improvements With limitations
to increasing system capacity
Denali NPampP management is
working toward increased
system efficiency and better
coordination with transportation
partners
12
Denali National Park and Preserve Long Range Transportation Plan Existing Conditions Report
February 27 2015
There is a general funding gap projected into the future The most recent congressionally authorized
transportation funding bill Moving Ahead for Progress in the 21st Century (MAP-21) reduces funding for
the NPS transit systems by approximately 28 percent from the previous federal transportation legislature
(Alternative Funding Opportunities for NPS Transit 2014) Regional funding assessments show an
annual funding gap of $720000 for Alaskan ldquoroad parksrdquo the category which Denali NPampP is included
Although park-level funding shortages are not yet documented for Denali NPampP a large portion of the
Alaska Regionrsquos transportation assets are located in Denali NPampP Elimination of the Transportation
Improvement Program (TRIP) has made funding multimodal systems such as the Parkrsquos concessioner-
operated transit more challenging (Alternative Funding Opportunities for NPS Transit 2014)
Because the transit system is operated by a for-profit concessionaire it is not eligible for transportation
funding through MAP-21 however several FHWA funding and grant programs are still applicable and
partnerships with local government cooperation and partnership could increase funding eligibility
Park management is also very interested in finding efficiencies within its current asset portfolio
completing operational modifications that improve the transportation system and promoting the Parkrsquos purpose Recent examples of this include new vehicle management strategies provided in the VMP and
wintertime operation improvements
Asset Investment Planning Objective Consider sustainability of operation and maintenance of new
and existing assets in the planning process
The NPS includes asset investment planning in much of its recent Condition transportation planning documentation At a regional level the NPS Denali NPampP managers are very is using measurements that feed into asset planning processes involved with asset planning for such as total cost facility ownership as well as the project
transportation system prioritization tools mentioned earlier Several strategies identified in maintenance and operations the Alaska Federal Lands LRTP promote asset planning through Relative to other parks in the collaboration with other federal land management agencies and region Denali NPampP has high Alaska Department of Transportation and Public Facilities deferred maintenance needs consideration of lifecycle costs and evaluation of maintenance
resulting largely from challenges costs versus investments in new infrastructure associated with maintaining
Denali Park Road Maintenance In 2010 deferred maintenance in Denali NPampP accounted for 65
and operation are constantly percent approximately $20 million of all deferred maintenance of
weighed against environmental transportation assets in the Alaska Region Deferred maintenance
conservation priorities issues within Denali NPampP could be addressed by treating the
underlying cause of the road failures to reduce the need for
repetitive maintenance according to the General Management Plan
Documents suggest that road repairs and maintenance should follow the 2005 Denali NPampP Road
Maintenance Repair and Operating Standards and the 2007 Denali NPampP Road Design Standards The
total planned transportation assets for Denali NPampP include improvements to access roads parking lots
non-motorized routes and other transportation infrastructure These planned assets are valued at $64
million (NPS Alaska Region LRTP 2012)
13
Denali National Park and Preserve Long Range Transportation Plan Existing Conditions Report
February 27 2015
In terms of operational needs Park managers are actively participating in day to day management of
transit operations and are able to make adjustments based on demand For example real-time
monitoring of the transit system allows the concessionaire to track transit vehicle occupancy and dispatch
additional vehicles during peak demand for return trips Denali NPampP is also actively investigating
opportunities for gaining efficiency in their transit and in their entrance fee collection program
As it is with other goal area topics effective operation and maintenance is balanced with environmental
protection In planning documents the Denali NPampP management is constantly balancing expectations of
visitor experience and safety with deference to natural resource objectives
Coordination Objective Coordinate with local organizations to ensure that nearby transportation
projects are planned with NPS involvement to the mutual benefit of all parties
Coordination with federal state and local agencies is seen as an Condition opportunity for funding and project implementation as well Coordination with federal state managing concessionaire services and expanding local visitor local and private transportation services An ongoing federal land management agency agencies is seen as a need for coordination team was formed as a result of the 2012 Alaska optimizing asset management Federal Lands LRTP The group actively works to coordinate because 21 percent of the transportation project planning across Alaska including in and transportation assets are owned around Denali NPampP These efforts could help organize interest in by non-NPS agencies expanding transit services outside of the Park which is a frequently
cited coordination need as determined by the literature review and
comments from Park staff during LRTP discussions
Needs and opportunities for coordinating with private entities are somewhat unique to Denali NPampP
Denali NPampP is the only park in the Alaska Region to have transportation assets that are not owned by
the NPS Twenty-one percent of the transportation assets in the Park are owned and operated by
concessionaires or owned by others There is a desire to expand partnerships to include other local
businesses and eventually local government agencies The 2006 Needs Assessment and Feasibility
Study for a Community Transportation System provides alternatives for organizing such efforts
Other coordination efforts include involving air tourism operators regular communication with tribal
organizations and land inholders and coordinating access with other area landholders and transportation
agencies such as the Alaska Department of Transportation and Public Facilities
14
Denali National Park and Preserve Long Range Transportation Plan Existing Conditions Report
February 27 2015
4 Conclusions
Common themes encountered throughout the literature review process provide several general baseline
conditions for Denali NPampP These include
Resourc
e P
rote
ctio
n
Clim
ate
Change
User
Experie
nce
Mo
bili
ty
Syste
m M
anagem
ent
The historic character of Denali Park Road and the management thereof are important
factors influencing access and mobility
Denali NPampP is a primary attraction for tourists Many visits are rushed due to the
logistics of popular packaged Alaska tours Visitation is anticipated to increase as tour
companies continue to promote and expand travel options to the Park
With anticipated visitation increases and associated use of the transportation system
Denali NPampP managers may face ongoing decisions about how to best protect the Parkrsquos natural resources as congestion grows and the capacity of Denali Park Road and
transportation system is tested
Travel options are sometimes viewed as limited within the Park but some multimodal
enhancements could increase safety particularly for bicycling and hiking opportunities
The general condition of the transportation system is good but priorities are complex
both in terms of balancing maintenance needs with the care for natural resources and
providing access to view designated wilderness areas
Recent changes to Denali Park Road vehicle management and operations system are
intended to advance the NPSrsquos emerging outcome-driven planning processes As more
data becomes available Denali NPampP managers can better set performance indicators
for operations
Existing transportation plans do not contain much information about climate change but if
the actions recommended and cited in the NPS Alaska Region LRTP are followed there
may be more opportunities to include unit-level strategies for addressing climate change
into asset planning and operation With ongoing progression toward a CFP certification
Denali NPampP is well positioned to incorporate these objectives at a unit-level
15
National Park Service US Department of the Interior
Denali National Park and Preserve Long-Range Transportation Plan
Appendix B Denali Long-Range Transportation Planning and Acoustic Resources
1
Denali Long Range Transportation Planning and Acoustic Resources
Davyd_Betchkalnpsgov NPS Alaska Region Soundscape Specialist Biologist 907‐683‐5754
Research Sets the Stage
Author Eli Seigel wrote in 1970 ldquoall the opposites are two freedoms which question each other and complete each
otherrdquo Transportation and solitude likely represent such a pair of mutually‐exclusive freedoms In Denali and other
Alaskan parks we can immediately recognize a tradeoff between the ability to be easily and quickly transported to
a location and the ability to participate in the tranquility of wilderness beyond the reach of modern technology and
crowds
This recognition is a fundamental drive behind the work of the NPS Natural Sounds and Night Skies Division whose
vision statement is to ensure that ldquoNational parks are enduring sanctuaries for natural sounds and dark
environments where current and future generations have the opportunity to experience undisturbed soundscapes
and an unimpeded view of the cosmos and where the ecological roles and cultural values of acoustics and photics
are understood and appreciatedldquo (NPS 2014)
For the purposes of acoustic planning and research the NPS has developed an autonomous system that can
provide both American National Standards Institute (ANSI) certified acoustic levels (ie numeric measurements of
sound pressure level in decibel units) and audio recordings (ie sound that one can listen back to in headphones)
ANSI also recommends the collection of meteorological data concurrent with measurements of sound pressure
level Thus a simple weather station incorporating wind speed wind direction temperature and relative humidity
is also part of the acoustic monitoring station The photo below shows an external photograph of a typical station
2
Figure 1 NPS Standard Acoustic Monitoring Station ndash equipment is composed of a microphone meteorological instruments
sound level meter digital audio recorder battery bank and solar paneling
Scientific work to understand Denalirsquos acoustic environment began in 1999 in response to a large increase in
aviation and snowmobile noise in the mid‐1990s (Morgan 2001) Early data were incorporated into the
Backcountry Management Plan (BCMP) EIS a supplement to Denalirsquos General Management Plan (NPS 2006e)
After the BCMP was published the park embarked on a decade‐long inventory of the acoustic environment The
project was completed in 2015 and as of 2016 the park has moved into a monitoring phase A basic timeline of
acoustic resource management in Denali is shown below
Figure 2 Timeline of acoustic resource management in Denali 1999 ndash 2016
Denalirsquos acoustic inventory project is unique among park service units in that it was designed as a spatially random
sample on a 20 by 20 kilometer grid This allows inference beyond the local detection radius of each microphone
For example consider the following map that depicts the acoustic metric lsquodaily average noise free intervalrsquo ndash a
measure of how long a typical quiet period is before it is broken by motorized noise Noise free intervals in Denali
are largely determined by the frequency of air traffic Aircraft are very acoustically powerful sources that are
audible at distances similar to the scale of the sampling grid thus mapped measurements of noise free interval
immediately form a discernable pattern to the human eye
3
Figure 3 Daily average noise free intervals measured in hours Data were collected as part of Denalirsquos Soundscape Inventory
project 2006 ndash 2015 Noise free interval is a measure of how long a typical quiet period is before it is broken by motorized
noise
Entering the realm of inference the following map uses observations at specific soundscape inventory points to estimate the noise free interval at a park‐wide scale It uses a spatial smoothing technique called inverse distance weighting to construct new data points between the known values ‐ a method known as interpolation Again
because the scale of the phenomena (aircraft traffic) and the scale of the sample (20 km2 resolution) are comparable noise free interval is a metric well‐suited to interpolation techniques (Peterson 1998 Gergel 2006) Continuous change in the metric is physically sensible and approximate the visual effect of looking at the original point data Denalirsquos soundscape inventory was important for understanding which acoustic metrics are best suited to monitoring change at a landscape scale
4
Figure 4 Average noise free interval values estimated by spatial interpolation Units are in hours This map uses observations
at soundscape inventory points to estimate the average noise free interval at a park‐wide scale It uses a smoothing technique
called inverse distance weighting to construct new data points between the known values ndash a method known as interpolation
The Denali soundscape inventory supplies spatially‐rich information about the current state of the acoustic
environment It also clarifies the choices available to quiet the park as per NPS policy Inventory data have been
(1) Inventory data have been used to review the indicators and standards of the BCMP
They explain how indicators change in response to the acoustic ambience
They explain the relationship between indicators (for example NFI and event rate are inversely related
thus one can be estimated from the other)
They provide an understanding as to which indicators are best suited to the scale of the park
(2) Inventory data have been used as input to the voluntary aviation best practice development process
of the Denali Overflights Advisory Council (2007 ndash 2012)
They provided the basis from which to monitor the effects of aviation best practices
They provided updates to the council directing attention to areas most in need of mitigation
They transcend anecdote as the sole basis for making decisions
(3) Inventory data have been used in predictive acoustic modelling
5
They provide a means to validate noise models of aircraft takeoffs or overflights road noise or other
sources
Data such as event rates or hourly distributions can also be used as inputs to models
Aviation Transportation and NPS Policy
There are currently several types of aviation transport in the park Section 1110(a) of the Alaska National Interest
Lands Conservation Act (ANILCA) provides for aviation access for traditional activities and for travel to and from
homesites which will not be discussed in this document Nor will high‐altitude commercial aviation ndash which does impact the park but would involve participation of the Federal Aviation Administration in the revision of Victor
Airways or Jet Routes within the National Airspace System a process well beyond the scope of this plan
Instead this document seeks to build on discussions of the Denali Overflights Advisory Council
(httpswwwnpsgovarticlesdenali‐aircraft‐overflightshtm)a federal advisory committee chartered by the
Secretary of the Interior from 2007 ndash 2012 The group developed a suite of voluntary aviation best practices that
were adopted by both commercial and government aviators It is fitting that these best practices were broadly
adopted because NPS policy does not distinguish the obligations of governmental and Concessionaire operations
with respect to resource protection NPS Management Policies 2006 sect 10249 states
Concessioners are required to comply with applicable provisions of all laws regulations and policies that
apply to natural and cultural resource protection
It is relevant then to provide a brief policy review NPS Management Policies 2006 sect 823 addresses impacts to
natural sounds directly stating
The Service will strive to preserve or restore the natural quiet and natural sounds associated with the
physical and biological resources of parks To do this superintendents will carefully evaluate and manage
how when and where motorized equipment is used by all who operate equipment in the parks including
park staff Uses and impacts associated with the use of motorized equipment will be addressed in park
planning processes Where such use is necessary and appropriate the least impacting equipment vehicles
and transportation systems should be used consistent with public and employee safety The natural
ambient sound levelmdashthat is the environment of sound that exists in the absence of human‐caused
noisemdashis the baseline condition and the standard against which current conditions in a soundscape will be
measured and evaluated
Further guidance related to aircraft is articulated in sect 6343
Managers contemplating the use of aircraft or other motorized equipment or mechanical transportation within wilderness must consider impacts to the character esthetics and traditions of wilderness before considering the costs and efficiency of the equipment
In evaluating environmental impacts the National Park Service will take into account (1) wilderness characteristics and values including the primeval character and influence of the wilderness (2) the preservation of natural conditions (including the lack of man‐made noise) and (3) assurances that there will be outstanding opportunities for solitude that the public will be provided with a primitive and unconfined type of recreational experience and that wilderness will be preserved and used in an unimpaired condition
6
Furthermore sect 637 offers and important reminder that in wilderness areas
The principle of nondegradation will be applied to wilderness management and each wilderness arearsquos condition will be measured and assessed against its own unimpaired standard Natural processes will be allowed insofar as possible to shape and control wilderness ecosystems Management should seek to sustain the natural distribution numbers population composition and interaction of indigenous species Management intervention should only be undertaken to the extent necessary to correct past mistakes the impacts of human use and influences originating outside of wilderness boundaries
Envisioning a (Flight) Route Forward
Denalirsquos Backcountry Management Plan (BCMP) remains the overarching unit‐level policy document on the
management of the natural acoustic environment Data collection during the implementation of the BCMP has
provided a robust baseline description of the resource Transportation planning directly benefits from a synthesis
of these inventory data
One way to approach the protection of acoustic resources is through a cost‐distance analysis Cost‐distance
analysis balances the costs associated with travelling a certain distance (in this case the cost of aviation fuel) with
resistances to travel Resistances to travel can take many forms ndash the increased difficulty in crossing a major river
or mountain range or the difficulty of moving over muskeg as opposed to alpine tundra In this case we describe
resistances to noise ndash areas sensitive to the acoustic disturbance created by mechanical transport
What is meant by resistance Synonymous with lsquonoise sensitivityrsquo for the purposes of this discussion the word
resistance more accurately conveys the interlocked relationship between isolation and transportation The
following two definitions are applicable to the Long Range Transportation Plan
Resistance (noun)
1 Resistance is the degree to which a substance prevents flow through it
2 Resistance is the ability to prevent something from having an effect
In this case the ldquoability to prevent something from having an effectrdquo describes the human ability to make choices
about how to conserve the acoustic environment In other words we conceptualize a resistance when we answer
the question ldquoHow do we mitigate the effects of motorized transport on the acoustic environmentrdquo We will later
see how the resistive analogy between traffic flows and electrical flows can be used to the benefit of managing
acoustic resources
Resistances to noise typically fall into three basic categories
1) Those defined by NPS policy or aviation best practices
2) Those related to the acoustic or ecological properties of the landscape
3) Those related to avoiding interactions between motorized and non‐motorized experiences
7
Resistances to noise can be assigned based on a number of different rationales For instance consider the
following raster dataset that depicts the amount of use by backcountry unit One long‐standing approach to
describing which areas should be protected from noise is to separate backcountry user groups from aviation user
groups in space Lighter areas on the map indicate more backcountry use ndash and thus suggest that aircraft avoid
units along the Denali park road corridor
Figure 4 Backcountry Unit Use resistance layer Lighter values indicate a greater resistance to transportation noise This
suggests that aviation routes should avoid core units around the road corridor
Contrast this with data which show the average noise free interval across the park The layer is normalized to the
same brightness as the backcountry use layer with lighter areas representing a greater resistance to noise and
thus higher resource costs for transportation over the area
The rationale behind the noise free interval map produces different optimal routes than the backcountry user
map This is because resistance is based on the fact that areas with long noise free intervals are sensitive to minor
changes in air traffic and thus traffic should be routed over areas that are already highly fractured In this case
8
areas that already have air traffic would continue to bear the brunt of resource damage allowing the most pristine
acoustic environments of the park to remain intact
Figure 5 Noise Free Interval resistance layer lighter values indicate greater resistance to transportation noise This would
suggest that aircraft routing remain largely the same especially in the areas between the Kahiltna and Ruth glaciers
Backcountry use statistics and noise free intervals are just two of many different ways of assigning resistances to
aviation transport Which strategy is best That depends entirely on the basis of each claim After reviewing both
layers it should be apparent that a wide range of conflicting rationales can be applied to mitigating impacts from
Denalirsquos aviation transportation network Deciding which should be prioritized is a complex decision
Unless the overall aviation traffic volume over the park is reduced displacement in free space is the primary
mitigation technique available to park stewards The most substantial mitigations enacted for the park thus far ndash
the Denali Overflights Advisory Council aviation best practices ndash required the council to weigh certain routing
displacements over others (DOAC 2012)
9
Once a weighting network of resistance layers has been distilled from public and expert opinion it is possible to
use them to envision idealized flight corridors One useful tool for this purpose is the cost‐distance modelling
software Circuitscape (wwwcircuitscapeorg) which uses electrical theory to describe the travel of electrons over
a semiconductor This is analogous to a pilot with knowledge of areas resistant to noise who utilizes this
knowledge while conducting their flight operations Results of a Circuitscape analysis include all the possible routes
a pilot might fly but highlight stewardship‐friendly corridors It allows us to see the conclusions that follow from
our rationale
The following is an example weighting network that can be used as an input for Circuitscape The weights are
chosen in this case to produce a result that is realistic while avoiding the influence of hard discrete edges It
balances nine data sets with widely varying rationales to produce a final summation that can be used to visualize
flight corridors
Figure 6 Example of a weighted network resistance layer Summed data layers include natural ambient acoustic
level travel time backcountry unit use Denali Overflights Advisory Committee aviation best practices and sound
10
sensitive areas BCMP standards noise free interval campgrounds and road corridors The hard edges of polygon
features are especially prominent in the final sum
Dataset Name Description of Dataset Rationale Statement for Noise Resistance Weight
Natural Sound Pressure Level (Median L50)
Typical ambience of the natural acoustic environment (Modelled)
Listening area is reduced in more energetic acoustic environments reducing the impact of human
activities Less natural energy = higher resistance 50
Travel Time Estimated travel time on foot from
portal areas (Modelled)
Backcountry users travelling in more remote areas of the park have a greater motivation to find
solitude Greater travel time = higher resistance 25
Backcountry User Days Utilization of backcountry units of
the park (Empirical)
Areas with a greater amount of backcountry users should be preferrentially avoided More users =
higher resistance 15
Denali Overflights Advisory Council Aviation Best Practices
Best‐practices for mitigating acoustic impacts from aviation (Federal Advisory Committee)
Best‐practices identified by the Denali Overflights Advisory Council should be fully implemented Areas
affected by best‐practices = high resistance 10
Backcountry Management Plan Soundscape Standards
Soundscape standards by spatial region of the park (GMP)
Adherence to NPS policy should be prioritzed Lower impact management zone = Higher resistance
5
Noise Free Interval
Average amount of time before experiencing the next noise disturbance (Empirical
interpolated)
Areas with longer noise‐free intervals are more sensitive to fracturing due to increases in air traffic
Greater noise‐free interval = higher resistance 5
Campground Locations Buffered campground areas
(Empirical)
Campgrounds are places where many people spend time resting and should be preferrentially avoided
Closer to campground = higher resistance 5
Roads Buffered road network (Empirical) Roads are already impacted by noise so aviation
noise will have a lesser impact in proximity to roads Beyond road noise footprint = high resistance
3
Denali Overflights Advisory Council sound sensitive areas
Areas identified by the Denali Overflights Advisory Council as
noise sensitive banded into three categories low medium high (Federal Advisory Committee)
Sound sensitive areas should be preferrentially avoided Higher sensitivity band = higher resistance
2
Table 1 Description of noise resistance rasters that were used to show how varying rationales can be balanced to produce an overall weighted noise resistance layer
Once the weighted resistance layer has been created Circuitscape is used to recognize ideal flight corridors Airports with commercial use represent sources of electrical potential and include Talkeetna Healy McKinley Public ERA helipad McKinley Private Cantwell and Kantishna The sink (ground) of electrical potential is the Denali massif For the example weighting network in this document the following map was produced
11
Figure 7 Cost‐distance analysis results This graphic shows current flow from electrical sources (airports) to an electrical sink (the Denali massif) This is analogous to air traffic density
What does the model show It represents air traffic density as an analogy to electrical current ndash the greater the current the greater the air traffic density As a model it is an imperfect representation of reality but this example representation does identify flight corridors that follow from the input rationale (These corridors include the Denali park road corridor the Denali Fault a route along the outer range and one that connects Broad Pass to the Eldridge Glacier) Obviously the map in Figure 7 fails to capture public opinion and for that reason it is incomplete but the technique stands as a meaningful strategy to approach these complex decisions
12
Conclusion
Data from the Denali Soundscape Inventory describe the parkrsquos acoustic environment at a landscape scale These data can be used
for many purposes but their most critical is to provide a baseline from which to monitor the effects of future noise mitigation
efforts
In the preceding section we described a cost‐distance analysis technique that could be utilized to identify the most beneficial long‐
term mitigations for the acoustic environment Such corridors represent opportunities for park management and the aviation
community to work together as stewards What has not been identified in this document is the ldquovalue analysisrdquo process by which
public and expert opinion can be synthesized into an appropriate weighted resistance layer for cost‐distance analysis The overall
strategy may follow a form similar to this
An informal version of this same process was used to by the twelve members of the Denali Overflights Advisory Council to develop
an initial suite of aviation best practices from 2007 ndash 2012 Some of these best practices have produced substantial positive changes
for the park but others have failed to be acoustically effective due to their extent or timing The strategy described in this
document could be used to open the doors of conversation and improve the effectiveness of the mitigations to protect Denalirsquos
acoustic environment
References
Alaska National Interest Lands Conservation Act PL 96‐487 sect 1110(a)
Denali Aircraft Overflights Advisory Committee 2012 Denali air tour operatorsrsquo best practices to minimize sound impacts Available
at httpswwwnpsgovdenagetinvolvedaoachtmCP_JUMP_5151844 September 2013
Gergel S E and M G Turner 2006 Learning landscape ecology a practical guide to concepts and techniques Springer Science amp
Business Media New York
McRae BH VB Shah and TK Mohapatra 2013 Circuitscape 4 User Guide The Nature
Conservancy httpwwwcircuitscapeorg
Morgan D and J Van Horn 2001 Aircraft Overflight Activity in the Denali Wilderness An Analysis of Backcountry Rangers
13
Observations for 1999 and 2000 National Park Service Denali Park Alaska
National Park Service (NPS) 2000 Directorrsquos Order 47 Soundscape Preservation and Noise Management US Department of the
Interior National Park Service Washington DC
National Park Service (NPS) 2006a Management policy 6343 Environmental Compliance in Management policies 2006 US Department of the Interior National Park Service Washington DC
National Park Service (NPS) 2006b Management policy 637 Natural Resources Management in Management policies 2006 US Department of the Interior National Park Service Washington DC
National Park Service (NPS) 2006c Management policy 823 Use of motorized equipment in Management policies 2006 US Department of the Interior National Park Service Washington DC
National Park Service (NPS) 2006d Management policy 10249 Natural and Cultural Resource Management Requirements in Management policies 2006 US Department of the Interior National Park Service Washington DC
National Park Service (NPS) 2006e Denali National Park and Preserve final backcountry management plan environmental impact statement National Park Service Denali Park Alaska
National Park Service (NPS) 2014 Natural Sounds amp Night Skies Division Strategic Plan (2014 ndash 2019) US Department of the Interior National Park Service Natural Resources Stewardship and Science Ft Collins CO
Peterson D L and V T Parker 1998 Ecological scale theory and applications Columbia University Press New York
Siegel E 1970 There Are Two Freedoms Aesthetic Realism Lectures by Eli Siegel Web 1 July 2016
14
National Park Service US Department of the Interior
Denali National Park and Preserve Long-Range Transportation Plan
Appendix C Denali Park Road Risk Assessment Utilizing the Unstable Slope Management Program
1
Denali National Park and Preserve ndash Long Range Transportation Plan
Deterministic Geologic Risk Assessment of the Denali Park Road Utilizing the Unstable Slope Management Program
Authors Russell Rosenberg MSc ndash Physical Science Technician (Geologic Hazards) Denny Capps PhD ndash Park Geologist Heather Rogers MSc ndash Physical Science Technician (Geologic Hazards)
Prepared 080316
Revisions none to date
Introduction and Project Status
The 92‐mile Denali Park Road traverses a highly active geologic landscape and has experienced
numerous documented mass wasting events throughout the history of the road One of the most
dramatic occurred in late October 2013 when a 600‐ft‐long 110‐ft‐wide debris slide blocked the road
near MP 38 Blocks of permafrost‐frozen unconsolidated debris up to 15 ft thick slid on weak unfrozen
clay Frequent but less dramatic events block traffic undermine road surfaces and may cause damage
to vehicles or injuries Many events including the example above are likely triggered or exacerbated by
thawing permafrost and are consistent with the possible effects of anthropogenic climate change With
increases in road use the uncertain effects of climate change and possible changes to maintenance
funding levels National Park Service (NPS) and Federal Highway Administration (FHWA) staff identified
the need for a comprehensive risk analysis of geologic hazards along the Denali Park Road
The risk analysis is scheduled for completion by March 2017 and includes five parts (1) inventory maps
and linked database that illustrate spatialtemporal distribution of geohazards their relative activity
and geomorphic attributes (2) beta testing and implementation of the Unstable Slope Management
Program (USMP) rating criteria (3) geohazard susceptibility models that estimate the spatial probability
of occurrence (4) geohazard risk models that illustrate the potential consequences and (5)
analysesrecommendations to park management regarding other risks the road will exhibit over the
next decade (DENA‐MOA‐208813AB) Currently tasks 1 and 2 are predominately complete tasks 3 and
4 are underway and task 5 will follow the completion of tasks 1‐4 Although final results and
recommendations are still forthcoming the results of tasks 1 and 2 in particular the USMP ranking
scores (discussed below) provide an inventory and a first‐order deterministic risk assessment of
geologic hazards currently affecting the park road
2
The results of the USMP rating criteria provide valuable information on the spatial distribution of
geologic hazards their severity and the associated risk however they do not directly assess the
possible impacts of climate change or provide a detailed outlook of possible future scenarios We utilize
these data to provide a preliminary identification of the areas with the highest relative risk and their
spatial patterns Consideration of this information should be valuable to this Long Range Transportation
Plan (LRTP) and for park managers and planners as future infrastructure plans are being developed
Unstable Slope Management Program Site Rankings
The USMP is a collaboration between the FHWA many other federal agencies including the NPS private
geotechnical consultants and the Alaska Department of Transportation amp Public Facilities (AKDOT) that
ranks geologically unstable slopes for the purpose of facilitating more effective long‐term geotechnical
asset management USMP scores provide a deterministic ranking of agency risk associated with any
particular geologic hazard site These scores consider elements of both the severity and
frequencyprobability of a hazard and the exposure and vulnerability at each particular site Example
elements include the amount of roadway affected by landslide events the frequency of known hazard
events the impact of events on the use of the transportation corridor the maintenance cost and
complexity and annual average daily traffic For detailed information the USMP ranking criteria please
see (httpnlcsmontanaeduusmpRatingManualpdf)
We have currently completed a total of 141 USMP site rankings along the entire 92 miles of the DENA
Park Road (Figure 1) These data represent the vast majority of known geologic hazard sites and include
landslides debris flow drainages rockfall areas frost‐heaves and erosional undercutting due to fluvial
processes It should be noted however that these site rankings are not totally comprehensive instead
they represent our most complete knowledge as of 06292016 The DENA USMP rankings range from
164 to 948 with a mean value of 328 and more variance within higher ranking sites To put these values
in perspective immediately however the USMP qualitatively defines sites that score less than 200 to be
in ldquogoodrdquo condition sites that score between 200 and 399 to be in ldquofairrdquo condition and sites that score
400 or higher to be in ldquopoorrdquo condition
In theory sites in poor condition are more likely to pose persistent andor more serious problems along
the road and areas of higher risk density are more likely to see a higher concentration of problems In
DENA the current majority of our sites 67 rank in fair condition while only 9 are in good condition
and a relatively large number of sites 24 are in poor condition The only significant outlier was the
ldquoPretty Rocksrdquo slump (Figure 3b) with a score of 948 365 points higher than the next highest site
Spatially regions of higher USMP risk density (Figure 2) are most pronounced along Polychrome Pass
and the Eielson Bluffs areas Individual USMP scores represent the relative risk associated with a hazard
site and risk density represents the relative concentration of agency risk
3
Figure 1 DENA USMP site rankings on IKONOS imagery Icon sized is scaled by individual site rank and colored according to good fair or poor qualitative rank
Figure 2 DENA USMP score density on IKONOS imagery Density scaled by linear concentration and site ranking scores
Of the sites ranked in poor in condition along the Park Road many received prior mitigation or were
previously identified as areas of concern by maintenance or resource management personnel Some
previously noted severe geologic hazard sites in lsquoagreementrsquo with poor USMP scores include the ldquoPretty
Rocksrdquo slump (Figure 3a) debris flow activity at ldquoBugstufferrdquo creek (Figure 3b) the ldquoBear CaveMile 45rdquo
slump (Figure 3c) and the ldquoIgloo Debris Sliderdquo (Figure 3d) Additionally Polychrome Pass is a known area
of high geologic hazard occurrences This general agreement of USMP scores and professional
4
judgementinstitutional knowledge within DENA should be reassuring to park managers and help
demonstrate that the USMP ranking scores represent useful information and are based off of many
years of development from similar programs and expertise developed by FHWA AKDOT Oregon Dept
of Transportation and private firms The USMP provides an institutional framework for tracking these
known problem areas and has identified other new examples
A B
C D
A B
Figure 3 Previously recognized sites that rank in poor condition A ndash Pretty Rocks Slump (mile 454 948 points) B ndash Bugstuffer debris flow (mile 519 575 points) C ndash Bear Cave Slump (mile 45 411 points) D ndash Igloo Debris Slide (mile 377 514 points)
Current Applications to the LRTP
The USMP rankings provide a preliminary framework for understanding the relative severity of risk
associated with geologic hazards along the Park Road Although we do not currently make
recommendations tailored to specific sites or address possible future scenarios we suggest that an
awareness of the current results of the USMP rankings is beneficial to this LRTP Likely applications of
the USMP data to the LRTP would involve spatial analysis of USMP rankings as they relate to possible
disruptions in traffic programming of potential mitigation projects and overlap with future
infrastructure planning In order to facilitate this analysis we submitted a spatial database of our USMP
rankings to PaTINA (they are also available on request) We emphasize that these results are
preliminary yet they provide a method for understanding and considering geologic hazards in a broader
context Park planners and managers should continue to work with resource staff in understanding the
5
implications of these results however the following are potential applications to consider for the
current LRTP
All geologic hazards sites but in particular those in poor condition are more likely to pose
persistent andor serious problems along the Park Road These are areas where the
transportation corridor could experience interruptions or incur high maintenance costs as a
result of geologic activity Sites in poor condition should be considered for mitigation and
investigated in more scientific detail (see Future Work)
The USMP rankings may help identify geotechnical assets where hazards do not appear
extremely severe but may be candidates for mitigation from a risk‐based or cost‐based
perspective Rockfall sites that are not capable of producing catastrophic roadway failure but
require very frequent maintenance are good examples of this These sites also rank in poor
condition but may not otherwise receive attention from management
Density analysis of USMP site distribution identifies areas of non‐discrete geologic hazard areas
that may require alternate or more systematic mitigation efforts to increase cost effectiveness
The extreme concentration of hazard sites along Polychrome Pass is an example of such an area
Future Applications to the LRTP
Both the LRTP and USMP have been designed to evolve as new information become available through
time thus allowing for future applications with as new data become available Most transportation
agencies apply transportation asset management (TAM) systems to transportation assets such as
bridges and road surfaces however geotechnical assets such as rock slopes and embankments are
unlikely to be considered with the same detail (Stanley 2010) The USMP provides a system for
geotechnical asset management by creating a framework to establish potential performance measures
and targets for individual geologic hazards and the overall transportation corridor (Federal Highway
Administration‐DRAFT report 2015) We plan to update USMP rankings for the DENA park road as more
information is made available or new events occur and to perform a systematic re‐evaluation once
every five years By tracking USMP rankings over time the following performance measures could be
considered by transportation planners and park managers
Establish targets to reduce the overall number of fair or poor ranking sites along the park road
This could represent a total percentage reduction a maximum target number of poorfair sites
or a certain number of poorfair sites per unit distance along the road
Establish targets to reduce the risk at sites of particular concern (see Future Work)
A benefitcost analysis for all geotechnical assets along the transportation corridor could be
undertaken The USMP group is currently working on developing this tool and the effectiveness
of programmed mitigation projects could be measured by tracking costs vs performance
changes in geotechnical assets recorded by the USMP rankings
6
A method for tracking the performance of assets through time to establish a preferred course of
action As an example USMP scores at the site of the October 2013 slide that blocked the road
(Figure 3d) have been on a downward trend since May 2015 because of relative inactivity while
scores at the Pretty Rocks slump (Figure 3a) have remained higher or increased slightly because
of recent activity Establishing trends in USMP scores through time could be useful for
determining appropriate mitigation priority
Future Work
The USMP risk matrix provides a relatively robust assessment of geotechnical assets based on their
current condition and a way to track their performance through time However because of its
deterministic nature it does not directly consider possible or likely future conditions We hope to
address this limitation through the continued development of the geologic risk assessment Completion
of task 3‐5 of the risk assessment will allow us provide data which will help determine the probability of
future events based on geologic conditions and the associated risk based on transportation
infrastructure and human exposure The results of tasks 3‐5 will allow us to assess the potential outlook
of areas of the road based on their probability to experience new events Additionally we will expand
on the results of the USMP to examine high ranking sites in more scientific depth Examples of this may
include drilling bore holes at the Pretty Rocks slump to determine sub‐surface conditions examining
the relative abundance of fine‐grained sediment in debris flow watersheds or repeat GPS surveys to
ascertain motion rates such as are currently ongoing at the Bear CaveMile 45 slump By using all of
these data sets in conjunction we plan to propose specific recommendations and mitigation
considerations for sites of concern based on their current conditions and future outlook
References Cited
Federal Highway Administration 2015 DRAFT‐Unstable Slope Performance Measures for FLMAs using
USMP Ratings
Federal Highway Administration and National Park Service 2015 Comprehensive Memorandum of
Agreement DENA 208813 AB Denali National Park and Preserve ndash Conduct A Hazard Assessment Of
The Denali Park Road Corridor
Landslide Technology and Federal Highway Administration 2014 Geotechnical Asset Management ndash
Unstable Slope Rating Category Descriptions For Federal Land Management Agencies
Stanley D A 2010 Asset Management In A World Of Dirt ndash Emergence of an Underdeveloped Sector of
Transportation Asset Management TR News no 277 p 18‐22
7
Denali National Park and PreserveLong-Range Transportation Plan
Appendix D Current and Future Partner Projects
National Park ServiceUS Department of the Interior
1
1
Memo
To Denali National Park Long Range Transportation Plan Team
From ATKINS Email
Phone 720-841-2956 Date Sep 19 2014 Modified August 28 2017
Ref cc
Subject Possible Foreseeable ProjectsPlans near Denali National Park
Matanuska Susitna Borough LRTP
Source httpwwwmatsugovusplanslrtp
This transportation plan assesses growth in the Mat-Su Borough over the next 20 years and
identifies the key elements of the Boroughrsquos future transportation system that will be needed to
serve its growing communities The transportation plan will help the residents develop a Borough
that is a pleasure to live in with public infrastructure that supports their daily lives
Alaska Stand Alone Pipeline (ASAP)
Source httpwwwasapeiscom
The Alaska Stand Alone Pipeline (ASAP) Project is a 727-mile long 36-inch-diameter natural gas
transmission mainline extending from the GCF near Prudhoe Bay south to a connection with the
existing ENSTAR pipeline system in the Matanuska-Susitna Borough A 29-mile-long 12-inch-
diameter lateral pipeline will connect the mainline to Fairbanks The proposed pipeline will be
buried except at possible fault crossings elevated bridge stream crossings pigging facilities and
block valve locations
The pipeline will bypass Denali National Park and Preserve to the east and will then generally
parallel the Parks Highway corridor to Willow continuing south to its connection into ENSTARs
distribution system at MP 39 of the Beluga Pipeline southwest of Big Lake
The Alaska District US Army Corps of Engineers (Corps) has been designated the lead federal
agency and the US Bureau of Land Management (BLM) National Park Service (NPS) US
Environmental Protection Agency (EPA) US Fish and Wildlife Service (USFWS) US
Department of Transportation Pipeline and Hazardous Materials Safety Administration (PHMSA)
and the Alaska Department of Natural Resources State Pipeline Coordinators Office (SPCO) are
participating as cooperating agencies in the Supplemental Environmental Impact Statement (SEIS)
development process
2
2
Memo
Alaska LNG project
Source httpwwwarcticgasgovalaska-lng-project
The Alaska LNG export project would be among the worldrsquos largest natural gas-development
projects The project is in the pre-front-end engineering and design phase or pre-FEED The
project consists of constructing a 58-mile pipeline from Point Thomson gas field to Prudhoe Bay
and 800-mile pipeline from Prudhoe Bay to Nikiski
DOT Parks Highway Projects
Source httpdotalaskagovparks2014
The Alaska Department of Transportation and Public Facilities is performing road construction on
the Parks Highway during the construction season Work includes turn lanes passing lanes re-
surfacing bridge repairs
3
3
Memo
ADOTampPF Area Plans
Source httpwwwdotalaskagovstwdplngareaplansarea_regionalindexshtml
These are regional multi-modal transportation plans developed for specific areas of the state
designed to address movement between communities in the region and from the region to points
beyond Each of these plans incorporates economic modeling to evaluate potential projects and
prioritize them to best meet state and regional goals Denali National Park is partially included in
the Interior Alaska Transportation Planning Area The most recent plan for this area was adopted
in 2010 The plan includes transportation impacts to topic areas that include
bull Gas Pipeline
bull Mineral Development
bull Military Training
bull Railroad Development
bull Tourism
4
4
Memo The Plan examines potential impacts of these and other developments to highways rail aviation
and local community roads and although the plan did not fiscally constrain priority projects
several projects were identified as short-term capital improvement needs Among these projects
were recommendations for improvements on the George Parks Highway in the area of Denali
National Park This project as described by the plan includes passing lanes from MP 113 to MP
163 for an estimated cost of $15 million
Alaska Railroad ndash Healy Canyon
Source httpalaskarailroadcomPortals6pdfprojects2012_01_04_Healy_Canyon_Stabilization_FS_PROJpdf
Work is being proposed in Healy Canyon between Denali Park Station at Milepost (MP) 348 and Healy (MP 358) The Alaska Railroad has proposed projects to
bull Stabilize the track bed (ongoing)
bull Control the rock fall problems
bull ldquoDaylightrdquo (remove the top) Moody Tunnel at MP 3536 (complete)
bull Realign tracks around Garner Tunnel (complete)
bull Realign the tracks to enhance safety at MP 3536 (Moody Tunnel) and MP 357 (complete)
Proposed Susitna-Watana Dam
Source httpwwwsusitna-watanahydroorgprojectproject-description
Susitna-Watana Hydro could be a large hydro project on the Susitna River upstream of Denali
National Park This project would provide long-term stable power for generations of Alaskans and
have economic impacts on the area The project would generate 2800000 MWh of annual
energy once it comes online in 2024 The installed capacity is 600 megawatts (MW)
Environmental studies are currently underway
DOT Mile 231 Proposed Pedestrian Project
Source httpawsstateakusOnlinePublicNoticesNoticesViewaspxid=173914
The project scope includes constructing a new pedestrian bridge across the Nenana River trail
connections a rest area and intersection improvements Conceptual designs preliminary
engineering and environmental studies are currently underway
Other Area Energy Projects (Wind Coal Natural Gas exploration)
Eva Creek Wind Project Eva Creek is the largest wind project in Alaska at 25-megawatts It is
located 14 miles from Healy at the top of the 10-mile Ferry mining road
Usibelli Coal Mine Exploration License Plan of Operations Usibelli Coal Mine Inc has
submitted a request to carry out a Coalbed Methane drilling exploration program at a prospect site
approximately seven miles east of the town of Healy The project will consist of a single vertical
coal-bed methane exploratory well drilled inside the exploration license area The exploratory well
5
5
Memo will help determine whether sub-surface coal seams contain sufficient quantities of methane gas to
justify further exploration in the area (Source
httpdogdnralaskagovPermittingDocuments2014UsibelliUsibelli_LOCI_14_002_Drilling_at_H
ealy_Creek_Propect_Noticepdf)
Stampede State Recreation Area There is a potential designation of a Stampede State
Recreation Area west of the Panguingue Creek subdivision In March 2013 Senator
Representative David Guttenberg introduced HB148 in response to requests by the Denali
Borough Assembly
Borough Planning Commissioners are currently working through recommendations for area
management which include details of proposed allowed uses and a plan for land management
(Source httpnorthernorgtake-actionstampede-state-recreation-area-1)
Air Traffic ndash Overflights council
Source httpwwwnpsgovdenaparkmgmtaoachtm
The Denali National Park and Preserve Aircraft Overflights Advisory was established in 2007 to
consider resource conflicts between aircraft tours and park visitors on the ground The group is
charged with advising the National Park Service (NPS) on ways to mitigate (reduce) sound impacts
from aircraft flights over the park develop voluntary measures for assuring the safety of
passengers pilots and mountaineers and achieve desired resource conditions at Denali as
outlined in the Backcountry Management Plan (2006)
6
Denali National Park and PreserveLong-Range Transportation Plan
Appendix EPark Transportation Investment Needs Analysis
National Park ServiceUS Department of the Interior
Appendix E Denali National Park and Preserve Park Transportation
Investment Needs Analysis
Denver Service Center Planning Division | National Park Service | March 2017
1
Contents ABSTRACT 2
INTRODUCTION 2
PATINA DESIGN 3
OVERVIEW 3
VEHICLE MANAGEMENT PLAN 3
VECTOR ANALYSIS 4
DATA COLLECTION 4
TRANSPORTATION NETWORK 4
ASSET METRICS 5
HIGH RISK 5
INVESTMENT RANKING 6
GOAL AREAS 7
METHODOLOGY 8
DATA PREP 8
LAYER WEIGHTING 9
COMPOSITE ANALYSIS STEPS 10
SELECTED RESULTS 14
OUTPUTS 14
ROAD SEGMENT FINDINGS 16
Motorized Paved Zone 16
Wildlife Viewing Subzone 1 17
Wildlife Viewing Subzone 2 18
Wildlife Viewing Subzone 3 19
Wildlife Viewing Subzone 4 20
DISCUSSION 20
INTERNAL WEIGHTING 21
SKEWED DATA 21
SPATIAL SPREAD OF DATA 21
NEXT STEPS 22
2
ABSTRACT A Park Transportation Investment Needs Analysis (PaTINA) was performed in support of the Denali
National Park and Preserve Long Range Transportation Plan The PaTINA spatially models areas of
potential investment need by using a Geographic Information System to overlay geographic data The
data overlays are assigned a weight and added together where they are coincident in space The
resulting model visually depicts areas where multiple complexities occur This is compared with
transportation facility data to inform investment strategies The PaTINA results are shared in an
interactive web mapping environment and may be added to other mapping tools as a map service
INTRODUCTION The Park Transportation Investment Needs Analysis (PaTINA) synthesizes geospatial information to inform transportation planning and investment PaTINA takes into consideration the goals of the National Park Service (NPS) service-wide goals the goals of individual NPS units and the requirements of the Federal Highway Administration The combination of these goals is expressed in the Long Range Transportation Goals PaTINA creates geospatial-based analyses related to these goals and produces high-resolution outcomes that are site specific within the park unit PaTINA models use compiled data sources to create models related to transportation needs and restraints The vision goals and objectives established in the park unitrsquos Long Range Transportation Plan (LRTP) determine the input data for PaTINA As an analysis PaTINA is accomplished by overlaying map themes important to park management within
a Geographic Information System (GIS) and spatially comparing the overlay results to the transportation
network Metrics used by facility managers to rank assets of the transportation network in terms of
needed maintenance are then compared to the PaTINA results The analyses demonstrate where
priority areas may be located and can be compared to financial recommendations of LRTP The resulting
analyses can spatially inform the condition performance assessment needs identification funding
strategies and even funding prioritization
Modeled PaTINA results are shared as map services and presented in an interactive web mapping
application along with park facility and other relevant data The PaTINA process can be repeated with
model inputs and weights adjusted to reflect current park management needs
The PaTINA was originally developed as part of the Golden Gate National Recreation Area LRTP to help identify key areas where a confluence of conditions highlighted the need for investment consideration The recognized utility of the analysis led the Denali National Park and Preserve (Denali or park) LRTP team to request a PaTINA to help identify areas of concern that may not be readily discovered without geospatial tools
3
PATINA DESIGN
OVERVIEW The following are steps used to design create and implement PaTINA for the Denali LRTP At the
beginning stages of the LRTP goals are established for the Park Unit which includes Washington Federal
Highways and the Park Unit input Goal areas for Denali were system optimization resource
protection user experience access climate change and partners Each goal area was assigned
applicable GIS data layers which establish elements of the goal The data layers were given priority
weights depending on their importance on how it affects or is affected by the transportation network
Priority weights were determined with input from Denali park staff specialty experts
Once weights were established spatial analysis was performed to determine the overlap of each input
data layer within each goal area The weights of each input layer were added together where overlap
occurred The overlaying process identified areas where multiple inputs are spatially concurrent as well
as where inputs deemed as a higher prioritymdashmore heavily weighted--occur
The overlay results of each goal area were combined to generate the overall PaTINA composite denoted
as ldquoPotential Need Areasrdquo Throughout the LRTP process additional data themes outside the goal areas
were identified as a need and were categorized into three parts asset metrics high risk and investment
ranking These data were later added to the final web mapping product to compare to the Potential
Need Areas
VEHICLE MANAGEMENT PLAN In 2012 Denali prepared a Vehicle Management Plan (VMP) to evaluate alternatives for managing
vehicle use along the Park Road The preferred alternative of the plan proposed new management
zoning to include additional wildlife viewing subzones According to the VMP these subzones would be
implemented to clarify management objectives necessary to achieve desired conditions within specific
road sections Due to the significance of the segments for management purposes (Figure 1) it was
important to incorporate the sections into the initial design of the Denali PaTINA To do so the PaTINA
was applied independently to each road segment resulting in five separate sets of analyses Wildlife
viewing subzone 2 is split between 2a) from Teklanika River Bridge and the Eielson Visitor Center and
2b) east of Wonder Lake
4
Figure 1 Road segments defined in the Denali Vehicle Management Plan and used as a basis for the PaTINA
VECTOR ANALYSIS Following the methodology of the Golden Gate PaTINA the Denali PaTINA was completed as a vector
analysis Golden Gate was the pilot for the PaTINA effort which led to expectations that the process be
replicable at additional park units Vector analysis also has the added benefit of preserving spatial
geometries and attribution Attribution allows web map users to deconstruct the results to verify inputs
contributing to the composite result
DATA COLLECTION The following sections describe the categories of data that make up PaTINA and are included in the final
product
TRANSPORTATION NETWORK The transportation network for Denali first needed to be defined to create a spatial basis for the overlay
analysis For Denali the transportation network consists of roads trails parking lots railroad and
airstrips Each polyline transportation network features were assigned a width (Table 1) and then
2b
2a
5
buffered to that width to create a polygon input All polygon inputs were merged together to create a
final transportation network data layer
Table 1 Buffers applied to the Denali transportation network
Transportation Feature Width
Roads 11rsquo Trails 8rsquo
Railroad 100rsquo
ASSET METRICS Asset metrics included in the Denali PaTINA show facility condition index (FCI) and optimizer bands The
FCI rates the condition of a facility or asset using a numeric rating system This system reflects the
current replacement value of an asset and its projected cost of repairs Optimizer bands were developed
to divide a parkrsquos asset portfolio into five bands to represent the level of maintenance that each asset
should receive The metrics help staff make informed decisions about the allocation of limited funding
and staff time for maintaining park infrastructure
The FCI and optimizer band data were derived from the facility management software system (FMSS)
Assets in the transportation network data layer were joined together with the FMSS spreadsheet to be
able to show the asset metric information spatially The join was based on the Location ID attribute in
both the spreadsheet and spatial data A number of records in the spatial data were missing Location
IDrsquos so manual matching had to take place This was done by using aerial imagery to identify assets
based off of the FMSS location descriptions Assets that still couldnrsquot be identified through this method
received input from park staff via the web mapping tool by using create new features capability
Create New Features Tool in Web Map Site
The Create New Features tool allows users to generate data within the web map interface The user creates the geometry of the data and can also include information in predefined text boxes that gets added to the feature class attribute table Once the new feature has been created and saved it is automatically stored as a new record in a feature class that sits on a local server This benefits the GIS staff by having quick access to newly created data Because the data is automatically stored users can revisit the web map and see previous created features Geometry and text changes can be made to the feature after it has been created
HIGH RISK In winter of 2016 NPS regional and park staff as well as Federal Highway Administration (FHWA)
conducted a risk assessment workshop for Denali The purpose was to identify risk types and areas to
mitigate risk and provide recommendations to park management Those findings will be included in the
Denali LRTP There were a total of 28 identified risk types that were ranked into prioritization categories
from low to high Because of the importance of understanding where risk occurs and to mitigate future
events it was decided to include this information as spatial data into the PaTINA web map Only the
6
high risk category was added to the analysis due to the significance of these risks on Denalirsquos resources
visitors and staff
In total there were eight high risk types identified only six of which could be mapped Out of the six
remaining risk types three had data available The Create New Feature tool was used by park staff to
generate a data layer identifying locations of gravel production sites but was later omitted by the LRTP
team It was concluded that the site itself is not a risk to the transportation network but rather the
absence of gravel in these pits are The in holder access data was gathered from the NPS Lands
Resources Division to show tracts within Denali Culvert locations were derived from an excel
spreadsheet provided by FHWA ndash Western Federal Lands by plotting XY coordinates Lastly the
unstable slopes data was provided by park staff and was originally generated through FHWA in
collaboration with NPS Table 2 summarizes the risk data included in the PaTINA web map
Table 2 Summary of risk data used in the Denali LRTP
Risk Type Can it be mapped
Is data available
What is the source of the data
Inholder Access yes yes NPS Lands Resources Division
Implementation of LRTP no na
Staff Level Changes no na
Gravel Production Processing or Purchase yes no
Culverts (MampO) yes yes FHWAndash Western Federal Lands
Permafrost degradation yes no
River and Stream Flooding yes no
Unstable Slopes yes yes NPS FHWAndash Western Federal Lands
INVESTMENT RANKING A financial analysis was completed for the Denali LRTP resulting in development of investment
strategies An investment strategy combines goals and objectives of the LRTP agreed upon investments
and other transportation needs and constraints in the current funding environment One investment
strategy category is to Repair and Maintain the Unpaved Portion of the Denali Park Road and focuses on
desired condition targets which change depending on the Park Road segment This strategy aligns with
the VMPrsquos concept that the Park Road is less traveled by visitors farther into the park and those
segments with lower desired conditions can help reserve funding for other transportation asset
priorities
Due to the importance of financial analysis results it was decided to include the information as a spatial
component to PaTINA A table showing current and desired conditions for each segment with associated
milepost numbers was provided by one of the contractors working on the LRTP A GIS layer of mile
markers was used to correlate data from the table and create a new layer representing the financial
analysis Attribute information was added and the layer was symbolized by segment showing highest
priority and lowest priority Table 3 shows current and desired condition information that was
incorporated into the new investment ranking GIS layer These results can easily be compared to other
components such as high risk areas or goal area composites
7
Table 3 Financial analysis data based on mile markers
Mile Post Segment Current
Condition Desired
Condition Annual Needs
Priority Ranking
0 to 15 Entrance area to Savage River Trailhead
na 00 na 5
15 to 32 Savage River Trailhead to Teklanika Bridge
009 109 $013 M 4
32 to 39 Igloo Forest to Sable Pass 013 109 $014 M 4
39 to 43 Sable Pass to East Fork Bridge 013 109 $024 M 4
43 to 47 Polychrome to Plains of Murie 035 245 $074 M 2
47 to 62 Plains of Murie to Stony Overlook 013 149 $047 M 3
62 to 66 Stony Overlook to Eielson 014 149 $018 M 3
66 to 70 Eielson to Grassy Pass 017 325 $ - 2
70 to 88 Grassy Pass to Boundary Pit 012 325 $ - 2
88 to 92 Boundary Pit to Kantishna 0499 449 $012 M 1
GOAL AREAS During the early development of the Denali LRTP team members created six goal areas each with an
associated statement The goal statements represent aspects of the NPS mission and Denali vision
statements to help guide future transportation decisions These goal areas serve as a basis throughout
the LRTP for identifying baseline conditions performance management and implementation Table 4
shows the six goal areas and goal statements
Table 4 Denali LRTP goal statements
Goal Area Goal Statement
Resource Protection Understand and protect Denali NPPrsquos fundamental Park resources and values as they relate to the transportation system
Climate Change Plan for climate change impacts to the Parkrsquos transportation system
User Experience Provide a quality multi-modal Park experience for users
Access Provide safe efficient and appropriate Park access
System Optimization Develop a long-term transportation system to appropriately satisfy current and future Park needs
Partnership Manage formal and informal commercial partnerships to provide a viable transportation system
These goal areas served as a guide for GIS data collection Datasets related to each goal area were
identified collected and formatted as needed for the composite analysis The Partnership goal area is
not included in the PaTINA since no map-able data were identified Future iterations of the Denali
PaTINA may include the Partnership goal area if new data are obtained The System Optimization goal
was also not included in the analysis but rather it was called out separately for comparison in the final
model results This category is referred to as Asset Metrics (described above) and include FMSS-specific
data The purpose of this was to be able to spatially detect and understand the correlation between
FMSS data and the Parkrsquos values stated from the LRTP goal areas In total 26 GIS layers were used as
input layers for the analysis Layers from each goal area were overlaid upon each other so that the goals
8
could be visualized for the LRTP Listed below are the input layers for each of the goal areas used for the
analysis
Resource Protection
bull Sheep Gaps
bull Exotic Species
bull StreamRoad Intersections
bull Vegetation Monitoring Marker
bull Sheep^
bull Moose^
bull Bear^
bull Wolves^
bull Caribou (Aug-Sep)^
bull Caribou (July-Aug)^
bull Caribou (May-June)^
bull Wetlands
bull National Register Structures
bull Historic Districts
User Experience
bull Viewscapes
bull Visitor Services
bull Social Trails
bull Visitor Pattern
bull High Visitor Use Area
Access
bull Safety Areas of Concern
bull Railroad Depot
bull Bus Stops
Climate Change
bull Geohazards
bull Permafrost
^Based on extrapolated observation data reported in the Denali VMP
New data created by park staff for the PaTINA
During the process of collecting data data needs were recognized and collated Identified data gaps
included permafrost degradation river and stream flooding events informal aviation landing areas
congestion hotspots and wildlife patterns To fill certain gaps the Create New Features tool in the web
map was utilized by park staff Layers in the list above with an asterisk represent the ones created by
park staff Other identified data gaps focused on visitor use statistics Examples included dependable
traffic counts visitation numbers by area and visitor numbers on bus types beyond front country area
METHODOLOGY
DATA PREP All input data layers were projected to NAD_1983_Alaska_Albers Point and polyline datasets were
buffered and converted to polygon features and then clipped to the transportation network Figure 2
shows an example of a point layer created by park staff using the Create New Feature tool that was later
buffered and clipped Once the polygon data was created per input layer they were merged together to
create a single polygon layer For example park staff created multiple polylines and points to capture
visitor patterns along the Park Road The polygons were merged together to create a single visitor
pattern input layer under the User Experience goal area
9
Figure 2 Example of Denali staff input used to create data for the PaTINA
LAYER WEIGHTING Within the goal areas each input polygon layer was assigned a value The values ranged from 0 (no
impact) to 05 (lesser impact) to 1 (full impact) and was assigned by park staff Table 5 shows each goal
area and associated weighted values for each road segment The term ldquoimpactrdquo in this setting may refer
to impact the input layer has on the transportation network or conversely impact the transportation
network has on the input layer To align with the VMPrsquos subzones of the Park Road each input layer was
weighted separately for individual road segments Weighted per segment reflects park management
priorities which may vary for a particular input by road segment The High Visitor Use Area input layer is
an example of this where the impact is higher in the front country compared to further west on the Park
Road Therefore the High Visitor Use Area input layer received a higher impact value in the front
country road segment
10
Table 5 Layer input ranks assigned by park staff
RESOURCE PROTECTION GOAL AREA
Motorized Sightseeing
Subzone
Wildlife Viewing
Subzone 1
Wildlife Viewing
Subzone 2a
Wildlife Viewing
Subzone 3
Wildlife Viewing
Subzone 2b
Sheep Gaps 0 05 1 05 0
Exotic Species 1 05 05 05 05
StreamRoad Intersections 1 1 1 05 1
Vegetation Monitoring Marker 0 1 1 05 0
Sheep 05 05 1 0 0
Moose 1 05 05 1 05
Bear 05 05 1 05 05
Wolves 1 05 05 05 05
Caribou (Aug-Sep) 0 0 05 1 0
Caribou (July ndashAug) 0 05 05 1 0
Caribou (May ndash June) 0 0 0 05 0
Wetlands 1 05 1 1 05
National Register Structures 1 1 1 1 1
Historic Districts 1 1 1 1 1
USER EXPERIENCE GOAL AREA
Motorized Sightseeing
Subzone
Wildlife Viewing
Subzone 1
Wildlife Viewing
Subzone 2a
Wildlife Viewing
Subzone 3
Wildlife Viewing
Subzone 2b
Viewscapes 0 05 1 05 0
Visitor Services 1 1 1 1 1
Social Trails 1 1 1 1 1
Visitor Pattern 1 1 0 0 05
High Visitor Use Area 1 05 05 05 05
ACCESS GOAL AREA
Motorized Sightseeing
Subzone
Wildlife Viewing
Subzone 1
Wildlife Viewing
Subzone 2a
Wildlife Viewing
Subzone 3
Wildlife Viewing
Subzone 2b
Safety Areas of Concern 05 0 05 05 0
Railroad Depot 1 0 0 0 0
Bus Stops 1 0 0 0 0
CLIMATE CHANGE GOAL AREA
Motorized Sightseeing
Subzone
Wildlife Viewing
Subzone 1
Wildlife Viewing
Subzone 2a
Wildlife Viewing
Subzone 3
Wildlife Viewing
Subzone 2b
Geohazards 05 05 1 1 05
Permafrost 05 05 1 0 05
COMPOSITE ANALYSIS STEPS 1 Once the input layers were weighted the values were added into new fields in the attribute
table The new field names were abbreviated with each goal area name and input layer number
For example Resource Protectionsheep gaps would read as RP1 since sheep gaps was listed
11
first in the data collection table Another example would be Resource Protectionexotic species
shown as RP2 The following shows goal area abbreviations
a Resource Protection ndash RP
b User Experience ndash UE
c Access ndash AC
d Climate Change ndash CC
2 Within each goal area the input layers were combined with the transportation network layer
using the UNION tool creating a goal area output layer This resulted in the following layers
RP_Union UE_Union AC_Union and CC_Union
3 Using the DELETE tool all fields were deleted except for the five road segment fields This
reduced the file size of the output layer for future geoprocessing steps and faster speeds once
added to the web map
Steps 4-6 refer to only one goal area and one road segment For example Resource Protection
(RP)Motorized Paved Zone (MPZ)
4 A new field called RP_T_MPZ was added to the RP goal area output layer to sum the total
values This was completed by using the FIELD CALCULATOR tool and summing the MPZ value
for each input layer (RP1_MPZ + RP2_MPZ)
5 Due to the goal areas having a different number of inputs the total sum value was normalized
to avoid skewing the outputs to goal areas with more input layers By normalizing the total
values could be shown on a common scale A new field was added and called RP_TN_MPZ Using
the FIELD CALCUALTOR tool the RP_T_MPZ value was divided by the total number of inputs
resulting in a normalized number (RP_T_MPZ14= RP_TN_MPZ)
6 The RP goal area output layer was then clipped to a previously created MPZ road segment layer
(RP_MPZ_Clip)
Steps 1-6 were repeated for each goal area and road segment In total twenty clipped output layers
were created Figure 3 shows steps 1-6 in a flowchart
12
Figure 3 Process diagram for PaTINA steps 1 - 6
Steps 7-9 refer to only the MPZ road segment
7 The next step utilized the UNION tool to union each clipped goal area output layer by road
segment (RP_MPZ_Clip UE_MPZ_Clip AC_MPZ_Clip CC_MPZ_Clip = MPZ_Clip)
8 Once the MPZ_Clip layer was created a new field called All_MPZ was added to sum the total
normalized numbers The FIELD CALCULATOR tool was used and summed each goal areas
normalized number (RP_TN_MPZ + UE_TN_MPZ + AC_TN_MPZ + CC_TN_MPZ = ALL_MPZ)
9 The overall MPZ composite was then symbolized based on the total MPZ normalized values
(ALL_MPZ) and was shown with five classes using Natural Jenks classification The five classes
were symbolized from very low (dark green) low (light green) medium (yellow) high (orange)
to very high (red) which identified potential need areas throughout the transportation network
Figure 4 shows symbolization for the front country area in road segment MPZ
13
Figure 4 Mapped Potential Need Areas for the Motorized Paved Zone
Steps 7-9 shown in Figure 5 were repeated for each road segment In total five segments showed very
low to very high potential need areas
Figure 5 Process diagram for PaTINA steps 7-9
14
SELECTED RESULTS
OUTPUTS The PaTINA analysis resulted in four main output groups which may be viewed individually or compared
to one another These groups are asset metrics high risk areas investment rankings and potential
need areas See the Data Collection section for review of these groups
Figure 6 shows potential need areas against high risk areas located in Wildlife Viewing Subzone 3
segment of the Park Road The results appear to have several high risk areas spatially coincident with
high need areas highlighting locations that may be considered for financial investment Doing so may
help protect park resources and visitor safety
Figure 6 High Risk Areas shown with Potential Need Areas modeled in the PaTINA
15
Figure 7 shows potential need areas against high investment ranking along the Wildlife Viewing Subzone
2 segment of the Park Road The investment ranking displays two sections which are Igloo Forest to
Sable Pass (MP 32 to 39) and Sable Pass to East Fork Bridge (MP 39 to 43) Within the high investment
sections potential needs can be identified for further examination for future investment
Figure 7 Example PaTINA-modeled Potential Needs Areas shown with investment ranking data
16
ROAD SEGMENT FINDINGS
Motorized Paved Zone The motorized paved zone starts at the park entrance at mile post 0 and ends at mile post 149 (Figure
8) In this segment it appears that the greatest amount of very high potential need areas are
concentrated around the Denali Visitor Center and high potential need areas are located just east of
that surrounding the Riley Creek Campground These potential need areas consist of up to twelve input
layers each of which fall within all goal areas Findings also show the Park Headquarters and Savage
River to be potential need areas with values of medium and high
Figure 8 PaTINA-modeled potential need areas for the Motorized Paved Zone segment of the Park Road
17
Wildlife Viewing Subzone 1 The wildlife viewing subzone 1 spans the distance between mile post 149 to mile post 319 (Figure 9)
and includes the Sanctuary River campground and the Teklanika River campground and rest stop The
Teklanika River campground shows the largest very high potential need area Up to twelve input layers
from three of the goal areas cover this segment The access goal is not included Findings also show the
Sanctuary River campground and west of the Primrose Ridge and Mount Margaret rest stop to be a very
high potential need area though the spatial area is smaller compared to the Teklanika River
campground This location is comprised of up to thirteen input layers from all goal areas
Figure 9 PaTINA-modeled potential need areas for the Wildlife Viewing Subzone 1 segment of the Park Road
18
Wildlife Viewing Subzone 2a The wildlife viewing subzone 2a ranges from mile post 319 to mile post 66 (Figure 10) and includes
locations from Igloo Creek campground to Eielson Visitor Center The findings suggest that there are
many high potential need areas along this segment of road The most prominent areas are located
before and after Polychrome Overlook and includes up to ten input layers along this stretch The Eielson
Visitor Center shows very high potential need areas with up to twelve input layers from three goal
areas These findings may suggest future investment at this location due to high use at the visitor center
Figure 10 PaTINA-modeled potential need areas for the Wildlife Viewing Subzone 2 segment of the Park Road
19
Wildlife Viewing Subzone 3 Milepost 66 to mile post 846 is the wildlife viewing subzone 3 segment (Figure 11) which begins east of
the Eielson Visitor Center and goes to the Wonder Lake campground Results show west of the Eielson
visitor center with the greatest concentration of very high potential need areas A majority of this
segment ranges from very low to medium potential need areas until farther west near Wonder Lake
Wonder Lake campground consists of up to ten input layers from three goal areas
Figure 11 PaTINA-modeled potential need areas for the Wildlife Viewing Subzone 3 segment of the Park Road
20
Wildlife Viewing Subzone 2b The wildlife viewing subzone 2b starts at milepost 846 to mile post 920 being the farthest west of all
road segments (Figure 12) The only very high potential need area in this segment is located east of
Kantishna Results display that the very high area has up to 12 input layers from three goal areas The
east side of this area shows high potential need suggesting that this stretch could be identified as an
area for potential future investment
Figure 12 PaTINA-modeled potential need areas for the Wildlife Viewing Subzone 2b segment of the Park Road
DISCUSSION The Park Transportation Investment Needs Analysis (PaTINA) employs standard geospatial methods that can be repeated to reflect changing management goals as well as be applied in different facility management situations and scales The web mapping application deployed with the data allows for frequent review and consultation of the results to inform management decisions
21
Execution of the methods however requires intensive data gathering and formatting Further the
weighting process is currently accomplished in a desktop GIS after subject matter experts are polled for
input weights This process could be improved with tool development in either the desktop environment
or the online web map to streamline how GIS data are included and weighted in the model While the
process in its current state is repeatable in most cases it requires a GIS specialist and a desktop GIS to
complete We foresee improving either the desktop or online tool (or both) to make the process more
accessible and rapid Depending on the data inputs however the overlaying process may still require
extensive data collection and preparation Additionally the overlaying process can be computer
intensive--again depending on the data inputs--and may be prohibitive due to available resources
The data collection process in this analysis identified data needs which are collated separately and listed
above under Goal Areas Acquisition and incorporation of these data may improve the PaTINA results
Visitor use statistics are an especially glaring omission which if obtained will improve future PaTINA
modeling
Seasonal variations in some inputs are not well represented in the analysis Further work may entail
modeling specific seasons to help inform investment strategy throughout the year
INTERNAL WEIGHTING The PaTINA applied to Denali NPampP weighted each input layer uniformly across the spatial extent of the layer However some data contained attributions that could be weighted differently Because the weights were assigned by park staff for each input layer based on the road segments further weighting based on attributes internal to a layer would unnecessarily complicate the composite scoring Future iterations of the model for Denali may consider applying layer attributes to vary weights across the layer instead of applying weights per road segment Alternatively the weights assigned by road segment could be normalized against the attribute weighting but the statistical validity of this needs to be explored
SKEWED DATA The initial run of the PaTINA model showed skewed results within the front country segment NPS staff
clarified that specific locations within the front country segment should have been identified as very
high or high potential need areas instead of low and medium rankings The main concern was around
the Denali Visitor Center and vicinity that included the railroad depot trailheads and visitor amenities
As a known high visitor use area the visitor center and surroundings should be considered a high
potential for investment The data and associated weights were examined and it was concluded that the
user experience goal area was lacking desirable input layers to validate higher rankings Once the
additional input layers were identified they were added to the next run model and results showed
important locations such as the Denali Visitor Center with higher rankings
SPATIAL SPREAD OF DATA Input layers across the goal areas differ spatially within the road segments The resource protection goal
area is the only goal area in which input layers coincide with the transportation network within all five
road segments User experience and climate change goal areas are within four segments with no data in
22
the last segment wildlife viewing subzone 4 The access goal area contains data only within the first
segment motorized sightseeing subzone Although input weights are normalized for each goal area the
spatial spread of the data influences the results where more inputs are occurring
The results show classes of potential need areas throughout the entire transportation network due to
some input layers completely overlaying it These layers are exotic species each of the mammal layer
inputs excepting sheep and permafrost Due to the spatial spread of these data every area of the
transportation network can be classified as at some level of potential need for investment
NEXT STEPS The data and web mapping interface will require maintenance as updated or new data and web
mapping tools become available We see the initial release of the web map for the Denali PaTINA as a
first step toward a more comprehensive tool to aid the park in investment decision making As noted
above stream-lining the weighting and model execution processes would improve the overall utility of
the PaTINA
Additional development of the PaTINA web map may include incorporation of other map services such
as the NPS Road Inventory Program and data services from the Inventory and Monitoring network
Conversely the base PaTINA results can be added to other web map applications that may focus on
other issues
Finally development of instructional materials and accompanying training sessions would bolster and
help maintain the utility of the PaTINA results and its application to park management
National Park Service US Department of the Interior
Denali National Park and Preserve Long-Range Transportation Plan
Appendix F Denali Funding Plan
Denali National Park and Preserve Financial Analysis Technical Report ndash FINAL DRAFT
Introduction This report discusses the transportation funding aspects of the Denali National Park and Preserversquos first Long Range Transportation Plan It includes a retrospective of transportation funding from 2006-2013 a projection of funds expected to be available for transportation during the planrsquos twenty year planning horizon and a summation of the resources necessary to return transportation facilities at Denali National Park and Preserve (Denali NPP) to ideal conditions As is true for all of the National Park Service (NPS) the amount of funding that is needed for transportation at Denali NPP exceeds the amount that will be available in coming years and so this report includes an investment strategy that funds the highest priority needs
The discussion must begin with two of the NPSrsquos guiding transportation investment principles and Denali NPPrsquos primary existing transportation document the Vehicle Management Plan (VMP) It then discusses Denali NPPrsquos place in Alaska Region transportation funding and the expected increase in funding needs due to climate change impacts The middle section of this report discusses the LRTP methodology in general and how the Denali NPP LRTP methodology differs from those used for other NPS LRTPs There is also a discussion of historical forecasted and needed transportation funding that collectively make up the baseline transportation funding report for Denali NPP
This report concludes with a discussion of the funding strategies which were evaluated for the Denali NPP LRTP and how the final strategy was selected The investment strategy prioritizes operations and maintenance the rehabilitation of the paved section of the Park Road funds the unpaved sections of the Park Road to achieve management priorities and provides approximately $1m per year to address other transportation priorities The Denali NPP transportation investment strategy is expressed with respect to each of the four LRTP planning scenarios to guide park management decisions during times when visitation is increasing or decreasing and when funding (or stakeholder support) is higher or lower than average Funding shortfalls means that the condition of all transportation assets cannot be improved but progress can be made to address the highest priorities
Funding Denali Transportation Facilities
Capital Investment Strategy and Total Cost of Facility Ownership As a best practice and formal policy the NPS incorporates strategic facility planning into its asset management decision-making processes including LRTPs Two fundamental concepts the NPS Capital Investment Strategy (CIS) and Total Cost of Facility Ownership (TCFO) underlie those best practices and are drivers of the investment planning and decision-making reflected in the Denali LRTP
The NPS Capital Investment Strategy The CIS is an NPS strategy for prioritizing project investment to ensure effective and responsible project funding The CIS includes a scoring tool that decision-makers at all levels of the NPS have available to them to inform project investments and other asset management needs
The purpose of the CIS is to help prioritize investments focus on mission-critical assets manage operations and maintenance and ensure that the greatest impact can be made with available capital and operational funds The CIS uses a scoring tool to evaluate projects on a number of different criteria Financial Sustainability Visitor Experience Resource Protection and Health amp Safety The four categories are weighted using a predefined algorithm to arrive at an overall project score Projects can then be compared by score as needed in theory the greater the score the higher the priority The scoring strategy supports an asset management approach that emphasizes maintaining key assets and reducing the estimated value of deferred maintenance cost against those key assets
Some of the key objectives in the Financial Sustainability strategy are to build only what can be maintained right-size the asset portfolio reduce liabilities reduce resource consumption to promote sustainability and eliminate non-essential development in order to emphasize the essential natural and cultural experience The Visitor Experience strategy includes investment in assets or resources that enable recreation and serve as gateways to park units contact stations and interpretive assets The Resource
DenaliLong Range Transportation PlanFinancialTechReportndashFINAL DRAFT 1
Protection strategy focuses on those historic cultural and natural resources that the NPS is tasked with protecting and preserving Such tasks supported by the CIS could include preservation repair and restoration of assets Finally the Health amp Safety strategy places an emphasis on correcting unsafe or hazardous conditions within park units that pose a threat to visitors or staff Different parts of the Denali LRTP address these four strategies which are used by fund program managers to allocate limited funding
Total Cost of Facility Ownership Applying the concept of Total Cost of Facility Ownership (TCFO) is considered by the NPS to be a vital part of a financially sustainable infrastructure strategy and practice to truly address transportation asset management1 It aligns closely with the intentions behind the CIS especially the CIS Financial Sustainability component TCFO is the full life-cycle cost of constructing maintaining and operating an asset until it needs replacement This concept recognizes that assets require investment throughout their service lives until they need replacement or disposition and that preventive maintenance and facility operations activities are key to minimizing long-term costs and optimizing the life of said assets Implementation of the TCFO concept involves a shift-away from a ldquojust fix itrdquo or ldquorun to failurerdquo mentality to more holistic planning making cost estimates and decisions that consider not just the deferred maintenance (DM) of an asset but the ongoing OampM need over its service life need for replacement and ultimately disposition
The Denali LRTP team took the concepts inherent to the CIS and TCFO and embedded them into all of its LRTP analyses and planning activities Consequently the resulting investment strategy selected by Denali NPP staff is consistent with the approaches and practices used across the NPS to develop for example the National LRTP and other unit or regional LRTPs
The Denali Park Road and the Vehicle Management Plan Denali NPP is one of the most visited National Park Service units in Alaska and the Denali Park Road is the means for the majority of visitors who wish to traverse deep into the interior by any mode motorized or otherwise For many visitors it is the most readily accessible transportation corridor for them to experience the Alaska wilderness and for some it is their only option Denali NPP is currently several years into the implementation of its VMP the culmination of an intensive planning effort to balance the needs of the parkrsquos natural resources with high visitor demand The Denali LRTP is consistent with the recommendations in the VMP
Generally the VMP recommends limiting vehicle traffic on the Denali Park Road in order to reduce traffic impacts on natural and cultural resources The VMP has a ldquotelescopingrdquo approach where visitor activity is highest and associated development is most extensive in the paved entrance area of the park and declines and lessens respectively as the Park Road heads west As shown later in the section on Funding Strategies the Denali LRTP reflects this by realigning maintenance and rehabilitation investments along the Park Road to concentrate on the areas of highest visitor activity and most extensive development
Funding Trends The Federal Lands Transportation Program in the NPS Alaska Region The Federal Lands Transportation Program (FLTP) is the single largest source of transportation funding for the National Park Service and other Federal land management agencies Project funding decisions are made at the regional level following national guidelines The FLTP at a national scale has recently been reauthorized at a higher funding level than analyzed in this plan However interim program guidance suggests that the majority of the increase will be reserved for nationally significant major projects with only a small increase to regional allocations
Denali NPP has historically been the largest recipient of FLTP funding in Alaska in part because 20 of the Regionrsquos 27 miles of paved roads are within Denali NPP The unpaved Park Road may also be funded by FLTP NPS regional staff indicate that Denali NPP has in the past received all funding from the program by default unless another NPS Alaska Region park unit has eligible needs (which is rare) at which point that project from another park unit moves to the top of the regional FLTP program This means that FLTP will likely be a sustainable funding source for major investments at Denali NPP into the future The next three years of FLTP investment at Denali will be primarily used to rehabilitate the 15 mile paved section of the Park Road from the park entrance to the Savage River checkpoint
1 For example reference ldquoMemorandum Guidance for Addressing Facilities in Planning Documentsrdquo Associate Director Park Planning Facilities and Lands
National Park Service US Department of the Interior January 4 2016
DenaliLong Range Transportation PlanFinancialTechReportndashFINALDRAFT 2
Climate Change and Geotechnical Hazards As explained elsewhere in the LRTP current research indicates climate change is dramatically affecting transportation facilities across Alaska The impacts of climate change relevant to Denali NPPrsquos transportation system include thawing permafrost unstable slopes a lengthening shoulder season and other change indicators Most of these changes will result in higher costs to operate and maintain Denali NPPrsquos transportation network which will further stress already limited funding
Monitoring and evaluation of climate change impacts is an ongoing need and a recommendation of this LRTP Tracking threats and hazards to the transportation system such as unstable slopes requires funding for specialized equipment and the technicians and scientists who collect and analyze the data Funding updates to hydrology models and monitoring permafrost thawing are other near-term relatively inexpensive data needs that can help avoid disastrous impacts over the medium to long term Denali NPP has initiated the effort but funding has not been identified for developing specific plans for how to adapt the transportation system in the park to these expected impacts
In the near term a number of susceptible areas along the Park Road will likely encounter more frequent closures due to intermittent landslides flooding or debris flows with each requiring cleanup and reopening The future impacts of one of the effects of climate change increasing precipitation in the Denali Borough region can already be previewed during excessively wet years 2016 was a particularly wet year and staff were faced with unstable slopes and more frequent and more severe debris flows Beyond the cost of cleaning up after these road closures there are short-term disaster management tasks for which Denali must be ready ndash evacuation or care of visitors staff users and inholders on the far side of an interruption
Some dedicated funding sources are available for recovery costs such as NPS Emergency Storm amp Flood Damage and FHWArsquos Emergency Relief for Federally Owned Roads (ERFO) These programs have limited budgets and will be increasingly strained in an era of continued climate change impacts not just in Denali NPP but across the National Park Service These funding sources are currently limited to recovery costs only and cannot be used for monitoring or preventive work that can anticipate and avoid a future event such as by stabilizing slopes or realigning a road
There are several segments of the Park Road and its associated bridges and structures that may become physically or financially untenable in the next few decades There may come a time when the park will need to consider decommissioning rerouting andor relocating these facilities These costs are not yet known but will likely far exceed Denalirsquos typical past annual funding and may require special major project funding US Department of Transportation (DOT) discretionary grants such as the (unfunded) Nationally Significant Federals Lands and Tribal Projects program or Transportation Investments Generating Economic Recovery (TIGER) are possible sources as is the NPS Line Item Construction program However because these needs are not yet quantified and because they are beyond the capacity of the current funding programs to address the costs of fully adapting the transportation system to climate change are not included in the Denali LRTP financial analysis
Denali LRTP Funding Baseline Financial Analysis Methodology The financial analysis methodology for the Denali LRTP is based on the data and methods first developed for the NPS National LRTP (NLRTP) A much more detailed technical summary is available for the NLRTP and generally applicable to the Denali LRTP but this section will cover the basic steps as well as deviations used to adapt it to the unit level
Historical Investments Establishing a financial baseline of the historical average annual level of regional transportation spending provides a foundation for forecasting the
Annual transportation investments at Denali likely future available funding levels which can be anticipated for Denali NPP averaged $923 M per year from 2006-
NPPrsquos transportation facilities This is important information for developing a 2013 from all funding sources combined fiscally-constrained LRTP The LRTP team analyzed all of the fund sources that had been used for transportation investments at Denali NPP from fiscal year (FY) 2006 through FY 2013 These results provide a vital context for developing the Denali LRTP investment strategy
DenaliLong Range Transportation PlanFinancialTechReportndashFINALDRAFT 3
The LRTP team estimates that approximately $775 M per year will be available to Denali NPP for transportation purposes over the next six years
The financial data was extracted from various financial and project management data tracking systems2 The LRTP team
identified historical expenditures awards and authorizations for transportation assets
adjusted those prior year dollar values to equivalent 2014 values using GDP inflation factors and
calculated an annualized average transportation funding expenditure rate for the period FY 2006 ndash FY 2013
This data was initially prepared by the National LRTP team and then reviewed by the Denali LRTP team to remove any anomalies To simplify reporting the dataset was consolidated coded and grouped by funding authorizations funding programs work types and asset types All identifiable American Recovery and Reinvestment Act (ARRA) investments a one-time extra-ordinary funding source were removed from this analysis A detailed technical methodology document is available from the NLRTP effort
Because the data only includes transportation expenditures made by the National Park Service it does not include transportation
each funding source that Denali NPP has recently used for transportation It
funding and support with an increase in visitation) or ldquoSurplus of Moneyrdquo scenario (increased funding and support with a decrease in visitation) when compared to the historical average However for the purposes of the investment strategy in this plan the funding forecast is considered to be at the center of our ldquoManagement Strategies of no Regretrdquo - those actions that make sense given a normal variation in expected support funding and visitation levels
The Denali LRTP team leveraged the approach applied in the development of the NPS National LRTP to forecast anticipated funding availability for transportation investments in the near future There were two main sources of forecasting information
The NPS budget office The Budget Office conducts forecast exercises servicewide and with individual units The Budget Office suggested the LRTP program assume a one-time reduction to Title 54 (DOI) Non-Fee program fund sources of three percent for ONPS and Cyclic Maintenance programs in the NPS National LRTP The DENA LRTP forecast was based on a combination of actual funding program investment plans where possible and the three percent cut when it wasnrsquot The three percent reduction only applied to programs for which the Denali LRTP project team did not have access to an investment plan (eg Operational Base)
Regional Funding Programs The Denali LRTP project team consulted several regional-level program plans to acquire information on planned investment levels Title 54 Non-Fee programs for Cyclic Maintenance RepairRehabilitation and Line Item Construction Title 16 54 Fee programs for Recreation Fee Transportation Fee and Concession Franchise
investments by third parties The parkrsquos partners such as the Alaska Railroad bus concessioners Denali Borough and the Alaska Department of Transportation and Public Facilities (ADOTampPF) all fund transportation work that helps visitors employees inholders and freight carriers access the park However these investments are not accounted for in this analysis because these data do not enter NPS financial data systems
Forecasted Transportation Funding This section documents the Denali NPP financial forecast for transportation based on anticipated future funding levels that can be reasonably assumed to be available The forecast of available funding provides the principal financial constraint against which future investment plans must be prioritized and represents the result of the most likely funding scenario for
does not include a forecast for work done by other parties such as the State of Alaska or Denali Borough that may benefit Denali NPP and it also doesnrsquot include any unforeseen additional funding which may result in a ldquoPopular Parkrdquo scenario (increased
Fees and the Title 23 Federal Lands Transportation Program These forecasts replaced the National LRTP-style (ie three percent reduction) forecasts for these programs as they provide more certainty than broad program-level authorizations and appropriation amounts
The elimination of the Paul S Sarbanes Transit in the Parks Program (TRIP) is another factor to note in the forecast but the only analysis needed is to not project any future grant awards from this program Denali made use of TRIP in the past but will need to seek other funding sources to fund future transit and trails projects This is also true of various grant programs formerly used by many parks but not Denali NPP such as Scenic Byways or the Public Lands Highway Discretionary Program
2 Systems used included the NPS Administrative Financial System (ie AFS Versions 3 and 4) and the joint Federal Highway Administration (FHWA)NPS Park Roads and Parkways Transportation Allocation and Tracking System aka PTATS
DenaliLong Range Transportation PlanFinancialTechReportndashFINALDRAFT 4
Unfortunately transportation funding for Denali NPP is expected to decline unless additional funding sources are found or funds are redirected from other critical areas The declining funding environment coupled with historically high visitation may result in a ldquoLosing Groundrdquo scenario (decreased funding and support with an increase in visitation) when compared with historical averages These conditions are not dissimilar from recent years (eg 2013-2015)
Transportation Investment Needs Investment needs are defined in this plan as the amount of funding required to bring transportation assets to good condition and sustain them at that level Investment needs also include costs to address programmatic needs such as code compliance structural fire and accessibility Other goal area needs such as resource protection may overlap with asset management (TCFO) needs or may be additional potentially unfunded requirements
The LRTP team estimated an annual need of $1242 M to return the Denali NPP transportation system to good condition and keep it there over six years
The Denali LRTP used a similar methodology as the National LRTP and other Regional LRTPs using needs data from the best available data system or report that covers a particular type of transportation facility and type of work However many of the reports and systems available at the regional or national level do not apply to individual parks The principal difference between the needs in the Denali LRTP is the use of automated systems The data sources used for the Denali LRTP are
Reoptimization File OampM needs for all facilities except the unpaved Park Road
2013 Alaska Region Unpaved Road Analysis (pilot) Detailed analysis for the unpaved Park Road
Facility Management Software System (FMSS) Component renewal and programmatic needs
Project Management Information System (PMIS) Capital investment needs planning naturalcultural resources
National list of megaprojects Paved Park Road repair project and replacement of the Toklat River Bridge
Differences between the needs sources such as timespans and prioritization systems were reconciled in order to create a single set of transportation facility needs for Denali NPP Park staff also reviewed the needs data and removed several projects that were already underway or would be accomplished through partners rather than by the park At $1242 M per year the estimated annual transportation investments needs exceed the annual transportation funding amount by $467 M per year
Transportation Funding for Denali NPP This section discusses the current and near future transportation funding outlook for Denali NPP It covers where funds have come from and how they have been used in terms of what type of transportation facility was funded what type of work was funded and how transportation funding is prioritized
Investments by funding source From 2006-2013 the National Park Service as a whole used more than 60 different funding program and accounts to fund transportation activities but only ten programs funded investments at Denali NPP Table 1 below shows how much each funding program provided in the past how much it is expected to provide in the future and how much would be needed from each funding program to cover Denalirsquos total transportation need each year if past investment patterns were continued
DenaliLong Range Transportation PlanFinancialTechReportndashFINALDRAFT 5
Table 1 Denali NPP Transportation Investments and Needs by Funding Source (in millions of 2013 $)
Investments by funding source
Historical Average Annual Investment
Forecasted Annual Average Investment
Estimated Annual Needs
Title 54 Non‐Fee $175 M $101 M $335 M
Cyclic Maintenance $063 M $004 M $001 M Line Item Construction $034 M $032 M $007 M Operational Base $064 M $055 M $270 M Other NPS Programs $007 M $007 M $019 M
RepairRehab $007 M $002 M $039 M
Title 54 Title 16 Fee $134 M $211 M $261 M
Concessions Franchise Fees $067 M $144 M $051 M
Recreation Fee $067 M $067 M $210 M
Title 23 $601 M $462 M $586 M
FLTP $601 M $462 M $586 M
OtherExternal $014 M $001 M $060 M
FTA TRIPATPPL $012 M ‐‐ ‐‐
Reimbursable Agreements $001 M $001 M $060 M
Grand Total $923 M $775 M $1242 M
Each of these funding programs have a different legislative authorization and project eligibility criteria Title 54 programs are those authorized by Title 54 of the US Code (National Park Service-specific programs) Title 16 includes other relevant Department of the Interior programs (ie Recreation Fee Program) Title 23 includes programs overseen by the Federal Highway Administration and the ldquoOtherExternalrdquo category includes other funding sources such as the discontinued TRIP program as well as reimbursable agreements donations partnerships and other less common sources
Investments by Facility Type
Denali NPP maintains a diverse system of transportation facilities including paved and unpaved roads bridges paved and unpaved transportation trails transit facilities developed airstrips as well as support infrastructure such as a materials (gravel) quarry Table 2 below shows historical investments forecasted investments and the estimated annual investment needs for each of the parkrsquos transportation facility types
Of all historical investments in transportation at Denali NPP in the recent past about 55 went to the Park Road and associated structures and 18 supported parkwide operations that include the Park Road Less than a third was used for separate transportation facilities such as trails and access roads Park Road funding was oriented to the unpaved segments that require frequent repair work to remain in even fair condition given the extreme conditions and heavy vehicle traffic in Denali NPP Recent investments in several difficult sections in the western end of the Park Road helped restore user comfort and safety
DenaliLong Range Transportation PlanFinancialTechReportndashFINALDRAFT 6
Table 2 Denali NPP Transportation Investments and Needs by Asset Type (in millions of 2013 dollars)
Historical Forecasted Average Annual
Average Annual
Estimated Annual
Asset Type Unpaved Roads
Road Bridges
Trails and Transit
Investment $386 M
$184 M
$147 M
Investment $235 M
$042 M
$066 M
Needs $527 M
$135 M
$137 M
Paved Roads $144 M $291 M $297 M
Other3 $051 M $053 M $066 M
Parking $011 M $089 M $081 M
Grand Total $923 M $775 M $1242 M
Historical Forecasted Average Average Estimated Annual Annual Annual
Lifecycle Stage Investment Investment Needs Planning and Administration4 $058 M $057 M
Capital Investment $134 M $259 M $130 M
Operations and Preventive Maintenance $045 M $048 M $186 M
Recurring Maintenance $142 M $083 M $374 M
Component Renewal $527 M $259 M $508 M
Grand Total $923 M $775 M $1242 M
Denali NPPrsquos greatest area of transportation investment need is in heavy repair and rehabilitation work similar to much of the rest of the National Park Service Insufficient funding often leads to smaller routine maintenance work being deferred which causes transportation facilities to fall out of a state of good repair Other significant needs at the park include annual operations and maintenance of transportation facilities and making improvements to culverts that provide for fish passage and building an aircraft hangar
Note that some categories such as capital investment show ldquosurplusesrdquo where more funds are forecasted for investment than are needed This is the result of project programming where several capital investment projects are scheduled for near-term
Investments by Asset Lifecycle stage As discussed in the section on Total Cost of Facility Ownership different types of work are needed at different points in a transportation facilityrsquos lifespan from planning through to rehabilitation or disposition Table 3 below shows historical and forecasted annual investments as well as estimated annual investment needs for each lifecycle stage for all asset types combined
Table 3 Average Annual Investments by Lifecycle Stage (in millions of 2013 dollars)
construction in 2016-2021 whereas the needs represent the average annual needs over twenty years
3 Other category includes aviation buildings that support transportation equipment and multimodal facilities Trails and Transit notably excludes investments and OampM spending made by the transit contractors who operate within Denali NPP but does include Denalirsquos own investment in bus transit facilities such as buildings lots and experimental hybrid buses 4 Routine planning and administration needs are not included in NPS facilities management data systems but can be assumed to continue at historical levels Additional unquantified planning needs are likely in the LRTPrsquos horizon including work in the parkrsquos entrance area coordination with private shuttle services and the Alaska Railroad and transportation planning to maintain park operations in the face of climate change impacts
DenaliLong Range Transportation PlanFinancialTechReportndashFINALDRAFT 7
Priority Estimated Annual Optimizer Band Equivalent Transportation Needs
Highest Priority $377 M Band 1 High Priority $584 M Band 2 Other Priority $281 M Bands 3 4 5
Programmatic Needs Some of the lifecycle stage needs are also considered programmatic needs for transportation facilities at Denali NPP Programmatic needs include work necessary to meet standards set by safety accessibility environmental and fire safety requirements It is generally analogous to code compliance work that would be the responsibility of a facilities manager or an architect hired by a private business
Figure 1 summarizes estimated programmatic needs for the Denali NPP transportation asset portfolio which total less than $300000 Transportation facilities generally have relatively small programmatic needs compared to facilities such as visitor centers housing and offices Although not broken out in the historical and forecast data these types of projects are included in the NPS Facility Management Software System (FMSS) as needs Denali NPPrsquos programmatic needs are included in the overall $1242 M per year needs as capital investment or component renewal needs They are classified as capital investment if plans are to proactively address them as individual projects or as component renewal when addressed through a rehabilitation project that focuses on a low condition rating
Figure 1 Denali NPP Transportation Programmatic Needs
Investments by Asset Priority The final classification for investments is what priority of assets they were used to build maintain or repair NPS financial and asset management systems do not support this analysis for the historical or forecast data Each future investment need at Denali NPP is associated with the priority of the asset or the project itself this is shared below in Table 4 For the purposes of this plan Highest Priority is generally defined as Optimizer Band 1 High Priority is defined as Optimizer Band 2 Optimizer bands 3-5 are defined as ldquoother priorityrdquo Although they are not banded as such critical Park Road work is labeled as Highest Priority consistent with the priorities discussed during the investment strategy section later in this report
Table 4 Estimated Annual Needs by Priority
Denali NPP differs from other National Parks and the NPS as a whole due to the relatively low proportion of the total need in the highest
DenaliLongRangeTransportation PlanFinancialTechReportndashFINALDRAFT 8
priority need category Many transportation facilities in Denali NPP have been categorized in optimizer bands 2-5 This reflects the values laid out in Denali NPPrsquos Foundation Statement that place a high priority on investment in resource protection science and other portfolio areas ahead of transportation and broader visitor use needs As a result the park is able to cover its entire highest priority transportation needs given current funding In fact the $775 M per year in forecasted funding is enough to cover 80 of the highest and high priority transportation needs combined However there are still high priority transportation needs that will remain unmet unless additional funding is found and longer-term and lower-priority needs that cannot be met with forecasted funding
Investment Strategies The final step of the financial planning process for NPS LRTP development is the formulation of an investment strategy It is a synthesis of the planrsquos goals and objectives already formulated projects and other transportation-related needs and the reality of the constraints that exist in the current funding environment This section of the report describes the process used by the Denali LRTP team to identify several potential investment strategies including the strategy selected by Denali NPP staff for the Denali LRTP It also discusses potential alternatives which park management may consider if future funding or visitation deviates significantly from the forecast referencing the planning scenarios used in the development of the Denali LRTP
Methodology The key to understanding the funding strategy process is that funding in a constrained environment is a zero-sum game All investment strategies make use of the same $78 M annual funding amount that is forecasted for the near future Because transportation needs exceed this amount and because moving funds from other purposes deprives those projects of needed funding all investment strategies shift funds from one set of priorities to another The OampM strategy option shown in Table 5 for example focuses on staying current on annual operations and preventive maintenance work at the expense of larger repair projects
Unlike the plans for the National Capital Southeast Midwest Regions and the NPS as a whole the Denali LRTP used a single modeling tool to model the results of the different funding strategies on the Denali NPP transportation system A deferred maintenance (DM) FMSS-based tool was modified by a contractor (Booz Alan Hamilton) to work at the unit level and take into account park specific facilities such as the unpaved Park Road This tool uses extracts from FMSS to estimate Facility Condition Index (FCI) and DM outcomes given a known annual funding level The FCI outcomes reported for this effort are lsquoAdjusted FCIrsquo which includes programmatic needs and an anticipated 35 cost markup in addition to the ldquorawrdquo DM normally used in calculation of the FCI
Strategy Development Process
Methodology and Initial Strategy Concepts The team held several workshops and follow-up discussions with NPS stakeholders and partners to identify candidate strategies and to select the Denali NPP LRTP Investment Strategy (p 12) Internal NPS stakeholders included Denali NPP staff Alaska Region staff and the Washington Support Office (WASO) Partner input included expertise from FHWA Western Federal Lands Highway Division and US DOT Volpe Center staff familiar with the NPS LRTP financial planning process
The team worked with stakeholders to identify potential candidate strategies in light of CIS and TCFO policies best practices and past investment patterns (see Table 2 and Table 3) The initial investments strategies are shown in Table 5 below and were based on trends discussed by the project team early on in the Denali LRTP
DenaliLong Range Transportation PlanFinancialTechReportndashFINALDRAFT 9
The reaction to the strategies from park staff indicated high interest in the OampM strategy ndash if the park is able to at least stem the growth in deferred maintenance using its typical transportation funding sources then the park can later seek out additional funds to rehabilitate facilities that are no longer in a state of good repair The specificity of the three strategies that make different kinds of improvements was eliminated in favor of a general ldquomake improvementsrdquo strategy since transit and trails enhanced ITS and safety and emergency response are all priorities at the park that vary from year to year Finally Denali NPP staff noted that given its current condition the unpaved section of the Denali Park Road could still be one of the best unpaved roads in Alaska even with a reduction in maintenance levels so exploring redirecting some funding from the Park Road to other facilities in the park might be
Table 5 Initial Investment Strategy Concepts
Investment Strategy Option
Invests inhellip At the expense ofhellip
Business as usual Highest priority assets Lower priority assets
OampM emphasis Fund 100 of annual OampM needs for all assets Capital investments and rehabilitation
Transit and trails $1 M for existing transit and trails before other investments $1 M for roads and parking
Make improvements $1 M per year for new assetsservices (eg employee transit real-time bus trackers new trails)
$1 M less for annual OampM and rehabilitation
Safety and programmatic needs
Programmatic and safety needs before everything else (eg accessibility slope stability)
$1 M less for annual OampM rehabilitation
a viable option Various sections of the Park Road meet different condition criteria from good to fair to poor
Refined Investment Strategies No one strategy rose above others as a preferred strategy in the first round of modeling but the number of strategies was narrowed to two Both strategies funded all operations and maintenance needs and ensure that planned projects such as the paved Denali Park Road rehabilitation are completed but one option set aside $1 M per year for improvements or new facilities Table 6 below shows the tradeoffs of the two refined general strategies
Table 6 Refined Investment Strategies
Strategy Invests inhellip At the expense ofhellip
Cover all OampM complete planned projects
OampM and critical near-term repair needs
Making improvements
Cover all OampM complete planned projects and reserve $1Myr for improvements
OampM critical near-term repair needs and improving transportation at Denali
Buying down deferred maintenance
Unpaved Denali Park Road Analysis In addition to these two strategies Denali NPP staff also wanted to test whether transportation funds allocated to the unpaved Park Road in a business as usual approach could be shifted to other purposes The LRTP team as well as staff from Denali NPP and the Alaska Region developed five different options for unpaved road condition targets that could be modeled to estimate costs of different sets of conditions Table 7 below summarizes these five sets of condition targets Each of the two general strategies were tested using the five sets of condition targets for a total of ten investment strategy and condition results The strategies in Table 7 highlighted in red were not achievable give projected funding levels and established higher priorities
DenaliLong Range Transportation PlanFinancialTechReportndashFINALDRAFT 10
Table 7 Unpaved Park Road Conditions
Strategy Goals Annual Cost
Plan A Maintain all Park Road segments in good condition $43 M
Plan B Maintain all Park Road segments in fair condition $37 M
Plan C Set Park Road conditions from segment to segment recognizing that some segments are costlier to maintain in good condition than others
$29 M
Plan D Follow the VMPrsquos ldquotelescopingrdquo approach by keeping conditions good in the first part of the road fair in the middle part and poor at the western end
$25 M
Plan E Follow the VMPrsquos ldquotelescopingrdquo approach by keeping conditions good to fair in the first to middle parts of the road and poor at the western end
$27 M
Plan F VMP ldquotelescopingrdquo approach as in Plan E but with further lowered condition targets for two of the most expensive areas - MP 43-47 and MP 88-92
$20 M
Refined Strategy Results
general strategy was discarded Even without reserving $1 M per year projected funding is insufficient to meet the good to fair
Unlike the initial strategies several of the refined strategies were not viable None of the condition targets on the unpaved Park Road could be met if Denali NPP was to reserve $1 M per year for making improvements elsewhere on the park and so that
conditions proposed under plans A and B for the unpaved park road without scaling back commitments to OampM planned repaving of the paved sections of the Park Road and the rest of Denali NPPrsquos transportation facilities Additional funding could make Plans A and B possible ndash about $13 M per year more would allow for Plan A to be achieved and $07 M more per year would allow plan B to be achieved
Plans C D E and F are viable given currently constrained funding levels Plan C shows that it is possible to meet all of the investment strategyrsquos commitments and still maintain the unpaved Park Road on a segment-by-segment basis The conditions explored in Plan C take the relative expensive of each segment into account and the most difficult segments are allowed to remain in fair to poor condition However modeling showed that meeting these conditions would provide almost no funding for other transportation priorities
Plan D applies the Vehicle Management Planrsquos ldquotelescopingrdquo approach to the maintenance of the unpaved Denali Park Road and targets mid-poor condition for the farthest west segments which are intended to be more rustic and less traveled but keeps the middle and eastern segments in fair to good condition Under this plan nearly $05 M per year would be available for other transportation priorities Plan E made slight changes to keep more of the road in good condition instead of fair
Plan F was ultimately selected as the condition target for the Denali NPP LRTP This option retains the approach of Plan E but reduces condition targets for two sections which are particularly challenging and expensive to maintain Under plan F Polychrome Pass would be improved slightly (but still be in poor condition) while the final stretch of the park road would be allowed to decline to poor condition These two changes free about $06 M per year for use elsewhere on the road and in Denali NPP More information about these two segments is provided in Appendix A at the end of this technical report
Denali LRTP Investment Strategy The refined strategy results narrowed down the policy options for the unpaved Park Road and led to the selection of the Denali LRTP Investment Strategy as the best fiscally-constrained option for meeting the goals and objectives of the plan This strategy
DenaliLong Range Transportation PlanFinancialTechReportndashFINALDRAFT 11
would invest Denalirsquos forecasted $775 M per year in four categories as shown below in Table 8 and Error Reference source not found below
Table 8 Denali NPP LRTP Investment Strategy
Category Estimated share Estimated annual Percentage of of annual funds investment needs met
Operations and Preventive 37 $29 M 100 of needs Maintenance (all met transportation assets)
Rehabilitate Paved Portion of 24 $19 M 100 of needs the Denali Park Road met
Repair and Maintain the 26 $ 20 M 46 of needs met Unpaved Portion of the Denali Park Road
Repair and Improve Other 13 $ 10 M 24 of needs met High-Priority Transportation Assets
Totals 100 $ 78 M 63 of all needs met
The Denali LRTP Investment Strategy strikes a balance between several different priorities for transportation at the park and lies within the ldquoManagement Actions of No Regretrdquo area of the Denali LRTP scenario chart The strategy proposes to fully fund OampM needs in order to slow the decline of facilities and ensure a better visitor experience It continues planned investments on the paved section of the Park Road to achieve a good condition rating and continues to make funding available to address deferred maintenance on the unpaved sections of the Park Road However the strategy sets lower condition targets for sections of the unpaved Park Road which are further into the park and which are less traveled by visitors in order to reserve funding for other segments of the Park Road and for entrance area transportation facilities (eg aviation parking areas new priorities) This approach is consistent with the Vehicle Management Plan which envisions lower traffic volumes and a more rustic experience the further the road extends from the park entrance area
Ultimately because funding needs exceed available resources the condition of transportation facilities at Denali NPP is expected to decline overall FCI ratings across the Denali NPP transportation system today are modeled at 0148 or the low end of fair condition Continued scarce funding for transportation will reduce conditions to 0185 by 20215 However higher priority transportation facilities are expected to remain in fair condition overall as described by the Investment Strategy
5 FCIratings are modeled on a 0‐1 scalewhere0000isperfect conditionand1000iscompletelydegradedcondition
DenaliLong Range Transportation PlanFinancialTechReportndashFINALDRAFT 12
DenaliLRTPInvestment Strategy 13
37
26
24
OperationsandPreventiveMaintenance(all transportationassets)
RehabilitatePavedPortionoftheDenaliParkRoad
RepairandMaintaintheUnpavedPortion ofthe Denali Park Road
RepairandImproveOtherHigh‐PriorityTransportationAssets
The funding forecast in the Denali LRTP is only the most likely scenario for each program and in reality the amount of annual transportation funding will vary as will visitation Table 9Error Reference source not found below shares some management actions for when funding and visitation levels take Denali NPP out of the area of management actions of no regret Generally when visitation is lower it is a better time for disruptive work such as addressing major needs and accomplishing maintenance projects that were deferred Times of high visitation call for more investment in OampM and investment in new services to meet emerging visitor needs When funding prospects are good then more money is available to make improvements catch up on deferred maintenance and prepare plans for the future When funding is short then many necessary improvements have to be delayed and park staff can only fund core operations and critical repair work
Figure 2 Denali LRTP Investment Strategy
Denali Investment Strategy and LRTP Scenarios All of the funding strategies considered for the Denali NPP LRTP assumed the same funding forecast and would fall within the ldquoManagement Actions of No Regretrdquo area on the scenario planning graphic reproduced in Error Reference source not found below This area represents a balance between times of high and low visitation and high and low funding for the park It is calibrated based on an average of funding and visitation over time Years within one standard deviation of these means lie within it if they are more than one standard deviation away from the average then they are said to be in one of the four ldquoquadrantsrdquo
DenaliLong Range Transportation PlanFinancialTechReportndashFINALDRAFT
Figure 3 Denali LRTP Scenarios
13
Table 9 Potential Management Actions by Scenario
Losing Ground Popular Park
Emphasize more of Funding OampM Introducing new services
Emphasize less of Making improvements Funding deferred maintenance Initiating major capitalrehabilitation projects
Emphasize more of Funding OampM Making improvements Introducing new services Planning for future needs
Emphasize less of Funding deferred maintenance Initiating major capitalrehabilitation project
Turn out the lights Surplus of Money
Emphasize more of Funding deferred maintenance
Emphasize less of Funding OampM Making improvements Introducing new services
Emphasize more of Making improvements Funding deferred maintenance Initiating major capitalrehabilitation projects Planning for future needs
Emphasize less of Funding OampM Introducing new services
14DenaliLong Range Transportation PlanFinancialTechReportndashFINALDRAFT
Appendix A Unpaved Park Road Condition Targets
Unpaved Denali Park Road Condition Targets Plans C D and E for the unpaved Denali Park Road examined options for managing each segment of the road to an individually set condition target Each of these targets is based on the overall Vehicle Management Plan and accounts for past challenges or known issues with individual segments Plan F was ultimately selected for its ability to maintain acceptable condition levels while also freeing up funding for other transportation needs In particular Plan F was selected because the condition targets reflect the overall management approach to the road where the western-most sections are desired to be more rustic and remote-feeling and the eastern-most sections are in better conditions to handle more intensive use Tables 10 and 11 below summarizes the conditions for the unpaved segments of the Denali Park Road under the Denali LRTP investment strategy
Conditions are measured in FCI where a higher value represents worse condition and a lower value represents better condition FCI data for the unpaved Park Road is based on estimates by staff responsible for maintaining the unpaved Park Road after the 2016 opening
Table 10 Conditions of Unpaved Segments of Denali Park Road Reflected in Denali LRTP Investment Strategy
Mileposts Segment Name Current Condition
Target Condition
Change in Condition
MP 15 to 32 Savage to Teklanika Bridge Low‐good High‐fair Small decline MP 32 to 39 Igloo Forest to Sable Pass Mid‐fair High‐fair Small improvement MP 39 to 43 Sable Pass to East Fork Bridge Mid‐fair High‐fair Small improvement MP 43 to 47 Polychrome to Plains of Murie Mid‐poor High‐poor Small improvement MP 47 to 62 Plains of Murie to Stony Overlook Mid‐fair Low‐fair Small decline MP 62 to 66 Stony Overlook to Eielson Low‐fair Low‐fair No change MP 66 to 70 Eielson to Grassy Pass High‐poor Mid‐poor Small decline MP 70 to 88 Grassy Pass to Boundary Pit Mid‐fair Mid‐poor Moderate decline MP 88 to 92 Boundary Pit to Kantishna Very‐poor Low‐poor No change
DenaliLong Range Transportation PlanFinancialTechReportndashFINALDRAFT 15
Table 11 Denali Unpaved Park Road Segments ‐‐Current Conditions and Strategy Conditions Explored During LRTP Development
Plan A Plan B Plan C
Plan A Plan B Plan B Plan C Current Desired Plan A Strategy Annual Strategy Plan C
Mileposts Segment Name Conditions Conditions Annual Needs Conditions Needs Conditions Annual Needs
MP 15 to 32 Savage to Teklanika Bridge 009 0109 $ 013 M 013 $ lt01 M 0109 $ 013 M
MP 32 to 39 Igloo Forest to Sable Pass 013 0109 $ 014 M 012 $ 011 M 0129 $ 093 M
MP 39 to 43 Sable Pass to East Fork Bridge 013 0109 $ 0 24 M 013 $ 020 M 0139 $ 019 M
MP 43 to 47 Polychrome to Plains of Murie 035 0109 $ 120 M 014 $ 110 M 0245 $ 074 M
MP 47 to 62 Plains of Murie to Stony Overlook 013 0109 $ 070 M 013 $ 056 M 0139 $ 052 M
MP 62 to 66 Stony Overlook to Eielson 014 0109 $ 025 M 014 $ 020 M 0139 $ 0 20 M
MP 66 to 70 Eielson to Grassy Pass 017 0109 $ 044 M 014 $ 037 M 0169 $ 030 M
MP 70 to 88 Grassy Pass to Boundary Pit 012 0109 $ 056 M 012 $ 051 M 0169 $ 0 32 M
MP 88 to 92 Boundary Pit to Kantishna 0499 0109 $ 072 M 014 $ 068 M 0324 $ 043 M
Total MP 15 to 92 Total Total $ 435 M Total $ 376 M Total $ 293 M
Plan D Plan E Plan F (Selected)
Plan D Plan E Plan E Plan F Current Strategy Plan D Strategy Annual Strategy Plan F Annual
Mileposts Segment Name Conditions Conditions Annual Needs Conditions Needs Conditions Needs
MP 15 to 32 Savage to Teklanika Bridge 009 0109 $ 013 M 0109 $ 013 M 109 $ 013 M
MP 32 to 39 Igloo Forest to Sable Pass 013 0109 $ 014 M 0109 $ 014 M 109 $ 014 M
MP 39 to 43 Sable Pass to East Fork Bridge 013 0109 $ 024 M 0109 $ 024 M 109 $ 024 M
MP 43 to 47 Polychrome to Plains of Murie 035 0149 $ 11 M 0149 $ 11 M 245 $ 074 M
MP 47 to 62 Plains of Murie to Stony Overlook 013 0149 $ 047 M 0149 $ 047 M 149 $ 047 M
MP 62 to 66 Stony Overlook to Eielson 014 0149 $ 018 M 0149 $ 018 M 149 $ 018 M
MP 66 to 70 Eielson to Grassy Pass 017 0325 $ - 0325 $ - 325 $ -
MP 70 to 88 Grassy Pass to Boundary Pit 012 0325 $ - 0325 $ - 325 $ -
MP 88 to 92 Boundary Pit to Kantishna 0499 0325 $ 043 M 0325 $ 043 M 449 $ 012 M
Total MP 15 to 92 Total Total $ 266 M Total $ 266 M Total $203 M
Plan F Unpaved Road Segments The final change that the LRTP team made while discussing the road strategies with park staff was to lower the condition targets for two of the most difficult segments along the unpaved Park Road This section describes these two segments and how accepting a lower condition in these areas can allow for better conditions on other parts of the Denali NPP transportation system
Mileposts 43 to 47 Polychrome Pass to the Plains of Murie The unpaved Denali Park Road segment of Polychrome Pass to the Plains of Murie has been identified by Denali NPP staff as especially difficult to maintain and repair It is facing significant geotechnical hazards that will worsen as time goes on and climate
DenaliLong Range Transportation PlanFinancialTechReportndashFINALDRAFT 16
change accelerates permafrost thaw Making improvements to this section that would take it from the middle of the poor condition band to the low end of fair condition band as explored in Plan D is projected to cost $107 M per year Making lesser improvements from the middle of the poor condition band to the high end of the poor condition band as called for in Plan C would cost $074 M per year instead saving $033 M per year for other uses Thus the selected strategy (Plan F) will target a condition rating at the high end of the poor band instead of a fair rating as with other segments in the central segment of the unpaved Denali Park Road (Igloo Forest to Eielson Visitor Center) This is not an ideal or desired condition for this segment but reflects the challenges of working in this area given limited funding
Mileposts 88 to 92 Boundary Pit to Kantishna The final segment of the unpaved Denali Park Road is currently at the very low end of poor condition and is bordering on severe condition All of the alternative unpaved road plans propose to improve this section However improving the condition from the low end of poor condition to the middle of poor condition as explored in plans C and D is projected to cost $043 M per year Investing this much in one of the least-utilized segments of the Denali Park Road would limit funds for critical investments elsewhere As a result the Denali Investment Strategy proposes lesser improvements at a cost of $012 M per year
DenaliLong Range Transportation PlanFinancialTechReportndashFINALDRAFT 17
National Park Service US Department of the Interior
Denali National Park and Preserve Long-Range Transportation Plan
Appendix G Project Selection Checklist
DENA LRTPProjectSelectionCriteriaChecklist Project Name
PMIS Funding Source(s)
1 Long Range Transportation Plan ndash the project generally adheres to the following
National Long Range Transportation Planrsquos Goals and Objectives (see Attachment A)
Asset Management Transportation Finance Resource Protection
Visitor Experience Safety
Alaska Regional Long Range Transportation Planrsquos Goals and Objectives (see Attachment B)
System Management Mobility User Experience
Resource Protection Climate Change
Denali NPP Long Rang Transportation Planrsquos ldquoactions of no regretrdquo (see Attachment C)
Goal Area ____________________________ Action of No Regret __________
2 Financial Strategy ndash the project meets the following
Capital Investment Strategy score ______________
optimizer band 1 2 3 4 5
Consistent asset investment based on scenario quadrant position (Attachment D)
Consistent with proportionate investment within road management zones (Attachment D)
Milepost or Road Segment ______________________
Consistent with one or more of the following
Operations and Maintenance (OampM)
Rehabilitated Paved Road
Repair amp Maintain the Unpaved Road
Repair amp Improve Other High‐Priority Transportation Assets (bridges transportationmultimodal trail)
3 Risk Priority
Response to current high priority risks based on documented assessment (Attachment E)
Unstable Slopes
River and Stream Flooding
1
Permafrost Subsidence
Culverts ndash Operations and Maintenance (OampM)
Gravel Production Processing or Purchase
Relevance or proximity to mapped hot spot (see Attachment F)
‐ Attachment F should have all the hot spots for Park Road on a map Is this in DNPP LRTP Or do we
give them a link for online info
4 Operations and Maintenance
Investment Type ndash this project is a
New Investment ‐ offset in the cost of OampM
(presumed increase has been addressed by ____________________________________________________)
Replaced investment ‐ offset in the cost of OampM
(presumed decrease or net zero increase has been addressed by ___________________________________)
Eliminated Investment ndash offset in the cost of OampM
(presumed decrease has been addressed by ____________________________________________________)
2
National Park Service US Department of the Interior
Denali National Park and Preserve Long-Range Transportation Plan
Appendix H Public Comment Summary
Public Comment Summary Denali National Park and Preserve Long-Range Transportation Plan
Public comments are organized into two categories common and specific Common comments are
paraphrased themes that appear in multiple comment submissions Responses to common comments
are summarized in Table 1 Specific comments request a particular change When specific comments
seek changes that are accurate reasonable feasible and logically consistent they were made and
included in the final document Other comments include general statements about the quality of the
document suggestions for future plans or ideas for coordination next steps management strategies
park priorities or projects These comments are valued and are available to inform other park planning
efforts and will be referenced during the leadup to this planrsquos eventual update
Table 1 Common Comment
Paraphrased Comment Comment Response
1 Winter or offseason travel is not sufficiently represented in the plan
During the development of this plan numerous issues and needs surfaced as topics that warrant further study and consideration Public comments were an especially meaningful source for identifying topics in need of additional attention These findings will be used to inform the development of the planrsquos update as well as other plans such as the Winter Recreation Plan
2 There is insufficient data or information regarding specific transportation related conditions (eg trail crowding locations of specific facilities rest stop vehicle counts large vehicle counts winter routes locations etc)
The plan relied on facts data and concepts cited in existing park plans studies and other reports No additional data collection or data analysis was conducted as part of this planrsquos development process As such present day conditions or terminology may differ from those described in the plan Gaps in data and understanding will be reassessed in this planrsquos update
3 The plan does not map specific transportation use access facilities for the entirety of the planrsquos 20-year horizon
As a high-level strategic document the plan is not intended to identify specific short-term or long-term project needs or changes park access locations
1
Paraphrased Comment Comment Response
4 If a specific need is not mentioned in the plan (eg backcountry landing strip location) it means that the specific need will be precluded from future project selection and funding
The plan is a high-level strategy document and is not intended to identify and prioritize specific projects While the plan sets high-level goals that are used to evaluate the merits of future projects it is not a project list Whether or not a specific project idea is listed in this plan has no bearing on its ability to be developed or its funding merits
5 The plan does not describe specific actions that the park will take to address a very specific issue (eg plans to address the safety of backcountry landings strips in light of climate change cycling guidelines commercial use authorization for guided hikes off Park Road new parking lot locations more tours etc)
During the development of this plan numerous issues and needs surfaced as topics that warrant further study and consideration Public comments were an especially meaningful source for identifying topics in need of additional attention These findings will be used to inform the development of the planrsquos update
6 Data facts or terminology used in the plan appear to be out dated
The plan relied on facts data and concepts cited in existing park plans studies and other reports No additional data collection was conducted as part of this planrsquos development process As such present day conditions or terminology may differ from those described in the plan
7 The plan does not sufficiently outline specific actions to maintain and improve the parkrsquos soundscape
During the development of this plan numerous issues and needs surfaced as topics that warrant further study and consideration Public comments were an especially meaningful source for identifying topics in need of additional attention These findings will be used to inform the development of the planrsquos update
8 The plan does not go far enough in offering solutions that address threats to park access created by climate change and natural disasters
During the development of this plan numerous issues and needs surfaced as topics that warrant further study and consideration Public comments were an especially meaningful source for identifying topics in need of additional attention These findings will be used to inform the development of the planrsquos update
9 The plan does not go far enough to protect resources
During the development of this plan numerous issues and needs surfaced as topics that warrant further study and consideration Public comments were an especially meaningful source for identifying topics in need of additional attention These findings will be used to inform the development of the planrsquos update
2
Paraphrased Comment Comment Response
10 The plan does not go far enough to protect access
During the development of this plan numerous issues and needs surfaced as topics that warrant further study and consideration Public comments were an especially meaningful source for identifying topics in need of additional attention These findings will be used to inform the development of the planrsquos update
11 Goal andor objective indicators or performance measures are too limited
The plan relied on readily available data and findings cited in existing park plans studies and other reports No additional indicator data was collected as part of this planrsquos development The need for additional data for informing additional indicators will be considered for the planrsquos update
12 Specific details from the Vehicle Management Plan are not reflected in this plan
The long range transportation plan does not supersede the Vehicle Management Plan in any way Omission of Vehicle Management Plan data indicators and conclusions does not negate their significance in how the park is managed
3
- Appendix A - Literature Review Summary Report (1)
- Appendix B - Denali Long-Range Transportation Planning and Acoustic Resources (2)
- Appendix C - Denali Park Road Risk Assessment Utilizing the Unstable Slope Management Program (1)
- Appendix D - Current and Future Partner Projects (3)
- Appendix E - Park Transportation Investment Needs Analysis (1)
-
- Structure Bookmarks
-
- Denali National Park and PreserveLong-Range Transportation Plan
- Appendix EPark Transportation Investment Needs Analysis
- ABSTRACT
- INTRODUCTION
- PATINA DESIGN
- OVERVIEW
- VEHICLE MANAGEMENT PLAN
- VECTOR ANALYSIS
- DATA COLLECTION
- TRANSPORTATION NETWORK
- ASSET METRICS
- HIGH RISK
- INVESTMENT RANKING
- GOAL AREAS
- METHODOLOGY
- DATA PREP
- LAYER WEIGHTING
- COMPOSITE ANALYSIS STEPS
- SELECTED RESULTS
- OUTPUTS
- ROAD SEGMENT FINDINGS
- Motorized Paved Zone
- Wildlife Viewing Subzone 1
- Wildlife Viewing Subzone 2a
- Wildlife Viewing Subzone 3
- Wildlife Viewing Subzone 2b
- DISCUSSION
- INTERNAL WEIGHTING
- SKEWED DATA
- SPATIAL SPREAD OF DATA
- NEXT STEPS
-
- Appendix F _ Denali Funding Plan
- Appendix G - Project Selection Checklist
- Appendix H - Comment Responses (1)
-