appendix 2: longer term environmental water needs
TRANSCRIPT

Appendix 2: Longer Term Environmental Water Needs (Enhanced Scenario)
V1.0: 11 February 2021

2 of 16
We are the Environment Agency. We protect and improve the environment. We help people and wildlife adapt to climate change and reduce its impacts, including flooding, drought, sea level rise and coastal erosion. We improve the quality of our water, land and air by tackling pollution. We work with businesses to help them comply with environmental regulations. A healthy and diverse environment enhances people's lives and contributes to economic growth. We can’t do this alone. We work as part of the Defra group (Department for Environment, Food & Rural Affairs), with the rest of government, local councils, businesses, civil society groups and local communities to create a better place for people and wildlife.
Published by: Environment Agency Horizon House, Deanery Road, Bristol BS1 5AH www.gov.uk/environment-agency
© Environment Agency 2021 All rights reserved. This document may be reproduced with prior permission of the Environment Agency. Further copies of this report are available from our publications catalogue: http://www.gov.uk/government/publications or our National Customer Contact Centre: 03708 506 506 Email: [email protected]

3 of 16
Contents
Appendix 2: Longer Term Environmental Water Needs (Enhanced Scenario) ............ 1
................................................................................................................................................................................................
................................................................................................................................................................................................
................................................................................................
Contents ............................. 3
1. Introduction .................... 4
2. Enhanced scenario ..........................
..................................
................
4
3. Methodology 4
3.1. Background 4
................................................................................................................................
................................................................................................
3.2. Estimating abstraction in 2050 6
3.3. Estimating natural flows in 2050 7
3.4. Estimating groundwater availability in 2050 ............................... 9
3.5. Defining the enhanced scenario ................ 9
3.6. Allocation of abstractions reductions to water resource zone .................................. 10
4. Results .......................................................................................................................... 10
4.1. Flows in 2050 ..........................................................................................................................................................................................................................
.................................................................. ....................................................................................................
10
4.2. Enhanced 12
5. Assumptions and limitations of the work 13
6. List of abbreviations 15

4 of 16
1. Introduction This appendix to the update to the determination of water stress areas in England sets out the approach we have taken to explore longer term changes to protect the environment. It provides detail on the modelling, data sources, the assumptions we have made as well as more detailed results. This work was first completed for the water resources National Framework1.
2. Enhanced scenario The enhanced scenario, as developed under the Environment Agency’s National Framework sees greater environmental protection for Protected Areas, Sites of Special Scientific Interest (SSSI) rivers and wetlands, principal salmon and chalk rivers. In these water bodies the enhanced scenario applies the most sensitive flow constraint appropriate, increasing the proportion of natural flow that is protected for the environment. We have analysed what abstraction recovery would be needed to meet the Environmental Flow Indicator (EFI). The EFI indicates the proportion of natural flows that are required to support the environment in any given water body. Depending on the sensitivity of the water body it typically indicates that somewhere between 80% and 90% of natural low flows are protected.
3. Methodology 3.1. Background The Environment Agency owns and manages the Water Resources Geographical Information System (WRGIS) database. The WRGIS is used to calculate water availability on a Water Framework Directive (WFD) water body scale. To calculate water availability it looks at the balance between the flow in the river, the quantity needed to support the ecology and the water that can be licensed for abstraction. To do this the WRGIS database contains natural flow data (what flows would be under natural conditions) and artificial influence data including: surface water abstractions, groundwater abstractions, discharges and influences from reservoirs. For each water body we start with the natural flow that would be in the river in the absence of any artificial influence. An Abstraction Sensitivity Band (ASB) of high, medium or low sensitivity to abstraction is assigned to each water body based on a combination of physical, macroinvertebrate and fish typology. The ASB defines the EFI, which indicates the quantity of water we want to maintain in the river to protect the ecology and subsequently the amount of water we can allow for abstraction.
1 Meeting our future water needs: a National Framework for water resources - main report

5 of 16
Table 1: Percentage allowable abstraction from natural flows at different sensitivity bands and at different flow snapshots (Q30 is the highest and Q95 is the lowest flow)
Abstraction Sensitivity Band
Q30 Q50 Q70 Q95
ASB3 ‘high’ 24% 20% 15% 10%
ASB2 ‘moderate’
26% 24% 20% 15%
ASB1 ‘low’ 30% 26% 24% 20%
We then account for existing artificial influences to calculate three scenarios: • recent actual – abstraction rates are based on abstraction returns, typically a 6 year
period, 2010 to 2015 • future predicted – abstraction rates are based on recent actual abstraction rate
multiplied by a growth factor to project abstraction to 2050. For the purposes of this National Framework work the future predicted scenario is not capped at the licensed limit, therefore it could include where future demand exceeds the current licensed limit
• full licensed – abstraction rates are based on full licensed quantities We screen all river waterbodies (except those in flow regulated rivers) to show where impacts of abstraction may be causing flows to fall below EFIs when the flow is low. Low flow is defined as Q95, that is, the long term average flow exceeded 95% of the time. If the flow in the recent actual scenario is higher than the EFI at Q95, then the waterbody is compliant. If the recent actual scenario falls below the EFI at Q95, the waterbody is non-compliant. There are three bands of non-compliance which are defined by the degree of deviation from the EFI. Table 2: Describes compliance and non-compliance at different abstraction sensitivity bands.
Abstraction Sensitivity Band
Compliant with EFI
Non-compliant Band 1 (up to 25% below the EFI at Q95)
Non-compliant Band 2 (25-50% below the EFI at Q95)
Non-compliant Band 3 (up to 50% below the EFI at Q95)
ASB3 ‘high’ <10% lower than natural flow
<35% lower than natural flow
<60% lower than natural flow
>60% lower than natural flow
ASB2 ‘moderate’
<15% lower than natural flow
<40% lower than natural flow
<65% lower than natural flow
>65% lower than natural flow
ASB1 ‘low’ <20% lower than natural flow
<45% lower than natural flow
<70% lower than natural flow
>70% lower than natural flow
The WRGIS calculates water availability at four flow snapshots. From high to low, these are: Q30, Q50, Q70 and Q95. These are calculated for each integrated waterbody, where
6 of 16
an integrated waterbody is the combination of all Catchment Assessment Management Assessment Points and also all WFD river, lake and transitional waterbodies. The WRGIS is also used to calculate the four groundwater tests and overall groundwater status for the Water Framework Directive. The WRGIS is a snapshot of the water resource data and information which is manipulated for the purposes of calculating water availability. We have chosen to use the WRGIS to explore the environmental scenarios for the National Framework because it allows us to run climate and sustainability change scenarios together, and to understand the likely scale and distribution of any non-compliance with environmental standards that would result from each scenario.
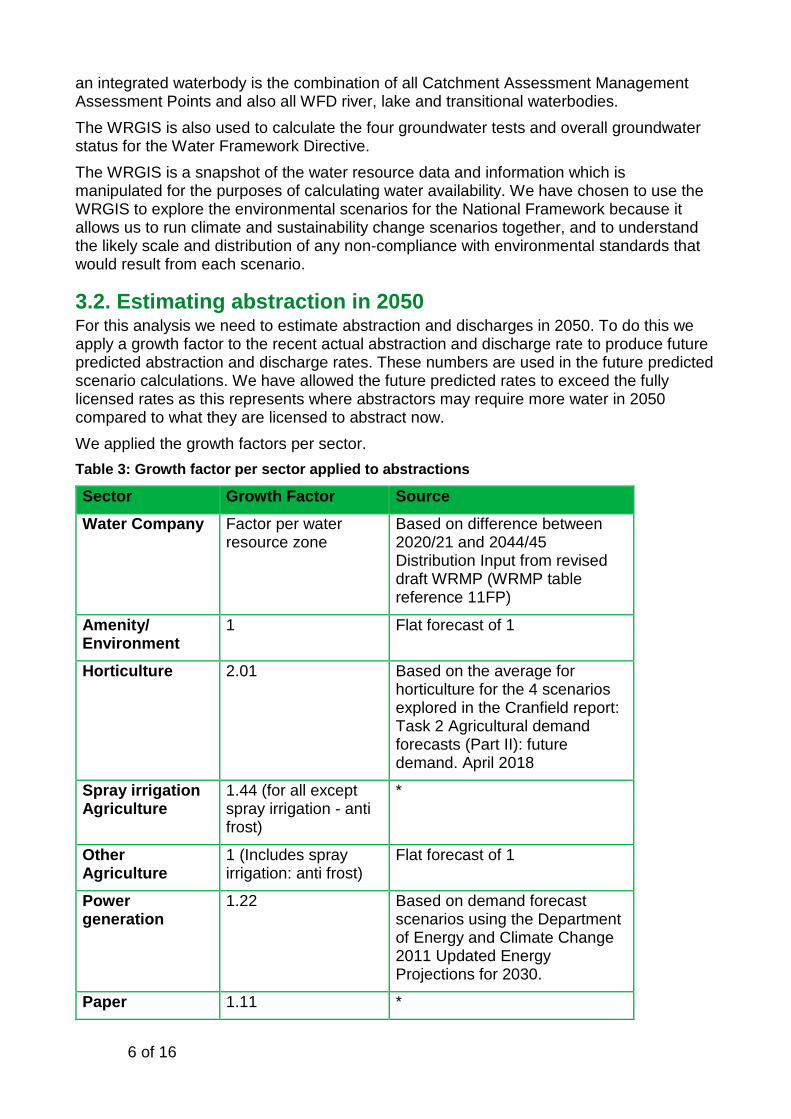
3.2. Estimating abstraction in 2050 For this analysis we need to estimate abstraction and discharges in 2050. To do this we apply a growth factor to the recent actual abstraction and discharge rate to produce future predicted abstraction and discharge rates. These numbers are used in the future predicted scenario calculations. We have allowed the future predicted rates to exceed the fully licensed rates as this represents where abstractors may require more water in 2050 compared to what they are licensed to abstract now. We applied the growth factors per sector. Table 3: Growth factor per sector applied to abstractions
Sector Growth Factor Source Water Company Factor per water
resource zone Based on difference between 2020/21 and 2044/45 Distribution Input from revised draft WRMP (WRMP table reference 11FP)
Amenity/ Environment
1 Flat forecast of 1
Horticulture 2.01 Based on the average for horticulture for the 4 scenarios explored in the Cranfield report: Task 2 Agricultural demand forecasts (Part II): future demand. April 2018
Spray irrigation Agriculture
1.44 (for all except spray irrigation - anti frost)
*
Other Agriculture
1 (Includes spray irrigation: anti frost)
Flat forecast of 1
Power generation
1.22 Based on demand forecast scenarios using the Department of Energy and Climate Change 2011 Updated Energy Projections for 2030.
Paper 1.11 *

7 of 16
Sector Growth Factor Source Food & Drink 1.25 *
Chemical 1.22 *
Other Spray Irrigation (non-Agriculture)
1 Flat forecast of 1
Industry & Any others
Factor per water resource zone
Based on the difference between from 2020-21 and 2044-45 non-household use from revised draft WRMPs (WRMP table reference 23FP + 24FP)
*Source: Understanding future water demand outside of the water industry work completed by Wood Environment & Infrastructure Solutions UK Limited Table 4: Growth factors applied to discharges
Sector Growth Factor Source Water Company Factor per water Based on difference
resource zone between 2020/21 and 2044/45 Distribution Input from revised draft WRMP (WRMP table reference 11FP)
All other sectors Factor per water Based on the difference resource zone between from 2020-21
and 2044-45 non-household from revised draft WRMPs use (WRMP table reference 23FP + 24FP)
We have applied the growth factors to the recent actual abstraction and discharge rates to estimate what abstraction and discharge may be in 2050 and used these figures to calculate the future predicted scenario. In some cases the future demand may exceed the full licensed quantities we have in the WRGIS. This same abstraction and discharge data has been applied to all the environmental scenarios. We use the comparison of the future predicted scenario (for the different environmental scenarios) against the recent actual scenario from the 2025 baseline to represent the estimated change in abstraction between 2025 and 2050.
3.3. Estimating natural flows in 2050 It is widely accepted that climate change will affect natural river flows in the future. This is an important consideration for this analysis so we used existing data to estimate the impact. The latest climate scenarios are from UK Climate Projections 2018 (UKCP18). However, at this time, there is no widespread analysis of river flows using UKCP18 and therefore it was not possible to use UKCP18 as part of this analysis. Instead, to estimate natural flows for 2050 we considered two evidence sources:

8 of 16
• Future Flows Hydrology (FFH)2: provides time series of river flows at 276 gauged locations from 1950 to 2098 using a medium emissions scenario. FFH is made up of an 11 member ensemble of climate model derived time series each of which is an equally plausible future outcome. The underlying climate model is HadCM3 which also provided the basis for the UKCP09 projections
• the Marius hydrology datasets3 provide monthly time series of river flows on a national 1 km grid and daily time series of river flows for 260 gauge locations. The time series are available for three time periods; historic baseline (1900-2006), near future (2020-2049) and the far future (2070-2099). The future periods are simulated using the RCP8.5 emissions pathway
After considering both evidence sources we opted to use the FFH dataset in this work to remain consistent with the current Environment Agency guidance to water companies. FFH provides 11 ensemble members, each representing different climate model configurations and assumptions. To decide which of the 11 ensembles to use, analysis was undertaken for the 2080s time horizon because the climate change signal is strongest at more distant time horizons and less influenced by natural climate variability. The results for the 2080s show two of the 11 ensemble members (AFIXJ and AFIXK) as being the driest. There is no single ensemble member which is the driest everywhere and there is spatial variation in the impacts. In general AFIXK is the drier scenario in the south and east whilst AFIXJ is typically drier in the north and west. We chose AFIXK as the ensemble member to use based upon the climate change impacts across the lower half of the flow duration curve (Q95-Q50) in the 2080s and applied this ensemble for the 2050 natural flows. For each integrated waterbody we took the percentage change between the current period and 2050 at Q30, Q50, Q70 and Q95. Each integrated waterbody has a percentage change assigned by either: • river basin: waterbody takes the river basin average • modelled: waterbody lies in a Future Flows catchment directly • donor: waterbody takes its impacts from a donor future flows catchment Small adjustments were made to some waterbodies that failed one or both of the basic assumptions needed in the WRGIS. These assumptions are that: • flows must accrete downstream. The WRGIS will not calculate correctly where there
are negative sub-catchment flows. It will allow for zero accretion • waterbodies have a greater sub-catchment flow at high flows than they do at low flows The analysis shows there is less natural flow in 2050, in particular in the north-west of England (please see section 5.2 for more details on the results).
2 Future Flows Hydrology data 3 Marius Hydrology data

9 of 16
3.4. Estimating groundwater availability in 2050 To assess the status of a groundwater body there are four tests. The tests consider groundwater balance, impacts on dependent surface waters, impacts on dependent wetlands and abstraction-induced intrusion of saline water into groundwater. All of these must be passed for the combined status to be good. To manage the complexity of this modelling we have assumed that reducing groundwater abstraction to achieve natural flows will deliver most environmental improvements and will in turn improve the groundwater status. However, this is not guaranteed as it is possible for the groundwater balance to be in deficit after reductions in abstraction necessary to meet river flow requirements have been made. Recent research from the British Geological Survey (BGS) has reviewed the impact of climate change on groundwater recharge and found that recharge may increase slightly by 2050, despite a shift to a shorter recharge period4. This suggests that, although it represents a simplification, excluding the groundwater balance test from this analysis is unlikely to miss significant climate impacts.
3.5. Defining the enhanced scenario Under the enhanced scenario we provide greater environmental protection for Protected Areas and SSSI rivers and wetlands, principal salmon and chalk rivers by applying the most sensitive flow constraints. This involved identifying the relevant water bodies and changing the designated abstraction sensitivity band applied to that waterbody (this then changes the volume of water protected through the EFI). For Protected Area and SSSI rivers: relevant waterbodies have been identified using a list of designated riverine sites provided by Natural England (NE). We have based our analysis on the long-term Common Standards Monitoring Guidance (CSMG) targets for rivers as set out in the Joint Nature Conservation Committee Guidance5. We recognise that there may be local agreements which identify a more appropriate target but these are not included in this project. CSMG identifies targets based on river size and flow condition and as such differs from the range of targets we currently use within WRGIS. For the purposes of this analysis we have generated a new subset of ASBs. These have been as closely matched as possible to the CSMG relevant waterbodies based on the information currently available. Table 5: Percentage allowable abstraction from natural flows at different abstraction sensitivity bands equivalent to CSMG
Type Abstraction sensitivity band
Q30 Q50 Q70 Q95
River ASB4 10% 20% 15% 10%
Headwater ASB5 15% 15% 10% 5%
WFD high hydrology
ASB6 10% 10% 10% 5%
4 Summary of results for national scale recharge modelling under conditions of predicted climate change, Mansour, M., Hughes, A. (2018) 5 Joint Nature Conservation Committee Guidance

10 of 16
ASB 4, 5 and 6 are only used for the purpose of this National Framework environmental scenario work. They are not part of the standard water availability calculation. The principal salmon river waterbodies are based on the 42 'principal' salmon rivers identified for England. An enhanced ASB3 is applied to those waterbodies which are currently assigned an ASB of less than ASB3 but we have ruled out those water bodies where salmon are unlikely to be present or outside of natural spawning areas (based on a high level review by the Environment Agency). Chalk river waterbodies have been identified based on Environment Agency's data and given an ASB3 recognising their global importance and the unique habitat they provide. We also identified groundwater bodies that contain Groundwater Dependent Terrestrial Ecosystems (GWDTE) that are Protected Areas in England. We then identified the surface water bodies associated with these GWDTE. An ASB3 has been assigned to these surface waterbodies. For each water body a final assumed ASB has been identified to be used for this scenario work. It was decided to exclude the estuarine sites from the National Framework scenario exercise due to the reduced risk to estuarine sites.
3.6. Allocation of abstractions reductions to water resource zone We have allocated the potential abstraction reduction to water resource zone based on the location of the public water supply abstractions.
4. Results 4.1. Flows in 2050 Climate change will have a significant impact on flows and water availability in 2050. Figure 1 suggests, under the climatic scenario we have used, that the north east, north west and the south west would see the greatest change in low surface water flows (Q95). The south east is less affected due to its geology and the buffering capacity of groundwater in the region. However, it too sees a decrease in natural flows in most catchments by 2050. Figure 2 shows the available resource for abstraction if the reduction in surface water flow from climate change is combined with fixing the environmental flow indicator (EFI) at the level it is now irrespective of the changes brought by climate change to natural flows. This suggests that at low flows there would be no surface water available for abstraction in the north and west without reservoir storage and very limited water available across most of the south and east. We do not think that fixing the EFI at current levels is a viable approach to take but it does provide a useful illustration of the scale of the pressures facing the environment in 2050 from climate change.

11 of 16
Figure 1: Shows potential percentage changes in natural surface water flow by 2050 at low flows (Q95)
Figure 2: Shows natural available resource for abstraction at low flows (Q95) in 2050 if we protect surface water flows for the environment at current volumes

12 of 16
Figure 3 shows the potential percentage change in natural surface water flow by 2050 at different flows. We can see at each flow snapshot there is a decrease in surface water flows with the exception of a few catchments. Figure 3: Percentage change in natural surface water flow by 2050, moving left to right Q70, Q50 and Q30 (lower flows to higher flows).
4.2. Enhanced The enhanced scenario continues our policy of the EFI evolving as a proportion of natural flow. Under this scenario we have protected a greater proportion of the flow for the environment compared to now because we have applied more stringent sensitivity scores to a subset of waterbodies (see description of the enhanced scenario). Based on this scenario the potential recovery required by 2050 is 2900 Ml/d. Figure 4 gives an indication of the potential changes in abstraction needed by region and by sector under this scenario from now to 2050. Southeast has the largest potential reduction in comparison to the other regions. In all regions public water supply shows the greatest percentage reductions compared to other sectors. Due to the limitations of this analysis they should not be taken as representing the actual changes required to abstraction licences.

13 of 16
Figure 4: An indication of potential reductions by region in Ml/d under the 2050 enhanced scenario (volumes revised compared with those published in the National Framework)
5. Assumptions and limitations of the work The National Framework scenarios presented here are for planning purposes only, more detailed local and regional analysis is required to inform decision making. This section sets out the assumptions we have made and the limitations of the work. We have used the February 2019 version of the WRGIS database. The WRGIS is a snapshot in time and is the best national information we have available on water availability. However it does not represent catchments in as much detail as more locally-specific models can. Also, WRGIS may differ from other models in the assumed distribution of the impact of abstractions. The WRGIS includes estimations of some unlicensed activities. They are included because they affect the water balance. Many of these unlicensed activities will come into the licensing regime as part of our work to remove exemptions from the abstraction licensing scheme known as 'New Authorisations' at which point we will have more accurate information available than we do today. The baseline calculations were completed on a national scale and should not supersede local investigations that have used more detailed modelling work. To establish the starting baseline we had to estimate several licence reductions to represent current abstraction reduction programmes as the exact licence quantities were

14 of 16
not available. Once these licence changes are identified and implemented this could alter the scale of reduction needed to achieve sustainable abstraction in the baseline. We have allowed the future predicted abstraction and discharge rates to exceed the fully licensed rates as this represents where abstractors may require more water in 2050 compared to what they are licensed to abstract now. In practice these licence limits are likely to constrain abstraction under certain scenarios, reducing the impact of abstraction. We have only completed analysis under one of the 11 possible ensembles from the Future Flows dataset. Other ensembles may not be as dry as the scenario we have used (AFIXK) or may show different spatial impacts. Recovery calculations are based on recovery to the EFI. Recovery calculations start by reducing groundwater abstraction first. Any remaining recovery calculations consider changes to the surface water licences but only where the surface water licence does not have a flow constraint, is not from a reservoir or lake or level dependent catchment and does not have an upstream supported flow. We have assumed public water supply abstraction supplies the water resource zone that it is located within.

15 of 16
6. List of abbreviationsAMP - Asset Management Programme ASB - Abstraction Sensitivity Band CSMG - Natural England's Common Standards Monitoring Guidance EFI - Environmental Flow Indicator FFH - Future Flows Hydrology GWDTE - Groundwater Dependent Terrestrial Ecosystems HMWBs - Heavily Modified Water Bodies NEP - National Environment Programme SSSI - Site of special scientific interest WFD- Water Framework Directive WRGIS - Water Resource Geographical Information System

16 of 16
Would you like to find out more about us or your environment? Then call us on 03708 506 506 (Monday to Friday, 8am to 6pm)
Email: [email protected]
or visit our website: www.gov.uk/environment-agency
incident hotline 0800 807060 (24 hours)
floodline 0345 988 1188 (24 hours) Find out about call charges (www.gov.uk/call-charges)
Environment first: Are you viewing this onscreen? Please consider the environment and only print if absolutely necessary. If you are reading a paper copy, please don’t forget to reuse and recycle.