appendix 1: uk climate projections · 2018-03-28 · design for future climate 41 uk climate...
TRANSCRIPT
40 Design for future climate
Appendix 1: UK climate projections
UK Climate Projections 2009
Climate overview
In this section:
The UK Climate Projections 2009 provide the most up-to-date estimates of how the climate may change over the next 100 years. They are an invaluable source of information if you wish to find out more about the future climate at a national or regional level.
Design for future climate 41
UK Climate Projections 2009
Probabilistic data
Three scenarios for greenhouse gas emissions
Absolute values as well as projected changes
Published tables, maps and graphs
Creating bespoke maps and graphs
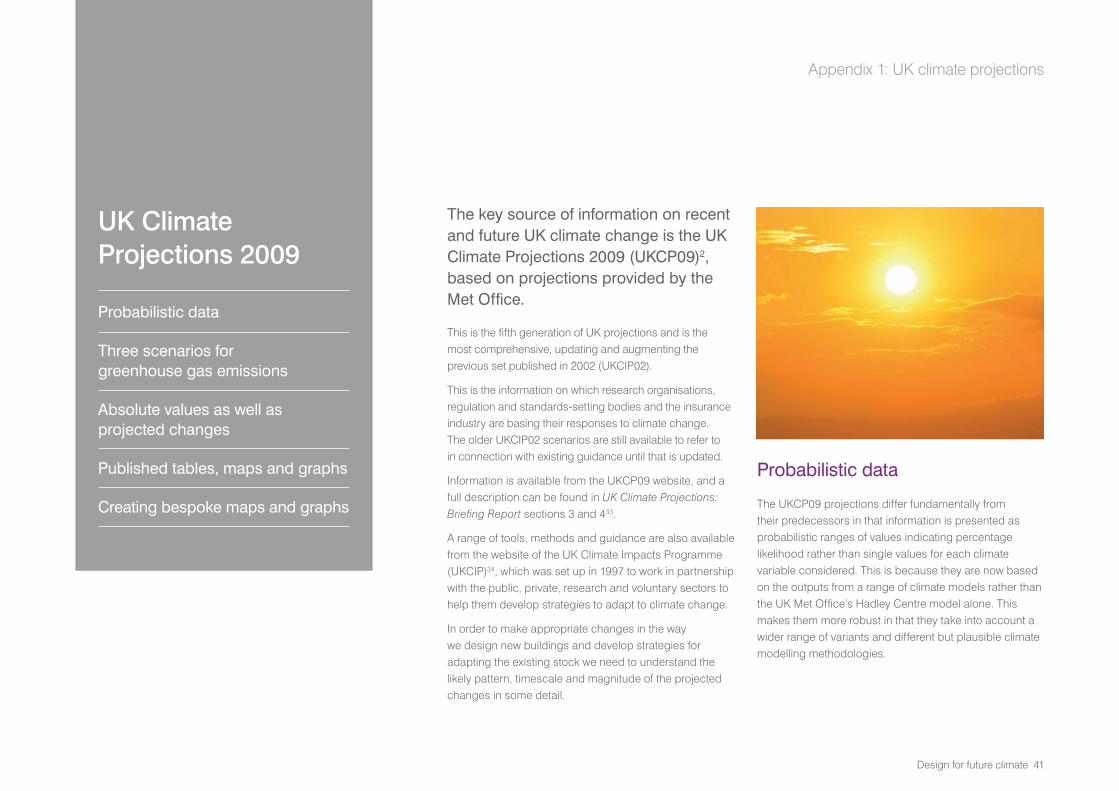
The key source of information on recent and future UK climate change is the UK Climate Projections 2009 (UKCP09)2, based on projections provided by the Met Office.
This is the fifth generation of UK projections and is the most comprehensive, updating and augmenting the previous set published in 2002 (UKCIP02).
This is the information on which research organisations, regulation and standards-setting bodies and the insurance industry are basing their responses to climate change. The older UKCIP02 scenarios are still available to refer to in connection with existing guidance until that is updated.
Information is available from the UKCP09 website, and a full description can be found in UK Climate Projections: Briefing Report sections 3 and 433.
A range of tools, methods and guidance are also available from the website of the UK Climate Impacts Programme (UKCIP)34, which was set up in 1997 to work in partnership with the public, private, research and voluntary sectors to help them develop strategies to adapt to climate change.
In order to make appropriate changes in the way we design new buildings and develop strategies for adapting the existing stock we need to understand the likely pattern, timescale and magnitude of the projected changes in some detail.
Probabilistic data
The UKCP09 projections differ fundamentally from their predecessors in that information is presented as probabilistic ranges of values indicating percentage likelihood rather than single values for each climate variable considered. This is because they are now based on the outputs from a range of climate models rather than the UK Met Office’s Hadley Centre model alone. This makes them more robust in that they take into account a wider range of variants and different but plausible climate modelling methodologies.
Appendix 1: UK climate projections
42 Design for future climate
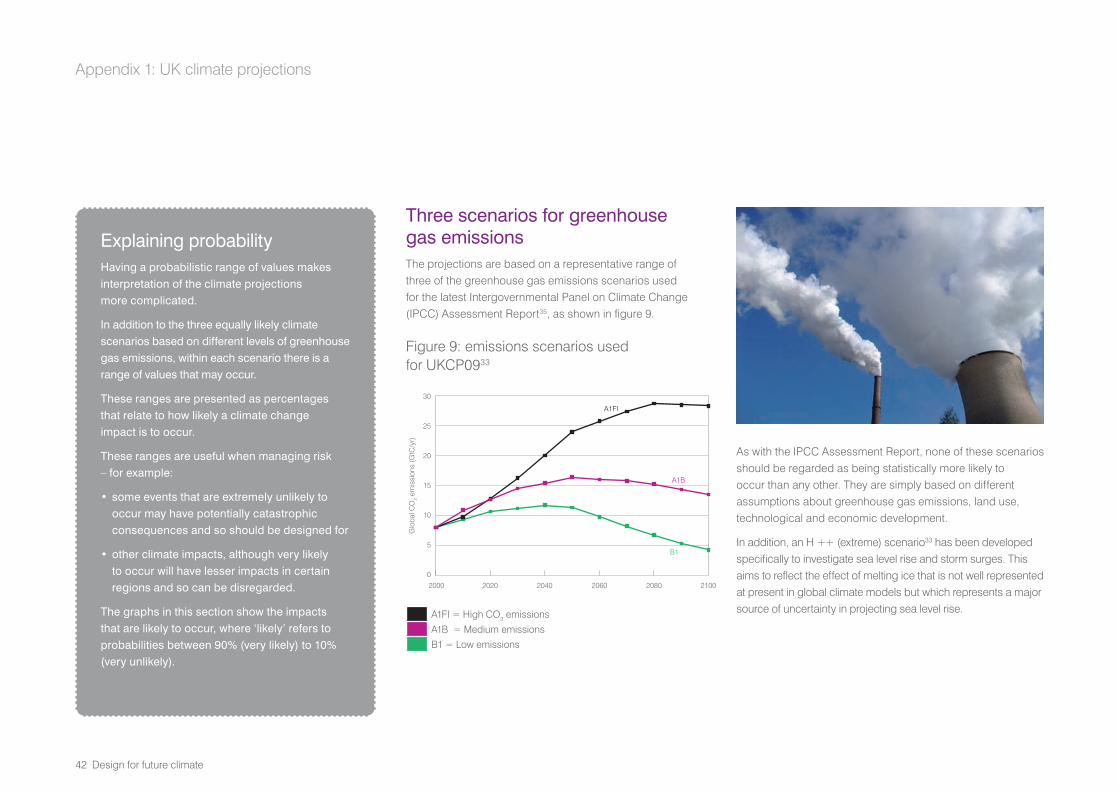
Three scenarios for greenhouse gas emissionsThe projections are based on a representative range of three of the greenhouse gas emissions scenarios used for the latest Intergovernmental Panel on Climate Change (IPCC) Assessment Report35, as shown in figure 9.
Figure 9: emissions scenarios used for UKCP0933
As with the IPCC Assessment Report, none of these scenarios should be regarded as being statistically more likely to occur than any other. They are simply based on different assumptions about greenhouse gas emissions, land use, technological and economic development.
In addition, an H ++ (extreme) scenario33 has been developed specifically to investigate sea level rise and storm surges. This aims to reflect the effect of melting ice that is not well represented at present in global climate models but which represents a major source of uncertainty in projecting sea level rise.
Explaining probabilityHaving a probabilistic range of values makes interpretation of the climate projections more complicated.
In addition to the three equally likely climate scenarios based on different levels of greenhouse gas emissions, within each scenario there is a range of values that may occur.
These ranges are presented as percentages that relate to how likely a climate change impact is to occur.
These ranges are useful when managing risk – for example:
•someeventsthatareextremelyunlikelytooccur may have potentially catastrophic consequences and so should be designed for
•otherclimateimpacts,althoughverylikelyto occur will have lesser impacts in certain regions and so can be disregarded.
The graphs in this section show the impacts that are likely to occur, where ‘likely’ refers to probabilities between 90% (very likely) to 10% (very unlikely).
Appendix 1: UK climate projections
30
25
20
15
10
5
0
2000 2020 2040 2060 2080 2100
Glo
bal C
O2 e
mis
sion
s (G
tC/y
r)A1FI
A1B
B1
A1FI = High CO2 emissions
A1B = Medium emissions
B1 = Low emissions
Design for future climate 43
Absolute values as well as projected changesAbsolute figures for climate variables (e.g. 19°C) are provided in addition to relative data on climate change (e.g. 2°C rise). Projections of change are useful for understanding the relative difference between what we are familiar with and future conditions, but absolute figures are more useful in understanding the actual effect of a change on, say, designing the size of a drain or maintaining a particular internal temperature.
Full probabilistic data is provided for:
Over land:
• mean temperature
• mean daily maximum temperature
• mean daily minimum temperature
• warmest day of the season (99th percentile of daily maximum temperature in a season)
• coolest day of the season (1st percentile of daily maximum temperature in a season)
• warmest night of the season (99th percentile of the daily minimum temperature in a season)
• coldest day of the season (1st percentile of daily minimum temperature in a season)
• precipitation rate (rain/snowfall combined)
• wettest day of the season (99th percentile of daily precipitation rate in the season)
• specific humidity
• relative humidity
• total cloud
• net surface long wave flux
• net surface short wave flux
• total downward short wave flux
• mean sea level pressure.
Over sea:
• mean air temperature
• precipitation rate
• total cloud
• mean sea level pressure.
Probabilistic data is not provided for:
• wind speed
• snow
• soil moisture
• surface latent heat flux36.
Projections for these were included in UKCIP02, albeit with relatively low levels of confidence attached. The change is due either to technical incompatibility between the results of the different models now used for the UK projections or because results vary significantly between different models which, in turn, do not match observed data particularly well.
Non-probabilistic data for specialist users on wind speed are available (outside UKCP09) based on outputs from the Met Office regional climate model for the medium scenario only from the Climate Impacts LINK website37. A technical note is available on the interpretation of this information38; however, in simple terms, it projects a slight decrease in winter mean wind speed over the UK.
Published tables, maps and graphsA wide range of data tables, maps and graphs is available for climate variables for probabilities, ranging from 10% (very likely to be exceeded) to 90% (very unlikely to be exceeded) in a number of different forms, the most useful of which are:
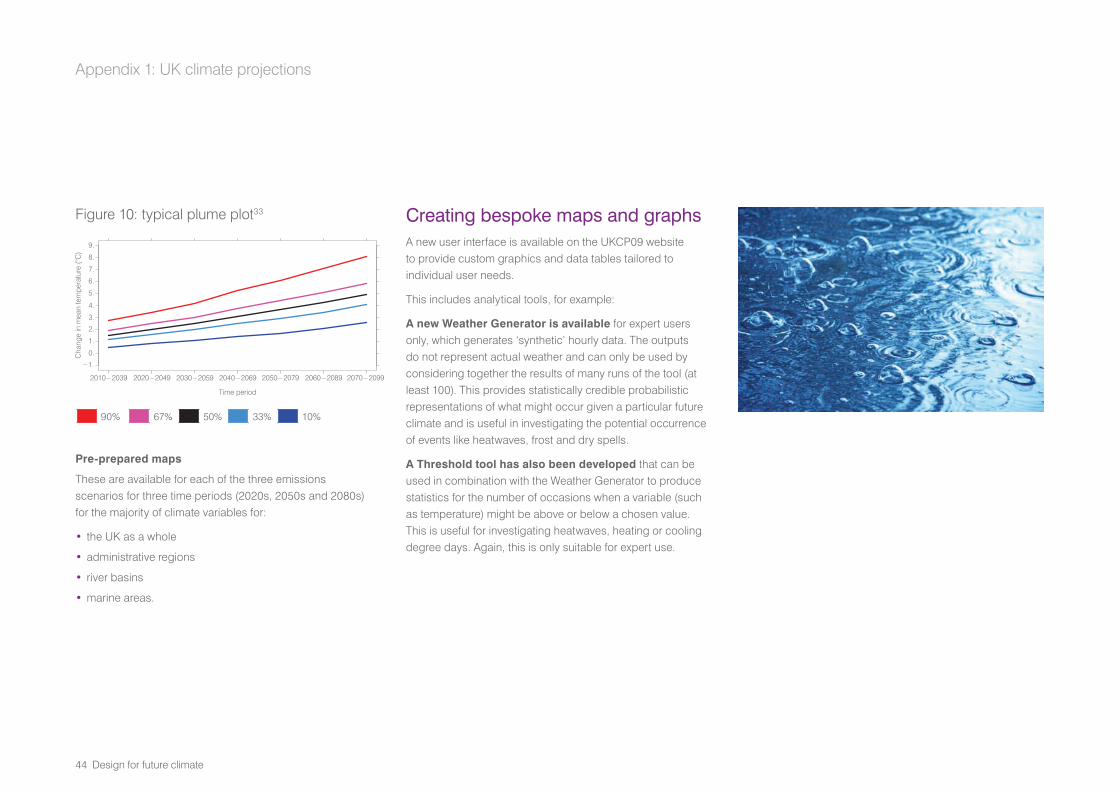
Plume plots
These show a plume of probability under a given emissions scenario, giving the likely (10% to 90%) range of change of a particular climate variable over time for a particular location; in the case of figure 10, change in mean summer temperature.
Appendix 1: UK climate projections
44 Design for future climate
Figure 10: typical plume plot33
Pre-prepared maps
These are available for each of the three emissions scenarios for three time periods (2020s, 2050s and 2080s) for the majority of climate variables for:
• the UK as a whole
• administrative regions
• river basins
• marine areas.
Creating bespoke maps and graphs A new user interface is available on the UKCP09 website to provide custom graphics and data tables tailored to individual user needs.
This includes analytical tools, for example:
A new Weather Generator is available for expert users only, which generates ‘synthetic’ hourly data. The outputs do not represent actual weather and can only be used by considering together the results of many runs of the tool (at least 100). This provides statistically credible probabilistic representations of what might occur given a particular future climate and is useful in investigating the potential occurrence of events like heatwaves, frost and dry spells.
A Threshold tool has also been developed that can be used in combination with the Weather Generator to produce statistics for the number of occasions when a variable (such as temperature) might be above or below a chosen value. This is useful for investigating heatwaves, heating or cooling degree days. Again, this is only suitable for expert use.
Appendix 1: UK climate projections
Time period
Cha
nge
in m
ean
tem
pera
ture
(°C
)
2010−2039 2020−2049 2030−2059 2040−2069 2050−2079 2060−2089 2070−2099
−1.
0.
1.
2.
3.
4.
5.
6.
7.
8.
9.
90% 67% 50% 33% 10%
Design for future climate 45
Overview of the projected climate
Graphs
Maps
Tables
There is a wealth of information available on the UKCP09 website which is summarised in the UK Climate Projections: Briefing Report.33
For those who principally need a broad understanding of the range of issues we might need to deal with, the following graphs and maps, developed by UKCIP for this report, give a simple overview. The tables on pages 60 and 61 summarise some of the projected changes for the 2080s.
Appendix 1: UK climate projections
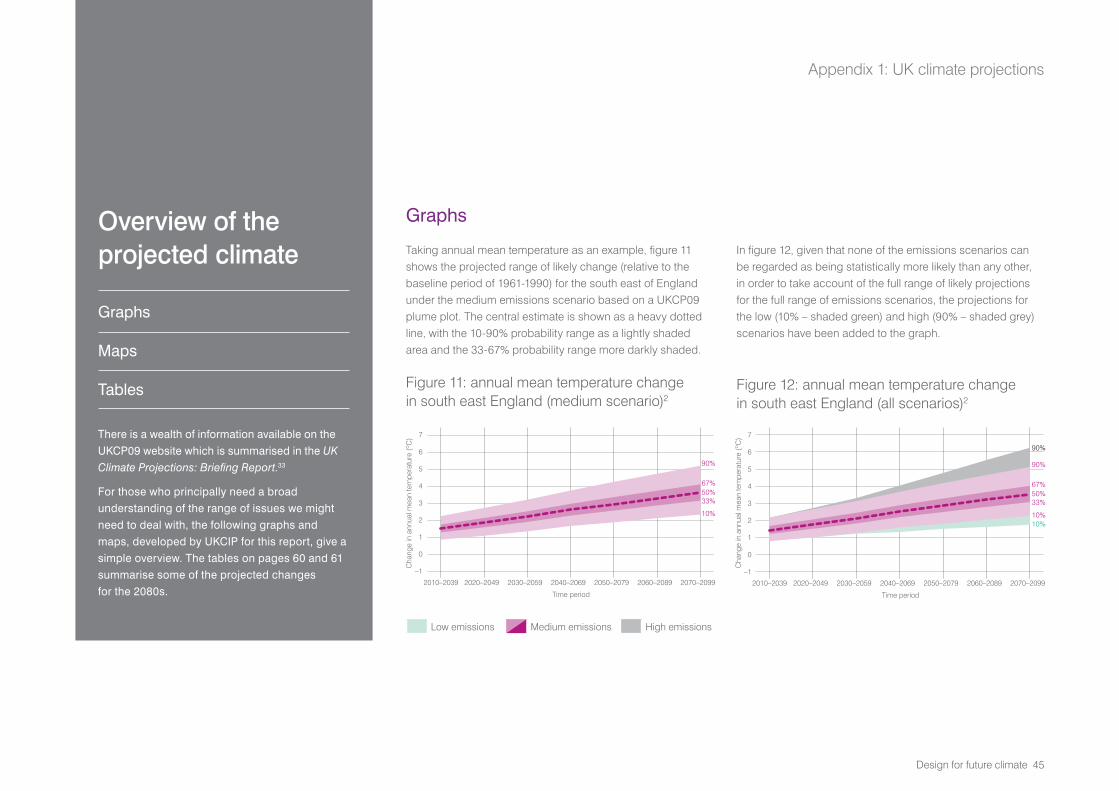
Taking annual mean temperature as an example, figure 11 shows the projected range of likely change (relative to the baseline period of 1961-1990) for the south east of England under the medium emissions scenario based on a UKCP09 plume plot. The central estimate is shown as a heavy dotted line, with the 10-90% probability range as a lightly shaded area and the 33-67% probability range more darkly shaded.
Figure 11: annual mean temperature change in south east England (medium scenario)2
In figure 12, given that none of the emissions scenarios can be regarded as being statistically more likely than any other, in order to take account of the full range of likely projections for the full range of emissions scenarios, the projections for the low (10% – shaded green) and high (90% – shaded grey) scenarios have been added to the graph.
Figure 12: annual mean temperature change in south east England (all scenarios)2
Graphs
7
6
5
4
3
2
1
0
–1
2010–2039 2020–2049 2030–2059 2040–2069 2050–2079 2060–2089 2070–2099
Time period
Cha
nge
in a
nnua
l mea
n te
mpe
ratu
re (º
C)
90%
90%
67%50%33%
10%10%
South East England
7
6
5
4
3
2
1
0
–1
2010–2039 2020–2049 2030–2059 2040–2069 2050–2079 2060–2089 2070–2099
Time period
Cha
nge
in a
nnua
l mea
n te
mpe
ratu
re (º
C)
South East England
90%
67%50%33%
10%
Low emissions Medium emissions High emissions
46 Design for future climate
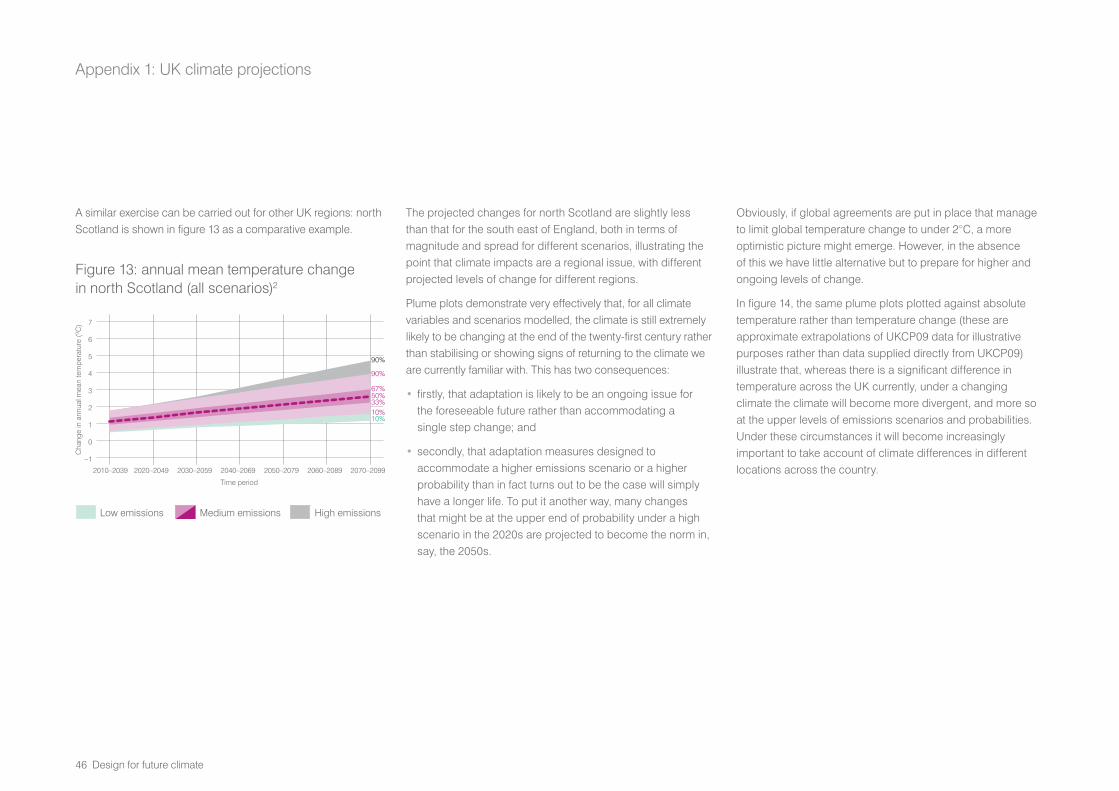
A similar exercise can be carried out for other UK regions: north Scotland is shown in figure 13 as a comparative example.
Figure 13: annual mean temperature change in north Scotland (all scenarios)2
The projected changes for north Scotland are slightly less than that for the south east of England, both in terms of magnitude and spread for different scenarios, illustrating the point that climate impacts are a regional issue, with different projected levels of change for different regions.
Plume plots demonstrate very effectively that, for all climate variables and scenarios modelled, the climate is still extremely likely to be changing at the end of the twenty-first century rather than stabilising or showing signs of returning to the climate we are currently familiar with. This has two consequences:
• firstly, that adaptation is likely to be an ongoing issue for the foreseeable future rather than accommodating a single step change; and
• secondly, that adaptation measures designed to accommodate a higher emissions scenario or a higher probability than in fact turns out to be the case will simply have a longer life. To put it another way, many changes that might be at the upper end of probability under a high scenario in the 2020s are projected to become the norm in, say, the 2050s.
Obviously, if global agreements are put in place that manage to limit global temperature change to under 2°C, a more optimistic picture might emerge. However, in the absence of this we have little alternative but to prepare for higher and ongoing levels of change.
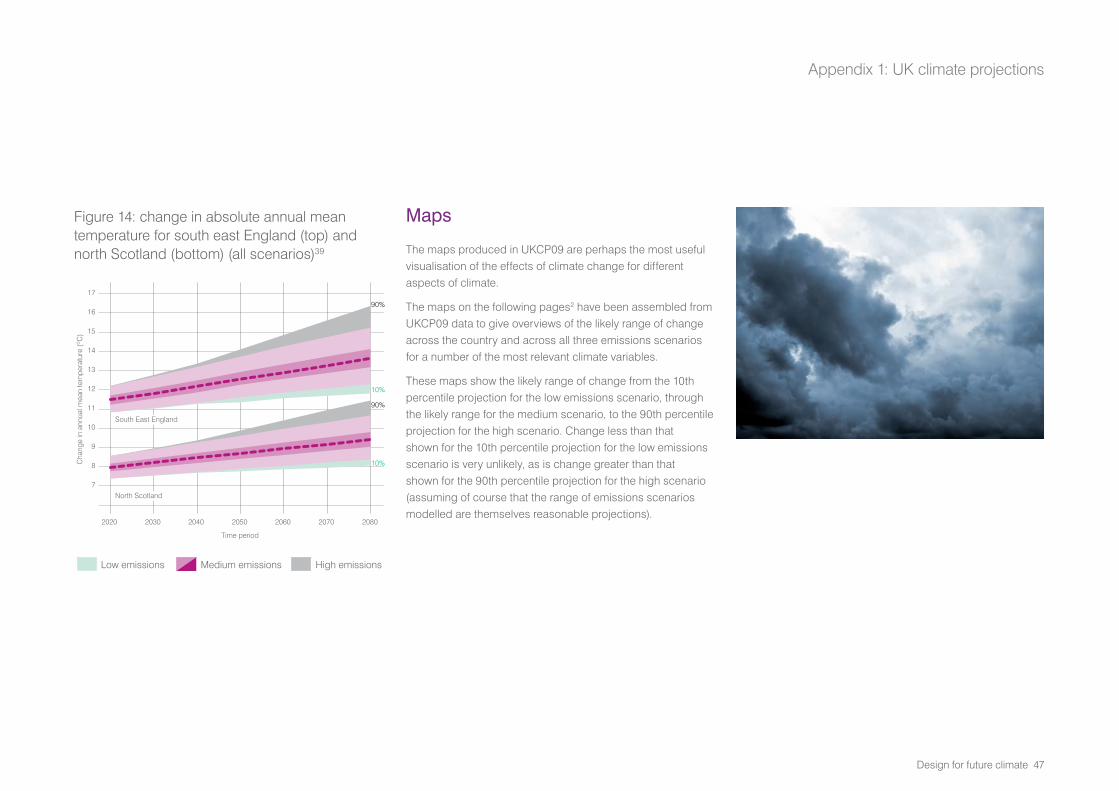
In figure 14, the same plume plots plotted against absolute temperature rather than temperature change (these are approximate extrapolations of UKCP09 data for illustrative purposes rather than data supplied directly from UKCP09) illustrate that, whereas there is a significant difference in temperature across the UK currently, under a changing climate the climate will become more divergent, and more so at the upper levels of emissions scenarios and probabilities. Under these circumstances it will become increasingly important to take account of climate differences in different locations across the country.
Appendix 1: UK climate projections
7
6
5
4
3
2
1
0
–1
2010–2039 2020–2049 2030–2059 2040–2069 2050–2079 2060–2089 2070–2099
Time period
Cha
nge
in a
nnua
l mea
n te
mpe
ratu
re (º
C)
Scotland North
90%
90%
67%50%33%10%10%
Low emissions Medium emissions High emissions
Design for future climate 47
Appendix 1: UK climate projections
Figure 14: change in absolute annual mean temperature for south east England (top) and north Scotland (bottom) (all scenarios)39
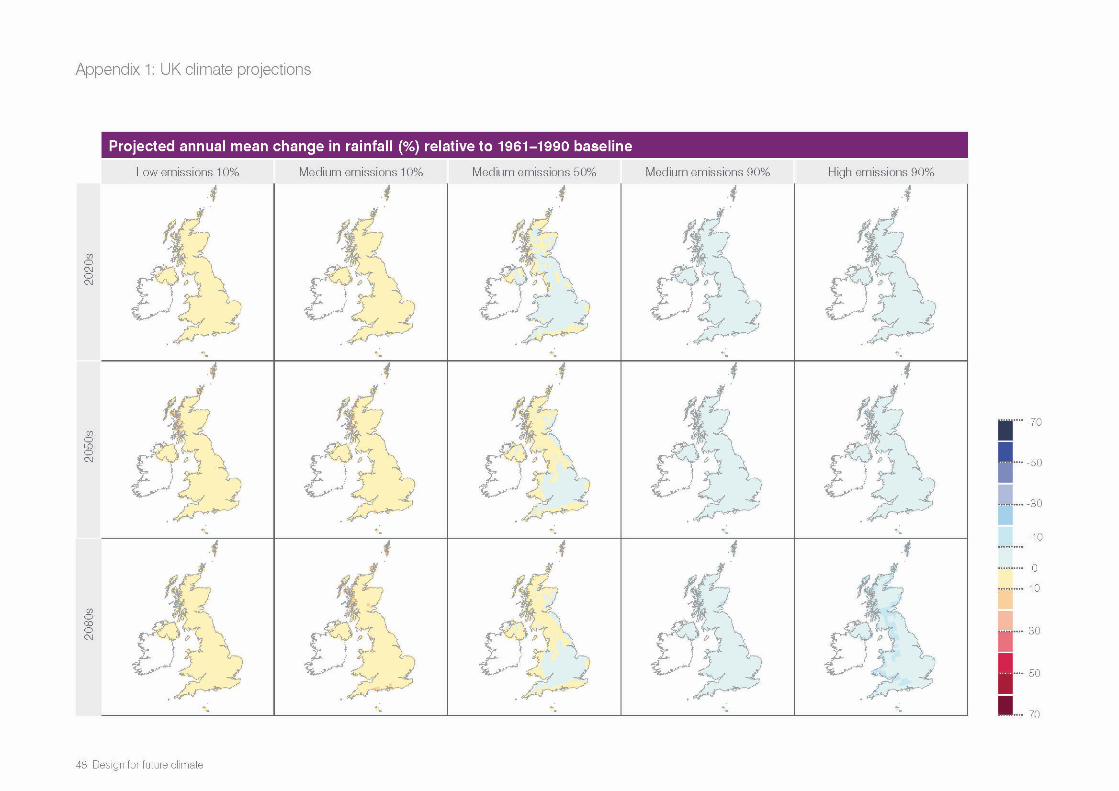
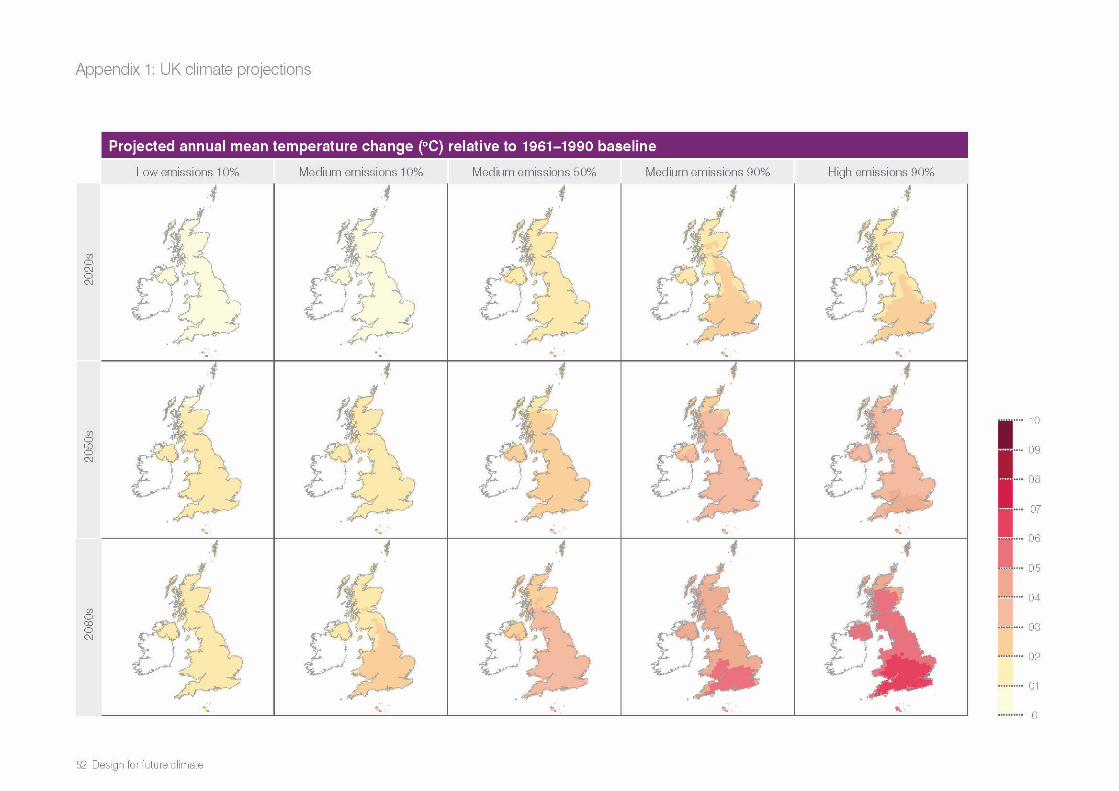
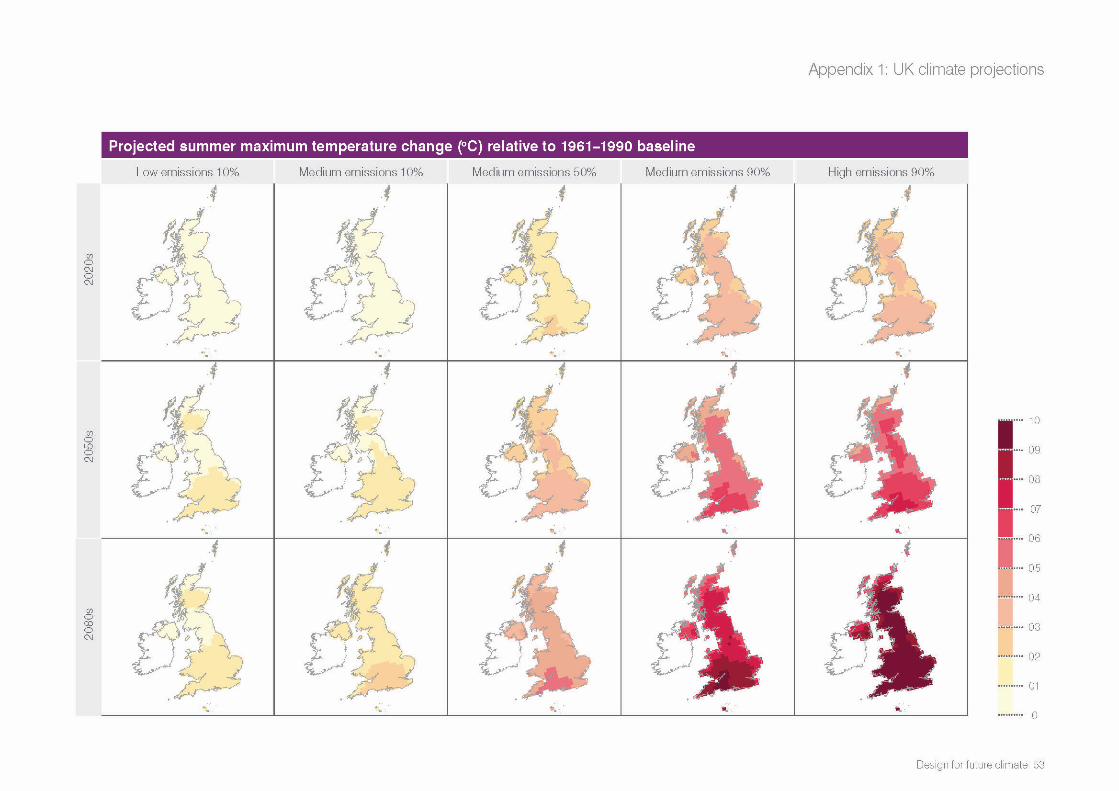
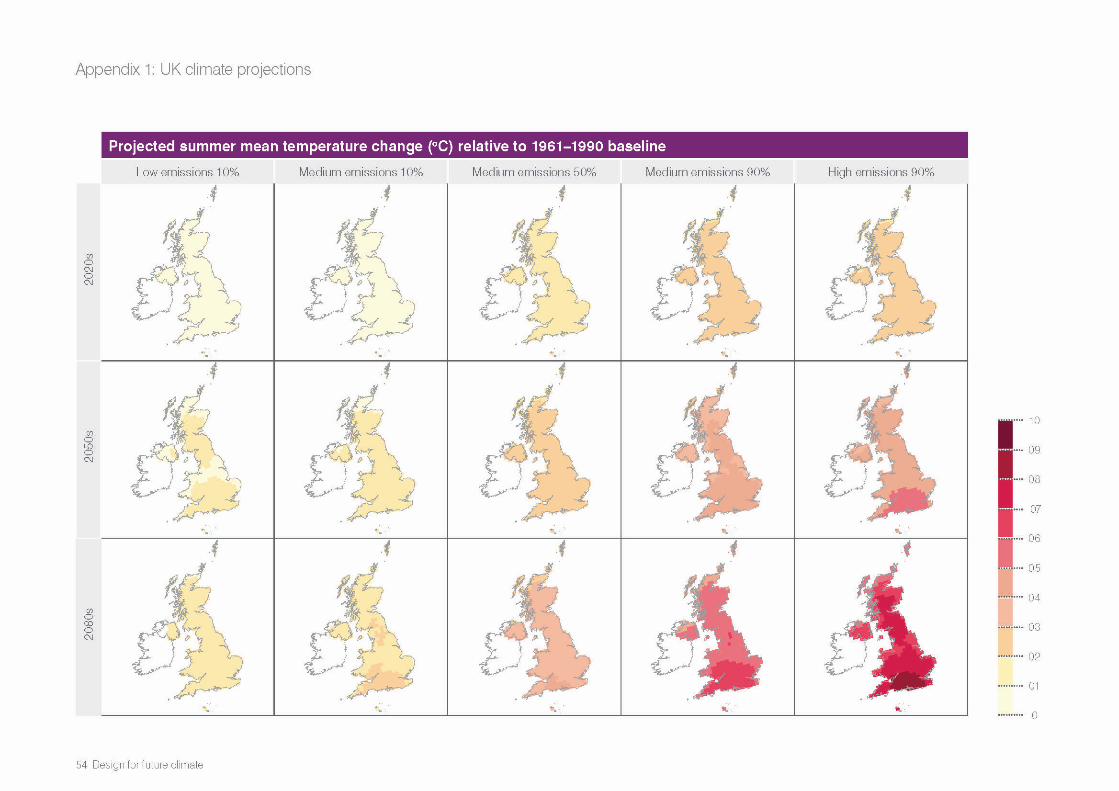
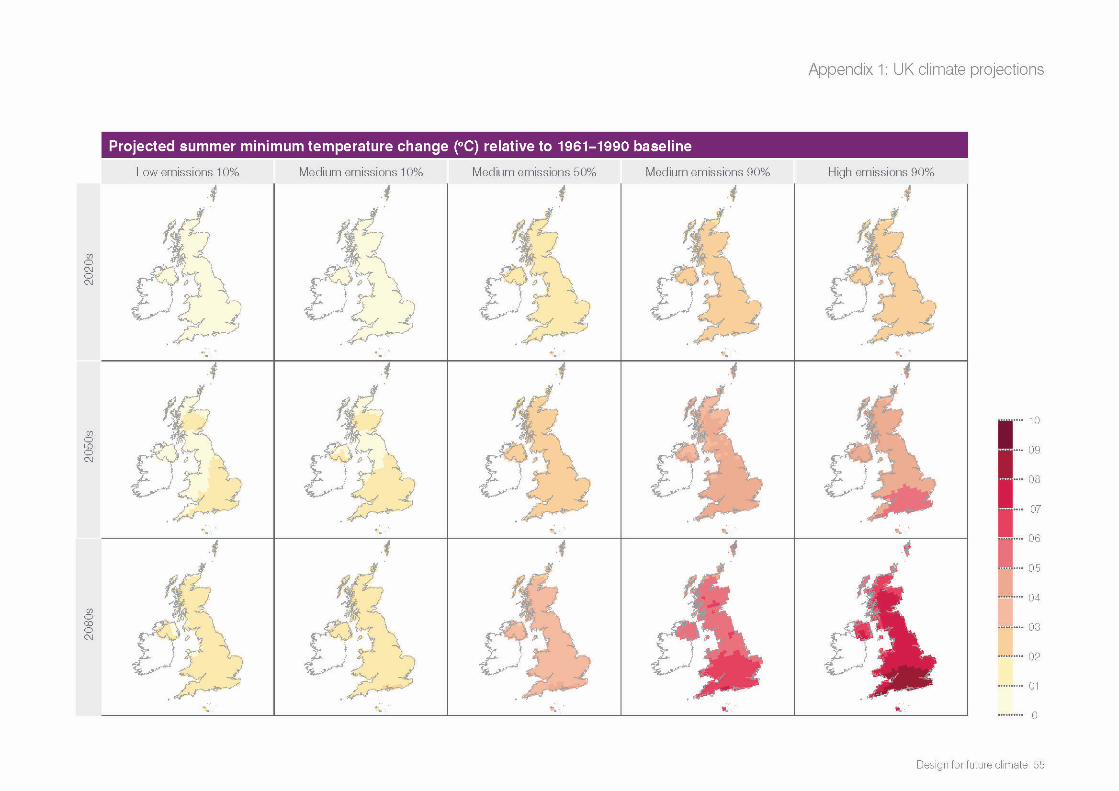
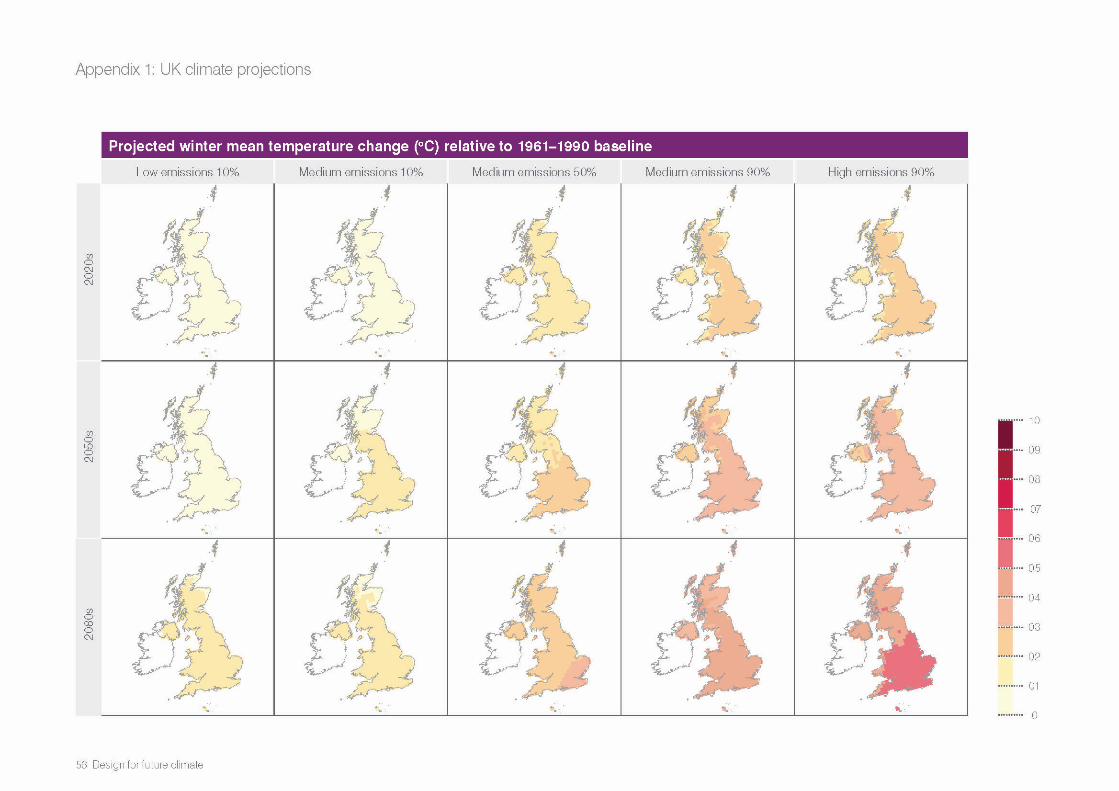
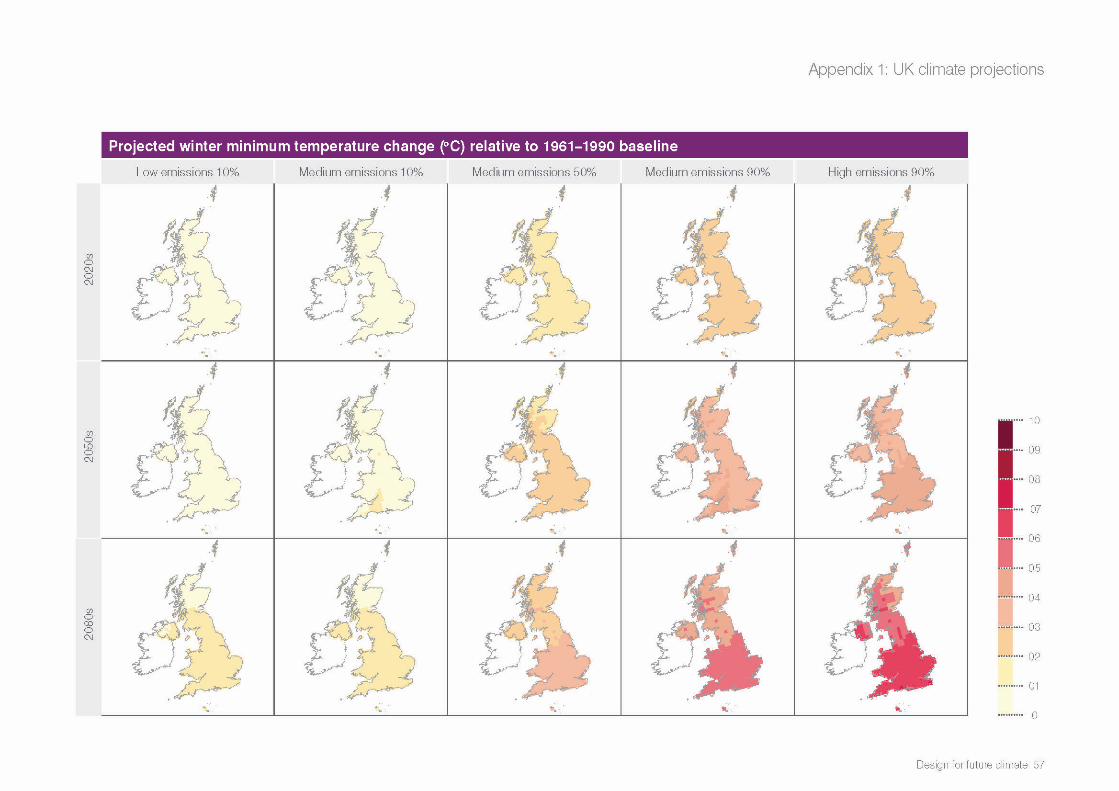
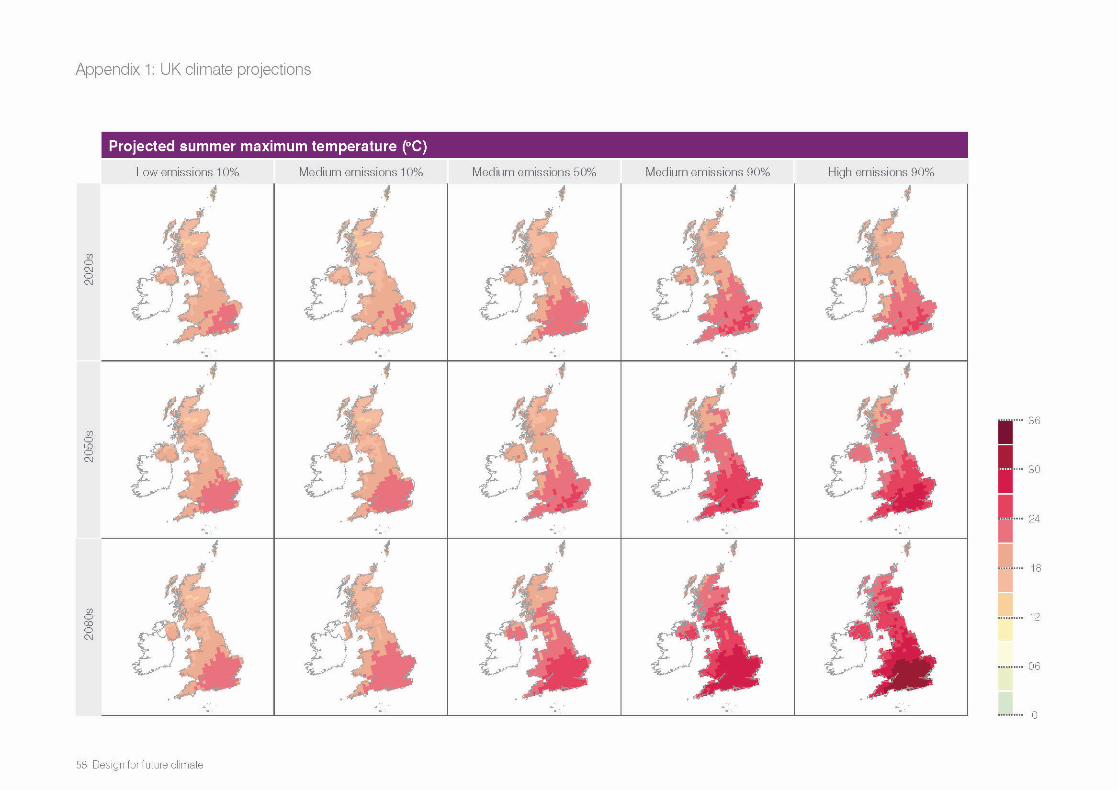
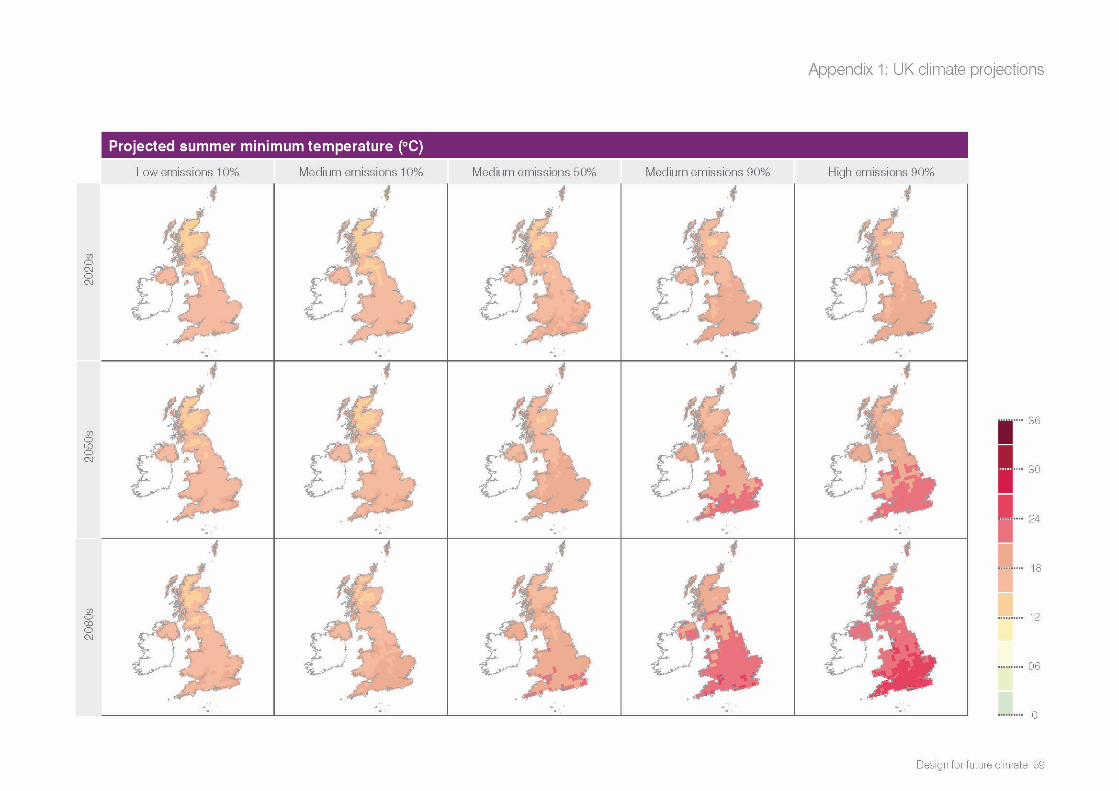
Maps
The maps produced in UKCP09 are perhaps the most useful visualisation of the effects of climate change for different aspects of climate.
The maps on the following pages2 have been assembled from UKCP09 data to give overviews of the likely range of change across the country and across all three emissions scenarios for a number of the most relevant climate variables.
These maps show the likely range of change from the 10th percentile projection for the low emissions scenario, through the likely range for the medium scenario, to the 90th percentile projection for the high scenario. Change less than that shown for the 10th percentile projection for the low emissions scenario is very unlikely, as is change greater than that shown for the 90th percentile projection for the high scenario (assuming of course that the range of emissions scenarios modelled are themselves reasonable projections).
Low emissions Medium emissions High emissions
17
16
15
14
13
12
11
10
9
8
7
2020 2030 2040 2050 2060 2070 2080
North Scotland
South East England
90%
10%
90%
10%
Time period
Cha
nge
in a
nnua
l mea
n te
mpe
ratu
re (º
C)
60 Design for future climate
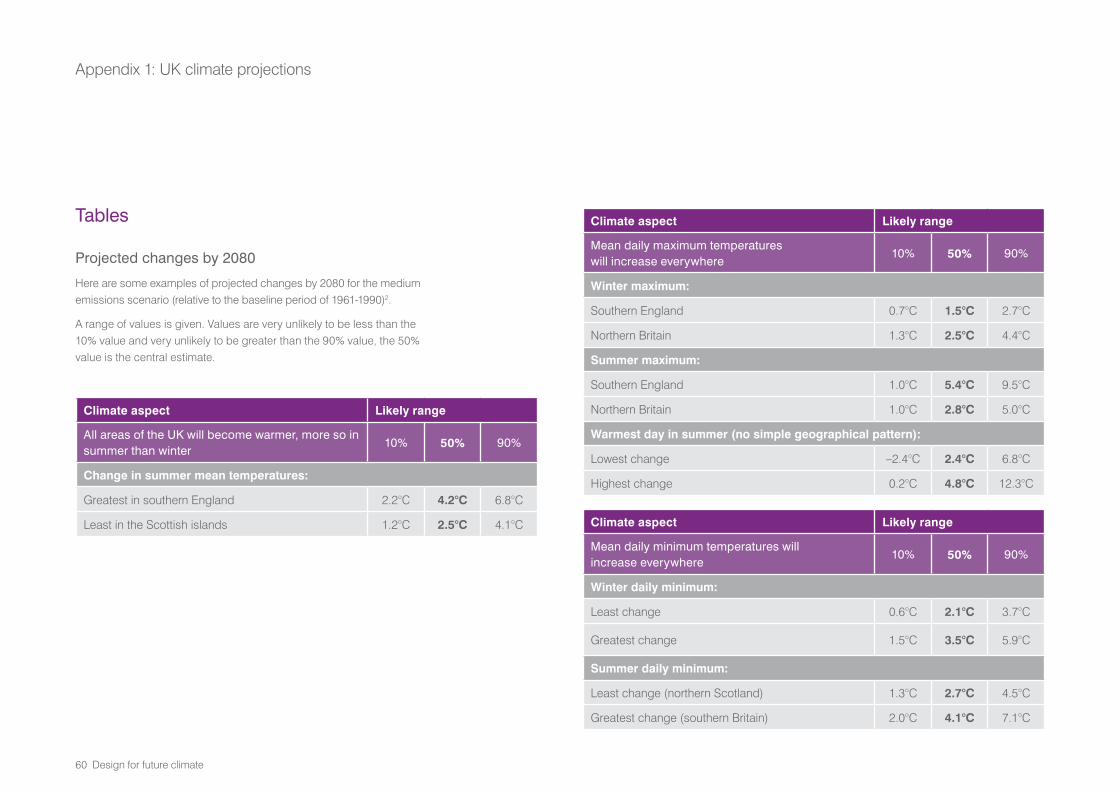
Climate aspect Likely range
All areas of the UK will become warmer, more so in summer than winter
10% 50% 90%
Change in summer mean temperatures:
Greatest in southern England 2.2°C 4.2°C 6.8°C
Least in the Scottish islands 1.2°C 2.5°C 4.1°C
Tables
Projected changes by 2080
Here are some examples of projected changes by 2080 for the medium emissions scenario (relative to the baseline period of 1961-1990)2.
A range of values is given. Values are very unlikely to be less than the 10% value and very unlikely to be greater than the 90% value, the 50% value is the central estimate.
Climate aspect Likely range
Mean daily maximum temperatures will increase everywhere
10% 50% 90%
Winter maximum:
Southern England 0.7°C 1.5°C 2.7°C
Northern Britain 1.3°C 2.5°C 4.4°C
Summer maximum:
Southern England 1.0°C 5.4°C 9.5°C
Northern Britain 1.0°C 2.8°C 5.0°C
Warmest day in summer (no simple geographical pattern):
Lowest change –2.4°C 2.4°C 6.8°C
Highest change 0.2°C 4.8°C 12.3°C
Climate aspect Likely range
Mean daily minimum temperatures will increase everywhere
10% 50% 90%
Winter daily minimum:
Least change 0.6°C 2.1°C 3.7°C
Greatest change 1.5°C 3.5°C 5.9°C
Summer daily minimum:
Least change (northern Scotland) 1.3°C 2.7°C 4.5°C
Greatest change (southern Britain) 2.0°C 4.1°C 7.1°C
Appendix 1: UK climate projections
Design for future climate 61
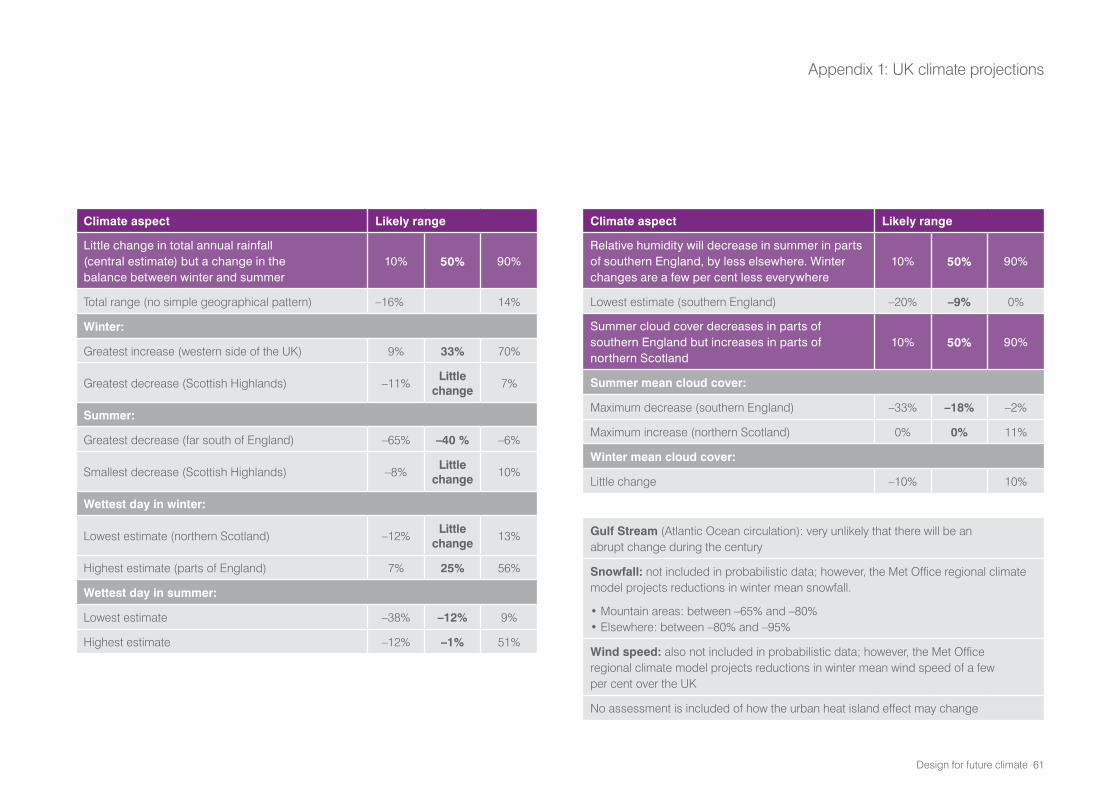
Climate aspect Likely range
Little change in total annual rainfall (central estimate) but a change in the balance between winter and summer
10% 50% 90%
Total range (no simple geographical pattern) –16% 14%
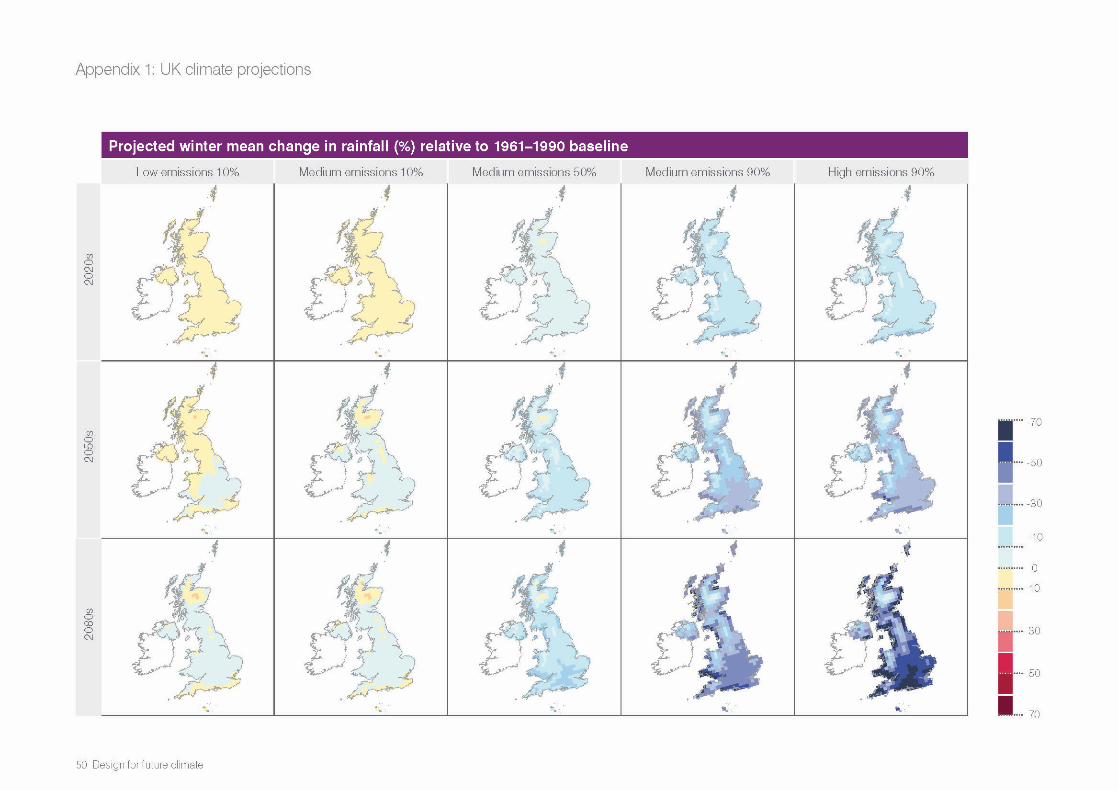
Winter:
Greatest increase (western side of the UK) 9% 33% 70%
Greatest decrease (Scottish Highlands) –11% Little
change7%
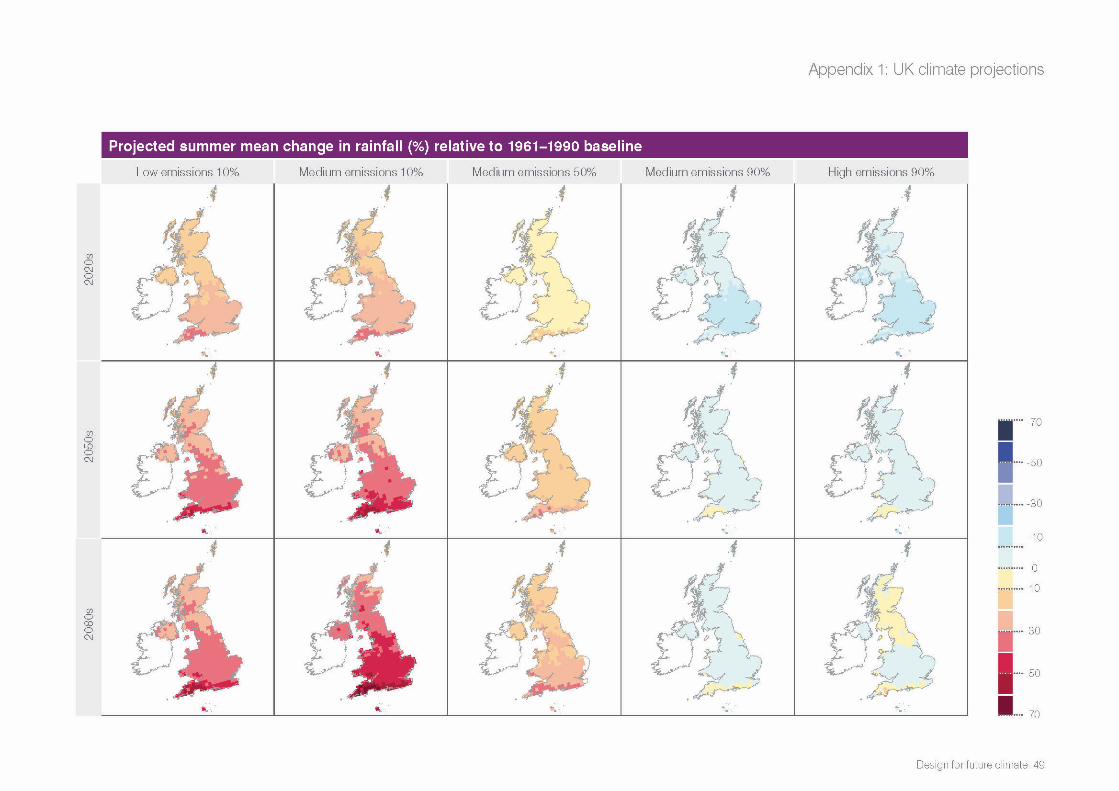
Summer:
Greatest decrease (far south of England) –65% –40 % –6%
Smallest decrease (Scottish Highlands) –8% Little
change10%
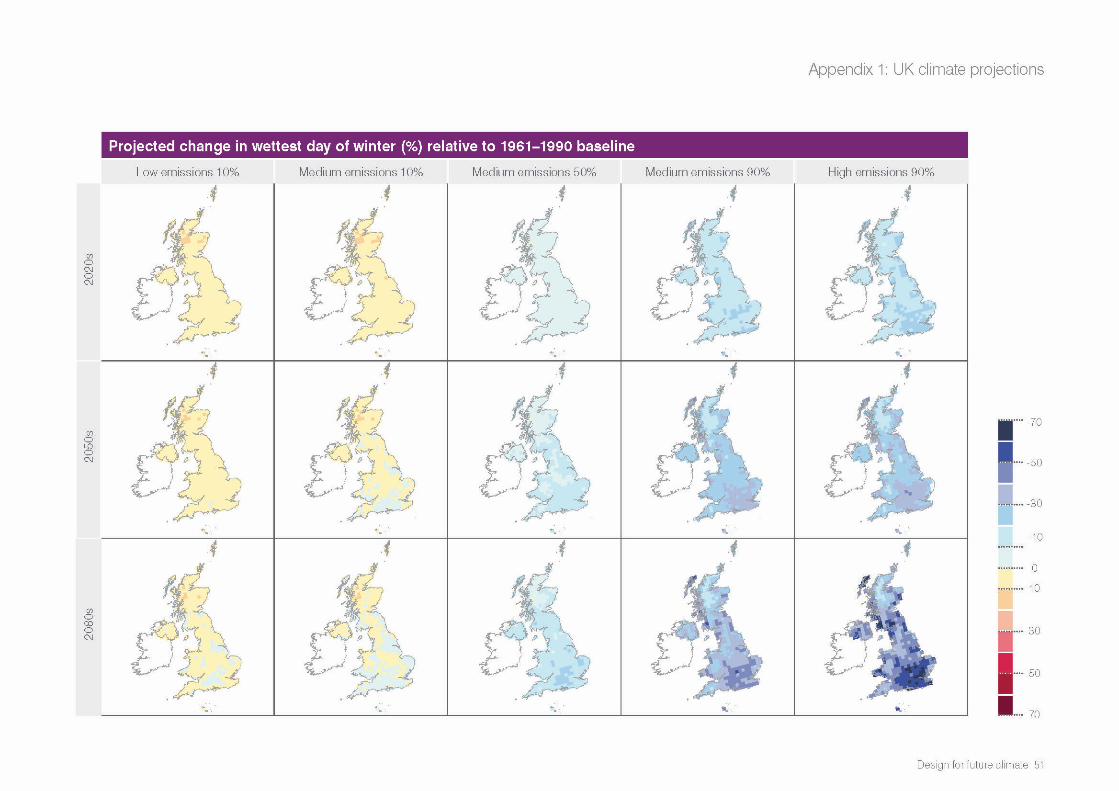
Wettest day in winter:
Lowest estimate (northern Scotland) –12% Little
change13%
Highest estimate (parts of England) 7% 25% 56%
Wettest day in summer:
Lowest estimate –38% –12% 9%
Highest estimate –12% –1% 51%
Climate aspect Likely range
Relative humidity will decrease in summer in parts of southern England, by less elsewhere. Winter changes are a few per cent less everywhere
10% 50% 90%
Lowest estimate (southern England) –20% –9% 0%
Summer cloud cover decreases in parts of southern England but increases in parts of northern Scotland
10% 50% 90%
Summer mean cloud cover:
Maximum decrease (southern England) –33% –18% –2%
Maximum increase (northern Scotland) 0% 0% 11%
Winter mean cloud cover:
Little change –10% 10%
Gulf Stream (Atlantic Ocean circulation): very unlikely that there will be an abrupt change during the century
Snowfall: not included in probabilistic data; however, the Met Office regional climate model projects reductions in winter mean snowfall.
•Mountainareas:between–65%and–80%•Elsewhere:between–80%and–95%
Wind speed: also not included in probabilistic data; however, the Met Office regional climate model projects reductions in winter mean wind speed of a few per cent over the UK
No assessment is included of how the urban heat island effect may change
Appendix 1: UK climate projections