4. observed climate and climate change projections … pdf/chapter 4 observed... · observed...
TRANSCRIPT

Tamil Nadu State Action Plan for Climate Change
25
4. OBSERVED CLIMATE AND CLIMATE CHANGE PROJECTIONS
4.1 INTRODUCTION ,
The State of Tamil Nadu is situated at the south-eastern extremity of the Indian Peninsula, bounded on the east by the Bay of Bengal, in the west by the Western Ghats and in the south by the Indian Ocean,and in the North West by Nellore and Chittoor districts of Andhra Pradesh and Kolar, Bangalore and Mysore districts of Karnataka. It has a coastal line of 922 km and land boundary of 1200 km. It lies between 8° 5΄ and 13° 35΄ N latitude and between 76° 15΄ and 80° 20΄ E longitude. The State can be divided into two natural divisions namely, the coastal plains and hilly western areas.The Palghat gap of Kerala about 25 km in width in the great western mountain wall is the only marked break to Tamil Nadu. The slopes of the Western Ghats are covered with heavy evergreen forests, that too presently being made grey rapidly with human intervention, thus making it susceptible to animal and human conflict.
The trend of drainage is from west to east into the Bay of Bengal. The river Cauvery rises from the Brahmagiri hill in Coorg district of Karnataka and passes across eastwards across the peninsula into the Bay of Bengal. The Ponnaiyar River rises from Kolar district of Karnataka runs across the State and falls into the sea north of Cuddalore. The Vaigai river from Western Ghats and passes across the State and finally falls into the Bay of Bengal, 16 km east of Ramanathapuram.
The proximity of sea influences the climate of the eastern and southern parts of the State whereas hilly orography and inland locations play important roles in modifying the climate over rest of the State.The western portions of the State and the portions bordering with Kerala have a marine climate with mild winters and moist summers and the remaining part of the State has a tropical savanna climate that is hot and seasonally dry.
Out of 13 million hectares of geographical area, about 7 million hectares of land is under cultivation. Of this 55 percent is irrigated and rest is rain fed/ dry land. Among all the States in India, ground water has been harnessed fully in this State. Tamil Nadu has been divided into seven agro climatic sub-zones, three agro ecological zones amd 16 sub agro-ecological zones. The agroclimatic zones are North Eastern zone, North Western zone, Western Zone, Cauvery Delta zone, the Southern zone, High rainfall zone and High Altitude and Hilly zone. The three agro-ecological zones are the hot semi arid eco-region with red loamy soil, hot sub humid to semi arid eco-region with coastal alluvium derived soils and hot humid eco-regions with red lateritic and alluvium derived soils. This classification helps in the suitable planning and should be made based on these boundaries.

Tamil Nadu State Action Plan for Climate Change
26
4.2 OBSERVED CLIMATE
Rainfall Pattern
The State mainly receives its rainfall in three seasons, viz. south west monsoon, north east monsoon and pre monsoon season. The normal annual rainfall falling over the State is 958.4 mm. About 50 percent of the total annual average rainfall is received during north east monsoon, while about 31 percent is received during south west monsoon and the balance in the other seasons. The coastal districts receive about 65-75 percent of annual rainfall and interior districts get about 40-50 percent in this season. The percentage share of rainfall of different locations coastal/ inland / hilly stations for four seasons are given in the Table 4.1. The hilly regions in the west and hilly/ plain lands in north western half of the region receive major share from south west monsoon. Figure 4.1 shows the spatial pattern of rainfall during north east monsoon season.
Table 4.1: Seasonal rainfall of selected stations in Tamil Nadu (Rainfall in cm)
Stations Lat. Long.
Percentage share of rainfall in various seasons
Winter Pre monsoon south west monsoon
north east monsoon
Meenambakkam 13.07 80.19 2.2 5.3 33.5 59.0
Nungambakkam 13.07 80.25 3.6 5.0 30.8 60.6
Vellore 12.92 79.15 3.0 10.1 46.1 40.8
Kanchipuram 12.83 79.72 2.9 7.0 43.7 46.4
Chengulpattu 12.70 79.95 3.1 5.6 38.4 53.0
Tiruvannamalai 12.23 79.08 3.9 10.8 43.7 41.6
Dharmapuri 12.13 78.18 2.3 18.9 42.4 36.4
Villupuram 11.93 79.50 4.0 7.3 38.3 50.3
Cuddalore 11.77 79.77 5.2 6.3 26.3 62.1
Salem 11.65 78.18 1.8 17.3 49.7 31.3
Ooty 11.40 76.73 2.7 20.6 45.9 30.9
Erode 11.35 77.67 3.3 20.2 35.2 41.3
Mettupalayam 11.30 76.25 7.8 21.4 19.4 51.4
Coimbatore 11.03 77.05 3.5 20.7 24.8 51.0
Karur 10.95 78.09 2.1 16.9 26.3 54.7
Tanjavur 10.78 79.13 5.7 11.1 34.1 49.2
Tiruchirapalli 10.77 78.72 3.8 15.0 35.2 45.9
Vedaranyam 10.37 79.85 21.5 8.4 13.6 56.5
Dindigul 10.35 77.97 4.8 16.2 29.7 49.3
Adiramapattinum 10.33 79.88 6.2 11.7 27.4 54.7
Kodaikanal 10.23 77.47 6.0 21.2 34.3 38.4
Madurai 9.92 78.12 1.9 12.6 37.0 48.5
Tondi 9.77 79.03 5.2 16.2 16.3 62.3
Virudhunagar 9.68 77.97 4.5 20.0 29.0 46.5
Tuticorin 8.80 78.15 8.0 17.7 5.4 68.9
Palayamkottai 8.73 77.75 9.8 18.4 9.7 62.1
Tiruchendur 8.50 78.12 12.1 12.7 3.3 71.8
Kanyakumari 8.08 77.05 3.6 17.5 29.1 49.8
Tamil Nadu 4.3 13.1 31.9 50.7 Source: http://www.tn.gov.in/dept.st/climate and rainfall.pdf
Tamil Nadu State Action Plan for Climate Change
27
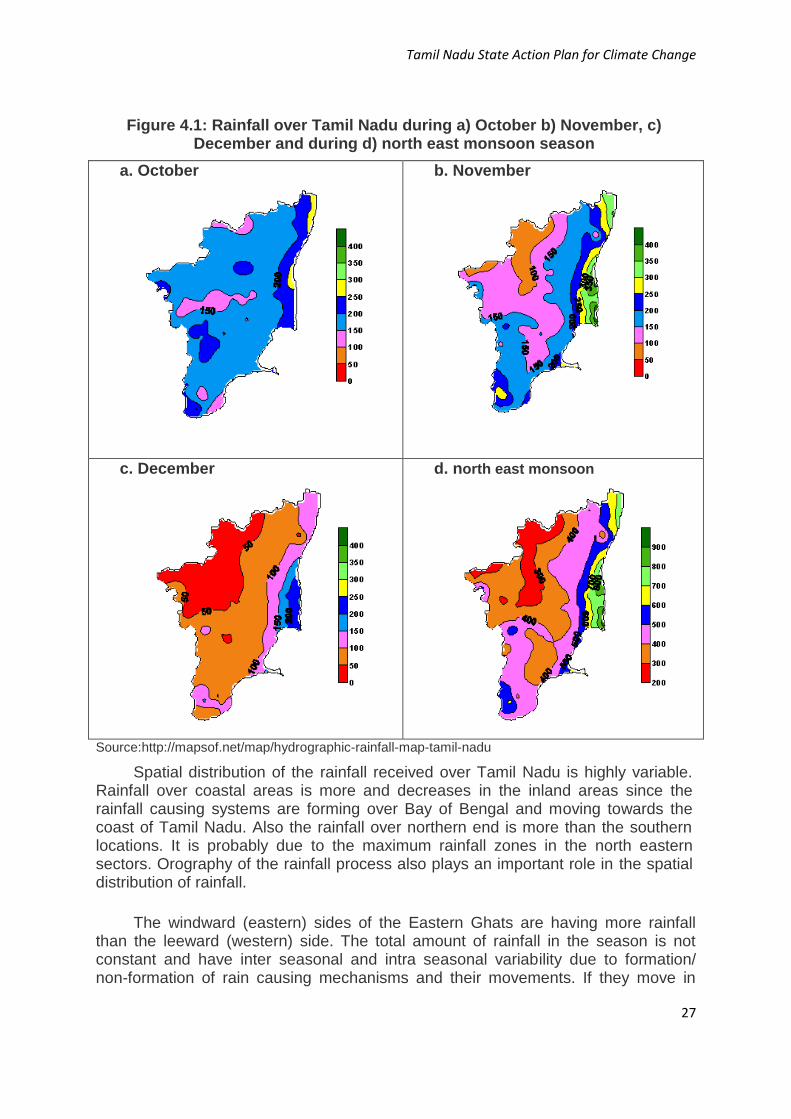
Figure 4.1: Rainfall over Tamil Nadu during a) October b) November, c) December and during d) north east monsoon season
a. October
b. November
c. December
d. north east monsoon
Source:http://mapsof.net/map/hydrographic-rainfall-map-tamil-nadu
Spatial distribution of the rainfall received over Tamil Nadu is highly variable. Rainfall over coastal areas is more and decreases in the inland areas since the rainfall causing systems are forming over Bay of Bengal and moving towards the coast of Tamil Nadu. Also the rainfall over northern end is more than the southern locations. It is probably due to the maximum rainfall zones in the north eastern sectors. Orography of the rainfall process also plays an important role in the spatial distribution of rainfall.
The windward (eastern) sides of the Eastern Ghats are having more rainfall than the leeward (western) side. The total amount of rainfall in the season is not constant and have inter seasonal and intra seasonal variability due to formation/ non-formation of rain causing mechanisms and their movements. If they move in
Tamil Nadu State Action Plan for Climate Change
28
north westerly or westerly direction, the systems cause more rainfall than when they re-curve or move in northerly direction The coefficient of variation of annual rainfall is less than 25 percent over the central part except over the coastal area north of latitude 10° N and extreme southern part where the coefficient may even exceed 30 percent.
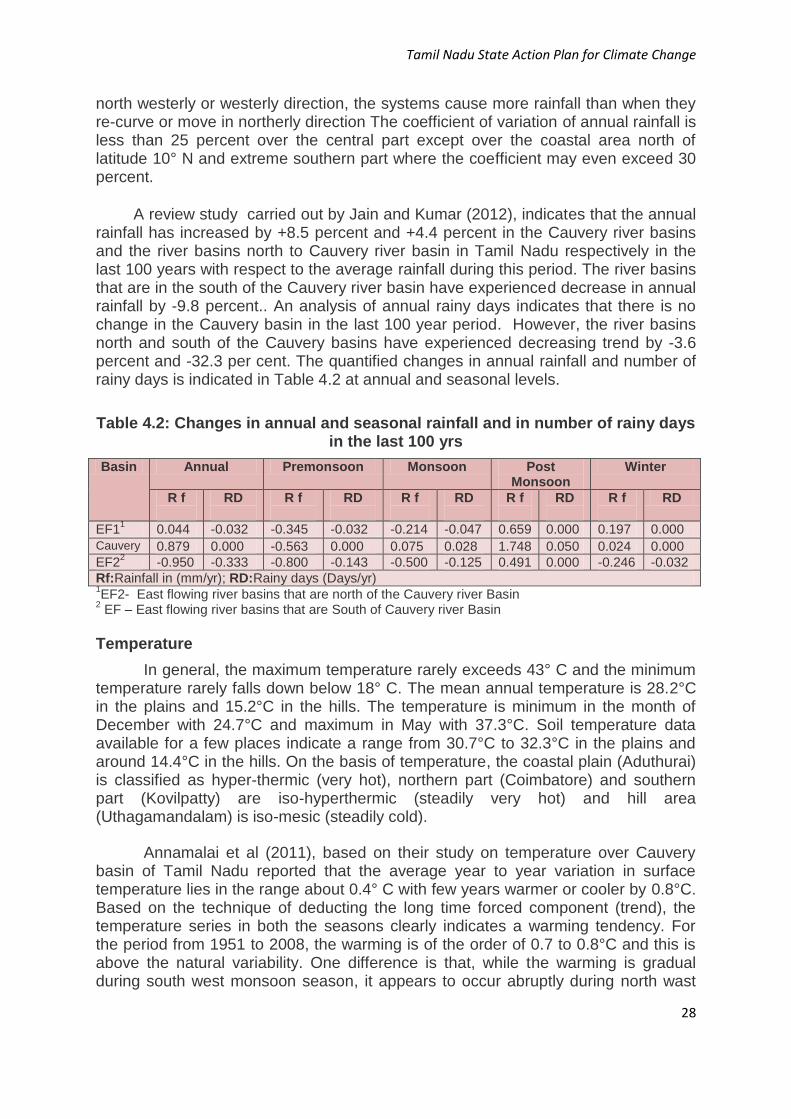
A review study carried out by Jain and Kumar (2012), indicates that the annual rainfall has increased by +8.5 percent and +4.4 percent in the Cauvery river basins and the river basins north to Cauvery river basin in Tamil Nadu respectively in the last 100 years with respect to the average rainfall during this period. The river basins that are in the south of the Cauvery river basin have experienced decrease in annual rainfall by -9.8 percent.. An analysis of annual rainy days indicates that there is no change in the Cauvery basin in the last 100 year period. However, the river basins north and south of the Cauvery basins have experienced decreasing trend by -3.6 percent and -32.3 per cent. The quantified changes in annual rainfall and number of rainy days is indicated in Table 4.2 at annual and seasonal levels.
Table 4.2: Changes in annual and seasonal rainfall and in number of rainy days in the last 100 yrs
Basin Annual Premonsoon Monsoon Post Monsoon
Winter
R f
RD
R f
RD
R f
RD
R f
RD
R f
RD
EF11
0.044 -0.032 -0.345 -0.032 -0.214 -0.047 0.659 0.000 0.197 0.000
Cauvery 0.879 0.000 -0.563 0.000 0.075 0.028 1.748 0.050 0.024 0.000
EF22
-0.950 -0.333 -0.800 -0.143 -0.500 -0.125 0.491 0.000 -0.246 -0.032
Rf:Rainfall in (mm/yr); RD:Rainy days (Days/yr) 1EF2- East flowing river basins that are north of the Cauvery river Basin
2 EF – East flowing river basins that are South of Cauvery river Basin
Temperature
In general, the maximum temperature rarely exceeds 43° C and the minimum temperature rarely falls down below 18° C. The mean annual temperature is 28.2°C in the plains and 15.2°C in the hills. The temperature is minimum in the month of December with 24.7°C and maximum in May with 37.3°C. Soil temperature data available for a few places indicate a range from 30.7°C to 32.3°C in the plains and around 14.4°C in the hills. On the basis of temperature, the coastal plain (Aduthurai) is classified as hyper-thermic (very hot), northern part (Coimbatore) and southern part (Kovilpatty) are iso-hyperthermic (steadily very hot) and hill area (Uthagamandalam) is iso-mesic (steadily cold).
Annamalai et al (2011), based on their study on temperature over Cauvery basin of Tamil Nadu reported that the average year to year variation in surface temperature lies in the range about 0.4° C with few years warmer or cooler by 0.8°C. Based on the technique of deducting the long time forced component (trend), the temperature series in both the seasons clearly indicates a warming tendency. For the period from 1951 to 2008, the warming is of the order of 0.7 to 0.8°C and this is above the natural variability. One difference is that, while the warming is gradual during south west monsoon season, it appears to occur abruptly during north wast
Tamil Nadu State Action Plan for Climate Change
29
monsson season. Balasubramanian et al (1994) based on their analysis of the prevailed temperature in Coimbatore from 1962 to 1992 found that there was decadal variability in maximum and minimum temperature and this was on the rise level up to 0.1 to 2.7° C.
Monsoons Onset and Withdrawals
The normal onset of southwest monsoon over Tamil Nadu is predicted to take place on 1st June with a standard deviation(SD) of 7.4 days (based on data of 1901-2011). During the last 31 years (1981-2011) period, however, the normal date has advanced by a day with SD of 6 days. The earliest onset is 11th May and the late onset is 18th June. Based on the linear trend analysis, it was found that the onset is advanced by one day in every 20 years period (1901-2011).
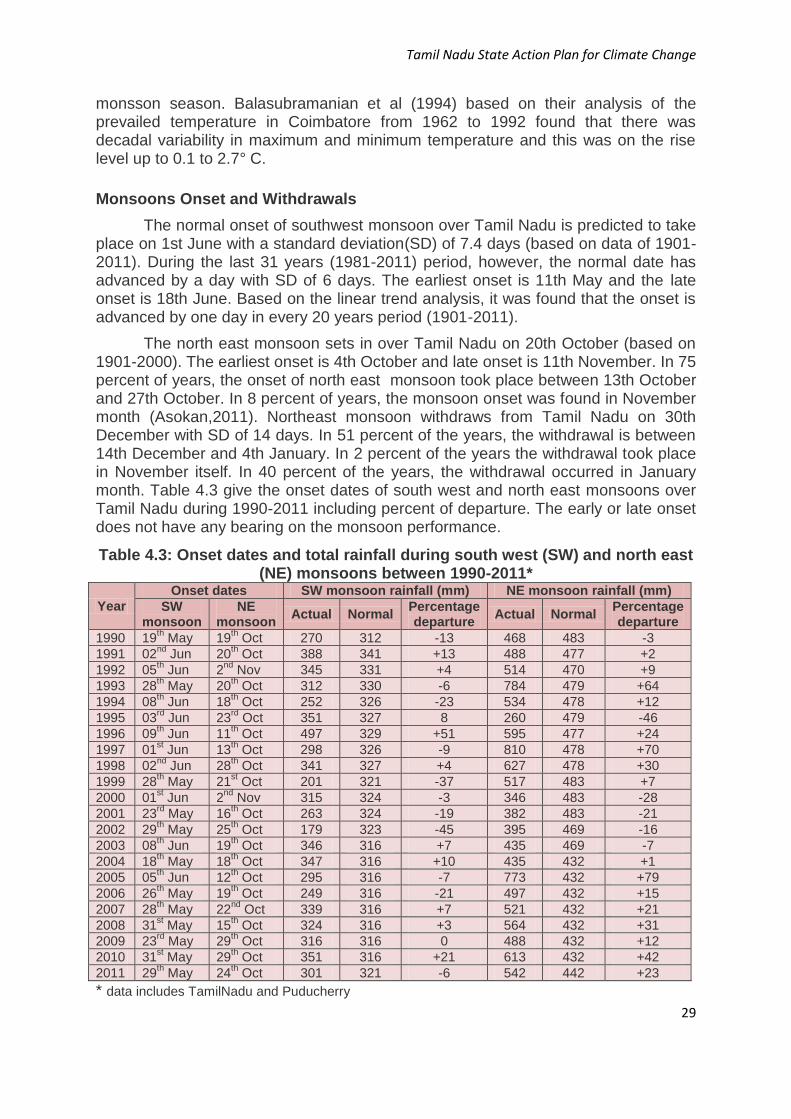
The north east monsoon sets in over Tamil Nadu on 20th October (based on 1901-2000). The earliest onset is 4th October and late onset is 11th November. In 75 percent of years, the onset of north east monsoon took place between 13th October and 27th October. In 8 percent of years, the monsoon onset was found in November month (Asokan,2011). Northeast monsoon withdraws from Tamil Nadu on 30th December with SD of 14 days. In 51 percent of the years, the withdrawal is between 14th December and 4th January. In 2 percent of the years the withdrawal took place in November itself. In 40 percent of the years, the withdrawal occurred in January month. Table 4.3 give the onset dates of south west and north east monsoons over Tamil Nadu during 1990-2011 including percent of departure. The early or late onset does not have any bearing on the monsoon performance.
Table 4.3: Onset dates and total rainfall during south west (SW) and north east (NE) monsoons between 1990-2011*
Year
Onset dates SW monsoon rainfall (mm) NE monsoon rainfall (mm)
SW monsoon
NE monsoon
Actual Normal Percentage departure
Actual Normal Percentage departure
1990 19th May 19
th Oct 270 312 -13 468 483 -3
1991 02nd
Jun 20th Oct 388 341 +13 488 477 +2
1992 05th Jun 2
nd Nov 345 331 +4 514 470 +9
1993 28th May 20
th Oct 312 330 -6 784 479 +64
1994 08th Jun 18
th Oct 252 326 -23 534 478 +12
1995 03rd
Jun 23rd
Oct 351 327 8 260 479 -46
1996 09th Jun 11
th Oct 497 329 +51 595 477 +24
1997 01st Jun 13
th Oct 298 326 -9 810 478 +70
1998 02nd
Jun 28th Oct 341 327 +4 627 478 +30
1999 28th May 21
st Oct 201 321 -37 517 483 +7
2000 01st Jun 2
nd Nov 315 324 -3 346 483 -28
2001 23rd
May 16th Oct 263 324 -19 382 483 -21
2002 29th May 25
th Oct 179 323 -45 395 469 -16
2003 08th Jun 19
th Oct 346 316 +7 435 469 -7
2004 18th May 18
th Oct 347 316 +10 435 432 +1
2005 05th Jun 12
th Oct 295 316 -7 773 432 +79
2006 26th May 19
th Oct 249 316 -21 497 432 +15
2007 28th May 22
nd Oct 339 316 +7 521 432 +21
2008 31st May 15
th Oct 324 316 +3 564 432 +31
2009 23rd
May 29th Oct 316 316 0 488 432 +12
2010 31st May 29
th Oct 351 316 +21 613 432 +42
2011 29th May 24
th Oct 301 321 -6 542 442 +23
* data includes TamilNadu and Puducherry
Tamil Nadu State Action Plan for Climate Change
30
Extreme Rainfall
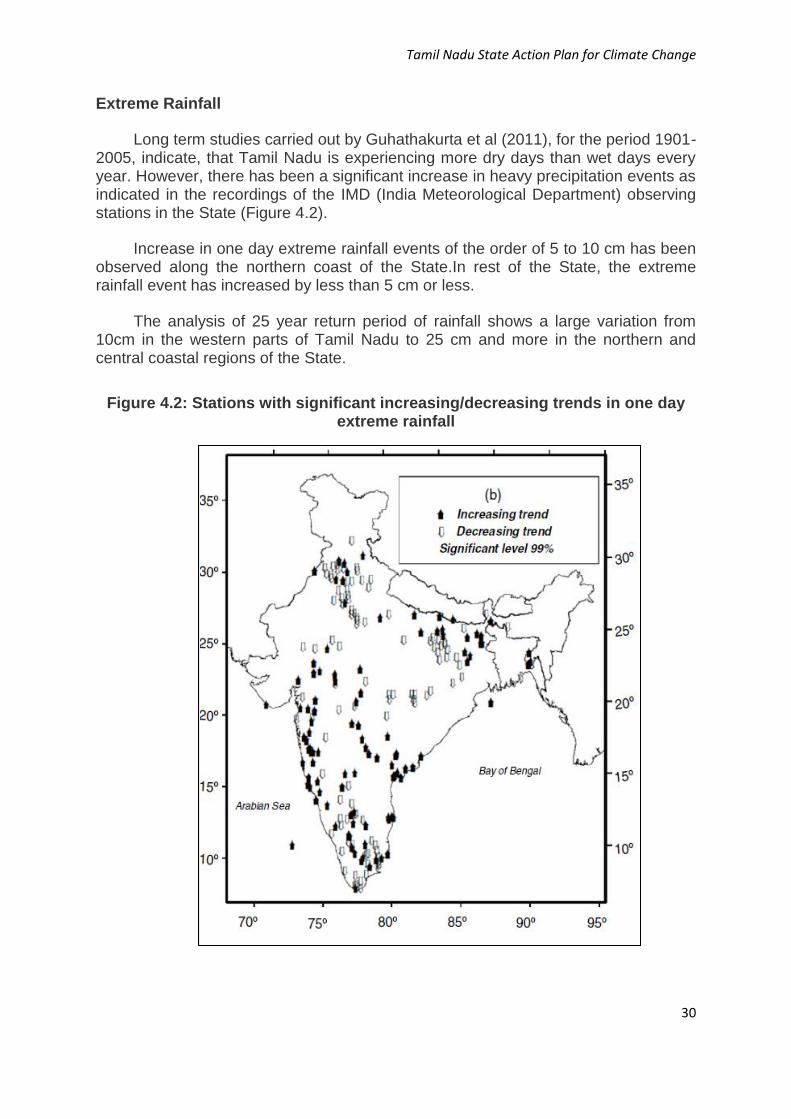
Long term studies carried out by Guhathakurta et al (2011), for the period 1901-2005, indicate, that Tamil Nadu is experiencing more dry days than wet days every year. However, there has been a significant increase in heavy precipitation events as indicated in the recordings of the IMD (India Meteorological Department) observing stations in the State (Figure 4.2).
Increase in one day extreme rainfall events of the order of 5 to 10 cm has been observed along the northern coast of the State.In rest of the State, the extreme rainfall event has increased by less than 5 cm or less.
The analysis of 25 year return period of rainfall shows a large variation from 10cm in the western parts of Tamil Nadu to 25 cm and more in the northern and central coastal regions of the State.
Figure 4.2: Stations with significant increasing/decreasing trends in one day extreme rainfall

Tamil Nadu State Action Plan for Climate Change
31
Cyclones
Situated along the eastern coast of India, Tamil Nadu has been hit by about 32 cyclonic storms between 1891 to 2006 of which 30 were severe cyclonic storms. The total number of cyclonic storms hitting the Tamil Nadu coast increased to 44 by 2011. A sharp increase by 37.5 percent between 2006 and 2011.
Maximum number of cyclonic storms tend to cross over north Tamil Nadu coast in the post monsoon season. No cyclonic disturbances crossed Tamil Nadu coast during monsoon season (June-September).The number of storms that crossed north Tamil Nadu coast is four times more than that crossed south Tamil Nadu coast during pre monsoon months during this period. Only three cyclonic disturbances crossed Tamil Nadu coast during winter months (Figure 4.3).
Linear trend analysis based on two different periods 1891- 2011 for winter, pre monsoon, monsoon, post monsoon and annual frequency shows that the formation of cyclonic disturbances in the Bay of Bengal (BOB) during winter and post monsoon months (October-February) shows an increasing trend while a decreasing trend is seen during the monsoon months (June–September).There is an increasing trend in the number of severe cyclonic storms to form in BOB in pre monsoon months (March–May) during same period.
Figure 4.3: Number of cyclonic storms crossing eastern coastal states
in India between 1891 and 2006
Source: IMD ( www.imd.gov.in/section/nhac/dynamic/cyclone.htm1)
Tamil Nadu State Action Plan for Climate Change
32
Box 4.1: About PRECIS and A1B Scenario
PRECIS is based on the UK Met Office Hadley Centre's regional climate modelling system (HadCM3). It has been ported to run on a work station (under Linux) with a simple user interface, so that experiments can easily be set up over any region.
For further details see http://www.metoffice.gov.uk/precis.
The IPCC A1B SRES scenario is a socio economic scenario that refers to a future world of very rapid economic growth, and rapid introduction of new and more efficient technologies. Major underlying themes are economic and cultural convergence and capacity building, with a substantial reduction in regional differences in per capita income. For further details see IPCC, Special report on Emission Scenarios (SRES), 2000.
https://www.ipcc.ch/pdf/special-reports/spm/sres-en.pdf).
Sea level rise
The mean sea level rise trend off the Chennai coast is 0.32 mm/year, estimated with a 95 percent confidence interval of +0.37 mm/year based on monthly mean sea level data for the period 1916 to 2008 which is equivalent to a change of 0.10 feet in 100 year (http://tidesandcurrents.noaa.gov/sltrends/).
4.3 CLIMATE PROJECTION
The following section gives the projections of temperature and precipitation based on UK Met Office Hadley Centre regional climate model PRECIS with boundary data inputs from 6 out of 17- member perturbed-physics ensemble (HadCM3Q0-Q16, known as 'QUMP').The model was run at CCC&AR, Anna University at a spatial resolution of 25 km x 25 km and the GHG emission drivers are generated by the IPCC A1B SRES scenario (Box 4.1).
Temperature Projections
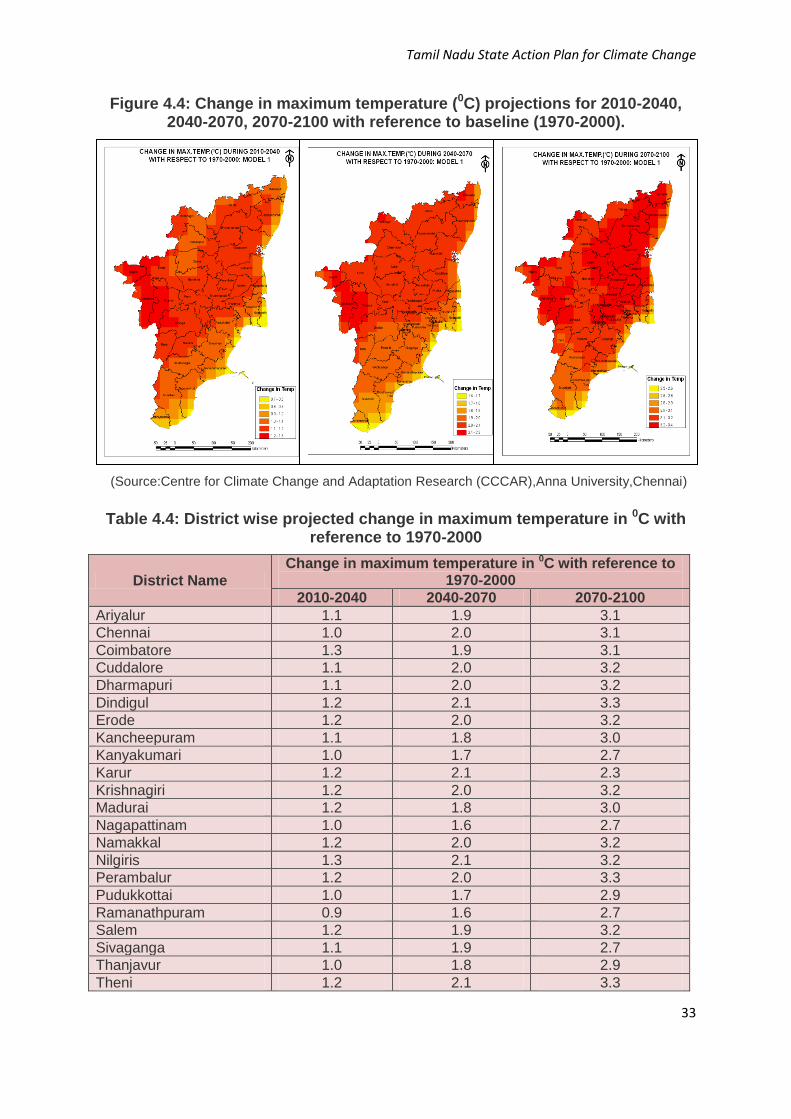
Maximum Temperature: The maximum temperature over Tamil Nadu is projected to increase by 1.00C, 2.00C and 3.10C for the periods 2010-2040, 2040-2070, 2070-2100 respectively with reference to the baseline 1970-2000 (Table 4.4). District wise changes (Figure 4.4) indicate a general maximum increase of about 3.40C over the North western districts of Nilgiris, Coimbatore, Tiruppur and western parts of Dindigul District at the end of the century. The minimum increase of about 0.70C is seen along the eastern parts of coastal districts particularly over Kanyakumari, Nagapattinam, Tirunelveli and Ramanathapuram.
Tamil Nadu State Action Plan for Climate Change
33
Figure 4.4: Change in maximum temperature (0C) projections for 2010-2040, 2040-2070, 2070-2100 with reference to baseline (1970-2000).
(Source:Centre for Climate Change and Adaptation Research (CCCAR),Anna University,Chennai)
Table 4.4: District wise projected change in maximum temperature in 0C with reference to 1970-2000
District Name
Change in maximum temperature in 0C with reference to 1970-2000
2010-2040 2040-2070 2070-2100
Ariyalur 1.1 1.9 3.1
Chennai 1.0 2.0 3.1
Coimbatore 1.3 1.9 3.1
Cuddalore 1.1 2.0 3.2
Dharmapuri 1.1 2.0 3.2
Dindigul 1.2 2.1 3.3
Erode 1.2 2.0 3.2
Kancheepuram 1.1 1.8 3.0
Kanyakumari 1.0 1.7 2.7
Karur 1.2 2.1 2.3
Krishnagiri 1.2 2.0 3.2
Madurai 1.2 1.8 3.0
Nagapattinam 1.0 1.6 2.7
Namakkal 1.2 2.0 3.2
Nilgiris 1.3 2.1 3.2
Perambalur 1.2 2.0 3.3
Pudukkottai 1.0 1.7 2.9
Ramanathpuram 0.9 1.6 2.7
Salem 1.2 1.9 3.2
Sivaganga 1.1 1.9 2.7
Thanjavur 1.0 1.8 2.9
Theni 1.2 2.1 3.3
Tamil Nadu State Action Plan for Climate Change
34
District Name
Change in maximum temperature in 0C with reference to 1970-2000
2010-2040 2040-2070 2070-2100
Thiruvallur 1.1 1.6 2.8
Thiruvannamalai 1.2 2.0 3.2
Thiruvarur 1.0 1.1 2.3
Thoothukudi 1.0 1.8 2.8
Trichy 1.2 2.0 3.3
Tirunelveli 1.0 1.8 3.0
Tiruppur 1.2 2.2 3.4
Vellore 1.1 1.9 3.2
Villupuram 1.1 2.1 3.4
Virudhunagar 1.1 1.9 3.1
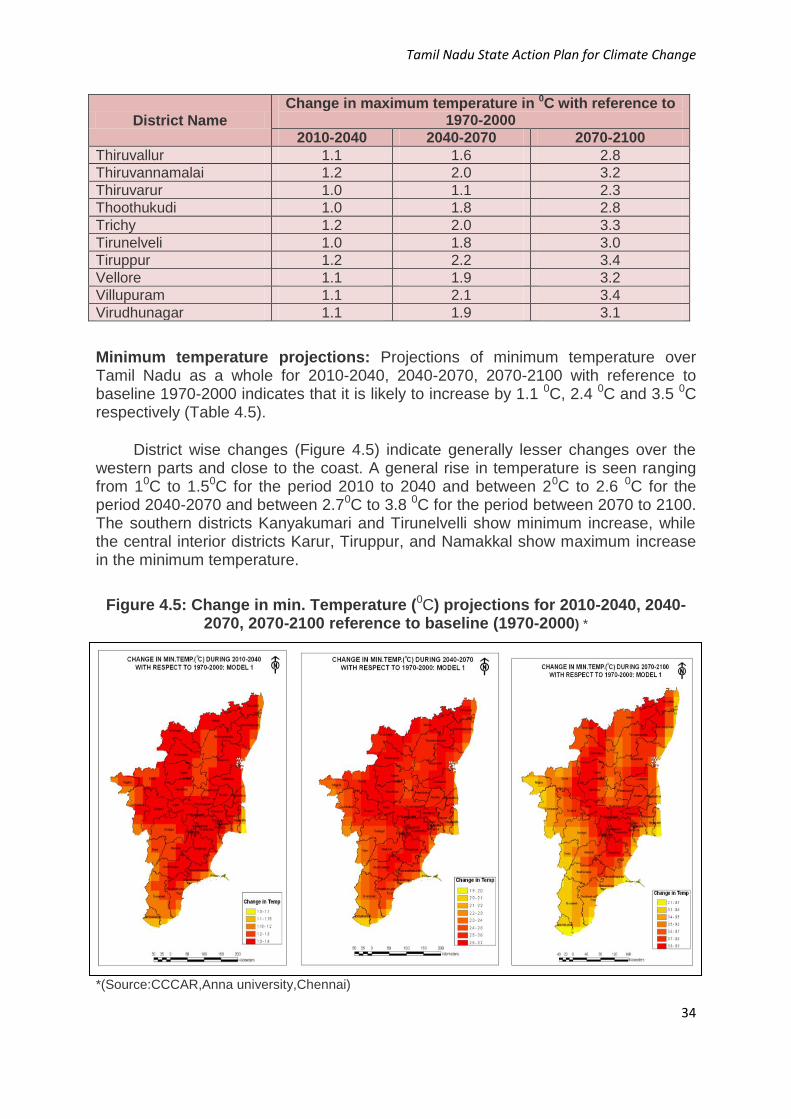
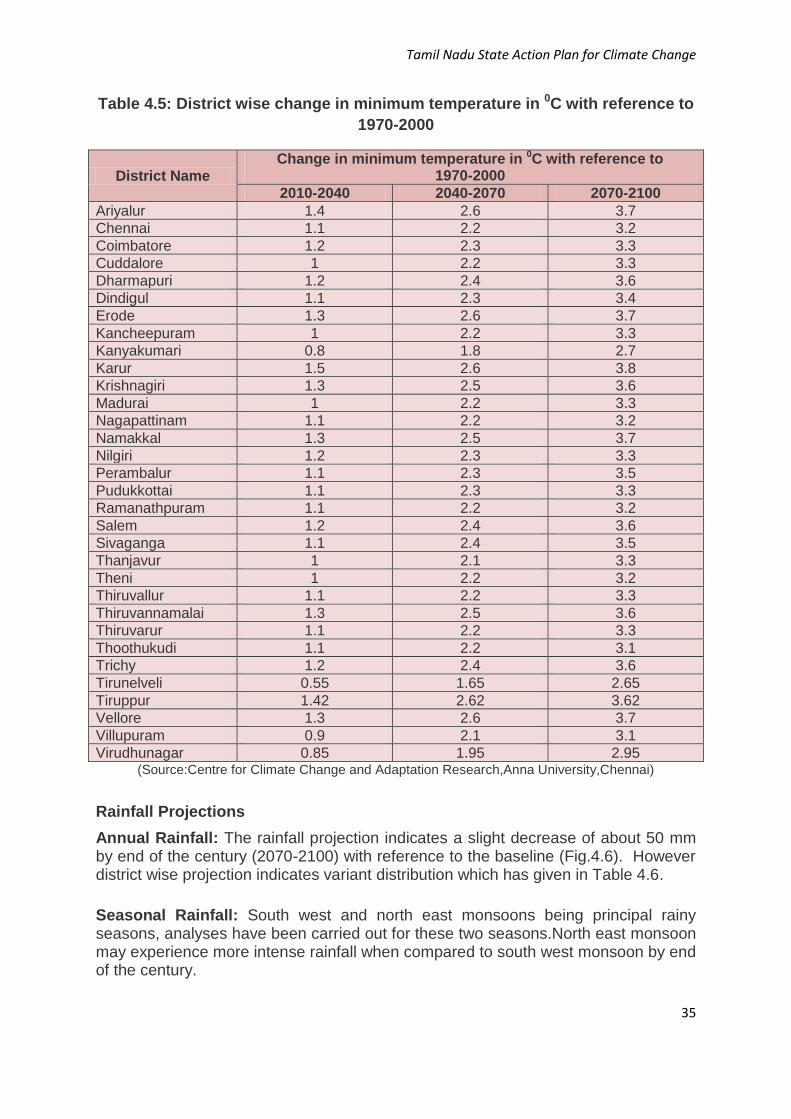
Minimum temperature projections: Projections of minimum temperature over Tamil Nadu as a whole for 2010-2040, 2040-2070, 2070-2100 with reference to baseline 1970-2000 indicates that it is likely to increase by 1.1 0C, 2.4 0C and 3.5 0C respectively (Table 4.5).
District wise changes (Figure 4.5) indicate generally lesser changes over the western parts and close to the coast. A general rise in temperature is seen ranging from 10C to 1.50C for the period 2010 to 2040 and between 20C to 2.6 0C for the period 2040-2070 and between 2.70C to 3.8 0C for the period between 2070 to 2100. The southern districts Kanyakumari and Tirunelvelli show minimum increase, while the central interior districts Karur, Tiruppur, and Namakkal show maximum increase in the minimum temperature.
Figure 4.5: Change in min. Temperature (0C) projections for 2010-2040, 2040-2070, 2070-2100 reference to baseline (1970-2000) *
*(Source:CCCAR,Anna university,Chennai)
Tamil Nadu State Action Plan for Climate Change
35
Table 4.5: District wise change in minimum temperature in 0C with reference to
1970-2000
District Name Change in minimum temperature in 0C with reference to
1970-2000
2010-2040 2040-2070 2070-2100
Ariyalur 1.4 2.6 3.7
Chennai 1.1 2.2 3.2
Coimbatore 1.2 2.3 3.3
Cuddalore 1 2.2 3.3
Dharmapuri 1.2 2.4 3.6
Dindigul 1.1 2.3 3.4
Erode 1.3 2.6 3.7
Kancheepuram 1 2.2 3.3
Kanyakumari 0.8 1.8 2.7
Karur 1.5 2.6 3.8
Krishnagiri 1.3 2.5 3.6
Madurai 1 2.2 3.3
Nagapattinam 1.1 2.2 3.2
Namakkal 1.3 2.5 3.7
Nilgiri 1.2 2.3 3.3
Perambalur 1.1 2.3 3.5
Pudukkottai 1.1 2.3 3.3
Ramanathpuram 1.1 2.2 3.2
Salem 1.2 2.4 3.6
Sivaganga 1.1 2.4 3.5
Thanjavur 1 2.1 3.3
Theni 1 2.2 3.2
Thiruvallur 1.1 2.2 3.3
Thiruvannamalai 1.3 2.5 3.6
Thiruvarur 1.1 2.2 3.3
Thoothukudi 1.1 2.2 3.1
Trichy 1.2 2.4 3.6
Tirunelveli 0.55 1.65 2.65
Tiruppur 1.42 2.62 3.62
Vellore 1.3 2.6 3.7
Villupuram 0.9 2.1 3.1
Virudhunagar 0.85 1.95 2.95 (Source:Centre for Climate Change and Adaptation Research,Anna University,Chennai)
Rainfall Projections
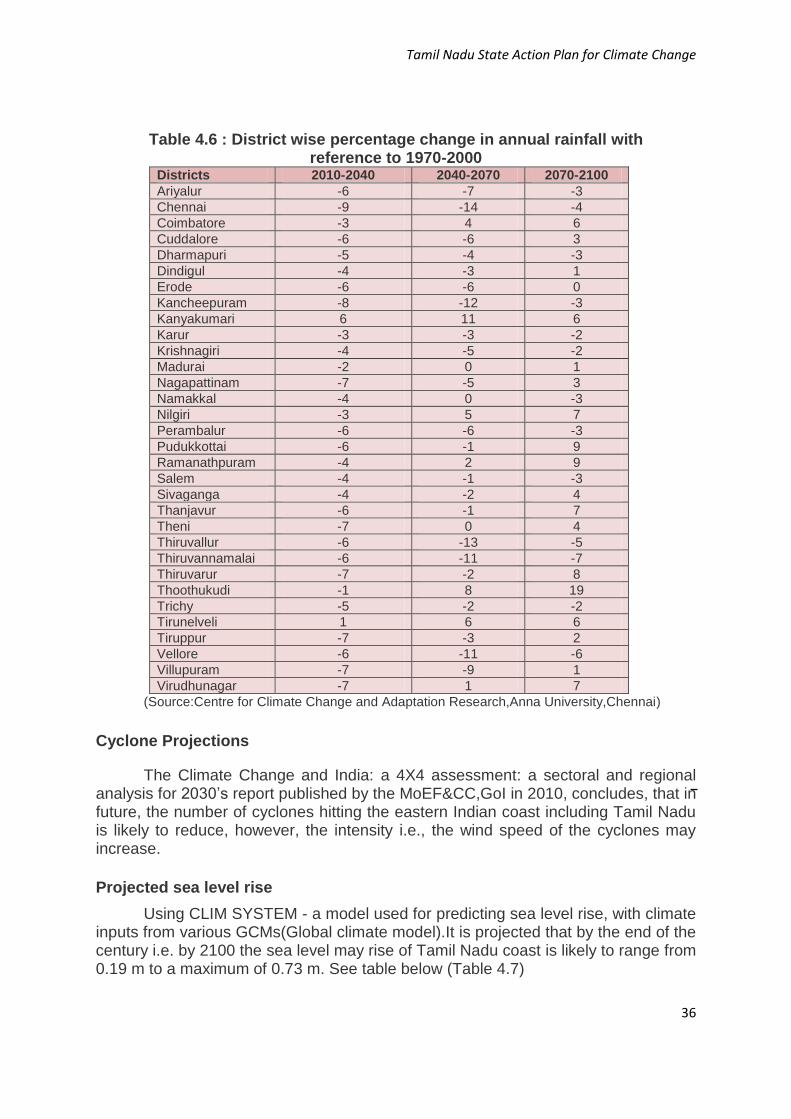
Annual Rainfall: The rainfall projection indicates a slight decrease of about 50 mm by end of the century (2070-2100) with reference to the baseline (Fig.4.6). However district wise projection indicates variant distribution which has given in Table 4.6.
Seasonal Rainfall: South west and north east monsoons being principal rainy seasons, analyses have been carried out for these two seasons.North east monsoon may experience more intense rainfall when compared to south west monsoon by end of the century.
Tamil Nadu State Action Plan for Climate Change
36
Table 4.6 : District wise percentage change in annual rainfall with reference to 1970-2000
Districts 2010-2040 2040-2070 2070-2100
Ariyalur -6 -7 -3
Chennai -9 -14 -4
Coimbatore -3 4 6
Cuddalore -6 -6 3
Dharmapuri -5 -4 -3
Dindigul -4 -3 1
Erode -6 -6 0
Kancheepuram -8 -12 -3
Kanyakumari 6 11 6
Karur -3 -3 -2
Krishnagiri -4 -5 -2
Madurai -2 0 1
Nagapattinam -7 -5 3
Namakkal -4 0 -3
Nilgiri -3 5 7
Perambalur -6 -6 -3
Pudukkottai -6 -1 9
Ramanathpuram -4 2 9
Salem -4 -1 -3
Sivaganga -4 -2 4
Thanjavur -6 -1 7
Theni -7 0 4
Thiruvallur -6 -13 -5
Thiruvannamalai -6 -11 -7
Thiruvarur -7 -2 8
Thoothukudi -1 8 19
Trichy -5 -2 -2
Tirunelveli 1 6 6
Tiruppur -7 -3 2
Vellore -6 -11 -6
Villupuram -7 -9 1
Virudhunagar -7 1 7
(Source:Centre for Climate Change and Adaptation Research,Anna University,Chennai)
Cyclone Projections
The Climate Change and India: a 4X4 assessment: a sectoral and regional analysis for 2030’s report published by the MoEF&CC,GoI in 2010, concludes, that in future, the number of cyclones hitting the eastern Indian coast including Tamil Nadu is likely to reduce, however, the intensity i.e., the wind speed of the cyclones may increase.
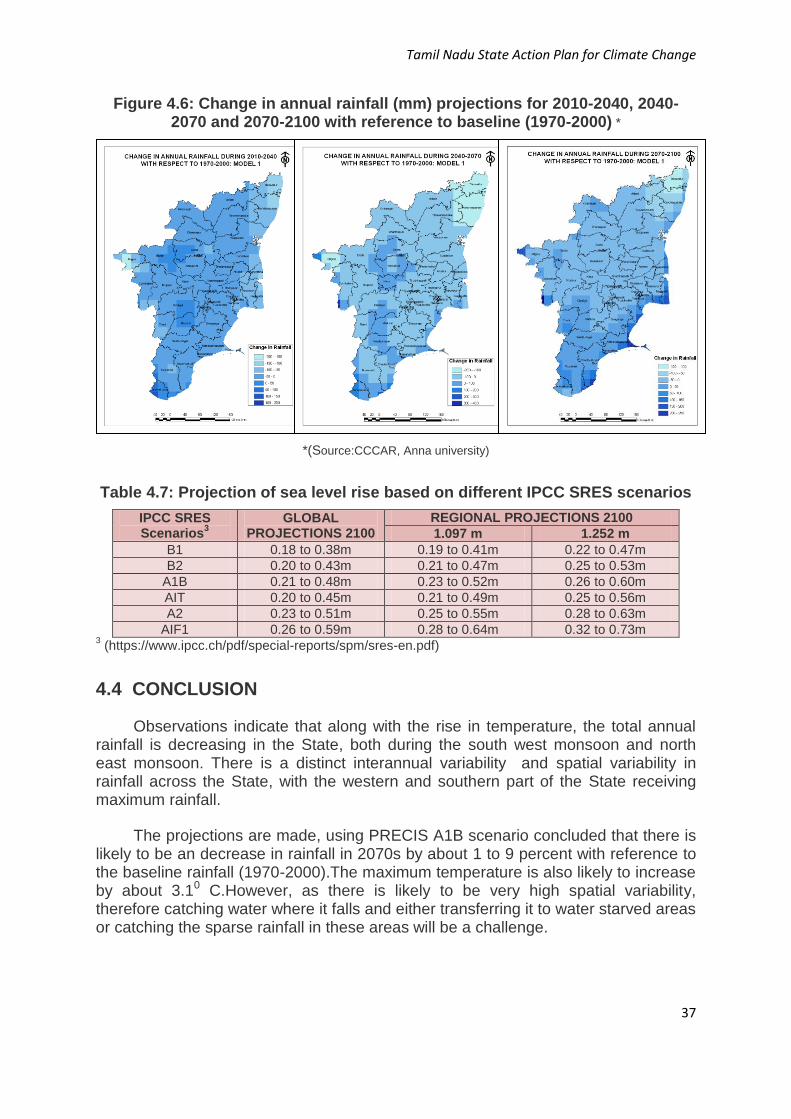
Projected sea level rise
Using CLIM SYSTEM - a model used for predicting sea level rise, with climate inputs from various GCMs(Global climate model).It is projected that by the end of the century i.e. by 2100 the sea level may rise of Tamil Nadu coast is likely to range from 0.19 m to a maximum of 0.73 m. See table below (Table 4.7)
Tamil Nadu State Action Plan for Climate Change
37
Figure 4.6: Change in annual rainfall (mm) projections for 2010-2040, 2040-2070 and 2070-2100 with reference to baseline (1970-2000) *
*(Source:CCCAR, Anna university)
Table 4.7: Projection of sea level rise based on different IPCC SRES scenarios
IPCC SRES Scenarios
3 GLOBAL
PROJECTIONS 2100
REGIONAL PROJECTIONS 2100
1.097 m 1.252 m
B1 0.18 to 0.38m 0.19 to 0.41m 0.22 to 0.47m
B2 0.20 to 0.43m 0.21 to 0.47m 0.25 to 0.53m
A1B 0.21 to 0.48m 0.23 to 0.52m 0.26 to 0.60m
AIT 0.20 to 0.45m 0.21 to 0.49m 0.25 to 0.56m
A2 0.23 to 0.51m 0.25 to 0.55m 0.28 to 0.63m
AIF1 0.26 to 0.59m 0.28 to 0.64m 0.32 to 0.73m 3 (https://www.ipcc.ch/pdf/special-reports/spm/sres-en.pdf)
4.4 CONCLUSION
Observations indicate that along with the rise in temperature, the total annual rainfall is decreasing in the State, both during the south west monsoon and north east monsoon. There is a distinct interannual variability and spatial variability in rainfall across the State, with the western and southern part of the State receiving maximum rainfall.
The projections are made, using PRECIS A1B scenario concluded that there is likely to be an decrease in rainfall in 2070s by about 1 to 9 percent with reference to the baseline rainfall (1970-2000).The maximum temperature is also likely to increase by about 3.10 C.However, as there is likely to be very high spatial variability, therefore catching water where it falls and either transferring it to water starved areas or catching the sparse rainfall in these areas will be a challenge.