projections with coupled climate gcms
TRANSCRIPT

Projections with CoupledClimate GCMs
Peter LemkeAlfred Wegener Institute
Helmholtz Center for Polar and Marine ResearchBremerhaven
Institute for Environmental PhysicsUniversity of Bremen

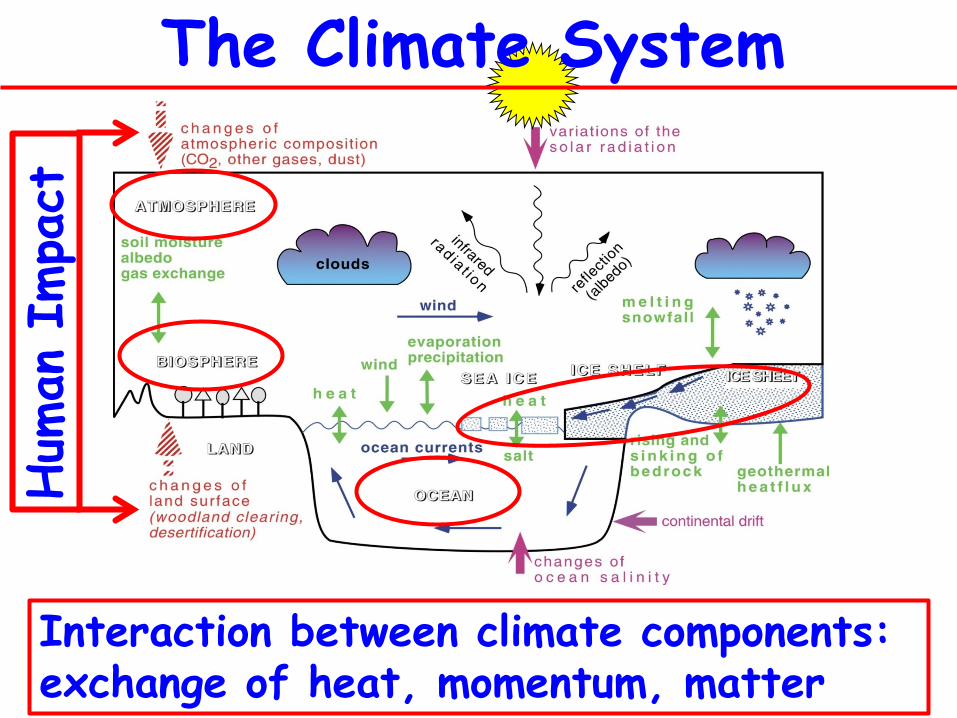
The Climate SystemHum
an I
mpa
ct
Interaction between climate components: exchange of heat, momentum, matter

ATMOSPHERE AND OCEAN MODELS
u⋅−∇=DtDρ
ρ1
1. Mass balance for water/air:
2. Mass balance for salt, water vapour
3. Energy balance
4. Momentum balance: Fguu++∇−×Ω−= p
DtD
ρ12
Basic variables:Temperature TSalinity, Humidity S, qPressure pVelocity u, v, w

Atmosphere Atmosphere Atmosphere Atmosphere Atmosphere Atmosphere
Land surfaceLand surfaceLand surfaceLand surfaceLand surface
Ocean & sea-ice Ocean & sea-ice Ocean & sea-ice Ocean & sea-ice
Sulphateaerosol
Sulphateaerosol
Sulphateaerosol
Non-sulphateaerosol
Non-sulphateaerosol
Carbon cycle Carbon cycle
Atmosphericchemistry
Ocean & sea-icemodel
Sulphurcycle model
Non-sulphateaerosols
Carboncycle model
Land carboncycle model
Ocean carboncycle model
Atmosphericchemistry
Atmosphericchemistry
Off-linemodeldevelopment
1975 1985 1992 1997
HADLEY CENTRE EARTH SYSTEM MODEL
The
Met
.Off
ice
Had
ley
Cen
tre
2001 200?
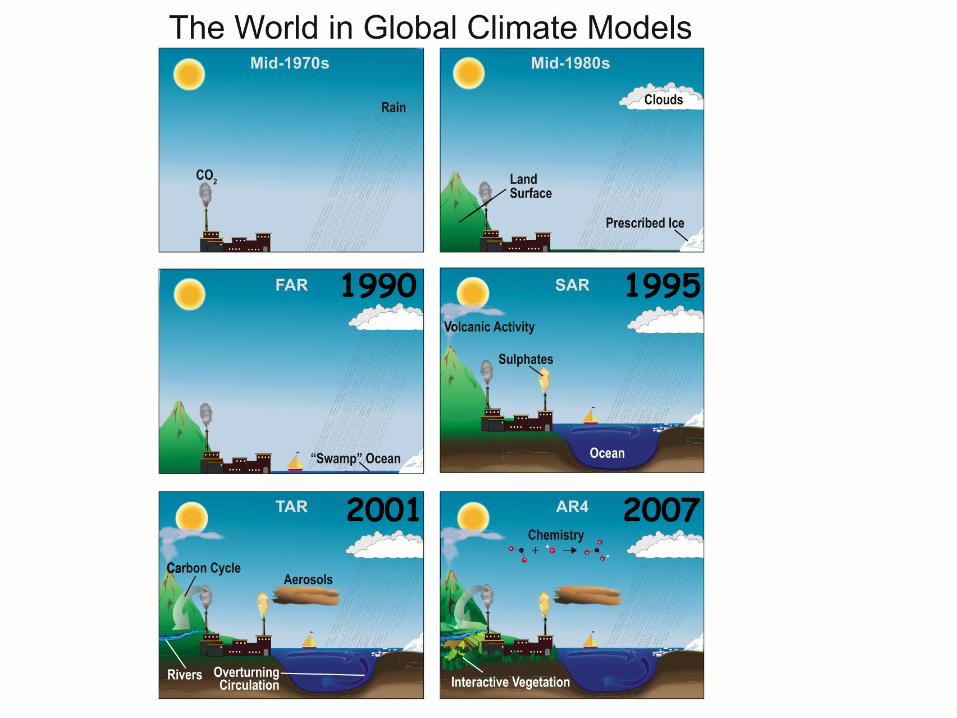
Figure 1.2
2007
19951990
2001

1990
1995
2001
2007

Sea ice model structure
Shth
+⋅−∇=∂∂ )(umass balance:
momentum balance: σττuku⋅∇+∇+×−= −+ Hmgmf
DtDm wa

Attribution Process
• other GHGs• aerosols• volcanic• solar• natural internal
Model
Fig SPM-3
SPM-1

Attribution
greenhouse gas emissions
no greenhouse gas emissions
Observed warming extremely unlikelynatural variability alone
GHG’s very likelycaused most of the observed warming since mid-century

Scenarios and projections


CO2 Emissions (Giga-Tonnes Carbon)
0
5
10
15
20
25
30
A2 A1B B1
200020202040206020802100
2
2.5
3
Projected CO2 Concentrations
ppmv
Scenarios of economic and technological development

Box TS.6 for further details
RCP8.5
RCP6.0
RCP4.5
RCP2.6
Representative Concentration Pathways (RCP)

RCP: CO2 ConcentrationsScenarios of economic and technological development

Global surface temperature change for the end of the 21st century is likely to exceed 1.5°C
relative to 1850 for all scenarios
(IPC
C 2
013,
Fig
. SPM
.7a)

Climate Projections
Global Surface Temperature
Arctic SeaIce Extentin Summer

Scenarios of future sea ice development
ACIA Report Walsh & Jakobsson, 2004
IPCC, B2
winter summer
Grand Challenge: Polar processes in
summer

Projections
Fig. SPM.7

Climate Projections

Projected patterns of precipitation changes
winter summer
wet winter dry summer

Figure SPM.8dMaps of CMIP5 multi-model mean results
All Figures © IPCC 2013

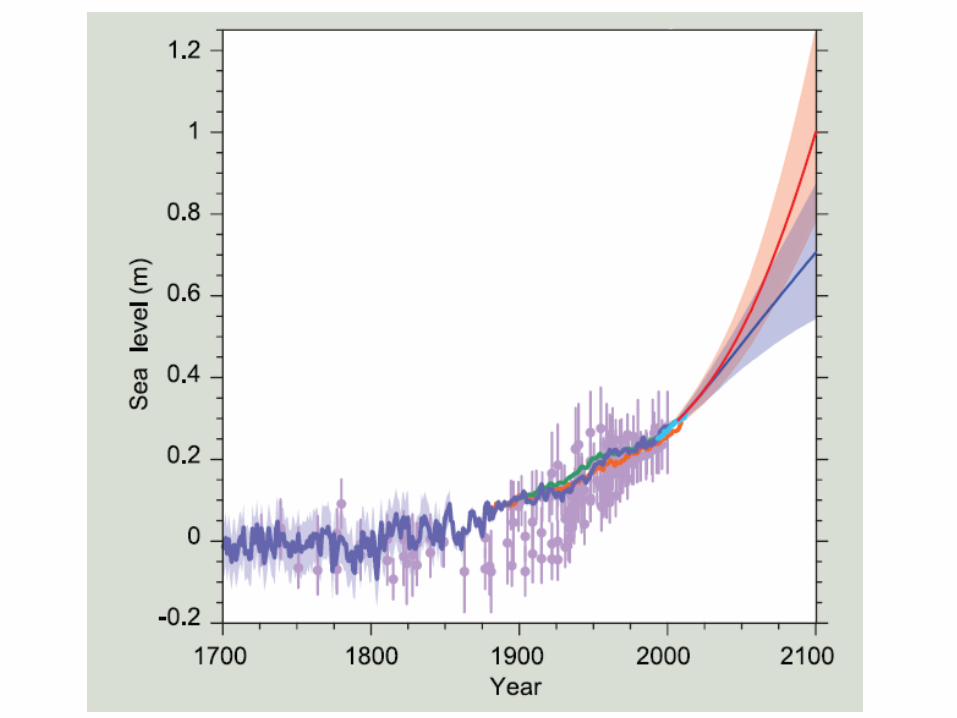
Global mean sea level will continue to rise during the 21st century
(IPC
C 2
013,
Fig
. SPM
.9)
Uncertainties in projections

Future climate change is a sum of:
• An externally forced response, due to changes in radiative forcingarising from human activity, variations in the sun and major volcaniceruptions
• Internal variability, e.g. the El Niño-Southern Oscillation (ENSO) and other patterns, and year-to-year and decade-to-decade fluctuations in winds, precipitation, temperature, …
Internal variability – an important source of climatevariability
The Climate SystemHum
an I
mpa
ct
Interaction between climate components: exchange of heat, momentum, matter

Global Mean Temperatures are rising
GISS Data
ΔT = 0,95°C
140 years ΔT = 1,0°C

Internal variability – an important source of climatevariability
Fig. 1.4

RCP8.5
Hatching: changes are “small” compared with internal variability
Stippling: changes are “large” compared with internal variability, and at least 90% of models agree on sign of change
How large is the projected change compared tointernal variability?

AR4 and AR5 projections are very similar whenaccounting for scenario differences
Fig. 12.41

Long term climate change andcumulative carbon
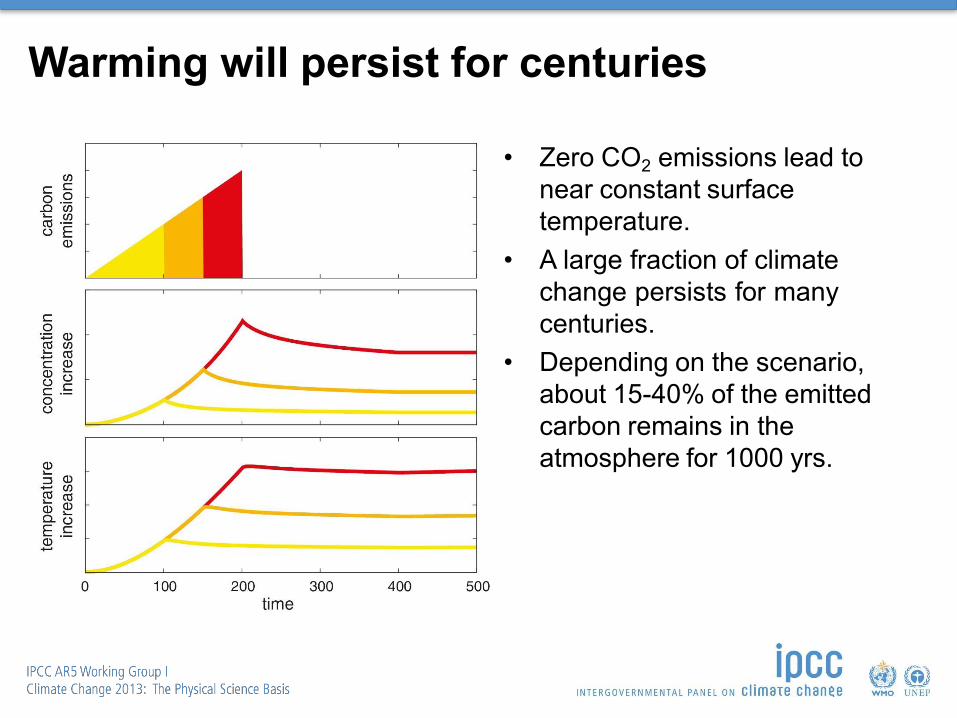
Warming will persist for centuries
• Zero CO2 emissions lead to near constant surface temperature.
• A large fraction of climatechange persists for manycenturies.
• Depending on the scenario, about 15-40% of the emitted carbon remains in the atmosphere for 1000 yrs.

Cumulative carbon determines warming
• Peak warming is approximately proportional to cumulative (total) emissions.
• Transient climate response to cumulative carbon emissions TCRE = Warming per 1000 PgC

Cumulative carbon determines warming
• Warming is largely independent ofthe emission profile. Only the totalmatters.
• More emissions early imply stronger reductions later.
• Any temperature target implies a maximum in cumulative CO2emissions. This is purely a physical and carbon cycle problem.
• Allocation over time is a economicand policy question.
• Overshooting the budget will overshoot the target.
Fig. 12.46
RCP2.6

Cumulative carbon determines warming
• Evidence from observations, and from simple to complex models for many scenarios.
• Near linear in all models, but the slope is uncertain.
• Any temperature target implies a maximum amount of carbon that can be emitted.
• Due to non CO2, RCP warming islarger than from CO2 only.
1%/yr CO2
RCP8.5
Fig. 12.45

Limiting climate change will require substantial and sustained reductions of greenhouse gas emissions
(IPC
C 2
013,
Fig
. SPM
.10)

Cumulative carbon determines warmingRemaining Budget
(from Jan 2020)
1.5°C Warming:340 (500) Gt CO2
2.0°C Warming:1090 (1420) Gt CO2
Current annualemissions~ 37 Gt CO21.5°C: 9 (14) years2.0°C: 29 (38) years
IPCC SR15 (Fig. 2.3; Table 2.2; 2018)

Summary
• “Continued emissions of greenhouse gases will cause further warming and changes in all components of the climate system. Limiting climate change will require substantial and sustained reductions ofgreenhouse gas emissions.”
• Changes are projected throughout all climate components, in most cases exceeding natural variations by far. Changes in AR5 are similarto those in AR4 for similar scenarios.
• Every ton of CO2 causes about the same amount of warming, nomatter when and where it is emitted.
• To limit warming to likely less than 2oC as in RCP2.6 requires total emissions since preindustrial to be limited to less than about 790PgC. 515 PgC were emitted by 2011.

Foss
il fu
el C
O2
emis
sion
s [Pg
C/y]
Scenarios: IPCC Representative Concentration Pathways
Observation uncertainty band (± 1 standard deviation)
Data: CDIAC (preliminary for 2009, 2010)Figure: Raupach et al (in prep, Dec 2011)
Citation for data: Peters, G.P., Marland, G., Le Quéré, C., Boden, T., Canadell, J.C. and Michael R. Raupach (2011). Rapid growth in CO2 emissions after the 2008-2009 Global Financial Crisis. Nature Climate Change 1 (doi:10.1038/nclimate1332)
2100:ΔT ~ 4°C
CO2 Emissions (Billion Tonnes of Carbon/year)
... are near the worst scenario of the IPCC

Global emissions from fossil fuel and industry: 35.9 ± 1.8 GtCO2 in 2014, 60% over 1990 Projection for 2015: 35.7 ± 1.8 GtCO2, 59% over 1990
Estimates for 2012, 2013, 2014, and 2015 are preliminarySource: CDIAC; Le Quéré et al 2015; Global Carbon Budget 2015
Uncertainty is ±5% for one standard deviation
(IPCC “likely” range)
Emissions from fossil fuel use and industry

Global emissions from fossil fuel and industry: 36.2 ± 2 GtCO2 in 2016, 62% over 1990 Projection for 2017: 36.8 ± 2 GtCO2, 2.0% higher than 2016
Estimates for 2015 and 2016 are preliminary. Growth rate is adjusted for the leap year in 2016.Source: CDIAC; Le Quéré et al 2017; Global Carbon Budget 2017
Emissions from fossil fuel use and industry
Uncertainty is ±5% for one standard deviation
(IPCC “likely” range)
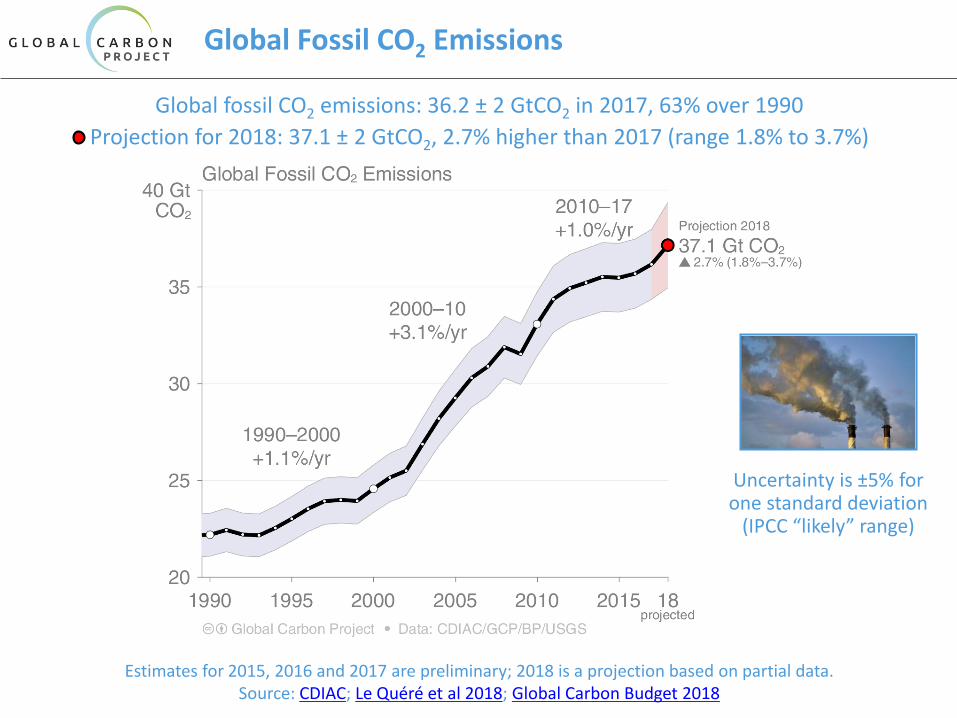
Global fossil CO2 emissions: 36.2 ± 2 GtCO2 in 2017, 63% over 1990 Projection for 2018: 37.1 ± 2 GtCO2, 2.7% higher than 2017 (range 1.8% to 3.7%)
Estimates for 2015, 2016 and 2017 are preliminary; 2018 is a projection based on partial data.Source: CDIAC; Le Quéré et al 2018; Global Carbon Budget 2018
Global Fossil CO2 Emissions
Uncertainty is ±5% for one standard deviation
(IPCC “likely” range)
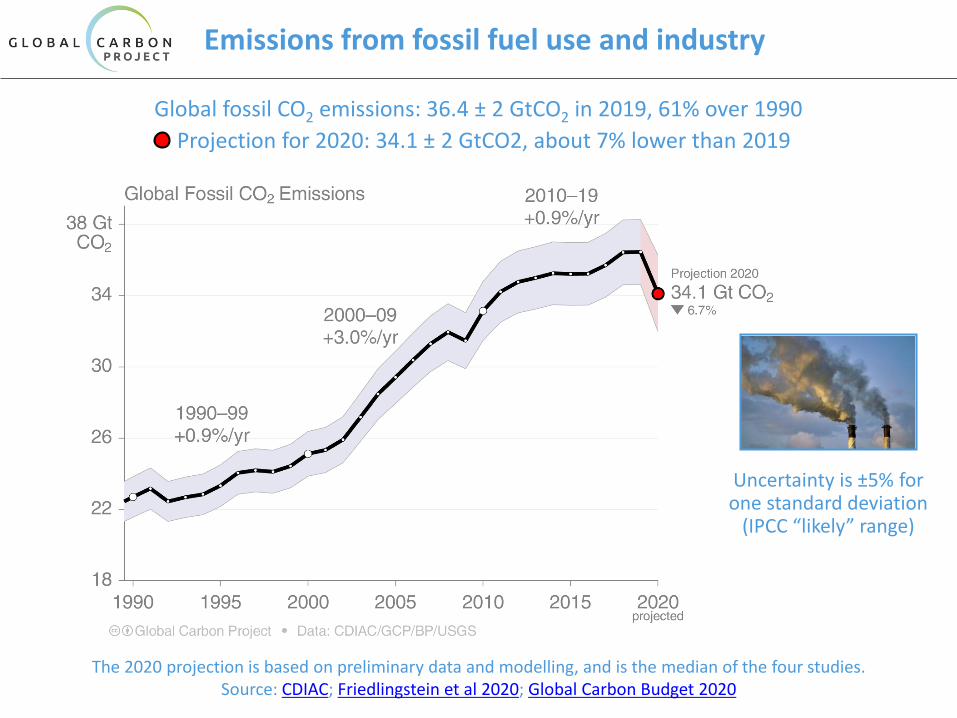
Emissions from fossil fuel use and industry
Global fossil CO2 emissions: 36.4 ± 2 GtCO2 in 2019, 61% over 1990Projection for 2020: 34.1 ± 2 GtCO2, about 7% lower than 2019
Uncertainty is ±5% for one standard deviation
(IPCC “likely” range)
The 2020 projection is based on preliminary data and modelling, and is the median of the four studies.Source: CDIAC; Friedlingstein et al 2020; Global Carbon Budget 2020

Top emitters: Fossil CO2 Emissions
Emissions by country from 2000 to 2019, with the growth rates indicated for the more recent period of 2014 to 2019
Source: CDIAC; Jackson et al 2019; Friedlingstein et al 2020; Global Carbon Budget 2020

Emissions from coal, oil, gas, cement
Share of global fossil CO2 emissions in 2019: coal (39%), oil (33%), gas (21%), cement (4%), flaring (1%, not shown)Projection by fuel type is based on monthly data (GCP analysis)
Source: CDIAC; Friedlingstein et al 2020; Global Carbon Budget 2020

Total global emissions
Land-use change estimates from three bookkeeping models, using fire-based variability from 1997Source: CDIAC; Houghton and Nassikas 2017; Hansis et al 2015; Gasser et al 2020; van der Werf et al. 2017;
Friedlingstein et al 2020; Global Carbon Budget 2020
Total global emissions: 43.0 ± 3.3 GtCO2 in 2019, 56% over 1990Percentage land-use change: 39% in 1960, 14% averaged 2010–2019