ap05 morphology 050311 - jicaopen_jicareport.jica.go.jp/pdf/11788502_01.pdf · jamuna multipurpose...
TRANSCRIPT

The Feasibility Study of
Padma Bridge in
The People's Republic of BANGLADESH
NIPPON KOEI CO., LTD.
in association withCONSTRUCTION PROJECT CONSULTANTS, INC.
FINAL REPORT
MARCH, 2005
JAPAN INTERNATIONAL COOPERATION AGENCY (JICA)
JAMUNA MULTIPURPOSE BRIDGE AUTHORITY (JMBA)
No.
S D
J R
05-017
Volume 5
RIVER STUDIES

THE FEASIBILITY STUDY OF PADMA BRIDGE FINAL REPORT (VOLUME V) MARCH 2005
STRUCTURE OF FINAL REPORT
VOLUME I EXECUTIVE SUMMARY
VOLUME II MAIN REPORT
VOLUME III SOCIO-ECONOMIC AND TRANSPORT STUDIES APPENDIX-1: ECONOMIC FEATURE OF BANGLADESH APPENDIX-2: TRANSPORT STUDIES
VOLUME IV TOPOGRAPHIC SURVEY AND GEOTECHNICAL INVESTIGATION
APPENDIX-3: TOPOGRAPHIC AND BATHYMETRIC SURVEYS APPENDIX-4: GEOTECHNICAL INVESTIGATION
VOLUME V RIVER STUDIES
APPENDIX-5: RIVER AND RIVER MORPHOLOGY APPENDIX-6: HYDROLOGY AND HYDRAULICS APPENDIX-7: RIVER ENGINEERING
VOLUME VI HIGHWAY, BRIDGE AND OTHER ENGINEERING STUDIES
APPENDIX-8: BRIDGE ENGINEERING APPENDIX-9: HIGHWAY ENGINEERING APPENDIX-10: RAILWAY PROVISION
VOLUME VII ENVIRONMENTAL AND SOCIAL/RESETTLEMENT STUDIES
APPENDIX-11: ENVIRONMENTAL STUDIES APPENDIX-12: SOCIAL IMPACT ASSESSMENT AND RESETTLEMENT
FRAMEWORK
VOLUME VIII DRAWINGS OF PRELIMINARY FACILITY DESIGN
VOLUME IX SUPPORTING STUDIES (Provided by electric files. Original copies are kept by JMBA and JICA
Tokyo.)

THE FEASIBILITY STUDY OF PADMA BRIDGE FINAL REPORT (VOLUME V) MARCH 2005
i
The Feasibility Study of Padma Bridge Final Report
(Vol. 4 Topographic Survey and Geotechnical Investigation)
Table of Contents
Appendix-5 River and River Morphology.................................................................A5-1 5.1 River and Basin Features .......................................................................................... A5-1
5.1.1 River and Basin............................................................................................... A5-1
5.1.2 Physiography .................................................................................................. A5-7
5.2 River Morphology and Sediment Study................................................................... A5-11
5.2.1 River Morphology......................................................................................... A5-11
5.2.2 River Channel Conditions ............................................................................. A5-16
5.2.3 Sediment Flow Conditions ............................................................................ A5-21
5.3 Additional River and Morphologic Studies.............................................................. A5-27
5.3.1 Displacement of Left and Right Banks .......................................................... A5-27
5.3.2 Identification of Erosion Resistant Banks ...................................................... A5-28
5.3.3 River Channel ............................................................................................... A5-29
5.3.4 Preliminary Estimate of Maximum Scour Depth............................................ A5-34
5.4 Further Studies on Erodibility of Riverbank ............................................................ A5-37
5.4.1 Historical River Course Shifting.................................................................... A5-37
5.4.2 Rate of Riverbank Change............................................................................. A5-44
5.4.3 Limit of River Course Shifting ...................................................................... A5-47
5.4.4 Geotechnical Structure of Riverbanks............................................................ A5-48
5.5 Estimation of Maximum Scour Depth ..................................................................... A5-50
5.5.1 Methodology................................................................................................. A5-50
5.5.2 Component Scour Depth ............................................................................... A5-56
5.5.3 Design Maximum Scour Depth ..................................................................... A5-59
5.5.4 Comparison with Historical Riverbed Records .............................................. A5-60 Appendix-6 Hydrology and Hydraulics.....................................................................A6-1
6.1 Introduction.............................................................................................................. A6-1
6.2 Hydrological and Hydraulic Features ........................................................................ A6-1
6.2.1 Hydro-meteorological Overview ..................................................................... A6-1
6.2.2 Characteristics of Rainfall ............................................................................... A6-6
6.2.3 Characteristics of Runoff............................................................................... A6-10
6.2.4 Tide .............................................................................................................. A6-17

THE FEASIBILITY STUDY OF PADMA BRIDGE FINAL REPORT (VOLUME V) MARCH 2005
ii
6.2.5 Flood Flow and Inundation Conditions .......................................................... A6-19
6.3 Hydro-meteorological Observations........................................................................ A6-25
6.3.1 Relevant Agencies and Activities................................................................... A6-25
6.3.2 Data Availability for the Study....................................................................... A6-28
6.3.3 Evaluation of Data ........................................................................................ A6-36
6.4 Additional Hydrological and Hydraulic Studies for Two Alternative Sites ............... A6-42
6.4.1 Standard Water Levels................................................................................... A6-42
6.4.2 Hydraulic Design Values ............................................................................... A6-42
6.5 Mathematical Modeling .......................................................................................... A6-44
6.5.1 Outlines ........................................................................................................ A6-44
6.5.2 Quasi-two Dimensional Modeling and Simulations ....................................... A6-45
6.5.3 Two-dimensional Modeling and Simulation: 2003/04 Padma 2-D Core Model ........................................................................................................... A6-50
6.5.4 Two Dimensional Modeling and Simulation: 2003/04 Padma 2-D Long Term Model .................................................................................................. A6-58
6.5.5 Summary of Simulation Results and Impact Assessment................................ A6-65
Appendix-7 River Engineering ..................................................................................A7-1 7.1 Introduction.............................................................................................................. A7-1
7.1.1 Necessity of River Study for Bridge Planning.................................................. A7-1
7.1.2 Tasks of River Study ....................................................................................... A7-1
7.1.3 Approach to Study........................................................................................... A7-2
7.2 Previous Studies and Works ...................................................................................... A7-4
7.2.1 Jamuna Bridge ................................................................................................ A7-4
7.2.2 Paksey Bridge ................................................................................................. A7-8
7.2.3 Pre-feasibility Study of Padma Bridge ........................................................... A7-12
7.2.4 Guidelines for Conventional River Works...................................................... A7-17
7.2.5 Bank Protection and River Training (FAP-21/22)........................................... A7-18
7.2.6 Jamuna-Meghna River Erosion Mitigation Project (JMREMP)...................... A7-19
7.2.7 Expertise Owned by Agencies Concerned...................................................... A7-20
7.3 River Study for Initial Screening............................................................................. A7-21
7.3.1 Method of Screening ..................................................................................... A7-21
7.3.2 General River Conditions .............................................................................. A7-21
7.3.3 Stability of River ........................................................................................... A7-22
7.3.4 Expected River Works ................................................................................... A7-23
7.3.5 Evaluation from River Perspective ................................................................ A7-23
7.4 River Studies for Selection of Optimum Site ........................................................... A7-23
7.4.1 Principles for Planning .................................................................................. A7-23

THE FEASIBILITY STUDY OF PADMA BRIDGE FINAL REPORT (VOLUME V) MARCH 2005
iii
7.4.2 Preliminary Design of River Works ............................................................... A7-25
7.4.3 Preliminary Design of River Works for PG-site ............................................. A7-28
7.4.4 Preliminary Design of River Works for MJ-site ............................................. A7-30
7.5 Establishment of Design Principles for Optimum Site ............................................. A7-34
7.5.1 Flow of Preliminary Design........................................................................... A7-34
7.5.2 Strategy for Planning River Facilities ............................................................ A7-35
7.5.3 Basis for Design of River Facilities ............................................................... A7-37
7.6 Preliminary Design of River Facilities .................................................................... A7-41
7.6.1 Layout Plan and Applicable Works ................................................................ A7-41
7.6.2 Design Considerations................................................................................... A7-51
7.6.3 Design Drawings........................................................................................... A7-61
7.7 Construction of River Works................................................................................... A7-71
7.7.1 Execution Method of River Works................................................................. A7-71
7.7.2 Preliminary Construction Schedule................................................................ A7-72
7.7.3 Maintenance of River Facilities ..................................................................... A7-75
7.8 Further Studies in Succeeding Stage........................................................................ A7-78

THE FEASIBILITY STUDY OF PADMA BRIDGE FINAL REPORT (VOLUME V) MARCH 2005
iv
List of Table
Appendix 5 Table 5.2.1 Average Highest and Lowest Water Levels ................................................. A5-17 Table 5.2.2 Average Bank Levels of the Padma River ................................................... A5-17 Table 5.3.1 Historical Changes of CS-P7...................................................................... A5-30 Table 5.3.2 Historical Changes of CS-P2.1 ................................................................... A5-31 Table 5.3.3 Hydraulic Channel Characteristics (CS-P7) ................................................ A5-32 Table 5.3.4 Hydraulic Channel Characteristics (CS-P2.1) ............................................. A5-32 Table 5.3.5 Preliminarily Estimated Maximum Scoured Depth ..................................... A5-36 Table 5.4.1 Old maps and Satellite Images Collected .................................................... A5-37 Table 5.5.1 Estimation of Maximum Scour Depth......................................................... A5-58 Table 5.5.2 Lowest Riverbed Surveyed Periodically by BWDB .................................... A5-60
Appendix 6 Table 6.2.1 Annual Maximum Daily Rainfall ................................................................. A6-9 Table 6.2.2 Probable Daily Rainfall ................................................................................ A6-9 Table 6.2.3 Number of Rainy Days............................................................................... A6-10 Table 6.2.4 Summary of Water Levels .......................................................................... A6-10 Table 6.2.5 Summary of Daily Mean Discharges .......................................................... A6-11 Table 6.2.6 Annual Highest Water Levels ..................................................................... A6-13 Table 6.2.7 Probable Water Levels................................................................................ A6-14 Table 6.2.8 Comparison of Annual Maximum Series of Daily Mean Discharges ........... A6-15 Table 6.2.9 Estimated Probable Discharges................................................................... A6-15 Table 6.2.10 Comparison of Probable Water Levels with Previous Studies...................... A6-16 Table 6.2.11 Comparison of Probable Discharges with Previous Studies ......................... A6-16 Table 6.2.12 Probable Water Levels at Alternative Bridge Sites ...................................... A6-17 Table 6.2.13 Probable Discharges at Alternative Bridge Sites.......................................... A6-17 Table 6.2.14 Average Daily Water Level Ranges at BWDB Tidal Water Level
Gauges....................................................................................................... A6-18 Table 6.2.15 Records of Major Flood Events around the Study Area ............................... A6-19 Table 6.2.16 Extent of Open Water Flooding from RADARSAT Images for
Common Area, 1998 .................................................................................. A6-23 Table 6.2.17 Percentages of Open Water Flood by Thana during 1998 Flood .................. A6-24 Table 6.3.1 Surface Observation at 35 Observatories of BMD....................................... A6-25 Table 6.3.2 BWDB Hydro-meteorological Observatories.............................................. A6-26 Table 6.3.3 Flood Action Plan (FAP) ............................................................................ A6-28 Table 6.3.4 Water Level Records Collected................................................................... A6-29 Table 6.3.5 BWDB Standard Cross Sections along the Major Rivers............................. A6-32 Table 6.3.6 Difference of Zero Value of Gauge (FAP24, 1993)...................................... A6-37 Table 6.5.1 Comparison of Extreme Value Analysis and Simulation.............................. A6-47 Table 6.5.2 Simulated Water Levels and Discharges ..................................................... A6-48 Table 6.5.3 Comparison of Maximum Flooding Extent by Depth.................................. A6-49 Table 6.5.4 Flooding Duration near Proposed Approach Road (Right Bank) ................. A6-50 Table 6.5.5 Water Level of Local Channel at Crossing of Proposed Approach
Road on Right Bank................................................................................... A6-50 Table 6.5.6 Comparison of Extreme Value Analysis and Simulation.............................. A6-51 Table 6.5.7 Summary of Simulations for Without/With Project Conditions ................... A6-54

THE FEASIBILITY STUDY OF PADMA BRIDGE FINAL REPORT (VOLUME V) MARCH 2005
v
Appendix 7 Table 7.2.1 List of Studies/Projects for Flood Action Plan (FAP) .................................. A7-18 Table 7.3.1 Evaluation of Crossing Locations from River Perspective........................... A7-23 Table 7.4.1 Major Bridge Works in Bangladesh ............................................................ A7-26 Table 7.6.1 Comparison of Revetment and Groynes...................................................... A7-44 Table 7.6.2 Alternative Schemes for Left Bank Protection ............................................ A7-45 Table 7.6.3 Types of Proposed Revetment Works.......................................................... A7-49 Table 7.6.4 Proposed Revetment Works for Respective Work Sites ............................... A7-50 Table 7.6.5 Design Crest Elevation of Embankment ..................................................... A7-52 Table 7.6.6 Alternative Construction Methods for Right Bank ...................................... A7-59

THE FEASIBILITY STUDY OF PADMA BRIDGE FINAL REPORT (VOLUME V) MARCH 2005
vi
List of Figure
Appendix 5 Figure 5.1.1 Location of Bangladesh................................................................................... A5-1 Figure 5.1.2 Ganges-Jamuna-Meghna River System .......................................................... A5-3 Figure 5.1.3 Overall Longitudinal Profiles of Ganges and Jamuna Rivers ......................... A5-3 Figure 5.1.4 Main Rivers in Bangladesh ............................................................................. A5-5 Figure 5.1.5 General Contour Map of Bangladesh.............................................................. A5-7 Figure 5.1.6 Physiographic Structure of Bengal Basin........................................................ A5-8 Figure 5.1.7 Landform of Bangladesh ................................................................................. A5-9 Figure 5.1.8 Development of Bengal Lowland.................................................................. A5-10 Figure 5.2.1 Historical River Shifting ................................................................................A5-11 Figure 5.2.2 Landform Patterns on Satellite Image (Jan. 2003) ........................................ A5-12 Figure 5.2.3 Landsat Images of Padma River (1973-2003)............................................... A5-14 Figure 5.2.4 Change in Bank-lines .................................................................................... A5-14 Figure 5.2.5 Changes in Riverbank Locations................................................................... A5-15 Figure 5.2.6 Longitudinal Profiles of Major Rivers .......................................................... A5-16 Figure 5.2.7 Superimposed River Sections at Sections P7 and P2.1 ................................. A5-18 Figure 5.2.8 Changes in Sectional Pattern of Section P7 (1/3).......................................... A5-19 Figure 5.2.8 Changes in Sectional Pattern of Section P7 (2/3).......................................... A5-19 Figure 5.2.8 Changes in Sectional Pattern of Section P7 (3/3).......................................... A5-19 Figure 5.2.9 Changes in Sectional Pattern of Section P2.1 (1/4)....................................... A5-20 Figure 5.2.9 Changes in Sectional Pattern of Section P2.1 (2/4)....................................... A5-20 Figure 5.2.9 Changes in Sectional Pattern of Section P2.1 (3/4)....................................... A5-20 Figure 5.2.9 Changes in Sectional Pattern of Section P2.1 (4/4)....................................... A5-21 Figure 5.2.10 Changes in Lowest Riverbed at Baruria........................................................ A5-22 Figure 5.2.11 Water Level and Lowest Riverbed at Baruria ............................................... A5-23 Figure 5.2.12 Change in Lowest Riverbed at Mawa ........................................................... A5-23 Figure 5.2.13 Water Level and Lowest Riverbed at Mawa ................................................. A5-24 Figure 5.2.14 Water Level and Channel Roughness............................................................ A5-25 Figure 5.2.15 Relationship between τ⋅ and φ at Baruria ...............................................A5-26 Figure 5.2.16 τ⋅ - φ Relationship at Baruria (H < +5.5 m,PWD) ....................................A5-26 Figure 5.2.17 τ⋅ - φ Relationship at Baruria (H > +5.5 m,PWD) ....................................A5-26 Figure 5.3.1 Displacement of Riverbanks along Padma River .......................................... A5-28 Figure 5.3.2 Distribution of Erodibility Levels of Riverbanks.......................................... A5-29 Figure 5.3.3 Longitudinal Profile of Meghna-Padma-Ganges River: 1998/99.................. A5-30 Figure 5.3.4 Cross Sectional Survey across PG-site.......................................................... A5-33 Figure 5.3.5 Cross Sectional Survey across MJ-site.......................................................... A5-33 Figure 5.3.6 Historical Lowest Riverbed at CS-P7 ........................................................... A5-35 Figure 5.3.7 Historical Lowest Riverbed at CS-P2.1......................................................... A5-35 Figure 5.4.1 Long-Term River Course Shifting................................................................. A5-38 Figure 5.4.2 Recent River Course Shifting (1/4) ............................................................... A5-40 Figure 5.4.2 Recent River Course Shifting (2/4) ............................................................... A5-41 Figure 5.4.2 Recent River Course Shifting (3/4) ............................................................... A5-42 Figure 5.4.2 Recent River Course Shifting (4/4) ............................................................... A5-43 Figure 5.4.3 Periodical Survey Sections by BWDB near Crossing Location.................... A5-44 Figure 5.4.4 Average Erosion Rate of Left Bank............................................................... A5-45 Figure 5.4.5 Yearly Changes of Left Bank ........................................................................ A5-45 Figure 5.4.6 Rate of Right Bank Changes ......................................................................... A5-46 Figure 5.4.7 Yearly Changes of Right Bank ...................................................................... A5-46 Figure 5.4.8 Limit of River Course Shifting...................................................................... A5-47 Figure 5.4.9 Geotechnical Conditions of Riverbanks........................................................ A5-49

THE FEASIBILITY STUDY OF PADMA BRIDGE FINAL REPORT (VOLUME V) MARCH 2005
vii
Figure 5.5.1 Empirical Relation Showing Influence of Pile Group.................................. A5-55 Figure 5.5.2 Historical River-Section Surveyed by BWDB............................................. A5-61 Figure 5.5.3 Historical Lowest Riverbed Surveyed by BWDB........................................ A5-62 Figure 5.5.4 Lowest Riverbeds by Periodical Survey and Discharge Measurement ......... A5-64 Figure 5.5.5 Seasonal Changes of River Sections ........................................................... A5-65
Appendix 6 Figure 6.2.1 Rainfall and Temperature in Bangladesh....................................................... A6-3 Figure 6.2.2 Flow Regimes of the Major Rivers ............................................................... A6-4 Figure 6.2.3 Flood-affected Areas in Bangladesh by Type of Flood .................................. A6-5 Figure 6.2.4 Padma River and Neighboring Area (Study Area) ......................................... A6-6 Figure 6.2.5 Monthly Rainfall and Temperature around the Study Area ............................ A6-7 Figure 6.2.6 Rainfall Intensity, Duration, Frequency Curves............................................. A6-8 Figure 6.2.7 Water Level Frequency Curves................................................................... A6-11 Figure 6.2.8 Water Level Duration Curves ..................................................................... A6-12 Figure 6.2.9 Locations of Gauges for Probability Analysis ............................................. A6-12 Figure 6.2.10 Water Level Variations at Daulatkhan (1995/96) ......................................... A6-18 Figure 6.2.11 Relationships between Daily Mean Water Levels and Daily Water
Level Ranges ............................................................................................. A6-19 Figure 6.2.12 Water Level Hydrographs during 1987, 1988, and 1998 Flood Events
(Aricha and Goalundo Transit) ................................................................... A6-20 Figure 6.2.13 Water Level Hydrographs during 1987, 1988, and 1998 Flood Events
(Bhagyakul and Chandpur)......................................................................... A6-21 Figure 6.2.14 Classified Flood Map from RADARSAT Image of 10th September
1998........................................................................................................... A6-23 Figure 6.2.15 Neighboring Districts (Zilas) along the Padma River .................................. A6-24 Figure 6.3.1 Locations of BMD Surface Observatories and Radars................................. A6-25 Figure 6.3.2 Locations of Selected BMD Surface Observatories and BWDB
Hydrological Stations for Data Collection................................................... A6-29 Figure 6.3.3 Water Level and Discharge Records Collected............................................ A6-31 Figure 6.3.4 Locations of BWDB Standard Cross Sections along the Major Rivers
(Jamuna River)........................................................................................... A6-33 Figure 6.3.5 Locations of BWDB Standard Cross Sections along the Major Rivers
(Ganges River and Padma River)................................................................ A6-34 Figure 6.3.6 Locations of BWDB Standard Cross Sections along the Major Rivers
(Meghna River).......................................................................................... A6-35 Figure 6.3.7 Examples of Discharge Measurement Plots and Rating Curves ................... A6-39 Figure 6.3.8 Examples of River Cross Section Changes (P2) .......................................... A6-41 Figure 6.4.1 Standard Water Levels at Baruria Transit and Mawa ................................... A6-42 Figure 6.5.1 Extent of Quasi-two Dimensional Model .................................................... A6-46 Figure 6.5.2 River Network and Boundaries of Quasi-two Dimensional Model .............. A6-47 Figure 6.5.3 Crossings of Proposed Approach Road on Right Bank.............................. A6-49 Figure 6.5.4 Extent of 2003/04 Padma 2-D Core Model ................................................. A6-51 Figure 6.5.5 Riverbank Settings for Simulation .............................................................. A6-53 Figure 6.5.6 Comparison of Highest Water Levels (Return Period 100-year) .................. A6-54 Figure 6.5.7 Comparison of Highest Water Levels (Return Period 25-year) .................... A6-55 Figure 6.5.8 Comparison of Flow Velocities at Peak of Discharge (Return Period
100-year) ................................................................................................... A6-55 Figure 6.5.9 Comparison of Flow Velocities at Peak of Discharge (Return Period
25-year) ..................................................................................................... A6-55 Figure 6.5.10 Comparison of Lowest Riverbed Levels (Return Period 100-year).............. A6-56 Figure 6.5.11 Comparison of Lowest Riverbed Levels (Return Period 25-year)................ A6-56 Figure 6.5.12 Comparison of Simulated Riverbed Levels near Bridge Site (Return
THE FEASIBILITY STUDY OF PADMA BRIDGE FINAL REPORT (VOLUME V) MARCH 2005
viii
Period 100-year)......................................................................................... A6-57 Figure 6.5.13 Comparison of Simulated Riverbed Levels near Bridge Site (Return
Period 25-year) .......................................................................................... A6-57 Figure 6.5.14 Comparison of Simulated Riverbank Erosion (Return Period
100-year) ................................................................................................... A6-58 Figure 6.5.15 Comparison of Simulated Riverbank Erosion (Return Period
100-year) ................................................................................................... A6-58 Figure 6.5.16 Extent of 2003/04 Padma 2-D Long-term Model ........................................ A6-59 Figure 6.5.17 Riverbed Levels - ‘Present (2003/04), After 5 years, and After 10
years .......................................................................................................... A6-61 Figure 6.5.18 Comparison of Riverbed Changes - After 5 years and After 10 years .......... A6-62 Figure 6.5.19 Classifications of riverbank and Distance from Proposed Bridge Site ......... A6-63 Figure 6.5.20 Comparison of Simulated Riverbank Erosion (After 5-year) ....................... A6-63 Figure 6.5.21 Comparison of Simulated Riverbank Erosion (After 10-year) ..................... A6-63 Figure 6.5.22 Comparison of Simulated Bank Line Changes (After 5-year)...................... A6-64 Figure 6.5.23 Comparison of Simulated Bank Line Changes (After 10-year).................... A6-64
Appendix 7 Figure 7.1.1 River Study for Bridge Plan.......................................................................... A7-2 Figure 7.2.1 (a) Jamuna Bridge: General Layout ................................................................... A7-7 Figure 7.2.1 (b) Jamuna Bridge: Layout of Guide Bunds (1988- and 1995-Designs) .............. A7-7 Figure 7.2.1 (c) Jamuna Bridge: Typical Cross Section of Guide Bund .................................. A7-8 Figure 7.2.1 (d) Jamuna Bridge: Substructure and Foundation ............................................... A7-8 Figure 7.2.2 (a) Paksey Bridge: General Location Map........................................................ A7-10 Figure 7.2.2 (b) Paksey Bridge: Elevation ........................................................................... A7-11 Figure 7.2.2 (c) Paksey Bridge: Cross Section of Guide Bank.............................................. A7-11 Figure 7.2.3 (a) Padma Bridge at Mawa (Pre-F/S): Elevation and Plan ................................ A7-13 Figure 7.2.3 (b) Padma Bridge at Mawa (Pre-F/S): Typical Cross Section of Guide
Bund .......................................................................................................... A7-13 Figure 7.2.3 (c) Padma Bridge at Mawa (Pre-F/S): Substructure and Foundation ................. A7-14 Figure 7.2.4 Layout of Guide Bund: Padma Bridge at Mawa (Pre-F/S)........................... A7-16 Figure 7.2.5 Layout of Guide Bund: Padma Bridge at Goalundo (Pre-F/S) ..................... A7-16 Figure 7.4.1 Typical Section of River Works .................................................................. A7-27 Figure 7.4.2 General Location of PG-site ....................................................................... A7-28 Figure 7.4.3 Alternative Scheme: PG-1 .......................................................................... A7-29 Figure 7.4.4 Alternative Scheme: PG-2 .......................................................................... A7-30 Figure 7.4.5 General Location of MJ-site ....................................................................... A7-31 Figure 7.4.6 Alternative Scheme: MJ-1 .......................................................................... A7-32 Figure 7.4.7 Alternative Scheme: MJ-2 .......................................................................... A7-32 Figure 7.5.1 Flow of Preliminary Design of River Facilities ........................................... A7-34 Figure 7.6.1 Cross-Section of Padma River at Crossing Route........................................ A7-41 Figure 7.6.2 Topography of Mawa-Janjira Site............................................................... A7-42 Figure 7.6.3 General Location of Work Site ................................................................... A7-47 Figure 7.6.4 Guide Bund Section of Jamuna Bridge ....................................................... A7-58 Figure 7.6.5 Alternative Construction Methods for Right Bank Works ........................... A7-60 Figure 7.6.6 General Plan of River Works ...................................................................... A7-62 Figure 7.6.7 Standard Design of Revetment: Type A-1 ................................................... A7-63 Figure 7.6.8 Standard Design of Revetment: Type A-2 ................................................... A7-64 Figure 7.6.9 Standard Design of Revetment: Type B-1 ................................................... A7-65 Figure 7.6.10 Standard Design of Revetment: Type B-2 ................................................... A7-66 Figure 7.6.11 Miscellaneous Details ................................................................................ A7-67 Figure 7.6.12 Plan of River Works: Left Bank of Padma River ......................................... A7-68 Figure 7.6.13 Plan of River Works: Right Bank of Padma River....................................... A7-69 Figure 7.6.14 Plan of River Works: Right Bank of Padma River....................................... A7-70

THE FEASIBILITY STUDY OF PADMA BRIDGE FINAL REPORT (VOLUME V) MARCH 2005
ix
Figure 7.7.1 Construction Plan and Actual Progress of Jamuna Bridge (River Works) ....................................................................................................... A7-73

THE FEASIBILITY STUDY OF PADMA BRIDGE FINAL REPORT (VOLUME V) MARCH 2005
A5-1
Appendix-5 River and River Morphology
5.1 RIVER AND BASIN FEATURES
General features of river and river morphology relevant to the Study Area were reviewed and introduced in this section based on the existing data and reference papers.
5.1.1 River and Basin
(1) Location
The territory of Bangladesh lies in the north eastern part of South Asia, between the latitude 20°34’N and 26°38’E, and the longitude 88°01’E and 92°41’E. As shown in Figure 5.1.1, the territory is bounded by India on the west to northeast, Myanmar on the southeast and the Bay of Bengal on the south. The area of the territory is 147,570 km2 mostly covered with the low-lying flood plain of the Ganges-Brahmaputra delta which is the largest delta in the world. The geographic location of the territory is a key factor to characterize the climate and hydrology of Bangladesh, surrounded by the Indian sub-continent to the west, the Himalayas and Tibetan Plateau to the north, and the Bay of Bengal and Indian Ocean to the south.
China
India
PakistanNepal Bhutan
Myanmer
Thailand
Sri Lanka
Indonesia
Malaysia
Afganistan
Vietnam
Cambodia
Laos
Singapore
Bangladesh
Bay of BengalArabian Sea
Indian Ocean
Figure 5.1.1 Location of Bangladesh
(2) Ganges-Jamuna-Meghna River System
The Ganges, the Jamuna and the Meghna rivers constitute the Ganges-Jamuna-Meghna (GJM) river system. Basin area of the GJM River is 1,740,000 km2 in total. Bangladesh is located in the lowest part of the GJM river basin.
The Ganges River (1,090,000 km2) and the Jamuna River (570,000 km2) meet each other near Goalundo and flow down to south and join the Meghna River (or the Upper Meghna, 77,000 km2) near Chandpur. The river stretch from the Ganges-Jamuna confluence to the Meghna River confluence is called as the Padma River in the present Study, though the Ganges River is also called by the name of Padma River. The main stream of the GJM river
THE FEASIBILITY STUDY OF PADMA BRIDGE FINAL REPORT (VOLUME V) MARCH 2005
A5-2
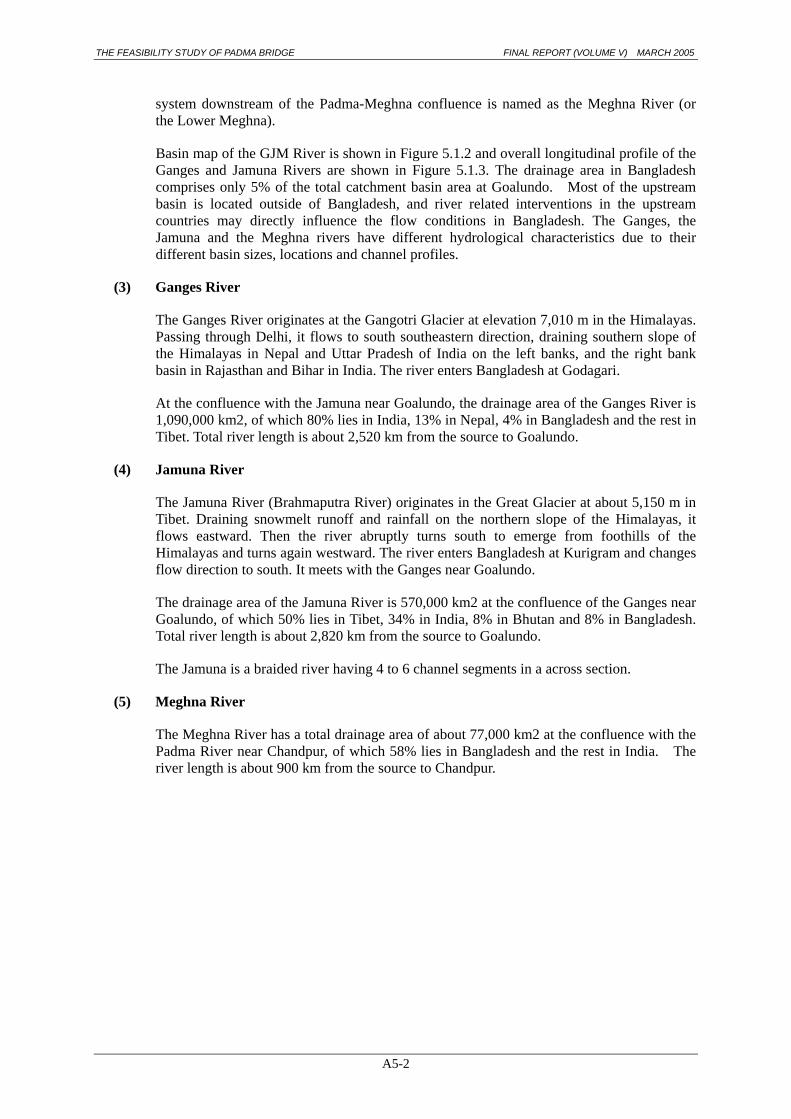
system downstream of the Padma-Meghna confluence is named as the Meghna River (or the Lower Meghna).
Basin map of the GJM River is shown in Figure 5.1.2 and overall longitudinal profile of the Ganges and Jamuna Rivers are shown in Figure 5.1.3. The drainage area in Bangladesh comprises only 5% of the total catchment basin area at Goalundo. Most of the upstream basin is located outside of Bangladesh, and river related interventions in the upstream countries may directly influence the flow conditions in Bangladesh. The Ganges, the Jamuna and the Meghna rivers have different hydrological characteristics due to their different basin sizes, locations and channel profiles.
(3) Ganges River
The Ganges River originates at the Gangotri Glacier at elevation 7,010 m in the Himalayas. Passing through Delhi, it flows to south southeastern direction, draining southern slope of the Himalayas in Nepal and Uttar Pradesh of India on the left banks, and the right bank basin in Rajasthan and Bihar in India. The river enters Bangladesh at Godagari.
At the confluence with the Jamuna near Goalundo, the drainage area of the Ganges River is 1,090,000 km2, of which 80% lies in India, 13% in Nepal, 4% in Bangladesh and the rest in Tibet. Total river length is about 2,520 km from the source to Goalundo.
(4) Jamuna River
The Jamuna River (Brahmaputra River) originates in the Great Glacier at about 5,150 m in Tibet. Draining snowmelt runoff and rainfall on the northern slope of the Himalayas, it flows eastward. Then the river abruptly turns south to emerge from foothills of the Himalayas and turns again westward. The river enters Bangladesh at Kurigram and changes flow direction to south. It meets with the Ganges near Goalundo.
The drainage area of the Jamuna River is 570,000 km2 at the confluence of the Ganges near Goalundo, of which 50% lies in Tibet, 34% in India, 8% in Bhutan and 8% in Bangladesh. Total river length is about 2,820 km from the source to Goalundo.
The Jamuna is a braided river having 4 to 6 channel segments in a across section.
(5) Meghna River
The Meghna River has a total drainage area of about 77,000 km2 at the confluence with the Padma River near Chandpur, of which 58% lies in Bangladesh and the rest in India. The river length is about 900 km from the source to Chandpur.

THE FEASIBILITY STUDY OF PADMA BRIDGE FINAL REPORT (VOLUME V) MARCH 2005
A5-3
Figure 5.1.2 Ganges-Jamuna-Meghna River System
Figure 5.1.3 Overall Longitudinal Profiles of Ganges and Jamuna Rivers
0
500
1000
1500
2000
2500
3000
3500
4000
4500
5000
5500
0 500 1000 1500 2000 2500 3000
Distance from sea (km)
Elevation (m)
Ganges-Jamuna confluence
Indian boader across Ganges R.
Indian boader across Brahmaputra R.
Padma-Meghna confluence
Jamuna-Brahmaptra R.
Ganges R.

THE FEASIBILITY STUDY OF PADMA BRIDGE FINAL REPORT (VOLUME V) MARCH 2005
A5-4
(6) Padma River
The Padma River drains the combined flows of the Ganges and the Jamuna rivers. The river length is about 102 km from the Ganges-Jamuna confluence to the Padma-Meghna confluence. There is no major inflow from the tributaries until it meet with the Meghna River at Chandpur. The Arial Khan River branches at the upstream of Charjanajat Ghat.
River course of the Padma River is straight as a whole extending toward southeast holding some great islands (chars) within the river section.
(7) Other Tributaries and Distributaries
The above major rivers form the trunk river system in Bangladesh and other smaller rivers join or branch from the major rivers. These rivers also join or branch off each other and create the complex river network on the vast extent of the flood plain. Network of the main rivers in Bangladesh is shown in Figure 5.1.4.
The major tributaries are the Tista and Hurasagar rivers both on the right bank of the Jamuna River. The Tista River flows down across the northern border of India and joins the Jamuna near Sundarganj. The Hurasagar River drains mainly the northwestern region in Bangladesh and joins the Jamuna near Bera.
The Old Brahmaputra and Dhaleswari rivers are the major distributaries of the Jamuna River. The Old Brahmaputra branches off from left bank of the Jamuna River near Bahadurabad, flows down to the southeast, and debouches into the Upper Meghna River near Narsingdi. The Old Brahmaputra is known as the past main course of the Brahmaputra that shifted its course to the present Jamuna River around 200 years ago. The Dhaleswari River branching off from left bank of the Jamuna River near Tangail flows down almost in parallel with the Padma River until it joins with the Upper Meghna River near Munshiganj.
The Modhumati River (Gorai) is one of the largest distributaries of the Ganges and its off-take is located on the right bank downstream of the Harding bridge. The Modhumati River drains the southwestern region of Bangladesh jointly with some other distributaries, and pours into the Bay of Bengal.
The Arial-Khan branches from right bank of the Padma River near the existing ferry port at Charjanajat. After flowing down to the south, the Arial-Khan joins with the Lower Meghna River and finally empties into the Bay of Bengal. The Arial-Khan was the past main course of the Padma River until the time less than 170 years ago.

THE FEASIBILITY STUDY OF PADMA BRIDGE FINAL REPORT (VOLUME V) MARCH 2005
A5-5
(Source: Graphosman World Atlas; 2003: SPARSO, BWDB)
Figure 5.1.4 Main Rivers in Bangladesh

THE FEASIBILITY STUDY OF PADMA BRIDGE FINAL REPORT (VOLUME V) MARCH 2005
A5-6
(8) Flood Plains and Chars
The most of the territory of Bangladesh lies in the flood plains formed by the major rivers of the Ganges, Jamuna and Meghna, and adjoining tributaries and distributaries. The flood plains occupy about 80% of the territory. According to FAP-24 (River Survey Project, 1996), the flood plains in Bangladesh can be broadly classified into three physiographic zones as presented in the paragraphs below.
Active Flood Plain Comprising Natural Levee and Chars: The natural levee is a strip-shaped higher land formed with relatively coarse sediment deposited during flood along the riverbank. The vegetated chars or islands in the rivers are also classified into the same. The elevation of natural levee corresponds with a flood level in a range of 2- to 5-year return period. The natural levees are cut by sizable channels (crevasses) serving to route flood water from the main river channel to the flood plain. The active flood plains in Bangladesh are the dynamic regions in river morphology with high rates of riverbank erosion and channel migration.
Seasonally Drained Flood Plains or Back-Swamps: The topographically lower areas than the natural levees serve as storage basins of flood water or runoff from the surroundings. Because of low flow velocity, these areas are formed with mostly fine sediments deposited through vertical accretion and are characterized by alluvial silt and clay deposits.
Standing Water Bodies or Marshes: Standing water bodies or marshes in the inland regions belong to the topographically depressed areas called as Haors, Boars, and Beels in Bangladesh. The majority of these areas are located in the northeastern region. Water flow is standing in these areas. These areas are mostly characterized by deposits of marsh clay and peat.

THE FEASIBILITY STUDY OF PADMA BRIDGE FINAL REPORT (VOLUME V) MARCH 2005
A5-7
5.1.2 Physiography
(1) Topography of Bangladesh
General contour map of the ground elevation of Bangladesh is shown in Figure 5.1.5. The topography of Bangladesh is mostly flat slightly slanting toward south-southeast direction. Three quarters of the country is below 30m in elevation. It is noted that the ground elevation along the Upper Meghna River is markedly low forming a depression. The ground elevation around the Padma River ranges from 3m to 8m.
(Source: People's Report on Bangladesh Environment 2001)
Figure 5.1.5 General Contour Map of Bangladesh
(2) Physiographic Structure
Figure 5.1.6 shows physiographic structure of the Bengal Basin. The basin is bounded by Indian Shield in west and fold zone in east. Shillong Plateau is located in north on the international border. Eocene Hinge Zone, a 25- to 30-km wide flexure zone with a series of fault scarps, traverses the middle of the Bengal Basin toward south west direction passing by immediately south of Sirajganj. The hinge zone divides the basin into the Shelf Zone in the north and Bengal Fore-deep in the south. The Study Area is located in the Bengal Fore-deep.

THE FEASIBILITY STUDY OF PADMA BRIDGE FINAL REPORT (VOLUME V) MARCH 2005
A5-8
(Source: Morphological Dynamics of the Brahmaputra-Jamuna River, 1997; EGIS)
Figure 5.1.6 Physiographic Structure of Bengal Basin
The Bengal Basin can be divided into three main physiographic sub-regions, i.e., Tertiary hills, Pleistocene uplands and alluvial lowlands (flood plain). The Tertiary hills are located in the north on and around the international border, Chittagong, etc. The Pleistocene uplands located in the northwest of Bangladesh are called as Barind tract, and those in the central Bangladesh are called as Madhupur tract on which City of Dhaka is located.
The alluvial lowlands occupy greater part of Bangladesh including the Study Area. These lands were formed by massive sediment of the Ganges and the Jamuna rivers, influence of tectonic movement, heavy precipitations and floods on the young surface of alluvial lowlands/flood plains. Many micro-landforms are seen on the flood plain. They are the vestiges of former river channels, natural levees, point bars, back marshes, etc. Principal landforms of Bangladesh are shown in Figure 5.1.7.

THE FEASIBILITY STUDY OF PADMA BRIDGE FINAL REPORT (VOLUME V) MARCH 2005
A5-9
Figure 5.1.7 Landform of Bangladesh
(3) Geological Formation of Bengal Basin
The Bengal Basin was formed in the Tertiary and Quaternary period filled with heavy sediment transported by the Ganges and the Jamuna rivers from the tectonically active Himalayas. The thickness of the sediment cover above the pre-Cambrian basement rock is about 180m at Rangpur in the north. It increases toward south and amounts to more than 18,000m in the south eastern part of the country. In the Study Area, the sediment cover has been estimated as thick as 12,000m to 14,000m. The Bengal Basin is said subsiding and balanced with the deposition of sediment supplied from the rivers. Development of Bengal Basin is shown in Figure 5.1.8.

THE FEASIBILITY STUDY OF PADMA BRIDGE FINAL REPORT (VOLUME V) MARCH 2005
A5-10
Figure 5.1.8 Development of Bengal Lowland

THE FEASIBILITY STUDY OF PADMA BRIDGE FINAL REPORT (VOLUME V) MARCH 2005
A5-11
5.2 RIVER MORPHOLOGY AND SEDIMENT STUDY
In this section studies were made preliminarily on the river morphology, river channel and sediment flow conditions.
5.2.1 River Morphology
(1) Historical River Course Shifting
The Bengal Basin is tectonically active. The Madhupur and Barind tracts are Pleistocene alluvial deposits uplifted. The Sylhet Basin is subsiding at 1 to 3 mm/year because of over thrusting of the adjacent Shillong block. In most of the Bengal Basin, compaction and/or isostatically induced subsidence occurs including the coastal zone and offshore areas.
In addition to the tectonic activities, the formation of the Bengal Basin is strongly influenced by the huge input of sediments from the Ganges and the Jamuna rivers. These rivers spread huge sediments brought from Himalayas over the lowland in the Bengal Basin, changing their courses so often.
The river course shifting in the lower Bengal Basin is illustrated in Figure 5.2.1. Around 1770, the Ganges River took its course almost along the present course of the Arial Khan River and emptied into the Bay of Bengal separately from the Jamuna River. Meanwhile, the main flow of the Jamuna River then flew along the present course of the old Brahmaputra River in the east of the City of Dhaka or the Madhupur tract and drained into the bay through the Meghna River. There was only a small stream running along the present course of Jamuna.
According to the Wilcox’s map around 1830, main course of the Jamuna River is found in the present river course and met with the Ganges almost at the present confluence. The joint flow, named as the Padma, discharged into the Bay of Bengal.
Some time between 1830 and 1860, the Padma River cut through the Chandina Alluvium at the downstream of Mawa and was connected with the Meghna River at the present confluence. The Padma River gradually shifted to the east and reached present location. The Padma River is a young river. Especially the Padma River downstream of Mawa is a new river channel formed less than 170 years ago.
(Source: Riverine Chars in Bangladesh; EGIS, 2000)
Figure 5.2.1 Historical River Shifting

THE FEASIBILITY STUDY OF PADMA BRIDGE FINAL REPORT (VOLUME V) MARCH 2005
A5-12
(2) Trend of Eastward Shifting of Padma River
The eastward shifting of the Padma River has been pointed out by the FAP-19 study. The satellite image shown in Figure 5.2.2 endorses the eastward shifting clearly with the vestiges of old river courses. Numerous old river courses of similar scale of the present river channel are found in the flood plain on the west side bank, which implies that the west flood plain used to be the river course until recent years. On the other hand, the landforms in the east side flood plain show distinctively different features from the west one. On the east bank, vestiges of recent river courses are not found and the ground seems to be old and firm comparing to the west bank with relatively higher resistance to erosion.
From the above, trend of eastward shifting of the Padma River could be confirmed. However, the eastward shifting should be regarded as a long-term and gradual trend of yearly riverbank movements.
Figure 5.2.2 Landform Patterns on Satellite Image (Jan. 2003)
(3) Recent Changes of Riverbank
In order to overview the changes of riverbank in recent years, old topographic maps of scale 1/250,000 (published in 1926, 1965) and LANDSAT satellite images taken in dry season of 1973, 1984, 1993 and 2003 were collected and studied preliminarily. From the riverbank changes during the past 78 years since 1926, the following river morphologic features were found:
1) The Padma River alternated its plan-forms with and without big chars (islands) within the river channel. This alternation influences the changes of riverbank mainly on the right (southwest) bank.
2) The confluence of the Ganges and the Jamuna rivers shifted southwards (toward downstream) by about 6 km during the period from 1926 to 1973.
3) The Lower Meghna River changed drastically its channel features. The left bank is continuously eroded and the river width is gradually narrowed forming gradually a single channel section. These changes were more active in early years until 1973.

THE FEASIBILITY STUDY OF PADMA BRIDGE FINAL REPORT (VOLUME V) MARCH 2005
A5-13
4) As a whole the left (east) riverbank is relatively stable, especially at Paturia-Goalundo and Mawa-Janjira sections. It was also confirmed that these two sites kept narrow (or nodal) sections at least during the past 78 years.
5) According to the latest satellite image taken in 2003, three big chars (islands) exist in the 102 km long Padma River. These chars, however, are not stable and young formed less than 30 years ago, since the river alternates conditions with and without chars.
(4) Stability of Riverbank
Furthermore, the satellite images taken in 1973, 1984, 1993 and 2003 were examined more precisely to evaluate the stability of riverbanks at the conceivable crossing locations. These satellite images are shown in Figure 5.2.3 and the changes of riverbanks during these three decades are shown in Figure 5.2.4 superimposing the bank lines each other.
Though the Padma River changes its width and plan-forms of riverbanks frequently, the river keeps relatively narrow and stable sections at the conceivable crossing locations. The left riverbanks are markedly stable especially at Paturia, Mawa and Chandpur.
Focusing on four crossing locations, historical riverbank changes in the past 30 years were studied and shown in Figure 2.5.5. From this Figure, it is clarified that Site-1 and Site-3 are by far stable comparing to remaining two sites as follows:
Site-1 (Paturia-Goalundo): • Change in river width (Wmin to Wmax): 2.44 to 5.00 km • Average river width (Wave): 4.27 km • Coefficient of variation = (Wmax-Wmin)/Wave: 0.61 • Maximum river extent during 30 years: 5.20 km Site-2 (Dohar-Charbhadrasan): • Change in river width (Wmin to Wmax): 3.56 to 8.48 km • Average river width (Wave): 5.25 km • Coefficient of variation = (Wmax-Wmin)/Wave: 0.94 • Maximum river extent during 30 years: 8.88 km Site-3 (Mawa-Janjira): • Change in river width (Wmin to Wmax): 2.00 to 4.92 km • Average river width (Wave): 3.81 km • Coefficient of variation = (Wmax-Wmin)/Wave: 0.60 • Maximum river extent during 30 years: 5.24 km Site-4 (Chandpur-Bhedarganj): • Change in river width (Wmin to Wmax): 2.68 to 9.60 km • Average river width (Wave): 5.31 km • Coefficient of variation = (Wmax-Wmin)/Wave: 1.30 • Maximum river extent during 30 years: 9.60 km

THE FEASIBILITY STUDY OF PADMA BRIDGE FINAL REPORT (VOLUME V) MARCH 2005
A5-14
Figure 5.2.3 Landsat Images of Padma River (1973-2003)
Figure 5.2.4 Change in Bank-lines
Mar. 1973 Feb/Mar. 1984
Jan. 1993 Jan. 2003

THE FEASIBILITY STUDY OF PADMA BRIDGE FINAL REPORT (VOLUME V) MARCH 2005
A5-15
MAWA-JANJIRA
0
2
4
6
8
10
1973 1884 1993 2003
Locat
ion o
f Riv
er
(km
)
Sand
Sand
Water
PATURIA-GOALUNDO
0
2
4
6
8
10
1973 1884 1993 2003
Locat
ion o
f Riv
er (k
m)
Water
Sand
DOHAR-CHARBHADRASAN
0
2
4
6
8
10
1973 1884 1993 2003
Locat
ion o
f Riv
er (k
m)
Water
Water
Sand
Sand
Sand
CHANDPUR-BHEDARGANJ
0
2
4
6
8
10
1973 1884 1993 2003
Locat
ion o
f R
iver
(km
)
Water
Sand
Sand
Note: Location of river indicates the historical locations of boundaries of river water and attached sand-bar along
respective bridge crossing sections measured from fixed reference points on the right bank.
Figure 5.2.5 Changes in Riverbank Locations

THE FEASIBILITY STUDY OF PADMA BRIDGE FINAL REPORT (VOLUME V) MARCH 2005
A5-16
5.2.2 River Channel Conditions
(1) Longitudinal Profiles
Longitudinal profiles of the Jamuna, Ganges-Padma and Meghna rivers were prepared and shown in Figure 5.2.6 based on the BWDW river survey for the year 1998/99.
Jamuna
-15
-10
-5
0
5
10
15
20
25
30
35
0 20 40 60 80 100 120 140 160 180 200 220
Chainage (km)
Elev
atio
n (m
, PW
D)
Left Bank
Right Bank
Lowest Bed
Average Bed Slope
Average Slope 1/13123
Ganges Confluence
Jamuna Bridge
Bahadurabad
Ganges-Padma
-20
-15
-10
-5
0
5
10
15
20
25
30
0 20 40 60 80 100 120 140 160 180 200 220 240
Chainage (km)
Elev
atio
n (m
, PW
D)
Left Bank
Right Bank
Lowest Bed
Average Bed Slope
Average Slope 1/17301
M eghna Confluence
Jamuna Confluence
Hardinge Bridge
Meghna
-30
-25
-20
-15
-10
-5
0
5
10
15
20
0 50 100 150 200 250 300 350 400
Chainage (km)
Elev
atio
n (m
, PW
D)
Left Bank
Right Bank
Lowest Bed
Average Bed Slope
Average Slope 1/25062
Bay of Bangal
Padma ConflunenceBhairab Bazar
Figure 5.2.6 Longitudinal Profiles of Major Rivers

THE FEASIBILITY STUDY OF PADMA BRIDGE FINAL REPORT (VOLUME V) MARCH 2005
A5-17
The average river bed slopes are 1/13,100 in the Jamuna, 1/17,300 in the Ganges-Padma, and 1/25,000 in the Meghna. In the Jamuna and Ganges-Padma rivers, the average slopes of the river banks are almost parallel with the average riverbed slope. The slope of river bank profile is very gentle along the Meghna River and the bank levels vary approximately from 3 to 7 m,PWD for the river stretch of about 320 km.
(2) Water Levels and Bank Levels
According to records of BWDB gauging stations the water level differences between high and low flow seasons in a year are 5 to 6 m in the Padma River, while they are 7 m in the Ganges and Jamuna rivers and 3.5 m in the Meghna River as shown in Table 5.2.1.
Table 5.2.1 Average Highest and Lowest Water Levels
River Code Gauge Highest (m, PWD)
Lowest (m, PWD)
Difference (m)
Jamuna 50.3 Mathura 10.20 3.03 7.17 Ganges 91.2 Mohendrapur 10.67 3.23 7.44 Padma 91.9L Baruia Transit 8.34 1.92 6.42 Padma 93.5L Mawa 6.13 1.12 5.01 Meghna 276 Chandpur 4.46 0.88 3.58
As to topographic data of the flood plain, riverbank levels and some extent of flood plain levels are available from the cross-section survey results by BWDB. FAP-24 study estimated the bank level at each standard cross section. Along the Padma River, the average bank level varies from 8.3 to 5.0 m on the left bank and from 7.6 to 5.4 m on the right bank as shown in Table 5.2.2.
Table 5.2.2 Average Bank Levels of the Padma River (Unit: m, PWD)
Cross section P7 P6.1 P6 P5 P4.1 P4 P3.1 P3 P2 P1.1 P1 Left bank 8.26 7.01 6.68 6.83 6.67 6.67 6.50 5.51 5.00 4.91 5.10Right bank 7.56 7.10 6.83 6.98 6.66 6.86 5.94 5.69 5.40 5.38 5.28(Data: 1966-1993, Source: FAP-24)
(3) River Width and Sectional Patterns
Among the periodical survey sections by BWDB, two cross-sections located most close to the existing gauging stations were selected for study, i.e., Section-P7 about 4 km downstream of Baruria Station and Section-P2.1 almost at Mawa Station. At Section-P7 the survey data are available intermittently from 1969 to 2001 and at Section-P2.1 from 1968 to 1999.
The section data of these surveys are shown in Figure 5.2.7 superimposing them respectively. From the Figure, extent of river area during the data period is about 8.0 km at Section-P7, while at Section-P2.1 about 6.5 km. The extent of river area was assumed as the river area where ground elevation was lower and the elevation changed year by year.

THE FEASIBILITY STUDY OF PADMA BRIDGE FINAL REPORT (VOLUME V) MARCH 2005
A5-18
SECTION-P7: 1969 - 2001
-25-20-15-10-5
05
1015
0 1000 2000 3000 4000 5000 6000 7000 8000 9000 10000
Distance (m)
Ele
vatio
n ((
m P
WD
)
SECTION-P2.1: ALL (1968 - 1999)
-30
-25
-20
-15
-10
-5
0
5
10
0 1000 2000 3000 4000 5000 6000 7000 8000 9000 10000
Distance (m)
Eleva
tion
((m P
WD)
Figure 5.2.7 Superimposed River Sections at Sections P7 and P2.1
Looking into the changes of river sections year by year, it was found that the river kept a similar sectional pattern for some period and the changes of the patterns took place in relatively short period, during one or few flood seasons.
At Section-P7 near Baruria Station, historical river sections are divided into the following periods of similar sectional pattern as shown in Figures 5.2.8 (1/3) ~ (3/3):
1) River width: about 8.0 km from 1969 to 1973 2) River width: about 5.5 km from 1974 to 1986 3) River width: about 6.5 km from 1992 to 2001

THE FEASIBILITY STUDY OF PADMA BRIDGE FINAL REPORT (VOLUME V) MARCH 2005
A5-19
SECTION-P7: 1969 - 1973
-25
-20
-15
-10
-5
0
5
10
15
0 1000 2000 3000 4000 5000 6000 7000 8000 9000 10000
Distance (m)
Ele
vatio
n ((m
PW
D)
Figure 5.2.8 Changes in Sectional Pattern of Section P7 (1/3)
SECTION-P7: 1974 - 1989
-25
-20
-15
-10
-5
0
5
10
15
0 1000 2000 3000 4000 5000 6000 7000 8000 9000 10000
Distance (m)
Ele
vatio
n ((
m P
WD
)
Figure 5.2.8 Changes in Sectional Pattern of Section P7 (2/3)
SECTION-P7: 1992 - 2001
-25
-20
-15
-10
-5
0
5
10
15
0 1000 2000 3000 4000 5000 6000 7000 8000 9000 10000
Distance (m)
Ele
vatio
n ((m
PW
D)
Figure 5.2.8 Changes in Sectional Pattern of Section P7 (3/3)
Likewise, the sectional patters at Section-P2.1 near Mawa-Janjira Site are similar during the following periods (see Figures 5.2.9 (1/4) ~ (4/4)):
1) River width: about 3.5 km from 1968 to 1976 2) River width: about 4.5 km from 1977 to 1989 3) River width: about 3.5 km from 1993 to 1995

THE FEASIBILITY STUDY OF PADMA BRIDGE FINAL REPORT (VOLUME V) MARCH 2005
A5-20
4) River width: about 4.0 km from 1997 to 1999 It is noted that the river width at Section-P2.1 was kept within the range from 3.5 km to 4.5 km, though its location shifted within the extent of about 6.5km width.
SECTION-P2.1: (1968 - 1976)
-30
-25
-20
-15
-10
-5
0
5
10
0 1000 2000 3000 4000 5000 6000 7000 8000 9000 10000
Distance (m)
Ele
vatio
n ((
m P
WD
)
Figure 5.2.9 Changes in Sectional Pattern of Section P2.1 (1/4)
SECTION-P2.1: (1977 - 1989)
-30
-25
-20
-15
-10
-5
0
5
10
0 1000 2000 3000 4000 5000 6000 7000 8000 9000 10000
Distance (m)
Elev
atio
n ((m
PW
D)
Figure 5.2.9 Changes in Sectional Pattern of Section P2.1 (2/4)
SECTION-P2.1: (1993 - 1995)
-30
-25
-20
-15
-10
-5
0
5
10
0 1000 2000 3000 4000 5000 6000 7000 8000 9000 10000
Distance (m)
Elev
atio
n ((m
PW
D)
Figure 5.2.9 Changes in Sectional Pattern of Section P2.1 (3/4)

THE FEASIBILITY STUDY OF PADMA BRIDGE FINAL REPORT (VOLUME V) MARCH 2005
A5-21
SECTION-P2.1: (1997 - 1999)
-30
-25
-20
-15
-10
-5
0
5
10
0 1000 2000 3000 4000 5000 6000 7000 8000 9000 10000
Distance (m)
Elev
atio
n ((m
PW
D)
Figure 5.2.9 Changes in Sectional Pattern of Section P2.1 (4/4)
5.2.3 Sediment Flow Conditions
Riverbed material of the Padma is fine sand of about 0.15 mm in grain size. According to an estimate, the Padma River transports suspended load of about 0.6 to 1.2 billion tons per year, of which 60% is supplied from the Jamuna River and the remaining from the Ganges River. Although the river channel changes its features forming sandbars and eroding riverbanks in the course of sediment transport, the Padma River maintains its straight course toward south eastern direction from the Ganges-Jamuna confluence to the Padma-Meghna confluence.
(1) River Channel Conditions during Flood
River Section Data during Flood: Since the periodical BWDB surveys are conducted in principle during low flow period, the survey sections do not always represent flood season channel features. River channels during flood season were therefore studied using the discharge measurement records which were also carried out by BWDB periodically.
At Baruria Station the discharge measurement records are available from 1985 to 2003. The measurements are carried out in principle weekly for flood months and biweekly for the rest of the year. The measurement records include water level, discharge, flow area, river width, maximum water depth and its lateral location, etc. The discharge measurement records are also available at Mawa Station from 1997 to 2002 on the same data items, but measurements are limited only to flood months from June to October.
Changes in Lowest Riverbed at Baruria Station: Historical changes of the water level, lowest riverbed and lateral location of the lowest riverbed at Baruria Station are studied based on the discharge measurement data and shown in Figure 5.2.10. Location of the lowest riverbed of the Padma River swayed to the right and left bank sides frequently, but after 1988 it stayed at the right bank side. Sometime between 1997 and 1999, the lowest riverbed moved to the left bank side and remains until now. Since the year of 1988, the lowest riverbed shows lowering trend. The seasonal riverbed movements are not clear from the data.
In order to inspect the changes in riverbed throughout dry and flood seasons, a series of water levels measured periodically were plotted against the corresponding lowest riverbed elevations as shown in Figure 5.2.11. If the lowest riverbed does not change as the water level rises, the relationship would be expressed by the vertical movement of plot in the Figure. As seen in the Figure, the vertical movements of the plots seen during lower water period seem to change to the horizontal movements at the water levels higher than +6 m, PWD, which indicates the changes of riverbed elevations at higher water regime.

THE FEASIBILITY STUDY OF PADMA BRIDGE FINAL REPORT (VOLUME V) MARCH 2005
A5-22
Changes in Lowest Riverbed at Mawa Station: Similarly to Baruria Station, historical changes of water level, lowest riverbed and lateral location of the lowest bed were studied and shown in Figure 5.2.12, though the dry season data are not available. Unlike Baruria station, the lowest riverbed of the Padma sways to right and left bank sides even in a flood season.
The relationship between water level and lowest riverbed is also shown in Figure 5.2.13. From the Figure, The lowest riverbed seems to move at the water levels higher than +5 m,PWD.
Change in Lowest Riverbed
-20.0
-15.0
-10.0
-5.0
0.0
5.0
10.0
15.0
1985/4/
1
1986/4/
1
1987/4/
1
1988/4/
1
1989/4/
1
1990/4/
1
1991/4/
1
1992/4/
1
1993/4/
1
1994/4/
1
1995/4/
1
1996/4/
1
1997/4/
1
1998/4/
1
1999/4/
1
2000/4/
1
2001/4/
1
2002/4/
1
2003/4/
1
Date (y/m/d)
Ele
vation (m
,PW
D)
Water level
Lowest riverbed
Change in Location of Lowest Bed
0
500
1000
1500
2000
2500
3000
3500
4000
4500
1985
/4/1
1986
/4/1
1987
/4/1
1988
/4/1
1989
/4/1
1990
/4/1
1991
/4/1
1992
/4/1
1993
/4/1
1994
/4/1
1995
/4/1
1996
/4/1
1997
/4/1
1998
/4/1
1999
/4/1
2000
/4/1
2001
/4/1
2002
/4/1
2003
/4/1
Date (y/m/d)
Dis
tance
fro
m L
eft R
efer
enc
e Poin
t (m
)
Figure 5.2.10 Changes in Lowest Riverbed at Baruria

THE FEASIBILITY STUDY OF PADMA BRIDGE FINAL REPORT (VOLUME V) MARCH 2005
A5-23
Water Level and Lowest Riverbed Elevation
0.0
2.0
4.0
6.0
8.0
10.0
-20.0 -15.0 -10.0 -5.0 0.0 5.0
Lowest riverbed elevation (m,PWD)
Wat
er
level (
m,P
WD
)
Figure 5.2.11 Water Level and Lowest Riverbed at Baruria
Change in Lowest Riverbed
-15.0
-10.0
-5.0
0.0
5.0
10.0
15.0
1997/4/1
1998/4/1
1999/4/1
2000/4/1
2001/4/1
2002/4/1
Date (y/m/d)
Ele
vation (m
,PW
D)
Water level
Lowest riverbed
Change in Location of Lowest Bed
0
1000
2000
3000
4000
5000
6000
1997/4/1
1998/4/1
1999/4/1
2000/4/1
2001/4/1
2002/4/1
Date(y/m/d)
Dis
tance fro
m L
eft R
efe
rence P
oin
t (m
)
Figure 5.2.12 Change in Lowest Riverbed at Mawa

THE FEASIBILITY STUDY OF PADMA BRIDGE FINAL REPORT (VOLUME V) MARCH 2005
A5-24
Water Level and Lowest Riverbed
2
3
4
5
6
7
8
-14 -12 -10 -8 -6 -4 -2
Lowest riverbed elevation (m,PWD)
Wate
r le
vel (
m,P
WD
)
Figure 5.2.13 Water Level and Lowest Riverbed at Mawa
(2) Channel Roughness
Approach: Since sediment flow patterns and bed forms during flood are not visible, an attempt was made to have an insight on the sediment movements through the changes in roughness or resistance to flow based on the discharge measurement records at Baruria Station. For the discussions below, river slope was assumed to be 1/17,300 taking the average bed slope of the Ganges-Padma River, and mean diameter of bed material (d50) 0.015 cm. Riverbank elevation is around +8.0 m, PWD at the section of Baruria Station.
The roughness was worked out by the uniform flow formula using the discharge measurement records as follows:
n = A (A / B)2/3 I1/2 / Q
where n: Manning’s coefficient of roughness, A: flow area (m2), B: surface width of river channel (m), I: river slope, and Q: discharge (m3/s).
Estimated Roughness: Figure 5.2.14 shows the relationship between water levels and corresponding channel roughness. The estimated roughness decreases as the water level rises, and at the bank-full level the roughness reaches more or less n = 0.015. It is noted that some changes in trend of roughness are observed around at +5.5 m, PWD of water level.

THE FEASIBILITY STUDY OF PADMA BRIDGE FINAL REPORT (VOLUME V) MARCH 2005
A5-25
Water Leve and Rourhness
0
2
4
6
8
10
12
0.00
0.01
0.02
0.03
0.04
0.05
0.06
0.07
0.08
0.09
0.10
Manning's coefficient of roughness (n)
Wat
er le
vel
(m
,PD
M)
Water Leve and Rourhness
0
2
4
6
8
10
12
0.001 0.010 0.100 1.000
Manning's coefficient of roughness (n)
Wate
r le
vel
(m
,PD
M)
Figure 5.2.14 Water Level and Channel Roughness
Resistance to Flow: In order to look into the change in trend observed in the above Figure, relationship between dimensionless shear stress (τ⋅) of flow and velocity coefficient (φ) which represents resistance to flow was examined using the same discharge measurement records. Figure 5.2.15 shows the relationship between τ⋅ and φ, which are defined as follows:
τ⋅ : Dimensionless shear stress = u*2 / (s g d) = h I / (s d)
φ : Velocity coefficient = vm / u* = h1/6 / (n g1/2) (n: Manning’s coefficient of roughness) = C / g1/2 (C: Chezy’s coefficient of roughness) = Fr / I1/2 (Fr: Froude number)
where
h : Water depth I : River slope (I = 1/17,300) vm : Mean velocity u* : Shear velocity = (g h I)0.5 s : Specific gravity of bed material in water (assumed as s = 1.65) g : Acceleration of gravity (g = 9.80 m/sec2) d : Particle size of bed material (d50 = 0.015 cm)
From the Figure it is clearly identified the difference in velocity coefficient or resistance to flow depending on the magnitude of shear stress. The shear stress represents the tractive force of flow and largely depends on the water depth. The relationship between τ⋅ and φ were further reproduced dividing the data into two, i.e., water-level group lower than +5.5 m, PWD and water-level group higher than that. These relationships were illustrated in Figures 5.2.16 and 5.2.17.
The velocity coefficients (φ) for the lower water-level group distribute horizontally around φ = 10. Referring to the empirical relations derived from river data in Japan, the lower water-level group seems to be under the bed-form of dune, bringing about high channel roughness. On the other hand the higher water-level group indicates the state of transition from dune-bed to flat-bed, and further to anti-dune bed. The channel roughness is very small under the flat-bed condition and sediment load is much. The boundary of dune-bed to

THE FEASIBILITY STUDY OF PADMA BRIDGE FINAL REPORT (VOLUME V) MARCH 2005
A5-26
flat-bed seems to be at around water level H = +5.5 m, PWD.
0
10
20
30
40
50
60
0.1 1.0 10.0
Dimensionless shear stress (τ*)
Velo
city c
eff
icie
nt
(φ)
Figure 5.2.15 Relationship between τ⋅ and φ at Baruria
0
10
20
30
40
50
60
0.1 1.0 10.0
Dimensionless shear stress (τ*)
Velocity cefficient (φ
)
Figure 5.2.16 τ⋅ - φ Relationship at Baruria (H < +5.5 m,PWD)
0
10
20
30
40
50
60
0.1 1.0 10.0
Dimensionless shear stress (τ*)
Velocity cefficient
(φ
)
Figure 5.2.17 τ⋅ - φ Relationship at Baruria (H > +5.5 m,PWD)

THE FEASIBILITY STUDY OF PADMA BRIDGE FINAL REPORT (VOLUME V) MARCH 2005
A5-27
(3) Sediment Flow Conditions
General Process of Sediment Flows: The process of sediment flow in the river can be generalized by the relationship of shear stress of flow and the resistance to flow represented by the roughness (n) or velocity coefficient (φ). The bed materials start to move when the shear stress of flow exceeds critical value particular to the materials. As the water level rises increasing the shear stress, resistance to flow of river channel also increases forming ripples on riverbed. If the shear stress continues to increase, the resistance to flow increases further forming dunes on the riverbed. Under the dune-bed condition the resistance to flow reaches to the maximum. The high resistance to flow abruptly turns to low, when the riverbed changes to flat-bed or unti-dune conditions as the shear velocity increases.
Sediment Flow in Padma River: Because of fine bed material, the bed material of the Padma River can start to move even under the water flow of 30 to 40 cm in depth. Most of the sediments are transported as suspended load even during the rising period of water level. During the flood season the riverbed forms dune increasing the resistance to flow, and at the water level of around +5.5 m, PWD the dune-bed starts to turn to flat-bed. Under the bank-full flow condition, the riverbed at Baruria Station would be flat-bed and/or unti-dune with roughness of around n = 0.015.
5.3 ADDITIONAL RIVER AND MORPHOLOGIC STUDIES
Additional studies were made in this section mainly for Patria-Goalundo site (PG-site) and Mawa-Janjira site (MJ-site), in order to compare river and river morphologic features to select an optimum crossing location for Padma Bridge.
5.3.1 Displacement of Left and Right Banks
Displacement of riverbanks at PG-site and MJ-site was studied based on the old topographic maps in 1926 and 1960; and satellite images taken in 1973, 1984, 1993 and 2003. Locations of historical bank-lines were superimposed and shown in Figure 5.3.1. In the Figure, left bank-lines are shown in white lines and right bank-lines in yellow lines. Approximate crossing locations are also shown in the Figure.
Probably due to the eastward shifting, the left bank (eastern bank) of the Padma River seems to sticks to the eastern land where the Padma River has not flowed yet. Especially near Paturia and Mawa the bank-lines were superimposed on one line, which indicates that the left banks at these sites are markedly stable showing invisible bank-line movement at least during the data period of 78 years.
On the other hand, the right bank of the Padma River is changeable as a whole located on the unconsolidated past river course of the Padma River. It seems that the right bank moves to absorb the river width changes due to fluctuation of water and sediment flow conditions of the Padma River.

THE FEASIBILITY STUDY OF PADMA BRIDGE FINAL REPORT (VOLUME V) MARCH 2005
A5-28
Figure 5.3.1 Displacement of Riverbanks along Padma River
5.3.2 Identification of Erosion Resistant Banks
Bank line shift of the Padma River is very active and its erosion rate is high as a whole. However, the erosion rate of the bank line is not uniform for its entire 100 km long stretch. In some locations the bank erosion rates are relatively low (5 to 20 m/year), and further there are a few locations where the bank erosion is markedly low (1 to 5 m/year) as mentioned earlier. The locations of low erosion rate are found even where the main flow of the Padma is along the bank. The bank erosion rate mainly depends on the texture of the bank materials, consolidation and mineralogical composition.
It is important to investigate different types of bank materials and their extent along the riverbanks of the Padma River, prior to the layout plan of the bridge, approach roads and river works for Padma Bridge.
In order to identify erosion resistant banks, Asian Institute of Technology (AIT, Bangkok) conducted a study under sublet contract with JICA Study Team. The study was carried out jointly with AIT and Center for Environmental and Geographic Information Services (CEGIS, Dhaka).
Major findings brought about by the study are summarized as follows:
1) The soil materials of floodplain and riverbank along the right bank are nearly uniform and composed of recently deposited unconsolidated sediments mostly consisting of fine sand and silt. The right bank is highly erodible, while any channel of the Padma River attacks the bank. The rate of bank erosion often reaches in the range of several hundred meters per year. The only exception is a patch of ‘Tippera Surface’ as designated by Coleman (1969), which consists of clay and silt, and relatively consolidated sediment. Rate of bank erosion in this area is much less compared to that of the unconsolidated floodplain.
2) Unlike the right bank, floodplain along left bank of the Padma River was not uniform in
Less
Less
PG-Site
MJ-Site
erodible
erodible

THE FEASIBILITY STUDY OF PADMA BRIDGE FINAL REPORT (VOLUME V) MARCH 2005
A5-29
terms of erodibility. Most of the floodplain is composed of Atria-Gur and ‘Tippera Surface’ sediments and less erodible. Ages of these flood plains are probably several hundred to several thousand years. Borehole data show that the sediments consist of clay, silt and find sand.
3) The exception is the left floodplain near Harirampur, which recently suffers from severe erosion in the scale of hundred meters per year. The left floodplain downstream of the Mawa, although it appears to be composed of ‘Tippera Surface’, was also found susceptible to erosion. Average rate of bank erosion is 20 to 40 m/years during the last three decades, which is between the observed erosion rates in the recently formed and the older floodplains upstream of Mawa.
As a result of the AIT-CEGIS study, Figure 5.3.2 was prepared to show the extent of the different categories of erodibility levels in consideration of bank materials and their distributions.
In the Figure, all the riverbanks of the Padma River are divided into three categories of erodibility levels; highly erodible, moderately erodible and less erodible. When the main channel of the Padma River attacks the bank, erosion rate would be more than a hundred meters per year along the highly erodible bank (red line), 20 to 50 m/year along the moderately erodible bank (yellow line), and 0 to 15 m/year along the less erodible bank (green line). It should be mentioned that even a moderately erodible bank can act as erosion resistant bank for a number of decades due to having a thin patch of clay deposits or while the bank is not attacked by an aggressive bend.
Figure 5.3.2 Distribution of Erodibility Levels of Riverbanks
5.3.3 River Channel
(1) Longitudinal Profile
Based on the cross sections surveyed in 1998/99, longitudinal profiles of the lowest riverbed, left and right riverbanks, and mean riverbed were prepared along the Padma River
Highly erodible Moderately
erodible Less erodible
MJ-Site
PG-Site

THE FEASIBILITY STUDY OF PADMA BRIDGE FINAL REPORT (VOLUME V) MARCH 2005
A5-30
as shown in Figure 5.3.3.
Since the mean riverbed generally represents hydraulic sectional characteristics of the river, riverbed slope was delineated on the profile of the mean riverbed. The riverbed slope is 1/15,800 (or 6.3 cm/km) from Hardinge bridge of the Ganges River to about 1.3 km downstream of MJ-site of the Padma River. Within the stretch, PG-site and MJ-site are included. In the downstream reaches of the stretch, the Padma and the Lower Meghna rivers have very gentle bed slope as 1/50,200 (or 2.0 cm/km).
Figure 5.3.3 Longitudinal Profile of Meghna-Padma-Ganges River: 1998/99
(2) Study on River Section Data
According to periodical survey data of the BWDB, the river section nearest to PG-site is CS-P7 at about 4 km downstream of PG-site, and that nearest to MJ-site is CS-P2.1 almost at MJ-site. Historical changes and hydraulic characteristics of these river sections were studied as presented below.
Historical Changes of CS-P7: Section data are available for 33 years from 1969 to 2001 for CS-P7. The maximum extent of river is about 8.0 km during the data period. Left bank of the main stream almost stayed at the same location during the past 33 years, and the river sections could be divided into three periods of similar sectional patterns mainly depending on the location of right bank as shown in Table 5.3.1.
Table 5.3.1 Historical Changes of CS-P7
Lowest riverbed Period (year)
River width (km)
sand bar on left bank (m,PWD) Location
1969-73 1974-86 1992-01
8.0 (wide) 5.5 (narrow) 6.5 (medium)
Small Small Small
– 8.34 –13.20 –12.14
L, C or R L or R
L (Remark) L, C and R stand for left, center and right side of the channel section.
-20
-15
-10
-5
0
5
10
15
20
25
0 50 100 150 200 250 300 350
Distance from sea (km)
Ele
vation (
m,P
WD
)
Right bank
Left bank
Mean riverbed
Average bed slope
Lowest riverbed
Sea(Ramgati) MeghnaR. Site-3 Site-1 JamunaR. HardingBr.
1/50,200
1/15,800
Lower Meghna R
Padma Ganges
-20
-15
-10
-5
0
5
10
15
20
25
0 50 100 150 200 250 300 350
Distance from sea (km)
Ele
vation (
m,P
WD
)
Right bank
Left bank
Mean riverbed
Average bed slope
Lowest riverbed
Sea(Ramgati) MeghnaR. Site-3 Site-1 JamunaR. HardingBr.

THE FEASIBILITY STUDY OF PADMA BRIDGE FINAL REPORT (VOLUME V) MARCH 2005
A5-31
Considering the close location to PG-site, the river section at the crossing location would be similar to CS-P7 with a little narrower width.
Historical Changes of CS-P2.1: River sections at CS-P2.1 could be divided into four periods of similar sectional patterns, according to the BWDB data available for 32 years from 1968 to 1999. Although the locations of perennial channel move to left and right within the maximum extent of river of about 6.5 km, the river keeps relatively narrow width ranging from 3.5 to 4.5 km as summarized in Table 5.3.2.
Table 5.3.2 Historical Changes of CS-P2.1
Lowest riverbed Period (year)
River width (km)
sand bar on left bank (m,PWD) Location
1968-76 1977-89 1993-95 1997-99
3.5 4.5 3.5 4.0
Medium Large Small Large
–15.09 –14.42 –28.31 –21.66
C C or R
L C
(Remark) L, C and R stand for left, center and right side of the channel section.
The left riverbank stayed almost at the same location during the data period. It is noted that the sections from 1993 to 95 showed markedly different sectional pattern from others with extremely deep water depth close to the left bank. During this period, the main flow of the Padma River took almost along the present South Channel behind Char Kawrakandi.
Sectional pattern of MJ-site would be the same as those of CS-P2.1, since the locations are close each other.
Hydraulic Characteristics: Hydraulic channel characteristics of CS-P7 near PG-site and CS-P2.1 near MJ-site were analyzed using the same data discussed in the above. Results of the analysis are shown in Table 5.3.3 for CS-P7 and Table 5.3.4 for CS-P2.1.

THE FEASIBILITY STUDY OF PADMA BRIDGE FINAL REPORT (VOLUME V) MARCH 2005
A5-32
Table 5.3.3 Hydraulic Channel Characteristics (CS-P7) Y・.M・
CS Bankfull MeanBed LowestB Area Width Dmean Dmax Qlow Qtotal hx/hm
m,PWD m,PWD m,PWD m2 m m m m3/s m3/s 6902P7 7.56 0.28 -8.03 56,386 7,744 7.282 15.590 112,000 112,000 2.147003P7 7.56 -0.03 -8.20 59,080 7,779 7.595 15.764 121,000 121,000 2.087012P7 7.56 1.39 -5.25 47,191 7,653 6.166 12.813 84,000 84,000 2.087202P7 7.56 -0.64 -8.34 63,779 7,775 8.203 15.905 138,000 138,000 1.947301P7 7.56 0.51 -7.98 54,325 7,710 7.046 15.539 106,000 106,000 2.217312P7 7.56 1.28 -6.48 48,534 7,728 6.280 14.042 88,000 88,000 2.247412P7 7.56 1.33 -4.61 47,633 7,650 6.227 12.170 86,000 86,000 1.957512P7 7.56 -0.28 -8.79 41,608 5,310 7.836 16.347 87,000 88,000 2.097707P7 7.56 -1.63 -13.20 49,179 5,351 9.191 20.764 114,000 115,000 2.267712P7 7.56 -0.27 -7.06 42,095 5,379 7.826 14.624 88,000 88,000 1.877911P7 7.56 -1.31 -10.45 47,334 5,339 8.865 18.005 108,000 108,000 2.038104P7 7.56 0.62 -8.80 37,829 5,453 6.937 16.362 73,000 73,000 2.368202P7 7.56 0.78 -6.05 36,297 5,352 6.783 13.612 69,000 69,000 2.018311P7 7.56 -0.16 -12.91 41,372 5,360 7.718 20.465 86,000 86,000 2.658412P7 7.56 -0.63 -9.52 44,544 5,440 8.188 17.075 96,000 96,000 2.098702P7 7.56 0.30 -5.73 41,566 5,727 7.259 13.290 83,000 83,000 1.838904P7 7.56 -1.07 -9.37 48,876 5,663 8.631 16.929 109,000 109,000 1.969208P7 7.56 0.46 -6.67 43,330 6,102 7.101 14.227 85,000 85,000 2.009305P7 7.56 1.49 -8.62 37,428 6,163 6.072 16.181 66,000 66,000 2.669501P7 7.56 2.86 -1.95 29,362 6,250 4.698 9.509 44,000 44,000 2.029602P7 7.56 0.04 -12.14 45,872 6,104 7.515 19.700 93,000 93,000 2.629711P7 7.56 0.91 -7.92 42,107 6,330 6.652 15.480 79,000 79,000 2.339802P7 7.56 -0.88 -8.06 53,490 6,340 8.437 15.620 118,000 118,000 1.859812P7 7.56 0.52 -6.88 44,420 6,310 7.040 14.440 87,000 87,000 2.050001P7 7.56 0.27 -7.94 47,446 6,510 7.288 15.500 95,000 95,000 2.130201P7 7.56 0.81 -8.51 39,847 5,900 6.754 16.070 76,000 76,000 2.38
Ave 7.56 0.27 -8.06 45,805 6,324 7.292 15.616 91,962 92,038 2.15
Table 5.3.4 Hydraulic Channel Characteristics (CS-P2.1)
Y・.M・CS Bankfull MeanBed LowestB Area Width Dmean Dmax Qlow Qtotal hx/hm
m,PWD m,PWD m,PWD m2 m m m m3/s m3/s 6812P21 5.71 -3.37 -14.39 28,952 3,187 9.083 20.103 67,000 71,000 2.217001P21 5.71 -5.24 -10.56 32,917 3,005 10.952 16.274 86,000 89,000 1.497102P21 5.71 -4.66 -10.89 33,966 3,274 10.373 16.597 86,000 89,000 1.607205P21 5.71 -3.65 -10.24 27,917 2,982 9.362 15.948 66,000 66,000 1.707303P21 5.71 -3.67 -12.68 31,652 3,376 9.376 18.393 75,000 75,000 1.967402P21 5.71 -4.74 -15.09 26,175 2,505 10.450 20.798 66,000 67,000 1.997504P21 5.71 -6.16 -13.21 31,317 2,638 11.869 18.923 86,000 87,000 1.597602P21 5.71 -6.01 -9.17 32,805 2,800 11.717 14.878 90,000 91,000 1.277704P21 5.71 -4.05 -12.54 30,850 3,161 9.759 18.250 75,000 76,000 1.877802P21 5.71 -3.08 -14.28 32,879 3,741 8.790 19.990 74,000 74,000 2.277912P21 5.71 -3.91 -9.83 29,893 3,108 9.618 15.536 72,000 73,000 1.628102P21 5.71 -4.03 -12.05 35,354 3,631 9.736 17.765 85,000 86,000 1.828203P21 5.71 -1.59 -10.21 28,665 3,924 7.304 15.920 57,000 57,000 2.188403P21 5.71 -2.47 -14.42 33,209 4,061 8.178 20.131 71,000 72,000 2.468501P21 5.71 -2.75 -10.18 39,075 4,621 8.455 15.887 86,000 87,000 1.888905P21 5.71 -1.51 -5.13 22,068 3,057 7.219 10.835 44,000 45,000 1.509301P21 5.71 -2.48 -21.74 35,700 4,361 8.187 27.445 77,000 77,000 3.359401P21 5.71 -4.66 -28.31 35,908 3,464 10.366 34.022 91,000 92,000 3.289510P21 5.71 -1.21 -4.70 21,859 3,161 6.916 10.412 42,000 43,000 1.519703P21 5.71 -6.23 -21.66 47,331 3,965 11.937 27.370 131,000 132,000 2.299803P21 5.71 -5.29 -15.09 44,361 4,032 11.002 20.800 116,000 117,000 1.899907P21 5.71 -4.91 -14.10 44,371 4,178 10.619 19.810 114,000 115,000 1.87
Ave 5.71 -3.89 -13.20 33,056 3,465 9.60 18.91 79,864 80,955 1.98

THE FEASIBILITY STUDY OF PADMA BRIDGE FINAL REPORT (VOLUME V) MARCH 2005
A5-33
River Sections Surveyed by Study Team: JICA Study Team conducted leveling survey in August 2003 along the proposed routes of approach roads and bridge across the Padma River at PG-site and MJ-site. The survey results are shown in Figures 5.3.4 and 5.3.5 for PG-site and MJ-site, respectively. In the figures, water levels such as DHWL, SHWL, MWL and SLWL are also shown in comparison.
-15
-10
-5
0
5
10
15
8,000 9,000 10,000 11,000 12,000 13,000 14,000 15,000 16,000
Distance (m)
Ele
vation
(m
,PW
D)
DHWL
SHWL
MWL
SLWL
Figure 5.3.4 Cross Sectional Survey across PG-site
-15
-10
-5
0
5
10
15
6,000 7,000 8,000 9,000 10,000 11,000 12,000 13,000 14,000
Distance (m)
Ele
vation
(m
,PW
D)
DHWL
SLWL
SHWL
MWL
Figure 5.3.5 Cross Sectional Survey across MJ-site
(3) Normal River Width
Lacey’s Formula: The following formula gives minimum stable river width of alluvial rivers. The formula was originally proposed by G. Lacey based on studies on rivers in India and Pakistan:
QCW =
in which W is the net surface river width corresponding to design discharge Q, and C is a coefficient originally proposed C=4.84 (in meter-second units) by Lacey for sand-bed river. According to the preliminary estimate, bank-full discharge is 92,000 m3/s at CS-P7 and 80,000 m3/s at CS-P2.1. Design discharge estimated for 100 year probable flood is 151,400 m3/s at CS-P7 and 134,400 for m3/s at CS-P2.1.
Applying Lacey’s formula to the Padma River, the stable river widths were estimated as shown below. On the other hand, low-water channel width of the surveyed section is 6,300 m for CS-P7 ranging from 5,300 to 7,800 m, and 3,500 m for CS-2.1 ranging from 2,500 to 4,600 m. Actual river width of the Padma River is far wide comparing to the estimated stable width.

THE FEASIBILITY STUDY OF PADMA BRIDGE FINAL REPORT (VOLUME V) MARCH 2005
A5-34
Lacey’s stable width (W) For bank-full discharge (Qb) For design discharge (Q100)
Cross section
Qb (m3/s) W(m) Q100 (m3/s) W(m) CS-P7 CS-P2.1
92,000 80,000
1,500 1,400
151,400 134,400
1,900 1,800
Coefficient C for Padma River: In order to find out the Lacey’s coefficient corresponding to the conditions of the Padma River at the candidate bridge sections, the coefficient C were estimated under the bank-full flow conditions as follows:
Cross section Bank-full Qb (m3/s)
LW ch. width Ave. (range: m)
Coefficient C Ave. (range: m)
CS-P7 (BWDB section) CS-P2.1 (BWDB section)
92,000 80,000
6,300(5,300-7,800) 3,500(2,500-4,600)
20.8(17.5-25.7) 12.4(8.8-16.3)
PG-site (JICA survey) MJ-site (JICA survey)
81,000 99,000
3,000 3,700
10.5 11.8
The C-value estimated for CS-P7 is quite different from those of CS-P2.1 and PG- and MJ-sites. The C-values for PG-site and MJ-site were assumed commonly at C = 12. Applying this to the design discharge, the normal river widths were estimated as follows:
Site Design discharge Normal width PG-site MJ-site
151,400 m3/s 134,400 m3/s
4,700 m 4,400 m
5.3.4 Preliminary Estimate of Maximum Scour Depth
(1) Recorded Lowest Riverbed
Periodical river survey results of CS-P7 and CS-P2.1 were used for the study of the maximum scour depth at the crossing location.
These survey results, however, are mostly of dry season. In order to clarify the difference of riverbeds between dry and rainy seasons, the deepest water records at Baruria and Mawa stations obtained during the time of discharge measurements were also studied, though these depths are of approximate ones. Locations of these survey sections and flow gauging stations are shown below.
Crossing location Survey section Flow gauging station PG-site CS-P7: About 4 km downstream of the
site Baruria: Almost the same location with the site
MJ-site CS-P2.1: Almost the same location with the site
Mawa: Almost the same location with the site
Historical lowest riverbed data are plotted in Figures 5.3.6 and 5.3.7, respectively for PG-site and MJ-site for both data from river survey and discharge measurements.
Records at CS-P7 near PG-site: As to CS-P7 near PG-site, river survey and discharge measurement data accord relatively well up to the year 1996, but after the year the discharge measurement data show lower riverbed elevations than those of river survey due to unknown reasons.

THE FEASIBILITY STUDY OF PADMA BRIDGE FINAL REPORT (VOLUME V) MARCH 2005
A5-35
-30
-25
-20
-15
-10
-5
0
5
10
01/04/1968 01/04/1972 01/04/1976 01/04/1980 01/04/1984 01/04/1988 01/04/1992 01/04/1996 01/04/2000 01/04/2004
Date(dd/mm/yyyy)
Ele
vat
ion
(m,P
WD
)
Lowest riverbed at discharge measurement
Lowest riverbed at periodical section survey
Mean riverbed at discharge measurement
Mean riverbed at periodical section survey
Figure 5.3.6 Historical Lowest Riverbed at CS-P7
The lowest riverbed elevation during the data period (Table 5.3.1) was -13.2 m,PWD according to the river survey data, and that of discharge measurement was -20 m,PWD.
Records at CS-P2.1 near MJ-site: As to CS-2.1 near MJ-site, riverbed elevations from two sources could not be compared, since river survey data were available mostly in low water season and discharge measurements were not conducted during the low water season at Mawa Station.
-30
-25
-20
-15
-10
-5
0
5
10
01/04/1968 01/04/1972 01/04/1976 01/04/1980 01/04/1984 01/04/1988 01/04/1992 01/04/1996 01/04/2000 01/04/2004
Date (dd/mm/yyyy)
Ele
vation (
m,P
WD
)
Lowest riverbed at discharge measurement
Lowest riverbed at periodical section survey
Mean riverbed at discharge measurement
Mean riverbed at periodical section survey
Figure 5.3.7 Historical Lowest Riverbed at CS-P2.1
According to the river survey data by BWDB (Table 5.3.2), the lowest riverbed was recoded as low as -28.3 m,PWD followed by two records of -21.7 m,PWD. These low riverbeds were recorded in the period from 1993 to 1997. Except for this period, the lowest riverbed at Mawa was -15.1 m,PWD.
(2) Preliminary Estimation of Maximum Scour Depth for Alternative Study
Method of Estimation: Maximum scour depth was estimated preliminary for the facility design necessary for the alternative study to select an optimum crossing location. The same method and standards adopted for the design of Jamuna Bridge and pre-feasibility study of Padma Bridge were applied for this purpose, considering the confluence scour, bend scour

THE FEASIBILITY STUDY OF PADMA BRIDGE FINAL REPORT (VOLUME V) MARCH 2005
A5-36
and local scour around river works and bridge piers.
The bend scour is considered for the riverbed adjacent to riverbank and the confluence scour for the other portion of the riverbed. The bend scour is caused by the possible stream bend, and the extent of scour is assumed to be 300 m wide from the riverbank. The confluence scour is caused by the turbulence of flows generated by the confluence of two streams, i.e., the Ganges and Jamuna rivers at PG-site and the southwestern and northeastern channels of Char Kawrakandi at MJ-site.
The scoured riverbed due to bend would be scoured further when riverbank is provided by bank protection works (BPW). Furthermore, the riverbed around the bridge pier would be scoured locally.
Result of Estimation: Maximum scour depths estimated by the empirical formulas are summarized in Table 5.3.5. The estimated maximum scour depths are deep enough comparing to the recorded lowest riverbeds.
Table 5.3.5 Preliminarily Estimated Maximum Scoured Depth
PG-Site Q100 = 151,400 m3/s H100 = 9.72 m,PWD
MJ-Site Q100 = 134,400 m3/s H100 = 7.35 m,PWD
Location
Items
Depth (m) El. (m,PWD) Depth (m) El. (m,PWD)Scour due to bend & BPW 43.5 -33.8 44.9 -37.5 Near bank Scour due to pier (Φ3m) 49.0 -39.3 50.4 -43.0 Scour due to confluence 32.8 -23.1 33.7 -26.4 Middle river Scour due to pier (Φ3m) 38.3 -28.6 39.2 -31.9
(Remarks) Depth: Water depth below DHWL; EL: Scoured riverbed elevation
The scour depths estimated in this sub-section are to be applied to the preliminary facility design for selection of an optimum site only. The scour depth shall be studied further for the optimum site selected finally.

THE FEASIBILITY STUDY OF PADMA BRIDGE FINAL REPORT (VOLUME V) MARCH 2005
A5-37
5.4 FURTHER STUDIES ON ERODIBILITY OF RIVERBANK
Further studies on the erodibility of riverbank were made specifically for Mawa-Janjira site (MJ-site) finally selected for crossing of Padma Bridge.
5.4.1 Historical River Course Shifting
(1) Data and Methodology
Historical maps and satellite images were collected additionally as shown in Table 5.4.1. The historical maps collected cover the period from 1776 to 1963 and the satellite images from CORONA in 1967 to LANDSAT in 2003. In addition to these, aerial photos taken in December 1998 and November 1989 were also referred.
Adjusting the coordinates and clear land marks carefully, maps and satellite images were superimposed each other and historical plan form changes of the Padma River were studied for the neighboring stretch of crossing location at MJ-site.
Table 5.4.1 Old maps and Satellite Images Collected
Year Date Type Year Date Type 1776 (Published year) 1989 Feb. Landsat 1860 (Published year) 1989 04 Nov. Landsat 1914 (Published year) Topography 1993 15 Jan. Landsat 1904-1913:surveyed 1996 18 Feb. Landsat 1938-42 Bank line
survey 1997 26 Jan. & 18 Feb. Landsat
1952/53 Dec/1952 - Jan/1953 Bank line survey
1998 Dec. Aerial photo
1960 Topography 1999 01 Feb. & 28 Mar.
Landsat
1963 Bank line survey
2000 28 Feb. Landsat
1967 CORONA 2001 29 Jan. Landsat 1973 10 Mar. & 21 Feb. Landsat 2002 Feb. Landsat 1980 02 Feb. & 21 Feb. Landsat 2003 19 Jan. Landsat 1984 19 Mar. & 23 Feb. Landsat
(2) Long-Term River Course Shifting
Figure 5.4.1 shows the long-term river course shifting since 1776 (228 years ago) based on the historical topographic maps in reference to plan-form in 2003. From this figure, one can find the following:
1) In 1776-map, the old Padma River took river course almost along the present Arialkhan River and it changed to the present river course as seen in 1860-map.
2) Since 1860, the Padma River shifted gradually toward northeast. 3) Since 1914 at latest, main stream of the Padma River has kept present river course at
the crossing location, stuck to the less erodible left bank.

THE FEASIBILITY STUDY OF PADMA BRIDGE FINAL REPORT (VOLUME V) MARCH 2005
A5-38
1776 (228 years ago)
1860 (144 years ago)
1914 (90 years ago)
1963 (31 years ago) 0 10km
Figure 5.4.1 Long-Term River Course Shifting

THE FEASIBILITY STUDY OF PADMA BRIDGE FINAL REPORT (VOLUME V) MARCH 2005
A5-39
(3) Recent River Course Shifting
Figure 5.4.2 shows changes and evolutions of riverbanks, main stream and sand bar (char) during recent years since 1960 with shorter time intervals. From the figure, following behaviors of the Padma River were found:
1) Since 1960, the Padma River at MJ-site has maintained a single channel section with no char. Though the period of data is limited, the Padma River seems to alternate meandering river and straight river courses, having node at the crossing location.
2) The meandering river develops gradually as the main stream upstream from the crossing location moves westward. The development peaks of meandering took place in around 1967 and 1993 when the South Channel got most active.
3) The straight river course appears when the meandering channel becomes inactive or extinct and the straight channel along the less erodible left bank becomes active. The most typical straight river course is found in around 1980.
4) According to the above data, it took about 13 years to change from the peak of meander river (1967) to that of straight river (1980) and took another 13 years to return to the peak of meander river (1993) with a cycle time of 26 years.
5) Along with the alternate process of meandering and straight river courses, riverbanks of the Padma were eroded or sand bars/islands were developed as outlined below.
- 1960-1967: The Padma River upstream from the crossing location gradually activates meandering, eroding right bank and developing sand bar on left side bank.
- 1967-1980: Upstream from the crossing location, former straight channel along the less erodible left bank was activated and became main stream with straight plan form, while the meander channel was gradually buried with sediment.
- 1980-1993: In response to the development of sand bar upstream from Narisha, the main stream started to meander again. Due to the channel meandering toward right bank upstream from the crossing location, left bank downstream from the crossing location was eroded and sandbar developed on the opposite bank (right bank).
- 1993-2003: The left sub-channel along the less erodible bank gradually became active upstream from the crossing location. Until the year around 1997, erosion on the left bank and development of sand bar on the right bank downstream from the crossing location are still active. In around 2000, flow of the straight channel prevails over that of the meander channel and sedimentation on the left bank and erosion on the right bank downstream from the crossing location were started.
- Present: Judging from the findings mentioned above, the Padma River around the crossing location would be in the transition from the meandering to straight river course. Downstream from the crossing location, the right bank erosion and the left bank sedimentation are continuing. This tendency would continue for several years.
6) The Padma River experienced big flood events in 1987, 1988 and 1989. However, significant influences were not identified with regard to the plan-form change by these flood events.

THE FEASIBILITY STUDY OF PADMA BRIDGE FINAL REPORT (VOLUME V) MARCH 2005
A5-40
Bank Line 1960Bank Line 1963Main FlowErosionAccretion
Bank Line 1963Bank Line 1967Main FlowErosionAccretion
Bank Line 1967Bank Line 1973Main FlowErosionAccretion
0 5k
1960 - 1963 (3 years)
1963 - 1967 (4 years)
1967 - 1973 (6 years)
Figure 5.4.2 Recent River Course Shifting (1/4)

THE FEASIBILITY STUDY OF PADMA BRIDGE FINAL REPORT (VOLUME V) MARCH 2005
A5-41
Bank Line 1973Bank Line 1980Main FlowErosionAccretion
Bank Line 1980Bank Line 1984Main FlowErosionAccretion
Bank Line 1984Bank Line 1989Main FlowErosionAccretion
0 5k
1973 - 1980 (7 years)
1980 - 1984 (4 years)
1984 - 1989 (5 years)
Figure 5.4.2 Recent River Course Shifting (2/4)

THE FEASIBILITY STUDY OF PADMA BRIDGE FINAL REPORT (VOLUME V) MARCH 2005
A5-42
Bank Line 1989Bank Line 1993Main FlowErosionAccretion
Bank Line 1993Bank Line 1996Main FlowErosionAccretion
Bank Line 1996Bank Line 1999Main FlowErosionAccretion
0 5k
1989 - 1993 (4 years)
1993 - 1996 (3 years)
1996 - 1999 (3 years)
Figure 5.4.2 Recent River Course Shifting (3/4)

THE FEASIBILITY STUDY OF PADMA BRIDGE FINAL REPORT (VOLUME V) MARCH 2005
A5-43
Bank Line 1999Bank Line 2001Main FlowErosionAccretion
Bank Line 2001Bank Line 2002Main FlowErosionAccretion
0 5k
Bank Line 2002Bank Line 2003Main FlowErosionAccretion
1999 - 2001 (2 years)
2001 - 2002 (1 year)
2002 - 2003 (1 year)
Figure 5.4.2 Recent River Course Shifting (4/4)

THE FEASIBILITY STUDY OF PADMA BRIDGE FINAL REPORT (VOLUME V) MARCH 2005
A5-44
5.4.2 Rate of Riverbank Change
(1) Data and Methodology
In order to estimate the erosion rate of the riverbanks around the crossing location, periodical river survey data by BWDB were studied. Cross sections selected for the study are CS-P2.0 and CS-P2.1 located downstream from the bridge site, and CS-P3.0, CS-P3.1 and CS-P4.0 upstream from the bridge site, for the period of 33 years from 1968/69 to 2000/01. Locations of the selected survey sections are shown in Figure 5.4.3.
Figure 5.4.3 Periodical Survey Sections by BWDB near Crossing Location
Locations of survey stakes were examined and extent of survey and sectional forms of river were checked with maps and satellite images. Then the locations of riverbank were identified and summarized in the following diagrams:
1) Rate of riverbank changes 2) Yearly changes of riverbank
(2) Erosion Rate of Left Bank
For the selected sections, erosion rate of less erodible riverbank was studied. For this purpose locations of left bank (natural levee) regardless of attached bars were identified and shown in Figure 5.4.4 setting the reference year in 1972. From the figure, following are found:
1) Historical change of left riverbank at CS-P3.0 which is most close to the crossing
0 5k
P4.0
P3.1
P3.0
P2.1 P2.0

THE FEASIBILITY STUDY OF PADMA BRIDGE FINAL REPORT (VOLUME V) MARCH 2005
A5-45
location on left bank indicates average erosion rate of 5 m/year for the whole data period, though it is 8 m/year for early 13 years until 1985 and 1.5 m/year for recent 15 years. Judging from the plan forms of the Padma River, the higher erosion rate seems to be caused by collision of meander flow from the South Channel and protrusion of riverbank to straight river flow.
2) The bank erosion at CS-P3.1 located upstream from the crossing location is small. The riverbank at P4.0 did not suffer from erosion during the data period because of the existence of sand bars in front.
3) The bank erosion at CS-P2.1 downstream from the crossing location was large for the period from 1989 to 1993 probably caused by collision of meander flow from the South Channel, though the natural levees are not always distinct for CS-P2.1 and CS-P2.0.
Figure 5.4.5 shows the yearly changes of left riverbank. According to the figure, the maximum amount of erosion during a flood season is more or less 20 m.
-300
-250
-200
-150
-100
-50
0
1972 1977 1982 1987 1992 1997 2002Year
Riv
er
Ban
k Shifting
from
1972 (
m)
(Nega
tive
: Ero
sion)
P4.0
P3.1
P3.0
P2.1
P2.0
Ave. erosion rate: 5 m/yr
Ave. erosion rate: 8 m/yr
Figure 5.4.4 Average Erosion Rate of Left Bank
-140
-120
-100
-80
-60
-40
-20
0
1972 1977 1982 1987 1992 1997 2002
Year
Annual
chan
ge (
m/yr
)
(Nega
tive
: Ero
sion)
P4.0
P3.1
P3.0
P2.1
P2.0
Figure 5.4.5 Yearly Changes of Left Bank
(3) Rate of Right Bank Changes
Existing right bank is formed of recent sediment deposit and is highly vulnerable to erosion. Similarly to the left bank, rate of riverbank changes were studied based on BWDB survey data. CS-P2.0 and CS-P2.1 were used for this study, since other sections upstream from the crossing location are influenced by the evolution of char. Changes of right bank location are shown in Figure 5.4.6 in reference to the riverbank in 1972. Erosion rate of riverbank was markedly high until 1985 showing average annual rate of about 240 m/yr at CS-P2.1. After 1985, the high erosion rate seems to be terminated and the riverbank

THE FEASIBILITY STUDY OF PADMA BRIDGE FINAL REPORT (VOLUME V) MARCH 2005
A5-46
location remains the same, though it fluctuates within the range of about 1000 m.
Figure 5.4.7 shows the yearly changes of right bank, in which negative value shows the erosion from the previous year and positive value the deposit of sediment. According to the figure, yearly erosion amount to as high as 500 m/yr at maximum at CS-P2.1 which is the nearest section to the crossing location on right bank.
-2000
-1000
0
1000
2000
3000
4000
1972 1977 1982 1987 1992 1997 2002
Year
Riv
er
Ban
k Shifting
from
1972 (
m)
(Posi
tive
: ero
sion)
P2.1
P2.0Ave. erosion rate: 240 m/yr.
Figure 5.4.6 Rate of Right Bank Changes
-1000
-800
-600
-400
-200
0
200
400
600
800
1000
1972 1977 1982 1987 1992 1997 2002
Year
Annual
chan
ge (
m/yr
)(N
ega
tive
: ero
sion)
P2.1
P2.0
Figure 5.4.7 Yearly Changes of Right Bank

THE FEASIBILITY STUDY OF PADMA BRIDGE FINAL REPORT (VOLUME V) MARCH 2005
A5-47
5.4.3 Limit of River Course Shifting
The existing left bank composed of geologically older soil layer covered with natural levee is less erodible and can be considered as the left limit of river course shifting.
On the other hand, the existing right bank is formed of young and loose deposit and susceptible to change. However at about 10 km land side from the existing right bank, there exist a boundary of recent active flood plain and high land (old flood plain). The high lands are made up with natural levee eroded by old river movements as shown in Figure 5.4.8.
Figure 5.4.8 Limit of River Course Shifting
Examining the historical bankline changes, the old flood plain on the south-west of the boundary was found not to have experience of erosion due to the main Padma River at least these 90 years since 1914. The boundary can be considered as the right limit of river course shifting.
The Padma River has a long-term tendency to shift toward north-east and is apt to flow aside along the less erodible left bank. The Padma River flows between the left and right limits frequently changing the right bank-line probably due to temporal changes of water and sediment flow of the Padma River.

THE FEASIBILITY STUDY OF PADMA BRIDGE FINAL REPORT (VOLUME V) MARCH 2005
A5-48
5.4.4 Geotechnical Structure of Riverbanks
Geotechnical data were collected and analyzed to clarify the cause of the less erodibility of left bank and its vertical and spatial distribution. The following data were collected and analyzed for the study:
1) Geotechnical investigation conducted for Pre-F/S: 4 boring data on left bank, 3 boring data on right bank and 1 boring data on char downstream from the crossing location.
2) Geotechnical investigation by JICA Study Team for the 1st stage study: 2 boring data each on the left and right banks.
3) Geotechnical investigation by JICA Study Team for bridge and approach road design during the period of 2nd stage study: 1 boring data on right bank, 13 boring data (including 4 boring of 20 m depth) on right bank and 2 boring data on char upstream from the crossing location.
4) Geotechnical investigation by JICA Study Team for mathematical modeling during the period of 2nd stage study: 5 boring data on left bank and 1 boring data on right bank.
Location of these data are shown in Figure 5.4.9. Boring data up to 40 m from the ground were used for the study considering the possible depth influenced by the river flow. According to the riverbank investigation made so far it has been found that the silt and clayey soil play an important role to resist erosion due to river flow. The boring logs were, therefore, simplified classifying into two types of soil materials to show up the characteristics of erodibility as follows:
1) Silt and clayey soil: Regarded relatively resistible against erosion. Soils of Unit-1 layer classified by Pre-F/S and Unit-1a layer classified by our geologist fall under this category. Definitions of Unit-1 and Unit-1a are as follows:
- Unit-1: Variable near-surface deposits ranging from silt of variable clay and sand content to very silty fine sand with occasional layers of silty clay.
- Unit-1a: Clay or silt with fine sand in which silt and clay of 50% or more are contained.
2) Other soil: Soil material other than the above which are regarded susceptible to erosion. The simplified boring logs are shown in Figure 5.4.9. From the figure, following matters are considered:
1) On the left bank, the thickness of the silt and clayey soil cover is 12 m to 25 m for the most part, while on the right bank the thickness of the soil and clayey soil is as thin as 5 m, more or less. The thicker silt and clayey soil layer would be the main reason of less erodibility of the left bank.
2) As for the width of the silt and clayey soil along the left bank, significant differences were not found between the boring log at river bank and that at about 1 km inland. Judging from the borehole data and distribution of natural levee, the width of the less erodible layer along the left bank would be more than 1 km, though further investigations are necessary to obtain the spatial distribution definitely.

THE FEASIBILITY STUDY OF PADMA BRIDGE FINAL REPORT (VOLUME V) MARCH 2005
A5-49
(Note) Boring logs are plotted for 40m long from the surface
Figure 5.4.9 Geotechnical Conditions of Riverbanks
0 5km
Legend Borehole location Silt and clayey soil (Unit1a or Unit1) Other type of soil

THE FEASIBILITY STUDY OF PADMA BRIDGE FINAL REPORT (VOLUME V) MARCH 2005
A5-50
5.5 ESTIMATION OF MAXIMUM SCOUR DEPTH
The maximum scour depth necessary for the design of river and bridge facilities was estimated specifically for Mawa-Janjira site (MJ-site) finally selected for the crossing of Padma Bridge.
5.5.1 Methodology
(1) Types of Riverbed Scour
Various types of riverbed scours are conceivable for estimation of scour depth around the structures related to bridge and river training works as follows:
Natural Scour:
1) Long-term degradation 2) Bend scour 3) Confluence scour 4) Scour due to bed-form Structure-induced Scour:
5) Constriction scour 6) Scour around bank protection works 7) Scour around bridge pier The maximum scour depth was worked out combining the component riverbed scour listed above, and the scour depth of each component was estimated mainly referring to the following data:
1) Guidelines and Design Manual for Standardized Bank Protection Structures; Bank Protection Pilot Project FAP-21, December 2001; WARPO (FAP-21 Manual)
2) Padma Bridge Study; Phase 1: Pre-feasibility Report, February 2000; JMBA (Padma Pre-F/S Report)
3) Scouring; IAHR Hydraulic Structures Design Manual, 1991; H.N.C. Breusers and A.J. Raudkivi
4) Study on Bridge Problems Relevant to Flood Mitigation (Japanese version); Public Work Research Institute Data #3225 November 1993; T. Uda et al
Further explanations for each component riverbed scour are given below in brief.
(2) Long-Term Degradation
Lowering due to long-term degradation occurs because of decrease in sediment supply from the upstream reaches or increase in river discharge.
Trend of Long-term Riverbed Changes
According to Study Report of FAP-24, the Jamuna and Ganges rivers have a trend of aggradations with an annual sedimentation rate of 0.01 m/year. Riverbed of the Padma, located downstream from the confluence of both rivers, may also have rising tendency due to long-term morphological development.
Therefore, the long-term degradation is not necessary to be considered as far as the maximum scour depth is concerned.

THE FEASIBILITY STUDY OF PADMA BRIDGE FINAL REPORT (VOLUME V) MARCH 2005
A5-51
Bifurcation of Arialkhan River in Future
Just upstream of MJ-site, the Arialkhan River bifurcates. The Arialkhan River was a main stream of the Padma River until about 150 years ago and now conveys about 10 percent of floodwater of the main Padma River. Considering geomorphologic evolution of the river at MJ-site, no one can deny the complete closure of the Arialkhan River in future temporarily or permanently. The complete closure of the Arialkhan would bring about the increase of river discharge and lowering of riverbed at JM-site.
In view of this, the maximum scour depth was estimated for the following two cases:
1) Case 1: Under present conditions of the Arialkhan River (Present Arialkhan R.) 2) Case 2: Under assumed conditions of complete closure of the Arialkhan River (Closed
Arialkhan R.)
(3) Bend Scour
Riverbed is scoured in general at the outer side and raised at the inner side of the channel bend. The bend scour can occur at any part of river section.
The scour depth at bend can be calculated by the empirical formula by Thorne.
hs /hm = 2.07 – 0.19 log (rc /B – 1.5)
where,
hs : Total water depth at thalweg below Design High Water Level (DHWL) hm : Mean water depth below DHWL B : Channel width rc : Radius of channel bend centerline
Assuming rc = 2.5 x B under which the largest scour would occur, the above formula is expressed simply as;
hs = hm + ys-bend = 2.07 x hm,, or ys-bend = 1.07 x hm
where,
ys-bend : Scour depth at bend defined as the difference between hs and hm .
(4) Confluence Scour
Confluence scour occurs where two channels meet, namely the main Padma River and the south channel an anabranch behind Char Kawrakandi.
The FAP-21 Manual proposes following empirical relation to calculate confluence scour in line with the approach by Klaassen and Vermeer as follows:
ys-confl = hSLW (0.292 + 0.037 φ)
where,
ys-confl : Confluence scour (m) hSLW : Upstream water depth below SLW (m) φ : Angle of incidence of anabranches (degree). It is recommended to use a

THE FEASIBILITY STUDY OF PADMA BRIDGE FINAL REPORT (VOLUME V) MARCH 2005
A5-52
representative value of 45° for channels wider than 1 km and 70° for channels narrower than 1 km.
Assuming φ = 45° for the Padma River at MJ-site;
ys-confl = 1.957 x hSLW
(5) Scour due to Bed-form
According to the result of our study on sediment flow of MJ-site, it was confirmed that the sediment was transported in the flat bed conditions during flood flow period. The scour due to bed-form was not taken into account for the estimation of the maximum scour depth.
(6) Constriction Scour
If the river section at the crossing location is constricted to reduce the bridge length, the concentration of flow at the constriction would bring about an increase in flow depth. The increase in flow depth is defined as constriction scour.
Since river training works proposed for Padma Bridge intend to maintain existing river and flow conditions giving less impact to the river, existing river channel would not be constricted and the flood water in flood plain would not be influenced significantly by the approach roads. Therefore, the constriction scour was not considered for the estimation of the maximum scour depth.
(7) Scour around Bank Protection Works
Scour around Groynes
Around the permeable groynes various scour phenomena take place, i.e., scour downstream from the tip of groyne, scours around the groyne piles, scour upstream from the groyne due to protrusion. Among these, scour downstream from the tip of groyne is most important for the design of the structure.
FAP-21 Manual proposes to calculate the scour depth behind the tip of the groyne by the following empirical relation based on the formula of Ahmad:
hi + ys-groyne = K {hi · ui · B/(B - b)}2/3
where,
ys-groyne : Maximum scour depth at the tip of groyne (m) hi : Water depth upstream from scour hole (m) ui : Upstream depth-averaged flow velocity (m/s) Β : Channel width upstream of the groyne (m) b : Protrusion length (m) K : Empirical coefficient (m-1/3 S2/3)
K = (K for groyne) · (K for bed protection) · (K for floating debris) K for groyne Impermeable : K = 2.4 Permeability 50% : K = 1.6 to 2.0 Permeability 60% : K = 1.5 to 1.8 Permeability 70% : K = 1.4 to 1.6 Permeability 80% : K = 1.2 to 1.3

THE FEASIBILITY STUDY OF PADMA BRIDGE FINAL REPORT (VOLUME V) MARCH 2005
A5-53
K for bed protection: Without bed protection: K = 1.0 With bed protection: K = 1.1 K for floating debris: Without floating debris: K = 1.0 Floating debris ≤ 1 m in thickness: K = 1.2 Floating debris > 1 m in thickness: K = 1.3
The formula can be simplified as follows:
ys-groyne = K (hi · ui )2/3 - hi
For the standardized groynes proposed by FAP-21 Manual, permeability at the tip of groyne is 80%. Then, K-value was assumed to be 1.3 under the conditions without bed protection and floating debris.
Scour around Revetment Works
The local scour induced by revetment works can be treated as the local scour at the abrupt transition at the tip of impermeable structure in combination with bed protection. The FAP-21 Manual recommends to use Ahmad’s formula for this case, too.
As to K-value, the following is recommended by the Manual:
K = 2.4 (impermeable) x 1.1 (bed protection) = 2.6
The above K-value would be considered as that for vertical wall. It is generally known that the scour depth at the foot of revetment reduces as revetment slope becomes milder. According to the result of additional model test for FAP-21/22 (Technical Report No.5, Mar. 1996), scour depth for vertical wall would reduce as follows depending on the revetment slope:
Slope Scour depth Ratio to Vertical Vertical 1V : 1H 1V : 3H 1V : 4H
15.5 m 13.3 m 9.1 m 7.1 m
1.00 0.86 0.59 0.46
Revetment and guide bund works proposed for Padma Bridge are designed as a composite work of slope pavement, launching apron, and falling apron works. The revetment slope will be formed naturally by the river flow. For the estimation of the maximum scour depth at the foot of revetment, following K-value was used, assuming overall revetment slope as 1V : 3H:
K = 2.6 x 0.59 = 1.6
As a summary, the scour depth at the foot of revetment works including guide bund works can be calculated using following equation:
ys-revet = K (hi · ui) 2/3 - hi
where,
ys-revet : Maximum scour depth at the foot of revetment (m) hi : Water depth upstream from scour hole (m) ui : Upstream depth-averaged flow velocity (m/s)

THE FEASIBILITY STUDY OF PADMA BRIDGE FINAL REPORT (VOLUME V) MARCH 2005
A5-54
K : Empirical coefficient (m-1/3 S2/3) K = 2.6 for vertical wall K = 1.6 for revetment and guide bund works
(8) Scour around Bridge Pier
Local scour around cylindrical bridge pier was estimated using the following empirical formula:
ys-pier = K x D
where,
ys-pier : Scour depth around pier D : Diameter of cylindrical bridge pier K : Empirical coefficient, assumed to be K = 1.8 for single cylindrical pile
pier.
Scour around Group Piles
In case bridge pier consists of plural piles, scour depth around the pile may be influenced by adjacent piles each other. The K-value to yield maximum scour depth should be adjusted as follows:
K = Ks x Kg-long x Kg-lat
where,
K : Composite K-value for estimation of maximum scour depth around group pile pier
Ks : Empirical coefficient for single pile pier (= 1.8) Kg-long : Adjustment factor for the influence of group piles placed longitudinally Kg-lat : Adjustment factor for the influence of group piles placed in lateral
As to the scour around pile group, empirical diagrams are available investigated by Hannah as shown in Figure 5.5.1. Maximum scour around group pile pier can be estimated in the following procedures:
1) To get ratios Slong/D and Slat/D, where Slong and Slat are spacing of longitudinal and lateral pile at original riverbed, and D is pile diameter.
2) To find adjustment factors Kg-long and Kg-lat using empirical diagram shown in Figure 5.5.1 for Slong/D and Slat/D.
3) To calculate scour depth as follows: ys-gpier = Ks x Kg-long x Kg-lat x D

THE FEASIBILITY STUDY OF PADMA BRIDGE FINAL REPORT (VOLUME V) MARCH 2005
A5-55
Scour Depths for Two Piles in Line as a Function of Pile Spacing
Scour Depths for Two Piles as a Function of Pile Spacing
Note: Solid lines: transverse piles, Dashed lines: Angle of attack 45° (Source: Scouring, H.N.C.Breusers, A.J.Raudkivi; IAHR/AIRH, 1991)
Figure 5.5.1 Empirical Relation Showing Influence of Pile Group

THE FEASIBILITY STUDY OF PADMA BRIDGE FINAL REPORT (VOLUME V) MARCH 2005
A5-56
5.5.2 Component Scour Depth
(1) Fundamental Setup
FAP-21 Manual presents regime relations of the Padma River section at the bank-full flow conditions as follows:
hmb = 0.28 x Qb0.30
B = 4.76 x Qb0.62
where
hmb : Average water depth below bank elevation (m) B : Channel width between the banklines at bank elevation (m) Qb : Bankfull discharge (m3/s)
The above relation was derived based on the survey sections of BWDB by FAP-24 study (Special Report No.7: River Survey Project, Delft Hydraulics and DHI).
The bankfull discharge (Qb) and other hydraulic parameters necessary for the estimation of scour depth was estimated by the following equation, applying the regime relations to Manning’s uniform flow formula:
Qd = Bhm5/3 I1/2/n = (I1/2/n) x 4.76Qb
0.62 x (0.28 Qb0.30 + dh)5/3
where
Qd : Design discharge (m3/s) Qb : Bankfull discharge (m3/s) hm : Average water depth below design high water level (DHWL) dh : Difference between DHWL and bank elevation (BEL) I : Channel slope (I = 1/15,800) n : Manning’s coefficient of roughness (n=0.015)
Hydraulic parameters calculated for the study cases are shown in Table 5.5.1 together with other fundamental parameters necessary for the estimation of the scour depth.
(2) Calculation of Scour Depth
The following types of scour depth were calculated according to the methodology mentioned above.
1) Natural scour: - Bend scour - Confluence scour
2) Structure-induced scour: - Scour around groyne - Scour around revetment - Scour around bridge pier
Results of calculation are shown in Table 5.5.1. In estimating the scour depths, following arrangements were made:
1) Natural scour was estimated as a total scour of bend and confluence scours that could

THE FEASIBILITY STUDY OF PADMA BRIDGE FINAL REPORT (VOLUME V) MARCH 2005
A5-57
occur at the same time for the worst. 2) Structure-induced scour was calculated under the flow conditions of natural scour. 3) The scour depth (ys) is further divided into normal scour (yn) and incremental scour
(ys’), i.e.; ys = yn + ys’ The total water depth (hs) subject to plural types of scours is estimated as follows: hs = hm + yn + ∑ys’ 4) The normal scour is defined as the difference between the maximum water depth and
average water depth of the river section under the straight and normal flow conditions not subject to specific scours mentioned earlier. The normal scour (yn) was assumed as
yn = 0.25 hm taking the lowest ratio of the maximum water depth and the average water depth based
on the periodical survey sections of BWDB.
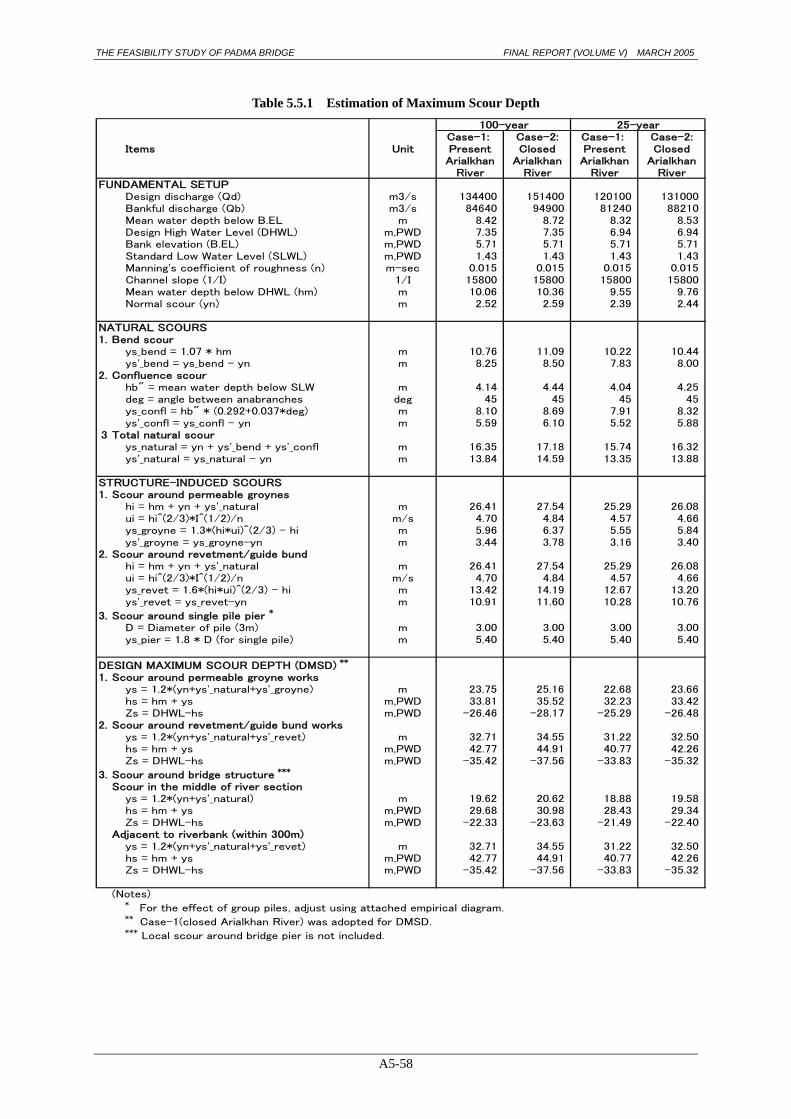
THE FEASIBILITY STUDY OF PADMA BRIDGE FINAL REPORT (VOLUME V) MARCH 2005
A5-58
Table 5.5.1 Estimation of Maximum Scour Depth 100-year 25-year
Case-1: Case-2: Case-1: Case-2:Items Unit Present
ArialkhanRiver
ClosedArialkhan
River
PresentArialkhan
River
ClosedArialkhan
RiverFUNDAMENTAL SETUP
Design discharge (Qd) m3/s 134400 151400 120100 131000Bankful discharge (Qb) m3/s 84640 94900 81240 88210Mean water depth below B.EL m 8.42 8.72 8.32 8.53Design High Water Level (DHWL) m,PWD 7.35 7.35 6.94 6.94Bank elevation (B.EL) m,PWD 5.71 5.71 5.71 5.71Standard Low Water Level (SLWL) m,PWD 1.43 1.43 1.43 1.43Manning's coefficient of roughness (n) m-sec 0.015 0.015 0.015 0.015Channel slope (1/I) 1/I 15800 15800 15800 15800Mean water depth below DHWL (hm) m 10.06 10.36 9.55 9.76Normal scour (yn) m 2.52 2.59 2.39 2.44
NATURAL SCOURS1. Bend scour
ys_bend = 1.07 * hm m 10.76 11.09 10.22 10.44ys'_bend = ys_bend - yn m 8.25 8.50 7.83 8.00
2. Confluence scourhb" = mean water depth below SLW m 4.14 4.44 4.04 4.25deg = angle between anabranches deg 45 45 45 45ys_confl = hb" * (0.292+0.037*deg) m 8.10 8.69 7.91 8.32ys'_confl = ys_confl - yn m 5.59 6.10 5.52 5.88
3 Total natural scourys_natural = yn + ys'_bend + ys'_confl m 16.35 17.18 15.74 16.32ys'_natural = ys_natural - yn m 13.84 14.59 13.35 13.88
STRUCTURE-INDUCED SCOURS1. Scour around permeable groynes
hi = hm + yn + ys'_natural m 26.41 27.54 25.29 26.08ui = hi^(2/3)*I^(1/2)/n m/s 4.70 4.84 4.57 4.66ys_groyne = 1.3*(hi*ui)^(2/3) - hi m 5.96 6.37 5.55 5.84ys'_groyne = ys_groyne-yn m 3.44 3.78 3.16 3.40
2. Scour around revetment/guide bundhi = hm + yn + ys'_natural m 26.41 27.54 25.29 26.08ui = hi^(2/3)*I^(1/2)/n m/s 4.70 4.84 4.57 4.66ys_revet = 1.6*(hi*ui)^(2/3) - hi m 13.42 14.19 12.67 13.20ys'_revet = ys_revet-yn m 10.91 11.60 10.28 10.76
3. Scour around single pile pier *
D = Diameter of pile (3m) m 3.00 3.00 3.00 3.00ys_pier = 1.8 * D (for single pile) m 5.40 5.40 5.40 5.40
DESIGN MAXIMUM SCOUR DEPTH (DMSD) **
1. Scour around permeable groyne worksys = 1.2*(yn+ys'_natural+ys'_groyne) m 23.75 25.16 22.68 23.66hs = hm + ys m,PWD 33.81 35.52 32.23 33.42Zs = DHWL-hs m,PWD -26.46 -28.17 -25.29 -26.48
2. Scour around revetment/guide bund worksys = 1.2*(yn+ys'_natural+ys'_revet) m 32.71 34.55 31.22 32.50hs = hm + ys m,PWD 42.77 44.91 40.77 42.26Zs = DHWL-hs m,PWD -35.42 -37.56 -33.83 -35.32
3. Scour around bridge structure ***
Scour in the middle of river sectionys = 1.2*(yn+ys'_natural) m 19.62 20.62 18.88 19.58hs = hm + ys m,PWD 29.68 30.98 28.43 29.34Zs = DHWL-hs m,PWD -22.33 -23.63 -21.49 -22.40
Adjacent to riverbank (within 300m)ys = 1.2*(yn+ys'_natural+ys'_revet) m 32.71 34.55 31.22 32.50hs = hm + ys m,PWD 42.77 44.91 40.77 42.26Zs = DHWL-hs m,PWD -35.42 -37.56 -33.83 -35.32
(Notes)* For the effect of group piles, adjust using attached empirical diagram.** Case-1(closed Arialkhan River) was adopted for DMSD.*** Local scour around bridge pier is not included.

THE FEASIBILITY STUDY OF PADMA BRIDGE FINAL REPORT (VOLUME V) MARCH 2005
A5-59
5.5.3 Design Maximum Scour Depth
Assuming the worst combination of the relevant types of scour, total maximum scour depth was calculated.
In order to account for extra scour which may be induced by unforeseen behavior of river channel and compound influence of the structures, the total scour shall be multiplied by a factor of 1.20 to determine design maximum scour depth (DMSD).
Adopting the case of closed Arialkhan River, DMSD was decided for 100- and 25-year flood as shown below. In the table below:
hs : Total scoured water depth below DHWL Zs : Elevation of scoured riverbed
(1) DMSD for Permeable Groyne
(100-yr.) ( 25-yr) hs = hm + ys Zs = DHWL - hs
35.5 m -28.2 m,PWD
33.4m -26.5 m,PWD
(2) DMSD for Revetment/Guide Bund
(100-yr.) ( 25-yr) hs = hm + ys Zs = DHWL - hs
44.9 m -37.6 m,PWD
42.3 m -35.3 m,PWD
(3) DMSD for Bridge Structure: Scour around bridge pier is not included
In the middle of river section
(100-yr.) hs = hm + ys Zs = DHWL - hs
31.0 m -23.6 m,PWD
Adjacent to riverbank (within 300 from riverbank)
(100-yr.) hs = hm + ys Zs = DHWL - hs
44.9 m -37.6 m,PWD

THE FEASIBILITY STUDY OF PADMA BRIDGE FINAL REPORT (VOLUME V) MARCH 2005
A5-60
5.5.4 Comparison with Historical Riverbed Records
Design maximum scour depth (DMSD) estimated in the previous Subsection was compared with the historical lower bed around the crossing location. The historical riverbed scours and their characteristics of seasonal changes are shown below. From these data, proposed DMSD is deemed appropriate.
(1) Historical Riverbed Scour
Figure 5.5.2 shows historical river sections periodically surveyed by BWDB at CS-P2.0, CS-P2.1, CS-P3.0, CS-P3.1 and CS-P4.0 that are located in the neighboring river reaches of the crossing location (see Figure 4.2.3 for their locations). These river sections were surveyed mainly during low water season and are available for a period of 35 years from 1968 including some lack of survey. The lowest riverbeds surveyed at each section are shown in Figure 5.5.3 and in Table 5.5.2.
Table 5.5.2 Lowest Riverbed Surveyed Periodically by BWDB CS-P2.0 CS-P2.1 CS-P3.0 CS-P3.1 CS-P4.0
Yr. M.Lowest
bed(m,PWD)
Yr. M.Lowest
bed(m,PWD)
Yr. M.Lowest
bed(m,PWD)
Yr. M.Lowest
bed(m,PWD)
Yr. M.Lowest
bed(m,PWD)
1968/69 1969 1 -14.11 1968 12 -14.39 1968 12 -17.60 1969 1 -14.13 1968 12 -10.191969/70 1970 1 -13.68 1970 1 -10.56 1970 1 -37.01 1970 1 -14.59 1970 1 -7.871970/71 1971 2 -9.80 1971 2 -10.89 1971 2 -25.24 1971 2 -10.90 1971 2 -7.231971/72 1972 5 -7.62 1972 5 -10.24 1972 5 -23.28 1972 5 -9.49 1972 5 -7.161972/73 1973 3 -9.47 1973 3 -12.68 1973 3 -15.50 1973 3 -13.53 1973 3 -9.551973/74 1974 2 -13.16 1974 2 -15.09 1974 2 -18.84 1974 2 -10.00 1974 2 -10.821974/75 1975 4 -8.52 1975 4 -13.21 1975 4 -17.84 1975 4 -14.47 1975 4 -13.431975/76 1976 2 -7.02 1976 2 -9.17 1976 2 -22.07 1976 2 -7.05 1976 2 -8.361976/77 1977 4 -6.80 1977 4 -12.54 1977 4 -15.79 1977 4 -8.84 1977 4 -6.551977/78 1978 2 -8.31 1978 2 -14.28 1978 2 -12.31 1978 2 -7.82 1978 2 -5.771978/79 - - - - - - - - - - - - - - - 1979/80 - - - 1979 12 -9.83 1979 12 -13.63 - - - 1979 12 -7.791980/81 1981 2 -9.78 1981 2 -12.05 1981 2 -20.20 1981 2 -11.22 1981 2 -10.361981/82 1982 4 -9.33 1982 3 -10.21 1982 3 -12.54 1982 4 -10.60 1982 3 -11.691982/83 - - - - - - - - - - - - - - - 1983/84 1984 4 -15.63 1984 3 -14.42 1984 3 -24.81 1984 4 -22.91 1984 3 -13.871984/85 1985 2 -9.37 1985 1 -10.18 1985 1 -31.73 1985 2 -19.59 1985 1 -12.911985/86 - - - - - - - - - - - - - - - 1986/87 1987 4 -10.75 - - - - - - 1987 4 -6.78 - - - 1987/88 - - - - - - - - - - - - - - - 1988/89 1989 5 -14.79 1989 5 -5.13 1989 5 -13.76 1989 5 -13.37 1989 5 -7.521989/90 - - - - - - - - - - - - - - - 1990/91 - - - - - - - - - - - - - - - 1991/92 - - - - - - - - - - - - - - - 1992/93 1993 3 -16.16 1993 1 -21.74 1993 1 -12.39 1993 3 -16.90 1993 1 -9.191993/94 1994 1 -25.00 1994 1 -28.31 1994 1 -9.20 1994 1 -7.47 1994 1 -14.501994/95 1995 3 -10.06 - - - - - - 1995 3 -11.51 - - -1995/96 1995 10 -4.70 1995 10 -4.94 1995 10 -4.94
1996 3 -13.57 1996 3 -15.46 1996 3 -11.48 1996 3 -11.89 1996 3 -14.011996/97 1997 1 -16.99 1997 3 -21.66 1997 3 -8.62 1997 1 -8.71 1997 3 -10.951997/98 1998 3 -14.51 1998 3 -15.09 1998 3 -12.93 1998 3 -3.86 1998 3 -6.431998/99 - - - 1999 7 -14.10 1999 7 -9.76 - - - 1999 7 -6.421999/00 1999 11 -15.21 2000 3 -12.50 2000 3 -13.20 1999 11 -7.67 2000 3 -6.60
2000 3 -12.842000/01 2001 2 -10.35
(NOTE) 1) Yr: Year starting from September to August next year(e.g., 1968/69: Sep. 1968 to Aug. 1969); Mn: month2) Riverbed elevation shown in box indicates deep scour lower than -20.0 m,PWD
Year1)

THE FEASIBILITY STUDY OF PADMA BRIDGE FINAL REPORT (VOLUME V) MARCH 2005
A5-61
SECTION-P2.0 (1969 - 2000)
-40
-35
-30
-25
-20
-15
-10
-5
0
5
10
0 1000 2000 3000 4000 5000 6000 7000 8000 9000 10000 11000 12000 13000
Ele
vatio
n ((
m P
WD
)
SECTION-P2.1 (1968 - 2000)
-40
-35
-30
-25
-20
-15
-10
-5
0
5
10
0 1000 2000 3000 4000 5000 6000 7000 8000 9000 10000 11000 12000 13000
Ele
vatio
n ((
m P
WD
)
SECTION-P3.0 (1968 - 2000)
-40
-35
-30
-25
-20
-15
-10
-5
0
5
10
0 1000 2000 3000 4000 5000 6000 7000 8000 9000 10000 11000 12000 13000
Ele
vatio
n ((
m P
WD
)
SECTION-P3.1 (1969 - 1999)
-40
-35
-30
-25
-20
-15
-10
-5
0
5
10
0 1000 2000 3000 4000 5000 6000 7000 8000 9000 10000 11000 12000 13000
Ele
vatio
n ((
m P
WD
)
SECTION-P4.0 (1968 - 2000)
-40
-35
-30
-25
-20
-15
-10
-5
0
5
10
0 1000 2000 3000 4000 5000 6000 7000 8000 9000 10000 11000 12000 13000
Distance from Left Bank (m)
Ele
vatio
n ((m
PW
D)
Figure 5.5.2 Historical River-Section Surveyed by BWDB

THE FEASIBILITY STUDY OF PADMA BRIDGE FINAL REPORT (VOLUME V) MARCH 2005
A5-62
SECTION-P2.0 (1969-2000)
-40
-35
-30
-25
-20
-15
-10
-5
0
5
10
1965 1970 1975 1980 1985 1990 1995 2000 2005
Low
est r
iver
bed
(m,P
WD
)
SECTION-P2.1 (1968-2000)
-40
-35
-30
-25
-20
-15
-10
-5
0
5
10
1965 1970 1975 1980 1985 1990 1995 2000 2005
Low
est r
iver
bed
(m,P
WD
)
SECTION-P3.0 (1968-2000)
-40
-35
-30
-25
-20
-15
-10
-5
0
5
10
1965 1970 1975 1980 1985 1990 1995 2000 2005
Low
est r
iver
bed
(m,P
WD
)
SECTION-P3.1 (1969-1999)
-40
-35
-30
-25
-20
-15
-10
-5
0
5
10
1965 1970 1975 1980 1985 1990 1995 2000 2005
Low
est r
iver
bed
(m,P
WD
)
SECTION-P4.0 (1968-2000)
-40
-35
-30
-25
-20
-15
-10
-5
0
5
10
1965 1970 1975 1980 1985 1990 1995 2000 2005
Year / month
Low
est r
iver
bed
(m,P
WD
)
Figure 5.5.3 Historical Lowest Riverbed Surveyed by BWDB

THE FEASIBILITY STUDY OF PADMA BRIDGE FINAL REPORT (VOLUME V) MARCH 2005
A5-63
According to the Table, deep riverbed scours lower than -20 m,PWD were extracted and shown below. The recorded lowest riverbed was -37.01 m,PWD in 1970 followed by -31.73 m,PWD in 1985 both at CS-P3.0.
Section
Year Month
Depth
(m,PWD)
Scoured place Estimated
Main cause
CS-P2.0
1994 Jan.
-25.00
Left bank
Bend/flow attack
CS-P2.1
1993 Jan.
1994 Jan.
1997 Mar.
-21.74
-28.31
-21.66
Left bank
Left bank
River center
Bend/flow attack
Bend/flow attack
Bend/flow attack, confluence
CS-P3.0
1970 Jan.
1971 Feb.
1972 May
1976 Feb.
1981 Feb.
1984 Mar.
1985 Jan.
-37.01
-25.24
-23.28
-22.07
-20.20
-24.81
-31.73
Left bank
Left bank
River center
River center
Left bank
Left bank
Left bank
Bend/flow attack
Bend/flow attack
Bend/flow attack, confluence
Bank protrusion, confluence
Bank protrusion, confluence
Bank protrusion, confluence
Bank protrusion, confluence
CS-P3.1
1984 Apr.
-22.91
Left bank
Bend/flow attack
CS-P4.0 (None) - -
The deep scours took place mostly near the left bank and some in the river center. Judging from plan-form of river and stream flow lines shown in the satellite images, main causes of scours at the foot of left bank are due to bend or flow attack to less erodible bank of the South Channel and protrusion of riverbank near Mawa Ghat. Some deep scours in the river center are deemed to be caused by flow turbulence due to confluence of channels downstream from the char.

THE FEASIBILITY STUDY OF PADMA BRIDGE FINAL REPORT (VOLUME V) MARCH 2005
A5-64
(2) Seasonal Changes in Riverbed
The historical riverbed sections discussed above were surveyed mostly during low-water season. It should be noted that the lowest riverbed does not always occur during flood season. The following data show the fact that the lowest riverbeds in low-water season were lower than those in flood season:
1) The lowest riverbed data surveyed at CS-P2.1 in low-water season were compared with corresponding lowest riverbeds surveyed in flood season at Mawa discharge measurement station as shown in Figure 5.5.4. The discharge measurements are carried out only in flood season and the section is located about 2 km upstream of CS-P2.1. The figure indicates that the lowest riverbeds of low-water season are lower than those of flood season, probably due to bed-form change.
-30
-25
-20
-15
-10
-5
0
01/04/1996 01/04/1997 01/04/1998 01/04/1999 01/04/2000 01/04/2001 01/04/2002
Ele
vation
(m
,PW
D)
Discharge measurement data
Periodical survey data
Figure 5.5.4 Lowest Riverbeds by Periodical Survey and Discharge Measurement
2) The similar tendency was found in BWDB survey data in 1995/96 at CS-P2.1, P3.0 and P4.0 (see Table 5.5.2 and Figure 5.5.5). In this low-water season, two surveys were conducted, i.e., in October 1995 just after the flood season and in March 1996 just before the start of rainy season. The lowest riverbeds surveyed just before the start of rainy season are lower than those surveyed just after the flood season, even though the river did not experience major flood flows between two surveys. The riverbeds just after the flood season (the October section) are flatter as a whole.
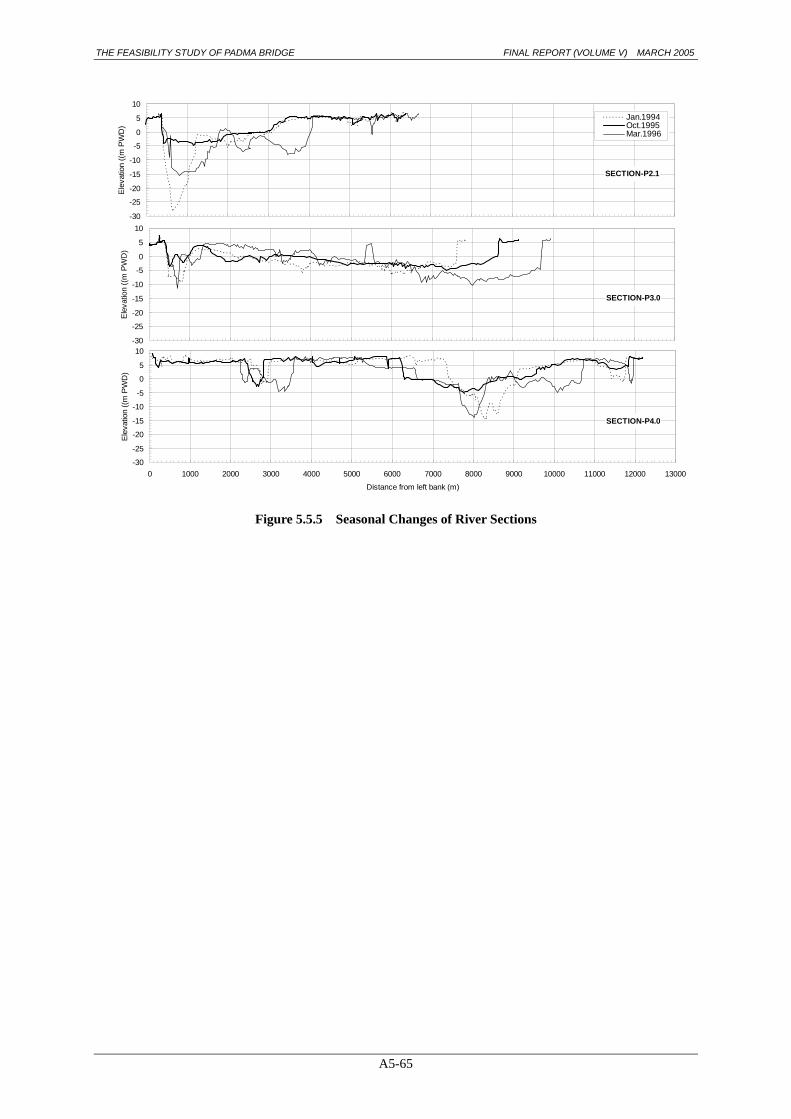
THE FEASIBILITY STUDY OF PADMA BRIDGE FINAL REPORT (VOLUME V) MARCH 2005
A5-65
SECTION-P2.1
-30
-25
-20
-15
-10
-5
0
5
10
0 1000 2000 3000 4000 5000 6000 7000 8000 9000 10000 11000 12000 13000
Ele
vatio
n ((
m P
WD
)Jan.1994Oct.1995Mar.1996
SECTION-P3.0
-30
-25
-20
-15
-10
-5
0
5
10
0 1000 2000 3000 4000 5000 6000 7000 8000 9000 10000 11000 12000 13000
Ele
vatio
n ((
m P
WD
)
SECTION-P4.0
-30
-25
-20
-15
-10
-5
0
5
10
0 1000 2000 3000 4000 5000 6000 7000 8000 9000 10000 11000 12000 13000
Distance from left bank (m)
Elev
atio
n ((
m P
WD
)
Figure 5.5.5 Seasonal Changes of River Sections