“a rolling loan gathers no loss” - advisor perspectives...dec 10, 2019 · advisor use only...
TRANSCRIPT

333 S. Grand Ave., 18th Floor || Los Angeles, CA 90071 || (213) 633‐8200
Live Webcast hosted by:
Jeffrey GundlachChief Executive Officer
Andrew HsuPortfolio Manager
December 10, 2019
“A Rolling Loan Gathers No Loss”

112‐10‐19 Total Return Webcast
Fund Offerings
The Funds’ investment objectives, risks, charges and expenses must be considered carefully before investing. The statutoryprospectus and summary prospectus (if available) contains this and other important information about the Funds, and itmay be obtained by calling (877) 354‐6311/ (877) DLINE11, or visiting www.doublelinefunds.com. Read it carefully beforeinvesting.Mutual fund investing involves risk; Principal loss is possible. Investments in debt securities typically decrease in value when interest rates rise. This risk is usually greater for longer‐term debt securities. Investments inAsset‐Backed and Mortgage‐Backed Securities include additional risks that investors should be aware of such as credit risk, prepayment risk, possible illiquidity and default, as well as increased susceptibility to adverseeconomic developments. Investments in lower‐rated and non‐rated securities present a greater risk of loss to principal and interest than higher‐rated securities. The Fund may use certain types of investment derivatives.Derivatives involve risks different from, and in certain cases, greater than the risks presented by higher‐rate securities. The DoubleLine Total Return Bond Fund intends to invest more than 50% of its net assets in mortgage‐backed securities of any maturity or type. The Fund therefore, potentially is more likely to react to any volatility or changes in the mortgage‐backed securities marketplace.
Diversification does not assure a profit, nor does it protect against a loss in a declining market.
Opinions expressed are subject to change at any time, are not forecasts and should not be considered investment advice.
DoubleLine Funds are distributed by Quasar Distributors, LLC.
While the Funds are no‐load, management fees and other expenses still apply. Please refer to the prospectus for further details.
Fund holdings and sector allocations are subject to change and are not recommendations to buy or sell any security.
Total Return Bond FundRetail and Institutional ClassNo Load Mutual Fund
Retail InstitutionalN‐share I‐share
Ticker DLTNX DBLTXMin Investment $2,000 $100,000 Min IRA Investment $500 $5,000 Gross Expense Ratio 0.73% 0.48%

212‐10‐19 Total Return Webcast
DoubleLine Total Return Bond Fund PerformanceAs of September 30, 2019
Benchmark: Bloomberg Barclays U.S. Aggregate Index. This index represents securities that are SEC‐registered, taxable, and dollar denominated. The index covers the US investment grade fixed rate bond market, withindex components for government and corporate securities, mortgage pass‐through securities, and asset‐backed securities. These major sectors are subdivided into more specific indices that are calculated and reportedon a regular basis. It is not possible to invest directly in an index.
Performance data quoted represents past performance; past performance does not guarantee future results. The investment return and principal value of an investmentwill fluctuate so that an investor's shares, when redeemed, may be worth more or less than the original cost. Current performance of the fund may be lower or higher thanthe performance quoted. Performance data current to the most recent month‐end may be obtained by calling 213‐633‐8200 or by visiting www.doublelinefunds.com.
Fund Performance
* If a Fund invested in an affiliate Fund sponsored by theAdviser during the period covered by this report theAdviser agreed to not charge a management fee to theFund in an amount equal to the investment advisory feespaid by the affiliated Fund in respect of the Fund’sinvestment in the affiliated fund to avoid duplicatecharge of the investment advisory fees to the investors.
Month‐End Returns September 30, 2019
Annualized
1‐Yr Std DeviationSep YTD 1‐Year 3‐Year 5‐YearSince Inception
4/6/2010 – 9/30/2019I‐share ‐0.35% 6.02% 7.87% 3.20% 3.48% 6.02% 2.58%N‐share ‐0.28% 5.93% 7.71% 2.98% 3.25% 5.77% 2.55% Benchmark ‐0.53% 8.52% 10.30% 2.92% 3.38% 3.80% 3.73%
Quarter‐End ReturnsSeptember 30, 2019
Annualized
3Q19 YTD 1‐Year 3‐Year 5‐YearSince Inception
4/6/2010 – 9/30/2019I‐share 1.58% 6.02% 7.87% 3.20% 3.48% 6.02% N‐share 1.61% 5.93% 7.71% 2.98% 3.25% 5.77% Benchmark 2.27% 8.52% 10.30% 2.92% 3.38% 3.80% Calendar Year Returns 2018 2017 2016 2015 2014 I‐share 1.75% 3.79% 2.16% 2.32% 6.73%N‐share 1.49% 3.44% 1.91% 2.07% 6.47% Benchmark 0.01% 3.54% 2.65% 0.55% 5.97%
SEC 30‐Day Yield I‐Share N‐ShareGross 3.52% 3.28%Net* 3.52% 3.28%

312‐10‐19 Total Return Webcast
Webcast Announcements
2020 Webcast Schedule available on www.doublelinefunds.com
Jeffrey Gundlach’s “Just Markets” Webcast – January 7, 2020 Jeffrey Gundlach will discuss his outlook on the economy and marketsGo to www.doubleline.com, Home page under “Webcasts”1:15 pm PT/4:15 pm ET
International Webcast – February 11, 2020 DoubleLine’s International Fixed Income team will discuss DoubleLine’s Emerging Markets, Low Duration Emerging Markets & Global Bond FundsGo to www.doublelinefunds.com, Home page under “Webcasts”1:15 pm PT/4:15 pm ET
Total Return Webcast – March 10, 2020Jeffrey Gundlach and Andrew Hsu will discuss DoubleLine’s Total Return Bond Fund Go to www.doublelinefunds.com, Home page under “Webcasts”1:15 pm PT/4:15 pm ET
Follow Us:https://twitter.com/DLineFunds
Register for Advisor Use Only https://doublelinefunds.com/advisor‐home/

412‐10‐19 Total Return Webcast
Other Announcements
Intellectual Property of DoubleLine – This presentation represents DoubleLine’s intellectual property. No portion of this webcast may be published, reproduced, transmitted or rebroadcast in any media in any form without the express written permission of DoubleLine. To receive permission from DoubleLine please contact [email protected]
Sherman Show Podcasts – Available on doubleline.com, iTunes, Sound Cloud, Google Play, Spotify and StitcherVisit them on Twitter @ShermanShowPod
Advisor Use Only Webpage ‐ Now Available on doublelinefunds.comSign up and a password will be sent to you once we have verifiedyou are a registered rep.

333 S. Grand Ave., 18th Floor || Los Angeles, CA 90071 || (213) 633‐8200
Live Webcast hosted by:
Jeffrey GundlachChief Executive Officer
Andrew HsuPortfolio Manager
December 10, 2019
“A Rolling Loan Gathers No Loss”

612‐10‐19 Total Return Webcast
Global EconomyTab I

712‐10‐19 Total Return Webcast
Overnight Funding Rate
Source: Seeking Alpha as of September 23, 2019 by David Haggith
St. Louis Reserve Bank President, James Bullard, who commented:
"Something is going on, and that's causing I think a total rethink of central banking and all our cherished notions about what we think we're doing…. We just have to stop thinking that next year things are going to be normal."

812‐10‐19 Total Return Webcast
Excluding U.S 34% of the Bloomberg Barclays Global Aggregate is Negative Yielding Debt
Source: Bianco Research, BloombergBloomberg Barclays Global Aggregate Negative Yielding Debt Index is a broad based index representing global intermediate‐term investment grade bonds with negative yields. You cannot invest directly in an index.

912‐10‐19 Total Return Webcast
Overnight Funding Rate vs. Fed Funds Rate
Source: ICAP, Bloomberg, DoubleLine

1012‐10‐19 Total Return Webcast
Fed’s Balance Sheet, Total Reserves, and Repos
Source: Bloomberg; DoubleLine
Fed Balance Sheet, Total Reserve, and Repos

1112‐10‐19 Total Return Webcast
Source: DoubleLine, Bloomberg
40% of Quantitative Tightening Has Been Reversedin Just Three Months

1212‐10‐19 Total Return Webcast
Fed Balance Sheet and 3m10y UST Spread
‐100
‐50
0
50
100
150
200
250
300
350
400
450
$500,000
$1,000,000
$1,500,000
$2,000,000
$2,500,000
$3,000,000
$3,500,000
$4,000,000
$4,500,000
$5,000,000
1/4/2008 1/4/2009 1/4/2010 1/4/2011 1/4/2012 1/4/2013 1/4/2014 1/4/2015 1/4/2016 1/4/2017 1/4/2018 1/4/2019
Fed Balance Sheet and 3m10y UST Spread
QE1 QE2 Operation Twist QE 3 Taper QT Not QE? Fed Balance Sheet (LHS) 3m10y UST Spread
Source: Bloomberg; DoubleLineUST refers to the U.S. Treasury. QE refers to Quantitative Easing.

1312‐10‐19 Total Return Webcast
Fed Funds Rate vs. U.S. Dollar
Source: Bloomberg, DoubleLineDXY: An index of U.S. dollar vs. a basket of currencies. You cannot invest directly in an index.

1412‐10‐19 Total Return Webcast
U.S. Dollar and Twin Deficits
Source: Bloomberg, DoubleLine, as of 6/30/2019
60
70
80
90
100
110
120
‐14
‐12
‐10
‐8
‐6
‐4
‐2
0
2
4
Trade Weighted USD
% GDP
Trade Weighted USD and Current Account and Budget Balance
Recession Current Account Budget Balance Twin Deficit Trade Weighted USD (RHS)

1512‐10‐19 Total Return Webcast
U.S. Trade Weighted Broad Dollar
Source: Bloomberg, DoubleLineBroad: Weighted average of the foreign exchange value of the U.S. Dollar against the currencies of a major group of U.S. trading partners.Relative Strength Index (RSI) ‐ A momentum indicator that measures the magnitude of recent price changes to evaluate overbought or oversold conditions in the price of a stock or other asset.

1612‐10‐19 Total Return Webcast
U.S. Dollar (DXY)
Source: Bloomberg, DoubleLineDXY: An index of U.S. dollar vs. a basket of currencies. You cannot invest directly in an index.

1712‐10‐19 Total Return Webcast
U.S. Outstanding Debt by Sector
Source: DoubleLine, BloombergFOF refers to Flow of Funds.

1812‐10‐19 Total Return Webcast
Source: DoubleLine, BloombergGDP refers to Gross Domestic Product.
‐12%
‐10%
‐8%
‐6%
‐4%
‐2%
0%
2%
4%
Budget Balance (percent of G
DP)
Budget Balance (percent of GDP)
US
Eurozone
Germany
France
UK
U.S. Budget Balance vs. Major European Nations (% of GDP):U.S. is the Outlier, Headed the Wrong Direction

1912‐10‐19 Total Return Webcast
Federal Revenues and Outlays
Source: CBO, https://www.cbo.gov/publication/54667As of November 30, 2019 and projections through 2028.

2012‐10‐19 Total Return Webcast
U.S. Budget Deficit and U.S. Unemployment
Source: CBO, Bloomberg, DoubleLine *Forecasted DataGross Domestic Product (GDP) is the amount of goods and services produced within a given country. LHS refers to Left Hand Side. RHS refers to Right Hand Side.
2%
3%
4%
5%
6%
7%
8%
9%
10%
11%‐10%
‐8%
‐6%
‐4%
‐2%
0%
2%
4%
US Une
mploymen
t Rate (%
) Decem
ber 3
1, 195
9 ‐D
ecem
ber 3
1, 202
9
US Fede
ral B
udget D
eficit as a % of U
S GDP
Decem
ber 3
1, 195
9 ‐D
ecem
ber 3
1, 202
9
US Deficit as a % of GDP (LHS)
US Unemployment Rate (RHS)
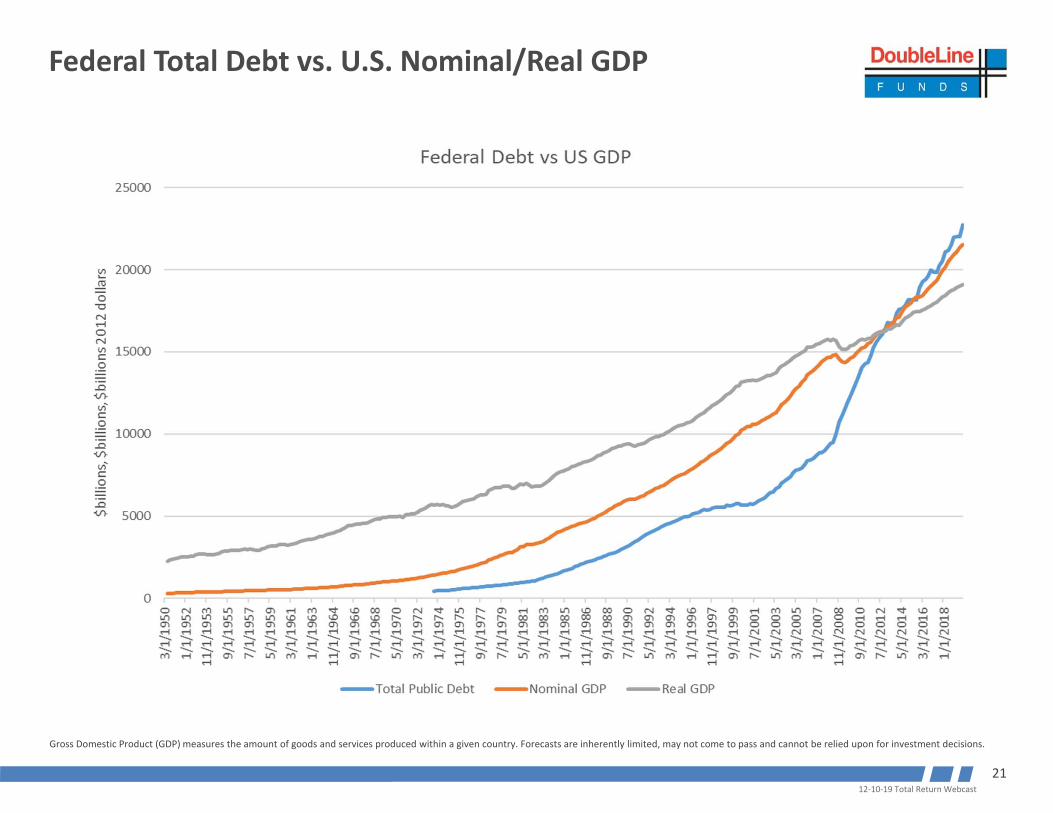
2112‐10‐19 Total Return Webcast
Federal Total Debt vs. U.S. Nominal/Real GDP
Gross Domestic Product (GDP) measures the amount of goods and services produced within a given country. Forecasts are inherently limited, may not come to pass and cannot be relied upon for investment decisions.

2212‐10‐19 Total Return Webcast
U.S. Tax Receipts as % GDP
Source: DoubleLine, BloombergSAAR refers to Seasonally Adjusted Annual Rate.

2312‐10‐19 Total Return Webcast
Greece vs. U.S. 10‐year Yield
Source: Bloomberg, DoubleLine

2412‐10‐19 Total Return Webcast
U.S. 2‐Year Treasury
Source: Bloomberg, DoubleLineGT02: US 2 Year Treasury Bond

2512‐10‐19 Total Return Webcast
Source: Bloomberg, DoubleLine
U.S. 10Y Yields

2612‐10‐19 Total Return Webcast
Copper/Gold Ratio vs. UST 10‐year Yield
Source: Bloomberg, DoubleLineCopper is the copper contract price. Copper is the world’s third most widely used metal, after iron and aluminum, and is primarily used in highly cyclical industries such as construction and industrial machinery manufacturing.Gold is the spot price in Troy ounces.

2712‐10‐19 Total Return Webcast
10Y UST vs. Avg (U.S. Nom GDP YoY + German 10Y)
Source: Bloomberg, DoubleLineGross Domestic Product (GDP) is the amount of goods and services produced within a given country.
Nominal GDP YoY: 4.0%German 10y Yield: ‐0.70%Projected Implied 10y: 1.5%Avg.(3.7 Q3 Nom. GDP + ‐0.70 Ger. 10y)

2812‐10‐19 Total Return Webcast
German 10‐Year Yield Breaks 2016 LowsDecember 31, 2015 – August 21, 2019
Source: Bloomberg, DoubleLine

2912‐10‐19 Total Return Webcast
Overnight Funding Rate
Source: NY Times “The Fed’s View on Inflation Is Quietly Shifting. Here’s Why?” published November 1, 2019
Federal Reserve Chairman, Jay Powell, who commented:
“I think we would need to see a really significant move up in inflation that’s persistent before we would even consider raising rates to address inflation concerns.”

3012‐10‐19 Total Return Webcast
U.S. Corporate and Government Debt and U.S. Net International Investment Position
The corporate and the public sector has increasingly had to rely on foreign funding.
Source: Macrobond, Morgan Stanley Research as of November 30, 2019
U.S. Corporate + Government Debt U.S. Net International Investment Position
(% GDP)

3112‐10‐19 Total Return Webcast
Corporate Bond Market Liquidity
As of September 30, 2019Source: J.P Morgan Asset Management Guide to the Markets

3212‐10‐19 Total Return Webcast
Corporate Debt: Quantity up, Quality down
As of November 30, 2019Source: Minack Advisors
U.S. Corporate Credit Outstanding, by Rating

3312‐10‐19 Total Return Webcast
Global Corporate Credit by Region
RoW refers to Rest of World; EU HY refers to European High Yield; US IG refers to U.S. Investment Grade; GBP IG refers to Great Britain Investment Grade.
The majority of corporate credit is in the U.S.

3412‐10‐19 Total Return Webcast
U.S. Corporate Credit as % GDP
Source: Bloomberg, DoubleLine

3512‐10‐19 Total Return Webcast
https://www.dallasfed.org/research/economics/2019/~/media/Images/research/economics/2019/0305/0305c2.png
U.S. Nonfinancial Corporate Bonds by Rating, 2008‐2018

3612‐10‐19 Total Return Webcast
U.S. Corporate Investment Grade Implied Ratings by Leverage
As of October 31, 2019.
IG refers to Investment Grade; HY refers to High Yield.
Par (short for Par Value) bonds, preferred stock, common stock or currencies, with different meanings depending on the context. Par most commonly refers to bonds, in which case, it means the face value, or value at which the bond will be redeemed at maturity.
A large part of IG has leverage consistent with a HY rating

3712‐10‐19 Total Return Webcast
High Yield Upgrade/Downgrade Ratio
Source: JP Morgan, Moody’s Investors Service, S&PLTM refers to Loan‐to‐Maturity

3812‐10‐19 Total Return Webcast
S&P 500 vs. Russell 2000 and U.S. Corporate High Yield Spread
Source: Bloomberg, DoubleLineS&P 500 includes 500 leading large‐cap U.S. leading companies. Russell 2000 Index is comprised of the smallest 200 companies in the Russell 3000 Index. Bloomberg Barclays US Corporate High Yield Average OAS ‐ An index that is composed of fixed‐rate, publicly issued, non‐investment grade debt with OAS. You cannot invest direly in an index.

3912‐10‐19 Total Return Webcast
U.S. Corporate Investment Grade and High Yield Net Debt to EBITDA
Source: Bloomberg, FactSet, GS Global Investment ResearchEBITDA refers to Earnings Before Interest, Taxes, Depreciation and Amortization. IG refers to Investment Grade. HY refers to High Yield.

4012‐10‐19 Total Return Webcast
U.S. Corporate High Yield Option Adjusted Spread + Energy
Source: BAML; DoubleLineBAML High Yield Index tracks the performance of USD denominated below investment grade corporate debt publicly issued domestically. Energy is a sub‐sector of this index.
300
400
500
600
700
800
900
1000
1100
1200
1300
1400
1500
1600
1700
1800
1900
2000
2100
4/21/2014
6/21/2014
8/21/2014
10/21/2014
12/21/2014
2/21/2015
4/21/2015
6/21/2015
8/21/2015
10/21/2015
12/21/2015
2/21/2016
4/21/2016
6/21/2016
8/21/2016
10/21/2016
12/21/2016
2/21/2017
4/21/2017
6/21/2017
8/21/2017
10/21/2017
12/21/2017
2/21/2018
4/21/2018
6/21/2018
8/21/2018
10/21/2018
12/21/2018
2/21/2019
4/21/2019
6/21/2019
8/21/2019
10/21/2019
U.S. Corporate HY OAS
BAML HY BAML HY Energy HY Current HY Energy Current
HY Energy 826bps
HY 414bps

4112‐10‐19 Total Return Webcast
Long CCC/Short BB Excess Returns by Year
Source: Bloomberg‐Barclays, GS Global Investment Research

4212‐10‐19 Total Return Webcast
Tab IIDBLTX

4312‐10‐19 Total Return Webcast
Duration: DBLTX vs. Barclays U.S. Aggregate IndexMay 31, 2010 through October 31, 2019
Source: DoubleLine, BarclaysDuration: A measure of sensitivity of the price of a fixed income investment to a change in interest rates, expressed in years.
0.00
1.00
2.00
3.00
4.00
5.00
6.00
7.00
Duration (years)
DBLTX
Bloomberg Barclays U.S. Aggregate Index

4412‐10‐19 Total Return Webcast
DBLTX Duration vs. 10 Year U.S. Treasury Yield May 31, 2010 through October 31, 2019
Source: Bloomberg, DoubleLineDuration is a measure of sensitivity of the price of a fixed income investment to a change in interest rates, expressed in years. LHS = left hand side, RHS = right hand side.
0.00%
0.50%
1.00%
1.50%
2.00%
2.50%
3.00%
3.50%
4.00%
‐
0.50
1.00
1.50
2.00
2.50
3.00
3.50
4.00
4.50
Percen
t
Duration (years)
DBLTX Duration (LHS)
10‐year U.S. Treasury Yield (RHS)

4512‐10‐19 Total Return Webcast
Source: DoubleLinePortfolio statistics based on market weighted averages. Subject to change without notice.Average price: A measure of the weighted average price paid for the securities calculated by taking the prices and dividing by the number of securities and does not include cash. Average price should not be confused with net asset value.Average Duration: Duration is used as a risk measure. It measures the price volatility of a security given a change in interest rate movements.Average Life: The average number of years that each dollar of unpaid principal due on the mortgage remains outstanding. Average life is computed as the weighted average time to the receipt of all future cash flows, using as the weights the dollar amounts of the principal paydowns.You cannot invest directly in an index. Please see index definition.
DoubleLine Total Return Bond Fund Portfolio StatisticsAs of October 31, 2019
DoubleLine TotalReturn Bond Fund
Bloomberg Barclays U.S. Aggregate Index
Average Price $101.48 $106.28
Duration 3.61 5.81
Average Life 5.19 7.97

4612‐10‐19 Total Return Webcast
Source: DoubleLine. Subject to change without notice.Sector allocations are subject to change and should not be considered a recommendation to buy or sell any security.Bond ratings are grades given to bonds that indicate their credit quality as determined by a private independent rating service such as Standard & Poor's. The firm evaluates a bond issuer's financial strength, or its abilityto pay a bond's principal and interest in a timely fashion. Ratings are expressed as letters ranging from 'AAA', which is the highest grade, to 'D', which is the lowest grade. In limited situations when the rating agency hasnot issued a formal rating, the Advisor will classify the security as nonrated.Cash: The value of assets that can be converted into cash immediately. Can include marketable securities, such as government bonds, banker's acceptances, cash equivalents on balance sheets that may include securities that mature within 90 days.Government: U.S. treasury securities.Agency:Mortgage securities whose principal and interest guaranteed by the U.S. Government agency including Fannie Mae (FNMA) or Freddie Mac (FHLMC).Non‐Agency: Residential Mortgages Bond Securities are a type of bond backed by residential mortgages. Non‐Agency means they were issued by a private issuer.CMBS: Commercial Mortgage‐Backed Securities. Securitized loans made on commercial rather than residential property.CLO: Collateralized Mortgage Obligations
DoubleLine Total Return Bond Fund Portfolio CompositionAs of October 31, 2019
Cash; 3.23%
Treasury; 8.61%
Agency Pass‐Throughs; 19.91%
Agency Collateralized Mortgage Obligation (CMO);
22.11%
Non‐Agency Residential MBS;
27.58%Commercial MBS; 9.94%
Collateralized Loan Obligations (CLO); 4.71%
Asset‐Backed Securities; 3.92%

4712‐10‐19 Total Return Webcast
Definitions
Basis Point (bps)‐ A basis point is a unit that is equal to 1/100th of 1%, and is used to denote the change in a financial instrument.Barclays Capital US 30 Year TIPS Index ‐ Barclays Capital 30‐year TIPS on‐the‐run index quoted in US Dollars traded intraday.Bloomberg Barclays Capital US Aggregate Index ‐ The Barclays Capital US Aggregate Index represents securities that are SEC‐registered, taxable, and dollar denominated. The index covers the USinvestment grade fixed rate bond market, with index components for government and corporate securities, mortgage pass‐through securities, and asset‐backed securities. These major sectors aresubdivided into more specific indices that are calculated and reported on a regular basis.Bloomberg Barclays Capital US MBS Index ‐ The Barclays Capital US MBS Index represents the MBS component of the Bloomberg Barclays US Aggregate Index.Bloomberg Barclays Capital US Treasury Index ‐ This index is the US Treasury component of the US Government index. Public obligations of the US Treasury with a remaining maturity of one yearor more.Bloomberg Barclays Capital US Treasury 10 Year Index ‐ This index is the 10 year component of the US Government index.Bloomberg Barclays Capital Capital US Treasury 30 Year Index ‐ This index is the 30 year component of the US Government index.Bloomberg Barclays Capital US High Yield Index ‐ The Barclays Capital US High Yield Index covers the universe of fixed rate, non‐investment grade debt. Eurobonds and debt issuer from countriesdesignated as emerging markets (e.g. Argentina, Brazil, Venezuela, etc.) are excluded, but Canadian and global bonds (SEC registered) of issuers in non‐EMG countries are included. Original issuezereos, step‐up coupon structures, 144‐As and pay‐in‐kind (PIK, as of October 1, 2009) are also included.Bloomberg Barclays Capital Global Emerging Markets Index ‐ The Barclays Capital Global Emerging Markets Index represents the union of the USD‐denominated US Emerging Markets index andthe predominately EUR‐denominated Pan Euro Emerging Markets Index, covering emerging markets in the following regions: Americas, Europe, Middle East, Africa, and Asia. As with other fixedincome benchmarks provided by Barclays Capital, the index is rules‐based, which allows for an unbiased view of the marketplace and easy replicability.Bloomberg Barclays Global Aggregate Index ‐ A measure of global investment grade debt from twenty‐four local currency markets. This multi‐currency benchmark includes treasury, government‐related, corporate and securitized fixed‐rate bonds from both developed and emerging markets issuers.Bloomberg Barclays High Yield Very Liquid Index ‐ A component of the US Corporate High Yield Index that is designed to track a more liquid component of the USD‐denominated, high yield, fixed‐rate corporate bond market.Bloomberg Barclays Capital CMBS Index – tracks the performance of US dollar‐denominated securitized commercial mortgage‐backed securities.Bloomberg U.S. Financial Conditions Index ‐ This index tracks the overall level of financial stress in the U.S. money, bond, and equity markets to help assess the availability and cost of credit. Apositive value indicates accommodative financial conditions, while a negative value indicates tighter financial conditions relative to pre‐crisis norms.Bloomberg Barclays U.S. High Yield Index – An index that is composed of fixed‐rate, publicly issued, non‐investment grade debt.Bloomberg Barclays US Corporate High Yield Average OAS ‐ An index that is composed of fixed‐rate, publicly issued, non‐investment grade debt with OAS.Bloomberg Barclays Euro Corporate Index – A subset of the Barclays EuroAgg measures the investment grade, euro‐denominated, fixed rate bond market, including treasuries, government‐related, corporate and securitized issues.Bloomberg Barclays Euro High Yield Index – Measures the market of non‐investment grade, fixed‐rate corporate bonds denominated in Euro. Inclusion is based on the currency of issue, and notthe domicile of the issuer.Bloomberg Barclays U.S. Corporate Index – A subset of the Barclays U.S. Aggregate index which is a broad‐based flagship benchmark that measures the investment grade, U.S. dollar‐denominated,fixed rate taxable bond market. IT includes Treasuries, government‐related and corporate securities, MBS, ABS and CMBS. This subset represents the investment grade portion of that index.BofA Merrill Lynch US Government Index (GOAO) ‐ The Merrill Lynch US Government Index tracks the performance of US government (i.e. securities in the Treasury and Agency indices).BofA Merrill Lynch US Corporate Index (COAO) “Investment Grade”‐ The Merrill Lynch Corporate Index tracks the performance of US dollar denominated investment grade corporate debt publiclyissued in the US domestic market. Qualifying securities must have an investment grade rating (based on an average of Moody’s, S&P and Fitch) and an investment grade rated country of risk (basedon an average of Moody’s, S&P and Fitch foreign currency long term sovereign debt ratings). Securities must have at least one year remaining term to final maturity, a fixed coupon schedule and aminimum amount outstanding of $250MM.BofA Merrill Lynch US Dollar Emerging Markets Sovereign Plus Index (IGOV)This index tracks the performance of US dollar denominated emerging market and cross‐over sovereign debt publicly issued in the eurobond or US domestic market. Qualifying countries must havea BB1 or lower foreign currency long‐term sovereign debt rating (based on an average of Moody’s, S&P, and Fitch).

4812‐10‐19 Total Return Webcast
BofA Merrill Lynch U.S. High Yield Cash Pay Index (J0A0) “Below Investment Grade”‐ Tracks the performance of US dollar denominated below investment grade corporate debt, currently in acoupon paying period, that is publicly issued in the US domestic market. Qualifying securities must have a below investment grade rating (based on an average of Moody’s, S&P and Firth foreigncurrency long term sovereign debt ratings). Must have one year remaining to final maturity and a minimum outstanding amount of $100MM.BofA Merrill Lynch U.S. High Yield Index (H0A0) – Tracks the performance of US dollar denominated below investment grade corporate debt publicly issued in the US domestic market. Qualifyingsecurities must have a below investment grade rating (based on average of Moodys, S&P and Fitch) at least 18 months to final maturity at time of issue of issuance, a final maturity, a fixed couponschedule and a minimum amount outstanding of $100MM.BofA Merrill Lynch U.S. High Yield Excluding Energy, Metals and Mining Index (HXNM) ‐ Tracks the performance of US dollar denominated below investment grade corporate debt publicly issuedin the US domestic market excluding energy, metals and mining.BofA Merrill Lynch International Government Index (NOGO) ‐ Tracks the performance of Australia, Canadian, French, German, Japan, Dutch, Swiss and UK investment grade sovereign debtpublicly issued and denominated in the issuer’s own domestic market and currency. Qualifying securities must have at least one year remaining term to final maturity, a fixed coupon schedule anda minimum amount outstanding.BofA Merrill Lynch Mortgage‐Backed Securities Index (MOA0) ‐ This index tracks the performance of US dollar denominated fixed rate and hybrid residential mortgage pass‐through securitiespublicly issued by US agencies in the US domestic market. 30‐year, 20‐year, 15‐year and interest only fixed rate mortgage pools are included in the Index provided they have at least one yearremaining term to final maturity and a minimum amount outstanding of at least $5 billion per generic coupon and $250MM per production year within each generic coupon.BofA/Merrill Lynch High Yield Cash Pay CCC–rated Index (JOA3) ‐ A component of the BofA/Merrill Lynch High Yield Cash Pay Index concentrating on CCC rated High Yield credit only.BofA/Merrill Lynch High Yield Cash Pay BB–rated Index (JOA1) ‐ A component of the BofA/Merrill Lynch High Yield Cash Pay Index concentrating on BB rated High Yield credit only.BofA/Merrill Lynch High Yield Cash Pay B–rated Index (JOA2) ‐ A component of the BofA/Merrill Lynch High Yield Cash Pay Index concentrating on B rated High Yield credit only.BofA/Merrill Lynch Credit Index BBB‐rated Index (COA4) ‐ A component of the BofA/Merrill Lynch Credit Index concentrating on the lower rated BBB investment grade credits.BofA/Merrill Lynch Credit Index A–rated Index (COA3) ‐ A component of the BofA/Merrill Lynch Credit Index concentrating on the A rated investment grade credits.BofA/Merrill Lynch Credit Index AAA–rated Index (COA1) ‐ A component of the BofA/Merrill Lynch Credit Index concentrating on the highest rated AAA investment grade credits.BofA Merrill Lynch US Treasury Index (G0Q0) ‐ Tracks the performance of US dollar denominated sovereign debt publicly issued by the US government in its domestic market. Qualifying securitiesmust have at least one year remaining term to final maturity, a fixed coupon schedule and a minimum amount outstanding of $1 billion.BofA Merrill Lynch US 10‐15 Year Treasury Index “Long Treasury” ‐ Tracks the performance of US dollar denominated 10‐15 year sovereign debt publicly issued by the US government in itsdomestic market. It is a subset of the BofA Merrill Lynch U.S. Treasury Index (GOQO).BofA Merrill Lynch Current 10 year UST Index ‐ This index is the 10 year component of the US Government index.BofA Merrill Lynch Current 30 year UST Index ‐ This index is the 30 year component of the US Government index.Below Investment Grade ‐ A term indicating that a security is rated below investment grade. These securities are seen as having higher default risk or other adverse credit events, but typically payhigher yields than better quality bonds in order to make them attractive. They are less likely to pay back 100 cents on the dollar.Cash Flows ‐ The net amount of cash and cash‐equivalents being transferred into and out of a business.Citigroup Economic Surprise Index ‐ The Citigroup Economic Surprise Indices are objective and quantitative measures of economic news. They are defined as weighted historical standarddeviations of data surprises (actual releases vs Bloomberg survey median). A positive reading of the Economic Surprise Index suggests that economic releases have on balance beating consensus.The indices are calculated daily in a rolling three‐month window. The weights of economic indicators are derived from relative high‐frequency spot FX impacts of 1 standard deviation datasurprises. The indices also employ a time decay function to replicate the limited memory of markets.Citigroup TIPS (SBUSILSI) –Measures the returns of the inflation‐linked bonds with fixed‐rate coupon payments that are linked to an inflation index. The price of each issue in the USLSI is adjustedby using an index ratio. The index ratio is determined by dividing the current inflation index level by the inflation index level at the time of issue of the security. The inflation index is published on amonthly basis, and the intra‐month index ratio is calculated using linear interpolation.“Copper”‐ Copper Spot Price (HGI) Copper is the world’s third most used metal behind iron and aluminum primarily used in highly cyclical industries including construction and industrial machinerymanufacturing. Spot price quoted in USD/lb.
Definitions

4912‐10‐19 Total Return Webcast
Credit Quality ‐ Determined from the highest available credit rating from any Nationally Recognized Statistical Rating Agency (NRSRO", generally S&P, Moody's, or Fitch). DoubleLine chooses todisplay credit ratings using S&P's rating convention, although the rating itself might be sourced from another NRSRO. The firm evaluates a bond issuer's financial strength, or its ability to pay abond's principal and interest in a timely fashion. Ratings are expressed as letters ranging from 'AAA', which is the highest grade, to 'D', which is the lowest grade. In limited situations when therating agency has not issued a formal rating, the rating agency will classify the security as nonrated.CMO ‐ A type of mortgage‐backed security that creates separate pools of pass‐through rates for different classes of bondholders with varying maturities, called tranches. The repayments from thepool of pass‐through securities are used to retire the bonds in the order specified by the bonds' prospectus.Correlation ‐ A statistical measurement of the relationship between two variables. Possible correlations range from +1 to ‐1. A zero correlation indicates that there is no relationship between thevariables. A correlation of ‐1 indicates a perfect negative correlation and +1 indicates a perfect positive correlation.CPI ‐ Consumer Price Index. A measure that examines the weighted average of prices of a basket of consumer goods and services, such as transportation, food and medical care.Crude Oil ‐ Crude oil varies greatly in appearance depending on its composition. West Texas intermediate (WTI )= Texas light sweet crude is used as a benchmark in oil pricing. It’s “light” because ofthe low density and sweet because of low sulfur. Brent crude = Is a major trading classification of sweet light crude. Brent is the oil maker also known as Brent Blend.Dow Jones – UBS DJ Commodity Index ‐ The Dow Jones UBS – Commodity index is composed of commodities traded on U.S. exchanges, with the exception of aluminum, nickel and zinc, whichtrade on the London Metal Exchange (LME).Dow Jones Industrial Average ‐ A price‐weighted average of 30 significant stocks traded on the New York Stock Exchange (NYSE) and the NASDAQ.Draw Down ‐ The peak‐to‐trough decline during a specific record period of an investment, fund or commodity. A drawdown is usually quoted as the percentage between the peak and the trough.Duration ‐ Duration is a commonly used measure of the potential volatility of the price of a debt security, or the aggregate market value of a portfolio of debt securities, prior to maturity. Securitieswith a longer duration generally have more volatile prices than securities of comparable quality with a shorter duration.DXY ‐ U.S. dollar spot index indicates the general international value of the US dollar by averaging the exchange rates between the USD and major world currencies.EBITDA (Earnings Before Interest, Taxes, Depreciation and Amortization) ‐ A measure of a company’s overall financial performance used as an alternative to simple earnings or net income in somecircumstances.Employment Cost Index (ECI) ‐ A quarterly economic series published by the Bureau of Labor Statistics that details the growth of total employee compensation. It tracks movement in the cost oflabor, as measured by wages and benefits, at all levels of a company. The data is broken down by industry group, occupation, and union vs. non‐union workers. The data is compiled throughseparate surveys of non‐farm businesses (about 4,500 sampled) and state and local governments (about 1,000 sampled).European Central Bank (ECB) ‐ The central bank responsible for monetary policy of those European Union (EU) member countries which have adopted the euro currency.FOMC ‐ Federal Open Market CommitteeG‐6 Developed Bonds ‐ G7 (Canada, France, Germany, Italy, Japan, the United Kingdom, and the U.S.) excluding U.S.G7: Consists of Canada, France, Germany, Italy, Japan, the United Kingdom and the U.S.German Bonds are represented by German Bund“Gold”‐ Gold Spot Price (Golds) The Gold Spot price is quoted as US Dollar per Troy Ounce.Hard Data ‐ Refers to concrete improvements in the economy, such as a firm hiring more people or an increase in average wages.Headline/Core Inflation ‐ Core CPI & PCE excludes food and energy componentsISM ‐ ISM Manufacturing Index is based on a survey of 300 manufacturing firms by the Institute of Supply Management.Investment Grade ‐ A level of credit rating for stocks regarded as carrying a minimal risk to investors. Ratings are based on corporate bond model. The higher the rating the more likely the bond willpay back par/100 cents on the dollar.JP Morgan Investment Grade Corporate Index ‐ JP Morgan Investment Grade Corporate Index includes performance of US dollar denominated investment grade corporate debt publicly issued inthe US domestic market. Qualifying securities must have an investment grade rating (based on an average of Moody’s, S&P and Fitch) and an investment grade rated country of risk (based on anaverage of Moody’s, S&P and Fitch foreign currency long term sovereign debt ratings). Securities must have at least one year remaining term to final maturity, a fixed coupon schedule and aminimum amount outstanding of $250MM.
Definitions

5012‐10‐19 Total Return Webcast
JP Morgan Corporate EMBI Broad Diversified Index (JBCDCOMP) ‐ This index tracks a broad basket of performance of investment grade corporate debt, including smaller issues covering a widerarray of publically issued across a range of emerging market countries.JP Morgan Corporate Emerging Market Index (JCMHCOR) ‐ This index is a liquid basket of emerging markets corporate issues which include 80 bonds, representing 60 issuers and 16 countries. Ithas strict liquidity criteria for inclusion in order to provide replicability, tradability, robust pricing and data integrity.JP Morgan Global Bond Index ex‐EM (JGAGGUSD) ‐ A comprehensive global investment grade benchmark excluding emerging markets.JP Morgan EM Bond Index Global Diversified ‐ Tracks total returns for traded external debt instruments in the emerging markets limiting the weights of those index countries with larger debtstocks by only including a specified portion of these countries eligible current face amounts of debt outstanding.Market Capitalization ‐ The market value of a company's outstanding shares. This figure is found by taking the stock price and multiplying it by the total number of shares outstanding.London Interbank Offered Rate (LIBOR) ‐ An indicative average interest rate at which a selection of banks known as the panel banks are prepared to lend one another unsecured funds on theLondon money market.MSCI USA Minimum Volatility Gross TR Index ‐ designed to reflect the performance of a minimum variance equity strategy by optimizing a traditional cap weighted “parent MSCI Index” to attainthe lowest level of volatility for a set of constraints.MSCI Europe Index ‐ The MSCI Europe Index is a free‐float weighted equity index designed to measure the equity market performance of the developed markets in Europe.NSE Nifty 50 Index ‐ National Stock Exchange of India's benchmark broad based stock market index for the Indian equity market.NASDAQ ‐ A computerized system that facilitates trading and provides price quotations on more than 5,000 of the more actively traded over the counter stocks. Created in 1971, the Nasdaq wasthe world's first electronic stock market.Option‐Adjusted Spread (OAS) ‐ The measurement of the spread of a fixed income security rate and the risk‐free rate of return, which is adjusted to take in to account an embedded option.PE ‐ Price/Earnings Ratio is the ratio of valuing a company that measures its current share price relative to tis per‐share earnings.QE ‐ Quantitative EasingQT ‐ Quantitative TighteningREIT ‐ Real Estate Trust. A security that sells like a stock on the major exchanges and invests in real estate directly, either through properties or mortgages.Relative Strength Index ‐ A momentum indicator that measures the magnitude of recent price changes to evaluate overbought or oversold conditions in the price of a stock or other asset.S&P 500 Banks Industry Group GICS (Global Index Classification Standard) Level 2 Index ‐ S&P 500 bank stocks placed within GICS’ Level 2 tier based on GICS 4‐tiered classification system.S&P/Case‐Shiller Composite Home Price Index ‐ The Case‐Shiller Home Price Indices, one comprised of price changes within all 20 metropolitan markets, and another comprised of price changeswithin the following subset of 10 metropolitan markets: Boston, Chicago, Denver, Las Vegas, Los Angeles, Miami, New York, San Diego, San Francisco and Washington DC. In addition to those 10markets, the 20‐Home Price index reflects price changes for Atlanta, Charlotte, Dallas, Detroit, Minneapolis, Phoenix, Portland, Seattle and Tampa.S&P 500 (SPX)‐ S&P 500 is a free‐float capitalization‐weighted index published since 1957 of the prices of 500 large‐cap common stocks actively traded in the United States.S&P GSCI ‐ A composite index of commodity sector return representing an unleveraged, long‐only investment in commodity futures that is broadly diversified across the spectrum of commodities.S&P Low Volatility TR ‐ The S&P 500 Low Volatility Index is designed to measure the performance of the 100 least volatile stocks of the S&P 500 Index Volatility is defined as the standard deviationof the security computed using the daily price returns over 252 trading days.Shanghai Index ‐ The Shanghai Stock Exchange Composite is a capitalization‐weighted index tracking daily price performance of all A and B‐shares listed on the Shanghai Stock Exchange. This indexwas developed December 19, 1990 with a base value of 100.Sharpe Ratio ‐ A measure that indicates the average return minus the risk‐free return divided by the standard deviation of return on an investment.Smart Beta – A passive weighting scheme that deviates from market capitalization.Soft Data ‐ Refers to sentiments and beliefs about the direction of the economy.Standard Deviation ‐ Sigma = standard deviation. Shows how much variation there is from the “average” (mean, or expected/budgeted value). A low standard deviation indicates that the data pointtend to be very close to the mean, whereas high standard deviation indicates that the date is spread out over a large range of values.
Definitions

5112‐10‐19 Total Return Webcast
Definitions
TIPS ‐ Treasury Inflation Protection. A treasury security that is indexed to inflation in order to protect investors from the negative effects of inflation. TIPS are considered an extremely low‐riskinvestment since they are backed by the U.S. government and since their par value rises with inflation, as measured by the Consumer Price Index, while their interest rate remains fixed.Tokyo Stock Exchange Tokyo Price Index (TOPIX or TPX) ‐ A capitalization‐weighted index of all companies listed on the First Section of the Tokyo Stock Exchange. The index is supplemented bythe subindices of the 33 industry sectors. The index calculation excludes temporary issues and preferred stocks, and has a base value of 100 as of January 4, 1968.Tokyo Stock Exchange TOPIX Banks Index ‐ A capitalization‐weighted index of all the banks listed on the First Section of the Tokyo Stock Exchange and one of the 33 industry sectors of the TOPIXIndex (TPX). The index was developed with a base value of 1000 as of January 6, 1992. The parent index is TPX.Transports ‐ The Industrials Sector includes companies whose businesses are dominated by one of the following activities: The manufacture and distribution of capital goods, including aerospace& defense, construction, engineering & building products, electrical equipment and industrial machinery.Treasuries are represented by BofA Merrill Lynch US Treasury Index (G0Q0) ‐ The Merrill Lynch US Treasury Index tracks the performance of US dollar denominated sovereign debt publicly issuedby the US government in its domestic market. Qualifying securities must have at least one year remaining term to final maturity, a fixed coupon schedule and a minimum amount outstanding of $1billion.Two‐Year Treasury is represented by U.S. Generic Gov’t 2‐Year Index ‐ An index that tracks U.S. Generic on‐the‐run government bill/note/bond indices.Utilities ‐ A public utility is a business that furnishes an everyday necessity to the public at large. Public utilities provide water, electricity, natural gas, telephone service, and other essentials.Utilities may be publicly or privately owned, but most are operated as private businesses.Wholesale Price Index (WPI) ‐ An index that measures and tracks the changes in the price of goods in the stages before the retail level.Yield curve ‐ A line that plots the interest rates, at a set point in time, of bonds having equal credit quality but differing maturity dates.Yield‐to‐Maturity (YTM) ‐ The discount rate at which the sum of all future cash flows from the bond (coupons and principal) is equal to the price of the bond. The YTM calculation takes intoaccount the bond’s current market price, par value, coupon interest rate and time to maturity. It is also assumed that all coupon payments are reinvested at the same rate as the bond’s currentyield.Z‐score ‐ A numerical measurement used in statistics of a value's relationship to the mean (average) of a group of values, measured in terms of standard deviations from the mean. If a Z‐score is 0,it indicates that the data point's score is identical to the mean score.
Munis are represented by BofA Merrill Lynch U.S. Municipal Securities Index (UOA0) ‐ An index that tracks the performance of U.S. dollar denominated investment grade tax‐exempt debtpublicly issued by U.S. states and territories, and their political subdivisions, in the U.S. domestic market. Qualifying securities must have at least one year remaining term to final maturity, a fixedcoupon schedule and an investment grade rating (based on Moody’s, S&P and Fitch). Minimum size vary based on the initial term to final maturity at time of issuance.Investment Grade Corporates are represented by ICE BofA Merrill Lynch U.S. Corporate Index (COAO) “Investment Grade”.Mortgage‐Backed Securities are represented by ICE BofA Merrill Lynch Mortgage‐Backed Securities Index (MOA0).High Yield is represented by ICE BofA Merrill Lynch U.S. High Yield Cash Pay Index (J0A0) “Below Investment Grade”.Emerging Markets are represented by ICE BofA Merrill Lynch U.S. Dollar Emerging Markets Sovereign Plus Index (IGOV).Treasuries are represented by ICE BofA Merrill Lynch U.S. Government Index (GOAO).Commercial Mortgage‐Backed Securities are represented by Bloomberg Barclays Capital Commercial Mortgage‐Backed Securities (CMBS) Index.
You cannot invest directly in an index.

5212‐10‐19 Total Return Webcast
SPDR Bloomberg Barclays High Yield Bond ETF (JNK)As of September 30, 2019

5312‐10‐19 Total Return Webcast
iShares iBoxx $ Investment Grade Corporate Bond ETF (LQD)As of September 30, 2019

5412‐10‐19 Total Return Webcast
Disclaimer
Important Information Regarding This ReportIssue selection processes and tools illustrated throughout this presentation are samples and may be modified periodically. Such tools are not the only tools used by theinvestment teams, are extremely sophisticated, may not always produce the intended results and are not intended for use by non‐professionals.
DoubleLine has no obligation to provide revised assessments in the event of changed circumstances. While we have gathered this information from sources believed to bereliable, DoubleLine cannot guarantee the accuracy of the information provided. Securities discussed are not recommendations and are presented as examples of issueselection or portfolio management processes. They have been picked for comparison or illustration purposes only. No security presented within is either offered for sale orpurchase. DoubleLine reserves the right to change its investment perspective and outlook without notice as market conditions dictate or as additional information becomesavailable. This material may include statements that constitute “forward‐looking statements” under the U.S. securities laws. Forward‐looking statements include, among otherthings, projections, estimates, and information about possible or future results related to a client’s account, or market or regulatory developments.
Important Information Regarding Risk FactorsInvestment strategies may not achieve the desired results due to implementation lag, other timing factors, portfolio management decision‐making, economic or marketconditions or other unanticipated factors. The views and forecasts expressed in this material are as of the date indicated, are subject to change without notice, may not come topass and do not represent a recommendation or offer of any particular security, strategy, or investment. All investments involve risks. Please request a copy of DoubleLine’sForm ADV Part 2A to review the material risks involved in DoubleLine’s strategies. Past performance is no guarantee of future results.
Important Information Regarding DoubleLineIn preparing the client reports (and in managing the portfolios), DoubleLine and its vendors price separate account portfolio securities using various sources, includingindependent pricing services and fair value processes such as benchmarking.
To receive a copy of DoubleLine Capital’s current Form ADV (which contains important additional disclosure information, including risk disclosures), a copy of the DoubleLine’sproxy voting policies and procedures, or to obtain additional information on DoubleLine’s proxy voting decisions, please contact DoubleLine’s Client Services.

5512‐10‐19 Total Return Webcast
Important Information Regarding DoubleLine’s Investment StyleDoubleLine seeks to maximize investment results consistent with our interpretation of client guidelines and investment mandate. While DoubleLine seeks to maximizereturns for our clients consistent with guidelines, DoubleLine cannot guarantee that DoubleLine will outperform a client's specified benchmark or the market or thatDoubleLine’s risk management techniques will successfully mitigate losses. Additionally, the nature of portfolio diversification implies that certain holdings and sectors in aclient's portfolio may be rising in price while others are falling; or that some issues and sectors are outperforming while others are underperforming. Such out orunderperformance can be the result of many factors, such as but not limited to duration/interest rate exposure, yield curve exposure, bond sector exposure, or news orrumors specific to a single name.DoubleLine is an active manager and will adjust the composition of client’s portfolios consistent with our investment team’s judgment concerning market conditions andany particular sector or security. The construction of DoubleLine portfolios may differ substantially from the construction of any of a variety of market indices. As such, aDoubleLine portfolio has the potential to underperform or outperform a bond market index. Since markets can remain inefficiently priced for long periods, DoubleLine’sperformance is properly assessed over a full multi‐year market cycle.
Important Information Regarding Client ResponsibilitiesClients are requested to carefully review all portfolio holdings and strategies, including by comparing the custodial statement to any statements received fromDoubleLine. Clients should promptly inform DoubleLine of any potential or perceived policy or guideline inconsistencies. In particular, DoubleLine understands thatguideline enabling language is subject to interpretation and DoubleLine strongly encourages clients to express any contrasting interpretation as soon as practical. Clientsare also requested to notify DoubleLine of any updates to Client’s organization, such as (but not limited to) adding affiliates (including broker dealer affiliates), issuingadditional securities, name changes, mergers or other alterations to Client’s legal structure.
CFA® is a registered trademark owned by CFA Institute.
DoubleLine Group is not a registered investment adviser with the Securities Exchange Commission (SEC).
DoubleLine® is a registered trademark of DoubleLine Capital LP.
© 2019 DoubleLine Capital LP
Disclaimer

333 S. Grand Ave., 18th Floor || Los Angeles, CA 90071 || (213) 633‐8200
Live Webcast hosted by:
Jeffrey GundlachChief Executive Officer
Andrew HsuPortfolio Manager
December 10, 2019
“A rolling loan gathers no loss”

5712‐10‐19 Total Return Webcast
Webcast Announcements
2020 Webcast Schedule available on www.doublelinefunds.com
Jeffrey Gundlach’s “Just Markets” Webcast – January 7, 2020 Jeffrey Gundlach will discuss his outlook on the economy and marketsGo to www.doubleline.com, Home page under “Webcasts”1:15 pm PT/4:15 pm ET
International Webcast – February 11, 2020 DoubleLine’s International Fixed Income team will discuss DoubleLine’s Emerging Markets, Low Duration Emerging Markets & Global Bond FundsGo to www.doublelinefunds.com, Home page under “Webcasts”1:15 pm PT/4:15 pm ET
Total Return Webcast – March 10, 2020Jeffrey Gundlach and Andrew Hsu will discuss DoubleLine’s Total Return Bond Fund Go to www.doublelinefunds.com, Home page under “Webcasts”1:15 pm PT/4:15 pm ET
Follow Us:https://twitter.com/DLineFunds
Register for Advisor Use Only https://doublelinefunds.com/advisor‐home/