ant^onio reis, maria cristina lay, luisa muniz, vitor …spacesyntax.tudelft.nl/media/long papers...
TRANSCRIPT
Perception of security, visual connections, children and adolescentsbehaviour in open spaces
Antonio Reis, Maria Cristina Lay, Luisa Muniz, Vitor AmbrosiniFederal University of Rio Grande do Sul, Brazil
[email protected], [email protected], [email protected],[email protected]
Abstract
This article identifies the levels of security in 12 housing estates in the metropolitan regionof Porto Alegre through the perception of residents and examine, using GIS and spacesyntax methods, the relationship between such levels, the presence of children and adoles-cents in the open spaces of estates characterised by blocks of flats, their visual connectionsto the housing units and the potential of movement of streets and pedestrian paths. It isconsidered the quantity of visual connections between the children and adolescents andthe openings of housing units, and the distances between them, as well as the levels ofdepth and integration of public streets and pedestrian paths. Physical measurements, be-haviour maps, questionnaires with maps for respondents to identify the most insecureareas, and structured interviews were used as methods of data collection. These reveal theattitudes and behaviours of residents and the research relevant physical characteristics ofhousing estates, such as the existence of openings that permit visual connections betweenthe interior and the exterior of housing units. Quantitative date related to the perceptionof security is analysed through non-parametric statistics, while the distances between thechildren and adolescents and the openings of housing units are calculated and graphicallyrepresented in IDRISI software, and the depths and integration levels of streets and pedes-trian paths are calculated and graphically represented in Spatialist software. Some of themain results show a tendency for the use of opens spaces in the housing estates, especiallyby children, to be an indicator of open spaces adequacy regarding security. Young childrenuse those spaces in the immediacy of openings of the housing units in most of the housingestates, what tend to indicate a residential environment perceived as more secure.
1. Introduction
Perception of security of urban space seems to affect people’s behaviour, since spacesperceived as insecure tend to be little used (Francis, 1987). The reasons for the perceptionof insecurity are related to a group of aspects of socioeconomic and political nature, as wellas of physical nature (i.e. Basso, 2002; Zanotto, 2002; Hillier & Shu, 1999; Poyner, 1983).Among these are the morphologic and configurational characteristics of the urban spacethat affect its security level, as for instance, the amount of existent visual connectionsbetween the buildings and the open spaces. The importance of such connections has beenemphasized since early sixties when Jane Jacobs (1961) wrote “The Death and Life ofGreat American Cities”. Several other authors (i.e. Hillier & Shu, 1999; Voordt & Wegen,1990; Newman, 1972) ever since, have supported Jacobs (1961) arguments that urbanspaces with larger degree of visual supervision on the part of the users of adjacent buildingstend to be more secure spaces, when compared with spaces where visual supervision issmaller or inexistent. This relationship was also found in a study accomplished in Brazil
438 A. Reis, M. C. Lay, L. Muniz, V. Ambrosini
(Zanotto, 2002).However, although the importance of such visual supervision is more and more evident,
except for some studies (i.e. Zanotto, 2002; Basso, 2002) that considered the quantificationof the visual connections, in terms of number of connection modules (equivalent to 1meter), it has not been specified what is a high or low supervision based on the amountof existent visual connections between the open spaces and the adjacent buildings, as wellas on the distance between people in the open spaces and the openings of the buildings.
Considering that such quantifications could be made through a Geographic InformationSystem (GIS) software and that perception of insecurity has specifically been detected inhousing estates built for low-income populations in several countries, including Brazil (e.g.Reis et al, 2003; Basso, 2002; Reis & Lay, 1996), it seems relevant to investigate the impacton their security of: the amount of existent visual connections between the open spaces andthe adjacent buildings; the distances between people in the open spaces and the openingsof the buildings, specifically regarding the behaviour of children from 0 to 5 years old,from 6 to 12 years old and of adolescents. Moreover, it appears relevant to investigate therelationship between behaviour on open spaces of these age groups and the potential ofmovement of such spaces as represented by depth and integration values.
Therefore, based on these points, this article identifies security’s levels in 12 housingestates in the metropolitan region of Porto Alegre through residents’ perception and exam-ines, using GIS and space syntax methods, the relationship between residents’ perceptionof security and: the presence of children in the age groups above mentioned, as well as ofadolescents, in the open spaces of estates characterised by blocks of flats; the amount ofvisual connections between these age groups and the openings of the housing units as wellas the distances between them; and the potential of movement of streets and pedestrianpaths.
2. Methodology
Residents perceptions about security in their housing estates were collected through ques-tionnaires, including maps for indication of the most insecure areas, applied to respondentsof 374 units distributed in the following groups: four storey blocks of flats (Loureiro-45,Angico-30, Guajuviras blocks-32, Cavalhada-33 and Sapucaia-30), terraced houses (ValeVerde-30, Joao Vedana-30, Sao Jorge-20 and Santo Alfredo-24), and houses (Restinga-36,Costa e Silva-32, Guajuviras-32). Systematic observations were carried out during morn-ings and afternoons, for the period of two consecutive weeks, in all housing estates withthe objective of registering and spatially representing behaviour in open spaces of childrenup to 5 and from 6 to 12 years old, and of adolescents.
In order to quantify visual connections between buildings and people in the openspaces, physical measurements were used to register the ground floor openings as wellas the buildings and other existent visual barriers. As the openings dimensions of theblocks of flats in the housing estates investigated tend to be similar, a larger number ofopenings visualized by children and adolescents corresponds to a larger visual connectionand therefore, to a larger visual supervision of the open spaces on the part of residents ofadjacent buildings.
Data obtained through questionnaires were registered and statistically analyzed inthe software SPSS/PC through non-parametric test that indicates the existence or notof significant differences among the residents’ opinions on security of different estates
Perception of security, visual connections, children and adolescents behaviour in openspaces 439
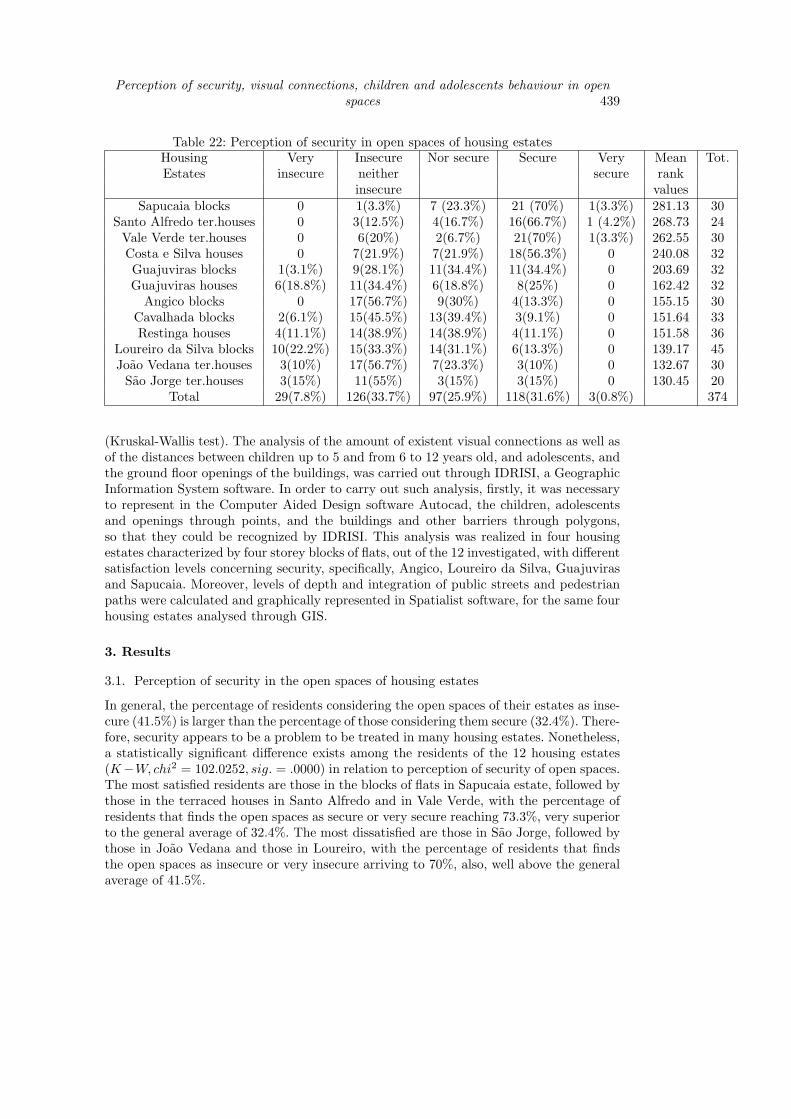
Table 22: Perception of security in open spaces of housing estatesHousing Very Insecure Nor secure Secure Very Mean Tot.Estates insecure neither secure rank
insecure valuesSapucaia blocks 0 1(3.3%) 7 (23.3%) 21 (70%) 1(3.3%) 281.13 30
Santo Alfredo ter.houses 0 3(12.5%) 4(16.7%) 16(66.7%) 1 (4.2%) 268.73 24Vale Verde ter.houses 0 6(20%) 2(6.7%) 21(70%) 1(3.3%) 262.55 30Costa e Silva houses 0 7(21.9%) 7(21.9%) 18(56.3%) 0 240.08 32Guajuviras blocks 1(3.1%) 9(28.1%) 11(34.4%) 11(34.4%) 0 203.69 32Guajuviras houses 6(18.8%) 11(34.4%) 6(18.8%) 8(25%) 0 162.42 32
Angico blocks 0 17(56.7%) 9(30%) 4(13.3%) 0 155.15 30Cavalhada blocks 2(6.1%) 15(45.5%) 13(39.4%) 3(9.1%) 0 151.64 33Restinga houses 4(11.1%) 14(38.9%) 14(38.9%) 4(11.1%) 0 151.58 36
Loureiro da Silva blocks 10(22.2%) 15(33.3%) 14(31.1%) 6(13.3%) 0 139.17 45Joao Vedana ter.houses 3(10%) 17(56.7%) 7(23.3%) 3(10%) 0 132.67 30Sao Jorge ter.houses 3(15%) 11(55%) 3(15%) 3(15%) 0 130.45 20
Total 29(7.8%) 126(33.7%) 97(25.9%) 118(31.6%) 3(0.8%) 374
(Kruskal-Wallis test). The analysis of the amount of existent visual connections as well asof the distances between children up to 5 and from 6 to 12 years old, and adolescents, andthe ground floor openings of the buildings, was carried out through IDRISI, a GeographicInformation System software. In order to carry out such analysis, firstly, it was necessaryto represent in the Computer Aided Design software Autocad, the children, adolescentsand openings through points, and the buildings and other barriers through polygons,so that they could be recognized by IDRISI. This analysis was realized in four housingestates characterized by four storey blocks of flats, out of the 12 investigated, with differentsatisfaction levels concerning security, specifically, Angico, Loureiro da Silva, Guajuvirasand Sapucaia. Moreover, levels of depth and integration of public streets and pedestrianpaths were calculated and graphically represented in Spatialist software, for the same fourhousing estates analysed through GIS.
3. Results
3.1. Perception of security in the open spaces of housing estates
In general, the percentage of residents considering the open spaces of their estates as inse-cure (41.5%) is larger than the percentage of those considering them secure (32.4%). There-fore, security appears to be a problem to be treated in many housing estates. Nonetheless,a statistically significant difference exists among the residents of the 12 housing estates(K−W, chi2 = 102.0252, sig. = .0000) in relation to perception of security of open spaces.The most satisfied residents are those in the blocks of flats in Sapucaia estate, followed bythose in the terraced houses in Santo Alfredo and in Vale Verde, with the percentage ofresidents that finds the open spaces as secure or very secure reaching 73.3%, very superiorto the general average of 32.4%. The most dissatisfied are those in Sao Jorge, followed bythose in Joao Vedana and those in Loureiro, with the percentage of residents that findsthe open spaces as insecure or very insecure arriving to 70%, also, well above the generalaverage of 41.5%.
440 A. Reis, M. C. Lay, L. Muniz, V. Ambrosini
3.2. Perception of security and people’s presence in the open spaces
Considering that children up to 12 years old would be those to be more affected by the lackof security in the open spaces, it is observed that the largest percentages of householdswhose children use the open spaces are in the terraced houses of Vale Verde estate (100%,10 out of 10 households with children), in the houses of Costa e Silva (93.33%, 14 outof 15), in the terraced houses of Joao Vedana (92.31%, 12 out of 13), in the houses ofRestinga (92%, 23 out of 25), in the terraced houses of Santo Alfredo (85.71%, 12 out of14) and Sao Jorge (85.71%, 12 out of 14) and in the blocks of Sapucaia (82.35%, 14 out of17). The smallest percentages are in the blocks of Angico (42.86%, 9 out of 21), Cavalhada(57.14%, 12 out of 21), and Loureiro (63.3%, 19 out of 30). Although such percentagestend to indicate a greater or smaller adequacy of open spaces in terms of security forchildren and to support results in Table 221, they can still reflect a need of use of suchspaces even if they are not considered secure or very secure.
Nonetheless, in general, the most frequented spaces by the children (up to 12 yearsold) in the housing estates tend to be those considered by the respondent (usually theparent) as the most appropriate in terms of security, besides their location and existingequipment. Still, the great majority of residents whose children don’t use the open spacesperceive these areas as more insecure, and probably for that reason they don’t allow thechildren to play in the open spaces of the estate. In general, the most used spaces werenot appointed as insecure, suggesting a certain relationship among movement, people’spresence and security.
3.3. Perception of security and visual and physical connections
Although a marked difference exists between the residents of terraced houses in Sao Jorgeand in Santo Alfredo, concerning satisfaction with security of open spaces, the numberof ground floor windows and doors facing the open spaces for pedestrian and vehicularcirculation is very similar among the two. The number of ground floor openings is muchlarger in these and in the terraced houses in other estates, than in the houses and inthe blocks of flats. However, some of the explanations for such differences between SantoAlfredo and Sao Jorge, appears to be in the higher degree of territorial control exercisedin the first estate through physical barriers compared to the later one.
However, in the case of the estates with blocks of flats, it can be said that a certainrelationship exists between the number of visual connections and the security of publicand semi-public open spaces. Even in the estates with terraced houses, areas without orpractically without visual connections with the buildings tend to generate insecurity, asobserved in Joao Vedana, where an area with almost inexistent connections, in the backof the estate and close to a small stream and dense vegetation, is the most insecure areaof the estate.
Regarding the physical connections, that make possible the physical access besidesthe visual one, the situation is quite similar to that of visual connections, as much inthe number as in the relationship among the different architectural types, except for theexpressive reduction in the number of physical connections in relation to the visual ones inalmost all the estates with blocks. Therefore, it can be said that the accessibility from the
1 The housing estates are ordered from the highest to the lowest degree of the residents’ satisfactionwith security of open spaces; mean rank values were obtained through Kruskal-Wallis non-parametricstatistical test; ter.houses = terraced houses.
Perception of security, visual connections, children and adolescents behaviour in openspaces 441
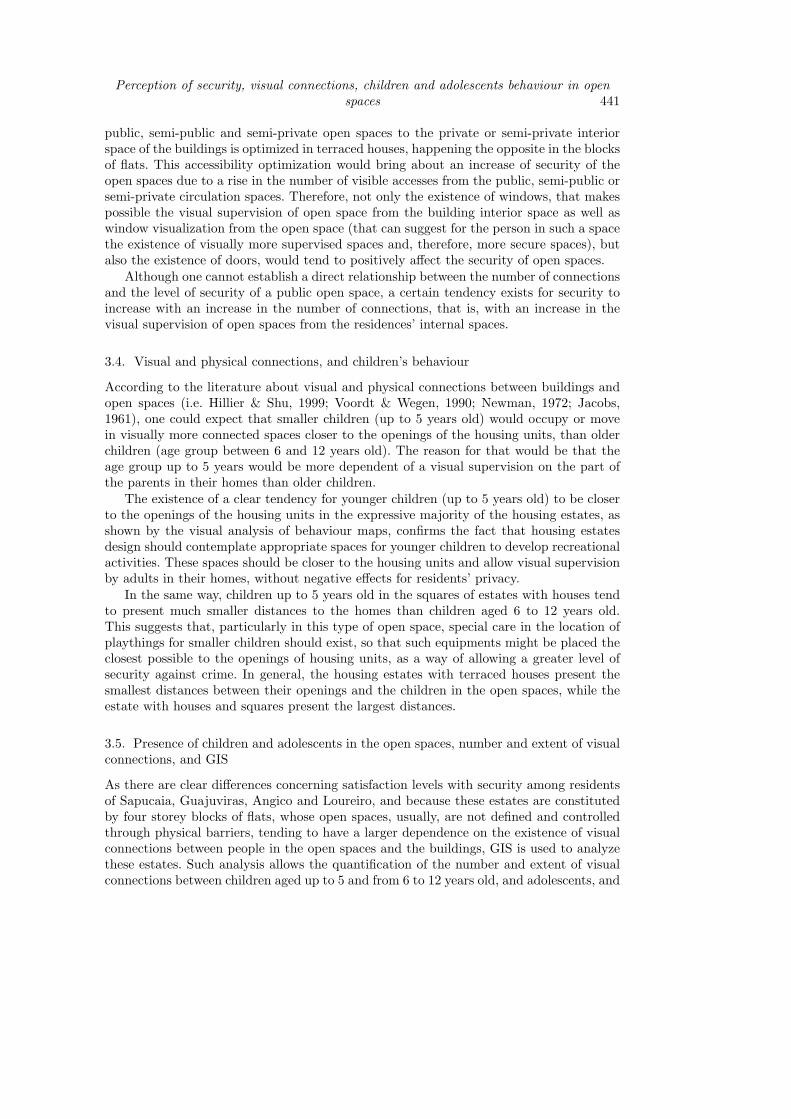
public, semi-public and semi-private open spaces to the private or semi-private interiorspace of the buildings is optimized in terraced houses, happening the opposite in the blocksof flats. This accessibility optimization would bring about an increase of security of theopen spaces due to a rise in the number of visible accesses from the public, semi-public orsemi-private circulation spaces. Therefore, not only the existence of windows, that makespossible the visual supervision of open space from the building interior space as well aswindow visualization from the open space (that can suggest for the person in such a spacethe existence of visually more supervised spaces and, therefore, more secure spaces), butalso the existence of doors, would tend to positively affect the security of open spaces.
Although one cannot establish a direct relationship between the number of connectionsand the level of security of a public open space, a certain tendency exists for security toincrease with an increase in the number of connections, that is, with an increase in thevisual supervision of open spaces from the residences’ internal spaces.
3.4. Visual and physical connections, and children’s behaviour
According to the literature about visual and physical connections between buildings andopen spaces (i.e. Hillier & Shu, 1999; Voordt & Wegen, 1990; Newman, 1972; Jacobs,1961), one could expect that smaller children (up to 5 years old) would occupy or movein visually more connected spaces closer to the openings of the housing units, than olderchildren (age group between 6 and 12 years old). The reason for that would be that theage group up to 5 years would be more dependent of a visual supervision on the part ofthe parents in their homes than older children.
The existence of a clear tendency for younger children (up to 5 years old) to be closerto the openings of the housing units in the expressive majority of the housing estates, asshown by the visual analysis of behaviour maps, confirms the fact that housing estatesdesign should contemplate appropriate spaces for younger children to develop recreationalactivities. These spaces should be closer to the housing units and allow visual supervisionby adults in their homes, without negative effects for residents’ privacy.
In the same way, children up to 5 years old in the squares of estates with houses tendto present much smaller distances to the homes than children aged 6 to 12 years old.This suggests that, particularly in this type of open space, special care in the location ofplaythings for smaller children should exist, so that such equipments might be placed theclosest possible to the openings of housing units, as a way of allowing a greater level ofsecurity against crime. In general, the housing estates with terraced houses present thesmallest distances between their openings and the children in the open spaces, while theestate with houses and squares present the largest distances.
3.5. Presence of children and adolescents in the open spaces, number and extent of visualconnections, and GIS
As there are clear differences concerning satisfaction levels with security among residentsof Sapucaia, Guajuviras, Angico and Loureiro, and because these estates are constitutedby four storey blocks of flats, whose open spaces, usually, are not defined and controlledthrough physical barriers, tending to have a larger dependence on the existence of visualconnections between people in the open spaces and the buildings, GIS is used to analyzethese estates. Such analysis allows the quantification of the number and extent of visualconnections between children aged up to 5 and from 6 to 12 years old, and adolescents, and

442 A. Reis, M. C. Lay, L. Muniz, V. Ambrosini
Figure 205: Explanatory diagram of the distances between people (p) in the open spacesand the openings of buildings (ab)
the ground floor openings of the housing units of these four housing estates with blocks(Table in fig 206).
The mean of average distances (Table in fig 206) between the openings and the childrenand adolescents in the open spaces indicates the mean of all average distances of each childand adolescent to all ground floor openings visualized by each of them (Figure 205). Forinstance, it is the mean of the average distances between p1 and the openings visualized byher (ab1, ab2, ab3, ab4, ab5 and ab6 - full line), between p2 and the openings visualized byher (ab1, ab2, ab3, ab4, ab5 and ab6 - dash-point line) and between p3 and the openingsvisualized by her (ab1, ab2, ab3, ab4, ab5 and ab6 - dashed line) (Figure 205). The largestand the smallest average distance indicate (Table in fig 206), respectively, the largest andthe smallest mean among the means of each child’s and adolescent distance to all theopenings visualized by each of them (Figure 205). Therefore, it is the largest and thesmallest of the average distances between p1 and the openings visualized by her (ab1,ab2, ab3, ab4, ab5 and ab6 - full line), between p2 and the openings visualized by her(ab1, ab2, ab3, ab4, ab5 and ab6 - dashed-point line) and between p3 and the openingsvisualized by her (ab1, ab2, ab3, ab4, ab5 and ab6 - dashed line) (Figure 205).
The mean of the minimum distances (Table in fig 206) indicates the mean of thesmallest distances between each child and adolescent and all the openings visualized byeach of them (Figure 205). For instance, it is the mean of the smallest distances betweenp1, p2 and p3 and the openings visualized by them, respectively, distances between p1and ab3, p2 and ab1 and between p3 and ab6 (Figure 205).
The largest and the smallest minimum distance (Table in fig 206) indicate, respectively,the largest and the smallest of the smallest distance between each child and adolescent andall the openings visualized by each of them (Figure 205). Consequently, it is the largest(distance between p2 and ab1 - dashed-point line) and the smallest (distance between p1and ab3 - full line) among the smallest distances between p1 and the openings visualizedby her (distance between p1 and ab3 - full line), between p2 and the openings visualizedby her (distance between p2 and ab1 - dashed-point line) and between p3 and the openingsvisualized by her (distance between p3 and ab6 - dashed line) (Figure 205).
Comparing among the estates with four storey blocks of flats the averages of youngerchildren’s (up to 5 years old) distances to the visualized ground floor openings of the

Perception of security, visual connections, children and adolescents behaviour in openspaces 443
Figure 206: Average and minimum distances between children and adolescents, and open-ings of the buildings and number of visual connections between them
buildings, it is observed that Sapucaia presents the smallest mean of the average distances,as well as the smallest mean of the minimum distances (Figures 207 to 209)2, althoughit doesn’t present the largest mean number of openings visualized by the children, whathappens in Loureiro/Angico (Table in fig 206). Considering that among the four estateswith blocks of flats analyzed through GIS, Sapucaia is that where the residents are the mostsatisfied with security, and that Loureiro and Angico are that where the residents are themost dissatisfied (Table 22), it seems that the measures of mean of average distances andof minimum distances between younger children and the visualized ground floor openingsof the buildings (Table in fig 206)3 are related to the satisfaction levels with the securityin the open spaces of housing estates. Hence, the fact of younger children being closer tothe openings of the buildings would tend to indicate a residential environment perceivedas more secure than those where younger children are less close to the openings of thebuildings.
However, this relationship between satisfaction levels with security and measures rep-resenting the mean of average distances and the mean of minimum distances (betweenyounger children and the visualized ground floor openings of the buildings) is not re-peated when older children (6 to 12 years old) and adolescents are considered (Table 22and table in fig. 206). Still, a relationship was not found between the considered age groups
2 In Figures 207, 208 and 209, black polygons represent buildings; black points represent children; whitepoints represent the openings; the numeric scale represents the distances in meters, increasing fromthe blue to the yellow; therefore, points in bluish areas (darker) present smaller minimum distancesto the openings than points in redder or yellowish areas.
3 The number of openings visualized by children and by adolescents indicates more and less visuallyconnected open spaces to the buildings

444 A. Reis, M. C. Lay, L. Muniz, V. Ambrosini
Figure 207: Younger children (up to 5 years old) minimum distances to the openings ofthe buildings - Loureiro/Angico
and the average number of openings visualized by them, in none of the housing estateswith blocks of flats considered in the analysis through GIS (Table in fig 206). Therefore,although these results don’t indicate a larger potential of the method of space analysisthrough GIS, developed and presented in this article, such method appears to have the po-tential to model the relationship between levels of security in the open spaces and youngerchildren’s distance to the openings of the buildings.
3.6. Perception of security, potential of movement and behaviour in open spaces
Mean depth values (Table in fig 206) show that Sapucaia (Figure 210) has the deep-est and most segregated grid (5.75) and the greatest number of pedestrian paths, whileLoureiro/Angico (Figure 212) have the shallowest and least segregated grid (3.53), and thesmallest number of pedestrian paths. Hence, while Loureiro/Angico present more choice ofaccess, Sapucaia present less choice of access, determining the movement of people throughspecific intermediate spaces in order to have access to the blocks of flats. Values of RelativeAsymmetry (RA) and Real Relative Asymmetry (RRA) reveals a small difference amongSapucaia, Guajuviras, and Loureiro/Angico, showing that Loureiro/Angico is the mostsegregated according to RA values and that Sapucaia is the most segregated according toRRA values (Table 234). Nonetheless, acknowledging that values of Relative Asymmetrytending to zero indicate an urban grid near to the theoretically most integrated (RA=0),favouring the movement of visitors, all three estates clearly tend to be more integratedthan segregated. On the other hand, considering that values of RRA, which allow for aproper comparison between systems of different sizes, tending to or superior to 1 reflectgrids with segregated areas, Sapucaia also present a segregated grid.
Looking at integration values (Table 24)5, Guajuviras presents the most integrated and
4 md= mean depth;∑
d = total depth; k=number of lines; RA = relative asymmetry; RRA = realrelative asymmetry; Dk = coefficient related to the number of lines which can be obtained from Hillier& Hanson (1984)
5 10 most integrated and segregated lines are ranked according to real integration values, from the mostto least integrated; real int.= real integration value

Perception of security, visual connections, children and adolescents behaviour in openspaces 445
Figure 208: Younger children (up to 5 years old) minimum distances to the openings ofthe buildings - Guajuviras
Table 23: Values of mean depth, Relative Asymmetry and Real Relative AsymmetrySapucaia estate
md =∑
d/k = 1046/182 = 5.75RA = 2(md− 1)/k − 2 = 2(5.75− 1)/182− 2 = 9.5/180 = 0.0527
RRA = RA/Dk = 0.0527/0.055 = 0.958Guajuviras estate
md =∑
d/k = 280/75 = 3.74RA = 2(md− 1)/k − 2 = 2(3.74− 1)/75− 2 = 5.48/73 = 0.075
RRA = RA/Dk = 0.075/0.103 = 0.728Loureiro/Angico estates
md =∑
d/k = 169/48 = 3.53RA = 2(md− 1)/k − 2 = 2(3.53− 1)/48− 2 = 5.06/46 = 0.11
RRA = RA/Dk = 0.11/0.137 = 0.803
Figure 209: Younger children (up to 5 years old) minimum distances to the openings ofthe buildings - Sapucaia 1
446 A. Reis, M. C. Lay, L. Muniz, V. Ambrosini
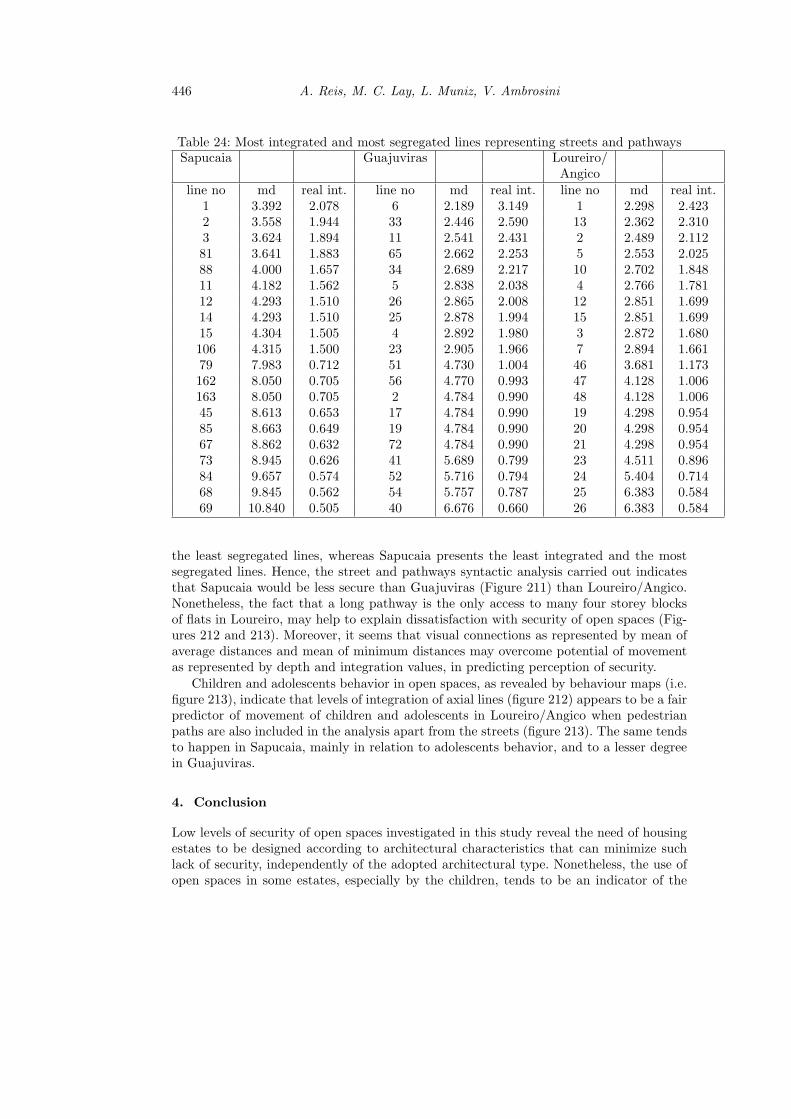
Table 24: Most integrated and most segregated lines representing streets and pathwaysSapucaia Guajuviras Loureiro/
Angicoline no md real int. line no md real int. line no md real int.
1 3.392 2.078 6 2.189 3.149 1 2.298 2.4232 3.558 1.944 33 2.446 2.590 13 2.362 2.3103 3.624 1.894 11 2.541 2.431 2 2.489 2.11281 3.641 1.883 65 2.662 2.253 5 2.553 2.02588 4.000 1.657 34 2.689 2.217 10 2.702 1.84811 4.182 1.562 5 2.838 2.038 4 2.766 1.78112 4.293 1.510 26 2.865 2.008 12 2.851 1.69914 4.293 1.510 25 2.878 1.994 15 2.851 1.69915 4.304 1.505 4 2.892 1.980 3 2.872 1.680106 4.315 1.500 23 2.905 1.966 7 2.894 1.66179 7.983 0.712 51 4.730 1.004 46 3.681 1.173162 8.050 0.705 56 4.770 0.993 47 4.128 1.006163 8.050 0.705 2 4.784 0.990 48 4.128 1.00645 8.613 0.653 17 4.784 0.990 19 4.298 0.95485 8.663 0.649 19 4.784 0.990 20 4.298 0.95467 8.862 0.632 72 4.784 0.990 21 4.298 0.95473 8.945 0.626 41 5.689 0.799 23 4.511 0.89684 9.657 0.574 52 5.716 0.794 24 5.404 0.71468 9.845 0.562 54 5.757 0.787 25 6.383 0.58469 10.840 0.505 40 6.676 0.660 26 6.383 0.584
the least segregated lines, whereas Sapucaia presents the least integrated and the mostsegregated lines. Hence, the street and pathways syntactic analysis carried out indicatesthat Sapucaia would be less secure than Guajuviras (Figure 211) than Loureiro/Angico.Nonetheless, the fact that a long pathway is the only access to many four storey blocksof flats in Loureiro, may help to explain dissatisfaction with security of open spaces (Fig-ures 212 and 213). Moreover, it seems that visual connections as represented by mean ofaverage distances and mean of minimum distances may overcome potential of movementas represented by depth and integration values, in predicting perception of security.
Children and adolescents behavior in open spaces, as revealed by behaviour maps (i.e.figure 213), indicate that levels of integration of axial lines (figure 212) appears to be a fairpredictor of movement of children and adolescents in Loureiro/Angico when pedestrianpaths are also included in the analysis apart from the streets (figure 213). The same tendsto happen in Sapucaia, mainly in relation to adolescents behavior, and to a lesser degreein Guajuviras.
4. Conclusion
Low levels of security of open spaces investigated in this study reveal the need of housingestates to be designed according to architectural characteristics that can minimize suchlack of security, independently of the adopted architectural type. Nonetheless, the use ofopen spaces in some estates, especially by the children, tends to be an indicator of the

Perception of security, visual connections, children and adolescents behaviour in openspaces 447
Figure 210: Axial map of Sapucaia housing estate considering streets and pathways
Figure 211: Axial map of Guajuviras housing estate considering streets and pathways
Figure 212: Axial map of Loureiro/Angico housing estates considering streets and path-ways

448 A. Reis, M. C. Lay, L. Muniz, V. Ambrosini
Figure 213: Behaviour map of children and adolescents in Loureiro/Angico
adequacy of such open spaces in terms of security.The relationship between the number of visual connections and security of public and
semi-public open spaces was more evident in the estates with blocks of flats, probablybecause of the lack of a clear territorial definition and control of open spaces. There was atendency for visual and functional connections to positively affect the use of open spaces.In expressive majority of the housing estates it was evident the proximity of childrenaged up to 5 years old to the openings of buildings, what tends to indicate a residentialenvironment perceived as more secure.
The method of space analysis through GIS revealed its potential to model the relation-ships between levels of security in the open spaces and the distance of children aged up to5 years old to the visualized ground floor openings of the buildings, through the measuresof mean of average distances and the mean of minimum distances between the childrenand the openings. However, in this case, as in relation to the children age group from 6to 12 years old and to the adolescents, new investigations are needed in order to check forthe reliability of the method. On the other hand, configurational space attributes such asdepth and integration, appears to be less strong in predicting perception of security thanthe above measures of visual and physical connections.
Concluding, based on the results presented in this article concerning the security ofthe open spaces, it is recommended:
• to maximize the amount of visual and physical connections between the buildingsand the streets and pathways
• to maximize the amount of visual and physical connections between the buildingsand the leisure areas, mainly for the smaller children, with clear territorial definitionand control, in order to optimize security and to minimize or stop acts of vandalism
• specifically, without negatively affecting residents’ privacy, to consider the possibilityof providing leisure areas for smaller children in the proximities of the homes
• to consider the possibility of establishing accesses to the buildings the closest possibleand clearly visible from the public space of street and pathways
Perception of security, visual connections, children and adolescents behaviour in openspaces 449
• to avoid the inclusion of areas that, due to the existence of visual obstacles (e.g.dense vegetation) can serve as favourable places for crimes
• to avoid or minimize the existence of long pathways as the only access to the housingunits
5. Acknowledgements
To the Federal Economic Bank (CEF) for financing the research and to the followinggrant holders of scientific initiation UFRGS/CNPq for the participation: Paulo GustavoBarreto, Graciela Melega, Selma Rubina and Camila Marquetto.
Literature
Basso, L., (2002) Influencia do Espaco Construıdo na Ocorrencia de Crimes em Con-juntos Habitacionais. PROPUR, Federal University of Rio Grande do Sul, PortoAlegre, unpublished Master thesis.
Francis, M., (1987) Urban Open Spaces, in: Zube, E. & Moore, G. (Ed.), Advances inEnvironment, Behaviour and Design, New York, Plenum Press, p. 71-102.
Hillier, B. and Shu, S., (1999) Do Burglars Understand Defensible Space? New Evi-dence on the Relation Between Crime and Space. http : //www.spacesyntax.org.
Hiller, B. and Hanson, J., (1984) The Social Logic of Space, Cambridge, CambridgeUniversity Press.
Jacobs, J., (1961) The Death and Life of Great American Cities, New York, RandomHouse.
Newman, O., (1972) Defensible Space - Crime Prevention Through Urban Design, NewYork, The Macmillan Company.
Poyner, B., (1983) Design Against Crime - Beyond Defensible Space, Cambridge, Uni-versity Press.
Reis, A. and Lay, M.C. (1996) Security in Private and Semi-private Housing Spacesin Brasil, Proceedings of the 27th EDRA Annual Conference-Public and PrivatePlaces, Salt Lake City, Utah, p. 117-123.
Reis, A., Portella, A., Bennett, J. and Lay, M.C., (2003) Accessibility and Se-curity: Syntactic and Perceptual Analysis in Two Low-Income Housing Estates, in:Proceedings Space Syntax. 4th International Symposium Hanson J (ed.), UniversityCollege London, London, p. 44.1- 44.12.
Voordt, D. and Wegen, H., (1990) Testing building plans for public safety: useful-ness of the Delft checklist, in: Netherlands Journal of Housing and EnvironmentalResearch, 5(2), p. 129-154.
Zanotto, K., (2002) Seguranca em Area Urbana Central: Configuracao, Forma Urbanae Usuario. PROPUR, Federal University of Rio Grande do Sul, Porto Alegre, un-published Master thesis.
