anthropogenic (and biomass burning) emissions at … (and biomass burning) emissions at the global...
TRANSCRIPT
Anthropogenic (and biomass burning) emissions at the global and regional scaleduring the past three decades
Claire Granier
CNRS and University Pierre and Marie Curie, Paris, France
NOAA Earth System Research Laboratory & University of Colorado/CIRES, Boulder, CO, USA
Max Planck Institute for Meteorology, Hamburg, Germany
Co-authors:
Katerina Sindelarova and Thierno Doumbia, CNRS and University Pierre and Marie Curie, Paris, France
Sabine Darras, Observatoire Midi-Pyrénées, CNRS, SEDOO, Toulouse, France
Hugo Denier van der Gon, TNO, Utrecht, The Netherlands
Gregory Frost, Thomas Ryerson, Michael Trainer, and Karen RosenlofNOAA Earth System Research Laboratory
Birgit Hassler, NOAA Earth System Research Laboratory & University of Colorado/CIRES, Boulder, CO, USA
Catherine Liousse, Laboratoire d’Aérologie, Toulouse, France
Greet Maenhout- Janssens, Joint Research Center, Ispra, Italy
Michael Gauss, met.no, Norway
Barbara Barletta, University of California at Irvine, Irvine, CA, USA
Erika von Schneidemesser, IASS, Postdam, Germany
Johannes Kaiser, ECMWF, Reading, UK and MPI for Chemistry, Mainz, Germany
Outline:
Goal of the work
Short description of the most recent global/regional inventories
Evaluation of anthropogenic emissions from 1960 to 2012
Evaluation of VOCs speciation: preliminary results
First results of the evaluation of emissions from fires since 1900
Conclusions and future work
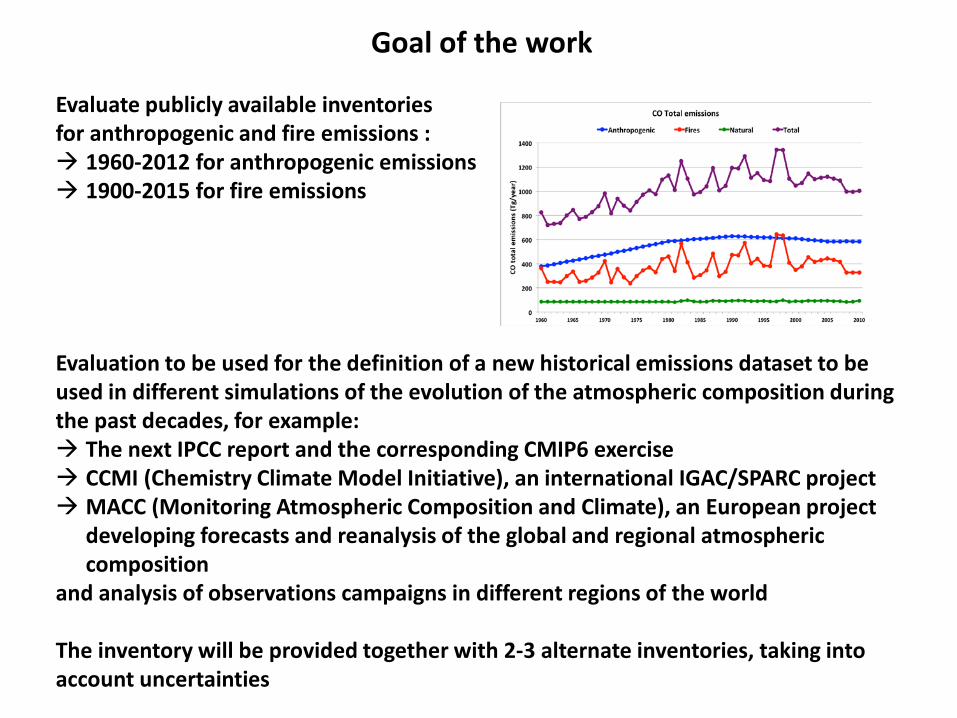
Goal of the work
Evaluate publicly available inventories for anthropogenic and fire emissions : 1960-2012 for anthropogenic emissions 1900-2015 for fire emissions
Evaluation to be used for the definition of a new historical emissions dataset to be used in different simulations of the evolution of the atmospheric composition during the past decades, for example: The next IPCC report and the corresponding CMIP6 exercise CCMI (Chemistry Climate Model Initiative), an international IGAC/SPARC project MACC (Monitoring Atmospheric Composition and Climate), an European project
developing forecasts and reanalysis of the global and regional atmospheric composition
and analysis of observations campaigns in different regions of the world
The inventory will be provided together with 2-3 alternate inventories, taking into account uncertainties
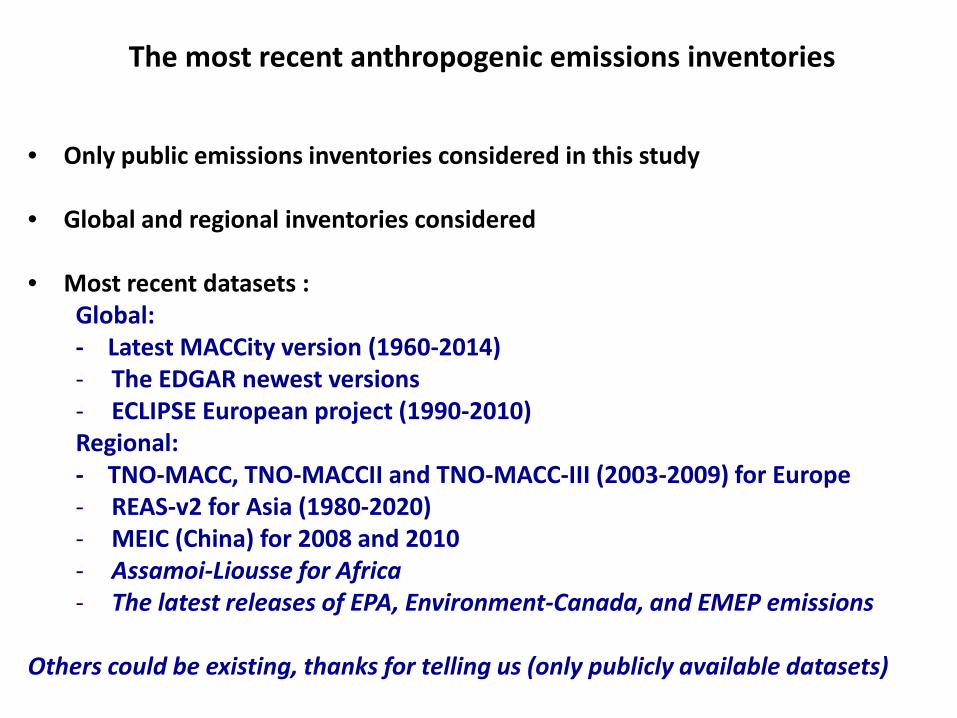
The most recent anthropogenic emissions inventories
• Only public emissions inventories considered in this study
• Global and regional inventories considered
• Most recent datasets :Global: - Latest MACCity version (1960-2014) - The EDGAR newest versions- ECLIPSE European project (1990-2010) Regional: - TNO-MACC, TNO-MACCII and TNO-MACC-III (2003-2009) for Europe - REAS-v2 for Asia (1980-2020) - MEIC (China) for 2008 and 2010- Assamoi-Liousse for Africa - The latest releases of EPA, Environment-Canada, and EMEP emissions
Others could be existing, thanks for telling us (only publicly available datasets)
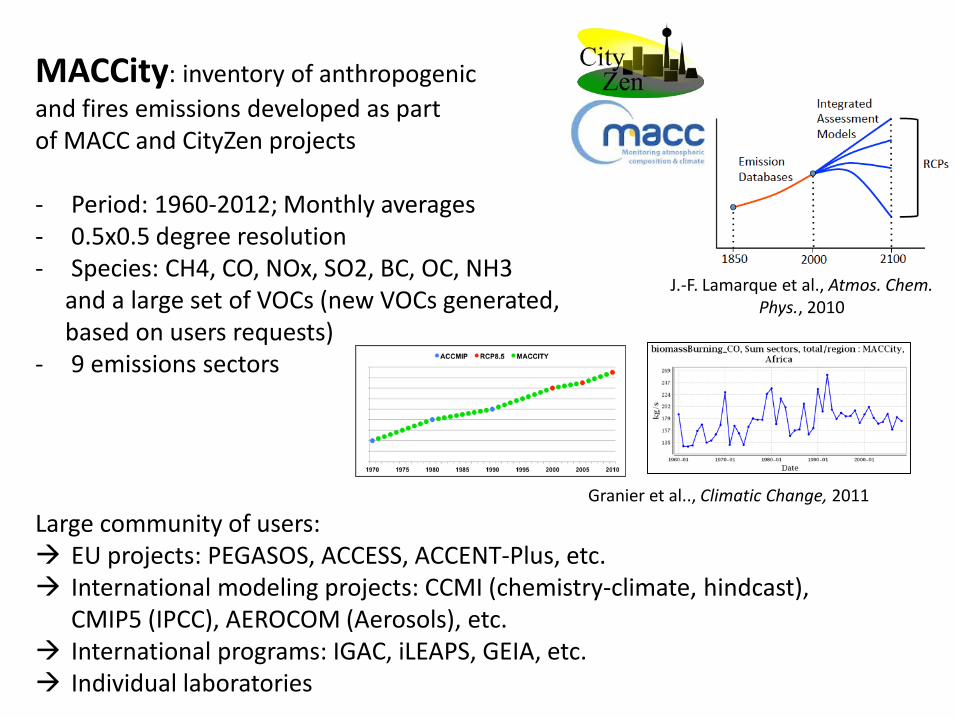
MACCity: inventory of anthropogenic and fires emissions developed as part of MACC and CityZen projects
- Period: 1960-2012; Monthly averages- 0.5x0.5 degree resolution- Species: CH4, CO, NOx, SO2, BC, OC, NH3
and a large set of VOCs (new VOCs generated, based on users requests)
- 9 emissions sectors
Large community of users: EU projects: PEGASOS, ACCESS, ACCENT-Plus, etc. International modeling projects: CCMI (chemistry-climate, hindcast),
CMIP5 (IPCC), AEROCOM (Aerosols), etc. International programs: IGAC, iLEAPS, GEIA, etc. Individual laboratories
J.-F. Lamarque et al., Atmos. Chem. Phys., 2010
Granier et al.., Climatic Change, 2011
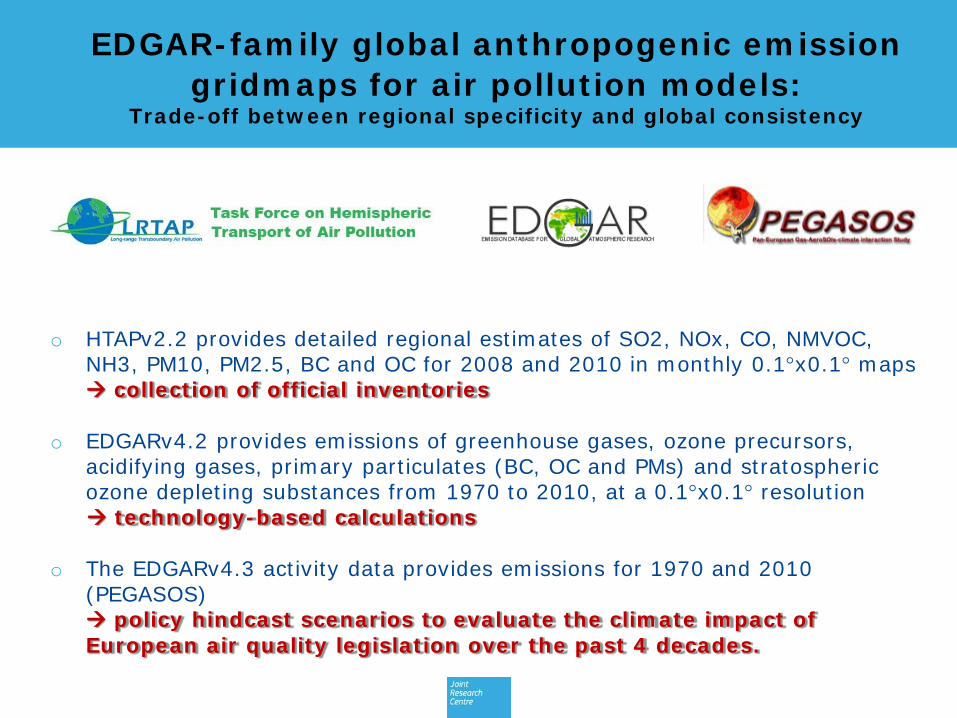
EDGAR-family global anthropogenic emission gridmaps for air pollution models:
Trade-off between regional specificity and global consistency
o HTAPv2.2 provides detailed regional estimates of SO2, NOx, CO, NMVOC, NH3, PM10, PM2.5, BC and OC for 2008 and 2010 in monthly 0.1°x0.1° maps collection of official inventories
o EDGARv4.2 provides emissions of greenhouse gases, ozone precursors, acidifying gases, primary particulates (BC, OC and PMs) and stratospheric ozone depleting substances from 1970 to 2010, at a 0.1°x0.1° resolution technology-based calculations
o The EDGARv4.3 activity data provides emissions for 1970 and 2010 (PEGASOS) policy hindcast scenarios to evaluate the climate impact of European air quality legislation over the past 4 decades.
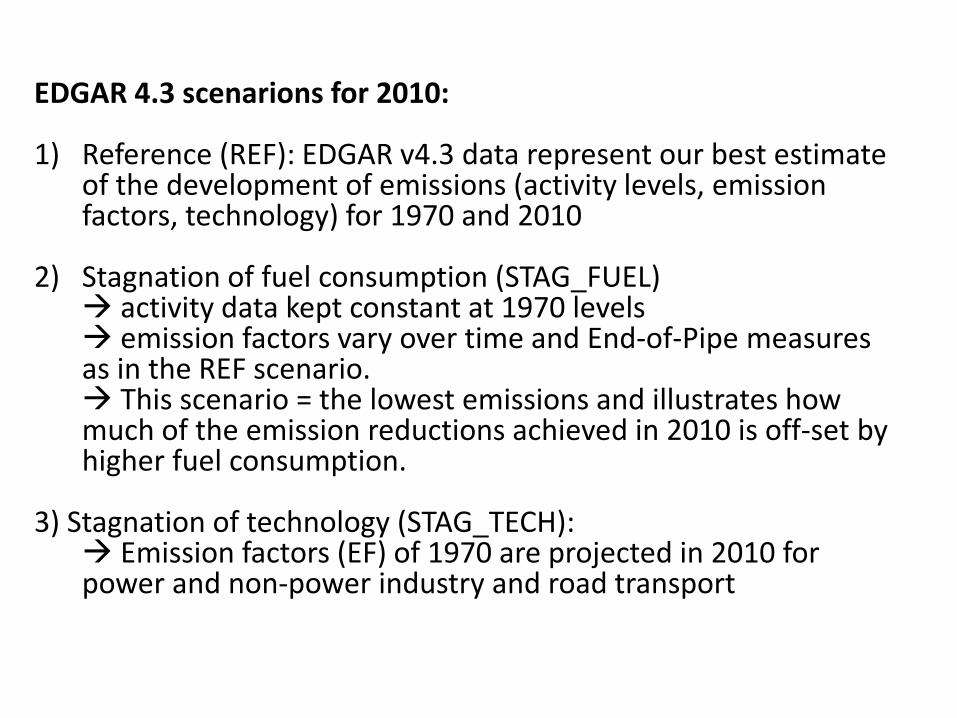
EDGAR 4.3 scenarions for 2010:
1) Reference (REF): EDGAR v4.3 data represent our best estimate of the development of emissions (activity levels, emission factors, technology) for 1970 and 2010
2) Stagnation of fuel consumption (STAG_FUEL) activity data kept constant at 1970 levels emission factors vary over time and End-of-Pipe measures as in the REF scenario. This scenario = the lowest emissions and illustrates how much of the emission reductions achieved in 2010 is off-set by higher fuel consumption.
3) Stagnation of technology (STAG_TECH): Emission factors (EF) of 1970 are projected in 2010 for power and non-power industry and road transport
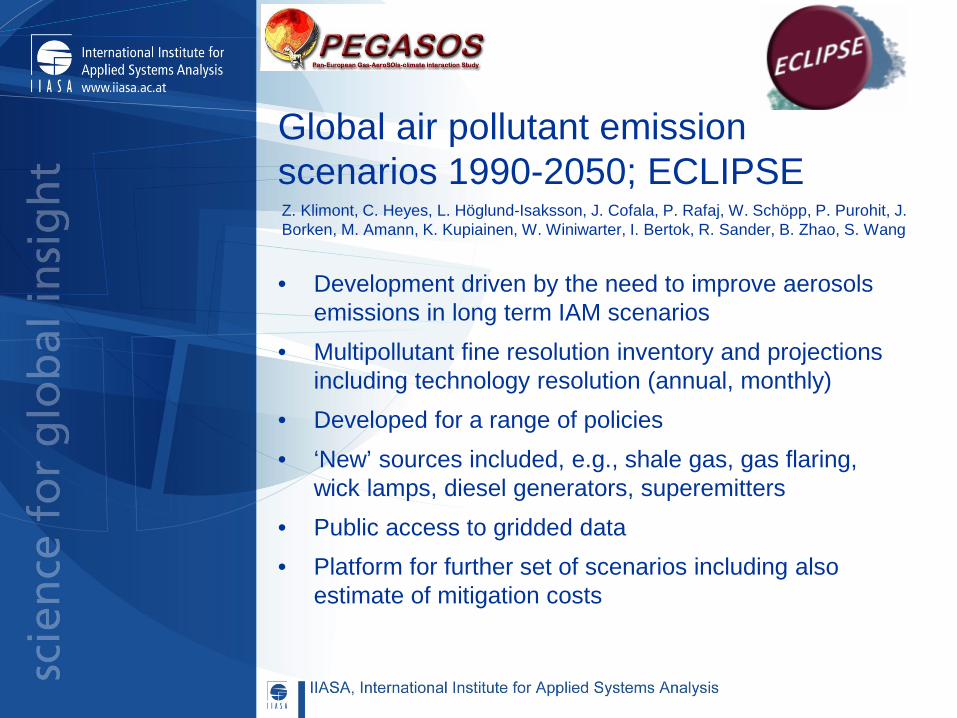
Global air pollutant emission scenarios 1990-2050; ECLIPSE
• Development driven by the need to improve aerosols emissions in long term IAM scenarios
• Multipollutant fine resolution inventory and projections including technology resolution (annual, monthly)
• Developed for a range of policies• ‘New’ sources included, e.g., shale gas, gas flaring,
wick lamps, diesel generators, superemitters• Public access to gridded data• Platform for further set of scenarios including also
estimate of mitigation costs
Z. Klimont, C. Heyes, L. Höglund-Isaksson, J. Cofala, P. Rafaj, W. Schöpp, P. Purohit, J. Borken, M. Amann, K. Kupiainen, W. Winiwarter, I. Bertok, R. Sander, B. Zhao, S. Wang
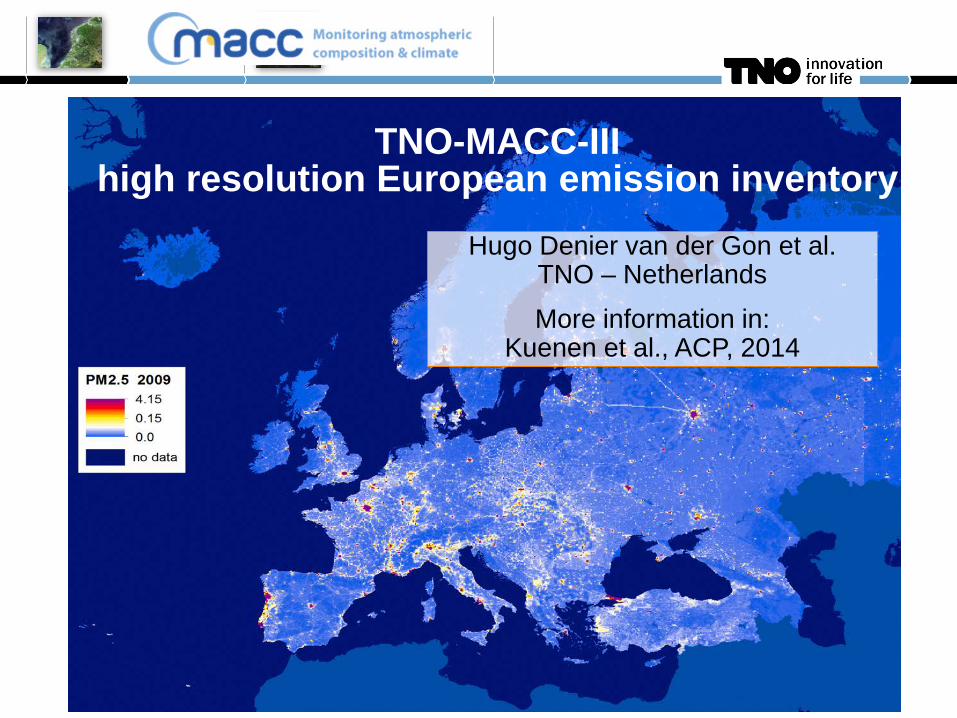
TNO-MACC-III high resolution European emission inventory
Hugo Denier van der Gon et al.TNO – Netherlands
More information in: Kuenen et al., ACP, 2014

The TNO-MACC-III regional European emission inventory
New version of the TNO-MACC (2003-2007) and TNO-MACC-II (2003-2009) (Kuenen et al. 2011 and Pouliot et al. 2012)
Coverage UNECE-Europe; resolution ~7 x 7kmReanalysis of reported emissions data: extended time series starting in year 2000 instead of 2003, all years revisited.Addition of 2 new years, period covered in MACC-III 2000-2011New European shipping emissions trend 2000-2011 based on review of available data and expert knowledge.Spatial distribution proxies were updated and/or improved (Industry, wood combustion, population, shipping), often based on user comments
Inclusion of CO2 emissions (with a split in fossil – biofuel) expected before Summer 2015
March 03, 2015Hugo Denier van der GonTNO-MACC_III emission data
11
Documentation: Kuenen et al., ACP, 2014http://www.atmos-chem-phys.net/14/10963/2014/acp-14-10963-2014.pdf

Shipping emission trend for NOx and SO2 in new MACC-III inventory
March 03, 2015Hugo Denier van der GonTNO-MACC_III emission data
12
Impact of crisis: fuel saving by slow
steaming, larger ships
Impact of crisis for NOx + SECA for SO2(2 x; 2007;2010)
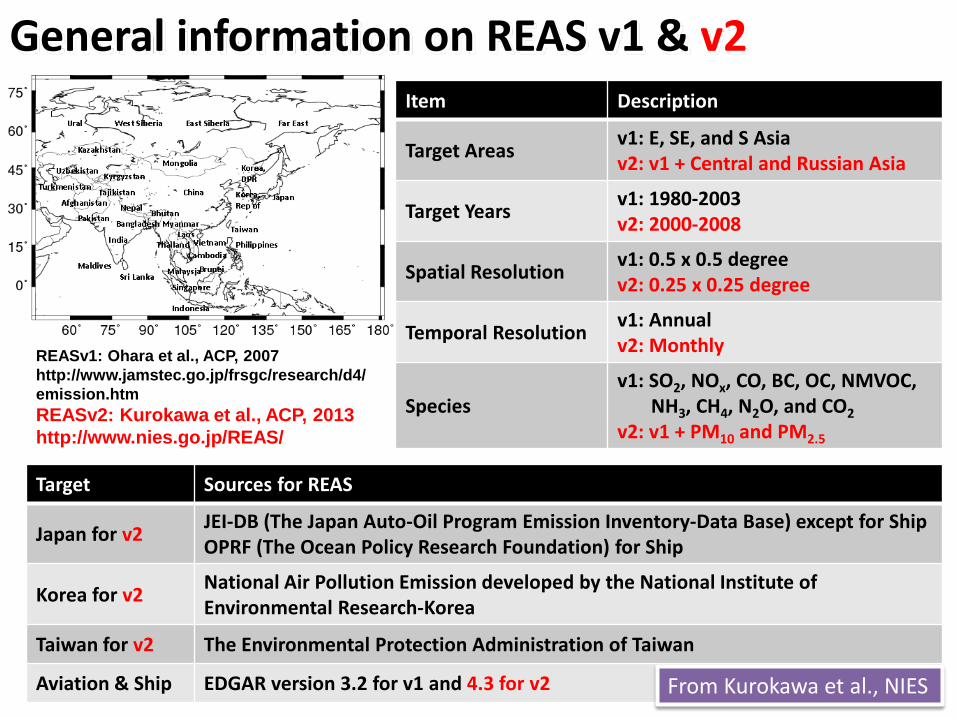
General information on REAS v1 & v2Item Description
Target Areas v1: E, SE, and S Asiav2: v1 + Central and Russian Asia
Target Years v1: 1980-2003v2: 2000-2008
Spatial Resolution v1: 0.5 x 0.5 degreev2: 0.25 x 0.25 degree
Temporal Resolution v1: Annualv2: Monthly
Speciesv1: SO2, NOx, CO, BC, OC, NMVOC,
NH3, CH4, N2O, and CO2v2: v1 + PM10 and PM2.5
REASv1: Ohara et al., ACP, 2007http://www.jamstec.go.jp/frsgc/research/d4/emission.htmREASv2: Kurokawa et al., ACP, 2013http://www.nies.go.jp/REAS/
Target Sources for REAS
Japan for v2 JEI-DB (The Japan Auto-Oil Program Emission Inventory-Data Base) except for ShipOPRF (The Ocean Policy Research Foundation) for Ship
Korea for v2 National Air Pollution Emission developed by the National Institute of Environmental Research-Korea
Taiwan for v2 The Environmental Protection Administration of Taiwan
Aviation & Ship EDGAR version 3.2 for v1 and 4.3 for v2 From Kurokawa et al., NIES
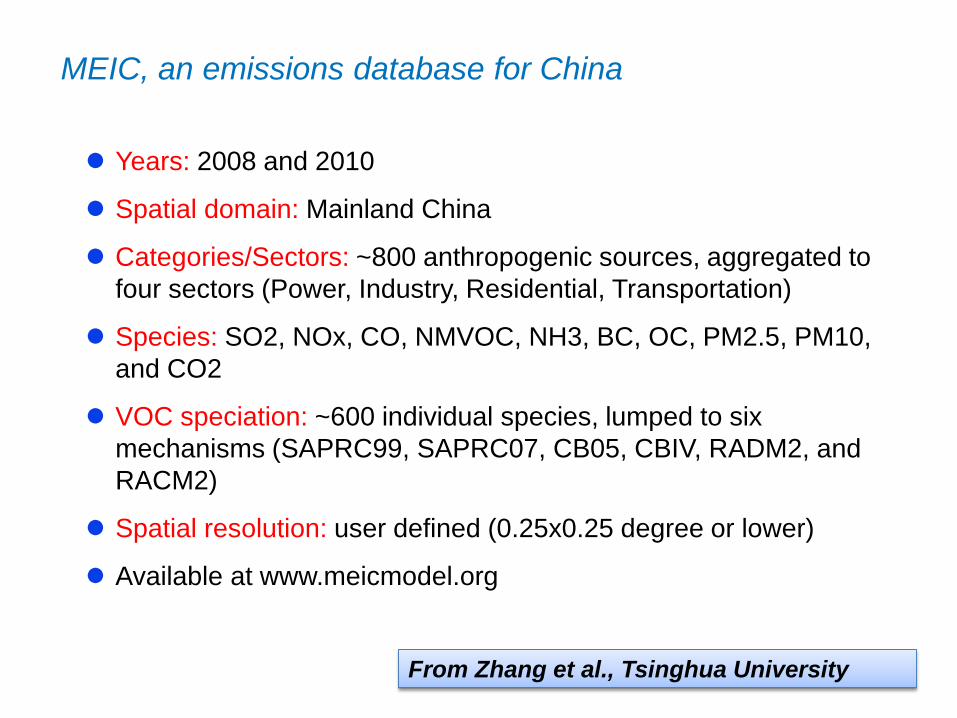
MEIC, an emissions database for China
Years: 2008 and 2010
Spatial domain: Mainland China
Categories/Sectors: ~800 anthropogenic sources, aggregated to four sectors (Power, Industry, Residential, Transportation)
Species: SO2, NOx, CO, NMVOC, NH3, BC, OC, PM2.5, PM10, and CO2
VOC speciation: ~600 individual species, lumped to six mechanisms (SAPRC99, SAPRC07, CB05, CBIV, RADM2, and RACM2)
Spatial resolution: user defined (0.25x0.25 degree or lower)
Available at www.meicmodel.org
From Zhang et al., Tsinghua University
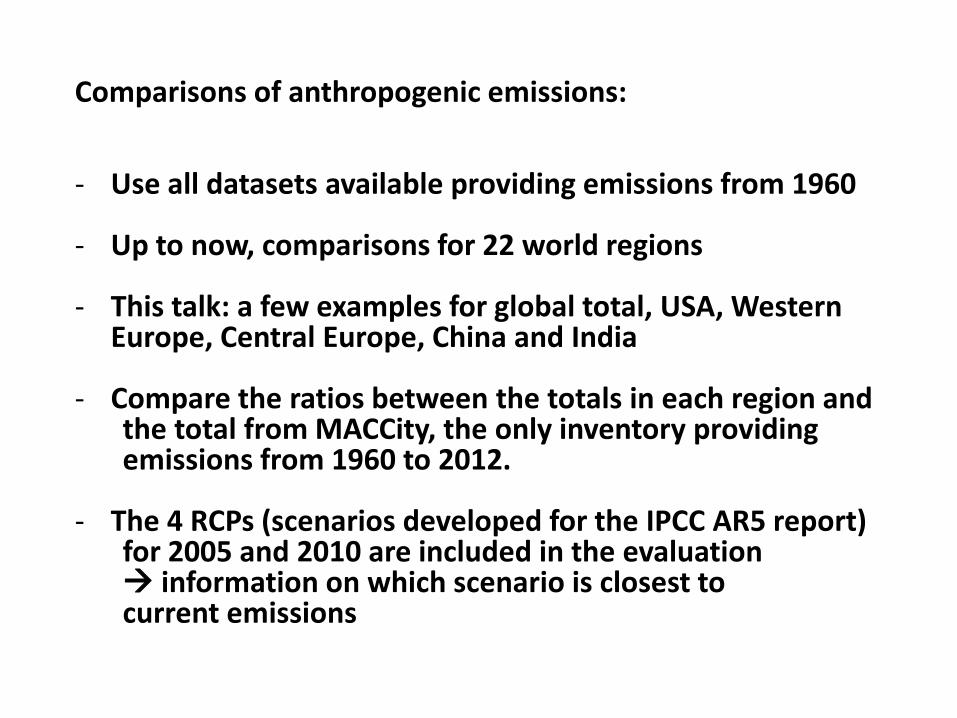
Comparisons of anthropogenic emissions:
- Use all datasets available providing emissions from 1960
- Up to now, comparisons for 22 world regions
- This talk: a few examples for global total, USA, Western Europe, Central Europe, China and India
- Compare the ratios between the totals in each region and the total from MACCity, the only inventory providing emissions from 1960 to 2012.
- The 4 RCPs (scenarios developed for the IPCC AR5 report)for 2005 and 2010 are included in the evaluation information on which scenario is closest to current emissions

CO and NOx global emissionsGlobal Total Ratio to MACCity (MACCity = 1)
1960 2000 2005 2010
1960 2000 2005 2010 1960 2000 2005 2010
1960 2000 2005 2010
CO
NOx ratioNOx
CO ratio

CO and NOx global emissionsGlobal Total Ratio to MACCity (MACCity = 1)
1960 2000 2005 2010
1960 2000 2005 2010 1960 2000 2005 2010
1960 2000 2005 2010
CO
NOx ratio: 0.6-1.3NOx
CO ratio: 0.7-1.4

SO2 and NH3 global emissionsGlobal Total Ratio to MACCity
1960 2000 2005 2010
1960 2000 2005 2010 1960 2000 2005 2010
1960 2000 2005 2010
SO2
NH3 ratio: 0.7-1.4NH3
SO2 ratio: 0.6-1.3
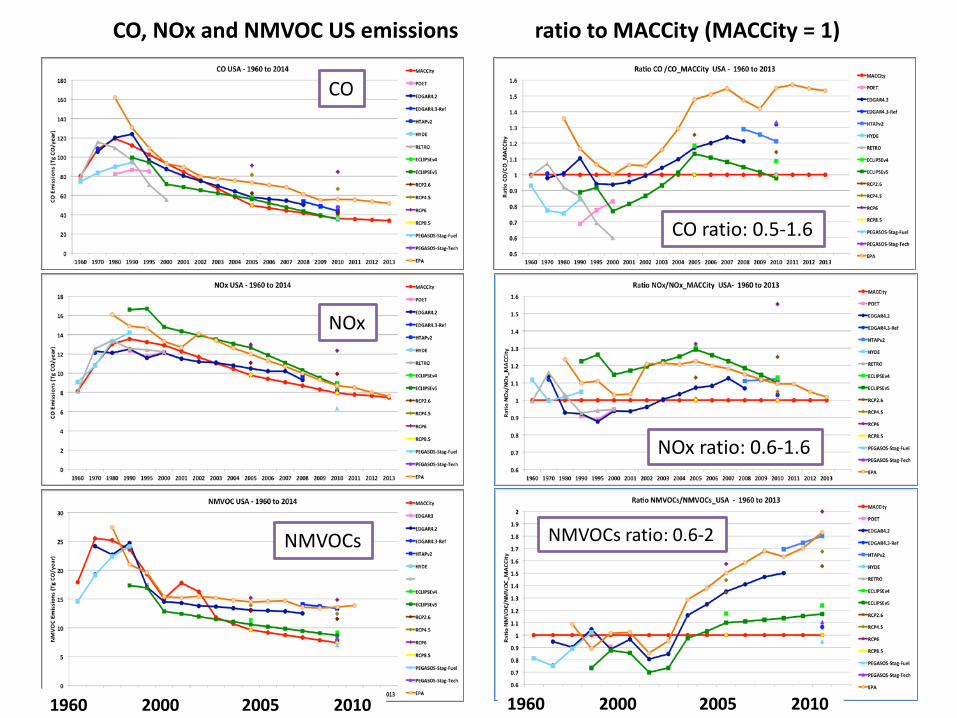
CO, NOx and NMVOC US emissions ratio to MACCity (MACCity = 1)
CO
NOx ratio: 0.6-1.6
NOx
NMVOCs NMVOCs ratio: 0.6-2
1960 2000 2005 2010 1960 2000 2005 2010
CO ratio: 0.5-1.6
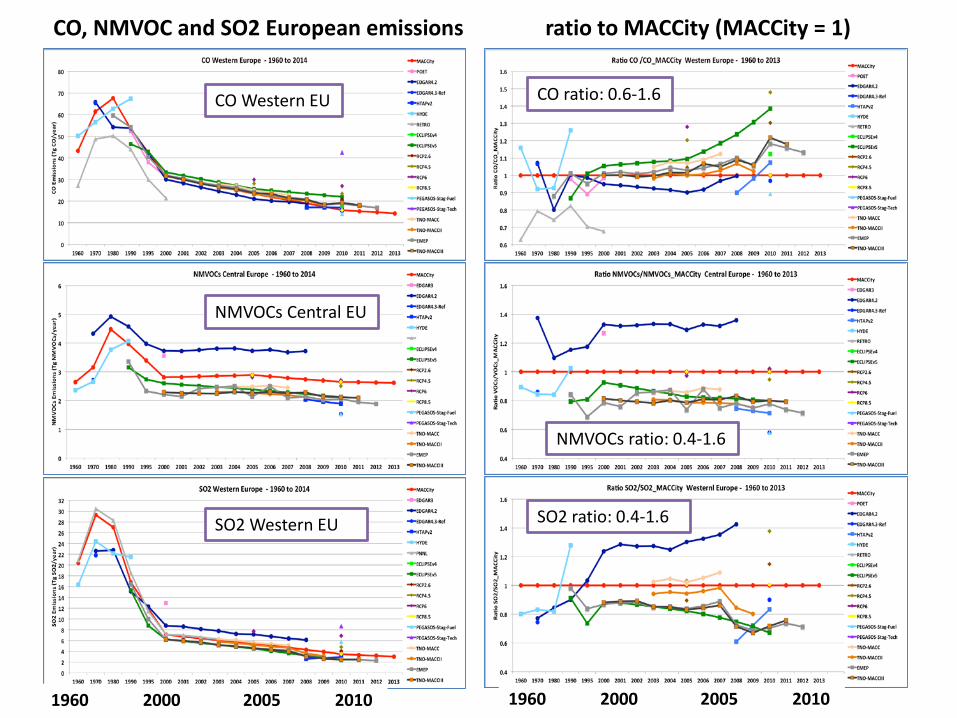
CO, NMVOC and SO2 European emissions ratio to MACCity (MACCity = 1)
1960 2000 2005 2010 1960 2000 2005 2010
CO Western EU
NMVOCs ratio: 0.4-1.6
NMVOCs Central EU
SO2 Western EU
CO ratio: 0.6-1.6
SO2 ratio: 0.4-1.6
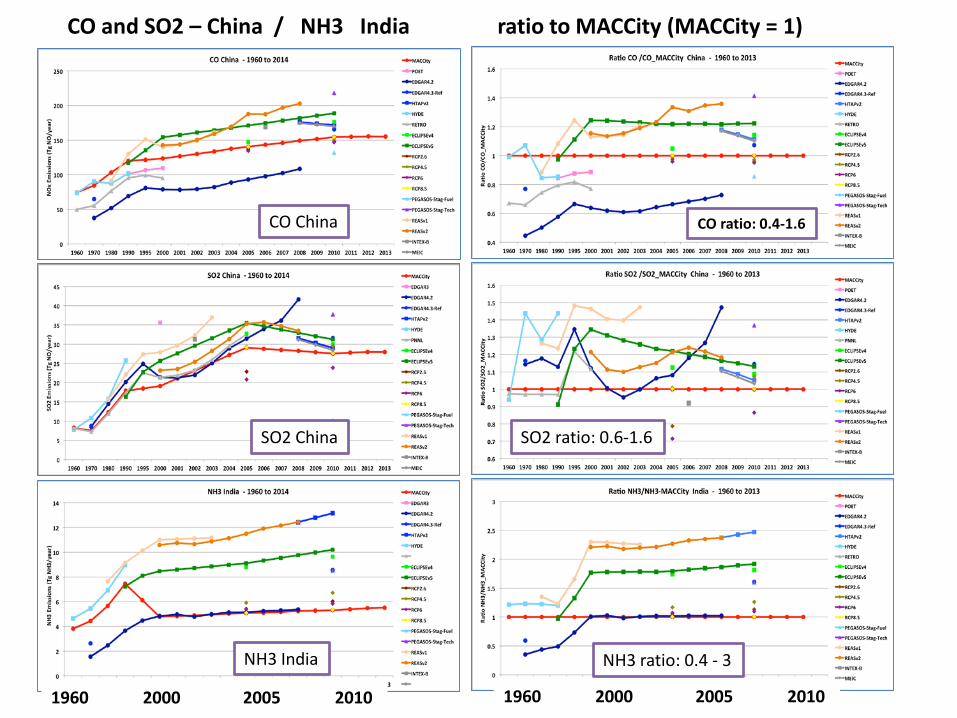
CO and SO2 – China / NH3 India ratio to MACCity (MACCity = 1)
1960 2000 2005 2010 1960 2000 2005 2010
CO China CO ratio: 0.4-1.6
SO2 China SO2 ratio: 0.6-1.6
NH3 India NH3 ratio: 0.4 - 3
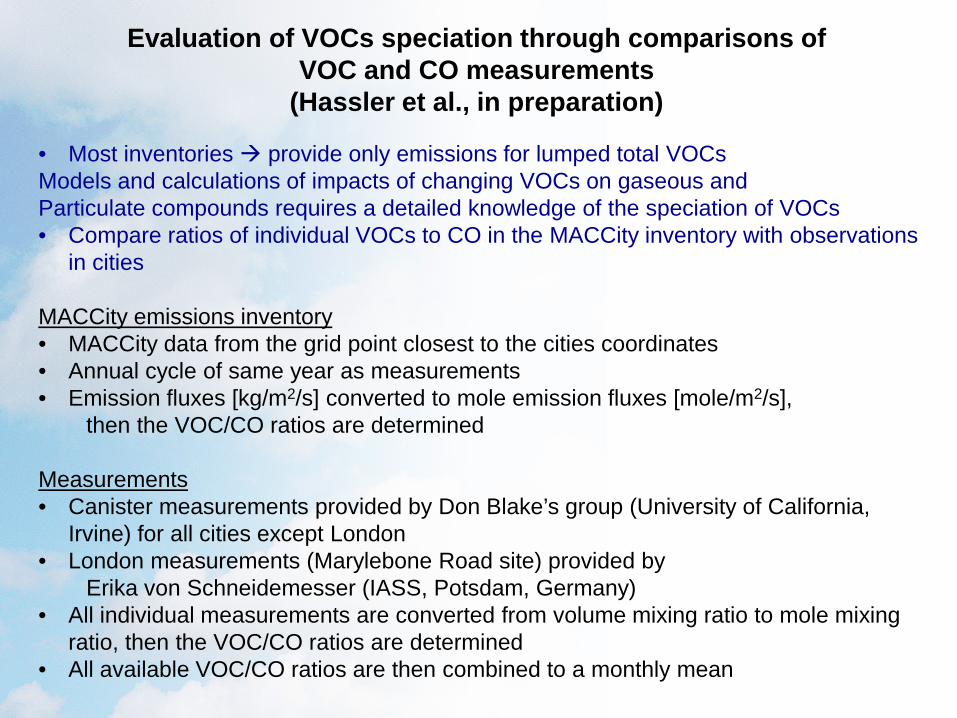
• Most inventories provide only emissions for lumped total VOCsModels and calculations of impacts of changing VOCs on gaseous andParticulate compounds requires a detailed knowledge of the speciation of VOCs• Compare ratios of individual VOCs to CO in the MACCity inventory with observations
in cities
MACCity emissions inventory• MACCity data from the grid point closest to the cities coordinates• Annual cycle of same year as measurements• Emission fluxes [kg/m2/s] converted to mole emission fluxes [mole/m2/s],
then the VOC/CO ratios are determined
Measurements• Canister measurements provided by Don Blake’s group (University of California,
Irvine) for all cities except London• London measurements (Marylebone Road site) provided by
Erika von Schneidemesser (IASS, Potsdam, Germany)• All individual measurements are converted from volume mixing ratio to mole mixing
ratio, then the VOC/CO ratios are determined• All available VOC/CO ratios are then combined to a monthly mean
Evaluation of VOCs speciation through comparisons of VOC and CO measurements
(Hassler et al., in preparation)
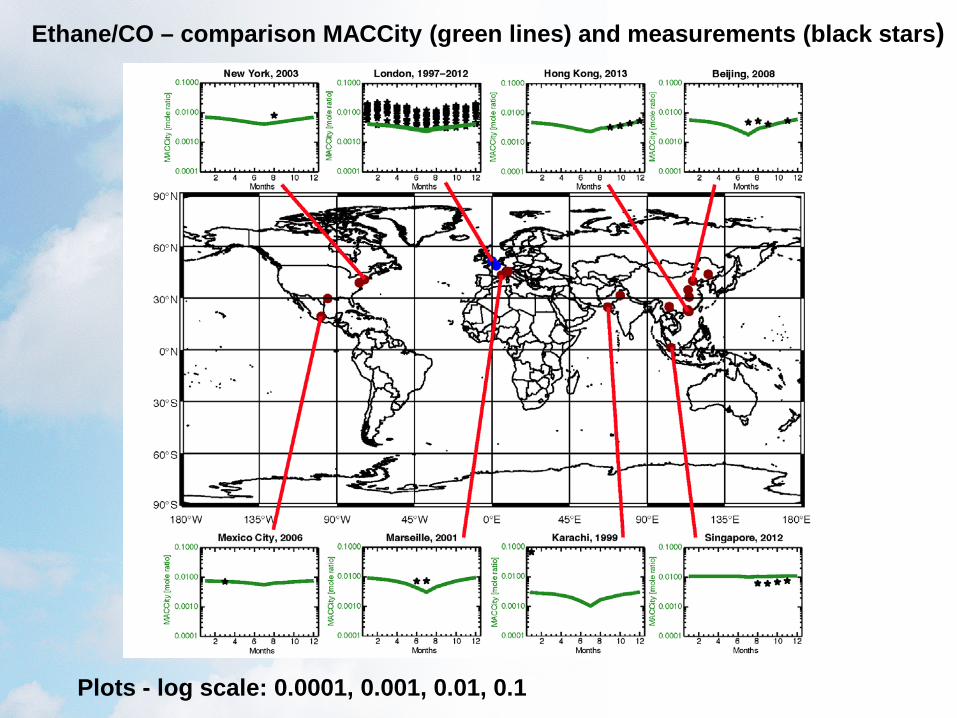
Ethane/CO – comparison MACCity (green lines) and measurements (black stars)
Plots - log scale: 0.0001, 0.001, 0.01, 0.1
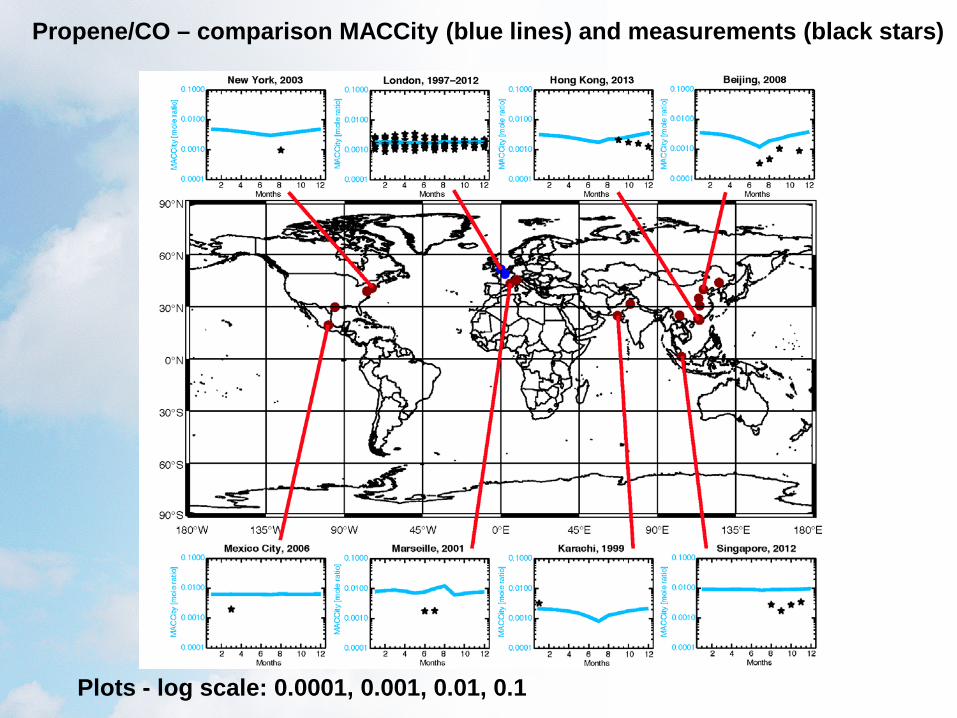
Propene/CO – comparison MACCity (blue lines) and measurements (black stars)
Plots - log scale: 0.0001, 0.001, 0.01, 0.1
Evaluation of emissions from fires for the past decades
Goal of the work: Evaluate the differences between existing biomass burning inventories and define a “best” inventory for the 1750-2015 period.
No inventory exist for the pre-1900 period Need to use fire models coupled with earth-system models.
Datasets considered in this study:
Fire models: - MPI-ref and MPI-popd : from the Max Planck Institute for Meteorology (S. Kloster and G. Lasslop), Hamburg, Germany- SIMFIRE: from the SIMFIRE model (Knorr et al., 2014)
Inventories:GICC (Mieville et al., 2010): Inventory based on an historical reconstruction for 1900 to 2000Inventories based on satellite observations: MACCity/ACCMIP (Granier et al., 2011) - GFED2 (van der Werf et al., 2006)GFED3 (van der Werf et al., 2010) - FINNv1.5 (Wiedinmyer et al., 2011)GFASv1.0 (Kaiser et al., 2012)
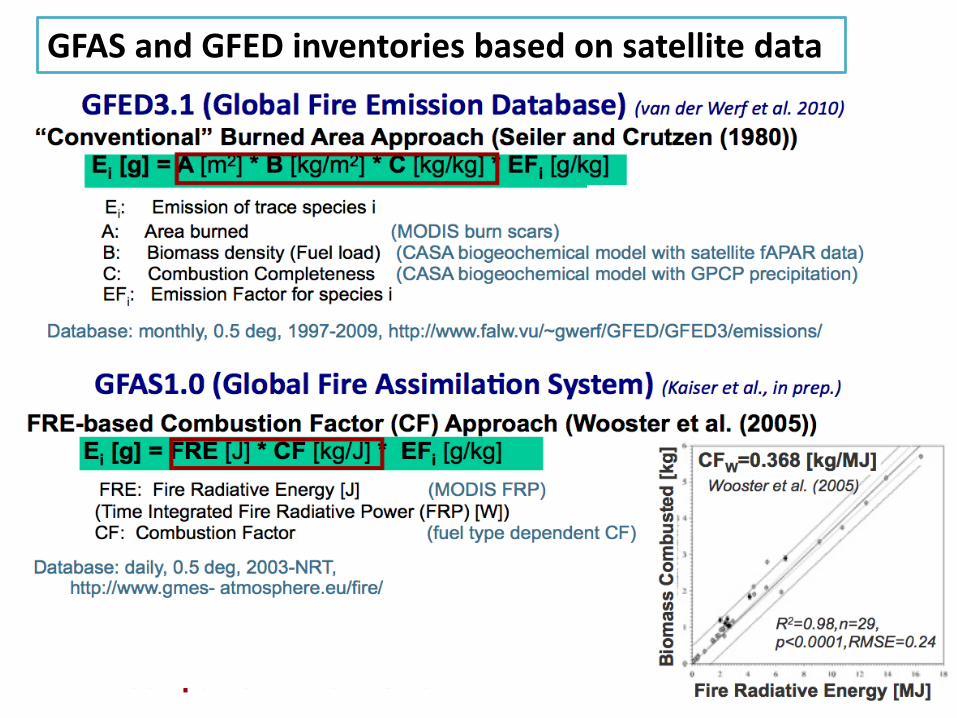
GFAS and GFED inventories based on satellite data
GFAS and GFED inventories based on satellite data
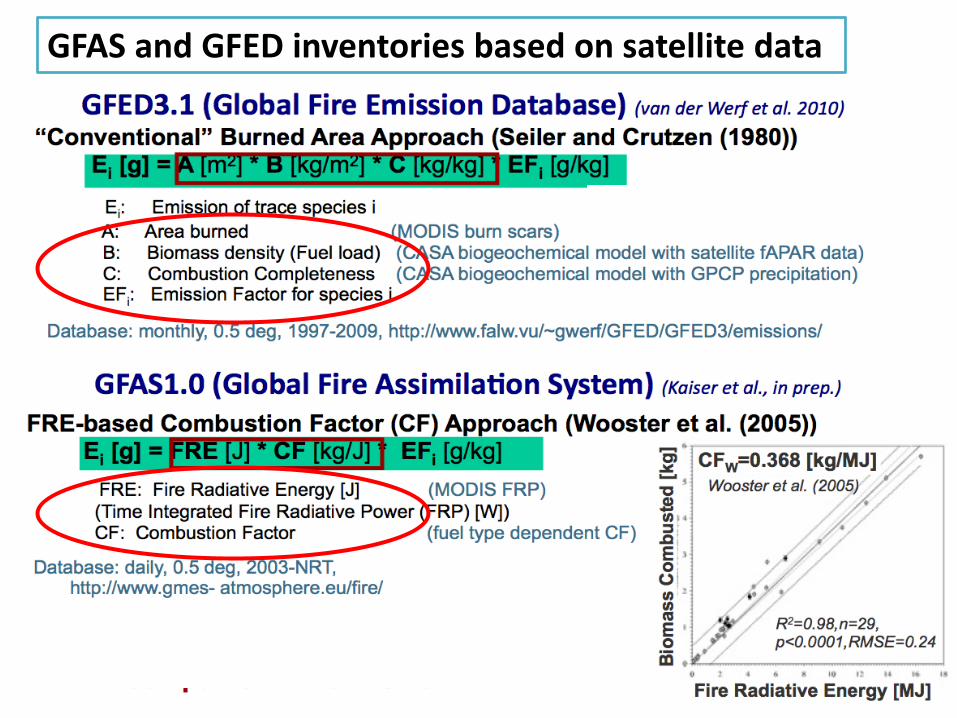
Publicly available at: http://www.gmes-atmosphere.eu/fire/0.1deg (GFASv1.2): GRIB and NetCDF(ECMWF ftp server)0.1deg (GFASv1.1): KMZ0.5deg (GFASv1.0): GIF, KML, NetCDF (FZ Jülich), NetCDF & ASCII(available on ECCAD, 1 month behind real time)
NRT production of daily FRP and fire emissions
From USDA Forest Service

Mean seasonal CO emissions for 14 selected regions and theworld for 2003 until 2011.
Emissions are shown for three different fire emission inventories:GFAS, GFED and FINN.
(From Andela et al., Univ. Amsterdam)
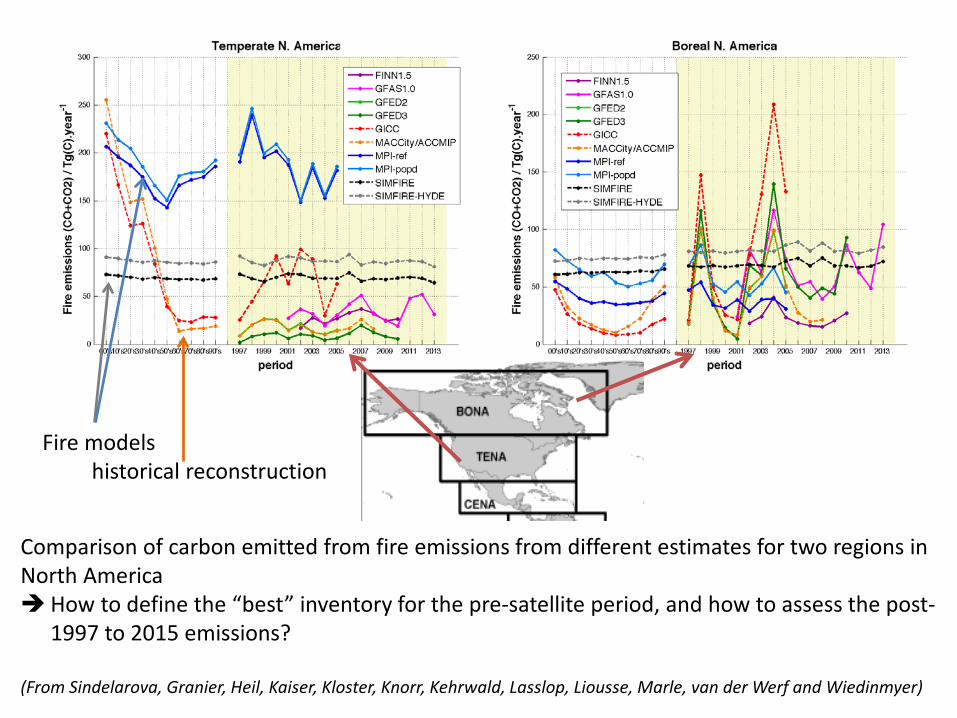
Comparison of carbon emitted from fire emissions from different estimates for two regions in North AmericaHow to define the “best” inventory for the pre-satellite period, and how to assess the post-
1997 to 2015 emissions?
(From Sindelarova, Granier, Heil, Kaiser, Kloster, Knorr, Kehrwald, Lasslop, Liousse, Marle, van der Werf and Wiedinmyer)
Fire modelshistorical reconstruction
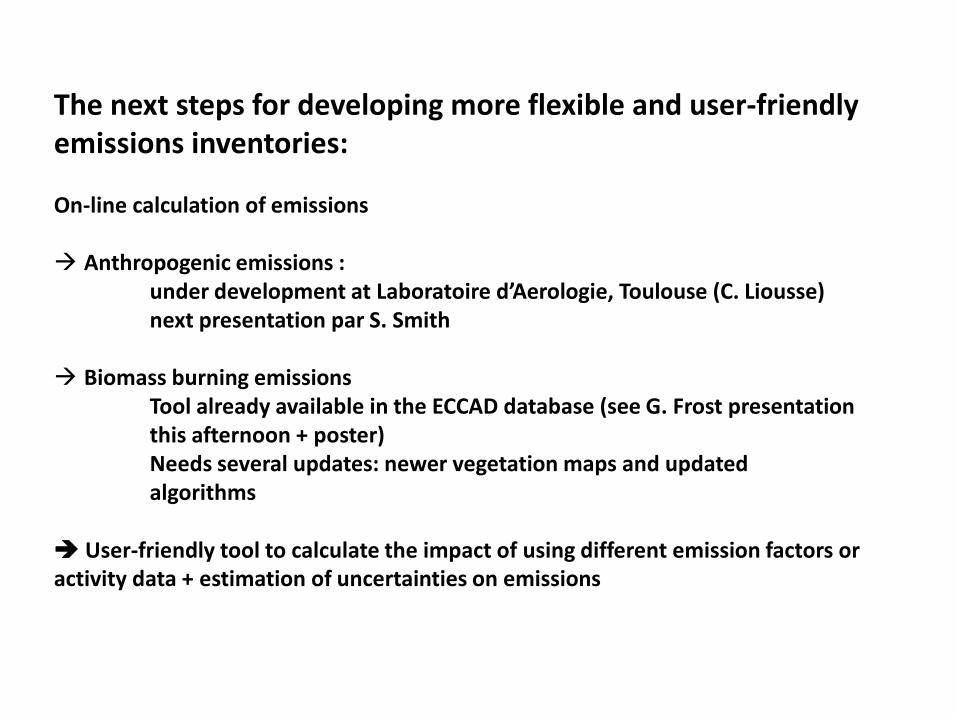
The next steps for developing more flexible and user-friendly emissions inventories:
On-line calculation of emissions
Anthropogenic emissions : under development at Laboratoire d’Aerologie, Toulouse (C. Liousse)next presentation par S. Smith
Biomass burning emissionsTool already available in the ECCAD database (see G. Frost presentationthis afternoon + poster)Needs several updates: newer vegetation maps and updatedalgorithms
User-friendly tool to calculate the impact of using different emission factors or activity data + estimation of uncertainties on emissions

On line emission calculation tool
On line emission calculationFlexiblity
Uncertainty
Under developmentBy C. Liousse and
colleaguesat Laboratoire d’Aerologie,
Toulouse
Tool= OLE-CAPEDB
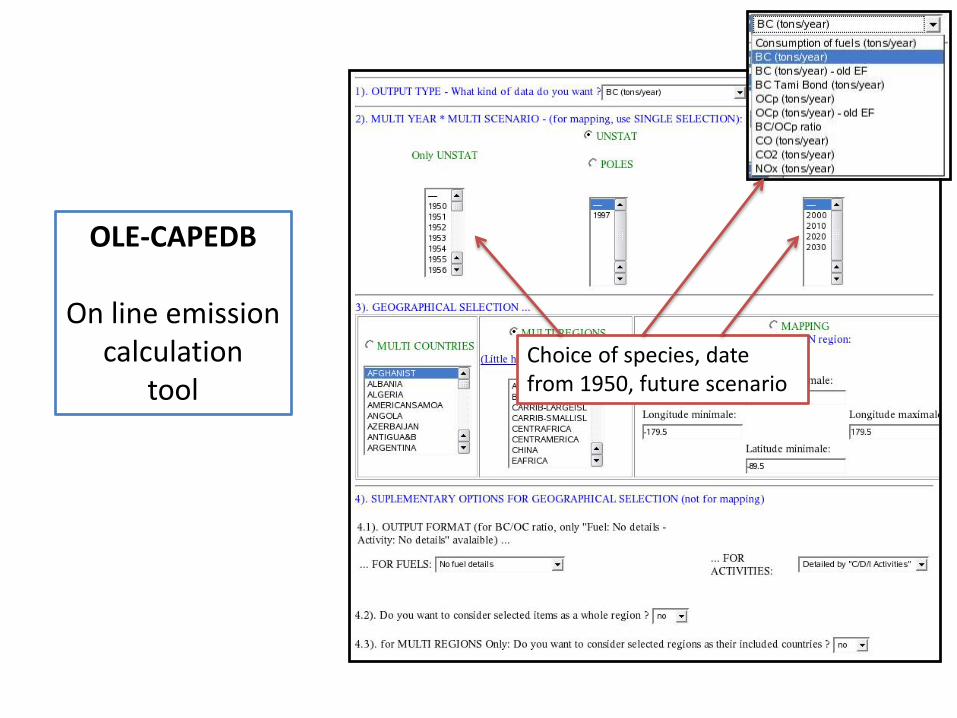
Choice of species, date from 1950, future scenario
OLE-CAPEDB
On line emissioncalculation
tool

On line emission calculation
Choice of region, type of fuel, output, etc.
OLE-CAPEDB
On line emissioncalculation
tool
Conclusions
- Significant differences between emissions provided by different inventoriesin all regions of the world.
- Comparisons of available datasets will allow a quantification on the uncertainties on emissions.
- Large differences between the VOCs/CO ratios identified: use of surface observations from monitoring stations could help defining better speciations
- Very large differences among datasets providing emissions from fires in all regions
- Papers on the evaluation of anthropogenic emissions, VOCs speciation and evaluation of emissions from fires are in preparation
Interested in participating? send an email to [email protected]