anthony s. bryk sheeo annual meeting washington, d.c. … 1100 anthony bryk.pdf · deliberate...
TRANSCRIPT

Anthony S. Bryk
SHEEO Annual Meeting
Washington, D.C.
July 9, 2013

SHEEO Open Letter, Fall 2012
• “Our achievements have grown more slowly than our needs and aspirations…”
• “While the U.S. has many excellent schools and colleges, our future is at risk because we have not achieved excellence at scale”
2
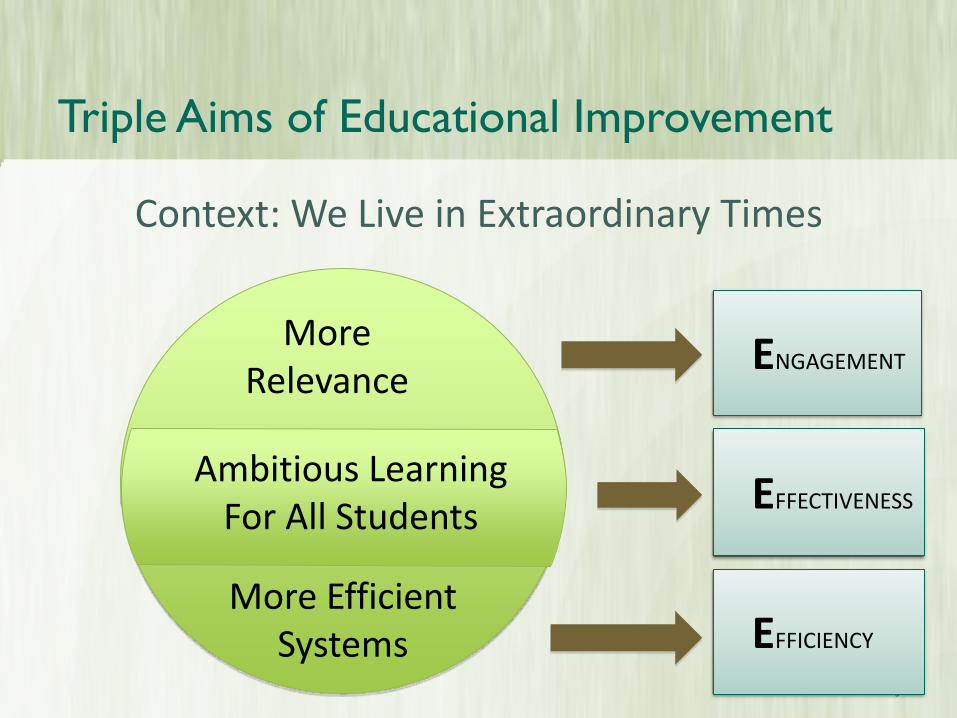
Triple Aims of Educational Improvement
3
EFFICIENCY
EFFECTIVENESS
ENGAGEMENT
Context: We Live in Extraordinary Times
More Efficient Systems
Ambitious Learning For All Students
More Relevance

How We Work Now: Tower of Babel Problem
4
The Educational R&D Problem
• Accelerate Improvement Efforts
• Aim for Quality, Reliably at Scale
5

Networked Improvement Communities:
What are they?
Integrating Two Big Ideas:
• The rudiments of Improvement Science
joined to
• The Power of Networks
Accelerating Learning in and through Practice to Improve

An Inspiration: Improvement Science in Healthcare
Protecting 5 Million from Harm,
Saving 100,000 Lives

8
A second source
of inspiration:
the power of
networks
Six Principles Guide the Work
(plus useful tools to scaffold the activity)
9
Taken Together:
• Disciplined Inquiry
• Rudiments a scientific community
• Aim: systematic practice improvement

I. Problem- & User-Centered
• What is the specific problem we’re trying to solve?
• What we tend to do now: a general issue comes into view and we jump on solutions

The Organizing Problem: Poor Completion Rates from
Developmental Math to College-level Credit

12
The Community College NIC , 2013
40 Community Colleges
4 State
Universities 11 States
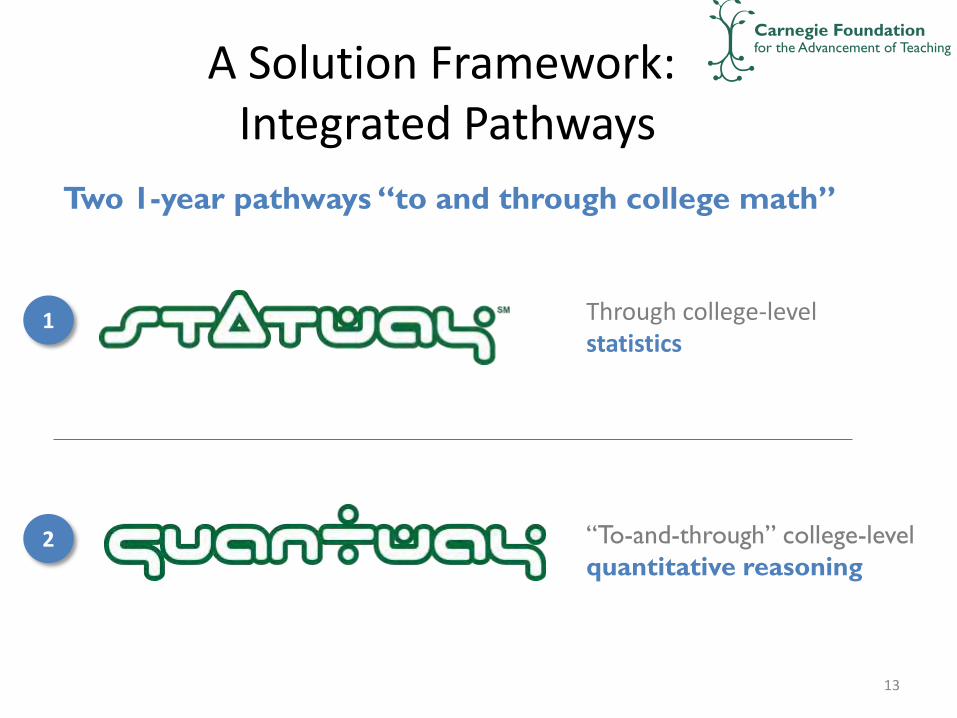
A Solution Framework: Integrated Pathways
13
Through college-level statistics
“To-and-through” college-level
quantitative reasoning
Two 1-year pathways “to and through college math”
1
2
II. Variation in Performance is the problem to solve
• Typical question asked: “Does it Work?”
• 50 years of educational intervention
– Most everything can be made to work somewhere and nothing work everywhere

First Year Results:
Statway vs. Traditional Sequence

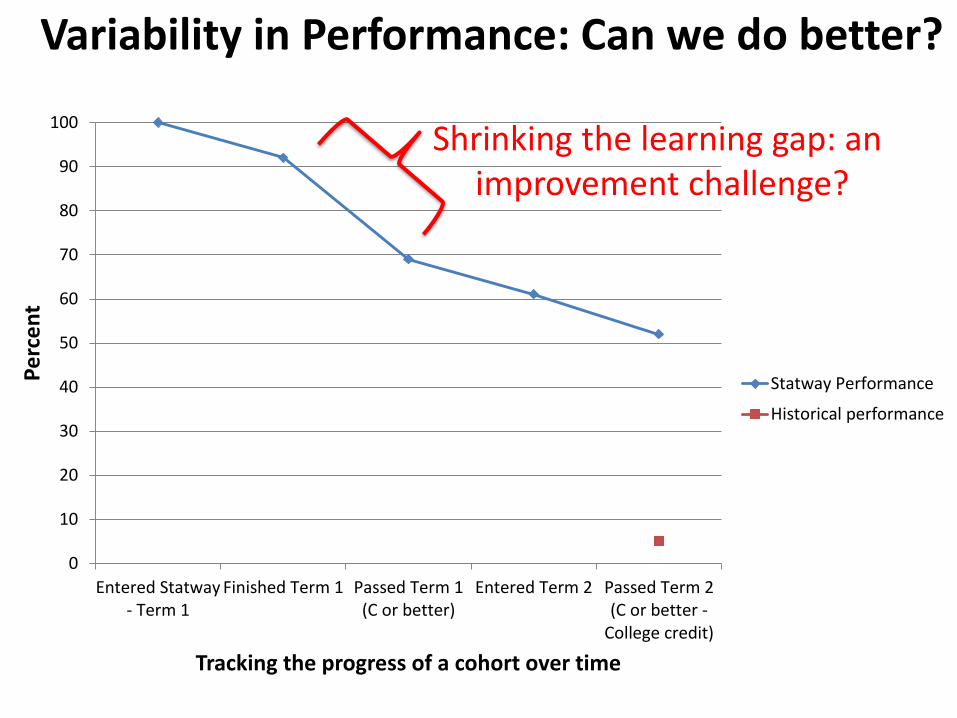
Variation in Performance is the problem to solve
• Yes it can work, but…
• Real Issue: Quality Improvement Question
“How to advance effectiveness among diverse faculty engaging varied populations of students and working in different organizational contexts?”
• Goal: Achieve efficacy with reliability at scale
0
10
20
30
40
50
60
70
80
90
100
Entered Statway- Term 1
Finished Term 1 Passed Term 1(C or better)
Entered Term 2 Passed Term 2(C or better -
College credit)
Pe
rce
nt
Tracking the progress of a cohort over time
Statway Performance
Historical performance
Variability in Performance: Can we do better?
Shrinking the learning gap: an improvement challenge?
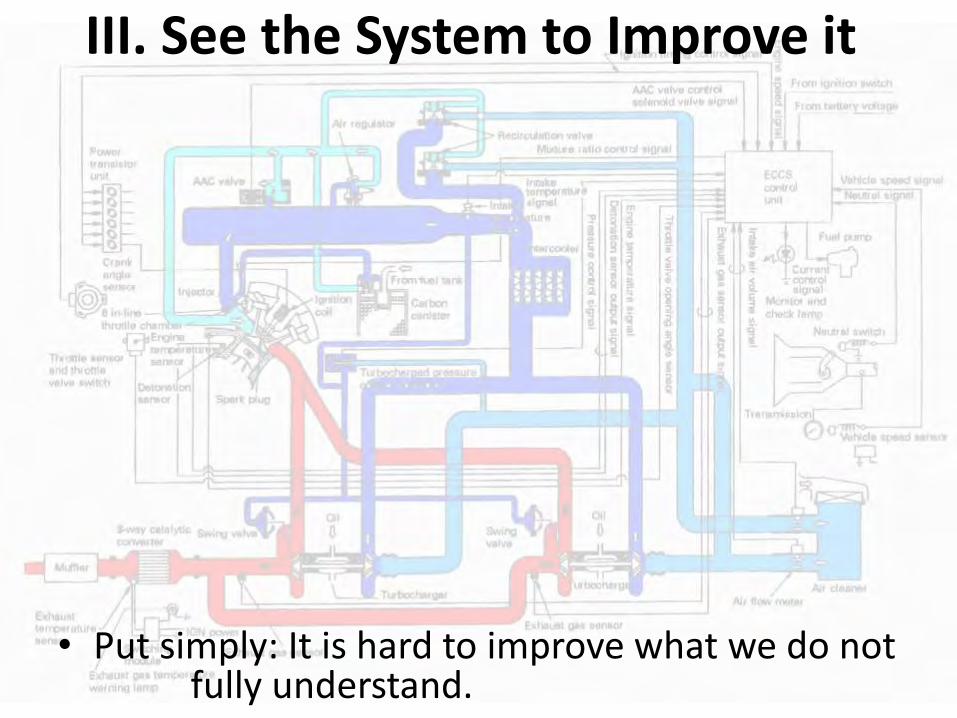
III. See the System to Improve it
• Put simply: It is hard to improve what we do not fully understand.

The Orienting Problem
Embedded literacy and language barriers
Extraordinarily high failure rates among students assigned to developmental math instruction
Lose large # of students at the transitions
Consolidate the courses into a 1-year pathway
Students mindsets undermine success
Real world problems from statistics as the organizer
Students “gone” before we know it
Psycho-social interventions aimed at “productive persistence”
Rapid analytics capacity
Course material are not engaging
Faculty development
A Community Explicates its Causal Thinking:
Root Cause Analysis
Primary Causes for High Failure Rates
Organizing Improvement Hypotheses
Eventually leads to a “Pathways Strategy”
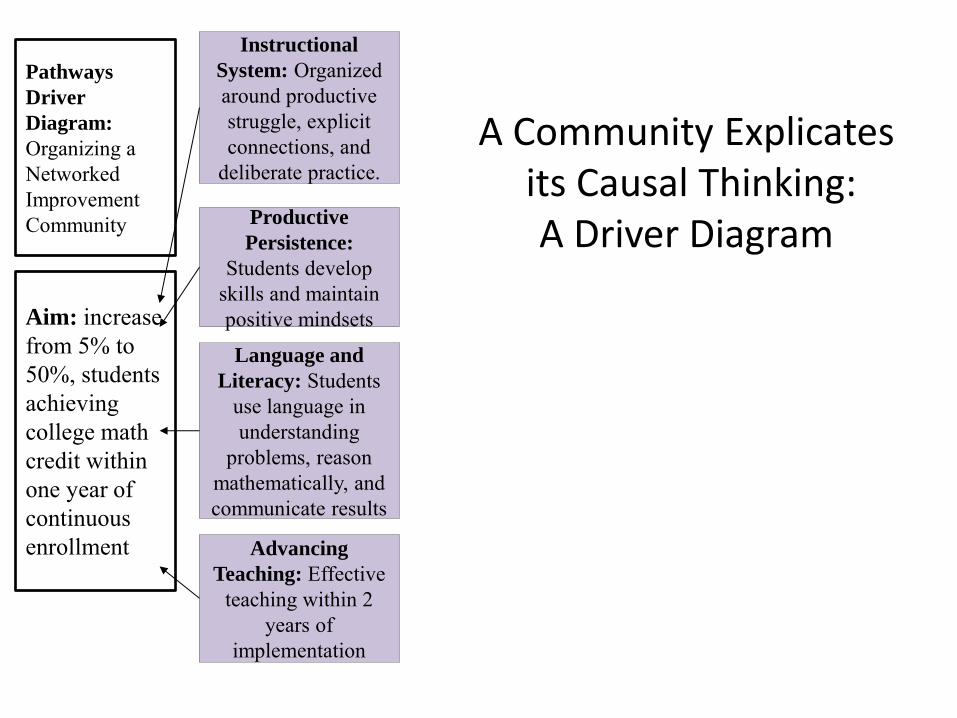
Pathways
Driver
Diagram:
Organizing a Networked Improvement Community
Aim: increase from 5% to 50%, students achieving college math credit within one year of continuous enrollment
Instructional
System: Organized around productive struggle, explicit connections, and
deliberate practice.
Productive
Persistence:
Students develop skills and maintain positive mindsets
Language and
Literacy: Students use language in understanding
problems, reason mathematically, and communicate results
Advancing
Teaching: Effective teaching within 2
years of implementation
Reduce transitions + assure enrollment across semesters
Deliberate focus on “Starting Strong”
Promote students’ ties to peers, faculty,
pathway
Math that matters: students see material interesting, relevant
Enhance faculty’s beliefs and relational
practices
Opening lessons engage interest, assure early
success
Direct interventions to influence student mindsets
Real-time data tracking on student engagement
Detail supportive classroom norms and
social connections
Professional development on “Starting Strong”
A Community Explicates its Causal Thinking:
A Community Explicates its Causal Thinking:
A Driver Diagram

Pathways
Driver
Diagram:
Organizing a Networked Improvement Community
Aim: increase from 5% to 50%, students achieving college math credit within one year of continuous enrollment
Instructional
System: Organized around productive struggle, explicit connections, and
deliberate practice.
Productive
Persistence:
Students develop and maintain
positive mindsets
Language and
Literacy: Students use language in understanding
problems, reason mathematically, and communicate results
Advancing
Teaching: Effective teaching within 2
years of implementation
Reduce transitions + assure enrollment across semesters
Deliberate focus on “Starting Strong”
Promote students’ ties to peers, faculty,
pathway
Math that matters: students see material interesting, relevant
Enhance faculty’s beliefs and relational
practices
Opening lessons engage interest, assure early
success
Direct interventions to influence student mindsets
Real-time data tracking on student engagement
Detail supportive classroom norms and
social connections
Professional development on “Starting Strong”
Elaborating Out The Driver Diagram
Productive Persistence

IV. You cannot improve at scale what you cannot measure
• Measureable targets: “Some is not a number;
soon is not a time”--Valued outcome measures
– But, you just can not stand at the end of the line.
• We need process measures tied to intermediate targets.

Productive Persistence
Supportive social relationships
Target: How do we measure it?
Mindsets about the value of math
Mindsets about potential to learn
math
Anxiety Regulation
Study Skills Conceptual Task: reduce to 5 core ideas
focus on underlying malleable causes + change evidence
Practical Measurement:
reduce 900 items to 26 “you have 3 minutes”

V. Accelerate Improvement: Embrace Disciplined Inquiry
• The Romance of the Silver Bullet – We move quickly to large scale implementation, but…
• We typically don’t know whether: – We can make these ideas work at all;
– We have capacity and will to execute with efficacy at scale.
• Instead, a DEED orientation – Quick, minimally intrusive, an empirical warrant
– Mantra: Learn Fast, Fail Fast, Improve Fast!
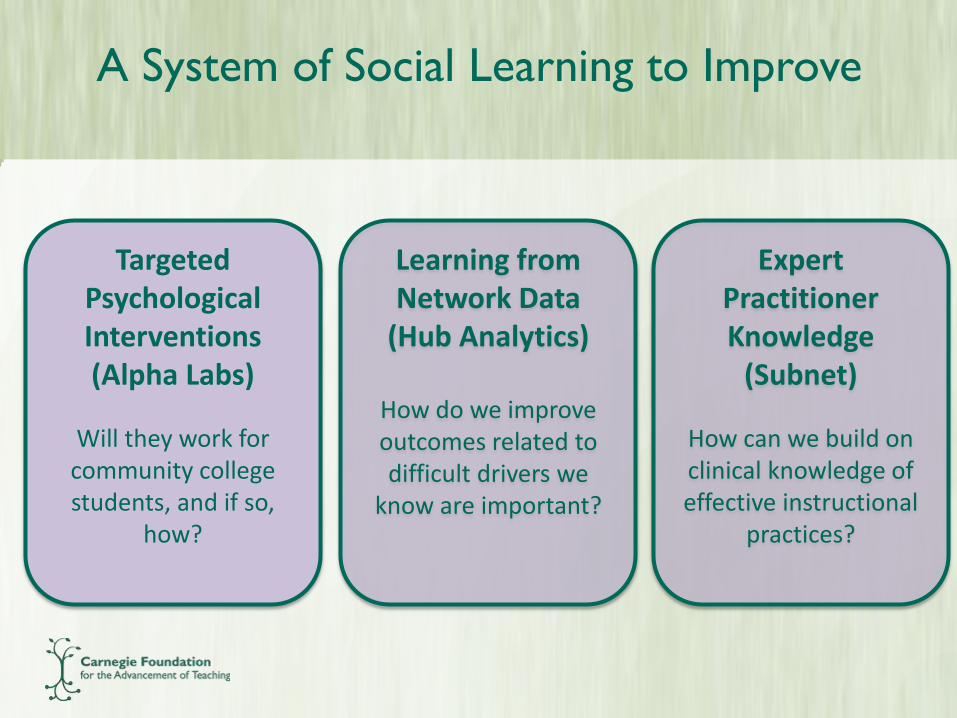
A System of Social Learning to Improve
Targeted Psychological Interventions (Alpha Labs)
Will they work for community college students, and if so,
how?
Expert Practitioner Knowledge
(Subnet)
How can we build on clinical knowledge of effective instructional
practices?
Learning from Network Data
(Hub Analytics)
How do we improve outcomes related to difficult drivers we
know are important?
33
Targeted Psychological Interventions
(Alpha Labs)
• Will they work for community college students, and if so,
how?
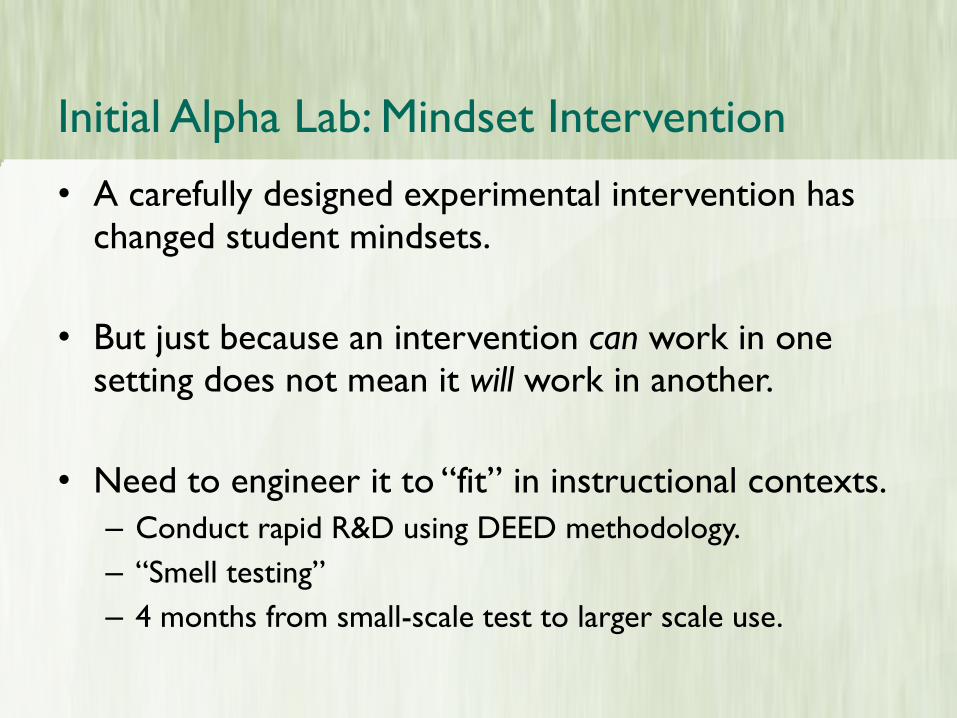
Initial Alpha Lab: Mindset Intervention
• A carefully designed experimental intervention has changed student mindsets.
• But just because an intervention can work in one setting does not mean it will work in another.
• Need to engineer it to “fit” in instructional contexts.
– Conduct rapid R&D using DEED methodology.
– “Smell testing”
– 4 months from small-scale test to larger scale use.

Rapid Iterative DEED cycles
• Research-Practitioner Team
• Testing – Small double-blind randomized
trial in Algebra course (n = 26)
– Larger double-blind experiment (n = 288)
• Introduce to faculty network, carefully study emerging results, continue to revise, refine, and extend.
35
Roberta Carew,
Statway faculty
Valencia College

36
Learning from Network Data
(Hub Analytics)*
• How do we improve outcomes related to
difficult drivers we know are important?
• Capitalizing on practical measures
* Also conduct 90 day cycles.

37
1. Assessing Change: Initial Evidence of Efficacy
of Starting Strong Package
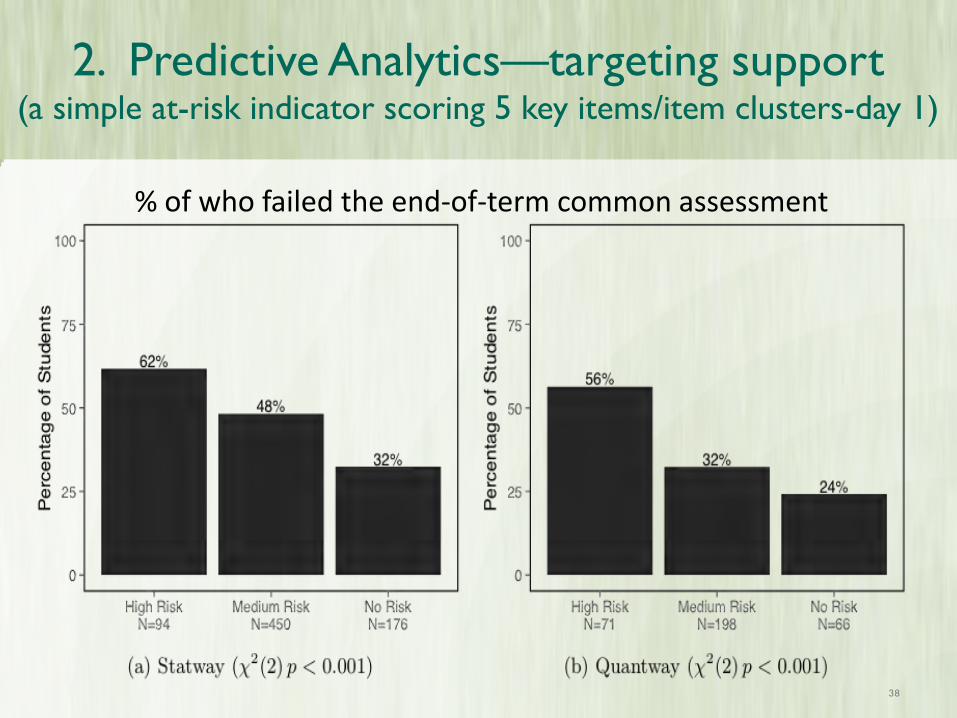
2. Predictive Analytics—targeting support
(a simple at-risk indicator scoring 5 key items/item clusters-day 1)
38
% of who failed the end-of-term common assessment

3. NIC Priority Setting: What can we do about
belonging uncertainty?
39

Connections to Stereotype Threat?
12% 13% 14%
28%
40%
7% 11%
14%
50%
71%
0%
10%
20%
30%
40%
50%
60%
70%
80%
Never Hardly Ever Sometimes Frequently Always
Pat
hw
ays
Dro
po
ut
All students Black students
“How often, if ever, do you wonder: ‘Maybe I don't belong here?’”
N = 714 math students
Students feel
socially tied to
peers, faculty, and the course.

41
Expert Practitioner Knowledge
(Subnet)
How can we build on clinical knowledge about
effective instructional practices that amplify and extend student success mindsets ?

PDSA Cycle: Rapid, Small Experimental Trials
PLAN DO
ACT STUDY
The Three Questions: • What specifically are we trying to accomplish?
• What change might we introduce?
• How will we know that the changes are an improvement?

Improving Instructional Routines in Support
of Productive Persistence: PDSA Cycles
• Faculty routines and email scripts re: absent students
• Student group noticing routine
• Effective scaffolding for group roles (rich problems)
43
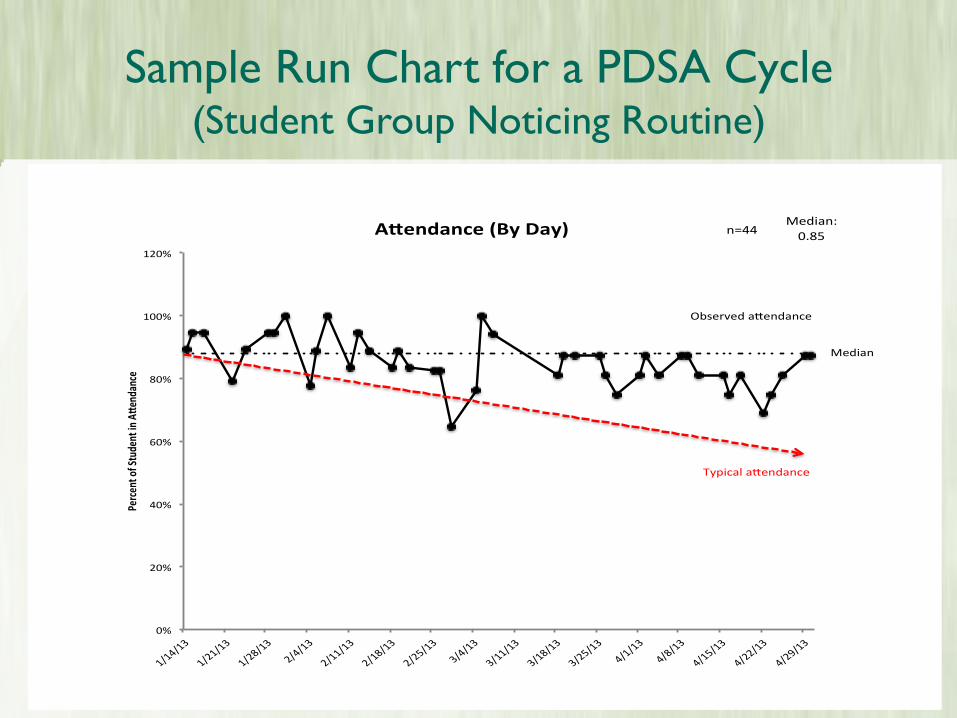
Sample Run Chart for a PDSA Cycle (Student Group Noticing Routine)
0%
20%
40%
60%
80%
100%
120%
1/14/13
1/21/13
1/28/13
2/4/13
2/11/13
2/18/13
2/25/13
3/4/13
3/11/13
3/18/13
3/25/13
4/1/13
4/8/13
4/15/13
4/22/13
4/29/13
Percen
tofS
tude
ntinA
enda
nce
A endance(ByDay)
Typicala endance
Observeda endance
n=44Median:
0.85
Median
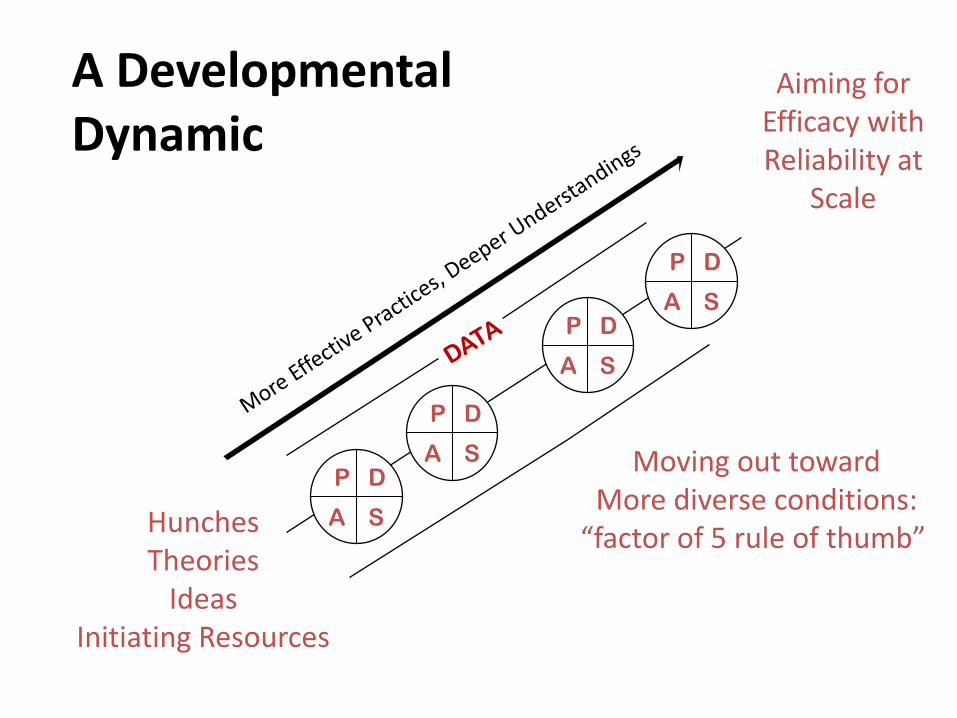
A Developmental Dynamic
Hunches Theories
Ideas Initiating Resources
P D
S A
P D
S A
P D
S A P D
S A
Moving out toward More diverse conditions:
“factor of 5 rule of thumb”
Aiming for Efficacy with Reliability at
Scale
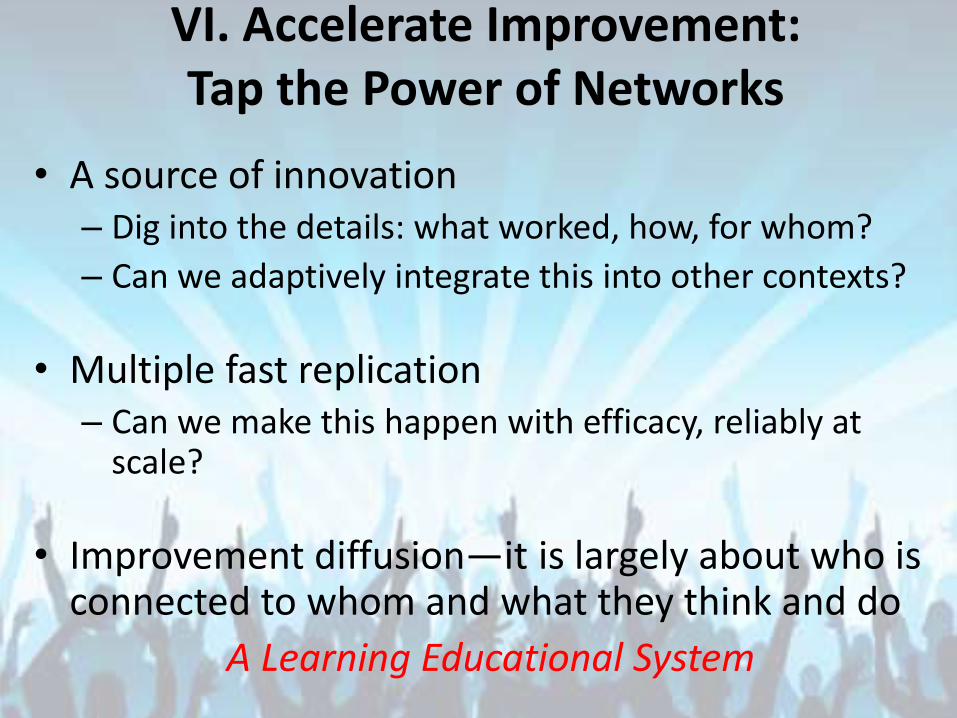
VI. Accelerate Improvement: Tap the Power of Networks
• A source of innovation – Dig into the details: what worked, how, for whom?
– Can we adaptively integrate this into other contexts?
• Multiple fast replication – Can we make this happen with efficacy, reliably at
scale?
• Improvement diffusion—it is largely about who is connected to whom and what they think and do
A Learning Educational System

A A
Improvement Networks Need Hubs to Accelerate Learning in Practice for Improvement
A
B
A
A A
B
A
A A
B
A
A A
B
C
(Englebart,1994)

Conclusion: A Strong Contrast to An
Increasingly Popular View
• Performance management
– Set targets
– Create incentives
– Collect data/dashboards
– Hold individuals accountable
• No working theory of improvement, tied to measures, tied to processes
“Go figure it out on your own or else…”
50
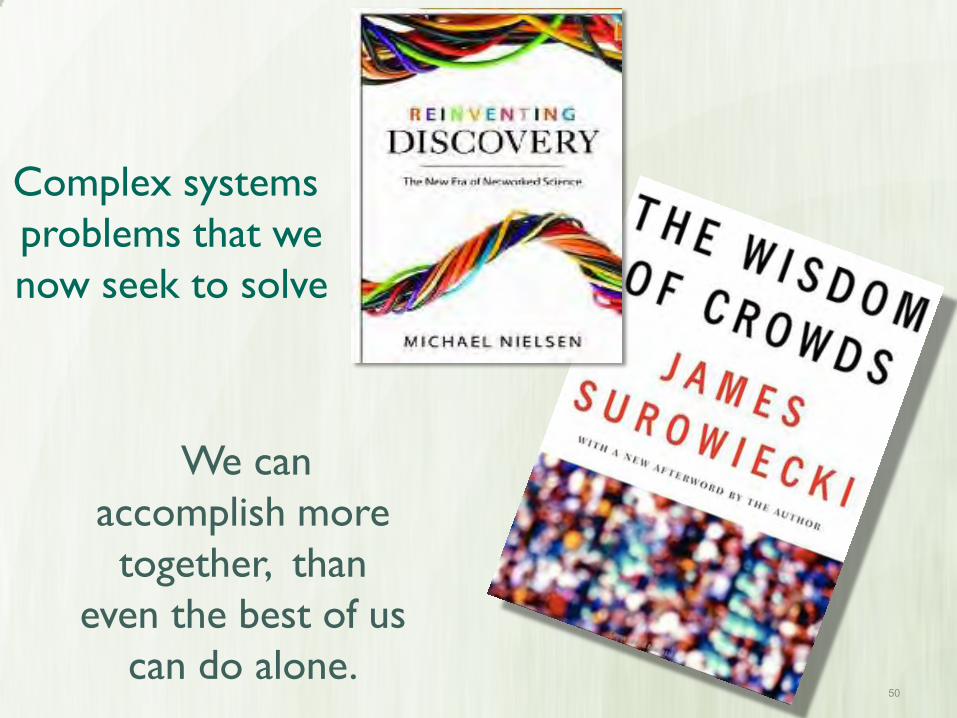
We can
accomplish more
together, than
even the best of us
can do alone.
Complex systems
problems that we
now seek to solve

Implications for Transformative Leadership
• Focus on a small number of high leverage problems
• Encourage formation of improvement networks (+hubs)
• Embrace the the dynamic of a science at work--theory, measurement and common practices
• Motivate: an ennobling vision of a professional community engaged in its own practice improvement.
We are all learners, all improvers 51
It is all about accelerating how we learn
in and through practice to improve.