annual water quality status report - inletkeeper
TRANSCRIPT

HOMER SOIL & WATER CONSERVATION DISTRICT &
COOK INLET KEEPER
Cook Inlet Citizens’ Environmental
Monitoring Project
Annual Water Quality
Status Report
OCTOBER 2000
Prepared by
Joel Cooper Research Coordinator
Cook Inlet Keeper

HOMER SOIL & WATER CONSERVATION DISTRICT
& COOK INLET KEEPER
Cook Inlet Citizens’
Environmental Monitoring Project
Annual Water Quality Status Report
October 2000
Prepared by
Joel Cooper Research Coordinator
Cook Inlet Keeper P.O. Box 3269
Homer, AK 99603 (907) 235-4068

ACKNOWLEDGEMENTS
First and foremost, Cook Inlet Keeper must express its deepest appreciation to the more than 220 dedicated citizens who have taken the time to attend volunteer training sessions and braved often adverse weather conditions to collect and analyze water quality samples from Cook Inlet streams and bays. Keeper also owes a special debt of gratitude to Steve Hackett for his hard work and dedication in establishing the Citizens’ Water Quality Monitoring Project and managing it through its first two and a half years. In addition, Keeper thanks its volunteer-based Technical Advisory Committee and Citizens Advisory Panel for their time and effort in developing and guiding the Project. Over the past two years, Keeper has also benefited from the hard work of several volunteer interns including: Josh Brann, Ilissa Kellman, Jake Fugazotto, Jessica Lambert, Bob Forrest, Jeremy Kobor, Ami Riscassi and Wendy Jo Kroll.
Keeper thanks the United States Environmental Protection Agency, the Alaska
Department of Environmental Conservation (and most especially Project Managers Les Buchholz and Kent Patrick-Riley) and the United States Geological Survey for their guidance and cooperation in developing and refining this project. Keeper adapted much of it Quality Assurance Project Plan (QAPP) and Volunteer Training Manual from similar documents developed by The Friends of Casco Bay (Maine) and Texas Watch, and it extends its sincere appreciation to those organizations for their open support and assistance.
Supplemental laboratory facilities for this project were graciously provided by the
Kachemak Bay Campus of the Kenai Peninsula College, a unit of the University of Alaska Anchorage. Special thanks to Campus Director Carol Swartz.
This project was made possible by a U.S. EPA Section 319 Clean Water Act Grant provided through the Alaska Department of Environmental Conservation’s Non-Point Source Pollution Program. Additional funding was provided by the Norcross Wildlife Foundation, Inc., the Skaggs Foundation, the RiverNetwork, the Bullitt Foundation, OMB Watch, Global Rivers Environmental Education Network and Keeper’s many members and supporters.
Finally, Keeper thanks the Homer Soil and Water Conservation District for
working in partnership to sustain citizen-based water quality monitoring on the southern Kenai Peninsula and helping to promote similar efforts throughout the Cook Inlet basin.

1
CONTENTS
Page
INTRODUCTION 5 Background 5 Purpose and Scope 5 SAMPLING DESIGN AND METHODS 6 Sampling Site Selection 6 Sampling Parameters and Collection Frequency 6 General Sampling Procedures 9 Analytical Methods 12 TRAINING 15 DATA MANAGEMENT 15 DATA ANALYSIS 16
Overview of Collected Data 16 Comparison of Site Types by Parameter 17
Temperature 17 Dissolved Oxygen 18 Turbidity 21 Salinity 24 pH 26 Conductivity 28 Oxidation-Reduction Potential 28 Apparent Color 31 Nitrate-nitrogen 33 Orthophosphate 33 Bacteria 34
QUALITY CONTROL 36
Data Comparison 36 Comparing Project Results with Other Data for the Anchor River 36 Comparing Against Duplicate Samples and Standard Solutions 36 Quality Assurance Project Plan 39
Review 39 Proposed Revisions 39
OTHER CITIZEN BASED MONITORING IN COOK INLET BASIN 40 CONCLUSION 41

2
Page REFERENCES 43 APPENDIX 1. VOLUNTEER MONITORING SITES APPENDIX 2. COMPILED DATA TABLE APPENDIX 3. LIST OF VOLUNTEER MONITORS APPENDIX 4. QC SPLIT SAMPLE DATA TABLE APPENDIX 5. PERFORMANCE STANDARDS TABLE TABLES 1. Frequency of Site Visits by Weekday and Time 9 2. Data Quality Objectives 11 3. Methods Reference 14 4. Percent Total and Total Number of Observations by Site Type 16 5. Total Number of Observations by Parameter and Site Type 17 FIGURES 1. Citizens’ water quality monitoring sites around Kachemak Bay 7
2. Citizens’ water quality monitoring sites throughout Cook Inlet 8
3. Minimum, maximum and average temperatures readings at 18 estuarine and freshwater sites
4. Dissolved oxygen and temperature readings at selected volunteer 19 monitoring sites from February 1997 to February 2000
5. Minimum, maximum and average dissolved oxygen readings at 20 estuarine and freshwater sites
6. Minimum, maximum and average % saturation readings at 21 estuarine and freshwater sites
7. Minimum, maximum and average turbidity readings at 22 estuarine and freshwater sites
8. Turbidity measurements at selected volunteer monitoring sites 23 from February 1997 to February 2000
9. Minimum, maximum and average salinity readings at 24 estuarine sites
10. Salinity measurements at selected volunteer monitoring sites from 25 February 1997 to February 2000
11. Minimum, maximum and average pH Hanna Meter and Colorimetric 26 readings at estuarine and freshwater sites

3
Page
12. pH readings at selected volunteer monitoring sites from November 27 1996 to February 2000
13. Minimum, maximum and average oxidation-reduction potential 28 readings at estuarine and freshwater sites
14. Conductivity measurements at selected volunteer monitoring sites 29 from November 1996 to February 2000
15. ORP readings at selected volunteer monitoring sites from 30 November 1996 to February 2000
16. Minimum, maximum and average apparent color readings at 31 estuarine and freshwater sites
17. Color readings at selected volunteer monitoring sites from 32 November 1996 to February 2000
18. Minimum, maximum and average nitrate-nitrogen readings at 33 estuarine and freshwater sites
19. Minimum, maximum and average Ortho-Phosphate readings at 34 estuarine and freshwater sites
20. Average Ecoli and Total Coliform counts for 1ml and 5ml 35 dilutions at estuarine and freshwater sites
21. Water quality monitoring sites in the Anchor River watershed 37
22. Comparisons of CEMP volunteer data for water temperature, pH, and 38 conductivity to USGS and LKWHP data in the Anchor river watershed

4

5
INTRODUCTION Background In 1996, Cook Inlet Keeper established its Citizens' Environmental Monitoring Program (CEMP) to actively involve citizens in collecting reliable water quality data in the Cook Inlet basin. With guidance from its Technical Advisory Committee, Keeper developed a Kachemak Bay Pilot Project as a working template that could be adopted by other groups interested in conducting citizen-based monitoring programs. The Citizens' Environmental Monitoring Program has continued to show consistent growth. In 1998, Keeper formed a partnership with the Homer Soil & Water Conservation District to help support its citizen-based monitoring efforts. In 1999, 44 new volunteers were trained as monitors, and to-date over 220 citizens have been trained. Currently there are 36 active sites in and around Kachemak Bay, monitored by 34 active volunteers. On the Kenai River, nearly 60 volunteer monitors are working with the Kenai Watershed Forum, using Keeper's established monitoring protocols to collect water quality data. In the summer of 1999, Keeper used the template developed through the Kachemak Bay Pilot Project to offer Citizen-Based Monitoring Support Services to other Cook Inlet communities. Keeper entered into an agreement with the Anchorage Waterways Council, Alaska Cooperative Extension, and the University of Alaska Anchorage's Environment & Natural Resources Institute, to maximize the unique resources of each group, and to facilitate citizen-based monitoring and assessment in the Anchorage Bowl. More recently, Keeper has begun working with the Wasilla Soil & Water Conservation District in a similar partnership to facilitate a citizen-based water quality monitoring program in the Mat-Su Valley. To date, these partnerships have facilitated training of at least 38 new volunteers and established 8 water quality monitoring sites in the Anchorage area and 6 sites in the Matanuska-Susitna Valley (Mat-Su). Purpose and Scope Cook Inlet Keeper (Keeper) is a 501(c)(3) nonprofit organization based in Homer, Alaska, which is dedicated to protecting the Cook Inlet watershed and the life it sustains. Because citizens are the true owners of public water resources, Keeper strives to involve them in hands on activities aimed at improving and protecting habitat and water quality, promoting resource stewardship, and establishing an environmental database for the Cook Inlet Basin. The objectives of Keeper’s Citizens Environmental Monitoring Program are to:
• inventory baseline water quality in the waters of Cook Inlet Basin;
Mike and Amy Stockburger learn to collect reliable water quality data.

6
• detect and report significant changes and track water quality trends; • raise public awareness of the importance of water quality through hands on involvement.
To promote these objectives Keeper has selected water quality parameters that will enhance understanding of overall environmental health and testing methods that have proven successful in citizen based programs throughout the United States. Refinements in methods or additional testing parameters may be incorporated in this project in the future if it is determined that such changes would enhance efforts to achieve the project’s goals; and assuming additional funding is available. Any such changes will be subject to review and approval by the project’s Technical Advisory Committee, the U.S. EPA and Alaska Department of Environmental Conservation. SAMPLING DESIGN AND METHODS Sample Site Selection In order to obtain useful baseline inventory and monitoring information, it is critical to select sampling sites which are representative of the various hydrologic, geographic, biologic, land use, and other conditions within the watershed. Because of the variability and distribution of human population densities in the Kachemak Bay area and the Cook Inlet region, an effort has been made to select sites which represent a balance between more impacted and less impacted areas. In the challenging climate of Southcentral Alaska, it was also necessary to select sites which are safely and reasonably accessible. Finally, to maintain volunteer involvement, it has been important to select monitoring sites in which volunteer team members have a personal interest.
To-date, Keeper volunteers have sampled water quality at a total of 82 estuarine and fresh water sites in the Kachemak Bay watershed and 2 sites on the west side of Cook Inlet (Figure 1). Keeper has also developed partnerships to provide training and support for other citizen-based water quality monitoring efforts around Cook Inlet. Keeper has worked with the Kenai Watershed Forum to establish 22 sites (17 currently active) in the Kenai River watershed. Through its partnerships with UAA’s Environment and Natural Resources Institute, Alaska Cooperative Extension, the Anchorage Waterways Council, and the Wasilla Soil and Water Conservation District, Keeper has also helped to establish 8 sites in the Anchorage bowl and 6 sites in the Mat-Su Valley (Figure 2). This report focuses primarily on depicting data collected from the Kachemak Bay watershed. Sampling Parameters and Collection Frequency Testing parameters were selected based on their usefulness in inventorying water quality and projecting the general "health" of the water bodies in question. Due to cost concerns, only the more affordable sampling parameters have been selected to ensure the viability of long term monitoring. Primary sampling parameters include: water temperature, turbidity (clarity), pH, salinity, and dissolved oxygen; secondary parameters include: color, conductivity, oxidation-

7

8

9
reduction potential, and screening test for nutrients (nitrate-nitrogen and ortho-phosphate), and bacteria (fecal and total coliform).
Surface water samples are taken at all monitoring stations monthly between September and April, and twice monthly from May through August for a total of 16 sampling events per site per year. The sampling period is designated as the last Sunday of each month (as well as the second Sunday of each month from May through August), plus or minus two days (i.e. Friday through Tuesday). The recommended time for sampling is 2:00 PM, and the time allowance range is from 1:00 PM to 5:00 PM, however, some sites need to adjust the sampling time according to the tides. Table 1 shows the frequency that site visits have occurred by weekday and time.
The impact of rain events on water quality is a factor considered in the Project. Monitors are asked to maintain a regular monitoring schedule regardless of precipitation and to document past and present weather conditions at the time of sampling. Given the climate of Southcentral Alaska some sites are not reasonably accessible on the appointed sampling date. Keeper staff try to reschedule samplings as weather allows, but since this is not always possible, a total of 12 sampling events per year at any one site is considered to be a complete set of data for that site. General Sampling Procedures Regular volunteer sampling in this program involves ambient measurements collected and processed in the field with the following possible exceptions: 1) the titration phase of the dissolved oxygen test (when necessary, DO samples may be collected and fixed on-site, then titrated within six hours after collection); 2) the bacteria screening test (coliscan plating and incubation is done off site up to 6 hours after collection, and the total Coliform and E. coli counting phases must be done 24 to 48 hours after plating), and 3) determination of nutrients (colorimetric tests for nitrates & phosphates may be performed up to 6 hours after collection). In the case of each of these parameters, sample temperature is maintained between +4°C to +10°C during storage.
Table 1 Frequency of Site Visits by Weekday and Time
Site ID
(All Sites)
Data
Sunday
Monday
Tuesday
Wednesday
Thursday
Friday
Saturday
Total Percent of Weekday 32% 13% 9% 9% 10% 11% 16% 100%Count of Collection Date 267 106 79 73 87 95 135 842Count of Collection Time 266 106 79 71 86 93 133 834Max Collection Time 10:45 PM 11:20 PM 9:15 PM 9:52 PM 9:00 PM 7:55 PM 9:00 PM 11:20 PMMin Collection Time 8:09 AM 7:30 AM 7:50 AM 7:00 AM 8:20 AM 7:30 AM 9:10 AM 7:00 AMAverage Collection Time 2:32 PM 2:27 PM 2:04 PM 2:25 PM 2:54 PM 2:01 PM 1:18 PM 2:15 PM

10
Most volunteer monitors sample near shore stations or freshwater sites that have been established using GPS equipment and/or USGS 1:63,360 scale topographical maps. These sites are routinely located using recognizable natural features or nearby fixed structures. Preferably sites are located at easily identifiable features such as stream confluences or natural bends, bridges, piers, bulkheads, floats, jetties, docks, etc. In the case of estuarine waters, an effort has been made to locate sites where there is at least 3 meters of water at low tide. This preferred minimum water depth requirement allows a Secchi disk reading to be taken at almost any tidal stage. Unfortunately, requiring a strict minimum depth is not always feasible in the dynamic waters of Cook Inlet. Because of the limited number of accessible spots, and because consistency is also related to convenience, a number of near shore stations have been, and will continue to be sampled by wading-in from shore. The disadvantages are that Secchi disk readings cannot be taken (turbidity tubes are used in shallower water); and that these typically shallower inter-tidal areas can be more dynamic than sub-littoral areas and thus harder to characterize until large amounts of data can be collected over considerable time. The advantage is that at near shore stations, both shallow and inter-tidal and sub-littoral areas, can be close to important habitat zones and food sources for freshwater and marine organisms.
Water samples are collected using a 2 1/2 -gallon plastic bucket with an attached cord if necessary. Volunteers are instructed to rinse the bucket (and all testing containers) three times with water from their site before taking the sample to be tested. Water quality testing is then performed on the sample in the bucket. While data quality for some parameters might benefit from in situ testing, the bucket method is used in the interest of volunteer safety. Sampling equipment and methods, as well as data quality objectives for sensitivity, precision and accuracy are outlined in Table 2. Willy Dunne collects a water sample at his
monitoring site on McNeil Creek (KB-535).

11
Table 2: Data Quality Objectives
Parameter Method/Range Units Sensitivity (a) Precision Accuracy Calibration Method
Temperature Thermometer -5.0 to +50.0oC
Degrees Celsius (oC)
0.5oC ±1.0oC (b)
±0.5oC (b)
NIST Certified Thermometer
Hanna Meter 0.0 to 60.0 C
Degrees Celsius (oC)
0.1 C ±0.5 C (c)
±0.5 C (c)
NIST Certified Thermometer
pH pH Octet Comparator
(Wide-Range) 3.0 to 10.0 units
Standard pH units 0.5 units ±0.6 units (b)
±0.4 units (b)
Checked against Hach pH Meter
pH Octet Comparator
(Narrow-Range) 7.2 to 8.6 units
Standard pH units 0.1 units ±0.3 units (b)
±0.2 units (b)
Checked against Hach pH Meter
Hanna pH Tester 0.0 to 14.0
Standard pH units 0.1 units +0.2 units (c)
+ 0.2 units (c)
Standard Solutions Method
Hach Model 5005 Electrometric Method -2.00 to 19.99 pH units
Standard pH units 0.01 units +0.02 units
+0.05 units
Standard Solutions Method
Micro Winkler Titration 0 to 20 mg/l
Milligrams per liter (mg/l)
0.1 mg/l ±0.9 mg/l (b)
±0.3 mg/l (b)
Checked against LaMotte DO Meter
Dissolved Oxygen
LaMotte Model DO 4000 0 to 19.99 mg/l
Milligrams per liter (mg/l)
0.1 mg/l ±0.05 mg/l ±0.1 mg/l Saturated air calibration
Salinity Hydrometer 0 to 42 ppt
(1.0000 to 1.0700 SG)
Parts per thousand (ppt)
0.1 ppt (0.0005 specific
gravity)
±1.0 ppt (b)
±0.82 ppt (b)
Standard Solutions Methods
Limit of Visibility Secchi Disk Depth 0 to 30 m
Meters (m) 0.5 m NA NA Line markings checked w/tape
Turbidity 0 to 200 JTU
Jackson Turbidity Units (JTU)
5 JTU +3 units (c)
+3 units at 0 - 200 JTU (c)
Checked against LaMotte meter
Turbidity
LaMotte Model 2020 0.00 to 100 NTUs
Nephelometric Turbidity Units
NTU Report to Nearest0 to 1.0 then 0.05NTU10 to 40 then 1NTU40 to 100 then 5NTU100 to 400 then 10NTU400 to 1000 then 50NTUover 1000 then 100NTU
+2% for readings below 100 NTUs+3% above 100
NTUs
+2% for readings below 100 NTUs +3% above 100
NTUs
Standard Solutions Method
Conductance Hanna TDS Meter (Total Dissolved Solids)
0 to 1999 microS/cm
Micro-Siemens/cm(µS/cm)
(converted to 25 C)
1.0 x 10 -6 S +0.5 units (c)
2% full scale (c)
Standard Solutions Method
Oxidation-Reduction Potential
Hanna ORP Meter -1000 to +1000mV
Millivolts 1.0 mV +0.5 units (c)
+5.0 mV (c)
Standard Solutions Method
Compare to color chart 147 standard colors
Color index number
1 to 2 Color Numbers
NA NA Checked against HachSpectrophotometer
Apparent Color
Hach Spectrophotometer Platinum-Cobalt Method
0-500 PC units
Platinum-Cobalt Units
NA NA NA Standard Solutions Method
Nitrate-Nitrogen Zinc reduction (Colorimetric)
0 to 15 ppm (15.0mg/L)
ppm (mg/L) 1.0 ppm ±0.5 ppm (c)
±0.5 ppm (c)
Standard Solutions Methods
Ortho-Phosphate Ascorbic acid reduction (Colorimetric)
0 to 4 ppm (0 to 4.0mg/L)
ppm (mg/L) 0.2 ppm ±0.5 ppm (c)
±0.5 ppm (c)
Standard Solutions Methods
Coliforms (Total & E. coli)
Chromogenic agents in medium, detects
E. coli & total coliform 0 to 60 CFU
Number of colonyforming units
(CFU) per 100 ml
1 CFU NA NA Send water sample split to EPA/ADEC
Certified Lab
NA = not available (a) Determined by the increments measurable with the stated method reflecting estimation where allowed. (b) Data taken from the Quality Assurance Project Plan for Friends of Casco Bay, 1995, p. 21; based on data taken
from EPA Volunteer Water Monitoring: A Guide for State Managers, 1990, EPA 440/4-90-010, p. 39; and the Quality Assurance Project Plan for the Chesapeake Bay Citizen Monitoring Program, Section 5, p. 2.
(c) Data taken from the manufacturer’s instruction manuals.

12
Analytical Methods Primary parameters (water temperature, turbidity, pH, salinity, & dissolved oxygen) are measured using standard EPA approved procedures and/or methods which are in use by established citizens volunteer monitoring programs (e.g., Friends of Casco Bay’s Citizen’s Water Quality Monitoring Program and Texas Watch’s Volunteer Environmental Monitoring Program). Each of these procedures, as well as those used in measuring secondary parameters, is taken from the Volunteer Estuary/Lake/River/Stream Monitoring: A Method’s Manual series published by U.S. EPA. All methods used are consistent with those recommended by the test kit manufactures (LaMotte, Hanna, Hach and Micrology Laboratories).
Water Temperature Water temperature is tested using two separate instruments: 1) Armored alcohol-filled thermometer factory calibrated against thermometer
standards traceable to N.I.S.T. (The National Institute of Standards and Technology); Model 545; range -5.0°C to +45.0oC in 0.5oC increments -- LaMotte Chemical Products; Cat. No. 1066.
2) Hanna “4-in-1” Water Test Meter; wide range 0.0°C to 60.0 °C units in 1.0°C unit increments; accuracy ± 0.1°C -- Hanna Instruments EN 50081-1.
Turbidity Water clarity is tested by one or both of the following means: 1) Water with a depth of greater than 3
meters is tested using a 20 cm diameter Secchi disk with black and white quadrants attached to a 30 meter calibrated stretch-resistant line marked at 0.5 meter intervals -- LaMotte Chemical Products; Cat No. 0171-CL.
2) Shallower water is tested using turbidity columns (Jackson Turbidity Tube with 25ml/50ml levels noted); range 0 JTU to 200+ JTUs in 5 JTU increments; accuracy ± 3 Jackson Turbidity Units (JTUs) -- LaMotte Chemical Products Cat No. 7519 and Standard Turbidity Reagents; Cat No. 7520
pH pH is tested and verified in both of the following ways: 1) Octet color comparator test kits; wide range 3.0 to 10.0 pH units in 1.0 unit
increments and narrow range 7.2 to 8.6 pH units in 0.2 unit increments; accuracy ±0.2 pH units -- LaMotte Chemical Products; Cat. Nos. 2117/P-3100 (3.0 to 10.0 units) and 2110/P-CR (7.2 to 8.6 units).
2) Hanna “4-in-1” Water Test Meter; wide range 0.0 to 14.0 pH units in 0.1 unit increments; accuracy ±0.2 units -- Hanna Instruments EN 50081-1.
Lynn Spence and Toby Tyler brush up on their testing procedures during an annual re-certification

13
Salinity (estuarine sites only) Specific gravity/salinity is tested using a LaMotte hydrometer with 500-ml hydrometer jar; range l.0000 to 1.0700 specific gravity in 0.0005 increments (0 to 42ppt salinity) – LaMotte Chemical Products; Cat. Nos. 3-0011 (hydrometer) and 3-0024 (jar). LaMotte 1.000/1.070.
Dissolved Oxygen Volunteers use precision dissolved oxygen two phase (fixation and titration) test kits; azide modification of Winkler titration method; range 0 to 20 mg/l in 0.1 mg/l increments; reagents sufficient for 25 tests at 0 to 20 mg/l range -- LaMotte Chemical Products; Cat. No. 5856/XDO.
Color Water color is monitored by describing the apparent color of sample water and comparing the color to numbered color chips in the Borger Color System booklet – LaMotte Chemical Products; Cat. No. 1580
Conductivity Hanna “4-in-1” Water Test Meter; range from 0 to 1999 micro-seimens/cm in 1 micro-seimens/cm increments; accuracy ± 2% full scale units – Hanna Instruments EN 50081-1.
Oxidation-Reduction Potential Hanna “4-in-1” Water Test Meter; wide range -1000 mV to +1000 mV in 1 mV increments; accuracy ± 5 mV – Hanna Instruments EN50081-1.
Nitrate-Nitrogen Volunteers use a two tablet reagent Octa-Color Slide system to screen for nitrate-nitrogen from 0 to 15ppm (0 to 66ppm as nitrate) – LaMotte Chemical Products; Cat. No.3354.
Ortho-Phosphate Monitors use ascorbic acid reduction and an Octet Comparator to screen for ortho-phosphate from 0 to 2.0ppm – LaMotte Chemical Products; Cat. No. 3121.
Fecal and Total Coliform Bacteria Analysis is conducted using the Coliscan screening technique developed by Micrology Laboratories.1 . This method is currently in use by a number of volunteer monitoring organizations (e.g., Washington State Dept. of Ecology, Lower Colorado River Authority-River Watch, Global River Environmental Education Network, Indiana Dept. of Natural Resources-River Watch).
Method References Table 3 references the methods used for each testing parameter. Most methods used in this Project are traceable to EPA-approved or EPA recommended methods.
1 Micrology Laboratories LLC. 1996. Coliscan ™Easygel™- Procedures & Detection of Waterborne Coliforms and Fecal Coliforms, 6p. RCS, Goshen, Indiana

14
Table 3: Methods Reference
Parameter Method Reference Modification
Thermometer (a) Alcohol-filled thermometer
Temperature
Electrometric (b) Colorimetric (c)
Electrometric (Hanna) (b) pH
Electrometric (Hach) (d) Dissolved Oxygen Azide Modified
Winkler Titration (e) Micro method;
60 ml bottle Electrometric (f)
Salinity Gravimetric (g) Secchi Disk Depth (h) Turbidity (Clarity) Jackson Turbidity (c)
Electrometric (i) Conductance Electrometric (b)
Oxidation-Reduction Potential
Electrometric (b)
Apparent Color Borger Color System (c) Nitrate-Nitrogen Colorimetric (c) Ortho-Phosphate Colorimetric (j) Fecal Coliforms (Total & E. coli)
“Coliscan” (k)
(a) U.S. EPA. 1979 (revised 1983). Methods for Chemical Analysis of Water and Wastes. EPA-600/4-79-020. Method 170.1. Environmental Monitoring and Support Laboratory, Cincinnati, OH. In The Friends of Casco Bay. 1995 Quality Assurance Project Plan. Pg. 15. Friends of Casco Bay, South Portland, ME.
(b) Hanna Instruments. 1996. The Water Analysis Handbook. Hanna Instruments, Woonsocket, RI. And manufacturer’s instructions.
(c) Campbell, G. & Wildberger, S. 1992. The Monitor’s Handbook. LaMotte, Chestertown, MD. (d) Eaton, A., Clesceri, L., & Greenberg, A. (Editors). 1995. Standard Methods for Examination of Water and
Wastewater, (19th Edition). American Public Health Association, Washington, D.C. Method 2580-B. (e) Eaton, A., Clesceri, L., & Greenberg, A. (Editors). 1995. Standard Methods for Examination of Water and
Wastewater, (19th Edition). American Public Health Association, Washington, D.C. Method 4500-0C. And, Campbell, G. & Wildberger, S. 1992. The Monitor’s Handbook. LaMotte, Chestertown, MD.
(f) Eaton, A., Clesceri, L., & Greenberg, A. (Editors). 1995. Standard Methods for Examination of Water and Wastewater, (19th Edition). American Public Health Association, Washington, D.C. Method 4500-0G. And, Campbell, G. & Wildberger, S. 1992. The Monitor’s Handbook. LaMotte, Chestertown, MD. And manufacturer’s instructions.
(g) U.S. EPA. 1993. Volunteer Estuary Monitoring: A Methods Manual. EPA-842-B-93-004. USEPA, Washington, D.C. And, Campbell, G. & Wildberger, S. 1992. The Monitor’s Handbook. LaMotte, Chestertown, MD.
(h) U.S. EPA. 1991. Volunteer Lake Monitoring: A Methods Manual. EPA-440/4-91-002. USEPA, Washington, D.C. And, Campbell, G. & Wildberger, S. 1992. The Monitor’s Handbook. LaMotte, Chestertown, MD.
(i) Eaton, A., Clesceri, L., & Greenberg, A. (Editors). 1995. Standard Methods for Examination of Water and Wastewater, (19th Edition). American Public Health Association, Washington, D.C. Method 2130-B. And, Campbell, G. & Wildberger, S. 1992. The Monitor’s Handbook. LaMotte, Chestertown, MD. And manufacturer’s instructions.
(j) U.S. EPA. 1997. Volunteer Stream Monitoring: A Methods Manual. EPA-841-B-97-004. USEPA, Washington, D.C. And, Campbell, G. & Wildberger, S. 1992. The Monitor’s Handbook. LaMotte, Chestertown, MD. And manufacturer’s instructions.
(k) Micrology Laboratories, LLC. 1996. Coliscan® for Coliform and Fecal Coliform Testing. Micrology Laboratories, Goshen, IN.

15
TRAINING Volunteer monitor training involves five phases. The volunteer begins monitoring after the completion of the first three phases, with phase III being conducted on site. Each volunteer must also attend an annual re-certification (phase IV). To become a Certified Monitor Trainer a
monitor can attend a two-day workshop (phase V) that teaches experienced monitors, and leaders of local organizations to design and run their own volunteer water quality monitoring programs coordinated with the Cook Inlet Keeper CEMP. In 1999, 44 people went through at least one phase of monitor training. Of those, seven became certified monitor trainers, 22 are active volunteer monitors, and four were interns working with Cook Inlet Keeper. Of the remaining 11, two have moved from the area, and the other nine either dropped out of the training or completed training, but have not yet begun monitoring. In addition, six monitors were re-certified in 1999.
DATA MANAGEMENT Cook Inlet Keeper has worked with the Anchorage Waterways Council and HDR Alaska, Inc to create the Citizens’ Environmental Monitoring Program (CEMP) database. This relational MS Access database is designed to store and compute observational data, store and track volunteer training records and schedules, and track and maintain monitoring equipment and chemical reagents. It provides project officers, quality assurance officers and quality control coordinators with an efficient management tool that will help assure high quality data, efficient training and re-certification of volunteer monitors and timely replacement of chemical reagents and monitoring supplies. The database is also designed to calculate the raw data entered and print out summary reports by monitoring site. It will not accept data that is out of the expected range for a parameter. In the future, the CEMP database will be posted on Cook Inlet Keeper’s web site (http://www.inletkeeper.org) the partnering groups will merge their data to make all volunteer
Kachemak Bay Monitoring Coordinator, Tom Wallace, enters data into the database.
Laura Eldred, Barbara Wild, Catherine Moncrief, Bill Sobers, and Sabrina Peterson at a phase V workshop in Anchorage.

16
collected data available to government agencies, volunteer monitors and the general public. Project officers, quality assurance officers and quality control coordinators will be provided passwords to access the database for data entry, editing, and general database maintenance. Data will be available to all users for down loading and use. In addition the data will be put into EPA's STORET database. The new, modernized STORET is EPA's principal repository for marine and freshwater ambient water quality and biological monitoring information. DATA ANALYSIS OVERVIEW OF COLLECTED DATA As of April 2000, a total of 842 field observations had been made in the Kachemak Bay and Anchor River watersheds (Table 4). Over half (52.5%) of the observations were made at freshwater sites, while 47.5% were made at estuarine sites. Table 4. Percent Total and Total Number of Observations by Site Type
Estuarine
Freshwater
Total
Percent total of Observations
47.5% 52.5% 100% Number of
Observations 400 442 842 Table 5 shows the number of observations by parameter and site type. Observations by parameter may vary from the total number of collection dates (site visits) for the following reasons: the information was not collected; the parameter was not being measured for a given site type; the measurement was discontinued, data did not meet data quality objectives; equipment failure.
Alexie Basargin records observations at his monitoring site on nahodka creek, a tributary in the anchor river watershed.

17
TABLE 5. TOTAL NUMBER OF OBSERVATIONS BY PARAMETER AND SITE TYPE
EstuarineFreshwate
r Total Count of Collection Date 400 442 842 Count of BCS# (25ml) Water Color Observations 365 388 753 Count of BCS# (50ml) Water Color Observations 262 309 571 Count of Turbidity Observations 355 407 762 Count of Water Temp Observations 385 432 817 Count of DO Observations 373 416 789 Count of Saturation Observations 373 414 787 Count of Salinity Observations 359 141 500 Count of Conductivity Observations 368 405 773 Count of ORP Observations 369 411 780 Count of Hanna Meter pH Observations 346 374 720 Count of Colorimetric pH Observations 384 425 809 Count of OrthoPhosphate Observations2 252 324 576 Count of Nitrate-Nitrogen Observations2 247 334 581 Count of 1ml Coliform (cfu/100ml) Observations3 163 214 377 Count of 3ml Coliform (cfu/100ml) Observations3, 4 83 82 165 Count of 5ml Coliform (cfu/100ml) Observations3 139 202 341 Count of 1ml EColi cfu/100ml) 3 161 214 375 Count of 3ml EColi (cfu/100ml) Observations3, 4 85 83 168 Count of 5ml EColi (cfu/100ml) Observations3 139 202 341
Comparison of Site Types by Parameter The analysis presented here shows the maximum, minimum and average readings for each parameter by site type. The averages are for all observations, although seasonal variations may exist and averages could be more weighted to the summer season due to the increase in sampling frequency. When possible, data was plotted over time and compared to state water quality standards. Temperature Temperature is a controlling factor for aquatic life: it controls the rate of metabolic activities, reproductive activities and therefore, life cycles (Murdoch and Choe, 1999). While temperature may be one of the easiest measurements to perform, it is also one of the most important parameters we test because it dramatically affects the rate of chemical and biological reactions within the water (Cook Inlet Keeper, 1998).
2 Began collecting observations for this parameter in March 1997. 3 Began collecting observations for this parameter in June 1997. 4 Discontinued this dilution in Beginning January 1999.

18
There were five temperature measurements that exceeded state water quality standards. All were at KB-310, Beluga Slough Outflow. The maximum water temperature readings for each site type were 24.5° C at KB-310 (estuarine) and 20° C at KB-912 (freshwater) (Figure 3). Minimum temperatures were -2.0° C at KB-1200 (estuarine) and -1.1° C at KB-470 (freshwater). The average temperature readings for estuarine and freshwater sites were 8.8° C and 6.1° C respectively. Figure 4 shows seasonal temperature variations at selected monitoring sites.
Dissolved Oxygen Like land organisms, aquatic animals need dissolved oxygen (DO) to live. Fish, invertebrates, plants and aerobic bacteria all require oxygen for respiration. The amount of oxygen required varies according to species and stage of life. DO levels below 3 mg/l are stressful to most aquatic organisms. DO levels below 2 or 1 mg/l will not support fish: levels 5 to 6 mg/l are usually required for growth and activity (Campbell and Wildberger, 1992). Most all the dissolved oxygen readings taken by volunteer monitors fell within healthy limits, although there were some measurements that were below state water quality standards (Figure 5). There were four readings that fell below the 7.0 mg/l state standard for fresh water. Two readings of 5.8 and 5.6 mg/l at KB-555, a 6.4 mg/l reading at KB-556, and a 5.5 mg/l reading at KB-912. One estuarine site, KB-1200, fell below the marine state standard of 5.0 mg/l with a reading of 4.4 mg/l. No site exceeded the state standard of 17.0 mg/l. The average DO for estuarine sites was 10.1 mg/l and 11.2 mg/l for freshwater sites. Figure 4 shows how dissolved
Figure 3. Minimum, maximum and average temperature readings at estuarine and freshwater sites
-4
-2
0
2
4
6
8
10
12
14
16
18
20
22
24
26
Min of WaterTemp Max of WaterTemp Average of WaterTemp
Deg
rees
C
EstuarineFreshwater
Alaska's maximum temperature limit at anytime for aquatic life , fresh water (ADEC 1999)
For marine water uses, the weekly average temperature may not increase more than 1 degree C. The maximum rate of change may not exceed 0.5 degees C per hour. Normal daily temperature cycles may not be altered in amplitude or frequency (ADEC 1999).
Alaska's upper limit for fish migration routes, drinking water supply , fresh water (ADEC 1999)
Alaska's upper limit for spawning areas, egg and fry incubation, fresh water (ADEC 1999)

19
oxygen readings tend to vary with season and temperature with higher concentrations corresponding with lower temperature readings.
Figure 4. Dissolved oxygen and temperature readings at selected volunteer monitoring sites from February 1997 to April 2000
Dissolved Oxygen and Temperature @ KB-1110 Diamond Creek @ Outflow Above Beach (Freshwater)
0
2
4
6
8
10
12
14
16
18
9-Oct-96
9-Dec-96
9-Feb-97
9-Apr-97
9-Jun-97
9-Aug-97
9-Oct-97
9-Dec-97
9-Feb-98
9-Apr-98
9-Jun-98
9-Aug-98
9-Oct-98
9-Dec-98
9-Feb-99
9-Apr-99
9-Jun-99
9-Aug-99
9-Oct-99
9-Dec-99
9-Feb-00
9-Apr-00
Date
mg/
l
0
2
4
6
8
10
12
14
16
18
Deg
rees
(C)
DOWaterTemp
Dissolved Oxygen and Temperature @ KB-1100 Diamond Creek @ Kachemak Bay (Estuarine)
0
2
4
6
8
10
12
14
16
18
9-Oct-96
9-Dec-96
9-Feb-97
9-Apr-97
9-Jun-97
9-Aug-97
9-Oct-97
9-Dec-97
9-Feb-98
9-Apr-98
9-Jun-98
9-Aug-98
9-Oct-98
9-Dec-98
9-Feb-99
9-Apr-99
9-Jun-99
9-Aug-99
9-Oct-99
9-Dec-99
9-Feb-00
9-Apr-00
Date
mg/
l
-2
0
2
4
6
8
10
12
14
16
18
20
Deg
rees
(C)
DOWaterTemp

20
Dissolved oxygen levels may also be viewed in terms of "percent saturation" or the percent of the potential capacity of the water to hold oxygen that is present. Percent saturation can serve as a "scorecard" for oxygen levels on a scale of 0 to 100% of the potential level. However, high percent saturation can occur even at low DO levels, and living organisms require specific
minimum levels of dissolved oxygen to survive (Campbell and Wildberger, 1992). Percent saturation readings exceeded state water quality standards 23 times, 4 times at fresh water sites (KB-555 twice, and one time each at KB-556 and KB-912), and 19 times at estuarine sites, with the highest measurement of 135.7% occurring at KB-310 (Figure 6). Standards were exceeded six times at KB-310, 5 times at KB-700, 4 times at KB-1200, 2 times at KB-350, and one time each at KB-651 and KB-711. The average %saturation was 87.6% at estuarine sites and 90.6% at fresh water sites. The lowest readings were 53.4% and 40.6% at fresh water and estuarine sites respectively.
Figure 5. Minimum, maximum and average dissolved oxygen readings at estuarine and freshwater sites
0
1
2
3
4
5
6
7
8
9
10
11
12
13
14
15
16
17
18
Min of DO Max of DO Average of DO
mg/
l
Estuarine
Freshwater
Alaska's upper limit for aquaitic life (ADEC 1999)
Alaska's lower limit for aquaitic life (ADEC 1999)
Alaska's lower limit in estuaries and tidal tributaries (ADEC, 1999)
Miranda Weiss measures dissolved oxygen during annual recertification.

21
Turbidity Turbidity, or water clarity, is a measurement that pulls together many important features of an aquatic system. Turbidity is caused by suspended solid matter which scatters light passing through the water. Any material mixed and suspended in water will reduce its clarity and make the water turbid (i.e. muddy and cloudy). Such materials can come from many sources. In early spring, the water may become more turbid as silt is carried into the estuary with the spring thaw and run-off. At any time of year, silt-laden surface water can flow into the estuary from tributaries and storm drains during periods of heavy rain and associated runoff (Cook Inlet Keeper [Volunteer Training Manual], August 1998). Turbidity readings ranged from 0 JTUs to >200 JTUs (outside range of the method) for both site
Figure 6. Minimum, maximum and aver age % saturation readings at estuarine and freshwater sites
0.0%
10.0%
20.0%
30.0%
40.0%
50.0%
60.0%
70.0%
80.0%
90.0%
100.0%
110.0%
120.0%
130.0%
140.0%
150.0%
Min of Saturation Max of Saturation Average of Saturation
% S
atur
atio
nEstuarineFreshwater
Alaska limit for aquatic life (ADEC 1999)
Willy Dunne measures turbidity using a secchi disk at the homer habor.
22
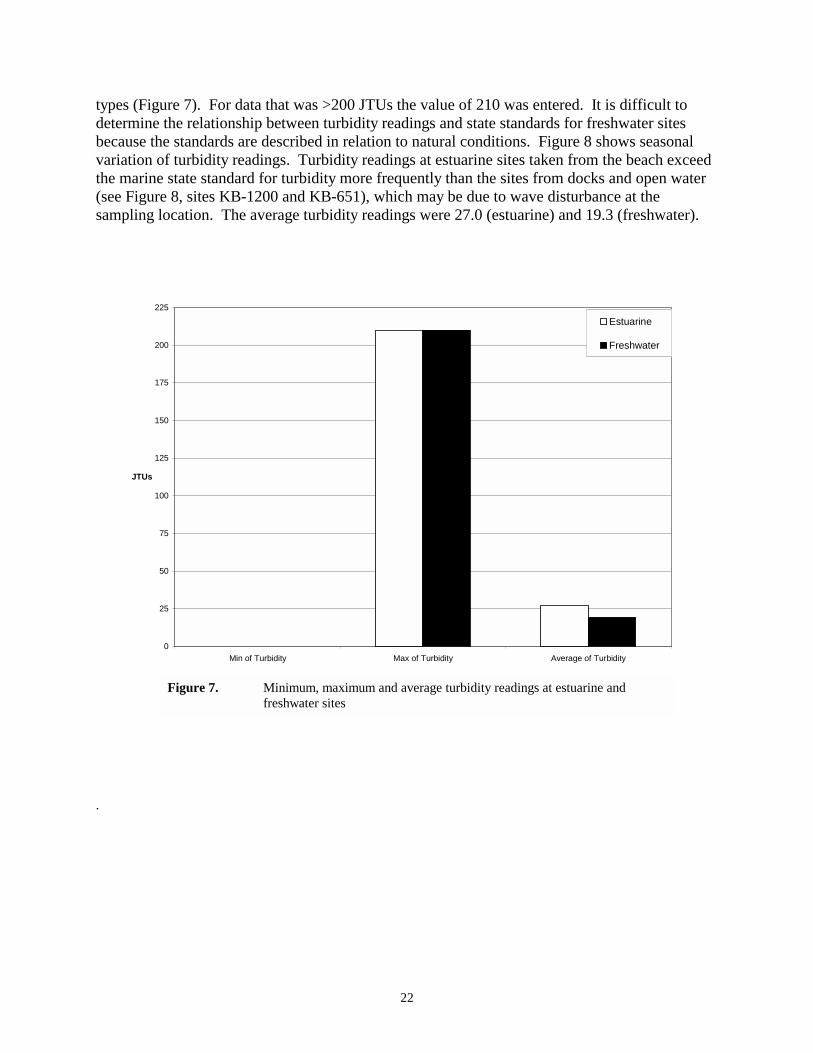
types (Figure 7). For data that was >200 JTUs the value of 210 was entered. It is difficult to determine the relationship between turbidity readings and state standards for freshwater sites because the standards are described in relation to natural conditions. Figure 8 shows seasonal variation of turbidity readings. Turbidity readings at estuarine sites taken from the beach exceed the marine state standard for turbidity more frequently than the sites from docks and open water (see Figure 8, sites KB-1200 and KB-651), which may be due to wave disturbance at the sampling location. The average turbidity readings were 27.0 (estuarine) and 19.3 (freshwater).
.
Figure 7. Minimum, maximum and average turbidity readings at estuarine and freshwater sites
0
25
50
75
100
125
150
175
200
225
Min of Turbidity Max of Turbidity Average of Turbidity
JTUs
Estuarine
Freshwater

23
Figure 8. Turbidity measurements at selected volunteer monitoring sites from February1997 to April 2000
Turbidity @ KB-1100 Diamond Creek @ Kachemak Bay(Estuarine)
0
25
50
75
100
125
150
175
200
225
9-D
ec-9
6
9-Fe
b-97
9-Ap
r-97
9-Ju
n-97
9-Au
g-97
9-O
ct-9
7
9-D
ec-9
7
9-Fe
b-98
9-Ap
r-98
9-Ju
n-98
9-Au
g-98
9-O
ct-9
8
9-D
ec-9
8
9-Fe
b-99
9-Ap
r-99
9-Ju
n-99
9-Au
g-99
9-O
ct-9
9
9-D
ec-9
9
9-Fe
b-00
9-Ap
r-00
Date
JTU
s
For values >200 JTUS, 210 was entered. This was to distinguish between values that are > 200 and those that are actually 200 JTUs.
Turbidity @ KB-1110 Diamond Creek @ Outflow Above Beach(Freshwater)
0
25
50
75
100
125
150
175
200
225
9-D
ec-9
6
9-Fe
b-97
9-Ap
r-97
9-Ju
n-97
9-Au
g-97
9-O
ct-9
7
9-D
ec-9
7
9-Fe
b-98
9-Ap
r-98
9-Ju
n-98
9-Au
g-98
9-O
ct-9
8
9-D
ec-9
8
9-Fe
b-99
9-Ap
r-99
9-Ju
n-99
9-Au
g-99
9-O
ct-9
9
9-D
ec-9
9
9-Fe
b-00
9-Ap
r-00
Date
JTU
s
For values >200 JTUS, 210 was entered. This was to distinguish between values that are > 200 and those that are actually 200 JTUs.

24
Salinity Perhaps the most important aspect of an estuary's salinity gradient is its effect on the distribution and well-being of the biological population that inhabits the area. Some species of fish, such as salmon, require the fresh water portion of the estuary to spawn, but live the rest of their lives in the marine portion. Some organisms are extremely tolerant of the changes in salinity and are found everywhere from the open sea to waters with only the slightest tinge of salt. Sessile (immobile) bottom-dwellers such as butter clams are tolerant of salinity variations, but salinity does affect their growth and spawning (Cook Inlet Keeper [Volunteer Training Manual], 1998). It is therefore important to get an understanding of the estuary's natural salinity backgrounds. Salinity is tested at estuarine sites using a hydrometer to measure specific gravity. The specific gravity and water temperature readings are then entered into the database, which calculates salinity with the following expression:
Salinity = -1242.39+1241.726*(specific gravity reading) -3.69946*(water temperature reading) +0.00771211*(water temperature reading)^2+3.62136*(specific gravity reading)*(water temperature reading)
The maximum salinity reading was 38.6 ppt at KB-310 (Figure 9). There were 4 readings below the estimated detection limit of this method of 0. The average salinity at estuarine sites was 17.0 ppt. Figure 10 shows salinity compared to state standards at selected volunteer monitoring sites.
Figure 9. Minimum, maximum, and average salinity readings at estuarine sites
-4
0
4
8
12
16
20
24
28
32
36
40
44
Min of Salinity Max of Salinity Average of Salinity

25
Salinity @KB-1200 Mud Bay Spit(Estuarine)
-3
2
7
12
17
22
27
32
37
21-D
ec-9
6
21-F
eb-9
7
21-A
pr-9
7
21-J
un-9
7
21-A
ug-9
7
21-O
ct-9
7
21-D
ec-9
7
21-F
eb-9
8
21-A
pr-9
8
21-J
un-9
8
21-A
ug-9
8
21-O
ct-9
8
21-D
ec-9
8
21-F
eb-9
9
21-A
pr-9
9
21-J
un-9
9
21-A
ug-9
9
21-O
ct-9
9
21-D
ec-9
9
21-F
eb-0
0
21-A
pr-0
0
Date
ppt
In the natural salinity range of 13.5 to 35.0 ppt, Alaska's maximum allowable variation above natural salinity for aquatic life is 4ppt (Human induced) (ADEC,1999).
In the natural salinity range of 3.5 to 13.5 ppt, Alaska's maximum allowable variation above natural salinity for aquatic life is 2 ppt (Human induced) (ADEC,1999).
In the natural salinity range of 0.0 to 3.5 ppt, Alaska's maximum allowable variation above natural salinity for aquatic life is 1ppt (Human induced) (ADEC,1999).
Salinity @ KB-1100 Diamond Creek @ Kachemak Bay(Estuarine)
-3
2
7
12
17
22
27
32
37
9-D
ec-9
6
9-Fe
b-97
9-Ap
r-97
9-Ju
n-97
9-Au
g-97
9-O
ct-9
7
9-D
ec-9
7
9-Fe
b-98
9-Ap
r-98
9-Ju
n-98
9-Au
g-98
9-O
ct-9
8
9-D
ec-9
8
9-Fe
b-99
9-Ap
r-99
9-Ju
n-99
9-Au
g-99
9-O
ct-9
9
9-D
ec-9
9
9-Fe
b-00
9-Ap
r-00
Date
ppt
Figure 10. Salinity measurements at selected volunteer monitoring sites from February 1997 to April 2000

26
pH The pH test is one of the most common analyses in water testing. An indication of the sample's acidity, pH is actually a measurement of the activity of hydrogen ions in the sample. pH measurements run on a scale from 0 to 14 , with 7.0 considered neutral. Solutions with a pH below 7.0 are considered acids, those between 7.0 and 14.0 are designated as bases. A range of 6.5 to 8.2 is optimal for most organisms (Campbell and Wildberger, 1992). Two different methods were used to measure pH. The electrometric method, using the Hanna meter, is more sensitive (0.1 units sensitivity) than the colorimetric method (0.5 units sensitivity). The average readings for the Colorimetric method were 8.1 (estuarine) and 7.1 (freshwater), while the more sensitive Hanna meter averaged 8.1 and 7.4 for estuarine and freshwater sites respectively (Figure 11). There were a total of 17 observations where both the Hanna meter and colorimetric tests together recorded readings above the state standard of 8.5. All were at estuarine sites, with 10 readings being at KB-350, 6 at KB-1200, and one at KB-700. The highest reading of 11.1 (Hanna meter) and 9.5 (colorimetric) occurred at KB-350, Beluga Lake Outflow (Figure 12). That High value could have been caused by an intense phytoplankton bloom (which raises pH), a likely event at a site downstream of a wetland in the middle of the summer (Cook Inlet Keeper, May 2000). One reading was below the 6.5 standard at a freshwater site at KB-490 with 6.3 (Hanna meter) and 6.0 (colorimetric) readings. Although less sensitive the colorimetric method is more consistent than the Hanna Meter, which should be calibrated prior to each use, is temperature sensitive, is battery powered and can go dead in the field, and has electrodes that need to be cleaned regularly. Figure 12 depicts the difference in sensitivity of the two methods and shows the inconsistency of the Hanna Meter (i.e. lack of data due to problems listed above). Some of these problems are being addressed by training volunteers to calibrate Hanna meters prior to sampling.
0
2
4
6
8
10
12
14
Min Colorimetric pH Min Hanna MeterpH
Max ColorimetricpH
Max Hanna MeterpH
AverageColorimetric pH
Average HannaMeter pH
pH u
nits
EstuarineFreshwater
Alaska 's upper limit for aquatic life (ADEC ,1999)
Alaska 's lower limit for aquatic life (ADEC ,1999)
Figure 11. Minimum, maximum, and average pH Hanna Meter and Colorimetric readings at estuarine and freshwater sites

27
pH @ KB-350 Beluga Lake Outflow (Estuarine)
3.5
4
4.5
5
5.5
6
6.5
7
7.5
8
8.5
9
9.5
10
10.5
11
11.5
12
9-O
ct-9
6
9-D
ec-9
6
9-Fe
b-97
9-Ap
r-97
9-Ju
n-97
9-Au
g-97
9-O
ct-9
7
9-D
ec-9
7
9-Fe
b-98
9-Ap
r-98
9-Ju
n-98
9-Au
g-98
9-O
ct-9
8
9-D
ec-9
8
9-Fe
b-99
9-Ap
r-99
9-Ju
n-99
9-Au
g-99
9-O
ct-9
9
9-D
ec-9
9
9-Fe
b-00
9-Ap
r-00
Date
pH u
nits
Hanna Meter pH
Colorimetric pH
Alaska 's upper limit for aquatic life , marine water uses. May not vary more than 0.2 pH unit from natural conditions (ADEC ,1999)
Alaska 's lower limit for aquatic life , marine water uses. May not vary more than 0.2 pH unit from natural conditions (ADEC ,1999)
pH @ KB-490 Bridge Creek @ Wynn Nature Center Bridge(Freshwater)
3.5
4
4.5
5
5.5
6
6.5
7
7.5
8
8.5
9
9.5
10
10.5
11
11.5
12
9-O
ct-9
6
9-D
ec-9
6
9-Fe
b-97
9-Ap
r-97
9-Ju
n-97
9-Au
g-97
9-O
ct-9
7
9-D
ec-9
7
9-Fe
b-98
9-Ap
r-98
9-Ju
n-98
9-Au
g-98
9-O
ct-9
8
9-D
ec-9
8
9-Fe
b-99
9-Ap
r-99
9-Ju
n-99
9-Au
g-99
9-O
ct-9
9
9-D
ec-9
9
9-Fe
b-00
9-Ap
r-00
Date
pH u
nits
Hanna Meter pHColorimetric pH
Alaska 's upper limit for aquatic life , freshwater uses. May not vary more than 0.5 pH unit from natural conditions (ADEC ,1999)
Alaska 's lower limit for aquatic life , freshwater water uses May not vary more than 0.5 pH unit from natural conditions (ADEC ,1999).
Figure 12. pH readings at selected volunteer monitoring sites from November 1996 to April 2000

28
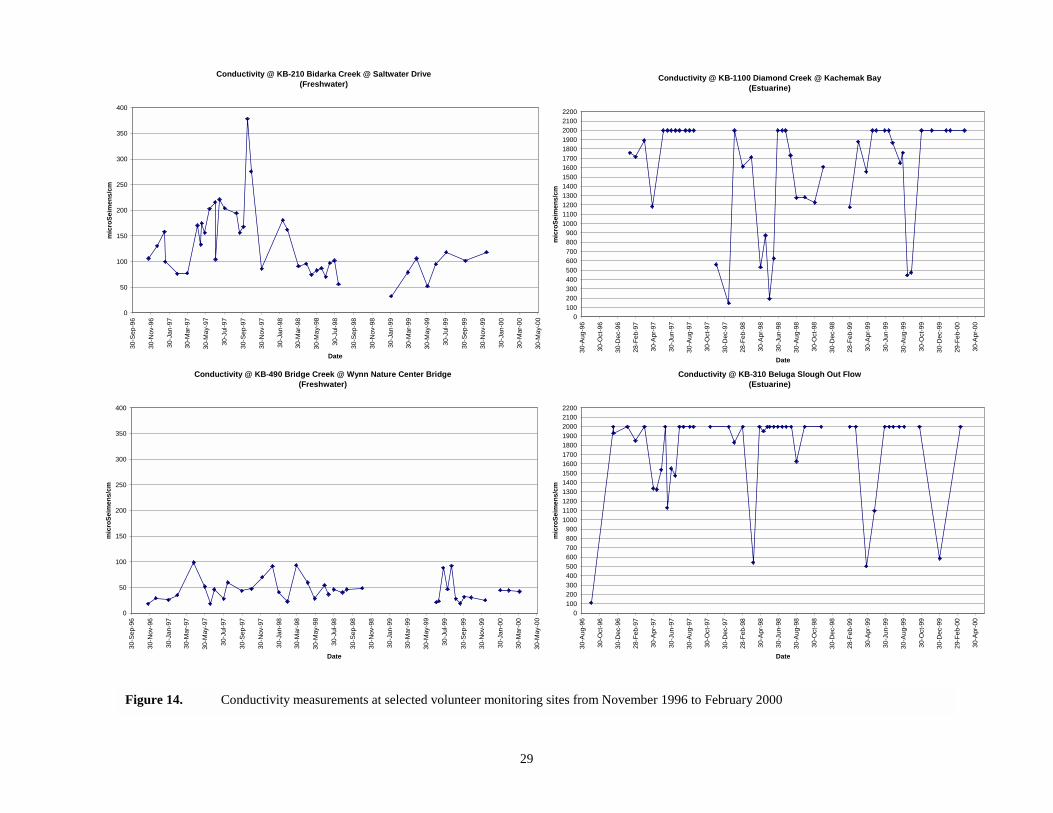
Conductivity Conductivity readings averaged 99 µS/cm (freshwater) and 1667 µS/cm (estuarine). The maximum reading for all sites was 1999 µS/cm (exceeding the range of Hanna Meter) with KB-1110 and KB-535 having the high for the freshwater sites. The minimum readings were 0 µS/cm at KB-440 (freshwater) and KB-350 (estuarine). Figure 14 shows conductivity readings at selected volunteer monitoring sites. Oxidation-Reduction Potential The highest oxidation-reduction potential (ORP) reading of 1085 mV was recorded at KB-310 an estuarine site and the high for the freshwater sites was 854 mV (Figure13). Lows were -51 mV at KB-1100 (estuarine) and -1009 mV at KB-210 (freshwater). Average readings were 138 mV (estuarine) and 127 mV (freshwater). Figure 15 shows ORP readings at selected volunteer monitoring site.
Figure 13. Minimum, maximum and average oxidation-reduction potential readings at estuarine and freshwater sites
-1100
-1000
-900
-800
-700
-600
-500
-400
-300
-200
-100
0
100
200
300
400
500
600
700
800
900
1000
1100
1200
Min of ORP Max of ORP Average of ORP
mV
Estuarine
Freshwater
29
Figure 14. Conductivity measurements at selected volunteer monitoring sites from November 1996 to February 2000
Conductivity @ KB-210 Bidarka Creek @ Saltwater Drive(Freshwater)
0
50
100
150
200
250
300
350
400
30-S
ep-9
6
30-N
ov-9
6
30-J
an-9
7
30-M
ar-9
7
30-M
ay-9
7
30-J
ul-9
7
30-S
ep-9
7
30-N
ov-9
7
30-J
an-9
8
30-M
ar-9
8
30-M
ay-9
8
30-J
ul-9
8
30-S
ep-9
8
30-N
ov-9
8
30-J
an-9
9
30-M
ar-9
9
30-M
ay-9
9
30-J
ul-9
9
30-S
ep-9
9
30-N
ov-9
9
30-J
an-0
0
30-M
ar-0
0
30-M
ay-0
0
Date
mic
roSe
imen
s/cm
Conductivity @ KB-490 Bridge Creek @ Wynn Nature Center Bridge(Freshwater)
0
50
100
150
200
250
300
350
400
30-S
ep-9
6
30-N
ov-9
6
30-J
an-9
7
30-M
ar-9
7
30-M
ay-9
7
30-J
ul-9
7
30-S
ep-9
7
30-N
ov-9
7
30-J
an-9
8
30-M
ar-9
8
30-M
ay-9
8
30-J
ul-9
8
30-S
ep-9
8
30-N
ov-9
8
30-J
an-9
9
30-M
ar-9
9
30-M
ay-9
9
30-J
ul-9
9
30-S
ep-9
9
30-N
ov-9
9
30-J
an-0
0
30-M
ar-0
0
30-M
ay-0
0
Date
mic
roSe
imen
s/cm
Conductivity @ KB-1100 Diamond Creek @ Kachemak Bay(Estuarine)
0100200300400500600700800900
1000110012001300140015001600170018001900200021002200
30-A
ug-9
6
30-O
ct-9
6
30-D
ec-9
6
28-F
eb-9
7
30-A
pr-9
7
30-J
un-9
7
30-A
ug-9
7
30-O
ct-9
7
30-D
ec-9
7
28-F
eb-9
8
30-A
pr-9
8
30-J
un-9
8
30-A
ug-9
8
30-O
ct-9
8
30-D
ec-9
8
28-F
eb-9
9
30-A
pr-9
9
30-J
un-9
9
30-A
ug-9
9
30-O
ct-9
9
30-D
ec-9
9
29-F
eb-0
0
30-A
pr-0
0
Date
mic
roSe
imen
s/cm
Conductivity @ KB-310 Beluga Slough Out Flow(Estuarine)
0100200300400500600700800900
1000110012001300140015001600170018001900200021002200
30-A
ug-9
6
30-O
ct-9
6
30-D
ec-9
6
28-F
eb-9
7
30-A
pr-9
7
30-J
un-9
7
30-A
ug-9
7
30-O
ct-9
7
30-D
ec-9
7
28-F
eb-9
8
30-A
pr-9
8
30-J
un-9
8
30-A
ug-9
8
30-O
ct-9
8
30-D
ec-9
8
28-F
eb-9
9
30-A
pr-9
9
30-J
un-9
9
30-A
ug-9
9
30-O
ct-9
9
30-D
ec-9
9
29-F
eb-0
0
30-A
pr-0
0
Date
mic
roSe
imen
s/cm

30
Figure 15. O
RP readings at selected volunteer m
onitoring sites from N
ovember 1996 to February 2000
OR
P @ K
B-490 Bridge C
reek @ W
ynn Nature C
enter Bridge
(Freshwater)
-50 0 50
100
150
200
250
300
9-Oct-96
9-Dec-96
9-Feb-97
9-Apr-97
9-Jun-97
9-Aug-97
9-Oct-97
9-Dec-97
9-Feb-98
9-Apr-98
9-Jun-98
9-Aug-98
9-Oct-98
9-Dec-98
9-Feb-99
9-Apr-99
9-Jun-99
9-Aug-99
9-Oct-99
9-Dec-99
9-Feb-00
9-Apr-00
Date
mV
ORP @
KB-1100 D
iamond C
reek @ K
achemak B
ay(Estuarine)
-50 50
150
250
350
450
550
650
750
850
9509-Oct-96
9-Dec-96
9-Feb-97
9-Apr-97
9-Jun-97
9-Aug-97
9-Oct-97
9-Dec-97
9-Feb-98
9-Apr-98
9-Jun-98
9-Aug-98
9-Oct-98
9-Dec-98
9-Feb-99
9-Apr-99
9-Jun-99
9-Aug-99
9-Oct-99
9-Dec-99
9-Feb-00
9-Apr-00
Date
mV

31
Apparent Color Apparent color was measured using the Borgor color system. Observations are the average of two readings when two were taken. The high reading was 144.5 (2.5 gallon) and 120 (50 ml) at an estuarine site and the low reading was 1 (2.5 gallon) and 0 (50 ml) at both freshwater and estuarine sites (Figure 16). The average readings were 80.8 (2.5 gallon), 88.7 (50 ml) and 58.4 (2.5 gallon), 63.2 (50ml) at estuarine and freshwater sites respectively. Figure 17 shows color readings at selected volunteer monitoring sites.
0
20
40
60
80
100
120
140
160
Min of BCS25 Min of BCS# (50ml) Max of BCS25 Max of BCS# (50ml) Average of BCS25 Average of BCS#(50ml)
BC
S#
EstuarineFreshwater
Figure 16. Minimum, maximum and average apparent color readings at estuarine and freshwater sites

32
Figu
re 1
7.
Col
or re
adin
gs a
t sel
ecte
d vo
lunt
eer m
onito
ring
site
s fro
m N
ovem
ber 1
996
to A
pril
2000
Colo
r @ K
B-21
0 Bi
dark
a C
reek
@ S
altw
ater
Driv
e(F
resh
wat
er)
020406080100
120
140
160
9-Sep-96
9-Nov-96
9-Jan-97
9-Mar-97
9-May-97
9-Jul-97
9-Sep-97
9-Nov-97
9-Jan-98
9-Mar-98
9-May-98
9-Jul-98
9-Sep-98
9-Nov-98
9-Jan-99
9-Mar-99
9-May-99
9-Jul-99
9-Sep-99
9-Nov-99
9-Jan-00
9-Mar-00
9-May-00
Dat
e
BCS #
BCS
2.5
gal.
BCS#
(50m
l)
Colo
r @ K
B-1
100
Dia
mon
d C
reek
@ K
ache
mak
Bay
(Est
uarin
e)
020406080100
120
140
160
9-Sep-96
9-Nov-96
9-Jan-97
9-Mar-97
9-May-97
9-Jul-97
9-Sep-97
9-Nov-97
9-Jan-98
9-Mar-98
9-May-98
9-Jul-98
9-Sep-98
9-Nov-98
9-Jan-99
9-Mar-99
9-May-99
9-Jul-99
9-Sep-99
9-Nov-99
9-Jan-00
9-Mar-00
9-May-00
Dat
e
BCS #
BCS
2.5
gal.
BCS#
(50m
l)

33
Nitrate-nitrogen The method used for nitrate-nitrogen is not sensitive enough to pickup background levels of nitrate-nitrogen, below 1.0 ppm (mg/l). There were 83 observations that measured nitrate-nitrogen. The highest reading of 5.0 ppm was measured at KB-110. A low of 0 ppm was measured at all sites where this test was performed. The average readings were 0.07 ppm at estuarine sites and 0.21 ppm at freshwater sites(Figure 18).
Orthophosphate Although the method may be sensitive enough to pickup some background levels of orthophosphate, it is not sensitive enough to measure levels below 0.2 ppm (mg/l). There were 94 observations that measured orthophosphate. The highest reading of 0.50 ppm was measured at KB-545. A low of 0 ppm was measured at all sites where this test was performed. The average readings were 0.01 ppm at estuarine sites and 0.03 ppm at freshwater sites (Figure 19).
0
1
2
3
4
5
6
7
8
9
10
11
12
Min of Nitrate-Nitrogen Max of Nitrate-Nitrogen Average of Nitrate-Nitrogen
ppm
Estuarine
Freshwater
Alaska's standard for drinking water (ADEC 1999)
Figure 18. Minimum, maximum and average nitrate-nitrogen readings at Estuarine and freshwater sites

34
Bacteria The Coliscan� method is used to sample for both total and fecal coliform bacteria. A test sample (of 1, 3 or 5 ml) is added to the designated medium, then it is poured into a petri dish and incubated at a controlled temperature. Samples are generally counted after a 48-hour incubation period. General coliform will produce colonies that are pink in color, while E. coli coliforms will produce purple colonies in the medium. Monitors count the number of general and E. coli coliforms in their petri dishes and record their information on data sheets. While this method is a simple, accurate quantitative way to measure coliforms, inherent problems include contamination of supplies as well as personal perspective in identifying the color of the colonies. This test is used only as a screening tool and to get a sense of natural variability. The average E. coli counts were 157 cfu/100ml (estuarine) and 233 cfu/100ml (freshwater) for the 1 ml dilution, 100 cfu/100 ml (estuarine) and 113 cfu/100ml (freshwater) for the 3 ml dilution and 124 cfu/100ml (estuarine) and 274 cfu/100ml (freshwater) for the 5 ml dilution. Average counts for total coliform with the 1ml dilution readings were 1031 cfu/100ml (estuarine), 4369 cfu/100ml (freshwater), 1463 cfu/100 ml (estuarine) and 3438 cfu/100ml (freshwater) for the 3 ml dilution. The 5ml dilution average readings were 1001 cfu/100ml (estuarine) and 3133 cfu/100ml (freshwater) (Figure 20).
Figure 19. Minimum, maximum and average Ortho-Phosphate readings at estuarine and freshwater sites
0
0.1
0.2
0.3
0.4
0.5
0.6
Min of OrthoPhosphate Max of OrthoPhosphate Average of OrthoPhosphate
ppm
Estuarine
Freshwater

35
Figure 20. Average Ecoli and Total Coliform counts for 1ml and 5 ml dilutions at estuarine and freshwater sites
0
500
1000
1500
2000
2500
3000
3500
4000
4500
5000
Average of 1ml Total Coliform (cfu/100ml) Average of 3ml Total Coliform (cfu/100ml) Average of 5ml Total Coliform (cfu/100ml)
cfu/
100
ml
Estuarine
Freshwater
0
20
40
60
80
100
120
140
160
180
200
220
240
260
280
300
Average of 1ml E. coli (cfu/100ml) Average of 3ml E. coli (cfu/100ml) Average of 5ml E. coli (cfu/100ml)
cfu/
100
ml
Estuarine
Freshwater

36
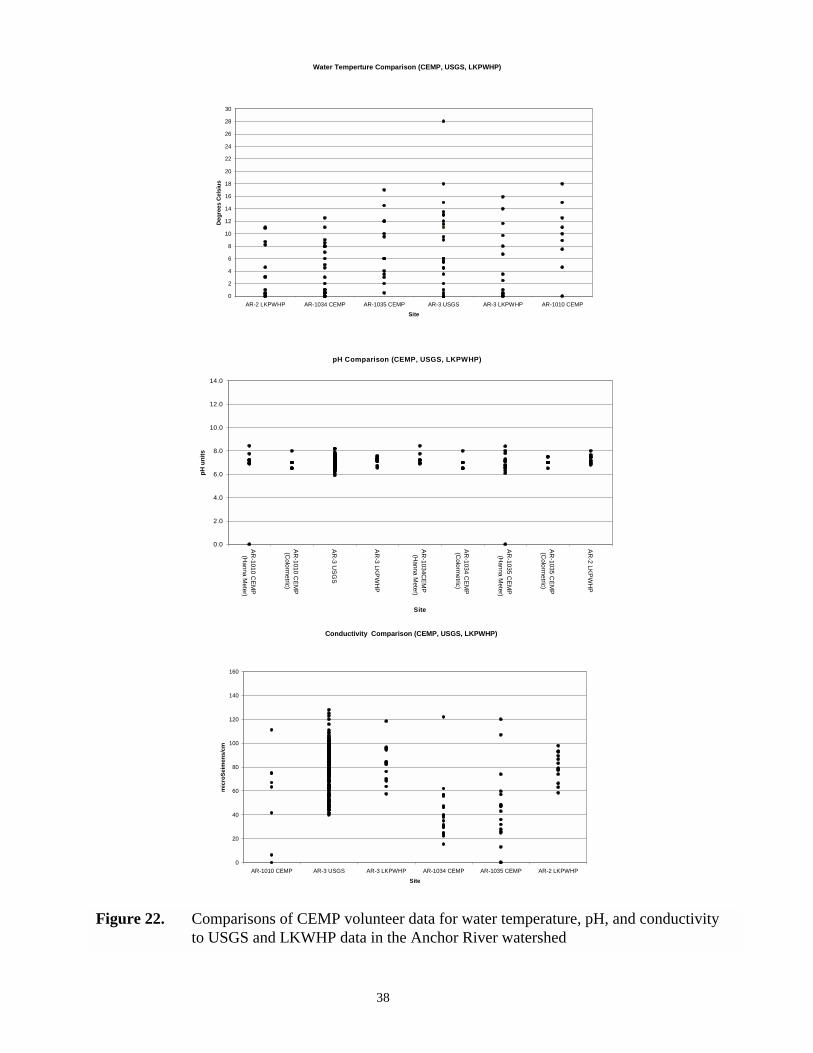
QUALITY CONTROL Data Comparison Comparing Project Results with Other Data for the Anchor River Keeper compared water quality data from the Citizen's Environmental Monitoring Program with data collected from the Lower Kenai Peninsula Watershed Health Project (LKPWHP) and USGS at sites in the Anchor River watershed. Figure 21 shows the location of sites used for comparison as well as other monitoring sites in the watershed. The graphs in figure 22 compare CEMP volunteer data to USGS and LKPWHP data for water temperature, pH, and conductivity in the Anchor River watershed (Cook Inlet Keeper, January 2000). Comparing Against Split Samples and Standard Solutions Keeper's quality assurance officer randomly selects volunteer monitoring sites and accompanies monitoring teams during selected sampling periods to perform split sample analysis. The QA officer uses the same sample water from the same bucket and performs the same tests as the monitoring team. Tests are performed using the same monitoring equipment as the volunteer monitor. Additional tests are done using the same equipment and methods used in the Lower Kenai Peninsula Watershed Health Project. Some results are shown in Appendix 4. Keeper also conducts performance standards comparisons during training and annual quality control sessions. Volunteer monitors are given a standard solution of known concentration. The monitor does not know the concentration while performing the test. Results are shown in Appendix 5.

37
38
Figure 22. Comparisons of CEMP volunteer data for water temperature, pH, and conductivity to USGS and LKWHP data in the Anchor River watershed
pH Comparison (CEMP, USGS, LKPWHP)
0.0
2.0
4.0
6.0
8.0
10.0
12.0
14.0
AR-1010 C
EMP
(Hanna M
eter)
AR-1010 C
EMP
(Colorm
etric)
AR-3 U
SGS
AR-3 LKPW
HP
AR-1034C
EMP
(Hanna M
eter)
AR-1034 C
EMP
(Colorm
etric)
AR-1035 C
EMP
(Hanna M
eter)
AR-1035 C
EMP
(Colorm
etric)
AR-2 LKPW
HP
Site
pH u
nits
Water Temperture Comparison (CEMP, USGS, LKPWHP)
0
2
4
6
8
10
12
14
16
18
20
22
24
26
28
30
AR-2 LKPWHP AR-1034 CEMP AR-1035 CEMP AR-3 USGS AR-3 LKPWHP AR-1010 CEMPSite
Deg
rees
Cel
sius
Conductivity Comparison (CEMP, USGS, LKPWHP)
0
20
40
60
80
100
120
140
160
AR-1010 CEMP AR-3 USGS AR-3 LKPWHP AR-1034 CEMP AR-1035 CEMP AR-2 LKPWHP
Site
mic
roSe
imen
s/cm

39
Quality Assurance Project Plan Review The Quality Assurance Project Plan (QAPP) and Volunteer Training Manual have been essential guiding documents for implementing the Citizens’ Environmental Monitoring Project. They have provided a template for organizations throughout the Cook Inlet watershed and beyond for developing sound water quality monitoring projects. A good QAPP is inherently dynamic. It changes based on advances in technology, financial limitations, and what its implementers learn will work or not work. Through training, monitoring and discussion with technical experts many suggestions for improvement have come forth from volunteers, quality control coordinators5, quality assurance officers, technical advisory committee members, equipment technicians, project officers of other monitoring programs, and citizens. Although the QAPP is technically sound, one of its greatest difficulties has been interpreting the duties, responsibilities, and procedures for those who are implementing the plan. The test procedures performed by the volunteer monitors are pretty straight forward, but when it comes to kit management, training, data management and other means of quality control more clearly defined instructions are needed. This information is explained in trainings and ongoing consultation but retaining it in an orderly fashion is somewhat difficult. It has been suggested that certain parts of the plan could be broken down into stand-alone Standard Operating Procedure (SOP) documents that would be incorporated as appendices in the QAPP. The appendices would clearly outline the duties and responsibilities of the quality assurance officer, trained quality control coordinators and volunteer monitors and provide step-by-step procedures for carrying out each particular component of the plan. This format will allow for individual SOP review and revision while still maintaining the framework of the QAPP. In addition to SOPs, Keeper is working to develop a Quality Management Plan (QMP) based on U.S. EPA guidelines. The purpose of the QMP will be to layout a formal framework for coordinating multiple monitoring projects and ensuring consistency. The QMP will further delineate the roles and responsibilities of the Technical Advisory Committee, Quality Assurance Officer, Quality Control Coordinators from each monitoring project, and others charged with ensuring the program’s data quality objectives are met. Proposed Revisions SOPs are currently being developed for the following activities and procedures: training, re-certification, performance standards, data management, replicate analysis, kit management, waste management, sample split, response, and field procedures. Each of these SOPs will be included as appendices in the revised QAPP. Corresponding sections of the QAPP will reference appropriate SOPs in lieu of detailed information within the main body of the document. In addition to this significant change in format, the QAPP will be revised to reflect: changes in 5 The quality control coordinator is the suggested title for monitors who complete a Phase V training and will be taking part in coordinating volunteer monitors and implementing the QAPP.

40
personnel; a shift in the sampling schedule (changing from sampling twice to sampling once in May and from sampling once to sampling twice in September); and resolution of minor inconsistencies between the QAPP and the Volunteer Training Manual. The Volunteer Training Manual will be revised by shifting those sections which provide detailed descriptions of procedures into the Field Procedure SOP which will be included as an appendix to the Manual. Cook Inlet Keeper is currently exploring more sensitive methods for measuring ortho-phosphate and nitrate-nitrogen as well as adding procedures for measuring ammonia and chlorophyll a and incorporating U.S. EPA’s volunteer habitat assessment methods into this project. If Keeper and its Technical Advisory Committee determine that these or other new procedures are feasible and would benefit the project, appropriate SOPs will be revised accordingly and submited to the U.S. EPA and the Alaska Department of Environmental Conservation for approval. OTHER CITIZEN BASED MONITORING IN COOK INLET The Citizens Environmental Monitoring Program continues to expand throughout the Cook Inlet basin (see figure 2), with over 100 sites having been monitored by over 120 active volunteers. To-date over 220 citizens have been trained since the start of the program. In and around Kachemak Bay, there are currently 36 active sites, monitored by 34 trained volunteers. In the Kenai area, nearly 60 volunteer monitors are working with the Kenai Watershed Forum to monitor 17 sites on tributaries of the Kenai River, using Keeper's established monitoring protocols to collect water quality data. In the Anchorage area more than 15 volunteers are monitoring eight sites with plans for new sites in the coming months. Keeper continues to provide support services to the Anchorage Waterways Council through trainer training's, technical support and data management. Keeper recently began working with the Wasilla Soil & Water Conservation District and the University of Alaska Anchorage’s Environment & Natural Resources Institute to expand monitoring efforts into the Mat Su Valley. A March, 2000 training saw 12 new monitors trained to monitor six new sites on the Little Susitna River and Cottonwood Creek. Data from all of these efforts will be merged into a common database beginning later this year. Future editions of this report will include a broad discussion of this data.
Ole Anderson with the Kenai Watershed Forum at a Cook Inlet Keeper training.

41
CONCULSION The intent of this first report has been to present the data objectively, make comparisons to state standards when possible and plot the data over time to show natural conditions and trends, and to
gain an understanding of how well the monitors, equipment, and methods are performing. In future edition of this report, Cook Inlet Keeper will look to provide a more detailed data analysis. To date, data collected by this project have been utilized by the city of Homer, the Kenai Peninsula Borough, and the Kachemak Bay National Estuarine Research Reserve for planning and research. The equipment and methods appear to be working to the best of their ability. As for the monitors, they are doing a tremendous job. Their dedication and commitment continues to amaze all who work with the program. The main limitations seem to be with the sensitivity of the methods and equipment, which are directly related to costs.
The Citizens' Environmental Monitoring Project is designed to raise public awareness of water quality issues and the watershed concept while collecting accurate baseline data. It strives to involve citizens in hands-on activities aimed at improving and protecting habitat and water quality, promoting resource stewardship, and establishing an environmental database. Since the inception of the monitoring program in the fall of 1996, CEMP has been accomplishing these goals and continues to improve and train more citizens. Technical Advisory Committee member Dr. John Kelly said it well after reviewing a draft of this report: "Citizen involvement in an environmental monitoring effort is not only cost-effective, but connects the stake holder to the stewardship of their environment rather than leaving the process to somebody else, thus disengaging themselves from both understanding the problems as well as solutions." John J. Kelly, Ph.D. Professor of Marine Science at University of Alaska-Fairbanks. In working with volunteer monitors, it is clear that these citizens are genuinely connecting with their environment on a regular basis. As they make these connections, monitors begin asking
Gravel pile that was spilling into McNeil creek at monitoring site KB-545. A volunteer monitor's response got the pile moved and the area re-vegetated.
Karl and Charles Pulliam, Susan Mumma, Joan Dunn, and Caren Graupe,-Seldovia volunteer monitors

42
question about what's going on in their watershed. They want to assure that the habitat and water quality around them is protected and they are willing to do their part to make it happen. Some monitors have taken extra steps. One volunteer noticed a gravel pile for a road construction project spilling over into the creek he was monitoring. He worked with Cook Inlet Keeper and the Alaska Department of Transportation to have the pile removed and the bank re-vegetated. Another monitoring team was fed up with the trash that was being dumped around in the parking area near their monitoring site on Ruby Creek, a tributary to the Anchor River. Team members took the initiative and worked with the Alaska Department of Transportation to have a no littering sign placed at the site. The team has committed to help enforce it. Yet another monitor has been concerned about a large a housing project being developed in her neighborhood. She has helped establish five monitoring sites in the creek running through the area, has talked with neighbors and the Alaska Department of Environmental Conservation. She wants to assure the project is done right and that proper septic systems are installed. In addition to the valuable water quality data being collected, it is this citizen vigilance and stewardship that provides some of the projects most far-reaching benefits.
Volunteer monitoring site KB-180, Woodard Creek West of Hospital.
Road development taking place on steep slope above Woodard creek and monitoring site KB-180.

43
REFERENCES
Alaska Department of Environmental Conservation, 1999. 18 AAC 70 Water Quality Standards as amended through May 27, 1999. ADEC. 58 p. Campbell, Gayla and Steve Wildberger. Edited by Nina Fisher, Marisa Feltham, and Eleanor Ely. 1992 LaMotte Company. The Monitors Handbook. Chestertown, Maryland. 71p. Cook Inlet Keeper, August 1998. Quality Assurance Project Plan: Cook Inlet Keeper Citizens Environmental Monitoring Program. Cook Inlet Keeper. Homer, Alaska. 29 p. + 9 appendices. Cook Inlet Keeper, August 1998. Volunteer Training Manual: Cook Inlet Keeper Citizens Environmental Monitoring Program. Cook Inlet Keeper. Homer, Alaska. 51 p. + 14 appendices. Cook Inlet Keeper, January 2000. A Preliminary Water Quality Assessment of Lower Kenai Peninsula Salmon Streams. Prepared by Beth Lambert, Stream Ecologist. Cook Inlet Keeper, Homer, Alaska. 68 p. Cook Inlet Keeper, May 2000. Beluga Wetlands and Their Watershed. Prepared by Ami Riscassi, Student Conservation Association Intern for Cook Inlet Keeper. Homer, Alaska. 39 p. EPA, 1986. Quality criteria for water: 1986. U. S. Environmental Protection Agency, Office of Water: Regulations and Standards, 398 pages.
Murdoch, Tom, and Martha Cheo, with Kate O'Laughlin. 1999. The Streamkeeper's Field Guide: Watershed Inventory and Stream Monitoring Methods. A product of the Adopt-A-Stream Foundation. Everett, WA. 296 p. USEPA. 1993. Volunteer Estuary Monitoring: A Methods Manual, EPA 842B93004, December. Office of Wetlands, Oceans, and Watersheds, 4503F, Washington, DC 20460. USEPA. 1996. The Volunteer Monitor's Guide To Quality Assurance Project Plans. EPA 841-B-96-003. September. Office of Wetlands, Oceans, and Watersheds, 4503F, Washington, DC 20460.