annual school report - home - bowraville central school€¦ · annual school report for 2010....
TRANSCRIPT

NSW Department of Education & Training
1336
2010 Annual School Report Bowraville Central School
NSW Public Schools – Leading the way

1
Messages
Principal’s message It is with enormous pride that we present the Annual School Report for 2010. Student achievement, attendance and engagement have all shown clear growth; parent and community engagement and support continue to deepen; and the school curriculum has further broadened to increasingly cater for the learning needs and aspirations of our students from Kindergarten through to Year 12. Quality Teaching programs are in place in all learning stages to both support and extent students. Our staff members have high expectations of our students, of themselves, and each other in our combined endeavour to create a learning environment where every child has the opportunity to be the best that they can be: Strong and Smart.
I certify that the information in this report is the result of a rigorous school self-evaluation process and is a balanced and genuine account of the school’s achievements and areas for development.
Malcolm McFarlane
P & C message 2010 was an eventful and productive year of collaboration and support for our parent body. Though at times light on numbers we are proud of the achievements of the year. The management of the P&C administered canteen has been very high on our agenda. As a result of the significant effort and dedication of the canteen committee, we are very pleased to report that the school’s Healthy Foods Canteen is in a far more stable financial position than was the case at the commencement of the school year. Our canteen was accepted into the Healthy Kids’ Booster Program. The much-needed air-conditioning was installed in order to improve the working environment of workers and volunteers. A further major fundraiser was the P&C organized Hoedown that raised funds for equipment to support student learning.
Leanne Davidson, Secretary
Student representative’s message Members of the Student Representative Council enjoyed a busy year of participation, leadership experience, and fundraising. We particularly enjoyed the opportunity to take part in many various decisions about the school playground that has improved considerably due to the completion of the various building projects.
Our fundraising activities included: Teddy Bear’s Picnic for Westmead Children’s Hospital, Jeans for Genes Day, and student socials each term. Funds raised assisted the school to purchase a new television for the library and materials for a bicycle rack, constructed with the help of Year 11 and 12 Metals and Engineering students.
Brad Doolan, School Captain
School context
Student information It is a requirement that the reporting of information for all students must be consistent with privacy and personal information policies.
Student enrolment profile
Enrolments in both Primary and Secondary have been variable in recent years. The school year concluded with a trend upward from the figures that appear below, K-12.
Primary
2006 2007 2008 2009 2010 Male 101 96 93 87 83 Female 90 83 68 55 48
Secondary
2006 2007 2008 2009 2010 Male 56 63 67 55 51 Female 56 70 47 58 61
Student attendance profile
Improving school attendance has been a school target focus for the past two years. Though still slightly below state average, the following graphs demonstrate the great improvements that have been made across the school.

2
Primary
Secondary
Management of non-attendance
Students whose attendance is causing concern are supported by both the school staff and the Home-School Liaison Officer. The school also highly values the advice and collaboration of our Aboriginal Education Officer and Aboriginal Community Liaison Officer in improving attendance patterns.
Class sizes
In March 2003 the Government announced its commitment to publish primary class sizes in annual school reports in order to provide parents with as much local information as possible.
The following table shows our class sizes as reported at the 2010 class size audit conducted on Wednesday 17 March 2010.
Roll Class Year Total per
Year
Total in Class
KINDER 10 K 16 16
YEAR 4/5 E 4 8 23
YEAR 4/5 E 5 15 23
YEAR 5/6 R 5 8 27
YEAR 5/6 R 6 19 27
YEAR 1/2 R 1 10 23
YEAR 1/2 R 2 13 23
YEAR 1/2 O 1 10 21
YEAR 1/2 O 2 11 21
YEAR 3/4RD 3 16 27 YEAR 3/4RD 4 11 27
Retention to Year 12
Stage 6 (Years 11 and 12) was commenced at Bowraville CS in 2007 with our first ever Higher School Certificate candidates graduating at the end of 2008. That first cohort of five (5) students has now more than doubled in both Years 11 and 12. An enrolment of approximately twelve each year in the senior secondary years is a very significant outcome for the school and an important outcome for the Nambucca Valley in improving the learning options for our youth.

3
In 2010 we had our largest enrolment in Year 11 to date, with 63% of the 2009 Year 10 students continuing at BCS.
Post-school destinations
Students completing their studies in 2010 proceeded to traineeships (4), apprenticeships, and further TAFE studies.
Year 12 students undertaking vocational or trade training
44% of students studied Vocational Education subjects, with one part-time student.
Year 12 students attaining HSC or equivalent vocational educational qualification
55% of students studied for their HSC fulltime and completed in 2010; the balance continuing.
Staff information
It is a requirement that the reporting of information for all staff must be consistent with privacy and personal information policies
Staff establishment
Position Number Principal 1 Deputy Principal(s) 1 Assistant Principal(s) 2 Head Teachers 3 Classroom Teachers 18 Careers teacher 0.4 Priority Schools Supplementation 0.6 Teacher of Reading Recovery 0.3 Support Teacher Learning Assistance 1.1 Teacher Librarian 1 Whole School Staffing 0.8 Counsellor 0.4 School Administrative & Support Staff 14 Total 43.6
The National Education Agreement requires schools to report on Indigenous composition of their workforce.
The above table is an indication of the diversity of skills required in order to continue to advance the learning outcomes of students at Bowraville CS. Of great significance is the contribution made each day by Aboriginal staff. In addition to our Aboriginal Education Officer and Community Liaison Officer, both of whom have long
associations with the school, a further teacher’s aide position and administrative position were created in 2010, provided employment for two Aboriginal community members.
As part of our ‘Bridges’ Pre-School into Kindergarten transition program one of the school’s first HSC candidates won the position of Teacher’s Aide through merit selection. Furthermore, a vacancy that emerged within our administration and support staff (SASS) was advertised within the parameters of the Aboriginal SASS identified positions program. The successful candidate was a member of the Bowraville community whose appointment to this significant, permanent position further reflects the positive collaboration between the school and the Aboriginal community. As in previous years, the school also endeavours to employ Aboriginal and other community members as tutors and aides through such programs as NORTA NORTA.
Staff retention
Our staffing is traditionally very stable, with only minimal movement from year to year. At the commencement of the 2010 school year, one of the secondary Science staff accepted a transfer to another High School, and at the conclusion of 2010 one of our highly valued executive staff, Mr Paul Le Cerf, Head Teacher Secondary, retired from the profession. Both positions were filled by qualified and highly experienced staff well known to the school community.
Teacher qualifications
All teaching staff meet the professional requirements for teaching in NSW public schools.
Qualifications % of staff Degree or Diploma 91 Postgraduate 9
Financial summary This summary below covers funds for operating costs and does not involve expenditure areas such as permanent salaries, building and major maintenance.

4
Date of financial summary: 30/11/2010Income $
Balance brought forward 138241.78Global funds 270659.64Tied funds 359152.15School & community sources 107773.36Interest 9475.78Trust receipts 14396.00Canteen 0.00Total income 899698.71
ExpenditureTeaching & learning Key learning areas 61968.04 Excurs ions 67492.00 Extracurricular dissections 52466.15Library 209.00Training & development 0.00Tied funds 338683.48Casual relief teachers 92265.05Administration & office 48758.19School-operated canteen 0.00Util ities 52326.40Maintenance 24207.92Trust accounts 13872.00Capital programs 0.00Total expenditure 752248.23Balance carried forward 147450.48
A full copy of the school’s 2010 financial statement is tabled at the annual general meeting of the School P&C. Further details concerning the statement can be obtained by contacting the school. Expenditure on staff training and development sits within the Tied Funds in the above table.
School performance 2010
Achievements Arts
Opportunities for artistic expression are highly valued at Bowraville CS. Due to our rural setting, staff explore every opportunity to either engage visiting troupes or create excursions so that a full exposure to The Arts is possible for all. In 2010 our students participated in a major excursion to the Sydney Opera House to see the Bell Shakespeare production of Twelfth Night.
The Bell Shakespeare Company also brought their schools production of Romeo and Juliet to our community, performing for our students and
visiting students from across the Nambucca Valley at the historic Bowraville Theatre.
This experience was made possible thanks to the collaboration of Beyond Empathy, Bowraville.
The school choir enjoyed another busy and productive year, performing at numerous assemblies, including Presentation Day and the Official Opening of our new facilities. The choir also played a pivotal role in the annual school musical. This year’s production was Rocks to Rap
Sport
, which provided a wonderful opportunity for learning and entertainment in the arts for all students involved.
BCS was represented at State level in Athletics. Students also represented in North Coast, Zone and District levels in Swimming, Athletics and Cross Country. Teams and individuals participated in League, Netball and Touch PSSA trials. Our senior boys League team narrowly missed out in qualifying in Group 2 carnival which would have given them the opportunity to play in Sydney at the All Schools Carnival. Our league team in the Seven’s competition won the right to play in front of a large audience at the Coffs Harbour Regional Stadium.
The school entered teams in local gala days in Touch and Soccer which were non competitive fun days.
Excursions
Primary excursions included a weeklong trip to the Gold Coast for Senior Primary students as well as curriculum related local outings to the beach, river, farms visits, and local museums. Students also participated in Gold day activities at Scott’s Head Beach, Macksville Pool and interest days at school.
ESSA
The Essential Secondary Science Assessment (ESSA) is undertaken annually in November by all Year 8 students across NSW. The results for Bowraville CS students this year was particularly pleasing.
A comparison of previous years’ results indicates an overall improvement in Science. School results are close to state average and for the first time

5
there are no students in the lower bands. Our school was above state average in extended responses in one category. The overall trend is upward to within 2 Marks of state average across all 5 categories.
Academic
In the National Assessment Program, the results across the Years 3, 5, 7 and 9 literacy and numeracy assessments are reported on a scale from Band 1 to Band 10.
The achievement scale represents increasing levels of skills and understandings demonstrated in these assessments.
Yr 3: from Band 1 (lowest) to Band 6 (highest for Year 3)
Yr 5: from Band 3 (lowest) to Band 8 (highest for Year 5)
Yr 7: from Band 4 (lowest) to Band 9 (highest for Year 7)
Yr 9: from Band 5 (lowest) to Band 10 (highest for Year 9)
and/or
In the School Certificate the performance of students is reported in performance bands ranging from Performance Band 1 (lowest) to Performance Band 6 (highest).
Literacy – NAPLAN Year 3
Years 3 results in Reading show positive movement in trend data from the lower bands towards middle bands. The percentage of students achieving Band 1 dropped significantly in 2010 to 13% from 20% in 2009 and 24% in 2008. This corresponds to an increase in the percentage of students achieving Band 4 in 2010 to 33% compared to only 10% in both 2009 and 2008. The large number of students in band 4 highlights the need for our continued focus on literal and inferential comprehension. This is being addressed through use of Accelerated Literacy (AL) Pedagogy.

6
Numeracy – NAPLAN Year 3
Literacy – NAPLAN Year 5
In 2010 Year Five Spelling, more students achieved band 8 than in the previous two years. The percentage of students in Band 8 rose
significantly from 0% in 2008 and 2009 to 5% in 2010.
Numeracy – NAPLAN Year 5
Literacy – NAPLAN Year 7
In 2010 Year 7 Writing saw a very favourable school average mark of 497.2, in comparison with the Similar Schools group (SSG) average of 483.3. This was repeated in Reading, 508.3 compared with 495.0 SSG, and Spelling, 506.0 compared with 504.3 SSG.

7
Numeracy – NAPLAN Year 7
Literacy – NAPLAN Year 9
Year 9 NAPLAN results in Literacy were all very solid. Of particular note were the results in Grammar and Punctuation, with the school’s average mark of 543.9 exceeding that of the SSG at 528.7.This was matched in Reading, with the school’s average mark of 541.2 exceeding that of the SSG at 530.3.
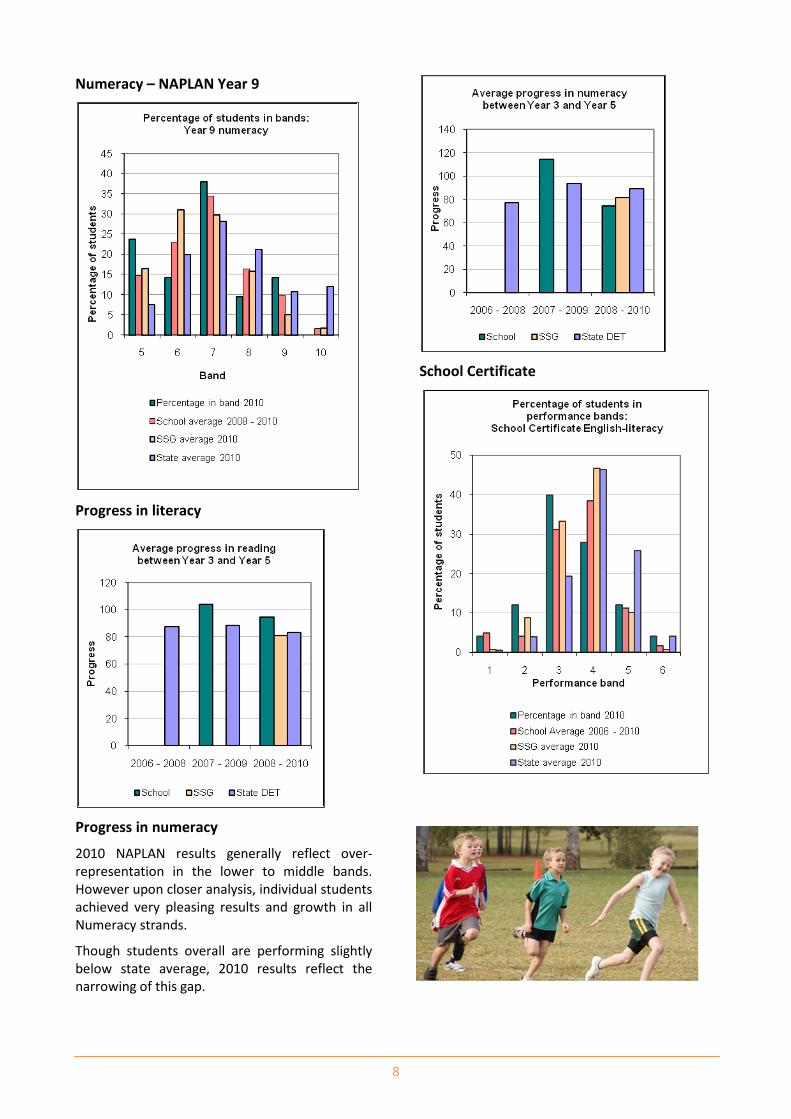
8
Numeracy – NAPLAN Year 9
Progress in literacy
Progress in numeracy
2010 NAPLAN results generally reflect over-representation in the lower to middle bands. However upon closer analysis, individual students achieved very pleasing results and growth in all Numeracy strands.
Though students overall are performing slightly below state average, 2010 results reflect the narrowing of this gap.
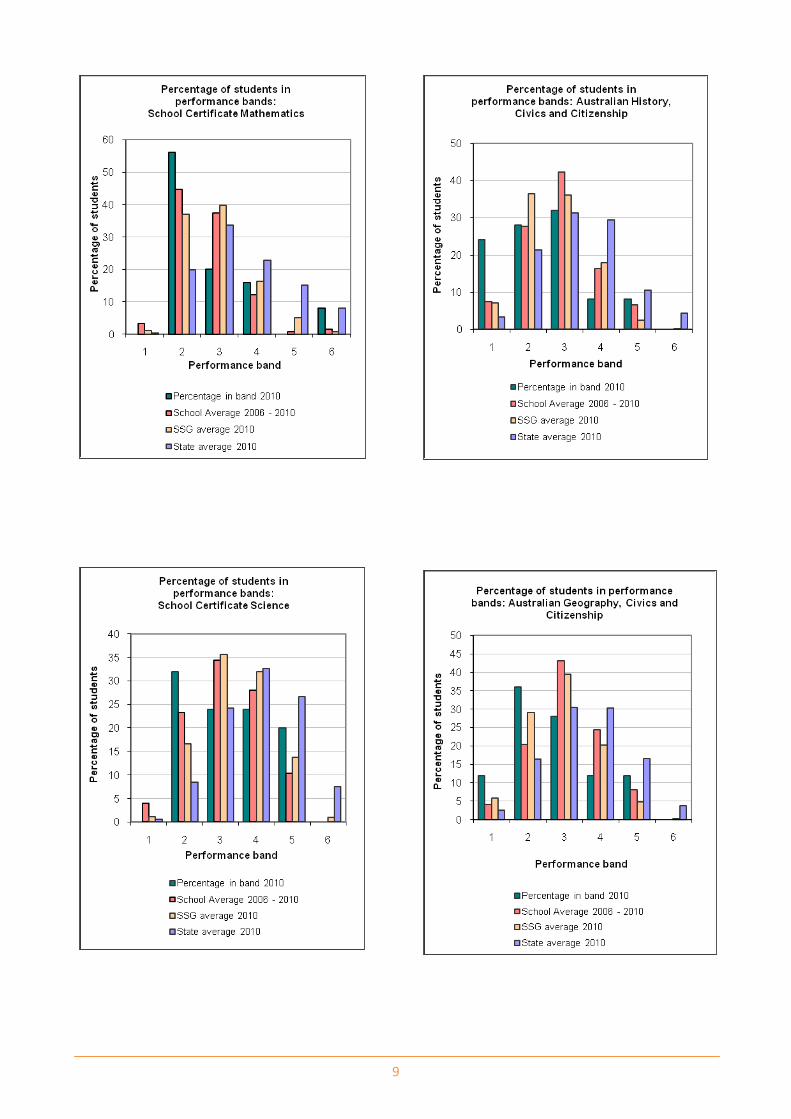
School Certificate
9

10
The above School Certificate graphs for individual subjects indicate an overall improvement in comparison to results in 2008 and 2009. More students overall achieved in the higher bands, and the percentage of our top students achieving the top grade (Band 6) in both English and Mathematics was equivalent to that across the state, and far exceeded that achieved by comparable schools (SSG).
School Certificate relative performance comparison to Year 5 (value-adding)
Higher School Certificate
In line with the departmental guidelines regarding small cohorts, it is not appropriate to provide summary statistics or graphical representation of student performance.
Minimum standards
The Commonwealth Government sets minimum standards for reading, writing, grammar and punctuation, spelling and numeracy for years 3, 5, 7 and 9.
The performance of the students in our school in the National Assessment Program – Literacy and Numeracy is compared to these minimum standards. The percentages of our students achieving at or above these standards are reported below.
These figures reflect a clear improvement overall in comparison with the same data for 2009. Of particular note for Year 3 are Reading (80% in 2009) and Numeracy (85% in 2009); for Year 5 Reading moved most significantly (80% in 2009).
Percentage of Year 3 students in our school achieving at or above the minimum standard in 2010
Percentage of Year 3 students achieving at or above minimum standard
Reading
87 Writing
93
Spelling
75 Punctuation and grammar
81
Numeracy 100
Percentage of Year 5 students in our school achieving at or above the minimum standard in 2010
Percentage of Year 5 students achieving at or above minimum standard
Reading
86 Writing
77
Spelling
82 Punctuation and grammar
73
Numeracy 91
English -3.5 -1.1 -1.5Mathematics 0.8 -2.2 -1.7Science -0.9 -1.6 -1.4Australian History, Civics and Citizenship -7.1 -2.6 -2.1Australian Geography, Civics and Citizenship -2.4 -1.6 -2.2Computer Skills -1.8 -1.6 -1.1Note: By definition, the State average relative performance is zero
SSG Average 2010
School Average 2006 - 2010School 2010Course

11
Percentage of Year 7 students in our school achieving at or above the minimum standard in 2010
Percentage of Year 7 students achieving at or above minimum standard
Reading 84.6 Writing
92.3
Spelling
92.3 Punctuation and grammar 69.2 Numeracy 100.0
Percentage of Year 9 students in our school achieving at or above the minimum standard in 2010
Percentage of Year 9 students achieving at or above minimum standard
Reading 72.7 Writing
68.2
Spelling
63.6 Punctuation and grammar 81.8 Numeracy 76.2
Significant programs and initiatives Aboriginal education
Bowraville CS has a long and proud history of striving to achieve the finest possible outcomes for Aboriginal students. In 2010, after significant training involving the Principal, Head Teacher Welfare, and the Aboriginal Education Officer, the school became a Learning Community Hub School within the Stronger Smarter Institute, Queensland University of Technology. The Stronger Smarter Institute is at the forefront of innovation and leadership development in Australia in regard to improving the educational outcomes of Aboriginal and Torres Straight Islander Students, and those from socio-educationally disadvantaged backgrounds. Through this affiliation with the Stronger Smarter Institute, and by learning from associated schools across the country, the school’s fine record of achievement in Aboriginal Education is being taken to a new level.
The Gumbaynggirr language program continues to strengthen, delivered in conjunction with Murrbaay Language Centre, Nambucca Heads. Strong partnerships continue with the community, illustrated by the participation and attendance at school assemblies, NAIDOC
celebrations, application to work in classrooms to tutor or mentor, or to be employed through Norta Norta funding.
The establishment of the ‘Bridges – Pre-School into Kindergarten Transition Program’ in 2010 is an extremely significant development for the school community in improving learning outcomes for Aboriginal students for many years to come.
Since 2008 the school has worked in collaboration with TAFE and other agencies to provide an off-site learning centre for adolescent students at risk of totally disengaging with formal education. In 2010 this program has been funded in partnership with Macksville TAFE. An evaluation was conducted in Term 4 to consider the impact of the program. It was acknowledged that the young people who had been involved largely remained engaged in education, although on a partial attendance basis. It was recommended that such a program be undertaken in the future within the school’s main campus.
Multicultural education
Teaching and non-teaching staff actively seek out and create opportunities for all students to experience multicultural education opportunities. Through the Arts, class research work, and languages studies, students are able to gain a greater understanding of the world and its rich diversity through various cultural lenses. Respect, tolerance, and empathy are qualities highly valued at Bowraville CS.
Respect and responsibility
Staff and students actively engage with the P&C and community to promote the concepts of respect and responsibility. Throughout 2010, class activities, staff professional learning time, and community forums were held around the theme of Stronger, Smarter. In 2010 Bowraville CS became a Stronger Smarter Learning Community Hub School, working with the support of The Stronger, Smarter Institute, Queensland University of Technology. This leadership program builds capacity within school communities to raise expectations of Aboriginal students and those from low socio-economic circumstances, built on mutual respect and responsibility.

12
Other programs Priority Schools Funding Program
Bowraville Central School continues to benefit from the additional resourcing of the Priority Schools Funding Program (PSFP).
The school’s Numeracy priority was addressed by the development of problem-solving resources utilising information and communication technology (ICT). These resources were developed following on from the 2009 Newman’s Prompts staff professional development.
The successful QuickSmart program was continued in 2010. The aim of the program is to increase automaticity, and thus free up the working memory of the students. PSFP funding also assisted in the school’s Literacy focus by supporting the further training of teachers in Accelerated Literacy. Other areas supported included the Home Reading program, library resources, SoundWaves spelling and criterion based marking developed from NAPLAN data.
Participation programs included the production of our annual School Magazine, Gayirri; support for the Three Way Interviews (student-teacher-carer); and the Secondary Student Portfolio program.
BRIDGES
The Bridges Pre-School into Kindergarten Program commenced in 2010. This is a major Bowraville CS initiative that will improve the learning outcomes of our students for many years to come. Working in collaboration with our local pre-schools, and the Departments of Health and Community Services, the program enables young people with identified needs and their families to engage with Bowraville CS throughout the year prior to entry into Kindergarten in a supportive, positive, and strength-based model. The program also enables the staff of Bowraville CS to have a deeper understanding of the individual strengths and needs of students and families prior to commencement at school.
RESUS
In an attempt to pro-actively address the repetitive problematic behavior of a small number of Infants students, a creative and innovative program was developed in 2010 by our staff: the Return from Suspension Program (RESUS).
Working in partnership with the relevant students’ families, students whose behaviour has warranted suspension are excluded from school for the minimum time possible, and then enter the RESUS program where both their individual learning needs and behaviour can be catered for before it is determined that they are ready to re-enter the classroom or regular playground.
Though constantly under review, this initiative has had a huge impact on behaviour management across the school and approaches have already been made by several other school to share the model.
Connected Learning
Curriculum offerings at Bowraville CS and Dorrigo HS were further expanded in 2010 with the establishment of a Connected Learning delivery model. Utilising the connected classrooms technology of a live video conference and interactive whiteboard connection, Year 11 students of Primary Industries and Community and Family Services (CAFS) benefitted from shared learning and the expertise of staff at both schools. Bowraville CS delivered Primary Industries to Dorrigo HS students, and Dorrigo HS delivered CAFS to students at Bowraville. Students and staff involved in connected learning visited each other for combined classes once a term throughout the year.
Progress on 2010 targets The school’s targets have been developed in consultation with the school community after a rigorous analysis of all available data. In line with both State and North Coast Region priority areas, the school’s targets for 2010 focused on: Literacy, Numeracy, Student Engagement and Retention.

13
Target 1
45% of students achieve Stage outcomes in Literacy and Numeracy; Student Retention increased to 70%.
Our achievements include:
• Reduction of students achieving NAPLAN results in the lower bands, and an increase in those achieving in the higher bands in both Literacy and Numeracy
• Significant growth in students’ NAPLAN results; closer to state average, and in most areas of learning greater than growth displayed in comparable schools
• Both retention in the senior years and student attendance have shown demonstrable improvement
Key evaluations It is a requirement for all NSW public schools to conduct at least two annual evaluations – one related to educational and management practice and the other related to curriculum. In 2010 our school carried out evaluations of School Planning, and Creative and Performing Arts.
Educational and management practice
Planning
Background
As part of the annual evaluation cycle, Planning was chosen as a major area of evaluation. Data was collected from targeted interviews with students, parents and staff.
Findings and conclusions
Students interviewed from secondary and upper primary grades indicated a limited understanding of whole school planning. The majority understood that the school staff had an executive structure that worked in collaboration with students and P&C to make decisions about the functioning of the school. Planning for students was best defined in terms of timetables and the term by term calendar.
Parents involved with the school either as volunteers or P&C members displayed a higher degree of understanding of the school’s planning cycle than those not so directly involved. However this knowledge too was limited largely to events rather than long-term planning and
means of addressing the students’ learning needs. Some parents indicated no desire to further their knowledge of this aspect of the school’s functioning while others expressed a clear desire to have opportunities to be more deeply involved in the creation of the school plan.
Staff understanding of the school planning cycle was understandably far greater however some expressed interest in have greater opportunities for further involvement, especially in the areas of timetabling and finance.
Future directions
Though the school community appears to respect the planning processes in place, further opportunities will be created in order for interested parties to be able to be more involved in the future direction of the school through the creation of the annual school plan.
Curriculum
Creative and Performing Arts
Background
The ability to offer a rich and diverse curriculum is a challenging for a K-12 rural Central School. Our ability to engage students in the Creative and Performing Arts (CAPA) was therefore chosen as an area of review.
Findings and conclusions
K-6 student participation in class creative arts pursuits is very solid, with a large range of music, dance, and visual arts opportunities available. Due to the particular expertise of a staff member, quite complex and involved mosaic art works have been created that are over time greatly enhancing the school environment for all. This ongoing project has been highly effective not only in improving students’ artistic skills, but also in increasing the engagement and confidence of students.
The Primary Choir has for many years gone from strength to strength, growing to having a regular attendance of approximately fifty students. The self-discipline and musical skills this program offers are matched by the experience and challenge of the many performances undertaken at the school and within the broader community each year. The choir plays a large role in our annual musical, performed at the Bowraville Theatre.

14
In the secondary school, the visual arts have traditionally been stronger than the performing arts. This has changed somewhat over the past two years, with staff endeavouring to raise the musical opportunities available to students. Elective music classes are now full. In addition to regular performances at school assemblies, students collaborated with staff and community members to create two highly successful Performance Nights.
Future directions
There is a definite sense among students and staff that opportunities for learning within the Creative and Performing Arts are good and growing. The benefits to students and the school community are many if this trend continues. Professional learning opportunities and fundraising in future years will further assist the capacity for development.
Parent, student, and teacher satisfaction In 2010 the school sought the opinions of parents, students and teachers about the school. Regular input and feedback from parents was sought through P&C meetings, and in a new initiative in 2010, at two community forums that were held to discuss and improve school tone. Based on attendance at these events and the honest and candid variety of comments offered, it can be said that the school enjoys solid support from its parent body. There were no formal complaints lodged in 2010.
Staff evaluations conducted at the conclusion of each professional learning day, revealed that more than 80% of staff consistently feel supported and have input into the direction of the school. There were no formal complaints from staff in 2010.
Though surveys explicitly around student satisfaction were not comprehensively completed in 2010, feedback from student leaders is very positive in regard to the tone of the school and the curriculum and environmental improvements that have been made in recent years. A gradual decline in suspensions each year reflects this.
Professional learning Professional Learning is a key lever in enabling the school to achieve its stated targets. In 2010
all teaching and non-teaching staff participated in professional learning opportunities both at the school and in conjunction with colleagues from other schools within the Nambucca Valley Community of Public Schools during School Development Days. In addition to mandatory training such as Child Protection and First Aid training, staff benefitted from Quality Teaching learning pertinent to their classroom.
Total Professional Learning expenditure in 2010 was $16487, or an average of $687 per teaching staff member. Though no permanent new scheme teachers worked towards accreditation, two temporary new scheme teachers benefitted from professional learning in 2010.
School development 2009 – 2011
By utilising our strengths as a learning community and by supporting staff professionally through a focus on Quality Teaching, we intend to create a safe and caring environment for learning within which each student is respected, supported and extended.
Targets for 2011 To raise student achievement in Numeracy and Literacy, and reduce the gap between Aboriginal and non-Aboriginal students, while improving attendance, engagement, and retention through effective transitions and other targeted programs.
Target 1
Literacy
Increase the percentage of students achieving proficiency (top two bands) in WRITING in NAPLAN 2011 as follows:
• Year 3 students from 25% in 2010 to 38% in 2011, represented by the movement of 1 student in each band
• Year 5 students from 5% in 2010 to 9% in 2011, represented by the movement of 2 student in each band
• Year 7 students from 8% in 2010 to 16% in 2011, represented by the movement of 1 student in each band
15
• Year 9 students from 14% in 2010 to 23% in 2011, represented by the movement of 2 student in each band
Increase the percentage of students achieving proficiency (top two bands) in READING in NAPLAN 2011 as follows:
• Year 3 students from 20% in 2010 to 27% in 2011, represented by the movement of 1 student in each band
• Year 5 students from 10% in 2010 to 15% in 2011, represented by the movement of 2 students in each band
• Year 7 students from 15% in 2010 to 28% in 2011, represented by the movement of 2 students in each band
• Year 9 students from 9% in 2010 to 14% in 2011, represented by the movement of 2 student in each band
Increase the percentage of students achieving proficiency (top two bands) in SPELLING in NAPLAN 2011 as follows:
• Year 3 students from 13% in 2010 to 19% in 2011, represented by the movement of 1 student in each band
• Year 5 students from 5% in 2010 to 14% in 2011, represented by the movement of 2 students in each band
• Year 7 students from 8% in 2010 to 16% in 2011, represented by the movement of 2 students in each band
• Year 9 students from 9% in 2010 to 15% in 2011, represented by the movement of 1 student in each band
Strategies to achieve this target include:
• The use of AL pedagogy will be initiated across all classes from BRIDGES to Year 7.
• Teachers will be given a scope and sequence of texts as well as teaching notes for staff members who have not been using AL pedagogy in their classes.
• Designated staff meetings will be held to discuss student achievement in the area of
text patterning around the novel each class has studied.
Our success will be measured by:
• Reduce percentage group difference between school and state from greater than 10% to within 10% for NAPLAN Reading questions
• Reduce percentage group difference between school and state from greater than 10% to within 10% for NAPLAN Reading questions
• Increase student representation achieving criterion marking score of 2 out of 4 in NAPLAN Writing, text structure, from 50% to 75% (Year 3), 59% to 75% (Year 5)
Target 2
Numeracy
Increase the percentage of students achieving proficiency (top 2 bands) in Numeracy in NAPLAN 2011 as follows:
• Year 3 students from 15% in 2010 to
20% in 2011, represented by the movement of 1 student in each band
• Year 5 students from 9% in 2010 to 18% in 2011, represented by the movement of 1 student in each band
• Year 7 students from 15% in 2010 to 23% in 2011, represented by the movement of 1 student in each band
• Year 9 students from 14% in 2010 to – 19% in 2011, represented by the movement of 1 student in each band
Strategies to achieve this target include:
• Teach two problem solving strategies per term and deliver at least two explicit lessons on those strategies using Problem Solving folders and or own program.
• Teach the targeted outcomes, identified through NAPLAN analysis, for each cohort in an explicit way and revisit these outcomes throughout the year.
• Analyse incorrect responses in targeted outcomes for NAPLAN.

16
Identify outcomes withdraw top students with incorrect responses and analyse their strategies.
Our success will be measured by:
• Enhance Quality Teaching practices to improve levels of numeracy achievement for all students in Problem solving
• Diminished gap in numeracy achievement between Aboriginal Students and all students.
• Increase student knowledge of specific problem solving strategies.
Target 3
Student Attendance, Engagement, Retention and Transition Student attendance to increase to 85%; student retention to increase to 75%; 95% of Personalised Learning Plans in place for Aboriginal students
Strategies to achieve this target include:
• Personalised Learning Program (PLP), involving mentors, and involving families
• Improved community awareness of attendance initiatives, through school newsletter, P&C and Aboriginal Education Consultative Group (AECG)
• Improved Aboriginal student outcomes through leadership of Stronger Smarter Learning Community Program (including an academic research project
Our success will be measured by:
• improved attendance
• reduction in unexplained absences
• Improved attendance of students, parents/carers at transition meetings; development of Transition Plans for all relevant students
About this report In preparing this report, the self-evaluation committee has gathered information from evaluations conducted during the year and analysed other information about the school's practices and student learning outcomes. The self-evaluation committee and school planning committee have determined targets for the school's future development.
Malcolm McFarlane Principal
Jeanette Perkins Deputy Principal
Craig Northfield Assistant Principal
Owen Rushton Assistant Principal
Leanne Davidson P&C Secretary
Megan Cochrane School Administrative
Officer
School contact information
Bowraville Central School
High Street, Bowraville, NSW 2449
Ph: 02-65647162
Fax: 02-65647801
Email: [email protected]
Web: www.bowraville-c.schools.nsw.edu.au
School Code: 1336
Parents can find out more information about Annual School Reports, how to interpret information in the reports and have the opportunity to provide feedback about these reports at:
http://www.schools.nsw.edu.au/asr