annual report - waipa district
TRANSCRIPT

ANNUAL REPORT
FOR THE YEAR ENDED
30 JUNE 2007

Waipa District Council Annual Report for Year Ended 30 June 2007
Page 2
CONTENTS PAGE Council Mission and Goals .............................................................................................................................................4
Map ................................................................................................................................................................................5
Council Information and Directory ..................................................................................................................................6
Organisational Structure.................................................................................................................................................7
Introduction ....................................................................................................................................................................8
Financial Overview .........................................................................................................................................................9
Community Outcomes – Measuring Progress ..............................................................................................................10
Improving Community Well-Being ................................................................................................................................11
Opportunities for Māori to contribute to Council’s decision-making processes.............................................................13
Statement of Compliance .............................................................................................................................................14
Statement of Financial Performance ............................................................................................................................15
Statement of Financial Position ....................................................................................................................................16
Statement of Changes in Equity ...................................................................................................................................17
Statement of Cash Flows .............................................................................................................................................18
Notes to the Financial Statements................................................................................................................................19 1 Statement of Accounting Policies for the Year Ended 30 June 2007.................................................................... 19 2 Explanation of Transition to NZ IFRS.................................................................................................................... 27 3 Summary Cost of Service ..................................................................................................................................... 30 4 Rates Revenue ..................................................................................................................................................... 31 5 Other Revenue...................................................................................................................................................... 31 6 Other Gains/(Losses) ............................................................................................................................................ 31 7 Employee Benefit Expenses ................................................................................................................................. 31 8 Other Expenses .................................................................................................................................................... 32 9 Finance Costs ....................................................................................................................................................... 32 10 Cash and Cash Equivalents.................................................................................................................................. 32 11 Trade and other Receivables ................................................................................................................................ 32 12 Other Financial Assets .......................................................................................................................................... 33 13 Non Current Assets Held for Sale ......................................................................................................................... 33 14 Property, Plant and Equipment ............................................................................................................................. 34 15 Intangible Assets................................................................................................................................................... 36 16 Forestry Assets ..................................................................................................................................................... 36 17 Investment Property.............................................................................................................................................. 36 18 Investment in Associates ...................................................................................................................................... 37 19 Trade and other Payables..................................................................................................................................... 37 20 Provisions (incl Landfills)....................................................................................................................................... 37 21 Employee Benefit Liabilities .................................................................................................................................. 38 22 Borrowings ............................................................................................................................................................ 38 23 Equity .................................................................................................................................................................... 39 24 Reconciliations of Net Surplus/(Deficit) to net Cash Flow from Operating Activities ............................................. 40 25 Capital Commitments and Operating Leases ....................................................................................................... 40 26 Contingencies ....................................................................................................................................................... 41

Waipa District Council Annual Report for Year Ended 30 June 2007
Page 3
27 Related Party Transactions................................................................................................................................... 41 28 Remuneration ....................................................................................................................................................... 42 29 Severance Payments............................................................................................................................................ 42 30 Events after the Balance Sheet Date .................................................................................................................... 42 31 Financial Instrument Risk...................................................................................................................................... 42 32 Capital Management............................................................................................................................................. 43 33 Explanation of Major Variances Against Budget ................................................................................................... 43 Governance..................................................................................................................................................................45
Environmental Services................................................................................................................................................47
Amenity Services..........................................................................................................................................................50
Transport Management ................................................................................................................................................55
Stormwater ...................................................................................................................................................................59
Water Treatment and Supply........................................................................................................................................62
Wastewater Treatment and Disposal ...........................................................................................................................66
Support Services ..........................................................................................................................................................69
Involvement in Council-Controlled Organisations and Council Organisations ..............................................................71
Auditor’s Report............................................................................................................................................................73

Waipa District Council Annual Report for Year Ended 30 June 2007
Page 4
COUNCIL MISSION AND GOALS Mission Statement To promote the well-being of the people of the Waipa District. Goals 1 To recognise, and foster awareness and the enhancement of, the unique cultural, historic, environmental and
recreational character and strengths of the District. 2 To ensure prudent stewardship of the natural and physical resources of the District. 3 To provide facilities and services to meet the expectations of residents and ratepayers. 4 To maximise the contribution of Council’s assets in promoting the sustainable development of the District. 5 To form strong and productive partnerships with other authorities, community organisations and the private
sector to provide the District with development opportunities. 6 To provide services and/or actively support Community Boards, community and welfare organisations in
meeting the physical, recreational, employment, cultural and social needs of the residents of the District. 7 To act as an advocate to promote the social, economic, cultural and environmental well-being of residents
and communities of the District. 8 To encourage the active and positive involvement of residents and ratepayers in Council’s decision-making
processes. 9 To implement the legal obligations of a territorial authority governing Waipa District.

Waipa District Council Annual Report for Year Ended 30 June 2007
MAP
Page 5

Waipa District Council Annual Report for Year Ended 30 June 2007
Page 6
COUNCIL INFORMATION AND DIRECTORY MAYOR Alan Livingston JP DEPUTY MAYOR Peter Lee COUNCILLORS Hazel Barnes JP Joe Scaramuzza Ron Cooper JP Diane Sharpe JP Alan Empson Barbara Taranaki JP Gaidyn Flay Bruce Thomas Graham Jull Grahame Webber Errol Newlands EXECUTIVE Chief Executive John Inglis Deputy Chief Executive/Group Manager – Environmental Services Garry Dyet Group Manager – Finance Shelagh Kew Group Manager – Assets, Community and Business Services John Mills Group Manager – Policy and Strategy Ross McNeil Engineering Manager John Kerr BANKERS ASB
500 Victoria Street HAMILTON
SOLICITORS Gallie Miles
P O Box 170 TE AWAMUTU
Irving Law P O Box 592 TE AWAMUTU
Swarbrick Dixon P O Box 19010 HAMILTON
Tompkins Wake
P O Box 258 HAMILTON
Phillips Fox P O Box 160 AUCKLAND
Simpson Grierson P O Box 2404 WELLINGTON
AUDITORS Audit New Zealand on behalf of:
Auditor-General Office of the Auditor-General WELLINGTON
LOCATIONS Head Office
Private Bag 2402 101 Bank Street TE AWAMUTU 3840 Phone (07) 872 0030 Fax (07) 872 0033
Cambridge Service Centre 23 Wilson Street CAMBRIDGE 3434 Phone (07) 823 3800 Fax (07) 823 3820

Waipa District Council Annual Report for Year Ended 30 June 2007
ORGANISATIONAL STRUCTURE
RESIDENTS
Iwi Consultative Committee
Regulatory Committee
Policy Committee
Te Awamutu Community
Board
Cambridge Community
Board
COUNCILMayor and twelve
Councillors
Chief Executive
Group ManagerAssets,
Community and Business Services
Group ManagerFinance
Group Manager
Environmental Services
Group Manager
Policy and Strategy
Property
Recreation
Asset Management
Financial Accounting
Financial Planning
Human Resources
Payroll
Rating
Customer Services
Information Services
Building Control
Planning Services
Environmental Safety
Animal Control
Libraries
Communications
Community Planning and Liaison
Corporate and Strategic Planning
Heritage
Maungatautari Reserve
Committee
Pirongia Ward
Consultative Committee
Engineering Manager
Transport Management
Waste Water Treatment
Water Treatment
Stormwater
Page 7

Waipa District Council Annual Report for Year Ended 30 June 2007
INTRODUCTION
This year has been another good one for Council and the Waipa District. Throughout the year growth has once again been greater than anticipated. Council assumed it would be 1.96%. It has been 3%, over 500 additional properties. Subdivisions and development, predominantly in Cambridge, have made it necessary to review the planned upgrade of associated infrastructure. Growth has also continued to put increased demands on planning and building consent work. In addition to work required by development and the usual operational work programmes Council initiated several large projects and continued to work on some significant issues. These include the extension of seal on gravel roads that has now taken the total of roads able to be sealed in the district to 95.6%; the problem of heavy traffic in the main street of Te Awamutu, which continues to be a complex matter; the Cambridge Bypass – now in its design stage, and a comprehensive traffic study of Cambridge and the surrounding area; a new covered swimming pool for Cambridge, a community sports hall as a joint venture with the Cambridge High School; and a substantial upgrade of the Karapiro Domain, which will support the world rowing championships to be held in 2010. The year has not been without the usual challenges but Council is pleased to report an operating surplus of $7 million compared to a budget of $6.8 million, and, once again, a strong balance sheet with an increase in equity of $229 million. The revaluation of infrastructural assets has played a part in this and vested assets of $8 million compared to a budget of $1.3 million has largely offset $9 million of under expenditure on capital work. Much of this incomplete capital work will continue on in the next year. The triennial local body elections are to be held in October 2007. Council is pleased with the outcome of 2006/07 and proud of what has been accomplished during its three year term. It takes this opportunity to thank all those who have been involved in Council business and who have contributed to the good results that have been achieved for the benefit of the district. Alan Livingston (JP) John Inglis MAYOR CHIEF EXECUTIVE
Page 8

Waipa District Council Annual Report for Year Ended 30 June 2007
Page 9
FINANCIAL OVERVIEW FOR THE YEAR ENDED 30 JUNE 2007 Operating Results Financial performance over the last year has been sound resulting in a surplus of $7m. The additional revenue of $5.8m has largely been driven by the high level of assets vested in Council as a result of the development of several major Cambridge sub-divisions, and also the requirement to recognise the increase in valuation of investments properties through the Statement of Financial Performance. Additional revenue was also contributed by the Significant Activities. Offsetting this additional revenue, there was significant additional expenditure. A revaluation of infrastructural assets was undertaken one year early to ensure that Council’s assets are reflected at fair value. New contracts for the Te Awamutu Events Centre, recycling and litter collection resulted in higher expenditure. Additional consultancy, depreciation and legal fees in the Support activity has resulted in an increased overhead allocation for all other significant activities. These additional costs were anticipated during the year and included in the nine months’ forecast.
Statement of Financial Position The Statement of Financial Position provides information about Council’s equity, assets and liabilities. There has been a significant increase in equity arising from the revaluation of infrastructural assets. Investments at year end were high awaiting completion of capital work and final contract payments. Borrowing was in accordance with budget with new short-term debt being undertaken. The short-term debt of $9m is due to be repaid in August and there is a higher than normal level of current liabilities until the repayment. Council has entered into a debenture trust deed to provide security over rates for all borrowing, and has also entered into an agreement with ANZ National Bank Limited to provide a borrowing facility for the coming years.
Financial Management Council receives monthly financial information throughout the year to support its governance role and decision-making. At each quarter a full report is presented to Council and this includes financial and non-financial performance information compared with targets set in the Annual Plan, together with financial forecasts to year end.
Full implementation of NZ IFRS has resulted in a change to the format of the financial statements and provided more detailed note disclosure. The prior year’s comparative figures have been restated to comply with NZ IFRS.

Waipa District Council Annual Report for Year Ended 30 June 2007
Page 10
COMMUNITY OUTCOMES – MEASURING PROGRESS Community Outcomes guide Council and other agencies in the delivery of services to the needs of the community. In 2003 Council facilitated a consultation process (Have Your Say) to identify the long-term aspirations and expectations of residents. The feedback received help shape 22 key community outcomes for Waipa District. In preparing the 2004-14 and 2006-16 Long Term Council Community Plans (LTCCPs), Council ensured that its activities and projects were aligned to these Community Outcomes. According to the Local Government Act 2002, once the community outcomes have been identified, work towards achieving the outcomes needs to be monitored, and the results reported to the public at least every three years. Both locally and nationally there are a number of processes underway to identify indicators that will be most appropriate to measure progress towards the achievement of community outcomes. As well as work at the national level on compiling national indicators, at regional level the local authorities in the Waikato Region have committed to work in partnership to develop joint approaches to identify and then monitor regional community outcomes. A working group, ‘Monitoring and Reporting Community Outcomes’ (MARCO), has been formed and Waipa District Council is part of this working group. A Waikato Community Outcomes Data Analysis Report has been published and is available online at http://www.choosingfutures.co.nz/index.asp?PageID=2145841505 In fulfilment of the Local Government Act community outcomes monitoring requirements, Council will prepare and publish a comprehensive State of the District report on a six-yearly basis, with an interim report to be published every three years. The purpose of the State of the District report will be to demonstrate the overall level of well-being in the Waipa District and any changes, both positive and negative, that occur over time. Council’s first monitoring report on progress towards achievement of the community outcomes will be published at the end of 2007. This first report will provide a baseline on which future data can be measured and compared, although historical data may be available for some of the indicators. This information will assist in identifying priority areas for consideration in the development of the 10-year Plan (LTCCP) 2009-19, as well as supporting the review of the Waipa District Plan. Information to date that will feed into the report is included in the Waikato Community Outcomes Data Analysis Report, which outlines some information to Waipa District level. Another current source of data for Waipa District is Environment Waikato’s Environmental Awareness Attitudes and Actions Survey 2006, available online at http://www.ew.govt.nz/publications/technicalreports/tr0706.htm. For a full list of Waipa’s Community Outcomes, the Waikato Regional Community Outcomes, Waipa Iwi Community Outcomes and the indicators that Waipa District Council will use to monitor progress towards achieving Community Outcomes, please refer to Waipa District Council’s 10-year Plan 2006-16.

Waipa District Council Annual Report for Year Ended 30 June 2007
Page 11
IMPROVING COMMUNITY WELL-BEING All of the activities, services and projects undertaken by Council are intended to support or improve the social, cultural, economic and environmental well-being of the community. However, Council recognises that there may also be unintended negative impacts associated with the service provision, particularly in relation to major services such as roading, water, wastewater and stormwater services. There has been no material change to the potential negative impacts of activities, services and projects undertaken by Council as identified in the LTCCP 2006-16. In relation to the past year a number of initiatives were commenced and/or completed, with each making a significant positive contribution to community well-being. These initiatives are listed below:
Kihikihi Wastewater Scheme – This project, which was completed in 2006, attracted a $7.1 million subsidy from the Government. At that time a shortfall in Government funding meant that $4.1 million of the subsidy was not going to be available to Council until 2009, requiring ratepayers to fund the interest payments on a loan for the outstanding amount. However, Council has now received the remaining subsidy, allowing the loan to be repaid.
Karapiro Development – Work has commenced on the development of the Karapiro Domain in general
accordance with the strategic plan adopted by Council in 2005. Designs and concept plans have been progressed, with the staging of development to complement the staging of the World Rowing Championships at Karapiro in 2010. Initial works have involved the construction of footpaths and the widening of the main entrance.
Cambridge Pool – Council has confirmed the location of the new pool at the existing Williamson Street site
(budget of $11.5 million) and committed $1.8 million to a joint initiative with Cambridge High School for the development of a Community Sports Hall. These projects will be progressed in 2007/08 with the finalising of designs and the commencement of the tendering process.
Stormwater upgrades – These were required to address chronic drainage problems in particular areas of
urban communities. Further work in Cambridge and Te Awamutu is programmed for the next 2-3 years.
Lake Te Ko Utu – Following extensive community input, Council commenced a programme of works to improve the water quality and enhance the environs of Lake Te Ko Utu. During the year litter traps were installed on stormwater pipes entering the lake; adjacent community facilities had their septic tanks removed and were connected to the sewerage system; significant upgrades were made to walking tracks and stabilisation of the south-eastern lake edge was undertaken.
Rukuhia Hall – Construction of this facility ($600,000 budget) commenced in March 2007, with completion
expected in August 2007. This project is being led by the Rukuhia community.
Remediation of Landfills – The closed landfills at Kihikihi and Pirongia were capped in accordance with resource consent requirements, with planting at the Pirongia landfill to be completed in 2007/08. The remediation works were required to ensure the landfills can be managed to minimise ongoing environmental effects, and will be subject to routine monitoring.
Cambridge North Development – The ongoing expansion of infrastructure to support residential development
in Cambridge.

Waipa District Council Annual Report for Year Ended 30 June 2007
Page 12
IMPROVING COMMUNITY WELL-BEING CONTINUED
Footpaths – In 2002, following strong support from the Cambridge community, Council embarked on a $1 million 5-year footpath development programme in Cambridge. A similar programme is underway in Kihikihi, following the completion of the wastewater scheme. The goal of the footpath programme is to ensure that every residential street in major urban areas has a footpath on at least one side of the road. During the year a total of 3.1km of new footpath has been constructed, with the renewal of 1.1km of old footpath.
Seal Extension – 2006/07 was the final year of a five-year, $5 million District-wide programme to seal roads.
During the year, an additional 4.8km of roads were sealed, with a further 1.3km underway to complete the 2006/07 programme. Seal extension is programmed to continue from 2008/09.
Te Awamutu Events Centre – An extensive maintenance programme, including shutdown of the pool
facilities, was successfully undertaken during the year.
Maungatautari Ecological Island – The construction of the pest-proof fence has been completed. Council support for the Ecological Island project has continued to focus on the provision of supporting infrastructure and administration. At a governance level the project is being overseen by a Committee of Council.
District Promotion Fund/Community Grants – $477,083 was allocated to groups and organisations to support
work and activities aimed at improving well-being for residents ($69,170 for district promotions and $407,913 for community grants). This figure is lower than in previous years, because the Te Awamutu Museum and Cambridge Museum, which were previously funded by way of annual grants, are now both funded through the Amenity Services significant activity area.
Reserve Development – The ongoing implementation of a rolling programme to develop parks and reserves
across the District.
Bylaws Review – During the year 11 Bylaws have been subject to review. Council has progressed the review of 20 of its 23 existing Bylaws. Council will complete its bylaw review programme by 30 June 2008.
Cambridge Traffic Study – Concerns about congestion and safety issues on the local and state highway
network prompted Council to undertake this Study, which was completed in May 2007. The study identified impacts of the proposed Cambridge bypass and the need for associated roading projects, including the need for a full interchange at Hautapu (intersection of State Highways 1 and 1B) and the time at which a third bridge across the Waikato River is required. The report will inform Council’s future road management and planning activities.
Peat Lakes Accord – These lakes are widely recognised as being unique and worthy of preservation. In
conjunction with key conservation and environmental management agencies, Council is overseeing the implementation of a 6 year ($650,000) programme of restoration works, with 2006/07 being the first year of the programme.
Water Supply and Wastewater System Upgrades – This work is an essential element in the preservation of
public health and the development of any community.

Waipa District Council Annual Report for Year Ended 30 June 2007
Page 13
OPPORTUNITIES FOR MĀORI TO CONTRIBUTE TO COUNCIL’S DECISION-MAKING PROCESSES Council’s governance structure includes an Iwi Consultative Committee, one of three primary standing committees. The Committee consists of the Mayor, the Deputy Mayor, Chairpersons of the Regulatory and Policy Committees, representatives of hapū within the District, the Chairperson of Ngā Iwi Toopu o Waipa and a Kaumatua representative. The purpose of the Iwi Consultative Committee is to consider any matter of significance to Māori, including, but not limited to, the development and implementation of policy. The Committee makes recommendations for Council consideration. Council has a formal agreement with Ngā Iwi Toopu o Waipa – an independent group mandated by and advocate for Iwi within the District. The agreement makes provision for annual support funding to Ngā Iwi Toopu o Waipa to ensure that Māori have the capacity and capability to participate in Council’s decision-making processes. Ngā Iwi Toopu O Waipa is recognised as an important conduit through which Council consults with Māori on resource consent applications, policy matters and other issues of significance. Council further promotes the decision-making capacity of Māori through the appointment of Iwi representatives to the Policy and Regulatory Committees of Council. Council has established a committee to oversee the management of key reserves in Pirongia Village. The reserves, which are subject to the provisions of the Waikato Raupatu Settlement Claims Act, are currently administered by the Department of Conservation. In line with community expectation, Council has sought an appointment (pursuant to the Reserves Act 1997) to control and manage these reserves. Given the significance of these reserves to local Māori, Council has appointed representatives of Purekireki Marae and Te Kauhanganui O Waikato as members of the Committee, as well as local community representatives and Pirongia Ward Councillors. In light of the scale and significance of the Maungatautari Ecological Island project, Council has established a committee to oversee the management and development of the Maungatautari Scenic Reserve. The Maunga (Mountain) has particular significance to local Iwi, and Council has recognised this in the membership of the Maungatautari Reserve Committee, with 5 of the 12 members being tangata whenua representatives. The remaining members represent the wide range of other stakeholders with an interest in the Ecological Island project.

Waipa District Council Annual Report for Year Ended 30 June 2007
STATEMENT OF COMPLIANCE The Council of the Waipa District Council hereby confirms that all statutory requirements in relation to the Annual Report, as outlined in the Local Government Act 2002, have been complied with.
MAYOR CHIEF EXECUTIVE Alan Livingston John Inglis
Page 14

Waipa District Council Annual Report for Year Ended 30 June 2007
STATEMENT OF FINANCIAL PERFORMANCE FOR THE YEAR ENDED 30 JUNE 2007
2007 2007 2006Actual Budget Actual
Note $000 $000 $000
OPERATING INCOME
Rates 4 26,904 26,652 24,604 Reserve contributions 871 1,299 625 Development contributions 2,275 3,223 1,666 Gain on revaluation of investment properties and forestry 6 2,775 396 4,036 Vested assets 6,214 2,725 3,595 Discovered assets 6 - 581 Other revenue 5 13,809 12,853 20,744
Total Operating Income 52,854 47,148 55,851
OPERATING EXPENDITURE
Employee benefit expenses 7 9,921 9,993 8,634 Depreciation and amortisation 12,935 10,597 11,348 Other expenses 8 22,244 18,920 19,508 Finance costs 9 681 802 904
Total Operating Expenditure 3 45,781 40,312 40,394
OPERATING SURPLUS 7,073 6,836 15,457
Explanations of significant variances against budget are detailed in note 33 and include:
• Reduced development contributions from assessments made at prior years’ rates • Recognition of revaluation gains on investment properties • Additional vested assets from developers of Cambridge sub-divisions • Additional depreciation from revaluation of infrastructural assets • Increases in contract costs, additional consultancy and legal fees
The accompanying notes form part of these financial statements.
Page 15
Waipa District Council Annual Report for Year Ended 30 June 2007
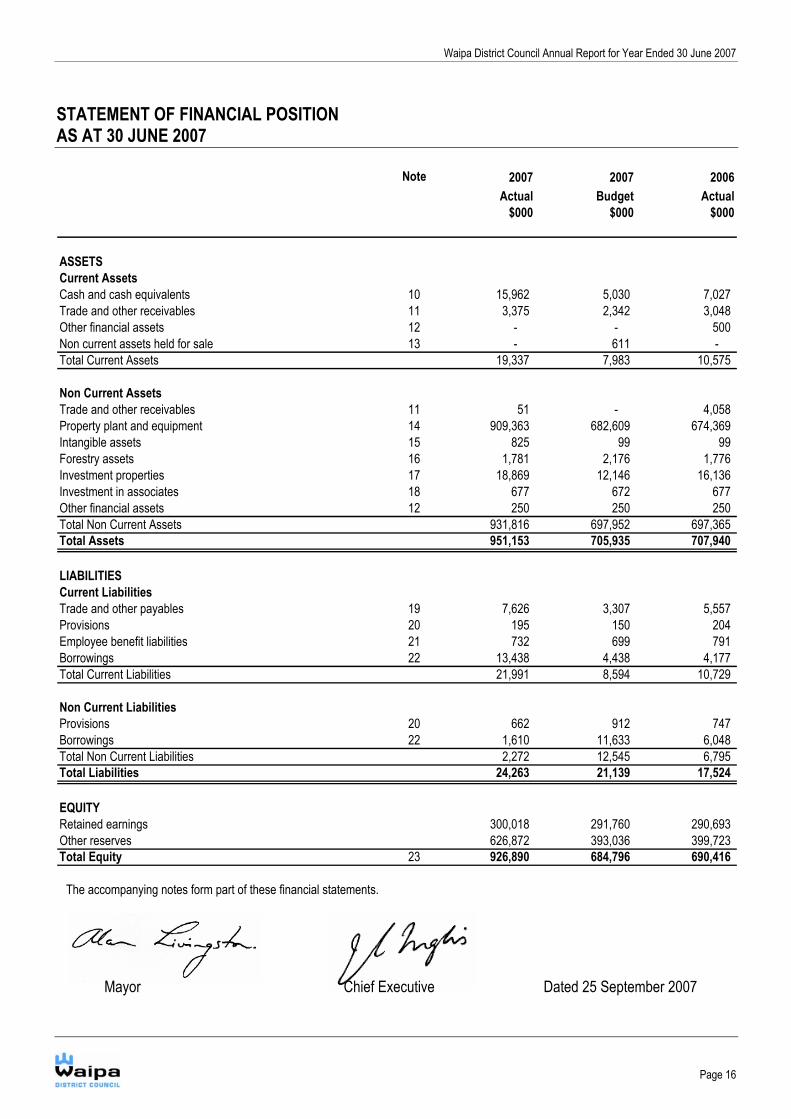
STATEMENT OF FINANCIAL POSITION AS AT 30 JUNE 2007
Note 2007 2007 2006Actual Budget Actual
$000 $000 $000
ASSETSCurrent AssetsCash and cash equivalents 10 15,962 5,030 7,027 Trade and other receivables 11 3,375 2,342 3,048 Other financial assets 12 - - 500 Non current assets held for sale 13 - 611 - Total Current Assets 19,337 7,983 10,575
Non Current AssetsTrade and other receivables 11 51 - 4,058 Property plant and equipment 14 909,363 682,609 674,369 Intangible assets 15 825 99 99 Forestry assets 16 1,781 2,176 1,776 Investment properties 17 18,869 12,146 16,136 Investment in associates 18 677 672 677 Other financial assets 12 250 250 250 Total Non Current Assets 931,816 697,952 697,365 Total Assets 951,153 705,935 707,940
LIABILITIESCurrent LiabilitiesTrade and other payables 19 7,626 3,307 5,557 Provisions 20 195 150 204 Employee benefit liabilities 21 732 699 791 Borrowings 22 13,438 4,438 4,177 Total Current Liabilities 21,991 8,594 10,729
Non Current LiabilitiesProvisions 20 662 912 747 Borrowings 22 1,610 11,633 6,048 Total Non Current Liabilities 2,272 12,545 6,795 Total Liabilities 24,263 21,139 17,524
EQUITYRetained earnings 300,018 291,760 290,693 Other reserves 626,872 393,036 399,723 Total Equity 23 926,890 684,796 690,416
The accompanying notes form part of these financial statements.
Mayor Chief Executive Dated 25 September 2007
Page 16
Waipa District Council Annual Report for Year Ended 30 June 2007
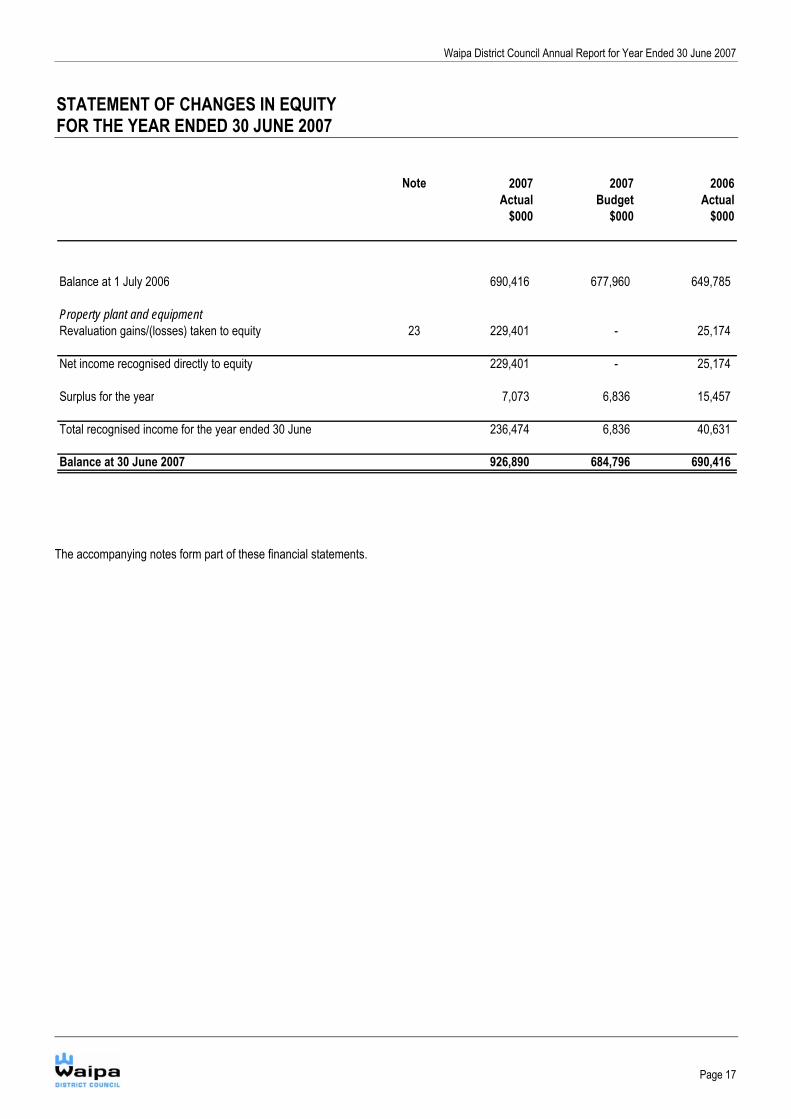
STATEMENT OF CHANGES IN EQUITY FOR THE YEAR ENDED 30 JUNE 2007
Note 2007 2007 2006Actual Budget Actual
$000 $000 $000
Balance at 1 July 2006 690,416 677,960 649,785
Property plant and equipmentRevaluation gains/(losses) taken to equity 23 229,401 - 25,174
Net income recognised directly to equity 229,401 - 25,174
Surplus for the year 7,073 6,836 15,457
Total recognised income for the year ended 30 June 236,474 6,836 40,631
Balance at 30 June 2007 926,890 684,796 690,416
The accompanying notes form part of these financial statements.
Page 17

Waipa District Council Annual Report for Year Ended 30 June 2007
STATEMENT OF CASH FLOWS FOR THE YEAR ENDED 30 JUNE 2007
Note 2007 2007 2006Actual Budget Actual
$000 $000 $000
Cash Flows from Operating ActivitiesReceipts from rates revenue 26,957 26,652 24,670 Interest received 677 533 1,875 Dividends received 9Receipts from other revenue 19,332 18,540 15,896 Payments to suppliers and employees (30,314) (28,803) (27,448) Interest paid (684) (802) (991) Goods and services tax (net) (108) (415) (399)
Net Cash Flow from Operating Activities 24 15,869 15,705 13,603
Cash Flows from Investing ActivitiesProceeds from sale of property, plant and equipment 364 226 Proceeds from sale of investments 500 10,418 Purchase of intangible assets (857) - Purchase of property, plant and equipment (11,764) (20,474) (24,119) Purchase of investment property -Acquisition of investments - (667)
Net Cash Flow from Investing Activities (11,757) (21,141) (13,475)
Cash Flows from Financing ActivitiesProceeds from borrowings 9,000 9,463 - Repayment of borrowings (4,177) (4,177) (7,687)
Net Cash Flow from Financing Activities 4,823 5,286 (7,687)
Net (decrease)/increase in cash, cash equivalents and bank overdafts 8,935 (150) (7,559) Cash, cash equivalents and bank overdrafts at the beginning of the year 7,027 5,180 14,586
Cash, cash equivalents at the end of the year 10 15,962 5,030 7,027
The accompanying notes form part of these financial statements.
Page 18
Waipa District Council Annual Report for Year Ended 30 June 2007
Page 19
NOTES TO THE FINANCIAL STATEMENTS 1 STATEMENT OF ACCOUNTING POLICIES FOR THE YEAR ENDED 30 JUNE 2007 Reporting Entity Waipa District Council is a territorial local authority governed by the Local Government Act 2002. Council has no subsidiaries and the financial statements are for the single entity of Waipa District Council. The primary objective of Council is to provide goods or services for the community or social benefit rather than making a financial return. Accordingly, Council has designated itself as a public benefit entity for the purposes of New Zealand equivalents to International Financial Reporting Standards (NZ IFRS). These Financial Statements are for the year ended 30 June 2007, and were authorised for issue by Council on 25 September 2007. Basis of Preparation The Financial Statements have been prepared in accordance with the requirements of the Local Government Act 2002: Part 6, Section 98 and Part 3 of Schedule 10, which includes the requirement to comply with New Zealand generally accepted accounting practice (NZ GAAP). The Financial Statements have been prepared in accordance with NZ GAAP. They comply with NZ IFRS, and other applicable Financial Reporting Standards, as appropriate for public benefit entities. This is the first set of financial statements prepared using NZ IFRS and comparatives for the year ended 30 June 2006 have been restated to NZ IFRS accordingly. Reconciliations of equity and net surplus/(deficit) for the year ended 30 June 2006 under NZ IFRS to the balances reported in the 30 June 2006 financial statements are detailed in note 2. The accounting policies set out below have been applied consistently to all periods presented in these financial statements and in preparing an opening NZ IFRS statement of financial position as at 1 July 2005 for the purposes of the transition to NZ IFRS. The financial statements have been prepared on a historical cost basis, modified by the revaluation of land and buildings, infrastructural assets, investment property and forestry. The financial statements are presented in New Zealand dollars and all values are rounded to the nearest thousand dollars ($’000). The functional currency of Council is New Zealand dollars. There are no standards, interpretations and amendments that have been issued, but are not yet effective, that Council has not yet applied. Revenue Revenue is measured at the fair value of consideration received. Rates Revenue Rates are set annually by a resolution from Council and relate to a financial year. All ratepayers are invoiced within the financial year to which the rates have been set. Rates revenue is recognised when payable.

Waipa District Council Annual Report for Year Ended 30 June 2007
Page 20
NOTES TO THE FINANCIAL STATEMENTS CONTINUED Other Revenue Water billing revenue is recognised on an actual basis. Unbilled usage, as a result of unread meters at year end, is accrued on an average usage basis. Council receives government grants from Land Transport New Zealand which subsidises part of Council’s costs in maintaining the local roading infrastructure. The subsidies are recognised as revenue upon entitlement as conditions pertaining to eligible expenditure have been fulfilled. Where a physical asset is acquired for nil or nominal consideration the fair value of the asset received is recognised as revenue. Assets vested in Council are recognised as revenue when control over the asset is obtained. Interest income is recognised using the effective interest method. Dividends are recognised when Council’s right to receive the payment is established. Development Contributions The revenue recognition point for development and financial contributions is at the point that settlement is received, either by payment or negotiated developer agreement. Borrowing Costs Borrowing costs are recognised as an expense in the period in which they are incurred. Grant Expenditure Non discretionary grants are those grants that are awarded if the grant application meets the specified criteria, and are recognised as expenditure when an application that meets the specified criteria for the grant has been received. Discretionary grants are those grants where Council has no obligation to award on receipt of the grant application and grants are recognised as expenditure on payment. Cash and Cash Equivalents Cash and cash equivalents includes cash in hand, deposits held at call with banks, other short term highly liquid investments with original maturities of three months or less, and bank overdrafts. Bank overdrafts are shown within borrowings in current liabilities in the Statement of Financial Position. Trade and other Receivables Trade and other receivables are initially measured at fair value and subsequently measured at amortised cost using the effective interest method, less any provision for impairment. Loans are initially recognised at the present value of their expected future cash flows, discounted at the current market rate of return of a similar asset/investment. They are subsequently measured at amortised cost using the effective interest method. The difference between the face value and present value of expected future cash flows of the loan is recognised in the statement of financial performance as a grant.

Waipa District Council Annual Report for Year Ended 30 June 2007
Page 21
NOTES TO THE FINANCIAL STATEMENTS CONTINUED A provision between the face value and present value of expected future cash flows of the loan is recognised in the Statement of Financial Performance as a grant. A provision for impairment of receivables is established when there is objective evidence that Council will not be able to collect all amounts due according to the original terms of receivables. The amount of the provision is the difference between the asset’s carrying amount and the present value of estimated future cash flows, discounted using the effective interest method. Financial Assets Council classifies its investments in the following categories:
• Financial assets at fair value
• Loans and receivables
• Held-to-maturity investments The classification depends on the reason behind acquiring the investment. Council decides how to classify its investments when they are acquired. Purchases and sales of investments are recorded on the value date. Financial assets are no longer recognised when the right to receive cash flows from the financial assets has expired or has been transferred. The fair values of quoted investments are based on current bid prices. If the market for a financial asset is not active, Council establishes fair value through valuation techniques. At each year end Council assesses whether there is evidence that a financial asset or group of financial assets is impaired. Any impairment loss is recognised in the statement of financial performance. Financial assets at fair value through profit or loss This category has two sub-categories: financial assets held for trading, and those designated at fair value through profit or loss. A financial asset falls in this category if acquired principally to sell in the short-term or if designated this way by Council. After initial recognition, they are measured at fair value. These financial assets are classified as current assets if they are held for trading or expected to be realised within twelve months of the year end date. Loans and receivables Loans and receivables are non-derivative financial assets with fixed or determinable payments not quoted in an active market. They arise when Council provides money, goods or services directly to a debtor with no intention of selling the receivable asset. After initial recognition, they are measured at amortised cost using the effective interest method. They are included in current assets, except for those with maturities greater than twelve months after the year end date, which are classified as non-current assets. Held-to-maturity investments Held-to-maturity investments are non-derivative financial assets with fixed or determinable payments and fixed maturities that Council has the intention and ability to hold to maturity. After initial recognition, they are measured at amortised cost using the effective interest method.

Waipa District Council Annual Report for Year Ended 30 June 2007
Page 22
NOTES TO THE FINANCIAL STATEMENTS CONTINUED Financial assets at fair value through equity Financial assets at fair value through equity are non-derivative assets designated in this category or not classified in the other categories. After initial recognition, they are measured at fair value. They are included in non-current assets unless Council intends to dispose of the asset within twelve months of year end. Non Current Assets Held for Sale Non current assets held for sale are classified as held for sale if their carrying amount will be recovered principally through a sale transaction, not through continuing use. Non current assets held for sale are measured at the lower of their carrying amount and fair value less costs to sell. These assets are not depreciated or amortised. Property, Plant and Equipment Property, plant and equipment consists of: Operational assets which include land, buildings, library books, plant and equipment, and motor vehicles. Infrastructural assets which are the fixed utility systems. Each asset class includes all items that are required for the network to function, for example sewer reticulation includes reticulation piping and sewer pump stations. Property, plant and equipment is shown at cost or valuation, less accumulated depreciation and impairment losses. Additions The cost of an item of property, plant and equipment is recognized as an asset if it is probable that future economic benefits or service potential associated with the item will flow to Council and the cost of the item can be measured reliably. Additions are generally recognised at cost. Where an asset is acquired at no cost, or for a nominal cost, it is recognised at fair value at the date of acquisition. Disposals Gains and losses on disposal are determined by comparing the proceeds with the carrying amount of the asset. Gains and losses on disposals are included in the statement of financial performance. When revalued assets are sold, the amounts included in asset revaluation reserves in respect of those assets are transferred to retained earnings. Subsequent costs Costs incurred subsequent to initial acquisition are capitalised only when it is probable that future economic benefits or service potential with the item will flow to Council and the cost of the item can be measured reliably. Depreciation Depreciation is provided on a straight-line basis on all property, plant and equipment other than land, at rates that will write off the cost (or valuation) of the assets to their estimated residual values over their useful lives. The useful lives and associated depreciation rates of major classes of assets have been estimated as follows:

Waipa District Council Annual Report for Year Ended 30 June 2007
Page 23
NOTES TO THE FINANCIAL STATEMENTS CONTINUED Components Years Water treatment – structures 50 – 100 – plant 10 – 25 – pipes 60 Water reticulation – pipes 30 – 80 – fittings 25 Sewage treatment – structures 50 – 100 – plant 10 – 25 – pipes 60 Sewerage reticulation – pipes 50 – 80 – manholes 50 Stormwater – structures 50 – pipes 50 – 100 – manholes 50 Years Formation/carriageway and shoulder Infinite Pavement structure 30 – 50 Pavement surface (seal) 10 – 15 Catchpits and culverts 30 – 70 Bridges 20 – 80 Kerb and channel 50 Lighting 10 Footpaths 20 – 50 Years Buildings – not componentised 40 Building – structure 50 - 80 Building – fit-out 25 - 80 Building – services 40 - 80 Plant/motor vehicles 3 - 10 Furniture, fittings and equipment 3 - 10 Computer equipment 3 - 10 Intangibles 3 - 10 The residual value and useful life of an asset is reviewed, and adjusted if applicable, at each financial year end.

Waipa District Council Annual Report for Year Ended 30 June 2007
Page 24
NOTES TO THE FINANCIAL STATEMENTS CONTINUED Revaluation Those asset classes that are revalued are valued on a three yearly cycle on the basis described below, with the exception of forestry assets and investment properties, which are valued annually. All other asset classes are carried at depreciated historical cost. The carrying values of revalued items are reviewed at each balance date to ensure that those values are not materially different to fair value. Operational land and buildings At fair value as determined from market-based evidence by an independent valuer. The most recent valuation was performed by Quotable Value New Zealand (registered valuers) and the valuation is effective as at 1 July 2005. Infrastructural assets At fair value determined on a depreciated replacement cost basis by an independent valuer. At balance date the carrying values of infrastructural assets are assessed to ensure that they do not differ materially from the assets’ fair values. If there is a material difference, then a revaluation is undertaken. The most recent valuation was performed by Opus International Consultants Limited (registered valuers) and the valuation is effective as at 1 July 2006. All infrastructural asset classes carried at valuation were valued. Land under roads and road reserves Valued by Opus International Consultants Limited (registered valuers) using estimates provided by Quotable Value at current market prices ($/ha) for land use categories through which the roads pass. Other roading assets are valued at optimised depreciated replacement cost by Opus International Consultants Limited. The valuation is effective at 1 July 2006. Accounting for revaluations Revaluations of property, plant and equipment are on a class of asset basis. The results of revaluing are credited or debited to an asset revaluation reserve for that class of asset. Where this results in a debit balance in the asset revaluation reserve, this balance is expensed in the statement of financial performance. Any subsequent increase in revaluation that off-sets a previous decrease in value recognised in the statement of financial performance will be recognised first in the statement of financial performance up to the amount previously expensed, and then credited to the revaluation reserve for that class of asset. Intangible Assets Acquired computer software licences are capitalised on the basis of the costs incurred to acquire and bring to use the specific software. Costs associated with maintaining computer software are recognised as an expense when incurred. Amortisation The carrying value of an intangible asset with a finite life is amortised on a straight line basis over its useful life. Amortisation begins when the asset is available for use and ceases at the date that the asset is derecognised. The amortisation charge for each period is recognised in the statement of financial performance. The useful lives and associated amortisation rates of computer software have been estimated at 3-10 years (33% - 10%).

Waipa District Council Annual Report for Year Ended 30 June 2007
Page 25
NOTES TO THE FINANCIAL STATEMENTS CONTINUED Forestry Forestry assets are independently revalued annually at fair value less estimated point of sale costs. Fair value is determined based on the present value of expected net cash flows discounted at a current market determined pre-tax rate. Gains or losses arising on initial recognition of forestry assets at fair value less estimated point of sale costs and from a change in fair value less estimated point of sale costs are recognised in the statement of financial performance. The costs to maintain the forestry assets are included in the statement of financial performance. Investment Properties Initially, investment properties are measured at cost including transaction costs. Subsequent to initial recognition investment properties are measured at fair value as determined annually by an independent valuer. Gains and losses on revaluation, acquisition and disposal are recognised in the statement of financial performance. Employee Benefits Employee benefits expected to be settled within twelve months of balance date are measured at nominal values based on accrued entitlements at current rates of pay. These include salaries and wages accrued up to balance date, annual leave earned to, but not yet taken at balance date, and sick leave. A liability for sick leave is recognised to the extent that absences in the coming year are expected to be greater than the sick leave entitlements earned in the coming year. The amount is calculated based on the unused sick leave entitlement that can be carried forward at balance date, to the extent that it is anticipated it will be used by staff to cover those future absences. Provisions Council recognises a provision for future expenditure of uncertain amount or timing when there is a present obligation (either legal or constructive) as a result of a past event, if it is probable that expenditures will be required to settle the obligation and a reliable estimate can be made of the amount of the obligation. Provisions are not recognised for future operating losses. Provisions are measured at the present value of the expenditures expected to be required to settle the obligation using a pre-tax discount rate that reflects current market assessments of the time value of money and the risks specific to the obligation. The increase in the provision due to the passage of time is recognised as an interest expense. Borrowings Borrowings are initially recognised at their fair value. After initial recognition, all borrowings are measured at amortised cost using the effective interest method. Equity Equity is the community’s interest in Council and is measured as the difference between total assets and total liabilities. Equity is disaggregated and classified into a number of reserves, the components of which are retained earnings, reserves and special funds, and asset revaluation reserves.

Waipa District Council Annual Report for Year Ended 30 June 2007
Page 26
NOTES TO THE FINANCIAL STATEMENTS CONTINUED Reserves and Special Funds Reserves and special funds are a component of equity representing a particular use to which various parts of equity have been assigned. Transfers from these reserves may be made only for certain specified purposes or when certain specified conditions are met. Goods and Services Taxation (GST) All items in the financial statements are stated exclusive of GST, except for receivables and payables which are stated on a GST inclusive basis. The net amount of GST recoverable from, or payable to, the Inland Revenue Department (IRD) is included as part of receivables or payables in the statement of financial position. The net GST paid to, or received from the IRD is classified as an operating cash flow in the statement of cash flows. Commitments and contingencies are disclosed exclusive of GST. Budget Figures The budget figures are those approved by Council at the beginning of the year in the Annual Plan. The budget figures have been prepared in accordance with NZ GAAP, using accounting policies that are consistent with those adopted by Council for the preparation of these financial statements. Cost Allocation Council has derived the cost of service for each significant activity using the cost allocation system outlined below. Direct costs are those costs directly attributable and charged to a significant activity. Indirect costs are those costs which cannot be identified in an economically feasible manner with a specific significant activity. Indirect costs are charged to significant activities using appropriate cost drivers such as computer equipment used, staff numbers and floor area. IMPACT OF ADOPTION OF NZ IFRS The impacts of adopting NZ IFRS on the total equity and surplus as reported under previous New Zealand generally accepted accounting practice (NZ GAAP) are illustrated below.

Waipa District Council Annual Report for Year Ended 30 June 2007
Page 27
NOTES TO THE FINANCIAL STATEMENTS CONTINUED Reconciliation of total equity as presented under previous NZ GAAP to that under NZ IFRS 30 June 2005
$000 30 June 2005
$000 Total equity under previous NZ GAAP 649,599 649,599 Adjustments to accumulated funds Investment property revaluation reserve 1,874 – Forestry revaluation reserve 484 – Employee benefits (12)
Adjustment to other reserves Investment property revaluation reserve (1,874) – Forestry revaluation reserve (484) –
Total equity under NZ IFRS 649,587 649,599 Previously under NZ GAAP changes in fair value of investment property and Forestry assets were reflected in the asset revaluation reserve. Under NZ IAS 17 and NZ IAS 41 these changes in value are to be charged to the Income Statement. 2 EXPLANATION OF TRANSITION TO NZ IFRS The financial statements for the year ended 30 June 2007 are the first financial statements that comply with NZ IFRS. Council has applied NZIFRS in preparing these financial statements. The transition date is 1 July 2005. Council prepared its opening NZ IFRS balance sheet at that date. The reporting date of these financial statements is 30 June 2007. The NZIFRS adoption date is 1 July 2006. Reconciliation of Equity The following table shows the changes in equity, resulting from the transition from previous NZ GAAP to NZ IFRS as at 1 July 2005 and 30 June 2006.

Waipa District Council Annual Report for Year Ended 30 June 2007
NOTES TO THE FINANCIAL STATEMENTS CONTINUED
Effect on Effect on Previous Transition to Previous Transition to
Notes NZ GAAP NZ IFRS NZ IFRS NZ GAAP NZ IFRS NZ IFRS1 July 2005 1 July 2005 1 July 2005 30 June 2006 30 June 2006 30 June 2006
$000 $000 $000 $000 $000 $000ASSETSCurrent AssetsCash and cash equivalents a 186 14,400 14,586 327 6,700 7,027 Trade and other receivables 2,457 - 2,457 3,048 - 3,048 Other financial assets a 23,425 (14,400) 9,025 7,200 (6,700) 500 Non current assets held for sale 611 - 611 465 (465) - Total Current Assets 26,679 - 26,679 11,040 (465) 10,575
Non Current AssetsTrade and other receivables - - - 4,058 - 4,058 Property plant and equipment 631,733 - 631,733 674,611 (242) 674,369 Intangible assets 154 - 154 99 - 99 Forestry assets 1,629 - 1,629 1,776 - 1,776 Investment properties 11,367 - 11,367 15,671 465 16,136 Investment in associates 677 677 Other financial assets 2,881 - 2,881 250 - 250 Total Non Current Assets 647,764 - 647,764 697,142 223 697,365 Total Assets 674,443 - 674,443 708,182 (242) 707,940
LIABILITIESCurrent LiabilitiesTrade and other payables 4,621 - 4,621 5,557 - 5,557 Provisions 151 - 151 204 - 204 Employee benefit liabilities b 688 12 700 775 17 791 Borrowings 7,687 - 7,687 4,177 - 4,177 Total Current Liabilities 13,147 12 13,159 10,713 17 10,729
Non Current LiabilitiesProvisions 1,472 - 1,472 747 - 747 Borrowings 10,225 - 10,225 6,048 - 6,048 Total Non Current Liabilities 11,697 - 11,697 6,795 - 6,795 Total Liabilities 24,844 12 24,856 17,508 17 17,524
EQUITYRetained earnings 272,861 7,246 280,107 279,658 11,035 290,693 Other reserves c 376,738 (7,258) 369,480 411,016 (11,294) 399,723 Total Equity 649,599 (12) 649,587 690,674 (259) 690,416
Explanatory notes - Reconciliation of equity
a Cash and cash equivalentsThose term deposits with maturities less than three months have been reclassified as cash and cash equivalents
b Sick leave liabilityThis represents the increase of sick leave provision, which was not recognised under previous NZ GAAP
c Investment Property and Forestry revaluation
Investment property and Forestry revaluation movements under New Zealand GAAP were debited or credited to the revaluation reserve where there was a credit balance. NZ IFRS requires revaluation movements to be recognised in the statement of financial performance.
Page 28

Waipa District Council Annual Report for Year Ended 30 June 2007
NOTES TO THE FINANCIAL STATEMENTS CONTINUED Reconciliation of surplus for the year ended 30 June 2006
Effect on Previous Transition to
Note NZ GAAP NZ IFRS NZ IFRS1 July 2006 1 July 2006 1 July 2006
OPERATING INCOME
Rates 24,604,278 24,604,278Other revenue 27,211,287 27,211,287Other gains/(losses) a 0 4,035,817 4,035,817
Total Operating Income 51,815,565 4,035,817 55,851,382
OPERATING EXPENDITURE
Employee benefit expenses b 8,629,105 4,539 8,633,644Depreciation and amortisation 11,347,673 11,347,673Other expenses 19,508,133 19,508,133Finance costs 904,914 904,914
Total Operating Expenditure 40,389,825 4,539 40,394,364
11,425,740 4,031,278 15,457,018
Explanatory notes - Reconciliation of surplus
a Investment Property and Forestry revaluation
b Sick leave liability
Operating Surplus
Investment property and Forestry revaluation movements were debited or credited to the revaluation reserve where there was a credit balance. NZ IFRS requires revalution movements to be recognised in the statement of financial performance.
This represents the increase of sick leave provision, which was not recognised under previous NZ GAAP
Page 29

Waipa District Council Annual Report for Year Ended 30 June 2007
NOTES TO THE FINANCIAL STATEMENTS CONTINUED 3 SUMMARY COST OF SERVICE
2007 2007 2006Actual Budget Actual
$000 $000 $000SIGNIFICANT ACTIVITIESIncomeGovernance - - 2Environmental Services 2,625 2,055 2,101Amenities 2,048 2,413 2,457Transport Management 5,341 4,951 4,538Stormwater 2 - 1Water 2,368 2,269 2,465Waste Water 301 200 118Support Services 10,902 9,999 8,602Gross Revenue 23,587 21,887 20,284Less Internal Charges (10,882) (9,867) (8,511)Total Income 12,705 12,020 11,773
ExpenditureGovernance 4,500 4,071 4,124Environmental Services 4,323 3,818 3,871Amenities 11,906 11,166 9,607Transport Management 13,198 10,891 10,104Stormwater 1,135 1,213 1,053Water 6,327 5,528 5,781Waste Water 6,226 5,325 5,754Support Services 9,637 8,744 9,228Gross Expenditure 57,252 50,756 49,522Less Internal Charges (10,882) (9,867) (8,511)Less Rates charged to Council Properties (589) (577) (617)Total Expenditure 45,781 40,312 40,394
Each significant activity is stated gross of internal costs and revenues, and includes targeted rates attributable to activities (refer Note 4). Inorder to fairly reflect the total external operations for the Council in the Statement of Financial Performance, these transactions are eliminatedas shown above.
Page 30

Waipa District Council Annual Report for Year Ended 30 June 2007
NOTES TO THE FINANCIAL STATEMENTS CONTINUED 4 RATES REVENUE
Actual Actual2007 2006$000 $000
Rates consist of:
General rates 11,230 12,201 Targeted ward rates 6,768 5,415 Separate rates:Water 2,872 2,542 Sewerage 4,727 3,591 Stormwater 1,167 1,120 Recycling 417 - Other 326 380 Add Penalties 109 89 Less Remissions (124) (117)
27,493 25,221 Less rates charged to Council properties (589) (617)
Total Rates Revenue 26,904 24,604 5 OTHER REVENUE User Charges 3,156 2,760 Land Transport NZ Government Grants 5,255 4,485 Regulatory Revenue 2,614 2,914 Rental Income From Investment Properties 865 837 Infringements and Fines 11 2 Other Significant Activity Revenue 804 775 Total Significant Activity Revenue 12,705 11,773
Petrol Tax 329 319 Dividend Income 9 - Investment Revenue 710 1,652 Other 56 7,000 Total Other Revenue 13,809 20,744 6 OTHER GAINS/(LOSSES) Gain on changes in fair value of forestry assets 5 137 Gain on changes in fair value of investment property 2,770 3,899
2,775 4,036 7 EMPLOYEE BENEFIT EXPENSES Salaries and Wages 9,980 8,650 Increase/(decrease) in employee benefit liabilities (59) (16) Total employee benefit expenses 9,921 8,634
Page 31

Waipa District Council Annual Report for Year Ended 30 June 2007
NOTES TO THE FINANCIAL STATEMENTS CONTINUED 8 OTHER EXPENSES
Actual Actual2007 2006$000 $000
Audit Fees:Fees paid to Principal Auditor 85 77 Other services provided by the Principal Auditor - LTCCP audit - 42 Audit related fees for assurance and related services 4 - Total Audit Fees 89 119
Donations 657 712 Impairment of Receivables 11 - Direct Expenses from investment property generating income 510 485 Direct Expenses from investment property not generating income 1,066 571 Other Operating Expenses 19,911 15,829
22,244 17,716
Audit fees for assurance and related services relate to a review of the newly developed procurement and contract management manual. 9 FINANCE COSTS Interest on Bank Borrowings and Stock 681 904 10 CASH AND CASH EQUIVALENTS Cash at bank and in hand 258 327 Short term bank deposits maturing within three months 15,704 6,700
15,962 7,027 The carrying value of short-term deposits with maturity dates of three months or less approximates their fair value. Refer to note 12 for weighted average effective interest rate for cash and cash equivalents 11 TRADE AND OTHER RECEIVABLES Rates Receivables 195 157 Community Loans 54 66 Sundry Debtors 3,210 6,916
3,459 7,139 Less provision for impairment of receivables (33) (33)
3,426 7,106 Less non current portionSubsidy for Kihikihi due 2008 - 4,000 Community loans 51 58 Total non-current portion 51 4,058 Current portion 3,375 3,048 The carrying value of trade and other receivables approximates their fair value. Council does not provide impairment on rates receivable as it has various powers under the Local Government (Rating) Act 2002 to recover any outstanding debts.
Page 32

Waipa District Council Annual Report for Year Ended 30 June 2007
Page 33
NOTES TO THE FINANCIAL STATEMENTS CONTINUED As of 30 June 2007 and 2006, all overdue receivables, except for rates receivable, have been assessed for impairment and appropriate provisions applied. Waipa District Council holds no collateral as security of other credit enhancements over receivables that are either past due or impaired. The impairment provision has been calculated based on expected losses for Council’s pool of debtors. Expected losses have been determined based on an analysis of Council’s losses in previous periods, and review of specific debtors. Movements in the provision for impairment of receivables and community loans are as follows:
Actual Actual2007 2006$000 $000
At 1 July 33 73 Additional provision made during the year (11) (40) Receivables written off during the period 11 - At 30 June 33 33 12 OTHER FINANCIAL ASSETS Local Authority stock - 500 Total current portion - 500
Non current PortionLocal Authority Stock 250 250 Total non-current portion 250 250 Maturity Analysis and Effective Interest Rates The maturity dates for all other financial assets with the exception of equity investments, and advances to subsidiaries and associates are as follows:
Short Term Depo
itysits
Local Author Stock
Short Term Deposits
Local Authority Stock
$000 $000Short Term deposits (with 15,704
$000 $000 maturities of 3 months or less) - 5,700 1,000
Average maturity - days 4 - 24 45 Weighted average effective interest rate 7.99% 0.00% 7.41% 7.75%Other Investments maturing within 1 year - - 500 Weighted average effective interest rate - - - 7.99%Investments maturing afte -r 1 year but less than 5 years 250 - 250 Weighted average effective interest rate - 8.16% - 8.16%
15,704 250 5,700 1,750
2007 2006
13 NON CURRENT ASSETS HELD FOR SALE
Actual ActualThere were no assets held for sale at 30 June 2007 (2006 - no assets held for sale) 2007 2006

Waipa District Council Annual Report for Year Ended 30 June 2007 NOTES TO THE FINANCIAL STATEMENTS CONTINUED 14 PROPERTY, PLANT AND EQUIPMENT
2007Cost/revaluation
1/7/06
Accumlated Depreciationand
impairment charges 1/7/06
Carrying amount 1/7/06
Current year Addtions
Current year disposals
Current year impairment
chargesCurrent year depreciation
Revaluation surplus
Cost/revaluation 30/6/07
Accumulated depreciation
and impairment charges 30/6/07
Carrying amount 30/6/07
Council operational assetsLand 92,510 0 92,510 41 (137) 0 0 0 92,415 0 92,415Buildings 29,740 (1,692) 28,048 1,311 0 0 (1,123) 0 31,051 (2,815) 28,236Landfills post closure 418 (418) 0 0 0 0 0 0 418 (418) 0Library books 1,714 (971) 743 170 0 0 (152) 0 1,885 (1,124) 761Plant 3,530 (1,842) 1,688 318 (20) 0 (496) 0 3,829 (2,338) 1,491Furniture and Equipment 4,997 (3,007) 1,990 261 (3) 0 (700) 0 5,255 (3,707) 1,548Work in progess 1,721 0 1,721 (1,402) 0 0 0 0 319 0 319Total operational assets 134,631 (7,930) 126,701 699 (159) 0 (2,472) 0 135,172 (10,402) 124,770
Council infrastructural assetsLand 0 0 0 0Sewerage System 32,076 (2,815) 29,261 12,887 (27) 0 (2,017) 6,077 51,013 (4,832) 46,181Water System 47,752 (4,078) 43,674 2,096 (78) 0 (2,456) 15,609 65,379 (6,534) 58,844Drainage network 27,579 (888) 26,691 1,402 (18) 0 (544) 2,334 31,297 (1,432) 29,865Roading network 337,475 (8,403) 329,072 8,519 (869) 0 (5,302) 80,752 425,877 (13,705) 412,172Land under roads 104,728 104,728 1,938 0 0 0 124,629 231,295 0 231,295Work in progress 14,240 14,240 (8,004) 0 0 0 0 6,236 0 6,236Total infrastructural assets 563,850 (16,184) 547,666 18,837 (992) 0 (10,320) 229,401 811,097 (26,504) 784,594
Total property plant and equipment 698,481 (24,114) 674,368 19,537 (1,150) 0 (12,792) 229,401 946,269 (36,906) 909,363
Page 34

2006Cost/revaluation
1/7/05
Accumlated Depreciationand
impairment charges 1/7/05
Carrying amount 1/7/06
Current year Addtions
Current year disposals
Current year impairment
chargesCurrent year depreciation
Revaluation surplus
Cost/revaluation 30/6/06
Accumulated depreciation
and impairment charges 30/6/06
Carryiamount 30/6/06
Council operational assetsLand 69,990 0 69,990 149 (177) 0 0 22,547 92,510 0 92,510Buildings 28,759 (2,610) 26,150 1,056 (6) 0 (1,692) 2,540 32,350 (4,302) 28,048Landfills post closure 228 (228) 0 0 0 (190) 190 418 (418)Library books 924 924 181 0 0 (362) 0 1,106 (362)Plant 3,251 (1,645) 1,606 488 (237) 0 (169) 0 3,502 (1,814) 1Furniture and Equipment 5,542 (3,759) 1,783 944 (459) 0 (278) 0 6,027 (4,037) 1Work in progess 121 121 1,721 (121) 0 0 0 1,721 0 1Total operational assets 108,816 (8,241) 100,575 4,540 (1,000) 0 (2,691) 25,277 137,634 (10,933) 126,702
Council infrastructural assetsLand 0 0 0 0Sewerage System 30,675 (1,392) 29,283 1,469 (64) (1,428) 32,081 (2,820) 29,261Water System 45,828 (2,015) 43,812 2,050 (115) (2,074) 47,763 (4,089) 43,674Drainage network 26,776 (443) 26,333 927 (120) (448) 27,583 (891) 26,692Roading network 329,378 (4,259) 325,119 8,891 (611) (4,325) 337,657 (8,584) 329,073Land under roads 104,081 0 104,081 647 104,728 0 104,728Work in progress 2,783 2,783 14,240 (2,783) 14,240 0 14,240Total infrastructural assets 539,521 (8,109) 531,412 28,224 (3,694) 0 (8,275) 0 564,051 (16,384) 547,667
Total property plant and equipment 648,337 (16,350) 631,986 32,765 (4,693) 0 (10,966) 25,277 701,685 (27,317) 674,369
Page 35
Waipa District Council Annual Report for Year Ended 30 June 2007
NOTES TO THE FINANCIAL STATEMENTS CONTINUED
ng
0744,688,990,721

Waipa District Council Annual Report for Year Ended 30 June 2007
NOTES TO THE FINANCIAL STATEMENTS CONTINUED 15 INTANGIBLE ASSETS
Actual Actual2007 2006$000 $000
Balance at 1 July 2006Cost 311 518 Accumulated amortisation and Impairment (212) (364) Opening carrying amount 99 154
Year Ended 30 June 2007Addtions 909 - Amortisation Change (183) (55) Closing carrying amount 825 99
Balance at 30 June 2007Cost 1,205 311 Accumulated amortisation and Impairment (380) (212) Closing carrying amount 825 99 16 FORESTRY ASSETS Balance at 1 July 1,776 1,629 Increases due to purchases - 11 Gains/(losses) arising from changes in fair value less estimated point of sale costs attributable to physical changes 5 144 Decreases due to sales - (7) Decrease due to harvest - (1) Balance at 30 June 1,781 1,776 Council owns 284 hectares of mainly pinus radiata. Included is 5 hectares of mixed species. The pinus radiate are at varying stages of maturity ranging from 1 year, planted in 2006 to 26 years. No compartments of the forest have been harvested during the period (2006 compartment 19, $62k). Independent registered valuers Tempest & Associates Forestry Ltd have valued forestry assets as at 30 June 2007. A pre tax discount rate of 9% has been used in discounting the present value of expected cash flows. Financial risk management strategies Council is exposed to financial risks arising from changes in timber prices. Council is a long-term forestry investor and does not expect timber prices to decline significantly in the foreseeable future, therefore, has not taken any measures to manage the risks of a decline in timber prices. Council reviews its outlook for timber prices regularly in considering the need for active financial risk management. 17 INVESTMENT PROPERTY Balance at 1 July 16,136 11,978 Disposals (37) (174) Fair Value gains/(losses) on valuation 2,770 4,332 Balance at 30 June 18,869 16,136
Page 36

Waipa District Council Annual Report for Year Ended 30 June 2007
NOTES TO THE FINANCIAL STATEMENTS CONTINUED
Investment properties are valued annually at fair value effective 30 June. All investment properties were valued on open market evidence. The valuation was performed by S J Taylor AREINZ, MNZPI, an independent valuer from Opus International Consultants Limited. Opus International Consultants Limited are an experienced valuer with extensive market knowledge in the types of investment properties owned by Council.
18 INVESTMENT IN ASSOCIATES Shares in Other Organisations Number of % Balance 2007 2006Shares in other organisations are as follows: Shares Holding Date Actual Actual
$000 $000
Waikato Regional Airport Limited 777,125 15.63 30 Jun 529 529 NZ Local Government Insurance Company Limited 68,541 1.1 31 Dec 68 68 Waikato SVDS Limited 78,748 4.9 30 Jun 79 79 Local Authority Shared Services Limited 1 7.69 30 Jun 1 1 Total Shares and Investments in Other Organisations 677 677 19 TRADE AND OTHER PAYABLES
Actual Actual2007 2006$000 $000
Trade payables 5,976 4,574 Deposits and bonds 270 269 Accrued expenses 767 191 Amounts due to related parties - 1 Rates in advance 613 522 Total trade and other payables 7,626 5,557 Trade and other payables are non-interest bearing and are normally settled on 30-day terms, therefore the carrying value of trade and other payables approximates their fair value. 20 PROVISIONS (INCL LANDFILLS) Current provisions are represented by:Landfill aftercare provision 195 204 Total current provisions 195 204
Non current provisions are represented by:Landfill aftercare provision 662 747 Total current provisions 662 747 Provision for Landfill Aftercare Costs Council gained resource consents to operate its Cambridge, Te Awamutu, Kihikihi and Pirongia landfills. Council has responsibility under the resource consents to provide ongoing maintenance and monitoring of the landfill after the site is closed. Capacity of the Site The Cambridge and Te Awamutu landfills have been capped. Final capping of Kihikihi landfill is expected by 2008, and the Pirongia Landfill is programmed to be capped by 2007. The cash outflows for landfill post-closure are expected to occur between 2006 and 2039.
Page 37

Waipa District Council Annual Report for Year Ended 30 June 2007
NOTES TO THE FINANCIAL STATEMENTS CONTINUED The long term nature of the liability means that there are inherent uncertainties in estimating costs that will be incurred. The provision has been estimated taking into account existing technology and is discounted using a discount rate of 7.57% (2006 6.69%).
2007
Actu
al $000’
s
2006 Actual $000’s
Opening Balance 951 1,062 Amounts Used (243) (99) Additional Provision 78 256 Discounting Changes 71 (77) Impairment of Land Value - (190) Closing Balance 857 952 Represented by: Current Portion 195 204 Term Portion 662 747 857 951
21 EMPLOYEE BENEFIT LIABILITIES Accrued pay 62 168 Annual leave 633 599 Long service leave 8 8 Sick leave 29 16 Total employee benefit liabilities 732 791 Comprising:Current 732 791 Non-current - - Total employee benefit liabilities 732 791 22 BORROWINGS CurrentSecured loans 13,438 4,177 Total current borrowings 13,438 4,177
Non currentSecured loans 1,610 6,048 Total Non current borrowings 1,610 6,048 Fixed Rate Debt Secured debt of $15,048 (2006 - $10,225k) is issued at fixed rates of interest. Security Council has an overdraft facility with its Bankers to a maximum limit of $5m although there has been no drawdown to date. Council has a further overdraft facility with its Bankers to a maximum limit of $3.5m for disaster recovery purposes. There has been no drawdown against this facility. Council’s loans are secured over either separate or general rates of the district.
Page 38

Waipa District Council Annual Report for Year Ended 30 June 2007
NOTES TO THE FINANCIAL STATEMENTS CONTINUED
Maturity Analysis and Effective Interest Rates The following is a maturity analysis of Council’s borrowings There are no finance leases.
Actual Actual2007 2006$000 $000
Less than one year 13,438 4,177weighted average effective interest rate 7.58% 6.86%Later than one year but not more that five years 1,610 6,048weighted average effective interest rate 7.47% 6.57%
15,048 10,225 23 EQUITY Retained EarningsAs at 1 July 290,693 278,000 Transfer to:Reserves and special funds (3,957) (3,019) Transfers from:Asset Revaluation reserve on disposal of property, plant and equipment 782 (2,475) Reserves and special funds 5,427 2,730 Surplus/(deficit) for the year 7,073 15,457 As as 30 June 300,018 290,693 Reserves and special fundsAs at 1 July 8,467 8,179 Transfers to:Retained earnings (5,427) (2,730) Transfers from:Retained earnings 3,957 3,019 As at 30 June 6,997 8,468 Asset Revaluation ReservesAs at 1 July 391,255 361,301 Revaluation gain/(losses) 229,401 25,173 Transfer of revaluation reserve to retained earnings on disposal of property plant and equipment (782) 4,781 As as 30 June 619,874 391,255 Asset revaluation reserves consist of:Operational assetsLand 76,973 77,063 Buildings 8,652 8,652 Infrustructural AssetsSewerage System 14,871 9,047 Water System 20,747 18,297 Drainage network 38,963 24,037 Roading network 459,669 254,159 Total 619,875 391,255 Total other reserves 626,872 399,723
Page 39

Waipa District Council Annual Report for Year Ended 30 June 2007
NOTES TO THE FINANCIAL STATEMENTS CONTINUED 24 RECONCILIATIONS OF NET SURPLUS/(DEFICIT) TO NET CASH FLOW FROM OPERATING ACTIVITIES
Actual Actual2007 2006$000 $000
Surplus /(deficit) after tax 7,073 15,457
Add (less) non cash itemsDepreciation and amortisation 12,923 10,437 Asset Write-downs 31 Vested/Discovered/DC Assets (7,327) (5,225) (Gains)/losses in fair value of investment property and forestry (2,775) (4,036)
Add/(less items classified as investing or financing activitesLoss on Disposal of Assets 975 1,242 Profit on Disposal of Assets (150) (18) Asset Write-downs
Add/(less) movements in working capital itemsAccounts receivable 3,621 (4,590) Accounts payable 1,587 3 Provisions 1 138 Employee Benefits (59) 164
Net cash inflow/(outflow) from opertaing activies 15,869 13,603 25 CAPITAL COMMITMENTS AND OPERATING LEASES Capital Commitments 5,271 7,880 Capital expenditure contracted for at balance date but not yet incurred
Operating Commitments 4,955 1,993 Operating expenditure contracted for at balance date but not yet incurred
Council does not enter into Operating Leases
Page 40

Waipa District Council Annual Report for Year Ended 30 June 2007
NOTES TO THE FINANCIAL STATEMENTS CONTINUED 26 CONTINGENCIES Contingent Liabilities
Actual Actual2007 2006$000 $000
a) Guarantees 109 114 b) Professional Indemnity Claims 39 195 c) Waikato Regional Airport 3,375 3,675 d) Site Licence Agreement 100 100
3,623 4,084 a) Loans guaranteed by Council of $108,542 (2006 $113,542). b) There is currently one professional indemnity claim lodged against Council via Weathertight Homes Resolution Services (2006 3
claims). The total of the claim is $39,400 and this is covered by Council’s insurance policy with a maximum liability to Council of the excess of $10,000 per claim.
c) During May 2004, the shareholders of Waikato Regional Airport (WRAL) of which Waipa District Council has a 15.625% shareholding, authorised the company to issue further shares totalling $21.6m to shareholders. This capital restructure is part of the WRAL Airport Development and allows WRAL to borrow commercially at favourable interest rates. While there are no plans to call up the capital, Council has a contingent liability for $3.375m for uncalled capital.
d) Council owns one pensioner housing unit where there is a Site Licence Agreement with a provision that if the owner is unable to sell the property within one year of termination of the Site Licence, Council will lend the owner the value of the property, which would then be reimbursed on the future sale. Council has a contingent liability for $.1m.
Contingent Assets Council is a 2% capital beneficiary of the WEL Energy Trust. The life of the Trust ends in 2073 unless terminated earlier if its purpose is completed. Given the uncertainties surrounding the life of the Trust, Council is unable to accurately establish the appropriate value of the 2% shareholding. 27 RELATED PARTY TRANSACTIONS The following transactions were carried out with related parties: Local Authority Shared Services (LASS) During the year Council purchased technical valuation services from LASS at a cost of $65,049 (2006 $29,100). At balance date there was an amount outstanding in relation to these services of $5,700 (2006 $14,391). Senior Management and Members of Council During the year, Councillors and senior management, as part of a normal customer relationship, were involved in minor transactions with the Council (such as payment of rates). In addition, during the year. Council purchased electrical goods at a cost of $3,720 (2006 $1,051) from Selectrix Appliances, a company of which Councillor Scaramuzza is a director; and Council paid lease costs of $48,426 (2006 $44,762) to the Scaramuzza Trust. At balance date there was no amount outstanding in relation to these contracts (2006 $720). Council also purchased dangerous goods services at a cost of $8,905 (2006 $0) from Inferno Consultants, a company of which Councillor Lee is a director. At balance date there was an amount outstanding in relation to this contract of $450 (2006 $0). Except for these transactions and items of a trivial nature, no Councillors or senior management have entered into related party transactions with Council. Senior Management and Councillors’ Compensation Salaries and other short-term employee benefits of $1,325,683 (2006 $1,113,175) were paid to the Mayor, Councillors, Chief Executive and other senior management personnel.
Page 41
Waipa District Council Annual Report for Year Ended 30 June 2007
NOTES TO THE FINANCIAL STATEMENTS CONTINUED 28 REMUNERATION Chief Executive The Chief Executive of the Waipa District Council, appointed under s42 of the Local Government Act 2002 received a salary of $200,994 (2006 $198,240). He also received a vehicle allowance (including fringe benefit tax) of $15,350 (2006 $14,138). The total cost of the remuneration package received by the Chief Executive was $216,344 (2006 $212,378). Councillors 2007 2006Alan Livingston, Mayor 74,786 73,033 Peter Lee, Deputy Mayor 23,778 23,270 Hazel Barnes 22,953 22,087 Ron Cooper 22,986 22,119 Alan Empson 24,503 23,597 Gaidyn Flay 30,523 23,034 Graham Jull 20,572 19,283 Errol Newlands 23,392 24,154 Joe Scaramuzza 21,195 20,623 Diane Sharpe 37,091 29,067 Barbara Taranaki 30,753 26,869 Bruce Thomas 21,227 20,718 Grahame Webber 33,349 29,091 29 SEVERANCE PAYMENTS For the year ended 30 June 2007 there were no severance payments made to employees (2006 $6,256). 30 EVENTS AFTER THE BALANCE SHEET DATE There were no significant events after balance date 31 FINANCIAL INSTRUMENT RISK Council has a series of policies to manage the risks associated with financial instruments. Council is risk averse and seeks to minimise exposure from its treasury activities. Council has established Liability Management and Investment policies which do not allow any transactions that are speculative in nature. Market Risk
Price Risk Price Risk is the risk that the value of the financial instrument will fluctuate as a result of changes in the market prices. Council is not exposed to price risk as it does not enter into equity security transactions.
Currency Risk Currency Risk is the risk that the value of a financial instrument will fluctuate due to changes in foreign exchange rates. Council is not exposed to currency risk as it does not enter into foreign currency transactions.
Interest Rate Risk Interest rates on investments are disclosed in note 12 and on borrowings in note 22. Fair Value Interest Rate Risk Fair value interest rate risk is the risk that the value of a financial instrument will fluctuate due to changes in market interest rates. Borrowing at fixed rates exposes Council to fair value interest rate risk and the Liability Management Policy outlines the level of borrowing that is to be secured using fixed rate instruments. Fixed to floating interest rate swaps may be entered into to hedge the fair value interest rate risk arising from borrowing at fixed rates. In addition investments at fixed interest rates give an exposure to fair value interest rate risk.
Page 42

Waipa District Council Annual Report for Year Ended 30 June 2007
Page 43
NOTES TO THE FINANCIAL STATEMENTS CONTINUED Credit Risk Credit risk is the risk that a third party will default on its obligation, causing Council to incur a loss. There are no specific concentrations of credit risk. Council only invests funds on bank deposits and local authority stock and the Investment Policy limits the exposure to any one organisation. Liquidity Risk Liquidity risk is the risk that Council will encounter difficulty raising liquid funds to meet commitments as they fall due. In order to meet its commitments, Council maintains a liquidity buffer of $5m and, whilst it has an overdraft facility, there has not been any drawdown against it. 32 CAPITAL MANAGEMENT The Council’s capital is its equity (or ratepayers’ funds), which comprise retained earnings and reserves. Equity is represented by net assets. The Local Government Act 2002 [the Act] requires the Council to manage its revenues, expenses, assets, liabilities, investments, and general financial dealings prudently and in a manner that promotes the current and future interests of the community. Ratepayers funds are largely managed as a by-product of managing revenues, expenses, assets, liabilities, investments, and general financial dealings. The objective of managing these items is to achieve intergenerational equity, which is a principle promoted in the Act and applied by the Council. Intergenerational equity requires today’s ratepayers to meet the costs of utilizing the Council’s assets and not expecting them to meet the full cost of long term assets that will benefit ratepayers in future generations. Additionally, the Council has in place asset management plans for major classes of assets detailing renewal and maintenance programmes, to ensure ratepayers in future generations are not required to meet the costs of deferred renewals and maintenance. The Act requires the Council to make adequate and effective provision in its Long Term Council Community Plan (LTCCP) and in its annual plan (where applicable) to meet the expenditure needs identified in those plans. And the Act sets out the factors that the Council is required to consider when determining the most appropriate sources of funding for each of its activities. The sources and levels of funding are set out in the funding and financial policies in the Council’s LTCCP. Waipa District Council has the following Council created reserves:
reserves for different areas of benefit; self-insurance reserves; and reserves and special funds.
Reserves for different areas of benefit are used where there is a separate rate set as distinct from the general rate. Any surplus or deficit relating to these separate areas of benefit is applied to the specific reserves. Special reserves are set up where Council has received funds that are restricted for particular purposes. Interest is added to these reserves where applicable and deductions are made where funds have been used for the purpose they were donated. 33 EXPLANATION OF MAJOR VARIANCES AGAINST BUDGET Explanations for major variances from the 2006/7 budgeted figures are as follows: Statement of Financial Performance
• Very high volumes of applications for resource consents and building consents resulted in significant additional revenue – actual $2.1m, budget $1.5m.
• Additional projects which attracted Land Transport subsidy resulted in a higher than budgeted revenue - actual $5.2m, budget $4.9m.

Waipa District Council Annual Report for Year Ended 30 June 2007
Page 44
NOTES TO THE FINANCIAL STATEMENTS CONTINUED
• Lower development and reserve contributions received - actual $3.1m, budget $4.5m - due largely to the fees being paid at the prior year’s rates before the introduction of the new Development Contributions Policy.
• An increase in valuation of investment properties – actual $2.8m, budget $0.4m has resulted from the accounting treatment under IFRS.
• Additional vested assets – actual $6.2m, budget $2.7m - were received as a result of recognition of several major Cambridge sub-divisions.
• An increase in depreciation of $2.3m is due to the revaluation of infrastructural assets • An increase in expenditure of $0.5m relating to resource consents and building consent applications. • Additional contract costs for the Events Centre, litter collection and recycling – $1.3m • Additional consultancy, software implementation and legal fees of $0.9m in the Support activity
Statement of Financial Position
• Current assets include high investment levels awaiting large payments for capital work in July/August. • Non current assets significantly increased as a result of the revaluation of infrastructural assets, as did the other reserves within
equity. • Current liabilities include short term borrowing of $9m which is due to mature in August.

Waipa District Council Annual Report for Year Ended 30 June 2007
Page 45
GOVERNANCE What Does this Activity Include? This activity encompasses Council’s democratic and decision-making processes, including meetings, consultation, communication and civic affairs. Council’s Governance responsibilities include conducting local government elections and reviewing representation arrangements. Why is Council involved in this Activity? Council is involved in these activities in order to fulfil the requirements of legislation and also to work towards the achievement of community outcomes. The Link to Community Outcomes This activity contributes towards the achievement of the following Community Outcomes: WAIPA COMMUNITY OUTCOMES
Empowered people through democratic process Communication and consultation on all significant issues
Performance Measure and Target Level of Achievement Source of Information
85% of those residents who have an opinion are satisfied with the elected members.
2006/07 Mayor and Councillors: Achieved 97% satisfaction Community Board Members: Achieved 97% satisfaction 2005/06 Mayor and Councillors: Achieved 95% satisfaction1 Community Board Members: Achieved 94% satisfaction
Annual Community Satisfaction Survey
To ensure public input/consultation on all significant decisions, the statutory period for special consultative procedures exceeds the minimum required by statute
2006/07 The special consultative procedure was used on 6 occasions, involving 9 proposals, with a total of 53 days in excess of statutory minimum requirements. The submission period for one of the proposals ended in July 2007 2005/06 Minimum statutory requirements were met
Comparison of days made available for public consultation and the number required by statute
1 Please note that all Community Survey results have been recalculated to take out ‘don’t know’ responses.

Waipa District Council Annual Report for Year Ended 30 June 2007
GOVERNANCE CONTINUED
A minimum of 12 issues of “Word on Waipa’ are published to communicate Council’s involvement on community issues
2006/07 Council published the Word on Waipa on twelve occasions for the twelve month period. 2005/06 Achieved
“Word on Waipa” published monthly
Cost of Service
2006/07 Actual
2006/07 Target
2005/06 Actual
QUALITY Rateable properties 18,479 18,059 18,148 Population 42,500 43,200 42,500 AVERAGE OPERATING COSTS Per resident:
• Council 76 68 41 • Community Boards 28 25 14
RESOURCES: Permanent staff 170 179 159
Statement of Cost of Services
2007 2007 2006Actual Budget Actual
$000 $000 $000REVENUECambridge Community Board - - 2
- - 2
OPERATING EXPENDITURECouncil & Committees 1,874 1,720 1,735Cambridge Community Board 358 324 324Te Awamutu Community Board 287 270 265Elections 14 12 3Public Information 1,967 1,745 1,797
4,500 4,071 4,124
OPERATING SUPLUS/(DEFICIT) (4,500) (4,071) (4,122)
Funded by:Rates and General Funding 4,109 4,071 3,627Accumulated Funds Transfers 391 - 495
4,500 4,071 4,122
Explanation of significant cost of service variancesIncreased overhead allocation.
Page 46

Waipa District Council Annual Report for Year Ended 30 June 2007
Page 47
ENVIRONMENTAL SERVICES What does this Activity include? Activities associated with this activity area are Planning (Resource Management), Building control, Environmental Health, Navigation Safety and Animal Control. Why is Council involved in this Activity? Council is involved in these activities in order to fulfil the requirements of legislation and also to work towards the achievement of community outcomes. Council has a legal obligation to promote, protect and manage natural and physical resources, public health and public safety. The Link to Community Outcomes This activity contributes towards the achievement of the following Community Outcomes: WAIPA COMMUNITY OUTCOMES Feel safe and enjoy lifestyle of District A well-managed environment A District in which people can take a pride Safer communities Communication and consultation on all significant issues
Performance Measure and Target Level of Achievement Source of
Information
100% of applications for resource consents, building consents, LIMs, PIMs, licences and permits are processed within statutory timeframes, in accordance with policy guidelines and are accurate and cost effective
2006/07 Resource Consents: 91.3% (711 applications) processed within timeframe (211 above target) Building Consents : 96.3% (1594 applications) processed within timeframe LIMs: Achieved 100% (640 applications processed – 20 above target) PIMs: 99.4% (1077 applications) processed within timeframe 2005/06 Achieved 97.6% (average)
Management reports Response time measured
Satisfaction with those who had an opinion on Planning Services and Building Control Services achieves 85% as measured in the NRB Survey
2006/07 Planning: Satisfaction level of 76% achieved Building: Satisfaction level of 82% achieved 2005/06 Planning: 77% satisfaction Building: 86% satisfaction
Annual Community Satisfaction Survey – satisfaction with Planning Services and Building Control Services.

Waipa District Council Annual Report for Year Ended 30 June 2007
Page 48
ENVIRONMENTAL SERVICES CONTINUED
Performance Measure and Target Level of Achievement Source of Information
Satisfaction with environmental, public health and safety standards achieve 85% as measured in the NRB survey
2006/07 Dog Control: Satisfaction level of 84% achieved Noise Control: Achieved 93% satisfaction 2005/06 Dog Control: Achieved 85% satisfaction Noise Control: Achieved 93% satisfaction
Annual Community Satisfaction Survey – satisfaction with Animal Control and Noise Control
Conditions of consents, licences and permits are 100% compliant
2006/07 Regular monitoring of all consents, licences and permits is undertaken. All instances of non-compliance resulted in enforcement action being taken. 2005/06 Achieved 100% compliance
Annual audit Management records Number of breaches
Cost of Service 2006/07 2006/07 2005/06 Actual Budget Actual $000 $000 $000AVERAGE OPERATING COSTS Per resident Resource Management 54 42 45 Building Control 26 25 23 Environmental Health 10 9 13 Lake Navigation 0 2 0 Animal Control 11 10 10
TOTAL 101 88 91 Per rateable property Resource Management 125 100 106 Building Control 61 60 54 Environmental Health 24 21 30 Lake Navigation 0 6 0 Animal Control 24 24 23
TOTAL 234 211 213

Waipa District Council Annual Report for Year Ended 30 June 2007
ENVIRONMENTAL SERVICES CONTINUED Statement of Cost of Services
2007 2007 2006Actual Budget Actual
$000 $000 $000REVENUEResource Management 1,083 638 821Building Control 1,192 990 876Environmental Health 131 217 213Animal Control 219 210 191
2,625 2,055 2,101
OPERATING EXPENDITUREResource Management 2,310 1,804 1,925Building Control 1,126 1,092 980Environmental Health 437 482 544Animal Control 450 439 422
4,323 3,818 3,871
OPERATING SUPLUS/(DEFICIT) (1,698) (1,763) (1,770)
Funded by:Rates and General Funding 1,730 1,714 1,455Transfer to/from Reserves (82) 1 315Other - Non funded 50 50 -
1,698 1,764 1,770
Explanation of significant cost of service variancesHigh levels of consent applications required additional resourcesto process and generated higher revenue
Page 49

Waipa District Council Annual Report for Year Ended 30 June 2007
Page 50
AMENITY SERVICES What Does this Activity Include? Amenity Services comprises a range of activities that can be broadly categorised into recreation incorporating parks and reserves and swimming pools, libraries, property, cemeteries and public toilets, rural fire and civil defence and waste management.. Why is Council involved in this Activity? Council is involved in these activities in order to fulfil the requirements of legislation and also to work towards the achievement of community outcomes. The Link to Community Outcomes This activity contributes towards the achievement of the following Community Outcomes: WAIPA COMMUNITY OUTCOMES
Fit and active community High standards of public and environmental health Minimal waste and effective waste management Place, space and occasion to express cultures and interests Access to high quality facilities Social and cultural well-being A District in which people can take a pride
Parks and Reserves
Performance Measure and Target Level of Achievement Source of Information
The provision of 25 ha per 1,000 residents of parks space for leisure is achieved
2006/07 There is currently 24.8 ha per 1,000 residents 2005/06 Achieved 24.8 ha per 1,000 residents
Annual assessment
All reserves are managed to meet community expectations by being subject to Reserve Management Plans (RMPs) in accordance with the Reserves Act 1977.
2006/07 Reserve Management Plans were completed for urban reserves and the Maungatautari Scenic Reserve, with all other key reserves (excluding Peat Lakes) subject to a Reserve management Plan. 2005/06 All key reserves were subject to an Reserve Management Plan or Plan development process
Annual Review

Waipa District Council Annual Report for Year Ended 30 June 2007
Page 51
AMENITY SERVICES CONTINUED
Performance Measure and Target Level of Achievement Source of Information
A new Peat Lakes Reserve Management Plan is developed in accordance with the Reserves Act 1977.
2006/07 A draft has been prepared, although it is not expected to be adopted by Council until December 2007. 2005/06 Not applicable
Management reports
Playgrounds are maintained to be safe for use by complying with NZS 5828 Standards for Playground equipment
2006/07 Achieved 100% compliance 2005/06 Achieved 100% compliance
Quarterly audit
At least 87% of people who have an opinion are satisfied with the quality of parks in their community
2006/07 Achieved 93% satisfaction 2005/06 Achieved 91% satisfaction
Annual Community Satisfaction Survey
Libraries
Performance Measure and Target Level of Achievement Source of Information
A 2% increase in total number of issues over the previous year is achieved (>= 483,396 issues)
2006/07 The number of issues was 302 less than 2005/06, with numbers stable over the past two years. 2005/06 Achieved 98.1% (473,918 issues)
Annual audit
A 1% increase in visitor numbers across the District over the previous year is achieved (>= 230,096 visitors)
2006/07 Visitor figures for Cambridge are 3.4% higher than for 2005/06. A malfunction of the automatic counter in Te Awamutu resulted in a significantly lower recorded level of visitor numbers, which was not consistent with issue figures and desk receipts. The counter has now been re-calibrated. 2005/06 Achieved 97.6% (227,818 visitors)
Annual audit
Customer satisfaction of those who have an opinion achieves 85% or higher
2006/07 Achieved 95% satisfaction 2005/06 Achieved 94% satisfaction
Annual Community Satisfaction Survey

Waipa District Council Annual Report for Year Ended 30 June 2007
Page 52
AMENITY SERVICES CONTINUED
Performance Measure and Target Level of Achievement Source of Information
Libraries are operated in accordance with Library and Information Association of New Zealand Aotearoa (LIANZA) Standards 2004 unless Council policy determines otherwise
2006/07 The size and condition of the Te Awamutu Library and the condition of the library management system do not meet these standards. Provision has been made in the 2007/08 Annual Plan to address the library management system, while upgrading the Te Awamutu Library is signalled in Council’s 10-year Plan (LTCCP). 2005/06 Compliance with LIANZA Standards not assessed
Quarterly review
Full library service is maintained in Cambridge and Te Awamutu
2006/07 Achieved 2005/06 Achieved
Annual review
Waste Management
Performance Measure and Target Level of Achievement Source of Information
65% of all urban residents have access to a kerbside recycling service in 2006/07
2006/07 The service commenced in March 2007 and all households in the Cambridge, Te Awamutu, Kihikihi, Pirongia , Ohaupo, Karapiro, Rukuhia and Ngahinapouri urban areas have access to the service. 2005/06 Service not available
Annual participation survey
85% of residents who received a kerbside recycling service and have an opinion are satisfied with the service
2006/07 Achieved 95% satisfaction 2005/06 Service not available
Annual Community Satisfaction Survey

Waipa District Council Annual Report for Year Ended 30 June 2007
Page 53
AMENITY SERVICES CONTINUED Swimming Pools
Performance Measure and Target Level of Achievement Source of Information
85% of residents who have an opinion are satisfied with Council’s swimming facilities
2006/07 Satisfaction level of 76% achieved. 2005/06 Achieved 68% satisfaction
Annual Community Satisfaction Survey
Council swimming pools meet or exceed NZS 5826:2000 Standards in their daily operations
2006/07 Compliance not assessed due to management constraints. Assessment will be undertaken in 2007/08. 2005/07 Compliance with NZS 5826:2000 not assessed
Operational records
All-weather pool facilities in Te Awamutu are maintained at 100%
2006/07 Achieved 100% 2005/06 Achieved 100%
Annual review
Construction of a Cambridge all-weather pool facility is initiated in accordance with the wishes of the community.
2006/07 Council has confirmed the site for the development of an all-weather pool. Subject to design confirmation and tendering, construction is expected to commence in 2007/08. 2005/06 Not applicable
Annual review
Cost of Service 2006/07 2006/07 2005/06 Actual Budget Actual $000 $000 $000AVERAGE OPERATING COSTS Per Resident Parks & Reserves, Cemeteries 80 68 57 District Pools 53 28 28 Community Services Support 18 17 19 Public Safety (Rural Fire/Civil Defence) 6 6 4 Waste Management 22 18 5 District Libraries $ per resident 27 27 24 $ per book issued 2.47 2.46 2.20 Pensioner housing $ invested 10.4m 4.9m 9.3m Return on investment 0.57% 0.77% 0.91%

Waipa District Council Annual Report for Year Ended 30 June 2007
AMENITY SERVICES CONTINUED Statement of Cost of Services
2007 2007 2006Actual Budget Actual
REVENUE $000 $000 $000Parks and Reserves 335 277 289Cemeteries 103 124 99Public Toilets 15 14 15Properties 1,020 1,136 1,290Forestry - 250 62Community Service Support 29 29 30Heritage 53 130 195Civil Defence 8 7 6District Libraries 164 161 158District Pools 321 285 312
2,048 2,413 2,457OPERATING EXPENDITUREParks and Reserves 3,144 2,724 2,762Cemeteries 254 218 211Public Toilets 420 355 328Properties 2,226 2,827 2,229Forestry 21 241 146Community Service Support 755 732 819Heritage 496 653 237Rural Fire 72 75 63Civil Defence 182 203 188Waste Management 917 775 224District Libraries 1,174 1,168 1,213District Pools 2,245 1,195 1,185
11,906 11,166 9,607OPERATING SUPLUS/(DEFICIT) (9,858) (8,753) (7,149)
Capital Expenditure 910 5,229 1,251
To be Funded 10,768 13,982 8,400Funded by:Rates and General Funding 7,701 7,629 6,590Loan Funding - 1,176 - Transfer to/from Reserves 2,450 2,306 1,338Development Contributions - 978 - Value of Assets Vested - 1,276 - Other - Non funded 617 617 472
10,768 13,982 8,400
Explanation of significant cost of service variances Explanation of significant capital expenditure variances
Significant Capital ProjectsKarakiro Domain Development 104 2,352 416Gecks Reserve Development - 1,367 170
Additional maintenance requirement and increased operational costs for the Te Awamutu Events Centre,included in District Pools, additional cost for recycling and litter bins contracts
The project to upgrade the Karapiro lakesides has been rescheduled and re-prioritised to support the world rowing regatta 2010. The objective is to have the project substantially completed by December 2009
Page 54

Waipa District Council Annual Report for Year Ended 30 June 2007
Page 55
TRANSPORT MANAGEMENT What Does this Activity Include? The management and development of local roads and car parks, including safety improvements, road marking and signage, street lighting, kerb and channelling, and footpaths. This activity also includes the progressive sealing of unsealed roads. Why is Council involved in this Activity? Council is involved in these activities in order to fulfil the requirements of legislation and also to work towards the achievement of community outcomes. The Link to Community Outcomes This activity contributes towards the achievement of the following Community Outcomes: WAIPA COMMUNITY OUTCOMES
Fit and active community Business opportunities Safer communities High standard of infrastructure Access to high quality facilities
Performance Measure and Target Level of Achievement Source of Information
Reduction in injury crash trends and other road safety trend data, is equal to or less than Council’s peer group as established by Land Transport New Zealand
2006/07 This report is no longer produced by LTNZ. Injury crash data figures have not yet been published, and are not expected before September 2007. 2005/06 Poor observation Waipa = 36%; Peer Group = 31% Speed Waipa = 16%; Peer Group = 20% Road factors Waipa = 13%; Peer Group = 15%
Land Transport New Zealand road safety issues report
Satisfaction of users who have an opinion about road safety is equal to 85% as measured in the NRB Survey
2006/07 Satisfaction level of 81% achieved 2005/06 Achieved 79% satisfaction
Annual Community Satisfaction Survey

Waipa District Council Annual Report for Year Ended 30 June 2007
Page 56
TRANSPORT MANAGEMENT CONTINUED
Performance Measure and Target
Level of Achievement Source of Information
100% compliance with performance measures within Land Transport New Zealand Roading Programme agreement is achieved.
2006/07 Level of compliance can not be determined until Land Transport New Zealand report in August/September 2007. 2005/06 Achieved 80% compliance
Annual audit
Sealed roads maintain 100% compliance with NAASRA standards.
2006/07 Achieved 100% compliance 2005/06 Achieved 100% compliance
Annual roughness survey
At least 95.5% of all roads are sealed.
2006/07 Achieved 95.6% (of sealable roads are sealed) 2005/06 Achieved 95% (of sealable roads are sealed)
Annual review
Customer satisfaction of those with an opinion regarding the quality of Council roads and footpaths achieves 85%.
2006/07 Roads: Satisfaction level of 83% achieved Footpaths: Satisfaction level of 79% achieved 2005/06 Roads: Achieved 79% satisfaction Footpaths: Achieved 83% satisfaction
Annual Community Satisfaction Survey
100% of residential streets in Cambridge, Te Awamutu, Kihikihi, Pirongia and Ohaupo have footpaths on at least one side
2006/07 The footpath development programme is ongoing, with the following completion levels achieved: Cambridge 92 % (72.7km of residential streets and 78.7km of footpath – some streets already had footpath on both sides). Te Awamutu/Kihikihi 87% Pirongia 58% Ohaupo 100% 2005/06 Not assessed
Annual review
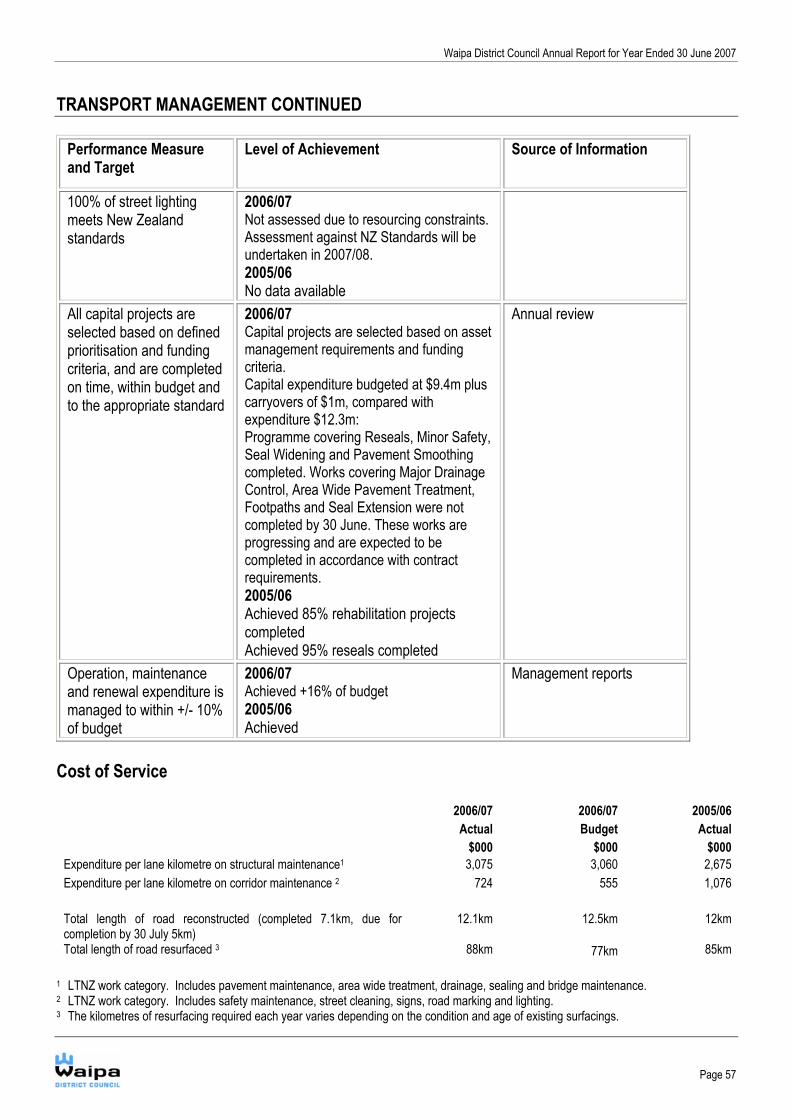
Waipa District Council Annual Report for Year Ended 30 June 2007
Page 57
TRANSPORT MANAGEMENT CONTINUED
Performance Measure and Target
Level of Achievement Source of Information
100% of street lighting meets New Zealand standards
2006/07 Not assessed due to resourcing constraints. Assessment against NZ Standards will be undertaken in 2007/08. 2005/06 No data available
All capital projects are selected based on defined prioritisation and funding criteria, and are completed on time, within budget and to the appropriate standard
2006/07 Capital projects are selected based on asset management requirements and funding criteria. Capital expenditure budgeted at $9.4m plus carryovers of $1m, compared with expenditure $12.3m: Programme covering Reseals, Minor Safety, Seal Widening and Pavement Smoothing completed. Works covering Major Drainage Control, Area Wide Pavement Treatment, Footpaths and Seal Extension were not completed by 30 June. These works are progressing and are expected to be completed in accordance with contract requirements. 2005/06 Achieved 85% rehabilitation projects completed Achieved 95% reseals completed
Annual review
Operation, maintenance and renewal expenditure is managed to within +/- 10% of budget
2006/07 Achieved +16% of budget 2005/06 Achieved
Management reports
Cost of Service 2006/07 2006/07 2005/06 Actual Budget Actual $000 $000 $000 Expenditure per lane kilometre on structural maintenance1 3,075 3,060 2,675 Expenditure per lane kilometre on corridor maintenance 2 724 555 1,076 Total length of road reconstructed (completed 7.1km, due for completion by 30 July 5km)
12.1km 12.5km 12km
Total length of road resurfaced 3 88km 77km 85km 1 LTNZ work category. Includes pavement maintenance, area wide treatment, drainage, sealing and bridge maintenance. 2 LTNZ work category. Includes safety maintenance, street cleaning, signs, road marking and lighting. 3 The kilometres of resurfacing required each year varies depending on the condition and age of existing surfacings.

Waipa District Council Annual Report for Year Ended 30 June 2007
TRANSPORT MANAGEMENT CONTINUED Statement of Cost Of Services
2007 2007 2006Actual Budget Actual
$000 $000 $000REVENUELTNZ Subsidies 5,254 4,897 4,485Activity Revenue 87 54 53
5,341 4,951 4,538
OPERATING EXPENDITURESubsidised Roading 10,958 9,095 8,462Non-subsidised Roading 2,152 1,695 1,642Carparks 88 101 -
13,198 10,891 10,104
OPERATING SUPLUS/(DEFICIT) (7,857) (5,940) (5,566)
Analysis of Operating ExpenditureDepreciation & Amortisation 5,335 4,408 4,325Activity Expenses 6,211 4,838 4,577Overhead Allocation 1,111 1,016 726Finance Costs 541 629 476
13,198 10,891 10,104
Capital Expenditure 12,334 9,422 9,356
To be Funded 20,191 15,362 14,922
Funded by:Rates and General Funding 5,395 5,344 6,310Loan Funding 1,803 2,470 1,089Transfer to/from Reserves 5,897 4,425 4,136Development Contributions 1,942 1,559 692Value of Assets Vested 4,287 764 1,895Other - Non funded 867 800 800
20,191 15,362 14,922
Explanation of significant cost of service variances Explanation of significant capital expenditure variances
Significant Capital ProjectsSeal Extentions 901 1,015 900Reseals 1,674 1,627 1,542Rehab sealed/Area Wide Pavement 1,483 1,625 2,422Minor Safety Improvements 507 418 253Footpaths and Kerb and Channel 202 523 342Maungatautari Reserve Hicks Road Access 198 765 - Vaile Street Carpark 53 - - Pavement Smoothing 1,740 1,295
Additional depreciation from revaluation of infrastructural assets,transfers from capital to operating expenditure, additional projectssupported by LTNZ revenue
Hicks Road reconstruction to be completed 2008; Raynes Road reconstruction brought forward from 2006
Page 58

Waipa District Council Annual Report for Year Ended 30 June 2007
Page 59
STORMWATER What Does this Activity Include? The management, maintenance and development of stormwater collection systems in urban and particular rural areas of the District. Stormwater is collected to maintain public convenience and safety, and its discharge is subject to consents granted by Environment Waikato. Why is Council involved in this Activity? Council is involved in these activities in order to fulfil the requirements of legislation and also to work towards the achievement of community outcomes. The Link to Community Outcomes This activity contributes towards the achievement of the following Community Outcomes: WAIPA COMMUNITY OUTCOMES
High standards of public and environmental health Sustainable, safe and healthy infrastructure Clean air, water and land A well-managed environment Efficient and effective utility services Protection or natural environment High standard of infrastructure
Performance Measure and Target Level of Achievement Source of Information
Discharges achieve 100% compliance with the standards set by Environment Waikato in order to provide an acceptable quality of discharge from stormwater outlets
2006/07 Discharges met consent conditions. A stormwater management plan is yet to be submitted to Environment Waikato, but is being addressed. 2005/06 Five out of six stormwater resource consents fully complied.
Testing carried out in accordance with resource consents
Continuity of service is not compromised by system blockages. The number of blockages per length of pipe/drain will not exceed one blockage per 2kms of pipe/drain
2006/07 Achieved one blockage per 7.87km of pipe. 2005/06 One blockage per 1.8km of pipe/drain
Quarterly review of failure information sheets and INFRA
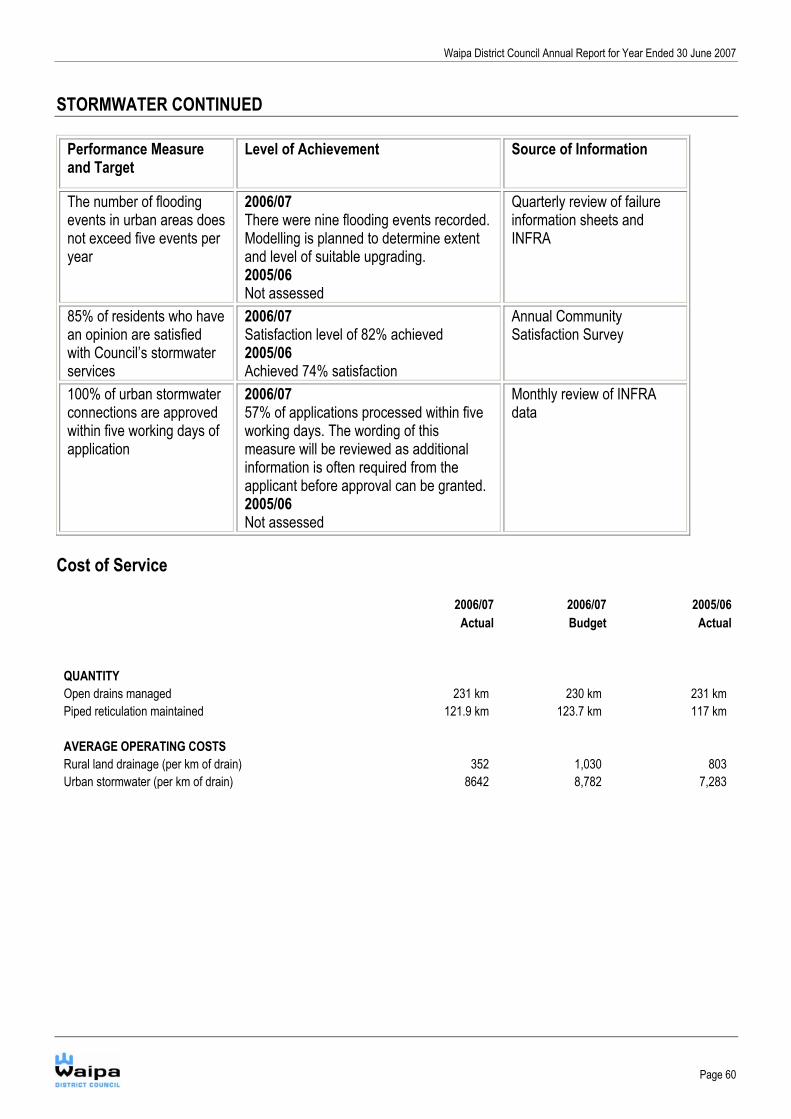
Waipa District Council Annual Report for Year Ended 30 June 2007
Page 60
STORMWATER CONTINUED
Performance Measure and Target
Level of Achievement Source of Information
The number of flooding events in urban areas does not exceed five events per year
2006/07 There were nine flooding events recorded. Modelling is planned to determine extent and level of suitable upgrading. 2005/06 Not assessed
Quarterly review of failure information sheets and INFRA
85% of residents who have an opinion are satisfied with Council’s stormwater services
2006/07 Satisfaction level of 82% achieved 2005/06 Achieved 74% satisfaction
Annual Community Satisfaction Survey
100% of urban stormwater connections are approved within five working days of application
2006/07 57% of applications processed within five working days. The wording of this measure will be reviewed as additional information is often required from the applicant before approval can be granted. 2005/06 Not assessed
Monthly review of INFRA data
Cost of Service 2006/07 2006/07 2005/06 Actual Budget Actual QUANTITY Open drains managed 231 km 230 km 231 km Piped reticulation maintained 121.9 km 123.7 km 117 km AVERAGE OPERATING COSTS Rural land drainage (per km of drain) 352 1,030 803 Urban stormwater (per km of drain) 8642 8,782 7,283

Waipa District Council Annual Report for Year Ended 30 June 2007
STORMWATER CONTINUED Statement of Cost of Services
2007 2007 2006Actual Budget Actual
$000 $000 $000REVENUEActivity Reveune 2 - 1
2 - 1
OPERATING EXPENDITUREDepreciation & Amortisation 543 459 448Activity Expenses 224 406 327Overhead Allocation 368 347 278Finance Costs - - -
1,135 1,213 1,053
OPERATING SUPLUS/(DEFICIT) (1,133) (1,213) (1,052)
Capital Expenditure 1,658 777 775
To be Funded 2,791 1,990 1,827
Funded by:Rates and General Funding 1,173 1,163 1,131Transfer to/from Reserves 588 677 243Development Contributions 616 - 263Value of Assets Vested 396 100 190Other - Non funded 18 50 50
2,791 1,990 1,827
Explanation of significant cost of service variances Explanation of significant capital expenditure variances
Significant Capital ProjectsPakura Street Project 383 - 34Victoria Street to Lake Te Ko Utu 179 - -
Additional depreciation from revaluation of infrastructural assets. The Pakura Street upgrade was brought forward from the previous year; Water quality improvement to Lake Te Ko Utu brought forward from 2006
Page 61

Waipa District Council Annual Report for Year Ended 30 June 2007
Page 62
WATER TREATMENT AND SUPPLY What Does this Activity Include? The management and operation of water treatment plants and maintenance and development of water supply systems. Why is Council involved in this Activity? Council is involved in these activities in order to fulfil the requirements of legislation and also to work towards the achievement of community outcomes. The Link to Community Outcomes This activity contributes towards the achievement of the following Community Outcomes: WAIPA COMMUNITY OUTCOMES
High standards of public and environmental health Sustainable, safe and healthy infrastructure Efficient and effective utility services High standard of infrastructure
Performance Measure and Target Level of Achievement Source of Information
Drinking water is clean and safe and complies with New Zealand Drinking Water Standards by achieving a minimum of Bb grading for all water supplies
2006/07 Ministry of Health grading of supplies is progressing, and expected to be completed in 2007/08. 2005/06 Ungraded.
Testing carried out as per New Zealand Drinking Water Standards 2005
Taking water for treatment has minimal effects on the environment and its abstraction is 100% compliant with resource consents
2006/07 Achieved 100% compliance for all sources except Hicks Road No.2 Spring where abstraction exceeded maximum allowed on 1 day. 2005/06 Achieved 100% compliance
Monitoring undertaken in accordance with consent requirements

Waipa District Council Annual Report for Year Ended 30 June 2007
Page 63
WATER TREATMENT AND SUPPLY CONTINUED
Performance Measure and Target Level of Achievement Source of Information
Water supply and pressure are adequate and are 100% compliant with the Fire Service Standards (NZS 4509:2003) for water pressure and flow
2006/07 A full evaluation of the reticulation is required before the level of compliance can be assessed. This evaluation will be undertaken in 2007/08 2005/06 Not assessed
Testing conducted in accordance with New Zealand Standards
86% of residents who have an opinion are satisfied with Council’s water supply service
2006/07 Achieved 89% satisfaction 2005/06 Achieved 88% satisfaction
Annual Community Satisfaction Survey
The interruption of water supply available to customers does not exceed 5 hours per annum for on demand service
2006/07 There were three recorded interruptions that exceeded five hours. Two were the result of pipe failure, and were responded to immediately. The third interruption was a result of a planned upgrade project where additional unplanned essential work was required. In this case all affected residents were notified prior to the work being undertaken. 2005/06 Not assessed
Quarterly audit of failure information sheets and INFRA data
100% of all water supply connections are approved within 10 days
2006/07 63% of applications were processed within 10 days. The wording of this measure will be reviewed as additional information is often required from the applicant before approval can be granted. 2005/06 Not assessed
Monthly review of INFRA data

Waipa District Council Annual Report for Year Ended 30 June 2007
Page 64
WATER TREATMENT AND SUPPLY CONTINUED Cost of Service
2006/07 2006/07 2005/06 Actual Budget Actual QUANTITY
Water processed in millions 9.9 m3 10.1 m3 9.5 m3 Reticulation system 527 km 510 km 520 km Separately rateable property 13,109 12,851 12,417 AVERAGE OPERATING COSTS $ $ $ Per separately rateable property 483 430 466 Production (per cubic metre) 0.64 0.55 0.61
Consent Granted Next Review Hicks Road 2001 2021
Karapiro 2001 2021
Alpha Street 2004 2024
Pukerimu 2004 2024
Te Tahi 1991 2011
Kihikihi
Church Street 2004 2016
Hall Street 2001 2016

Waipa District Council Annual Report for Year Ended 30 June 2007
WATER TREATMENT AND SUPPLY CONTINUED Statement of Cost of Services
2007 2007 2006Actual Budget Actual
$000 $000 $000REVENUEActivity Revenue 2,368 2,269 2,465
2,368 2,269 2,465
OPERATING EXPENDITUREEmployee Benefit Expenses 564 549 543Depreciation & Amortisation 2,515 2,056 2,080Activity Expenses 2,289 2,113 2,479Overhead Allocation 959 810 679Finance Costs - - -
6,327 5,528 5,781
OPERATING SUPLUS/(DEFICIT) (3,959) (3,259) (3,316)
Capital Expenditure 2,807 3,100 2,516
To be Funded 6,766 6,359 5,832
Funded by:Rates and General Funding 3,027 2,999 2,742Transfer to/from Reserves 2,913 2,538 2,254Development Contributions 31 275 - Value of Assets Vested 562 287 576Other - Non funded 233 260 260
6,766 6,359 5,832
Explanation of significant cost of service variances Explanation of significant capital expenditure variances
Significant Capital ProjectsPukerimu Plant/Parallel Road 211 - 432Cambridge North Reservoir 681 - 121Kihikihi Reservoir 167 - 390Te Awamutu Water Source 27 500 - Te Tahi Treatment Plant Resevoir Renewal 54 600 - Te Awamutu Te Rore Connection to Te Awamutu Supply 9 500 -
Additional depreciation from revaluation of infrastructural assets. Cambridge North and Kihikihi reservoir brought forward from 2006; Te Awamutu water source project underway 2008
Page 65

Waipa District Council Annual Report for Year Ended 30 June 2007
Page 66
WASTEWATER TREATMENT AND DISPOSAL What Does this Activity Include? The management and operation of wastewater treatment plants and maintenance and development of wastewater reticulations systems. Why is Council involved in this Activity? Council is involved in these activities in order to fulfil the requirements of legislation and also to work towards the achievement of community outcomes. The Link to Community Outcomes This activity contributes towards the achievement of the following Community Outcomes: WAIPA COMMUNITY OUTCOMES
High standards of public and environmental health Sustainable, safe and healthy infrastructure A well-managed environment Efficient and effective utility services High standard of infrastructure
Performance Measure and Target Level of Achievement Source of Information
No river or stream pollution resulting from treatment plant discharge occurs and there is 100% compliance with standards set by Environment Waikato across the District
2006/07 Te Awamutu - Two samples exceeded the maximum bacterial count due to a minor plant failure, which has been rectified. Cambridge - Non-compliance for nitrogen and bacterial count levels. A plant upgrade will be required to achieve consent levels. 2005/06 100% compliance for Te Awamutu Non-compliance for nitrogen and phosphorus in Cambridge
Testing carried out in accordance with resource consents
Wastewater assets are operated in accordance with best practice in order to achieve less than 5 odour events2 per year
2006/07 Seven odour events were reported, which have been attributed to blockages 2005/06 Nine odour events were reported
Quarterly audit of INFRA data
2 Event – one fault or problem which can attract a number of complaints
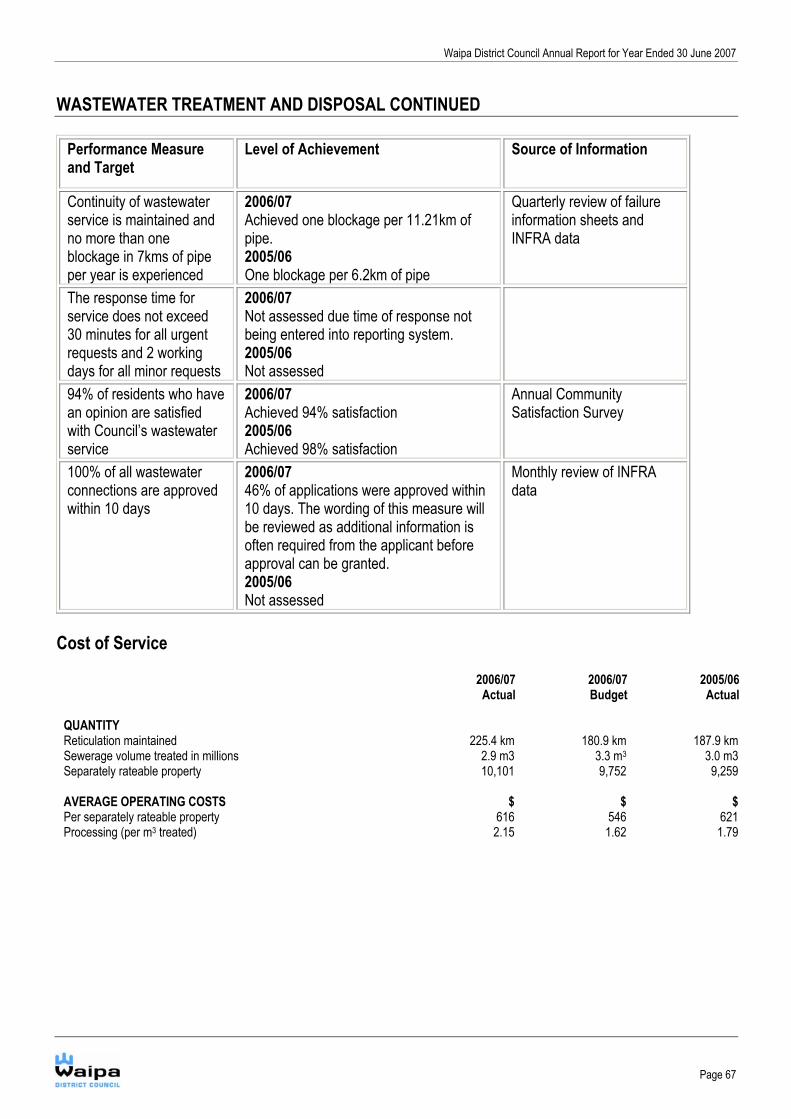
Waipa District Council Annual Report for Year Ended 30 June 2007
Page 67
WASTEWATER TREATMENT AND DISPOSAL CONTINUED
Performance Measure and Target
Level of Achievement Source of Information
Continuity of wastewater service is maintained and no more than one blockage in 7kms of pipe per year is experienced
2006/07 Achieved one blockage per 11.21km of pipe. 2005/06 One blockage per 6.2km of pipe
Quarterly review of failure information sheets and INFRA data
The response time for service does not exceed 30 minutes for all urgent requests and 2 working days for all minor requests
2006/07 Not assessed due time of response not being entered into reporting system. 2005/06 Not assessed
94% of residents who have an opinion are satisfied with Council’s wastewater service
2006/07 Achieved 94% satisfaction 2005/06 Achieved 98% satisfaction
Annual Community Satisfaction Survey
100% of all wastewater connections are approved within 10 days
2006/07 46% of applications were approved within 10 days. The wording of this measure will be reviewed as additional information is often required from the applicant before approval can be granted. 2005/06 Not assessed
Monthly review of INFRA data
Cost of Service
2006/07 2006/07 2005/06 Actual Budget Actual QUANTITY Reticulation maintained 225.4 km 180.9 km 187.9 km Sewerage volume treated in millions 2.9 m3 3.3 m3 3.0 m3 Separately rateable property 10,101 9,752 9,259 AVERAGE OPERATING COSTS $ $ $ Per separately rateable property 616 546 621 Processing (per m3 treated) 2.15 1.62 1.79
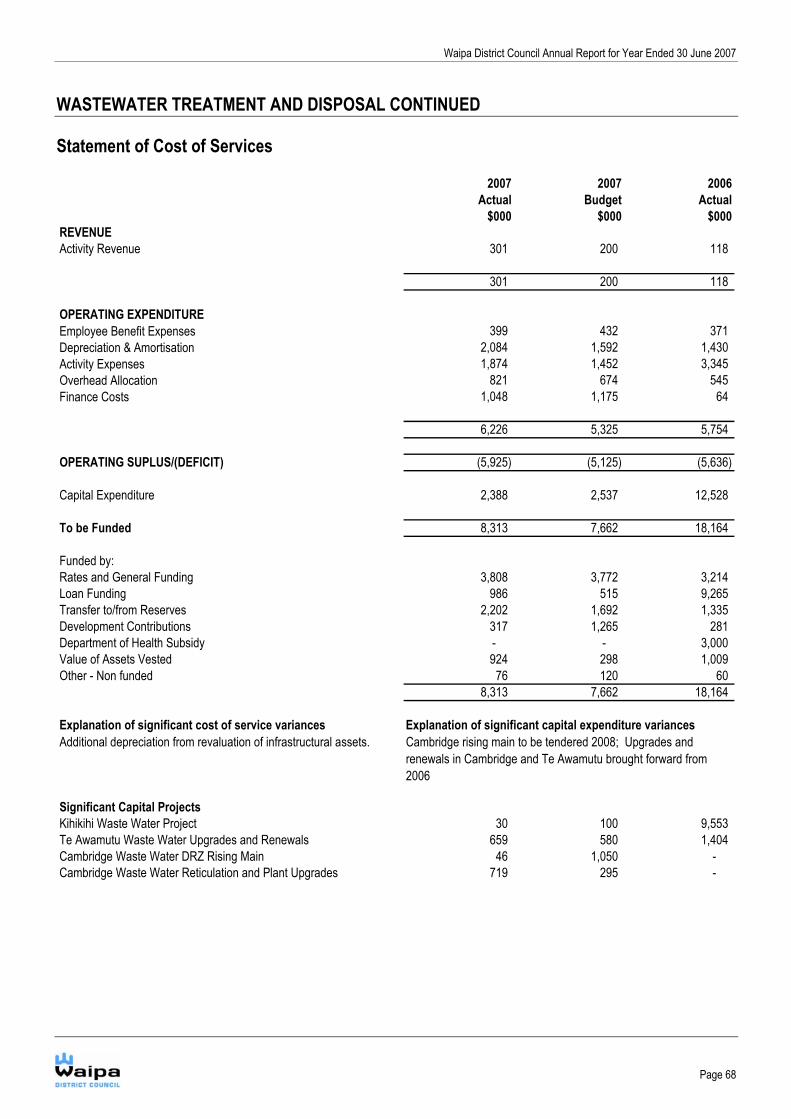
Waipa District Council Annual Report for Year Ended 30 June 2007
WASTEWATER TREATMENT AND DISPOSAL CONTINUED Statement of Cost of Services
2007 2007 2006Actual Budget Actual
$000 $000 $000REVENUEActivity Revenue 301 200 118
301 200 118
OPERATING EXPENDITUREEmployee Benefit Expenses 399 432 371Depreciation & Amortisation 2,084 1,592 1,430Activity Expenses 1,874 1,452 3,345Overhead Allocation 821 674 545Finance Costs 1,048 1,175 64
6,226 5,325 5,754
OPERATING SUPLUS/(DEFICIT) (5,925) (5,125) (5,636)
Capital Expenditure 2,388 2,537 12,528
To be Funded 8,313 7,662 18,164
Funded by:Rates and General Funding 3,808 3,772 3,214Loan Funding 986 515 9,265Transfer to/from Reserves 2,202 1,692 1,335Development Contributions 317 1,265 281Department of Health Subsidy - - 3,000Value of Assets Vested 924 298 1,009Other - Non funded 76 120 60
8,313 7,662 18,164
Explanation of significant cost of service variances Explanation of significant capital expenditure variances
Significant Capital ProjectsKihikihi Waste Water Project 30 100 9,553Te Awamutu Waste Water Upgrades and Renewals 659 580 1,404Cambridge Waste Water DRZ Rising Main 46 1,050 - Cambridge Waste Water Reticulation and Plant Upgrades 719 295 -
Additional depreciation from revaluation of infrastructural assets. Cambridge rising main to be tendered 2008; Upgrades and renewals in Cambridge and Te Awamutu brought forward from 2006
Page 68

Waipa District Council Annual Report for Year Ended 30 June 2007
Page 69
SUPPORT SERVICES Why Council is involved in this Activity Support Services are those activities that are needed to support the significant activities. Support Services is not a significant activity in its own right, but it reflects a significant part of Council’s operating budget. Unlike the significant activities, which are focused on public service delivery, Support Services are internally focused. The Local Government Act 2002 enables Council to choose between staff directly employed in a support service capacity, or a contract arrangement. In doing so, Council is required to give due consideration to the advantages and disadvantages of each option. The legislation is permissive, except in some areas of regulatory enforcement. Council’s Support Services can be broadly categorised into general management or business units. The former comprises policy advice and monitoring, financial management, information and general administrative services. Business units are applicable to a range of service areas, most notably roading and recreation. Business units typically exist in competition with alternative market providers because Council is able to provide that service more efficiently, or effectively than an external service provider. Expenditure in this area relates to internal charges recovered as overheads or internal contracts from other activities. The costs of Support Services are shown as indirect costs (overheads) or direct costs (internal contracts) in each of Council’s significant activities.

Waipa District Council Annual Report for Year Ended 30 June 2007
SUPPORT SERVICES CONTINUED Statement of Cost of Services
2007 2007 2006Actual Budget Actual
$000 $000 $000REVENUEActivity Revenue 639 705 91Internal Recoveries 10,263 9,294 8,511
10,902 9,999 8,602
OPERATING EXPENDITUREEmployee Benefit Expenses 4,962 5,060 3,968Depreciation & Amortisation 1,356 976 1,079Activity Expenses 3,270 2,686 4,126Finance Costs 49 22 52
9,637 8,744 9,224
OPERATING SUPLUS/(DEFICIT) 1,265 1,255 (622)
Capital Expenditure 634 2,135 1,916
To be Funded (631) 880 2,538
Funded by:Rates and General Funding (1,408) (1,408) - Loan Funding - 780 784Transfer to/from Reserves 691 1,422 1,668Other - Non funded 86 86 86
(631) 880 2,538
Explanation of significant cost of service variances Explanation of significant capital expenditure variances
Significant Capital ProjectsPlant Replacement 272 453 456Information Technology Hardware 176 422 546Information Technology Software 187 1,260 784
Addition depreciation due to Corporate Software project occuringa year earlier than budgeted, additional consultancy and legalfees
Corparate Software and related hardware were purchased earlier than budgeted. Other software items have been deferred
Page 70

Waipa District Council Annual Report for Year Ended 30 June 2007
Page 71
INVOLVEMENT IN COUNCIL-CONTROLLED ORGANISATIONS AND COUNCIL ORGANISATIONS Waikato Regional Airport Limited (WRAL) This Company established in 1989, operates the Airport situated at Rukuhia within Waipa District. The local authority part owners negotiated the purchase of the Crown’s former shareholding to secure the retention of the airport as a major infrastructural facility important to the economy of the Waikato. The objective of the airport company is to operate a successful commercial business, providing safe, appropriate and efficient services for the transportation of people and freight in and out of the port of Hamilton. Council holds 15.625% of the airport company’s shares. The remaining shares are owned by Hamilton City Council, Matamata-Piako, Otorohanga and Waikato District Councils. Waikato Regional Airport Ltd reported a net surplus of $1.0m for the year ended 30 June 2007 (2006 a net loss of $1.5m). No dividend was paid in 2007 (2006 nil). A comparison of the company’s financial and performance measures for the year ended 30 June 2007 is shown below. Actual Statement of
Corporate Intent Targets
Operating surplus after taxation to shareholders' funds 2.88% 1.37%
Operating surplus before taxation and interest to total assets 3.76% 3.55%
Operating surplus after taxation to total assets 1.63% 0.69%
Operating surplus before taxation and interest to shareholders' funds 6.64% 6.98%
Percentage of non-landing charges revenue to total revenue 81.44% 81.38%
Debt equity ratio 43:57 49:51
Interest rate cover 3.7 2.2
Net asset backing per share $12.51 $7.37 Local Authority Shared Services Limited (LASS) Council is a shareholder in the Local Authority Shared Services Limited which was established to provide shared services to local authorities within the Waikato region. The primary activity of this company is the operation of a Shared Valuation Database Service (SVDS). Council holds 7.69% of the shares in LASS. The remaining shares are owned by Environment Waikato, Hamilton City Council, Franklin, Waikato, Thames-Coromandel, Hauraki, Matamata-Piako, Otorohanga, Waitomo, South Waikato, Taupo and Rotorua District Councils.

Waipa District Council Annual Report for Year Ended 30 June 2007
Page 72
INVOLVEMENT IN COUNCIL-CONTROLLED ORGANISATIONS AND COUNCIL ORGANISATIONS CONTINUED Council has contributed $78,748 as a contribution to the capital cost of development of the SVDS, and this represents 4.9% of the service shares in the SVDS. Other Companies and Organisations NEW ZEALAND LOCAL GOVERNMENT INSURANCE CORPORATION The company’s prime objective is to ensure the long term provision of stable and cost effective risk financing products for local government in New Zealand. Council holds 1.1% of the shares in the Company with the remaining shares being held by other Councils in New Zealand. Council received a dividend of $8,636 (2006 $0).

WN60866_Waipa DC Audit Opinion
AUDIT REPORT
TO THE READERS OFWAIPA DISTRICT COUNCIL’S
FINANCIAL STATEMENTS AND PERFORMANCE INFORMATIONFOR THE YEAR ENDED 30 JUNE 2007
The Auditor-General is the auditor of Waipa District Council (the District Council). The Auditor-General has appointed me, B H Halford, using the staff and resources of Audit New Zealand, to carry out an audit on his behalf. The audit covers the District Council’s compliance with the requirements of Schedule 10 of the Local Government Act 2002 that apply to the annual report of the District Council for the year ended 30 June 2007, including the financial statements.
Unqualified Opinion
In our opinion:
The financial statements of the District Council on pages 15 to 44:
comply with generally accepted accounting practice in New Zealand; and
fairly reflect :
the District Council’s financial position as at 30 June 2007; and
the results of its operations and cash flows for the year ended on that date.
The service provision information of the District Council on pages 45 to 72 fairly reflects the levels of service provision as measured against the intended levels of service provision adopted, as well as the reasons for any significant variances, for the year ended on that date; and
The Council has complied with the other requirements of Schedule 10 of the Local Government Act 2002 that apply to the annual report (the “other requirements”).
The audit was completed on 25 September 2007, and is the date at which our opinion is expressed.
The basis of our opinion is explained below. In addition, we outline the responsibilities of the Council and the Auditor, and explain our independence.

WN60866_Waipa DC Audit Opinion
Basis of Opinion
We carried out the audit in accordance with the Auditor-General’s Auditing Standards, which incorporate the New Zealand Auditing Standards.
We planned and performed the audit to obtain all the information and explanations we considered necessary in order to obtain reasonable assurance that the financial statements, performance information and the other requirements did not have material misstatements, whether caused by fraud or error.
Material misstatements are differences or omissions of amounts and disclosures that would affect a reader’s overall understanding of the financial statements, performance information and the other requirements. If we had found material misstatements that were not corrected, we would have referred to them in our opinion.
The audit involved performing procedures to test the information presented in the financial statements, performance information and the other requirements. We assessed the results of those procedures in forming our opinion.
Audit procedures generally include:
determining whether significant financial and management controls are working and can be relied on to produce complete and accurate data;
verifying samples of transactions and account balances;
performing analyses to identify anomalies in the reported data;
reviewing significant estimates and judgements made by the Council;
confirming year-end balances;
determining whether accounting policies are appropriate and consistently applied; and
determining whether all required disclosures are adequate.
We did not examine every transaction, nor do we guarantee complete accuracy of the financial statements, performance information and the other requirements.
We evaluated the overall adequacy of the presentation of information in the financial statements, performance information and the other requirements. We obtained all the information and explanations we required to support our opinion above.
Responsibilities of the Council and the Auditor
The Council is responsible for preparing financial statements in accordance with generally accepted accounting practice in New Zealand. Those financial statements must fairly reflect the financial position of the District Council as at 30 June 2007. They must also fairly reflect the results of its operations and cash flows and the levels of service provision for the year ended on that date. The Council is also responsible for meeting the other requirements of Schedule 10 and including that information in the annual report. The Council’s responsibilities arise from Section 98 and Schedule 10 of the Local Government Act 2002.

WN60866_Waipa DC Audit Opinion
We are responsible for expressing an independent opinion on the financial statements, performance information and the other requirements and reporting that opinion to you. This responsibility arises from section 15 of the Public Audit Act 2001 and section 99 of the Local Government Act 2002.
Independence
When carrying out the audit we followed the independence requirements of the Auditor-General, which incorporate the independence requirements of the Institute of Chartered Accountants of New Zealand.
Other than the audit we have no relationship with or interests in the District Council.
Ben HalfordAudit New ZealandOn behalf of the Auditor-GeneralHamilton, New Zealand