annual report on charter schools: 2017-2018
TRANSCRIPT

The Washington State Board of Education envisions an education system where students are engaged in personalized education pathways that prepare them for civic engagement, careers,
postsecondary education, and lifelong learning.
Annual Report on Charter Schools: 2017-2018 1/14/2019

2
ACKNOWLEDGEMENTS The Washington State Board of Education (SBE) staff would like to acknowledge the support provided by the Washington State Charter School Commission (CSC) staff who worked collaboratively to ensure accurate student performance data and identify suggested amendments to statute to strengthen the state’s charter schools. The SBE also wishes to thank the Student Information Office staff at the Office of the Superintendent of Public Instruction (OSPI) for providing certain data to the SBE about the Washington charter schools.
Questions regarding this report should be directed to the following SBE staff:
Ms. Kaaren Heikes, Director of Policy and Partnerships
Dr. Andrew Parr, Research Director
3
Table of Contents Page 4 Executive Summary 6 Introduction 10 Section I Charter School Performance 14 Section II Successes, Challenges, and Areas for Improvement 17 Section III Recommended Changes to State Law or Policy 20 Exhibit A Part I School by School Performance Analysis Data Part II Design and Methodology

4
Executive Summary Washington State’s Charter School Act (RCW 28A.710) was enacted on April 3, 2016. The primary purpose of Washington’s Charter School Act is to allow flexibility to innovate in areas such as scheduling, personnel, funding, and educational programs to improve student outcomes and academic achievement of “at-risk” student populations. A Washington charter public school is a public school that is not a common school. Rather it is a public alternative to traditional common schools. The first public charter schools began operating in Washington in fall, 2016. Annually, the State Board of Education, in collaboration with the Charter School Commission, issues a report to the Governor, the Legislature, and the public, in accordance with RCW 28A.710.250. This is the second annual report, and as such, the findings and analysis presented here should be considered preliminary. The annual report must include:
The performance of the state's charter schools during the preceding school year, including a
comparison of the performance of charter school students with the performance of
academically, ethnically, and economically comparable groups of students in other public
schools;
The state board of education's assessment of the successes, challenges, and areas for
improvement in meeting the purposes of the Washington Charter Public Schools Act (RCW
28A.710), including the board's assessment of the sufficiency of funding for charter schools, the
efficacy of the formula for authorizer funding; and
Any suggested changes in state law or policy necessary to strengthen the state's charter schools.
Two authorizers – the Charter School Commission and Spokane Public Schools – authorized ten charter
public schools operating in Washington during the 2017-18 school year. Charter public school
enrollment enrolled a total of 2,352 Washington students K-12 in 2017-18. This represents
approximately one fifth of one percent (0.2%) of the total 1,116,599 K-12 public school students
enrolled in Washington’s public schools in 2017-18.
The five key findings are:
1. Five charter schools posted results that were similar to or better than the statewide average performance in Washington.
2. Seven charter schools posted results that were similar to or better than the home school1
district.
3. Statewide charter school students perform about the same as demographically similar non-
charter students on the ELA, math, and science assessments.
4. At nearly every grade level and in ELA, math, and science, charter school students perform
about the same as demographically similar non-charter school students.
5. Statewide, charter school students posted student growth percentiles similar to or higher than
the non-charter school students in all grades for both ELA and math.
This annual report contains an assessment of the successes, challenges, and areas for improvement in
meeting the purposes of the Washington Charter Public Schools Act (RCW 28aA.710), including the State
1 The home school district is defined as the district in which the charter school is physically located. In some cases charter schools draw students from multiple districts.

5
Board of Education’s assessment of the sufficiency of funding for charter schools, and the efficacy of the
formula for authorizer funding.
This report identifies the following successes:
Constitutionality and strength of the Washington’s Charter School Act;
Charter public schools are serving a higher share of many of the student groups prioritized in the
law;
Charter public school authorizers and other state agencies (SAO, OSPI, SBE) have established
comprehensive academic, financial, and organizational frameworks and protocols for high levels
of charter public school accountability; and
The True Measure Collaborative (TMC) offers centralized expertise and supports that promote
compliant, effective, and innovative practices for meeting the needs of students faced with
barriers to academic achievement, including those with disabilities.
This report identifies the following challenges for charter schools:
The current funding model, in which students in charter public schools receive significantly
lower total public funding than students in non-charter public schools, makes sustainability
challenging;
Lack of access to capital funding for Washington charter public schools exacerbates the funding
challenges. Charter public schools spend approximately ten percent of their basic education
state funding on facilities; and
Like all public schools in Washington, the funding model for students with Individualized
Education Plans and the shortage of high-quality special education (SPED) teachers in our state
present challenges for charter public schools.
While it is early in the implementation of this law, the report identifies recommendations to improve
the law governing charter public schools from the state Charter School Commission, from Spokane
Public Schools, and from SBE, with consensus around the following recommendations:
Increase the per-student state funding for students with an Individualized Education Plan (IEP).
Make changes to the Charter School Act (RCW 28A.710) to clarify language and align the Act to
the state’s updated accountability system.
Change approval (of an admission policy) “by the commission” to “by the authorizer” (to reflect
multiple authorizers in Washington).
Change annual report dates – from November 1st (authorizers’ reports to SBE) and December
1st (SBE’s report to the Governor and Legislature) – to later dates that allow authorizers and the
SBE to access and utilize financial and academic performance data, and enables SBE to
incorporate them into one comprehensive annual charter schools report that addresses all
information required by RCW 28A.710.250.
Review the adequacy and efficiency of the authorizer oversight fee for the purpose of
determining whether the formula should be adjusted in order to ensure fulfilling the purposes
of chapter 28A.710 RCW, in accordance with RCW 28A.710.110(2).
Explore and consider alternative language for “at risk” which is used throughout the charter
school act to denote “the types of students” charter schools are to prioritize; “at risk” is
pejorative and misaligned with SBE’s equity statement and lens.

6
Introduction Research Context
National: Since the inception of public charter schools, dueling research has abounded, much of it biased
based on the philosophical support or opposition of the charter school concept. Drawing broad
conclusions about the academic achievement of charter school students across the nation is challenging,
as results vary from state to state, by school level, by presence and nature of a management
organization, and other structural variables, and results differ for specific student groups.
The Center for Research on Education Outcomes (CREDO) is one of the most credible and prolific
entities researching charter schools. In 2013, CREDO published the results of a nationwide study of the
academic performance of students attending charter schools. The overall takeaway from the National
Charter School study was that on average, students attending charter schools exhibit the equivalent of
eight additional days of learning in reading and the same days of learning in math per year compared to
their non-charter school peers. Black students, students in poverty, and English learners appear to
benefit from attending charter schools. However, like traditional public schools, charter school quality is
uneven across the states and across schools.
Washington-specific: Over the past year, 2017-2018, CREDO has conducted a study on Washington State
Charter Schools. SBE is issuing this report at the same time that CREDO is finalizing its analysis of the
performance of Washington charter schools in 2012-2017. The CREDO report follows a rigorous design
the organization has utilized for a number of charter school studies, including the National Charter
School Study (2013). The findings of the CREDO study of Washington charter schools will be publicly
released in January, 2019.
Two other studies specific to charter schools in Washington state have been released in 2018; one by
the Center for Reinventing Public Education (CRPE), “Are Washington Charter Public Schools Serving
Students with Disabilities” and one by the State Auditor’s Office (SAO), “Charter School Accountability
and Opportunities for Collaboration.” CRPE finds that “Looking at Washington within the national
context, Washington’s charter schools appear to serve students with disabilities at a substantially higher
rate than the national charter school average (16.1 percent versus 10.6 percent) and at a higher rate
than the Washington state average (12.4 percent). They are also serving a wide range of disabilities,
including students with high needs, and serving a majority in a mostly inclusive environment. There is no
evidence of push out or counseling out, and in a number of schools there are enrollment increases in
special education midyear as more students transfer in.” SAO finds that “When compared to the rest of
their local school districts, almost all charters enrolled higher percentages of low-income students,
students of color, and students with disabilities, though most enrolled a smaller percentage of English
language learners.”
Charter Schools in Washington Washington State’s Charter School Act (RCW 28A.710) was enacted on April 3, 2016. The primary purpose of Washington’s Charter School Act is to allow flexibility to innovate in areas such as scheduling, personnel, funding, and educational programs to improve student outcomes and academic achievement of “at-risk” student populations. A Washington charter public school is a public school that is not a common school, rather it is a public alternative to traditional common schools. A charter public school must be a Washington nonprofit public benefit corporation with federal tax exempt status under section

7
501(c)(3) of the IRS code, and must be nonsectarian and nonreligious. A charter public school is governed by a nonprofit board according to the terms of a renewable, five-year performance-based charter contract executed with an approved authorizer that contains at least the 32 elements required by RCW 28A.710.130; all charter school board members and Washington Charter School Commission members must file annual personal financial affairs statements with the Public Disclosure Commission (PDC). Washington charter public schools are open to all children free of charge and by choice, with admission based only on age group, grade level, and school enrollment capacity. Washington charter public schools are subject to the supervision of the OSPI and SBE, including accountability measures and the performance improvement goals adopted by SBE, to the same extent as other public schools, must provide a program of basic education, and participate in the statewide student assessment system. Charter teachers meet the same certification requirements as traditional public school teachers,
including background checks. Charter schools comply with local, state, and federal health, safety,
parents' rights, civil rights, Individuals with Disabilities Education Improvement Act, Elementary and
Secondary Education Act, and nondiscrimination laws applicable to school districts.
The first public charter schools began operating in Washington in fall, 2016. Now the state has had operating charter schools for two school years: 2016-2017 and 2017-2018. RCW 28A.710.250 directs the State Board of Education, in collaboration with the Charter School Commission, to issue an annual report to the Governor, the Legislature, and the public. This is the second annual report. The annual report must include:
I. The performance of the state's charter schools during the preceding school year, including a comparison of the performance of charter school students with the performance of academically, ethnically, and economically comparable groups of students in other public schools;
II. The state board of education's assessment of the successes, challenges, and areas for
improvement in meeting the purposes of the Washington Charter Public Schools Act (RCW 28A.710), including the board's assessment of the sufficiency of funding for charter schools, the efficacy of the formula for authorizer funding; and
III. Any suggested changes in state law or policy necessary to strengthen the state's charter
schools. RCW 28A.710.250(2) stipulates that the annual report must be based on the reports submitted by each
authorizer as well as any additional relevant data compiled by the state board of education. The two
current charter public school authorizers in the state, the Charter Schools Commission and Spokane
Public Schools, submitted annual reports to the State Board of Education in early November. In
accordance with RCW 28A.710.100(4) and WAC 180-19-210, annual authorizer reports include the
status of the authorizer’s charter school portfolio, the authorizer's strategic vision for chartering and
progress toward achieving that vision, and the academic and financial performance of all operating
charter schools under its jurisdiction, including the progress of the charter schools based on the
authorizer's performance framework. Certain information from these two authorizer reports is
incorporated into this SBE annual report. Both complete annual reports are posted on SBE’s website:
Washington State Charter School Commission’s 2017-2018 Annual Charter School Authorizer Report Spokane Public Schools’ 2017-2018 Annual Charter School Authorizer Report

8
Two authorizers – the Charter School Commission and Spokane Public Schools – authorized ten charter public schools operating in Washington during the 2017-18 school year, growth of two schools compared to 2016-17 (Table 1). Table 1: 2017-2018 Operating Charter Schools
School Name Authorizer Location Grades Served
Enrollment
Green Dot Excel State Charter School Commission
Kent 7-9 169
Green Dot Destiny State Charter School Commission
Tacoma 6-8 239
Green Dot Rainier Valley Leadership Academy (RVLA)
State Charter School Commission
Seattle 6 103
PRIDE Prep Spokane Public Schools Spokane 6-9 396
Rainer Prep State Charter School Commission
Seattle 5-8 322
SOAR State Charter School Commission
Tacoma K-3 139
Spokane International Academy Spokane Public Schools Spokane K-8 406
Summit Atlas State Charter School Commission
Seattle 6 and 9 156
Summit Olympus State Charter School Commission
Tacoma 9-11 142
Summit Sierra State Charter School Commission
Seattle 9-11 280
Charter public school enrollment grew by 455 students over 2016-17, enrolling a total of 2,352
Washington students K-12 in 2017-18. This represents approximately one fifth of one percent (0.2%) of
the total 1,116,599 K-12 public school students enrolled in Washington’s public schools in 2017-18.
The demographics of students enrolled in charter schools during the 2017-2018 school year are
delineated in Table 2. Eight of the ten charter schools served higher percentages of students of color
and students in poverty than did their “home districts;” the other two served similar demographics to
those in their “home districts.” Nine of the ten charter schools served higher percentages of Black
students than the state average; eight of the ten served higher percentages of students living in poverty
than the state average; charter schools served students with disabilities at a higher rate than the
Washington state average; seven of the ten served lower percentages of English Learners than the state.

9
Table 2: 2017-2018 Charter School Student Demographics A
me
rica
n In
dia
n/
Ala
skan
Nat
ive
Asi
an
Bla
ck/A
fric
an
Am
eri
can
His
pan
ic/L
atin
o
Nat
ive
Haw
aiia
n/
Pac
ific
Isla
nd
er
Wh
ite
Two
or
Mo
re R
aces
Engl
ish
Lea
rner
s
FRP
L El
igib
le
Stu
den
ts w
ith
IEP
s
Rainier Prep 0.3 9.0 35.5 28.1 0.9 18.5 7.8 28.3 77.3 10.6
Highline SD 0.9 14.5 14.1 38.5 4.0 22.0 6.1 27.9 62.5 15.9
Excel 0.0 6.2 44.7 8.7 0.6 32.3 7.5 12.6 51.5 15.0
Kent SD 0.3 19.1 11.9 22.6 2.6 33.7 9.7 21.1 48.8 11.4
Atlas 0.0 3.3 30.9 17.1 0.0 35.4 13.3 7.5 47.8 16.0
Rainier Valley 0.9 2.8 76.6 5.6 0.0 10.3 3.7 20.2 68.3 14.4
Sierra 1.7 10.4 40.7 8.8 0.0 26.3 12.1 7.8 41.8 17.5
Seattle SD 0.5 14.1 14.9 12.1 0.5 47.1 10.8 12.5 31.8 15.1
Pride Prep 5.8 1.8 9.6 2.5 1.3 72.5 6.6 0.0 48.9 15.1
SIA 0.5 1.7 2.0 10.8 0.0 69.7 15.3 1.8 38.1 10.6
Spokane SD 1.2 2.6 3.3 10.3 1.6 67.9 13.0 6.4 55.7 17.4
Destiny 2.2 1.8 26.3 23.7 5.4 22.3 18.3 7.4 71.1 21.1
Olympus 1.8 3.6 19.2 29.3 2.4 30.5 13.2 7.3 70.9 19.8
SOAR 1.7 0.6 31.1 17.2 2.2 19.4 27.8 6.4 70.7 17.1
Tacoma SD 1.2 9.4 14.9 20.3 3.0 39.3 11.9 11.2 56.1 15.1
Washington 1.4 7.7 4.4 23.1 1.1 54.4 8.0 11.5 42.4 14.1
Note: School values exceeding district average values are highlighted in bold text.

10
Section I: 2017-2018 Charter School Performance
This section of the annual report provides a comparison of the performance of charter school students
with the average results for the home district and the state, and with the performance of academically,
ethnically, and economically comparable groups of students in other public schools, in accordance with
RCW 28A.710.250(2). In other words, the state law requires that the charter school performance be
conducted through two distinct analyses:
A. An analysis of the academic performance or achievement of students at charter schools
compared to students in the home district and the state, and
B. A comparison of the academic performance of students at charter schools to similar non-charter
school students.
Summary of Results The preliminary results and findings of the data1 analysis are best characterized as mixed. Some of the
charter schools performed higher, some performed similarly, and some performed lower than the
“home district” or state on the ELA, math, or science assessments (Table 3). For the average scale score
comparisons in this report, “similar” means the researcher must conclude that the average scores
(means) do not significantly differ and the performance is statistically similar. “Mixed”, as used here,
means the charter school was statistically similar to or outperformed the home district or state in either
ELA or math.
The five key findings are summarized as follows: 1. Five charter schools posted results that were similar to or better than the statewide average
performance in Washington. 2. Seven charter schools posted results that were similar to or better than the results for the home
school district.
3. Statewide charter school students perform about the same as demographically similar non-
charter students on the ELA, math, and science assessments.
4. At nearly each grade level and in ELA, math, and science, charter school students perform about
the same as demographically similar non-charter school students.
5. Statewide, charter school students posted student growth percentiles similar to or higher than
the non-charter school students in all grades for both ELA and math.
Methodology To meet the requirements of RCW 28A.710.250(2), SBE conducted a two part study.
Part A is comprised of analyses on the academic performance or achievement of students at charter
schools. For each charter school, the 2018 school demographics taken from the Washington report card
are presented in a summary table that includes demographic data for the charter school, the home
district, and the state. The charter school student performance data (mean scale score and mean scale
score difference by content area and by grade level) is presented in summary tables with accompanying
descriptive text.
Part B comprises the comparison of the academic performance of students at charter schools to similar
non-charter school students. This analysis required the construction of a control group from which to

11
make the comparison of student groups (Exhibit A). The charter school student performance data (mean
scale score and mean scale score difference by content area and by grade level) compared to results
from similar non-charter school students are presented in summary tables with accompanying
descriptive text.
Between late September and mid-December, the Office of the Superintendent of Public Instruction
(OSPI) Office of School Information provided the SBE with separate de-identified student enrollment,
assessment, absence, and discipline data files for the 2017-18 school year to complete the required
analyses.
The findings in Part B are derived solely from the SBA ELA and math and the WCAS science assessments
for the charter school and non-charter school student groups. Group differences were evaluated using
the Independent Samples t-Test and the group differences are reported as follows.
A statistically similar performance between groups is where a t-test of the group means resulted
in a value of p > 0.050. In this case, the null hypothesis of no difference between the means
cannot be rejected. In other words, the researcher must conclude that the means do not differ
and the performance is statistically similar.
A statistically different performance between groups is where a t-test of the group means
resulted in a value of p ≤ 0.050. In this case, the null hypothesis of no difference between the
means is rejected. The researcher concludes that the means differ and the performance is
described as statistically different.
This work primarily relies on the statewide assessments in ELA and math developed by the Smarter
Balanced Assessment consortium (SBAC). Based on the items answered correctly, a scale score of
approximately 2300 to 2800 is assigned to each student. A scale score of approximately 2425 to 2675
(depending on grade level and content area) is required to meet standard or be deemed as proficient.
On the science assessments, scale scores range from approximately 340 to 1190 and a scale score of 700
is required to meet standard or be deemed as proficient. Because the range of scale scores differs by
grade level, it is necessary to evaluate for scale score differences by grade level. If scores are aggregated
to the school-level or to the student group level, it is essential that the number of records for each grade
level are factored into the finding.
In addition to the average scale score by group, the scale score mean difference is reported and
provides the most meaningful measure of charter school student performance in comparison to the
non-charter school student performance. The mean difference is reported as the value for the non-
charter school group minus the value for the charter school group. A negative mean difference indicates
that the mean scale score for the comparison group (charter school students) was higher than the mean
scale score for the control group (non-charter school students). A positive mean difference indicates
that the mean scale score for the comparison group (charter school students) was lower than the mean
scale score for the control group (non-charter school students).
The Independent Sample t-Test was conducted to determine whether the comparison group (charter
school students) performed differently than the control group (non-charter school students) on the
statewide ELA, math, and science assessments. For the analyses in Part B, the comparison and control
groups are aggregated from all of the charter schools. In other words, all of the charter school students

12
are combined into one large group to assess for overall group differences. The results of the t-tests are
summarized in Table 3.
Limitations
The findings presented here and elaborated upon should be considered preliminary, as this is only SBE’s
second annual report assessing the performance of charter schools and charter school students. Also,
the SBE Board has requested staff to conduct additional analyses which may be included in future
reports. SBE Board requests include but are not limited to the following analyses:
Performance on the early learning assessment (Washington Kindergarten Inventory of
Developmental Skills) by charter school students and similar students,
Differences in performance based on gender,
Differences in performance based on race/ethnicity and subethnicity,
Differences in performance based on program participation, and
Comparison of performance to the school the charter school student came from.
Please be advised that this report elaborates on the performance of charter schools through the use of
de-identified student results from the 2017-18 school year only. The SBE is expected to receive
additional school performance results subsequent to issuing this report and plans to analyze the 2016-
17 assessment results in a similar manner. As such, it would be premature to make a judgement about
the performance of the charter schools until multiple years of results (five years) are available.
Another limitation of this work centers on the fact that only ten charter schools are reported upon here
and the results for approximately 1400 students are included in this initial analysis. Additional charter
schools are expected to be authorized in the coming years and the overall enrollment of the charter
schools is expected to increase. The meaningfulness of the statistical analyses would be enhanced with
the larger student counts and additional schools.
Part A: Performance of Students at Charter Schools Table 3: Summary showing how the charter school, home school district, or state scored in relation to each other on the statewide ELA, math, and science assessments.
Charter School Demographics
Charter School vs. Home District
Average Scale Scores Charter School vs.
Home District
Average Scale Scores Charter School vs.
Washington
Green Dot Destiny Higher percentages of students of color and students in poverty
Destiny Performed Lower
Destiny Performed Lower
Green Dot Excel
Higher percentages of students of color; similar percentages of students
in poverty
Excel Performed Similar*
Excel Performed Lower
Green Dot Rainier Valley
Higher percentages of students of color and students in poverty
Rainier Valley Performed
Lower
Rainier Valley Performed
Lower

13
Charter School Demographics
Charter School vs. Home District
Average Scale Scores Charter School vs.
Home District
Average Scale Scores Charter School vs.
Washington
Pride Prep Similar
Demographics Mixed* Results
Pride Prep Performed Lower
Rainier Prep Higher percentages of students of color and students in poverty
Rainier Prep Performed
Higher
Rainier Prep Performed Higher
SOAR Higher percentages of students of color and students in poverty
SOAR Performed Lower
SOAR Performed Lower
Spokane International Academy
Similar Demographics
Spokane International Performed Higher
Spokane International Performed Higher
Summit Atlas Higher percentages of students of color and students in poverty
Atlas Performed Similar*
Atlas Performed Higher
Summit Olympus Higher percentages of students of color and students in poverty
Olympus Performed Similar*
Mixed* Results
Summit Sierra Higher percentages of students of color and students in poverty
Mixed* Results Sierra Performed
Higher
*For the average scale score comparisons in this figure, “similar” means the performance is statistically similar.
“Mixed” means the charter school was statistically similar to or outperformed the home district or state in either
ELA or math.
Part B: Performance of students at charter schools to similar non-charter school students. On the statewide ELA and math assessments, the comparison group (charter school students)
performed no differently than the control group (non-charter school students). On the science
assessment, the average scale score for the comparison group was a little higher than the average scale
score for the control group (Table 4).
Table 4: Scale Score Comparison Charter School Students with Non-Charter School Students.
Assessment Students in each Group
(N)
Mean Scale Score Comparison Group Charter Students
Mean Scale Score Control Group
Non-Charter Students
Mean Scale Score Difference*
ELA 1405 2543.3 2545.6 2.25
Math 1405 2531.7 2532.8 1.08
Science 470 684.7 678.1 -6.52
*Note: the mean difference is reported as the value for the non-charter school group minus the value for the charter school group. A negative mean difference indicates that the mean scale score for the comparison group (charter school students) was higher than the mean scale score for the control group (non-charter school students). A positive mean difference indicates that the mean scale score for the comparison group (charter school students) was lower than the mean scale score for the control group (non-charter school students)
On the student growth percentiles (SGPs), the comparison group (charter school students) performed similarly to the control group (non-charter school students) on the ELA SGPs but differently on the math

14
SGPs (Table 5). In ELA, both groups demonstrated a little more than one year of academic growth. In math, the charter school students demonstrated on average more than one year of academic growth, while the non-charter school students demonstrated a little less than one year of academic growth. Table 5: Student Growth Percentile Comparison Charter School Students with Non-Charter School Students.
Assessment Students*
(N)
Mean SGP Comparison Group Charter Students
Mean SGP Control Group
Non-Charter Students
Mean SGP Difference*
ELA 1091/1019 52.5 51.8 -0.72
Math** 1091/1018 52.1 48.4 -3.67 *Note: shows the number of student records for the control/comparison group. **Note: the double asterisk
denotes the assessments where the group performances were statistically different.
Section II – Meeting the purposes of Washington’s Charter Schools Act (RCW 28A.710) 28A.710.250 directs the SBE to include in this annual report its assessment of the successes, challenges, and areas for improvement in meeting the purposes of the Washington Charter Public Schools Act (RCW 28aA.710), including the Board's assessment of the sufficiency of funding for charter schools, and the efficacy of the formula for authorizer funding. Regarding the legal context, it is significant to note here that the two major pertinent lawsuits pending at the time the 2017 report was issued have now been resolved by the Washington Supreme Court. On June 7, 2018, in McCleary v. State, the Supreme Court ruled that the state had fully implemented its new plan that meet its constitutional obligation to amply fund a uniform system of basic education by 2018, lifted the contempt order and sanctions, and ended their oversight of the case. On October 25, 2018, in El Centro v. State, the Supreme Court issued its ruling upholding the constitutionality of the Charter Schools Act (RCW 28A.710). Successes:
1. The fact that the State Supreme Court has found Washington’s Charter School Act constitutional
is a testament to the strong law the Legislature has created. Washington’s law draws on over 20
years of lessons learned and best practices nationally. Both the National Alliance for Public
Charter Schools and the National Association of Charter School Authorizers ranked
Washington’s law as one of the strongest charter school laws in the country.
2. Charter schools are serving a higher share of many of the student groups prioritized in law,
particularly students with IEPs and students in low-income families.
3. Charter public school authorizers and other state agencies (SAO, OSPI, and SBE) have established comprehensive academic, financial, and organizational frameworks and protocols for high levels of charter public school accountability. SAO found that “Performance frameworks maintained by both of Washington’s charter school authorizers align with state laws and leading practices.”
4. This system allows for swift interventions and corrective action in instances of charter school non-compliance with their performance-based charter contract
5. The True Measure Collaborative (TMC) was formed in 2015 in response to emerging charter
schools’ commitment to providing the highest quality educational experience for their students,

15
including those with disabilities. The TMC was envisioned as a resource and partner to charter
schools, offering centralized expertise and resources around delivery of special education
services that build on and enhance the collective impact of partner schools. Launched as a
collaboration between the Washington State Charter Schools Association, Seneca Family of
Agencies, and the Puget Sound Educational Service District, the True Measure Collaborative
includes all 10 charter public schools. The True Measure Collaborative serves as a full partner to
member charter schools, offering robust, centralized expertise and supports that promote
compliant, effective, and innovative practices for meeting the needs of students faced with
barriers to academic achievement, including those with disabilities.
Challenges:
1. The current funding model, in which students in charter public schools receive significantly
lower total public funding than students in non-charter public schools, makes sustainability
challenging;
2. Lack of access to capital funding for Washington charter public schools exacerbates the funding
challenges. Charter public schools spend approximately ten percent of their basic education
state funding on facilities; and
3. Like all public schools in Washington, the funding model for students with Individualized
Education Plans and the shortage of high-quality special education (SPED) teachers in our state
present challenges for charter public schools.
Areas for Improvement: See Section III for potential law and policy changes. Funding sufficiency for charter schools: In terms of the sufficiency of funding for charter schools, this is a complex issue with many legal,
political, and practical aspects. While the Washington State Supreme Court did determine that the state
is meeting its constitutional paramount duty in funding a basic education for its K-12 students, many
educators and stakeholders continue to contend that public funding is insufficient. The legislature has
acted in recent years to increase state funding and eliminate district’s reliance on local levy funds for
basic education, reserving local levy funds exclusively for enrichment. Nevertheless, many districts still
rely on local levy funds to support basic education services, including special education.
RCW 28A.710.030(3) does not entitle public charter schools to receive local levy funds. The legislature
intends that state funding for charter schools be distributed equitably with state funding provided for
other public schools (RCW 28A.710.280(1)). So while state K-12 funding may be distributed equitably to
charter public schools, they are not entitled to any local levy funds, nor do they have access to facilities
or capital bonds, as do traditional public schools. Charter public schools must spend approximately ten
percent of their basic education state funding on facilities.
These regulatory realities create a funding gap in which public charter schools receive less public funding
than traditional public schools. Utilizing OSPI’s Multi-Year Budget Comparison tool and accounting for
the exclusion of local levy funds, the per student funding gap between Washington students in charter
public schools and students in traditional public schools in 2017-2018 ranged from $1,991 to $4,206. In
2018-2019 the gap is projected to be between $2,220 and $3,400 per charter school student. Over the

16
next four years, the McCleary fix does slightly narrow the funding gap by raising the state share and
limiting the local levies. If the legislature revisits local levies this session and increases the levy lid, then
the gap would likely increase again. SBE urges the Legislature and Governor to continue moving toward
sufficient and equitable funding for all Washington public schools.
Efficacy of the funding for charter school authorizers: In accordance with RCW 28A.710.110, SBE has, through rule-making, established a statewide formula for an authorizer oversight fee, with a sliding scale based on number of schools authorized, not to exceed four percent of each charter school’s annual funding (WAC 180-19-060). State law (RCW 28A.710.110(4)) stipulates that an authorizer must use its oversight fee exclusively for
the purpose of fulfilling its charter school authorizing duties (under RCW 28A.710.100). According to its
2016-17 and 2017-18 annual authorizer reports to SBE, Spokane Public Schools consistently does not
expend all of its authorizer fee funds on authorizing duties. For the 2017-2018 year, Spokane Public
Schools collected a total of $291,785 in authorizing fees ($154,285 from PRIDE Prep and $137,500 from
Spokane International Academy); the district expended $238,050, leaving an “un-spendable” balance of
$53,735. The district defers such balances to the subsequent fiscal year to be used only for allowable
authorizer expenses. Exploring other possibilities for this balance would be worthwhile.
The Charter School Commission currently authorizes ten or more schools, thus its authorizer fee rate is
three percent. Spokane Public Schools – and any other district that might become an authorizer in the
foreseeable future – authorizes fewer than ten, thus has a four percent authorizer fee. This one percent
fee differential could incentivize charter school developers to seek authorization by the Commission
rather than a local district. One possibility that may be worth exploring would be whether the
authorizer fee structure should be based on number of schools or number of students.
For both of these reasons, SBE will, during the 2018-2019 school year, review the adequacy and
efficiency of the authorizer oversight fee for the purpose of determining whether the formula should be
adjusted in order to ensure fulfilling the purposes of chapter 28A.710 RCW, in accordance with
RCW 28A.710.110(2), and to make any adjustments through rule-making.

17
Section III - Recommended changes to state law or policy The Charter School Commission has identified a number of statutory changes it would like to see, through a combination of its annual authorizer report and current advocacy platform, specifically:
Charter School Commission Recommendations
Special Education: Increase the per-student state funding for students with an Individualized Education Plan (IEP)
Charter School Act Improvements: Make changes to the Charter School Act (RCW 28A.710) to clarify language and align the Act to the state’s updated accountability system.
Charter School Facility Support: Allocate state resources and develop a clear and transparent process to support charter public school facility acquisition and improvements.
Washington State Charter School Commission Agency Administration: Provide for a statutory executive director of the Washington State Charter School Commission.
28A.710.050(3): Change approval (of an admission policy) “by the commission” to “by the authorizer” (since the Commission is not the only authorizer).
28A.710.250(1): Change annual report dates – from November 1st (authorizers’ reports to SBE) and December 1st (SBE’s report to the Governor and Legislature) – to later dates that allow authorizers and the SBE to access and utilize financial and academic performance data, and enables SBE to incorporate them into one comprehensive annual charter schools report that addresses all information required by RCW 28A.710.250(2).
Spokane Public Schools has also identified, in its annual report to SBE, potential changes to RCW 28A.710 that the district believes would strengthen the state’s charter schools and authorizing practices.
Spokane Public Schools Recommendations
28A.710.050(3): Change, “approved by the commission” to “approved by the authorizer,” which appears to be the intent of the provision, since the Commission is not the only authorizer.
28A.710.100(b): In “The academic and financial performance of all operating charter schools,” insert “organizational.” Adding organizational will better align this statute to the “board performance and stewardship” in .170(2)(h) and creates consistency with NACSA’s Principles & Standards (required in this section) and with current practice.
28A.710.150(3): Amend (3) to eliminate the "race to the finish line" for notice to SBE by authorizers of approved charters for certification. Change "If the board receives simultaneous notification" to "if the board receives notification in any year."
28A.710.250(1): Change “By December 1st of each year” to a later date to enable the authorizer annual reports and the SBE annual report to include graduation and WaSIF data.
SBE recommends further exploration of these issues, along with the issues specified in Section II related to both charter school and authorizer funding and others related to strengthening RCW 28A.710 and its implementation.

18
State Board of Education Recommendation
SBE recommends further exploration of the Charter School Commission and Spokane Public School recommendations. Further, SBE recommends exploring alternative language for “at risk” which is used throughout the charter school act to denote “the types of students” charter schools are to prioritize. Language evolves; language around equity, opportunity, access, and achievement for specific student populations certainly is evolving, raising the question as to whether “at risk” is the most appropriate terminology.
This recommendation stems from the extensive efforts SBE has undertaken related to equity issues over the past two years. In January 2018, the Board adopted an Equity Statement, and subsequently an Equity Lens to use in its policymaking and other decision making. SBE’s newly adopted five-year strategic plan prioritizes equity and embeds it throughout the plan. SBE’s Equity Statement: The Washington State Board of Education has committed to using equity as a guiding principle in its decision-making related to its statutory charges, strategic planning, and in developing annual policy proposals for consideration by the Washington State Legislature and Governor. The Washington State Board of Education is committed to successful academic attainment for all students. Accomplishing this will require narrowing academic achievement gaps between the highest and lowest performing students, as well as eliminating the predictability and disproportionality in student achievement outcomes by race, ethnicity, and adverse socioeconomic conditions. The Board acknowledges that historical and ongoing institutional policies, programs, and practices have contributed to disparate and statistically predictable educational outcomes. To address persistent inequities within our educational system the Board will work collaboratively with educational and community partners to:
Ensure that educational equity is a shared priority and is viewed as a process to identify, understand, and eliminate institutional policies, practices, and barriers that reinforce and contribute to disparate and predictable educational outcomes;
With transparency and humility, honor and actively engage Washington’s underserved communities as partners in developing and advocating for equitable educational policies, opportunities, and resources for marginalized students; and
Using equity as a lens, engage in a continuous, collective process of policymaking to ensure Washington’s education system can meet the needs of all students today and into the future.
“At risk” connotes a defect in the person, and implies that certain student characteristics are defects. This stems from a deficit approach to people rather than an asset-based approach. SBE would contend that the educational system has deficits, not the students in the system, and the systemic defects result in predictable and disparate access to opportunities and academic outcomes for students with certain characteristics. Data consistently reveals that race is the primary predictor of academic achievement, more so than poverty or any other factor. Not all students of color are in low income families, have special education needs, or meet the other criteria specified in the Charter School Act’s definition of an “at risk student” in RCW 28A.710.010(2): “At-risk student" means a student who has an academic or economic disadvantage that requires assistance or special services to succeed in educational programs. The term includes, but is not limited to, students who do not meet minimum standards of academic proficiency, students who are at risk of dropping out of high school, students in chronically low-performing schools, students with higher than average disciplinary sanctions, students with lower participation rates in advanced or gifted programs, students who are limited in English proficiency,

19
students who are members of economically disadvantaged families, and students who are identified as having special educational needs. While race is not included on this list of risk factors, some of these descriptors could be construed as inappropriate proxies for race. Students of color are vulnerable within our public school system – not because having black or brown skin is a defect, and not because of a legitimate correlation between race and special education, discipline, under-representation in gifted programs, etc. – but because of the implicit racial bias that exists in the public education system. “Systemically underserved” may be more suitable verbiage. If the legislature takes the Charter School Act under review, SBE would recommend reconsidering the “at risk” language and would work collaboratively with the legislature, the Educational Opportunity Gap Oversight and Accountability Committee, the Charter School Commission, district charter authorizers, and the Office of Superintendent of Public Instruction in an effort to identify better terminology to recommend the Legislature use to replace “at risk.” During the current fiscal/school year, SBE will continue to collect and analyze data related to charter public schools and the potential changes identified herein.

20
Exhibit A: Detailed Performance Analysis
Part A: Performance of the Charter Schools An extensive body of educational research supports the notion that student educational achievement
and outcomes are highly correlated with student characteristics that include but are not limited to
race/ethnicity, household income level, home language, and participation in special education (National
Assessment of Educational Progress, 2018). Because of this association, statistical modelling would
predict that any school serving a student population differing from the home district or state would post
educational outcomes different from the home district or state. The mixed results presented below
may be in part due to the different characteristics of the student populations between the charter
school, home district, and the state.
In a pioneering study, Zimmer and others (2009) published Charter Schools in Eight States: Effects on
Achievement, Attainment, Integration, and Competition. The research dispelled the fear that charter
schools were skimming off the highest achieving students. The authors showed that overwhelmingly,
the prior test scores of students transferring into charter schools were near or below the local averages.
Also, that the prior achievement of the students transferring to charter schools did not differ
substantially from other students in the non-charter school from where they left. The work also found
that the racial composition of the charter schools entered by transferring students was similar to that of
the non-charter school from which the students previously attended. In a meta-analysis of 22 studies
(Anderson, 2017), the researcher concluded that charter schools as a whole tend to serve fewer special
education students and English language learners. In a study of the Washington charter schools, the
researchers found that Washington charter schools served students with a disability at a substantially
higher rate than the national charter school rate, higher than the state rate, and mostly higher than the
home district rate. Like the national studies, there is no evidence of systematic “cream-skimming” or
“push-out” in Washington charter schools. Over all, there is very little evidence of systematic “cream-
skimming” or “push-out” in U.S. charter schools. The results presented below show that the enrollees at
charter schools are generally more racially diverse and serve higher percentages of students from low
income households.
For the ten charter schools assessing students in at least one of the assessed grade levels, three tables
and related text are provided to frame the performance or achievement of the students at a school. The
three tables for each school are as follows:
1. School demographics in comparison to the home school district and Washington,
2. The performance on the state assessments by the charter school students in comparison to the
performance by the non-charter school students in Washington by grade level, and
3. The performance on the state assessments by the charter school students in comparison to the
performance by the non-charter school students in the home school district by grade level.
Green Dot – Destiny Middle School The Green Dot Destiny Middle School (Destiny MS) is physically situated within the boundaries of the
Tacoma School District. Destiny MS serves a higher percentage of students of color, low income, and
special education students than the Tacoma SD and the state (Table 6). In May 2018, the Washington
Report Card showed Destiny MS with an enrollment of 242 students in the 6th through 8th grades. The
Destiny MS enrollment is approximately 26.3 percent Black/African American, which is nearly double the
rate of the Tacoma SD and six times the rate for the state. Destiny MS also serves American

21
Indian/Native Alaskan, Native Hawaiian/Pacific Islander, and Two or More races at a rate substantially
higher than the district and the state (Table 5). The school enrollment includes approximately 7.4
percent EL students (lower than the district and state rates), approximately 71 percent FRL students,
and 21 percent of students with a disability (both of which are higher than the corresponding rates for
the district and state).
Table 6: Destiny Middle School Demographics
Student Group Destiny MS
(%) Tacoma SD
(%) Washington
(%)
American Indian/Alaskan Native 2.2 1.2 1.4
Asian 1.8 9.4 7.7
Black/African American 26.3 14.9 4.4
Hispanic/Latino 23.7 20.3 23.1
Native Hawaiian/Pacific Islander 5.4 3.0 1.1
White 22.3 39.3 54.4
Two or More Races 18.3 11.9 8.0 Row intentionally left blank.
English Learners 7.4 11.2 11.5
Low Income (FRPL eligible) 71.1 56.1 42.4
Students with IEPs 21.1 15.1 14.1
For all content areas and for all grade levels reported on for Destiny MS, the average scale score for the
state is substantially higher than the corresponding score for Destiny MS (Table 7). The average scale
scores are described in more detail below.
The average SBA ELA scale score posted by Destiny MS is approximately 40 to 87 scale score
points lower than the corresponding measure for Washington.
For the SBA math, the average scale score for Destiny MS is approximately 60 to 96 scale score
points lower than the corresponding measure for Washington.
On the 8th grade WCAS, Destiny MS posted an average scale score approximately 37 scale score
points lower than the average for the state.
Table 7: Destiny Middle School Assessment Scores compared to State Average
Assessment
Scale Score Destiny
(M)
Scale Score Washington
(M)
Scale Score Mean (M)
Diff.* 6th Grade ELA 2498.9 2538.9 40.0
7th Grade ELA 2481.6 2568.6 87.0
8th Grade ELA 2523.7 2584.9 61.2 Row intentionally left blank.
6th Grade Math 2481.0 2540.9 59.9
7th Grade Math 2462.1 2558.2 96.1
8th Grade Math 2485.2 2576.2 91.0 Row intentionally left blank.
8th Grade Science 664.5 701.4 36.9

22
*Note: the positive value of the scale score mean difference means the average scale score for the charter school
students was lower than the average scale score for the non-charter school students.
In all the grade levels on the statewide assessments in ELA, math, and science, the Tacoma SD scored
higher than the Destiny MS (Table 8). Statistically significant differences were identified for the 7th and
8th grades. The results are described as follows:
On the SBA ELA, the Destiny and Tacoma SD performances were similar for the 6th grade but
different for the 7th and 8th grades, with the Tacoma SD scoring higher by 55 and 32 points
respectively.
On the math assessments, the Destiny and Tacoma SD performances were similar for the 6th
grade but different for the 7th and 8th grades, with Tacoma SD scoring higher by 54 and 43 points
respectively.
For the 8th grade science assessment, the average scale score for Destiny students and the
Tacoma SD were similar.
Table 8: Destiny Middle School Assessment Scores compared to Tacoma School District.
Assessment
Destiny MS Students
(N)
Tacoma SD Students
(N)
Scale Score Destiny MS
(M)
Scale Score Tacoma SD
(M)
Scale Score Mean Diff*
6th Grade ELA 25 2192 2498.9 2513.9 14.96
7th Grade ELA** 73 1984 2481.6 2536.9 55.21
8th Grade ELA** 91 1981 2523.2 2555.2 32.01 Row intentionally left blank. Row intentionally left blank.
6th Grade Math 25 2198 2481.0 2509.1 28.08
7th Grade Math** 73 1985 2462.1 2516.4 54.29
8th Grade Math** 91 1986 2485.0 2527.6 42.67 Row intentionally left blank. Row intentionally left blank.
8th Grade Science 90 1974 662.7 673.6 10.94
*Note: the positive value of the scale score mean difference means the average scale score for the charter school
students was lower than the average scale score for the non-charter school students.**Note: the double asterisk
denotes the assessments and grades where the group performances were statistically different.
Green Dot – Excel Middle School The Green Dot Excel Middle School (Excel MS) is situated within the Kent SD boundaries and the
Washington Report Card indicates a 2018 enrollment of 167 students in the 7th and 8th grades. Excel
student population differs from the state and district populations, as the percentage of Black students
Excel serves is ten times greater than for the state (44.7 vs. 4.4 percent) and approximately four times
greater than for the district (Table 9). Excel MS served a student population rather different than the
Kent SD in general. The percentage of Black students at Excel MS is considerably higher than the
corresponding measure for Kent SD and the state. The percentages of Asian, Hispanic, and Pacific
Islanders are considerably lower than the like measures for the Kent SD and for Washington. The
percentage of English learners at Excel MS is lower than the rate for the Kent SD and the percentage of
students with a disability at Excel MS (15.0 percent) is higher than the 11.4 percent rate for the Kent SD.

23
Table 9: Green Dot Excel Middle School Demographics
Student Group Excel MS
(%) Kent SD
(%) Washington
(%)
American Indian/Alaskan Native 0.0 0.3 1.4
Asian 6.2 19.1 7.7
Black/African American 44.7 11.9 4.4
Hispanic/Latino 8.7 22.6 23.1
Native Hawaiian/Pacific Islander 0.6 2.6 1.1
White 32.3 33.7 54.4
Two or More Races 7.5 9.7 8.0 Row intentionally left blank.
English Learners 12.6 21.1 11.5
Low Income 51.5 48.8 42.4
Students with IEPs 15.0 11.4 14.1
For all the content area assessments and for all grade levels, the statewide average scale scores for
Washington were substantially higher than the corresponding scale score for Excel (Table 10). The
average scale scores are described in more detail below.
The average ELA scale score for Excel is approximately 30 to 52 scale score points lower than the
statewide average scale score for Washington in the corresponding grade levels.
For math, the scale score for Excel is approximately 40 to 66 scale score points lower than the
statewide average scale score for Washington.
On the science assessment the scale score for Excel is approximately 38 scale score points lower
than the statewide average scale score for Washington.
Table 10: Green Dot Excel Middle School Assessment Scores Compared to State Average
Assessment
Scale Score Excel (M)
Scale Score Washington
(M)
Scale Score Mean Diff.*
7th Grade ELA 2517.1 2568.6 51.5
8th Grade ELA 2555.2 2584.9 29.7 Row intentionally left blank.
7th Grade Math 2492.5 2558.2 65.7
8th Grade Math 2536.7 2576.2 39.5 Row intentionally left blank.
8th Grade Science 663.8 701.4 38.2
*Note: the positive value of the scale score mean difference means the average scale score for the charter school
students was lower than the average scale score for the non-charter school students.
For all the content area assessments and for all grade levels, the average scale scores for the Kent SD
were higher than the corresponding average scale score for Excel (Table 11). More details on the
average scale scores are presented below.
On the ELA assessment, the average scale score for Excel students was 41 points higher for the
7th grade, and similar for the 8th grade.

24
On the SBA in math, the average scale score for Excel students was similar to the average scale
score for the Kent SD non-charter school students.
On the 8th grade WCAS, the average scale score for Excel students was similar to the
corresponding measure for the Kent non-charter school students.
Table 11: Green Dot Excel Middle School Assessment Scores compared to Kent School District
Assessment
Excel MS Students
(N)
Kent SD Students
(N)
Scale Score Excel MS
(M)
Scale Score Kent SD
(M)
Scale Score Mean Diff.*
7th Grade ELA** 22 1849 2512.7 2553.4 40.69
8th Grade ELA 35 1994 2555.2 2568.1 12.87 Row intentionally left blank. Row intentionally left blank.
7th Grade Math 21 1854 2492.5 2542.8 50.32
8th Grade Math 35 1995 2536.7 2560.5 23.86 Row intentionally left blank. Row intentionally left blank.
8th Grade Science 36 1996 660.6 684.6 23.92
*Note: the positive value of the scale score mean difference means the average scale score for the charter school
students was lower than the average scale score for the non-charter school students. **Note: the double asterisk
denotes the assessments and grades where the group performances were statistically different.
Green Dot - Rainier Valley Leadership Academy The Rainier Valley Leadership Academy (Rainier Valley) is in southeast Seattle and within the Seattle SD
boundaries. Rainier Valley serves a much higher percentage of students of color and students qualifying
for the FRL program than the Seattle SD and the state (Table 12). The Washington Report Card shows
that in 2018, approximately 104 students were enrolled at Rainier Valley. Nearly 77 percent of the
students at Rainier Valley identify as Black/African American which is about five times greater than the
Seattle SD, and as a result, the remaining six race/ethnicity student groups are substantially lower than
the corresponding rates for the Seattle SD. At Rainier Valley, the percentages of English learners (20.2
percent) and low income students (68.3) is substantially higher than the comparable rates for the
Seattle SD
Table 12: Green Dot Rainier Valley Leadership Academy Demographics
Student Group Rainier Valley
(%) Seattle SD
(%) Washington
(%)
American Indian/Alaskan Native 0.9 0.5 1.4
Asian 2.8 14.1 7.7
Black/African American 76.6 14.9 4.4
Hispanic/Latino 5.6 12.1 23.1
Native Hawaiian/Pacific Islander 0.0 0.5 1.1
White 10.3 47.1 54.4
Two or More Races 3.7 10.8 8.0 Row intentionally left blank.
English Learners 20.2 12.5 11.5
Low Income 68.3 31.8 42.4
Students with IEPs 14.4 15.1 14.1

25
On the 2018 6th grade assessments in ELA and math, the statewide average scale score for Washington
was substantially higher than the average scale scores for Rainier Valley (Table 13). Details on the
assessment results are included below.
The average scale score of Rainier Valley on the ELA assessment was approximately 72 scale
score points lower than the corresponding rate for Washington.
On the 6th grade math assessment, the Rainier Valley average scale score was approximately 43
scale score points lower than the Washington average scale score.
Table 13: Green Dot Rainier Valley Leadership Academy Assessment Scores compared to State Average
Assessment
Scale Score Rainier Valley
(M)
Scale Score Washington
(M)
Scale Score Mean Diff.*
6th Grade ELA 2467.9 2538.9 72.0
6th Grade Math 2498.2 2540.9 42.7
*Note: the positive value of the scale score mean difference means the average scale score for the charter school
students was lower than the average scale score for the non-charter school students.
On the 2018 6th grade assessments in ELA and math, the average scale score for the Seattle SD was
substantially higher than the corresponding average scale scores for Rainier Valley (Table 14). The
assessment results are described below.
On the 6th grade ELA assessment, the Rainier Valley average scale score was approximately 103
scale score points lower than the corresponding measure for the Seattle SD. The mean scores
were different with the Seattle SD being higher.
On the math assessment, the mean scores were different with the Seattle SD being higher.
There was a mean scale score difference of approximately 86 scale score points.
Table 14: Green Dot Rainier Valley Leadership Academy Assessment Scores compared to Rainier Valley School District
Assessment
Excel MS Students
(N)
Seattle SD Students
(N)
Scale Score Rainier Valley
(M)
Scale Score Seattle SD
(M)
Scale Score Mean Diff.*
6th Grade ELA** 99 3817 2467.9 2570.7 102.74
6th Grade Math** 99 3818 2494.9 2581.0 86.38
*Note: the positive value of the scale score mean difference means the average scale score for the charter school
students was lower than the average scale score for the non-charter school students. **Note: the double asterisk
denotes the assessments and grades where the group performances were statistically different.
Pride Prep Middle School The Pride Prep Middle School (Pride Prep) is authorized by Spokane Public Schools and located within
the district boundaries. Pride Prep enrolled 397 students for the 2017-18 school year in the 6th, 7th, and
8th grades. Pride Prep serves a student population similar to the Spokane SD but a population less similar
to Washington (Table 15). Pride Prep serves a predominantly White (72.5 percent) group of students.
Pride Prep serves a higher percentage of Black students (9.6 percent) and American Indian students (5.8
percent) than the Spokane SD and lower percentages of Hispanic and Two or More races student
groups. The Washington Report Card shows that Pride Prep served no English learners, and percentages

26
of low income (48.9 percent) and students with a disability (15.1 percent) approximating the district
rates.
Table 15: Pride Prep Middle School Demographics
Student Group Pride Prep MS
(%) Spokane SD
(%) Washington
(%)
American Indian/Alaskan Native 5.8 1.2 1.4
Asian 1.8 2.6 7.7
Black/African American 9.6 3.3 4.4
Hispanic/Latino 2.5 10.3 23.1
Native Hawaiian/Pacific Islander 1.3 1.6 1.1
White 72.5 67.9 54.4
Two or More Races 6.6 13.0 8.0 Row intentionally left blank.
English Learners 0.0 6.4 11.5
Low Income 48.9 55.7 42.4
Students with IEPs 15.1 17.4 14.1
The Washington average scale scores for all content areas and for all grades were higher than the
corresponding scores for the Pride Prep students (Table 16). The performance comparison between
Pride Prep and the state is described below.
On the ELA assessments, the average scale scores for Pride Prep are 8.9 to 19.7 scale score
points lower than the corresponding scores for Washington.
On the math assessments, the average scale scores for Pride Prep are approximately 20 to 61
scale score points lower than the corresponding scores for Washington.
The Pride Prep average scale score for the 8th grade WCAS was approximately 15.1 scale score
points lower than the state average.
Table 5: Pride Prep Middle School Assessment Results compared to Statewide Average
Assessment
Scale Score Pride Prep
(M)
Scale Score Washington
(M)
Scale Score Mean Diff.*
6th Grade ELA 2529.6 2538.9 9.3
7th Grade ELA 2559.7 2568.6 8.9
8th Grade ELA 2565.2 2584.9 19.7 Row intentionally left blank.
6th Grade Math 2502.1 2540.9 38.8
7th Grade Math 2537.9 2558.2 20.3
8th Grade Math 2515.7 2576.2 60.5 Row intentionally left blank.
8th Grade Science 686.3 701.4 15.1
*Note: the positive value of the scale score mean difference means the average scale score for the charter school
students was lower than the average scale score for the non-charter school students.
On the ELA assessments, Pride Prep students performed similar to the Spokane SD students at all grade
levels. On the math assessments, the Spokane SD performed different and better than Pride Prep in two

27
of the three grade levels analyzed (Table 17). On the science assessment, the Spokane SD and Pride Prep
performances were similar.
On the 6th, 7th, and 8th grade SBA ELA assessments, Pride Prep posted average scale scores that
were similar to the corresponding Spokane SD average scale score.
For the math assessments, the 7th grade average scale scores were similar, but the 6th and 8th
grade average scale scores differed, with the Spokane SD scoring higher by 32 and 48 scale score
points respectively.
On the 8th grade WCAS, Pride Prep students posted an average scale score that was similar to
the Spokane SD average.
Table 17: Pride Prep Middle School Assessment Results compared to Spokane School District
Assessment
Pride Prep Students
(N)
Spokane SD Students
(N)
Scale Score Pride Prep
(M)
Scale Score Spokane SD
(M)
Scale Score Mean Diff.*
6th Grade ELA 93 2230 2529.4 2545.4 16.05
7th Grade ELA 93 2052 2559.2 2557.8 -1.43
8th Grade ELA 92 1934 2565.2 2573.9 8.67 Row intentionally left blank. Row intentionally left blank.
6th Grade Math** 93 2261 2502.9 2534.7 31.78
7th Grade Math 92 2050 2537.9 2545.2 7.32
8th Grade Math** 92 1926 2515.7 2563.8 48.10 Row intentionally left blank. Row intentionally left blank.
8th Grade Science 90 1932 686.3 694.4 8.09
*Note: The positive value of the scale score mean difference means the average scale score for the charter school
students was lower than the average scale score for the non-charter school students, A negative value of the scale
score mean difference means the average scale score for the charter school students was greater than the average
scale score for the non-charter school students. **Note: the double asterisk denotes the assessments and grades
where the group performances were statistically different.
Rainier Prep Rainier Prep is situated with the Highline SD boundaries and enrolled approximately 322 students in the
5th through 8th grades in the 2017-18 school year. The Rainier Prep school demographics differ
somewhat from the Highline SD demographics (Table 18). The Washington Report Card indicates that
approximately 36 percent of Rainier Prep’s students were Black/African American, which is more than
double the district’s corresponding rate. Rainier Prep’s percentages of American Indian, Asian, and
Hispanic students are lower than the district rate and the remaining race ethnicities approximate the
corresponding district rates. The percentage of low income students at Rainier Prep (77.3 percent) is
approximately 15 percentage points higher than the corresponding district rate, while the percentage of
students with a disability (10.6 percent) is a little lower than the district rate of 15.9 percent.
Table 6: Rainier Prep Demographics
Student Group Rainier Prep
(%) Highline SD
(%) Washington
(%)
American Indian/Alaskan Native 0.3 0.9 1.4
Asian 9.0 14.5 7.7
Black/African American 35.5 14.1 4.4
Hispanic/Latino 28.1 38.5 23.1

28
Student Group Rainier Prep
(%) Highline SD
(%) Washington
(%)
Native Hawaiian/Pacific Islander 0.9 4.0 1.1
White 18.5 22.0 54.4
Two or More Races 7.8 6.1 8.0 Row intentionally left blank.
English Learners 28.3 27.9 11.5
Low Income 77.3 62.5 42.4
Students with IEPs 10.6 15.9 14.1
For the most part, the average scale scores for Rainier Prep on the ELA, math, and science assessments
were substantially higher at all grade levels than the corresponding scale scores for Washington (Table
19). The academic performance of the Rainier Prep students is further described below.
On the ELA assessments and in comparison to Washington, Rainier Prep scored lower in 5th
grade and as well or higher than Washington in the 6th, 7th, and 8th grades with a 32 scale score
point difference in 8th grade.
On the Math assessments, Rainier Prep outperforms Washington in all grade levels by 21 to 45
scale score points.
On the science assessments, Washington outperforms Rainier Prep by 25.3 and 4.4 scale score
points for the 5th and 8th grade assessments respectively.
Table19: Rainier Prep Assessment Results compared to Statewide Average
Assessment
Scale Score Rainier Prep
(M)
Scale Score Washington
(M)
Scale Score Mean Diff.
5th Grade ELA 2502.4 2520.2 17.8
6th Grade ELA 2538.6 2538.9 0.3
7th Grade ELA 2574.8 2568.6 -6.2
8th Grade ELA 2617.1 2584.9 -32.2 Row intentionally left blank.
5th Grade Math 2542.2 2519.9 -22.3
6th Grade Math 2562.2 2540.9 -21.3
7th Grade Math 2602.8 2558.2 -44.6
8th Grade Math 2616.5 2576.2 -40.3 Row intentionally left blank.
5th Grade Science 678.1 703.4 25.3
8th Grade Science 697.0 701.4 4.4
*Note: the positive value of the scale score mean difference means the average scale score for the charter school
students was lower than the average scale score for the non-charter school students. The negative value of the
scale score mean difference means the average scale score for the charter school students was greater than the
average scale score for the non-charter school students.
The average scale scores for Rainier Prep on the 2018 ELA, math, and science assessments were
substantially higher at all grade levels than the corresponding scale scores for the Highline SD (Table 20).
The academic performance of the Rainier Prep students is described below.

29
On the 5th and 6th grade ELA assessments, Rainier Prep students performed similar to the
Highline SD students. On the 7th and 8th grade assessments, Rainier Prep students scored
different and higher than the Highline SD students by 39 to 54 scale score points.
On the math assessments, Rainier Prep students scored different and substantially better than
the Highline SD students by 45 to 88 scale score points.
On the 5th grade WCAS, the Rainier Prep average scale score was nearly identical to the Highline
SD average scale score. On the 8th grade WCAS, Rainier Prep scored similar to the Highline SD.
Table 20: Rainier Prep Assessment Results compared to Highline School District
Assessment
Rainier Prep Students
(N)
Highline SD Students
(N)
Scale Score Rainier Prep
(M)
Scale Score Highline SD
(M)
Scale Score Mean Diff.*
5th Grade ELA 83 1394 2500.2 2495.9 -4.36
6th Grade ELA 79 1333 2538.6 2519.3 -19.29
7th Grade ELA** 78 1227 2574.7 2536.0 -38.76
8th Grade ELA** 73 1187 2615.4 2561.6 -53.82 Row intentionally left blank. Row intentionally left blank.
5th Grade Math** 83 1415 2539.7 2493.3 -46.38
6th Grade Math** 79 1343 2562.2 2517.4 -44.73
7th Grade Math** 78 1236 2606.8 2519.0 -87.80
8th Grade Math** 73 1187 2615.6 2534.8 -80.86 Row intentionally left blank. Row intentionally left blank.
5th Grade Science 83 1411 677.4 677.2 -0.29
8th Grade Science 73 1190 697.0 681.5 -15.51
*Note: the positive value of the scale score mean difference means the average scale score for the charter school
students was lower than the average scale score for the non-charter school students. A negative value of the scale
score mean difference means the average scale score for the charter school students was greater than the average
scale score for the non-charter school students. **Note: the double asterisk denotes the assessments and grades
where the group performances were statistically different.
SOAR Academy The SOAR Academy (SOAR) is situated within the Tacoma SD boundaries and enrolled approximately 140
students for the 2017-18 school year in kindergarten through 3rd grade. SOAR serves a higher
percentage of students of color and students from low income households as compared to the Tacoma
SD and the state (Table 21). Approximately 31 percent of the SOAR students identified as Black/African
American, which is double the district rate. SOAR served lower percentages of Asian (0.6 percent),
Hispanic (17.2 percent), and White (19.4 percent) students as compared to the Tacoma SD. The
percentage students identifying with Two or More races (27.8 percent) was double the district rate.
SOAR served a lower percentage of English learners (6.4 percent) and a higher percentage of students
with a disability than the Tacoma SD.
Table 21: SOAR Academy Demographics
Student Group SOAR
(%) Tacoma SD
(%) Washington
(%)
American Indian/Alaskan Native 1.7 1.2 1.4
Asian 0.6 9.4 7.7
Black/African American 31.1 14.9 4.4

30
Student Group SOAR
(%) Tacoma SD
(%) Washington
(%)
Hispanic/Latino 17.2 20.3 23.1
Native Hawaiian/Pacific Islander 2.2 3 1.1
White 19.4 39.3 54.4
Two or More Races 27.8 11.9 8 Row intentionally left blank.
English Learners 6.4 11.2 11.5
Low Income 70.7 56.1 42.4
Students with IEPs 17.1 15.1 14.1
On both the ELA and math assessments, SOAR posted average scale scores 69 to 91 points lower than
the corresponding scores for Washington (Table 22).
Table 22: SOAR Academy Assessment Scores compared to Statewide Average
Assessment
Scale Score SOAR (M)
Scale Score Washington
(M)
Scale Score Mean Diff.*
3rd Grade ELA 2371.9 2441.3 69.4
3rd Grade Math 2360.2 2450.9 90.7
*Note: the positive value of the scale score mean difference means the average scale score for the charter school
students was lower than the average scale score for the non-charter school students.
On the 3rd grade ELA assessment, the average scale score posted by SOAR was approximately
54.9 scale score points lower than the corresponding scale score for the Tacoma SD. The group
means differed with the Tacoma SD being 55 scale score points higher (Table 23).
On the math assessment, the average scale score posted by SOAR was approximately 72 scale
score points lower than the corresponding scale score for the Tacoma SD. The group means
differed with the Tacoma SD being higher.
Table 23: SOAR Academy Assessment Scores compared to Tacoma School District
Assessment
SOAR Students
(N)
Tacoma SD Students
(N)
Scale Score SOAR (M)
Scale Score Tacoma SD
(M)
Scale Score Mean Diff.*
3rd Grade ELA** 22 2305 2371.9 2426.4 54.54
3rd Grade Math** 23 2304 2357.5 2429.5 72.02
*Note: the positive value of the scale score mean difference means the average scale score for the charter school
students was lower than the average scale score for the non-charter school students. **Note: the double asterisk
denotes the assessments and grades where the group performances were statistically different.
Spokane International Academy The Spokane International Academy (SIA) is authorized by Spokane Public Schools and located within the
district boundaries. SIA served approximately 388 students for the 2017-18 school year. The school
demographics for the SIA are similar to the Spokane SD but differs from the statewide demographics by
serving fewer students of color (Table 24). The SIA serves a student population nearly identical to the

31
Spokane school district with respect to race and ethnicity. The SIA serves modestly lower percentages of
English learners, low income students, and students with a disability, as compared to the Spokane SD.
Table 24: Spokane International Academy Demographics
Student Group SIA (%)
Spokane SD (%)
Washington (%)
American Indian/Alaskan Native 0.5 1.2 1.4
Asian 1.7 2.6 7.7
Black/African American 2.0 3.3 4.4
Hispanic/Latino 10.8 10.3 23.1
Native Hawaiian/Pacific Islander 0.0 1.6 1.1
White 69.7 67.9 54.4
Two or More Races 15.3 13.0 8.0 Row intentionally left blank.
English Learners 1.8 6.4 11.5
Low Income 38.1 55.7 42.4
Students with IEPs 10.6 17.4 14.1
At all grade levels and for all content areas (except for 7th grade math) the students at the Spokane
International Academy posted average scale scores higher than the corresponding statewide average
scale scores for Washington (Table 25). More information on the comparison is provided below.
On the grade level ELA assessments, the SIA posted average scale scores that were 3.8 to 70
scale score points higher than the corresponding scale scores for the state.
On the math assessments for all grade levels except for the 7th grade, the SIA posted average
scale scores that were 0.8 to 49 scale score points higher than the corresponding scale scores
for the state. For the 7th grade, SIA’s average scale score was approximately 30.5 scale score
points lower than the state.
On the 5th and 8th grade science assessments, the average scores for the SIA were approximately
32 and 33 scale score points higher than the state.
Table 25: Spokane International Academy Assessment Scores compared to Statewide Average
Assessment
Scale Score Spokane International
(M)
Scale Score Washington
(M)
Scale Score Mean Diff.*
3rd Grade ELA 2474.9 2441.3 -33.6
4th Grade ELA -- 2484.5 --
5th Grade ELA 2525.2 2520.2 -5.0
6th Grade ELA 2566.7 2538.9 -27.8
7th Grade ELA 2572.4 2568.6 -3.8
8th Grade ELA 2654.6 2584.9 -69.7 Row intentionally left blank.
3rd Grade Math 2463.9 2450.9 -13.0
4th Grade Math -- 2491.3 --
5th Grade Math 2520.7 2519.9 -0.8
6th Grade Math 2549.2 2540.9 -8.3

32
Assessment
Scale Score Spokane International
(M)
Scale Score Washington
(M)
Scale Score Mean Diff.*
7th Grade Math 2527.7 2558.2 30.5
8th Grade Math 2625.4 2576.2 -49.2 Row intentionally left blank.
5th Grade Science 735.2 703.4 -31.8
8th Grade Science 734.4 701.4 -33.0
*Note: the negative value of the scale score mean difference means the average scale score for the charter school
students was greater than the average scale score for the non-charter school students. A positive value of the scale
score mean difference means the average scale score for the charter school students was lower than the average
scale score for the non-charter school students.
At all grade levels and for all content areas (except for 7th grade math) the students at the Spokane
International Academy posted average scale scores higher than the corresponding average scale score
for the Spokane SD (Table 26). More information on the comparison is provided below.
On all the grade level ELA assessments, the SIA posted average scale scores that were
approximately 12 to 82 scale score points higher than the corresponding measure for the
Spokane SD. The 3rd grade and 8th grade mean scale scores were different with the SIA scoring
higher than the Spokane SD. The 4th, 5th, 6th, and 7th grade mean scale scores were similar to the
Spokane SD.
On the 3rd, 5th, 6th, and 8th grade math assessments, the SIA average scale score was 15 to 64
scale score points higher than the corresponding score for the Spokane SD. The means for the
3rd and 8th grades were different but the mean scores for the 5th and 6th grades were similar. On
the 7th grade math assessment, the Spokane SD posted a higher score than the SIA but the
performances by each are characterized as similar.
On the science assessments, the SIA average scale scores were 37 to 40 scale score points higher
than the average scale scores posted by the Spokane SD. For both the 5th and 8th grade WCAS,
the mean scores differed with the SIA being higher.
Table 26: Spokane International Academy Assessment Scores compared to Spokane School District
Assessment
SIA Students
(N)
Spokane SD Students
(N)
Scale Score SIA (M)
Scale Score Spokane SD
(M)
Scale Score Mean Diff.**
3rd Grade ELA** 41 2364 2474.9 2427.2 -47.69
4th Grade ELA < 10 2430 -- 2468.5 --
5th Grade ELA 40 2377 2525.2 2512.5 -12.66
6th Grade ELA 35 2288 2556.7 2544.6 -12.07
7th Grade ELA 53 2092 2574.9 2557.4 -17.48
8th Grade ELA** 27 1999 2654.6 2572.4 -82.19 Row intentionally left blank. Row intentionally left blank.
3rd Grade Math** 42 2364 2463.1 2433.2 -29.86
4th Grade Math < 10 2405 -- 2474.8 --
5th Grade Math 40 2379 2520.7 2506.0 -14.67
6th Grade Math 35 2319 2549.2 2533.2 -16.00
7th Grade Math 52 2090 2527.7 2546.3 17.67
8th Grade Math** 27 1991 2625.4 2560.7 -64.68 Row intentionally left blank. Row intentionally left blank.
5th Grade Science** 40 2371 735.2 695.4 -39.77

33
Assessment
SIA Students
(N)
Spokane SD Students
(N)
Scale Score SIA (M)
Scale Score Spokane SD
(M)
Scale Score Mean Diff.**
8th Grade Science** 27 1995 734.4 697.4 -37.09
*Note: the positive value of the scale score mean difference means the average scale score for the charter school
students was lower than the average scale score for the non-charter school students. A negative value of the scale
score mean difference means the average scale score for the charter school students was greater than the average
scale score for the non-charter school students. **Note: the double asterisk denotes the assessments and grades
where the group performances were statistically different.
Summit – Atlas Summit Atlas (Atlas) is situated within the Seattle SD boundaries and enrolled approximately 159
students for the 2017-18 school year. Atlas serves higher percentages of students of color and students
from low income households (Table 27). Approximately 31 percent of the students at Atlas identify as
Black/African American, which is approximately double the rate for the Seattle SD. The percentages of
students identifying as Hispanic (17.1 percent) or with Two or More races (13.3 percent) are a little
higher than for the Seattle SD. Approximately 7.5 percent of the students at Atlas were English learners,
which is lower than the corresponding rate for the Seattle SD. Approximately 48 percent of the Atlas
students qualified for FRL, while the Seattle SD FRL rate is 16 percentage points lower at 31.8 percent.
Table 7: Summit Atlas Demographics
Student Group Atlas (%)
Seattle SD (%)
Washington (%)
American Indian/Alaskan Native 0.0 0.5 1.4
Asian 3.3 14.1 7.7
Black/African American 30.9 14.9 4.4
Hispanic/Latino 17.1 12.1 23.1
Native Hawaiian/Pacific Islander 0.0 0.5 1.1
White 35.4 47.1 54.4
Two or More Races 13.3 10.8 8.0 Row intentionally left blank.
English Learners 7.5 12.5 11.5
Low Income 47.8 31.8 42.4
Students with IEPs 16.0 15.1 14.1
Atlas’ performance comparison is based on the 6th grade ELA and math assessments only. The average
scale scores for the ELA and math assessments for Atlas students are substantially higher than the
corresponding average scale scores for Washington (Table 28). More details are provided below.
On the 6th grade ELA assessment, Atlas posted an average scale score which was approximately
23 scale score points higher than the statewide average scale score for Washington.
On the 6th grade math assessment, Atlas posted an average scale score which was nearly 32
scale score points higher than the statewide average scale score for Washington.

34
Table 28: Summit Atlas Assessment Scores compared to Statewide Average
Assessment
Scale Score Atlas (M)
Scale Score Washington
(M)
Scale Score Mean Diff.*
6th Grade ELA 2562.3 2538.9 -23.4
6th Grade Math 2572.8 2540.9 -31.9
*Note: the negative value of the scale score mean difference means the average scale score for the charter school
students was greater than the average scale score for the non-charter school students.
The average scale scores for the 6th grade ELA and math assessments for Atlas students are similar to the
corresponding average scale scores for the Seattle SD (Table 29). More details are provided below.
On the 6th grade ELA assessment, Atlas posted an average scale score which was approximately
5.1 scale score points lower than the average scale score for the Seattle SD. The average scale
scores were similar.
On the 6th grade math assessment, Atlas posted an average scale score which was 6.8 scale
score points lower than the average scale score for the Seattle SD. Again, the average scale
scores were similar.
Table 8: Summit Atlas Assessment Scores compared to Seattle School District
Assessment
Atlas Students
(N)
Seattle SD Students
(N)
Scale Score Atlas (M)
Scale Score Seattle SD
(M)
Scale Score Mean Diff.*
6th Grade ELA 86 3830 2563.0 2568.2 5.13
6th Grade Math 85 3832 2572.2 2579.0 6.81
*Note: The positive value of the scale score mean difference means the average scale score for the charter school
students was lower than the average scale score for the non-charter school. **Note: a double asterisk denotes the
assessments and grades where the group performances were statistically different.
Summit – Olympus The Olympus School (Olympus) is situated within the Tacoma SD boundaries and enrolled approximately
151 students for the 2017-18 school year. Olympus serves higher percentages of students of color and
students from low income households in comparison to the Tacoma SD and Washington (Table 30).
Approximately 19 percent of the students at Olympus identified as Black/African American and 29
percent as Hispanic, which were 4.3 and 9.0 percentage points higher than the corresponding rate for
the Tacoma SD. The percentages of Asian and White students were lower at Olympus as compared to
the Tacoma SD. The percentage of English learners (7.3 percent) at Olympus was lower than the
corresponding rate for the Tacoma SD. The percentage of FRL students (70.9 percent) at Olympus was
nearly 15 percentage points higher than the corresponding rate for the Tacoma SD.
Table 30: Summit Olympus Demographics
Student Group Olympus
(%) Tacoma SD
(%) Washington
(%)
American Indian/Alaskan Native 1.8 1.2 1.4
Asian 3.6 9.4 7.7

35
Student Group Olympus
(%) Tacoma SD
(%) Washington
(%)
Black/African American 19.2 14.9 4.4
Hispanic/Latino 29.3 20.3 23.1
Native Hawaiian/Pacific Islander 2.4 3.0 1.1
White 30.5 39.3 54.4
Two or More Races 13.2 11.9 8.0 Row intentionally left blank.
English Learners 7.3 11.2 11.5
Low Income 70.9 56.1 42.4
Students with IEPs 19.8 15.1 14.1
The average scale scores for the Olympus 10th graders are substantially lower than the corresponding
average scale scores for Washington, while the average scale scores for the Olympus 11th graders are
substantially higher than the corresponding average scale scores in ELA, math, and science (Table 31).
More details are provided below.
Olympus 10th graders posted average scale scores that were 37 and 53 scale score points lower
in ELA and math than the corresponding scores for the state.
Olympus 11th graders posted average scale scores that were 28 and 22 scale score points lower
in ELA and math than the corresponding scores for the state.
On the 11th grade science assessment, the average scale score for Olympus was 8.2 scale score
points higher than the average scale score achieved by other Washington students.
Table 31: Summit Olympus Assessment Scores compared to Statewide Average
Assessment
Scale Score Olympus
(M)
Scale Score Washington
(M)
Scale Score Mean Diff.*
10th Grade ELA 2592.2 2629.6 37.4
11th Grade ELA 2541.8 2513.6 -28.2 Row intentionally left blank.
10th Grade Math 2536.5 2589.2 52.7
11th Grade Math 2577.1 2555.4 -21.7 Row intentionally left blank.
11th Grade Science 704.3 696.1 -8.2
*Note: a positive value of the scale score mean difference means the average scale score for the charter school
students was lower than the average scale score for the non-charter school students and a negative value of the
scale score mean difference means the average scale score for the charter school students was greater than the
average scale score for the non-charter school students.
The average scale scores for the Olympus 10th graders are a little lower than the corresponding average
scale scores for the Tacoma SD, while the average scale scores for the Olympus 11th graders are
substantially higher than the Tacoma SD’s corresponding average scale scores in ELA, math, and science
(Table 32). Additional details are provided below.
On the 10th grade ELA assessment, the Olympus average scale score was similar to the
corresponding measure for the Tacoma SD. On the 11th grade ELA, the Olympus average scale
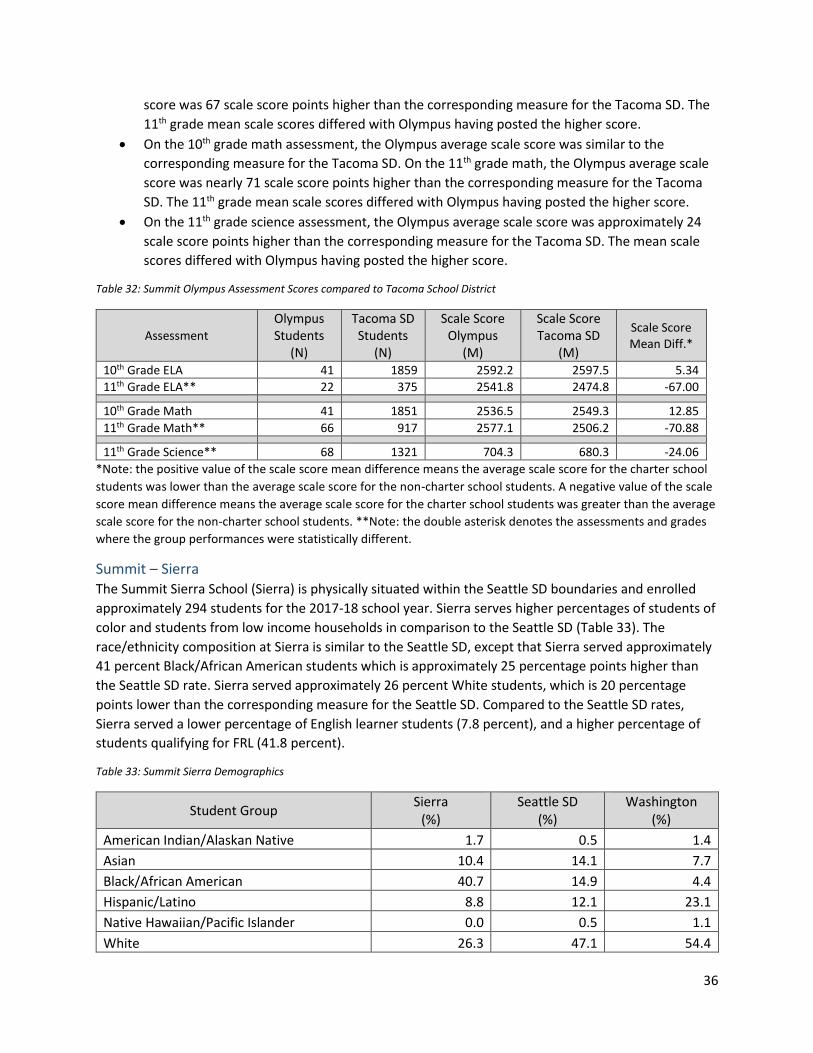
36
score was 67 scale score points higher than the corresponding measure for the Tacoma SD. The
11th grade mean scale scores differed with Olympus having posted the higher score.
On the 10th grade math assessment, the Olympus average scale score was similar to the
corresponding measure for the Tacoma SD. On the 11th grade math, the Olympus average scale
score was nearly 71 scale score points higher than the corresponding measure for the Tacoma
SD. The 11th grade mean scale scores differed with Olympus having posted the higher score.
On the 11th grade science assessment, the Olympus average scale score was approximately 24
scale score points higher than the corresponding measure for the Tacoma SD. The mean scale
scores differed with Olympus having posted the higher score.
Table 32: Summit Olympus Assessment Scores compared to Tacoma School District
Assessment
Olympus Students
(N)
Tacoma SD Students
(N)
Scale Score Olympus
(M)
Scale Score Tacoma SD
(M)
Scale Score Mean Diff.*
10th Grade ELA 41 1859 2592.2 2597.5 5.34
11th Grade ELA** 22 375 2541.8 2474.8 -67.00 Row intentionally left blank. Row intentionally left blank.
10th Grade Math 41 1851 2536.5 2549.3 12.85
11th Grade Math** 66 917 2577.1 2506.2 -70.88 Row intentionally left blank. Row intentionally left blank.
11th Grade Science** 68 1321 704.3 680.3 -24.06
*Note: the positive value of the scale score mean difference means the average scale score for the charter school
students was lower than the average scale score for the non-charter school students. A negative value of the scale
score mean difference means the average scale score for the charter school students was greater than the average
scale score for the non-charter school students. **Note: the double asterisk denotes the assessments and grades
where the group performances were statistically different.
Summit – Sierra The Summit Sierra School (Sierra) is physically situated within the Seattle SD boundaries and enrolled
approximately 294 students for the 2017-18 school year. Sierra serves higher percentages of students of
color and students from low income households in comparison to the Seattle SD (Table 33). The
race/ethnicity composition at Sierra is similar to the Seattle SD, except that Sierra served approximately
41 percent Black/African American students which is approximately 25 percentage points higher than
the Seattle SD rate. Sierra served approximately 26 percent White students, which is 20 percentage
points lower than the corresponding measure for the Seattle SD. Compared to the Seattle SD rates,
Sierra served a lower percentage of English learner students (7.8 percent), and a higher percentage of
students qualifying for FRL (41.8 percent).
Table 33: Summit Sierra Demographics
Student Group Sierra
(%) Seattle SD
(%) Washington
(%)
American Indian/Alaskan Native 1.7 0.5 1.4
Asian 10.4 14.1 7.7
Black/African American 40.7 14.9 4.4
Hispanic/Latino 8.8 12.1 23.1
Native Hawaiian/Pacific Islander 0.0 0.5 1.1
White 26.3 47.1 54.4

37
Student Group Sierra
(%) Seattle SD
(%) Washington
(%)
Two or More Races 12.1 10.8 8.0
Row intentionally left blank.
English Learners 7.8 12.5 11.5
Low Income 41.8 31.8 42.4
Students with IEPs 17.5 15.1 14.1
The average scale scores for the Sierra 10th graders are a little lower than the corresponding statewide
average scale scores for Washington, while the average scale scores for the Sierra 11th graders are
substantially higher than the corresponding average scale scores in ELA, math, and science (Table 34).
More details are provided below.
On the 10th grade assessments, the Sierra average scale scores were 2.7 and 11.2 scale score
points lower in ELA and math than the corresponding measure for Washington.
On the 11th grade assessments, the Sierra average scale scores were 47 and 51 scale score
points higher on the ELA and math than the corresponding measure for Washington.
Table 34: Summit Sierra Assessment Scores compared to Statewide Average
Assessment
Scale Score Sierra
(M)
Scale Score Washington
(M)
Scale Score Mean Diff.*
10th Grade ELA 2626.8 2629.6 2.7
11th Grade ELA 2560.2 2513.5 -46.7 Row intentionally left blank.
10th Grade Math 2578.1 2589.2 11.2
11th Grade Math 2606.6 2555.3 -51.3 Row intentionally left blank.
11th Grade Science 699.1 696.1 -3.0
*Note: the positive value of the scale score mean difference means the average scale score for the charter school
students was lower than the average scale score for the non-charter school students. A negative value of the scale
score mean difference means the average scale score for the charter school students was greater than the average
scale score for the non-charter school students.
The average scale scores for the Sierra 10th graders are substantially lower than the corresponding
average scale scores for Seattle SD while the average scale scores for the Sierra 11th graders are
substantially higher than the corresponding average scale scores in ELA and math (Table 35). On the
science assessment, the average scale score for the Seattle SD is a little higher than the corresponding
score for Sierra. More details are provided below.
On the 10th grade ELA assessment, the Sierra average scale score was approximately 29 scale
score points lower than the corresponding measure for the Seattle SD. The mean scale scores
differed with the Seattle SD being higher. On the 11th grade ELA, the Sierra average scale score
was 57 scale score points higher than the corresponding measure for the Seattle SD. The mean
scale scores differed with Sierra having posted the higher score.
On the 10th grade math assessment, the Sierra average scale score was approximately 52 scale
score points lower than the corresponding measure for the Seattle SD. The mean scale scores

38
differed with the Seattle SD being higher. On the 11th grade math assessment, the Sierra average
scale score was 35 scale score points higher than the corresponding measure for the Seattle SD.
The mean scale scores differed with Sierra having posted the higher score.
On the 11th grade science assessment, the Sierra average scale score was similar to the average
scale score posted by the Seattle SD.
Table 35: Summit Olympus Assessment Scores compared to Seattle School District
Assessment
Sierra Students
(N)
Seattle SD Students
(N)
Scale Score Sierra
ELA (M)
Scale Score Seattle SD
ELA (M)
Scale Score Mean Diff.*
10th Grade ELA** 85 3261 2626.8 2656.1 29.26
11th Grade ELA** 29 323 2560.2 2503.4 -56.87 Row intentionally left blank. Row intentionally left blank.
10th Grade Math** 79 3178 2578.1 2629.7 51.63
11th Grade Math** 95 1457 2606.6 2571.6 -35.04 Row intentionally left blank. Row intentionally left blank.
11th Grade Science 92 1732 699.1 710.1 11.04
*Note: the positive values of the scale score mean difference means the average scale score for the charter school
students was lower than the average scale score for the non-charter school students and the negative values of
the scale score mean difference means the average scale score for the charter school students was greater than
the average scale score for the non-charter school students. **Note: the double asterisk denotes the assessments
and grades where the group performances were statistically different.
Part B: Performance of students at charter schools to similar non-charter school students.
Data Sources and Data Processing Between late September and mid-December, the Office of the Superintendent of Public Instruction
(OSPI) provided the SBE with separate de-identified student enrollment, assessment, growth model,
absence, and discipline data files for the 2017-18 school year.
The assessment file provided by the OSPI contained results for the Washington Access to Instruction and
Measurement (WaAIM) and the statewide Smarter Balanced assessments. Fewer than a dozen students
at charter schools participated in the WaAIM, the assessment for selected students with severe
disabilities. Because the WaAIM differs greatly from the SBA and because WaAIM scores vary
considerably based on disability type, the SBE made the decision to exclude the WaAIM from the
analyses presented here.
Design and Statistical Methods
In order to carry out the most meaningful comparison of the academic performance between charter
school students and not charter school students, a control group was created following a student-by-
student matching process. In such a design, each charter school student is matched to or paired with a
demographically similar non-charter school student and the group means are then compared using the
Independent Samples t-Test.
The comparison group is comprised of students enrolled in charter schools with valid scores for the
Smarter Balanced (SBA) English language arts (ELA) and mathematics assessments. Most, but not all of
the comparison group members, also have valid results for the Washington Comprehensive Assessment
of Science (WCAS).

39
A control group comprised of similar non-charter school students was created through a one-by-one
matching process. Exact matching criteria included gender, federal race and ethnicity coding, Free and
Reduced Price Lunch program (FRL) status, English learner (EL) status, and special education (SWD)
status. Other matching criteria included Section 504 status, the aggregated number of absences, the
language spoken at home, number of exclusionary discipline events, and the number of exclusionary
discipline intervention days. In the matching process, each student’s home district was considered and
used as a matching criteria. As examples, a student at a Spokane charter school was matched to a similar
student in a Spokane non-charter school and a student at a Tacoma charter school was matched to a
similar student in a Tacoma non-charter school. In some instances, the control group matched student
attended school in different, but nearby school district.
Table 36 and Table 37 show that the demographic characteristics of the control group are nearly
identical to the demographic characteristics of the comparison group. Differences in some of the
aggregated matching criteria (e.g. days absent and discipline intervention days) result from the matching
protocol that paired some students on the combination of the two criteria when an exact match could
not be made on the criteria separately. In these cases, the total out of school days would be
approximately the same, some due to absence and some due to exclusionary discipline.
Table 36: Racial composition of the student groups and for Washington in the 2017-18 school year
Student Group Native
American (%)
Asian (%)
Black (%)
Hispanic (%)
White (%)
Pacific Islander
(%)
Two or More
(%)
Control Group 1.9 4.8 27.3 15.2 38.4 1.4 11.2
Comparison Group
1.9 4.8 27.3 15.2 38.4 1.4 11.2
Washington 1.4 7.7 4.4 23.1 54.4 1.1 8.0
The chronic absenteeism variable was computed from the student absence file, which describes each
absence as excused or unexcused and full day or part day. For this work, no distinction was made
between excused or unexcused absences. Full day absences were coded as 1.0 day and a part day
absence was coded as 0.25 days. The total days absent were summed from the individual absence
events and a student was coded as chronically absent if the total days absent were more than 18.
Table 37: Program participation, attendance, and exclusionary discipline patterns for the study groups and Washington for the 2017-18 school year.
Student Group
FRL (%)
EL (%)
SWD (%)
Section 504 (%)
Chronic Absence
(%)
Days Absent
(M)
Discipline Events
(M)
Discipline Days (M)
Control Group 60 11 15 4 26 13.7 0.39 0.64
Comparison Group
60 11 15 3 27 14.3 0.36 0.47
Washington 42 12 14 4 19 12.1 0.17 0.38

40
Several charter school students with valid SBA results could not be matched due to unusual absence or
exclusionary discipline patterns. Also, at least one match was impossible to make as the required coding
(e.g. race/ethnicity or FRL status) was not included in the various data files. For both the control and
comparison groups, more than 94 percent of the students were continuously enrolled for the academic
year, and student results were included in this comparison regardless of the continuously enrolled
status, in a similar manner in which results are reported on the Washington Report Card.
Student growth model data is used to broaden the definition of similar students to include academically similar students. For many years, Washington has been reporting on the academic growth of students through the Student Growth Percentile (SGP) growth model, which has been approved for use in federal accountability by the U.S. Department of Education and is currently used by more than 30 states. The SGP describes a student’s growth compared to other students with similar prior test scores (academic peers). A student’s academic peers are all students in Washington State in the same grade and assessment subject that had statistically similar scores in previous years. In other words, they are students that have followed a similar assessment score path. Students are only compared to others based on their score history, not on any other characteristics, such as demographics or program participation. A student’s growth percentile represents how much a student grew in comparison to these academic peers.
The student growth percentile allows for the comparison of academic performance of students who enter school at different levels and represents a student’s growth and academic progress, even if she is not yet meeting standard. A student growth percentile is a number between 1 and 99. If a student has an SGP of 85, we can say that she showed more growth than 85 percent of her academic peers. A student with a low score on a state assessment can show high growth and a student with a high score can demonstrate low growth. Similarly, two students with very different scale scores can have the same SGP. Only students that have at least two years of consecutive scores are included. For example, if a student has a score in 4th grade, but not in 5th grade, the student would not be included in the analysis.
Overall Findings by Content Area The Independent Sample t-Test was conducted to determine whether the comparison group (charter
school students) performed differently than the control group (non-charter school students) on the
statewide ELA, math, and science assessments. For the analyses that follow, the comparison and control
groups are aggregated from all of the charter schools. In other words, all of the charter school students
are combined into one large group to assess for overall group differences. The results of the t-tests are
summarized in Table 38.
On the statewide ELA, math, and science assessments, the comparison group (charter school students)
perform no differently than the control group (non-charter school students). On the science assessment,
the average scale score for the comparison group was a little higher than the average scale score for the
control group. The findings are detailed as follows:
The performance on the ELA assessment for the charter school students was similar to the
performance of the non-charter school students.
On the math assessment, the mean scale score for the control group was similar to the mean
scale core for the comparison group.

41
The average scale score for the comparison group was similar to the mean scale score for the
control group on the science assessment.
Table 9: Scale score differences based on charter school enrollment.
Assessment Students in each Group
(N)
Mean Scale Score Comparison Group Charter Students
Mean Scale Score Control Group
Non-Charter Students
Mean Scale Score Difference*
ELA 1405 2543.3 2545.6 2.25
Math 1405 2531.7 2532.8 1.08
Science 470 684.7 678.1 -6.52
*Note: the mean difference is reported as the value for the non-charter school group minus the value for the
charter school group. A negative mean difference indicates that the mean scale score for the comparison group
(charter school students) was higher than the mean scale score for the control group (non-charter school
students). A positive mean difference indicates that the mean scale score for the comparison group (charter school
students) was lower than the mean scale score for the control group (non-charter school students).
Washington uses the student growth percentiles (SGPs) growth model as the method to determine the
relative amount of learning a student makes during a school year. The SGP describes a student’s growth
compared to other students with similar prior test scores, their academic peers. The growth model data
provides important information about the performance of academically similar students. Because SGP
calculations require at least two years of assessment results, ELA and math SGPs are computed for
students in the 4th through 8th grades. The OSPI crated materials describing the Washington growth
model and posted on their website.
The Independent Sample t-Test was conducted to determine whether the comparison group (charter
school students) performed differently than the control group (non-charter school students) on the
measure of student growth percentiles (SGPs) derived from the statewide ELA and math assessments. In
a manner like the above, the comparison and control groups are aggregated from all of the charter
schools. In other words, all of the charter school students are combined into one large group to assess
for overall group differences.
As derived from the statewide ELA and math assessments, the comparison group (charter school
students) performed similarly to the control group (non-charter school students) on the ELA SGPs but
differently on the math SGPs (Table 39). The charter school students made on average more than one
year of academic growth in math, while the non-charter school students made a little less than one year
of academic growth in math. The findings are as follows:
The ELA SGPs for the charter school students were similar to the ELA SGPs of the non-charter
school students. The mean SGP for the comparison group was less than one percentile point
higher than the control group.
On the math SGP calculations, the mean SGP for the comparison group was approximately 3.67
percentile points higher than the control group. The means differed with the comparison group
posting higher SGP, meaning that the charter school students demonstrated more academic
growth than similar non-charter school students.
Table 39: shows the ELA and math growth model data for the control and comparison groups.

42
Assessment Students*
(N)
Mean SGP Comparison Group Charter Students
Mean SGP Control Group
Non-Charter Students
Mean SGP Difference*
ELA 1091/1019 52.5 51.8 -0.72
Math** 1091/1018 52.1 48.4 -3.67 *Note: shows the number of student records for the control/comparison group. **Note: the double asterisk
denotes the assessments where the group performances were statistically different.
Grade Level Findings by Content Area For the seven grades in which analyses on the ELA assessment were conducted, the comparison group
(charter school students) performed statistically similar to the control group at all grade levels except
for the 6th grade and 11th grade (Table 40). The results are described in more detail below.
The comparison and control groups performed similar on the 3rd, 5th, 7th, 8th, and 10th grade ELA
assessments.
The control group performed different (17 scale score points higher) than the comparison group
on the 6th grade ELA assessment.
The comparison group performed differently (56 scale score points higher) than the comparison
group on the 11th grade ELA assessment.
Table 40: ELA scale score differences based on charter school enrollment.
Assessment Students
(N)
Mean Scale Score Comparison Group Charter Students
Mean Scale Score Control Group
Non-Charter Students
Mean Scale Score Difference*
3rd Grade 63 2438.9 2445.2 6.32
4th Grade < 10 -- -- --
5th Grade 121 2509.9 2521.0 11.03
6th Grade** 413 2523.5 2540.7 17.20
7th Grade 316 2544.7 2546.7 2.05
8th Grade 316 2571.7 2558.8 -12.92
10th grade 120 2617.2 2624.5 7.24
11th Grade** 49 2560.0 2503.7 -56.35
*Note: the mean difference is reported as the value for the not charter school group minus the value for the
charter school group. A negative mean difference indicates that the mean scale score for the comparison group
(charter school students) was higher than the mean scale score for the control group. A positive mean difference
indicates that the mean scale score for the comparison group (charter school students) was lower than the mean
scale score for the control group. **Note: the double asterisk denotes the assessments and grades where the
group performances were statistically different.
For the seven grades in which analyses on the math assessment were conducted, the comparison group
(charter school students) performed statistically similar to the control group at all grade levels except for
the 10th grade (Table 41). The results are described in more detail below.
On the math assessment, the comparison group performed statistically similar to the control
group at all grade levels except for the 10th grade.

43
On the 10th grade math assessment, the mean scale score for the control group (2613.6) was
statistically different and higher than the mean scale score for the comparison group (2563.9).
The mean scale score difference was nearly 50 scale score points.
Table 41: Math scale score differences based on charter school enrollment.
Assessment Students
(N)
Mean Scale Score Comparison Group Charter Students
Mean Scale Score Control Group
Non-Charter Students
Mean Scale Score Difference*
3rd Grade 63 2427.7 2443.3 15.64
4th Grade < 10 -- -- --
5th Grade 121 2535.1 2512.8 -22.26
6th Grade 413 2528.8 2539.4 10.56
7th Grade 316 2532.7 2527.9 -4.83
8th Grade 316 2541.7 2539.7 -2.00
10th Grade** 120 2563.9 2595.1 31.20
11th Grade 49 2535.1 2482.4 -52.76
*Note: the mean difference is reported as the value for the not charter school group minus the value for the
charter school group. A negative mean difference indicates that the mean scale score for the comparison group
(charter school students) was higher than the mean scale score for the control group. A positive mean difference
indicates that the mean scale score for the comparison group (charter school students) was lower than the mean
scale score for the control group. **Note: the double asterisk denotes the assessments and grades where the
group performances were statistically different.
On the science assessments, the comparison group (charter school students) scored similar to the
control group in grades 5 and 8 and substantially higher than the control group in grade 11 (Table 42).
Additional details are provided below.
The mean differences for the 5th and 8th grade science assessments were -0.50 and -4.35
respectively, indicating that the comparison groups scored a little higher. However, the
comparison group performed statistically similar to the control group on the 5th and 8th grade
science assessments.
The comparison group (653.6 scale score) performed statistically different and higher than the
control group (595.9 scale score) on the 11th grade science assessment. The mean difference
was 57.76 scale score points with the comparison group scoring higher.
Table 42: Science scale score differences based on charter school enrollment.
Assessment Students
(N)
Mean Scale Score Comparison Group Charter Students
Mean Scale Score Not Control Group Charter Students
Mean Scale Score Difference*
5th Grade 120 696.9 696.4 -0.50
8th Grade 312 684.6 680.0 -4.53
11th Grade** 47 653.6 595.9 -57.76
*Note: the mean difference is reported as the value for the not charter school group minus the value for the
charter school group. A negative mean difference indicates that the mean scale score for the comparison group
(charter school students) was higher than the mean scale score for the control group. **Note: the double asterisk
denotes the assessments and grades where the group performances were statistically different.
The Independent Sample t-Test was conducted to determine whether the comparison group (charter
school students) performed differently than the control group (non-charter school students) on the

44
measure of student growth percentiles (SGPs) derived from the statewide ELA and math assessments.
Statewide, charter school students posted student growth percentiles similar to or higher than the non-
charter school students in all grades for both ELA and math (Table 43).
On the ELA SGPs, the comparison group performed similarly to the control group at all grade
levels. The average SGP for the comparison group was greater than 50 for all grade levels,
indicating that the group (on average) made more than one year’s growth in ELA for the 2017-18
school year.
On the math SGPs, the comparison group performed similarly to or higher than the control
group at all grade levels. The average math SGP for the comparison group was well above 50 for
the 5th and 6th grades, indicating that the groups (on average) made more than one year’s
growth in math for the 2017-18 school year.
Table 43: shows the ELA and math growth model data for the control and comparison groups by grade level.
Assessment Students
(N)
Mean SGP Comparison Group Charter Students
Mean SGP Control Group
Non-Charter Students
Mean SGP Difference*
4th Grade ELA < 10 -- -- --
5th Grade ELA 112/95 50.4 55.9 5.51
6th Grade ELA 388/333 53.9 54.1 0.23
7th Grade ELA 294/294 50.2 49.2 -1.08
8th Grade ELA 291/291 54.4 50.0 -4.36 Row intentionally left blank
4th Grade Math < 10 -- -- --
5th Grade Math ** 112/95 61.4 48.1 -13.32
6th Grade Math 386/333 54.8 53.0 -1.78
7th Grade Math 294/294 49.5 46.8 -2.68
8th Grade Math 293/290 48.0 43.8 -4.19 *Note: shows the number of student records for the control group/ comparison group. **Note: the double asterisk
denotes the assessments and grades where the group performances were statistically different.