annual report 2017 - arig · middle east has supported crude oil prices. these have risen by about...
TRANSCRIPT

2017A N N U A L R E P O R T

CONTENTS
Report of the Board of Directors 3
Financial Highlights 9
Operating and Financial Review 11
Arab Insurance Market Review 17
Corporate Governance Report 23
Biographies of Board Members 30
Biographies of General Management 31
Key Ratios 32
Consolidated Financial Statements 34

2
BOARD OF DIRECTORS
Saeed Mohammed AlBahhar
Chairman of the Board and member of the Nomination and Remuneration Committee
Dr. Bader Abdulla AlJaberi
Director and Chairman of the Nomination & Remuneration Committee and member
of the Audit & Risk Committee
Ahmed Saeed AlMahri
Director and Chairman of the Audit & Risk Committee and member of the Nomination
& Remuneration Committee
Wael Ibrahem Abu Khzam
Director and member of the Audit and Risk Committee and Nomination
and Remuneration Committee
Mohamed Saif AlHameli
Vice Chairman of the Board
ARAB INSURANCE GROUP (B.S.C.)
Mohamed Saif AlSuwaidi
Director and member of the Nomination and Remuneration Committee

ANNUAL REPORT 2017
3
REPORT OF THE BOARD OF DIRECTORS
Dear Shareholders,
The Directors of the Arab Insurance Group (B.S.C.) (Arig) are pleased to present the Company’s 37th Annual Report and Consolidated Financial Statements for the 2017 Financial Year.
GROUP PERFORMANCE
Despite the high level of catastrophe losses experienced in 2017 and a major fire loss in UAE “ADNOC refinery”, Arig continued to generate a positive result in 2017 of US$ 7.2 million attributable to shareholders (2016: US$ 9.2 million) backed by positive technical performance and higher investment earnings.
In addition, on 22 November 2017, A.M. Best affirmed Arig’s Financial Strength Rating of ‘A- (Excellent)’, and its Long-Term Issuer Credit Rating of “a-”. The outlook of both ratings remains stable. The rating agency highlighted in their related press release “the ratings reflect Arig’s very strong balance sheet strength, its adequate operating performance, neutral business profile and appropriate enterprise risk management”.
Arig’s Gross written premiums declined to US$ 225.6 million (2016: US$ 245.4 million), reflecting strict price oriented underwriting approach, unwillingness to follow soft-market practices on the expense of top-line, negative influence of exchange rate movements and inadequately priced accounts coupled with downward premium adjustments to our Lloyd’s portfolio.
The total investment income for the Company reached US$ 22.3 million (2016: US$ 19.3 million) reflecting strategic portfolio positioning.
THE MARKET
Economic Situation
After a year of political earthquakes, 2017 produced its share of significant world events. The most prominent ones were: The world witnessed the inauguration of the 45th President of the United States of America heralding a drastic change in policy and a new vision at the White House. The paramount slogan of the new Administration is “America first” in the full sense of its meaning. The USA cancelled its participation in the Trans-Pacific Partnership and has withdrawn from the Paris Climate Agreement. Also, the approach of the Administration towards US “unfriendly” countries has become much stricter.
The presidential elections in France as well as the vote for the German Bundestag were, especially after the unexpected win of the Brexit-Supporters in the United Kingdom, the most important political events in Europe and anxiously awaited. The result of both turned out to be in favour of the European Union and diminished earlier fears fuelled by the rise of right-wing populism.
However, the United Kingdom continued its path towards an exit from the European Union by invoking Article 50 of the Lisbon Treaty. Britain has now until March 2019 to negotiate the terms of its departure and may endure a “hard Brexit”, depending on how much disruption its divorce from the EU causes.
One of the most significant highlights in the Arab World was the promotion of Saudi Arabia’s Royal Highness, Prince Mohammad bin Salman, as Crown Prince. His “Vision 2030” aims to modernize Saudi Arabia’s economy and society and to prepare the country for a post-oil future, by transforming the Kingdom into an investment powerhouse and by empowering the private sector. Addressing corruption has also been a central topic on his ambitious agenda. Another development has been the growing tensions with neighbouring Qatar which is affecting trade, movement of capital and people.
The civil wars in Syria, Iraq, Libya, and Yemen remain. Besides being humanitarian disasters, they represent a significant challenge for the entire region, economically as well as socially.
The agreement of OPEC and non-OPEC producers led by Russia to extend oil output cuts until the end of 2018 and limit oil production, coupled with geopolitical tensions in the Middle East has supported crude oil prices. These have risen by about 20 percent between August 2017 and mid-December 2017 to over $60 per barrel. The increase in fuel prices raised headline inflation in advanced economies, but wage and core-price inflation remain weak. Among emerging market economies, headline and core inflation have ticked up slightly in recent months after declining earlier in 2017.
Ten years after the 2008 financial crisis, global economic growth is accelerating and stock markets around the world are hitting record highs. The International Monetary Fund (IMF) estimated in its latest World Economic Outlook (January 2018) an overall world output of 3.7% for 2017, 0.5% point higher than in 2016. About 120 economies representing three-quarters of the world GDP have seen a pick-up growth in year-on-year terms in 2017.
Growth in most emerging market and developing economies (EMDEs) with large numbers of commodity
4
REPORT OF THE BOARD OF DIRECTORS
Saeed Mohammed AlBahharChairman
Our focus will remain on maintaining a well-balanced portfolio, while benefitting from market opportunities in a controlled and opportunistic manner.”
“
ARAB INSURANCE GROUP (B.S.C.)

ANNUAL REPORT 2017
5
REPORT OF THE BOARD OF DIRECTORS
exporters recovered in 2017, with the significant exception of the Middle East and North Africa, mainly due to oil production cuts. EMDEs are expected to grow by 4.7% in 2017 (2016: 4.4%) against a growth of 2.3% in 2017 (2016: 1.7%) in the advanced economies. China will remain at the top of the list with an expected growth of 6.8% (2016: 6.7%). A high growth of 6.7% is also expected in India; however, at a slightly lower level than 2016 growth of 7.1%.
Growth has been constrained in the MENA region with 2.5% estimate growth due to the impact of geopolitical tensions and on-going security concerns. One of the core markets that is expected to perform at a considerable lower level against 2016 is the Kingdom of Saudi Arabia -0.7% (2016: 1.7%).
The growth in Sub-Saharan Africa is expected to increase to 2.7% against 1.4% in 2016.
In the USA, the growth forecast has been revised upwards, given the stronger than expected activity in 2017, higher projected external demand and the expected macroeconomic impact of the tax reform; in particular, the tax cuts and the temporary allowance for full expensing of investment. The economic growth 2017 is estimated at 2.3% compared to 1.5% in 2016.
Post-Brexit, Britain’s economy is underperforming. Sterling has depreciated, inflation has gone up. As a result, wages have been squeezed and investments have slowed down. The overall outlook for the UK in 2017 is 1.9% (2016: 1.9%).
Insurance and Reinsurance
The year 2017 will remain a prominent one in the reinsurance industry. According to Munich Re, natural catastrophe events in 2017 have caused record insurance and reinsurance market losses, with the total industry bill estimated at US$ 135 billion (representing 41% of economic loss for 2017 of US$ 330 billion). According to A.M. Best report published in early 2018, Lloyd’s share in these losses is estimated to reach US$ 4.8 billion, topping by this the list of insurers and reinsurers covering these catastrophes. Swiss Re also recently put 2017 insured natural disaster losses at the same level of US$ 131 billion. In fact, 2017 is the second most costly natural catastrophe year on an economic basis behind 2011 when the Tohoku earthquake and tsunami pushed economic losses for the year to US$ 345 billion, in today’s dollars.
The primary driver of the losses in 2017 was three Atlantic hurricanes in the third quarter. Harvey, Irma and Maria (HIM) which are estimated to have caused US$ 200 billion of economic losses and around US$ 80 billion of insured losses. In addition, other severe storms and wildfires in
California are set to become the costliest wildfire loss in US history with estimated insured losses at around US$ 8 billion.
According to Swiss Re’s data, the combined ratio of US Property & Casualty insurers is forecast to reach 109% in 2017, eight percentage points higher compared with 2016. The combined ratio for non-life reinsurer is estimated to hit 115%, mainly due to the hurricane losses, coupled with a number of other natural catastrophe events, including cyclone Debbie in Australia, earthquakes in Mexico and wildfires in California and Southern Europe. As a consequence, overall global industry profitability (ROE) for the full year is forecast to come in at around -4%.
Aon Benfield estimates that the global reinsurance capacity increased to US$ 600 billion at September 30, 2017. This figure includes conventional reinsurance as well as alternative capital. It is estimated that less than a third of 2017 losses fell into the private reinsurance market, representing a very manageable burden relative to the available capital base. 2017 losses have been absorbed without compromising the availability of reinsurance capacity, as more risk was being retained by primary insurers and more catastrophe exposure had been laid-off into the capital markets which confirm that the traditional reinsurers were well-capitalized. On the other hand, global reinsurance demand increased modestly during 2017 as a result of improved economics, the growing prevalence of risk-based capital regimes and emerging areas of risk transfer.
Capital availability and regulatory change are also resulting in new reinsurance company formations in rapidly developing and promising markets such as China and India.
According to the most recent report from PwC “US Insurance Deals Insights 1H2017”, M&A activity in the insurance sector more than tripled to US$10 billion in the first half of 2017 compared to US$2.9 billion the same period last year.
The reinsurance market is continuously adapting to the ever-changing political risk environment, particularly during the current climate of increasing global political instability. When combined with the rapid emergence of new technologies, big data and predictive analytics, insurers will be presented with major challenges in the coming years in order to stay relevant and close gaps in existing coverage.
In our region, the most powerful driver of insurance and reinsurance demand remains to be medical insurance, which continues to be the fastest growing line of business. This trend is driven by the introduction of new compulsory

6
REPORT OF THE BOARD OF DIRECTORS
ARAB INSURANCE GROUP (B.S.C.)
health insurance requirements which continue to evolve.
The region continues to remain attractive to global insurers and reinsurers, in view of the relatively low natural catastrophe exposure (except for Turkey, Iran, and Algeria). Overall, reinsurance pricing has moved up in lines and territories most affected by recent losses, but not to the expected level given the amount of new capital entering the sector.
ARIG’S POSITION
Despite the challenging market conditions and a major market fire loss in UAE (ADNOC refinery) which is currently estimated at US$ 1.2 billion - making it one of the costliest claims in the MENA region - the overall technical return for the Group remained positive at US$ 5.5 million (2016: US$ 14.7 million). Our Lloyd’s portfolio returned negative results of US$ 19.6 million (2016: loss of US$ 4.6 million) due to significant losses from most Lloyd’s syndicates, who in return were affected by the 2017 US hurricane losses. While keeping in mind fast recovery potentials resulting from improved terms of trade, especially in the US insurance market, the Company revisited during the 2018 renewals, its Lloyd’s portfolio and took corrective measures leading to the complete withdrawal from the worst performing syndicate.
Our non-life facultative portfolio showed, as in the previous years, a healthy performance of US$ 21.2 million (2016: US$ 11.0 million).
The life business performed well, comparing to the previous year, with technical results of US$ 1.1 million (2016: loss of US$ 2.5 million).
Our discontinued Takaful Re portfolio is also running off smoothly, and this has additionally benefited our bottom line by US$ 1.2 million (2016: US$ 1.2 million).
Gross written premiums were down by 8.1% for the year 2017, reflecting the negative influence of exchange rate movements, voluntary premium reductions in some under-performing accounts, mainly in the MENA region coupled with downward premium adjustments of our Lloyd’s portfolio. Additionally, premium income reduced following the closure of our Takaful Re and our Branches in Singapore and Labuan.
The upgrade of Arig rating by A.M Best to ‘A-’ in late December 2016 was too late to have any effect on our 2017 treaty portfolio. The impact was more on our Facultative business where we managed to increase the premiums during 2017 by US$ 9.5 million, representing a growth of 41.4%
The Company also continued to manage its operating expenses. Operating expenses have been reduced by 12.7% compared with last year.
Under the current challenging market conditions, we continue to identify new products and opportunities to look for alternative solutions to the challenges at hand to maintain the Company’s profitability.
The investment income increased by 15.5% in 2017 as compared to the previous year to reach US$ 22.3 million (2016: US$ 19.3 million) as a result of continuing positive equity returns. Our continued and well-executed investment strategy significantly contributed to the overall Group’s profit.
OUTLOOK
The world economic performance is expected to strengthen. Improved global manufacturing activities, a robust global trade, broadly favourable financing conditions and firming commodity prices amid an investment-led recovery in advanced economies are reaffirming this prediction. The IMF’s recent update estimated an overall projected world output of 3.9% for 2018. Emerging Markets and developing countries are expected to grow by 4.9% in the same period. The WEO stated that broad-based cyclical global recovery is underway, aided by a rebound in investment and trade, against the backdrop of benign financing conditions, generally accommodative policies, improved confidence and the dissipating impact of the earlier commodity price collapse. Global growth is expected to be sustained over the next couple of years and even accelerate somewhat in emerging market and developing economies (EMDEs) thanks to a rebound in commodity exporters.
In 2018, the Kingdom of Saudi Arabia and the United Arab Emirates have introduced VAT and the expectation is that other GCC countries will follow suit during 2018/2019 which may have inflation implication in the region.
After a challenging year that caused historically high natural catastrophe losses to reinsurers who were already affected by low rates and investment yields, 2018 is expected to offer an improved operating environment as a result of recovering terms of trade in addition to stronger economic growth.
Lloyd’s insurers’ outlook for 2018 is positive, as January renewals make for a promising start after several years of falling prices. Direct and facultative property business saw the highest price increases. Most price improvement has been seen in loss affected US business where rates went up by a minimum of 10%, with some rate rises as much

ANNUAL REPORT 2017
7
REPORT OF THE BOARD OF DIRECTORS
as 25%. For the remainder of 2018, pricing is expected to be strong despite the high level of available capital in the industry. This is in part because much of the upcoming renewals will be related to US wind exposed business, which was affected by large losses in 20171.
Premium growth and underwriting profitability are expected to pick up in 2018 and 2019, driven by an increase in the demand for non-life insurance. This growth will come predominantly from emerging markets, with premium growth forecast at 6% and 7% in 2018 and 2019 respectively in real terms. For advanced markets, modest improvements in macro conditions and accelerating inflation are expected to subdue real growth. In nominal terms, premium growth momentum is expected to accelerate marginally, driven by economic activity and moderate price increases2.
Rate increases during 2018 will be contingent on catastrophe loss experience during 2017. Insurers subjected to heavy catastrophe losses can expect significant rate increases, particularly those exposed to the most hard-hit areas such as the USA and Caribbean. There is a general consensus that these insurers will see rate rises as high as 20-30%. Conversely, rates are expected to remain flat for those insurers who have not been affected by such losses3.
The main sensitivities going forward are further large losses, unexpected movements in interest rates and developments that drive changes in market structure. Issues to watch for include the unwinding of quantitative easing, the progress of ‘Brexit’ negotiations, the impacts of US tax reform, the prospect of further sector consolidation and the creep of protectionism4.
At Arig, our focus will remain on maintaining a well-balanced portfolio, while benefitting from market opportunities in a controlled and opportunistic manner. At the same time we continue applying capital modelling techniques to ensure that our risk-adjusted capital remains at appropriate levels.
After the establishment of Arig Insurance Management (DIFC) (AIM) in Dubai during 2017, we intend to transform it into an “off balance-sheet” and purely fee-based operation. The aim is to further diversify and balance our income stream by adding a third column to our current operation, besides our primary activity as risk-carrier and investor.
We are, in line with the mentioned intention, entering into cover-holder agreements with a number of Lloyd’s syndicates. The objective is to write for, and on their behalf, niche products which are currently not offered by Arig or which could create synergy effects for both parties.
1 Sources: RBC Capital Markets analysts2 Swiss Re: “Global insurance review 2017 and outlook 2018 /19”3 Source: Guy Carpenter / Willis Re4 AON Benfield: “Reinsurance Market Outlook, Jan 2018”
The fact that AIM is located at the DIFC surely adds value in this regard. DIFC has positioned itself not only as an important reinsurance hub for the region, but also for business emanating from Africa. The majority of the leading reinsurance brokers are represented, in one way or another, at the DIFC. These brokers are controlling the placement of largely better performing corporate accounts, which should improve AIM’s access to such business.
The affirmation of Arig’s rating by A.M. Best allows us further access to business, where “A” rating is either a prerequisite, due to risk-based solvency regimes or where restrictions were previously placed due to management directives. For example, this applies to our engagement in facultative business, which is a targeted growth area or in many Far-Eastern markets.
In 2017, Arig expanded its development into Personal Lines business as a diversification tool, enjoying double digit reinsurance premium growth. Through its partnership with a pioneering Personal Lines technology company, it has been able to deliver a complete ‘front to back’ solution to one of its customers, enabling them in turn to deliver e-commerce insurance. Using these platforms, it is easier to launch and if necessary re-engineer product portfolios, as well as promote more effective cross selling as buyers establish online insurance profiles which can be interrogated intelligently for marketing. Furthermore, by using these digital developments, Arig is already in discussion with potential partners to expand its presence into more diverse markets.
Despite the current industry environment, Arig remains highly confident that we are well equipped to deal with the challenges at hand. Our reinsurance and investment portfolios are sufficiently diversified and our risk management is vigilant. We believe we can turn volatility into a profitable business across the business cycles by using our financial strength, market presence and third party relationships.
Our prime focus will remain on the protection of our policyholders and our shareholders’ capital, while providing reasonable returns on our equity.

8
ARAB INSURANCE GROUP (B.S.C.)
ACKNOWLEDGEMENTS
The Board takes this opportunity to express its gratitude to His Majesty the King, His Royal Highness the Prime Minister and His Royal Highness the Crown Prince for their wise leadership and encouragement for the insurance sector of the Kingdom of Bahrain. The Directors further extend their thanks to our business partners, clients, shareholders and the Central Bank of Bahrain for their support and cooperation throughout the year. The Directors also thank the Management team and the staff of Arig Group for their commitment, professionalism and sincere efforts.
On behalf of the Board of Directors
Saeed Mohammed AlBahhar Chairman13 February 2018

ANNUAL REPORT 2017
9
UAE Government 31.35%
Libya Government 14.45%
Kuwait Government 9.10%
Bahrain Government 0.84%
UAE Private 13.94%
Kuwait Private 9.04%
Other Private 21.28%
FINANCIAL HIGHLIGHTS
KEY FIGURES
PERCENTAGE OF SHAREHOLDING
As of 31 December 2017
(US$ million) 2017 2016 2015 2014 2013
Gross premiums written 225.6 245.4 220.4 315.3 262.0
Net earned premiums 179.9 180.5 219.9 256.4 237.7
Net profit (loss) 7.2 9.2 (4.4) 15.6 18.6
Investment assets 665.1 737.4 746.6 715.4 642.2
Total assets 1,086.1 1,114.4 1,099.1 1,104.3 1,056.6
Net technical provisions 568.1 589.9 613.7 635.6 619.6
Shareholders’ equity 256.9 256.6 244.2 264.5 249.2

10
1. Yassir Albaharna Chief Executive Officer
2. Firas El Azem General Manager - Reinsurance
3. Samuel Verghese Deputy General Manager - Finance & Administration
4. Rachid Mechouet Assistant General Manager - Reinsurance
ARAB INSURANCE GROUP (B.S.C.)
GENERAL MANAGEMENT

ANNUAL REPORT 2017
11
OPERATING AND FINANCIAL REVIEW

12
OPERATING AND FINANCIAL REVIEW
Yassir AlbaharnaChief Executive Officer
“
ARAB INSURANCE GROUP (B.S.C.)
Profitability and protection of our shareholders’ capital will remain to be our top priority.
“

ANNUAL REPORT 2017
13
OPERATING AND FINANCIAL REVIEW
Territorial split of Gross Written premium income
Middle East
Africa
Asia
Lloyd’s Accounts
39% 39%
11% 11%
REINSURANCE
The year 2017 will always be remembered as the year of natural catastrophe events, as much as years 2011 and 2001 conjure in the minds of professional reinsurers as most challenging. With estimated economic losses of US$ 330 billion1, 2017 turned out to be the second costliest year behind 2011 for natural catastrophes ever recorded (2011: US$ 380 billion). Over US$ 135 billion (2011: US$ 105 billion) of the losses were insured with reinsurers carrying the major load, out of which 59% of the losses emanated from three Atlantic hurricanes in the third quarter (Harvey, Irma and Maria) which are estimated to have caused US$ 200 billion of economic losses and around US$ 80 billion of insured losses2. These events made 2017 as one of the worst years recorded for the global reinsurance market.
According to Aon Benfield, the high impact of catastrophe losses over the period has not significantly impacted traditional equity capital, which has remained stable. Of the most affected reinsurers, some reported modest capital erosion, primarily driven by depleted earnings resulting in inadequate coverage for capital management activities. In contrast, companies with low U.S. and Caribbean exposure generally grew in terms of capital, with the overall picture benefitting from a weakening U.S. dollar. To a large extent, underwriting profit in other areas, favourable development in prior year reserves and investment income have offset these catastrophic losses.
Capital dedicated to reinsurance saw growth despite the impact of catastrophe losses in 2017. The resilience of the market was further demonstrated as there were no significant capital withdrawals over the period. There has also been a strong and favourable response from reinsurance and capital markets to those insurers who demonstrated superior data quality and loss mitigation strategies. Such measures enhance a company’s ability to provide customized risk transfer solutions and maximise protection for their risk profiles.
Global demand for reinsurance protection increased modestly during 2017, reflecting improved economics, the growing prevalence of risk-based capital regimes and emerging areas of risk transfer.
As regards the MENA region, despite a major fire loss in UAE which is one of the costliest claims in the region currently estimated at US$ 1.2 billion, it continues to remain attractive to global reinsurers, in view of the relatively low natural catastrophe exposure (except for Turkey, Iran, and Algeria). However, reinsurers remain concerned with the level of political instability as well as economic and social environment of the region. The main drivers for premium growth are, as in the previous years, stricter solvency requirements and growth in compulsory coverages such as motor and medical.
In Asia, countries with limited natural disaster exposures, such as Korea and Singapore, has witnessed buyers who continued to increase retentions to control reinsurance costs; whereas for those with larger natural catastrophe exposures, namely China, Philippines, Japan, Thailand, Taiwan, Indonesia and Vietnam, there is growing evidence of tighter placements such as buyer options with future flexibility reducing, but not yet to the extent of the hard market3.
The increase in loss activity in recent years is expected to lead to more underwriting scrutiny and improved terms and conditions. Arig looks forward to benefit from these improved conditions, particularly with affirmation of A.M. Best A- rating and the possession of key ingredients which are necessary for riding the market cycle and benefiting from our financial stability, professional expertise and geographical reach.
BUSINESS REVIEW
Portfolio development
The Company’s gross premiums written declined by 8.1% to US$ 225.6 million (2016: US$ 245.4 million) as a result of voluntary non-renewal of underperforming and inadequately priced accounts, in line with our prudent underwriting approach coupled with negative influence of exchange rate movements and downward premium adjustments of the Lloyd’s portfolio. Additionally, premium income reduced following the run-off of our subsidiary - Takaful Re and our Branches in Singapore and Labuan.
The regional premium distribution pattern changed comparing to last year, reflecting Arig’s aim to balance its geographical split towards 1/3rd per main markets (MENA, Lloyds and other markets). In line with this strategy, our Lloyd’s accounts’ share reduced from 45% to 39%, while the Middle East increased from 35% to 39%. On the other hand, our income from Africa went up by 2% points to reach 11%.
Diversification within our book of business remains one of Arig’s top priorities, while managing our risk exposures in a challenging market place. We are gradually shifting our portfolio away from regional treaty facilities towards lines where we have better control over our fortunes.
1 Munich Re: Natural Catastrophe Events in 20172 AON Benfield: “Reinsurance Market Outlook, Jan 2018”3 Willis Towers Watson: “Asia Insurance Market Report 2018”

14
OPERATING AND FINANCIAL REVIEW
ARAB INSURANCE GROUP (B.S.C.)
0% 5% 10%
0.7%
1.7%
1.7%
2.9%
2.9%
3.9%
8.1%
9.4%
10.3%
19.2%
39.2%
15% 20% 25% 30% 35% 40% 45%
Life
Property
Lloyd’s
Engineering
Medical
Others
Accident
Marine Cargo
Marine Hull
Extended Warranties
Marine Energy
Individual line contributions to Group’s Gross Written premium income
Our Facultative business increased in 2017 by US$ 9.5 million to reach US$ 32.4 million, representing a growth of 41.5% compared to the previous year. Reflecting the current reinsurance demand in developing markets, Property still dominates as a major class in our portfolio with 37.3% share of the total non-life non-Lloyd’s premium, followed by Medical and Engineering businesses with 20% and 15.9% respectively.
Life and Medical portfolio grew by 28.6% in 2017 to reach US$ 44.4 million. Personal lines will remain one of our major areas for development building on a customised solution approach with preferred insurance management partners in the region and by assisting our clients in exploring new sales channels.
Performance
Despite the challenging market conditions and the impact of major losses during 2017 on the Company’s reinsurance portfolio, the overall technical result for the Group remained positive at US$ 5.5 million (2016: US$ 14.7 million). Our Lloyd’s book reported a loss of US$ 19.6 million (2016: a loss of US$ 4.6 million) mainly due to significant losses reported by two syndicates. The major impact was attributable to US hurricane losses of US$ 14 million. The Company reviewed its Lloyd’s portfolio during 2018 renewal and withdrew from the worst performing syndicate as a corrective measure.
Same as in the previous years, the main profitability was driven by our facultative business which generated a technical result of US$ 21.2 million (2016: US$ 11.0 million).
Overall non-life treaties excluding Lloyd’s business produced a profit of US$ 2.8 million for the year (2016: US$ 10.7 million) where both Engineering and Medical lines contributed a profit of US$ 1.7 million each and Marine Cargo US$ 0.8 million. Property business generated a loss of US$ 0.6 million (mainly as a result of a major fire loss in UAE).
The life business performed well, comparing to the previous year, with technical results of US$ 1.1 million (2016: a negative result of US$ 2.5 million).
Run-off of our subsidiary Takaful Re’s portfolio, which ceased operation in 2015, is in line with our exit strategy and this has additionally contributed to our bottom line by US$ 1.2 million (2016: US$ 1.2 million).
(10,000)
(5,000)
-
5,000
10,000
20,000
(20,000)
25,000
(25,000)
15,000
(15,000)
Treaty
Pror
ata
Treaty
XL
Facult
ative
Lloyd
's Acc
ounts Lif
e
Total
Tech
nical
Result
s
Group Technical Result by source (in US$ 000)
Propert
y
Accide
nt
Engine
ering
Marine
Carg
o
Marine
Hull
Medica
l
Extend
ed W
arran
ties
Marine
Ene
rgy
Aviatio
nOthe
rs
Lloyd
’s Acc
ounts Lif
e
5,000
-
10,000
15,000
(10,000)
(5,000)
(20,000)
(25,000)
(15,000)
Group Technical Result by line (in US$ 000)

ANNUAL REPORT 2017
15
OPERATING AND FINANCIAL REVIEW
Risk Capital Position
As has been the Company’s practice, we commissioned independent external actuaries to provide an updated estimate of the amount of capital required to cater for risk events throughout the Group’s operations at a 1:200 probability, or 99.5th percentile. Arig’s Economic Capital shows significant redundancy against the Company’s shareholders equity at this confidence level.
This demonstrates that the Group is offering substantial financial security to its clients, even in a stressed model scenario. Arig’s reinsurance book has seen limited changes over the position one year ago. Key drivers for the Group’s risk capital are underwriting risk and reserve risk, followed by market risk, operational risk and credit risk. During 2017, market risk has seen a notable decrease, while reserve risk decreased moderately. All movements combined resulted in a marginal decrease in the Group’s Economic Capital requirement.
As it was endorsed through actuarial analysis, we remain highly confident that the diversity and the quality of the Group’s portfolio provide solid protection to Arig’s reinsured clients and shareholders’ capital alike.
Outlook
The world economic performance is expected to improve, reflecting improved global manufacturing activities, a robust global trade, favourable financing conditions and firming commodity prices. The IMF’s recent update estimated an overall projected world output of 3.9% for 2018. Emerging markets and developing economies are expected to grow by 4.9% in 2018, against a projected growth of 2.3% in the advanced economies.
Going forward, pricing conditions and underwriting profitability are predicted to improve after a challenging year affected by historically high natural catastrophe losses, as a result of recovering terms of trade in addition to stronger economic growth. There is now an increasing opportunity to benefit from the higher prices currently charged for natural catastrophe related covers, particularly in areas which were hit by recent claims. S&P reported that rate increases in response to the catastrophe events of 2017 were broadly in line with their expectations, with the highest rate increases achieved in the most loss-affected lines. Rate strengthening continues to be a hot topic in 2018 and S&P expect increases to continue through the remainder of the year especially with Florida and Puerto Rico up for renewal in the first half, with expectations of double-digit rate increases in these regions. Lloyd’s insurers’ outlook for 2018 is positive, as January renewals make for a favourable start after several years of falling prices especially in USA, which should provide reinsurers a chance to recover from 2017 major losses.
Similar as the previous years, Arig will continue to set prudent targets. Profitability and protection of our shareholders’ capital will remain to be our top priority. Balancing bottom and top lines remains our main challenge, especially in a soft market. In this context, we will be reasonably ‘technical’ in our underwriting approach, while targeting business opportunities in opportunistic manner. We intend to maximise the increased prospects generated by the affirmation of our ‘A-’ rating by focusing more on facultative business. While willing to invest into our future, the Company continues to look for ways to reduce its expenses, without compromising its professional standards.
Our focus on continued profitability to the benefit of all stakeholders will remain our guiding force in the future.
INVESTMENTS
All major economic blocs recorded growth in 2017. Since the financial crisis of the last decade, this was the first synchronous global expansion.
Short-term US interest rates rose in the year. However, this did not perturb the financial markets. Inflationary expectations continue to be low. A scenario of better economic growth, higher corporate earnings and benign inflation was a stimulus to the equity markets. The Morgan Stanley World Index rose 20.1%. In the US, the S&P 500 rose 19.4%. Most other developed and emerging equity markets registered gains.
The monetary policies of Central Banks continued to diverge. The ECB kept key interest rates unchanged and continued with its Asset Purchase program. The Bank of England joined the Federal Reserve in raising its Official Bank rate. The Bank of Japan maintained its short-term Policy Balance Rate at minus 0.1%. In spite of the better economic environment, Central Banks were very cautious in their actions.
The strategies of the Central banks impacted yields in the fixed income markets. European government bonds with a tenor of six years and less recorded negative yields. The Bank of Japan set a target yield of 0% on ten year Japanese Government Bonds. The benchmark ten year US Treasury Note closed marginally down for the year.
In this paradigm, there was a move into riskier assets such as High Yield bonds. There was also a move out of US dollar-denominated assets. Reflecting this, the Bloomberg Dollar Index weakened 8.5%.
A declining dollar and a well-executed production cut by OPEC buoyed crude oil. West Texas Intermediate futures closed the year above US$ 60 a barrel a level not breached since the middle of 2015.
16
ARAB INSURANCE GROUP (B.S.C.)
OPERATING AND FINANCIAL REVIEW
We continue to be conservative in our allocation and do not invest in strategies that are the flavour of the season. In line with the risk tolerance of the Group, our investment strategy remained unaltered. At the year-end, the Group’s investments stood at US$ 665.1 million (2016: US$ 737.4 million) with 86.1% allocated to cash, short-term securities, and bonds. Group’s investment income generated in 2017 was US$ 22.3 million (US$ 19.3 million in 2016).
At the time of this report, short-term US dollar money market rates such as six month LIBOR have increased. The dollar continues to weaken. Relatively riskier assets such as emerging markets are attracting sizeable inflows. The level of returns on investment grade short duration fixed income securities still continues to be low by historical standards. This phenomenon is a challenge to investors like Arig.
We will continue to manage a diversified low-risk portfolio within the Company’s avowed investment risk appetite, carefully balancing market opportunities against our standing obligation to policyholders and shareholders. We still are at a low point in the interest rate cycle. Preservation and safety of capital at this juncture is paramount to exploit opportunities in the investment cycle later. SUBSIDIARIES
Takaful Re Limited (TRL)
The Group’s Islamic reinsurance subsidiary, TRL, which was placed in run-off in April 2016 reported a net profit of US$ 2.3 million (2016: US$ 2.2 million) for the year. Arig’s share in the profit was US$ 1.2 million (2016: US$ 1.2 million).
TRL’s investments yielded an average return of 1.5% (2016: 1.8%) with investment earnings of US$ 1.3 million (2016: US$ 1.9 million). The Company maintained its conservative investment strategy with a high degree of liquidity. About 52% (2016: 64%) of the US$ 71.0 million (2016: US$ 104.6 million) of invested assets were held in cash and short-term Islamic deposits.
The Shareholders’ of TRL at their EGM on 17 October 2017, resolved to reduce the share capital from US$ 125 million to US$ 100 million. This reduction was effected after obtaining necessary approvals from TRL’s regulator, Dubai Financial Services Authority.
Gulf Warranties (GW)
Gulf Warranties recorded a loss of US$ 0.1 million for the year (2016: profit US$ 0.1 million). Arig’s share of this loss was US$ 0.1 million. Amidst challenging market conditions, the company recorded warranty revenues of US$ 2.3 million (2016: US$ 4.1 million) while non-warranty income contributed US$ 0.4 million (2016: US$ 0.7 million) for the year.
Arig Capital Limited (ACL)
ACL is a registered and fully owned corporate member at Lloyd’s of London that allows Arig to share in business written by Lloyd’s syndicates. In 2017, ACL wrote business through five syndicates namely Apollo, Argo, Barbican, Standard and Accapella, generating gross written premiums of US$ 88.6 million (2016: US$ 110.9 million). ACL retains limited risk for its net account and cedes most of its business to the parent company. ACL recorded a loss of US$ 2.7 million for the year (2016: net loss US$ 0.4 million) mainly impacted by US hurricane losses.
Arig Insurance Management (DIFC) Limited (AIM)
AIM will start active underwriting in the first half of 2018. The company is finalizing the Lloyds Cover Holder procedures. Capacity for 3 Special Lines products has been secured with a large Lloyd’s Syndicate. Negotiations with several Reinsurers are in various stages of development (both Lloyd’s and International capacities).

ANNUAL REPORT 2017
17
ARAB INSURANCE MARKET REVIEW
As a service to the industry, Arig is pleased to present general information
collated from the Arab insurance markets

18
ARAB INSURANCE MARKET REVIEW
ARAB INSURANCE GROUP (B.S.C.)
Non-Life Life
Country Year Exchange Rate Total GPI Motor
Property & Misc.
Accident
Marine & Aviation
Total Non-Life % of GPI Total % of GPI
Algeria 2012 77.5360 1,240.3 674.0 445.3 68.1 1187.4 95.7% 52.9 4.3%
2013 80.3520 1,428.7 769.5 488.8 72.4 1330.7 93.1% 98.0 6.9%
2014 80.5790 1,475.5 761.4 531.4 78.9 1371.7 93.0% 103.8 7.0%
2015 100.6914 1,222.6 657.9 457.8 57.2 1,172.9 95.9% 49.7 4.1%
2016 110.5200 1,182.7 590.4 427.5 62.8 1,080.7 91.4% 102.0 8.6%
Bahrain 2012 0.3769 634.0 164.5 291.3 18.6 474.4 74.8% 159.6 25.2%
2013 0.3769 685.5 180.5 322.4 16.1 519.0 75.7% 166.5 24.3%
2014 0.3769 718.4 191.7 354.6 21.2 567.5 79.0% 150.9 21.0%
2015 0.3769 721.9 201.1 355.2 19.7 576.0 79.8% 146.0 20.2%
2016 0.3769 730.8 209.3 359.7 15.8 584.8 80.0% 146.0 20.0%
Egypt(1) 2012 6.0561 1,770.5 330.8 434.4 240.2 1005.4 56.8% 765.1 43.2%
2013 6.8886 1,812.1 308.9 461.7 241.5 1012.1 55.9% 800.0 44.1%
2014 7.0900 1,812.1 308.9 461.7 241.5 1012.1 51.6% 876.3 48.4%
2015 7.6913 2,168.4 340.2 527.3 188.0 1055.5 48.7% 1,112.9 51.3%
2016 8.1382 2,130.1 363.1 645.5 98.5 1,107.1 52.0% 1,023.0 48.0%
Jordan 2012 0.7080 679.7 273.3 300.8 42.7 616.8 90.7% 62.9 9.3%
2013 0.7090 692.2 282.2 303.2 39.9 625.3 90.3% 66.9 9.7%
2014 0.7090 738.8 300.2 323.5 40.3 664.0 89.9% 74.8 10.1%
2015 0.7090 776.1 310.1 345.8 34.1 690.0 88.9% 86.1 11.1%
2016 0.7078 813.7 317.2 373.3 31.2 721.7 88.7% 92.0 11.3%
Kuwait 2012 0.2816 763.7 269.7 256.8 64.7 591.2 59.1% 312.5 40.9%
2013 0.2838 815.0 313.6 254.9 64.9 633.0 77.7% 182.0 22.3%
2014 0.2838 869.2 321.6 295.0 62.1 678.2 78.0% 191.0 21.9%
2015 0.3039 1,048.0 n/a n/a n/a 874.0 83.4% 174.0 16.6%
2016 0.3025 1,115.0 n/a n/a n/a 932.0 83.6% 183.0 16.4%
Lebanon 2012 1,504.0000 1,294.9 323.7 559.4 35.0 918.1 71.9% 364.1 28.1%
2013 1,505.0000 1,389.2 327.0 618.4 41.0 986.4 71.9% 390.9 28.1%
2014 1,507.5000 1,479.2 347.9 655.9 41.8 1,045.6 70.7% 433.6 29.3%
2015 1,501.8000 1,521.0 249.8 669.8 43.6 1,063.2 69.9% 457.8 30.1%
2016 1,514.3800 1,574.0 340.3 737.3 14.4 1,092.0 69.4% 482.0 30.6%
Libya 2012 1.2251 273.9 47.4 187.0 33.3 267.7 97.7% 6.2 2.3%
2013 1.2515 n/a n/a n/a n/a n/a n/a n/a n/a
2014 1.1950 n/a n/a n/a n/a n/a n/a n/a n/a
2015 1.3921 n/a n/a n/a n/a n/a n/a n/a n/a
2016 1.4006 n/a n/a n/a n/a n/a n/a n/a n/a
Mauritania 2012 288.0800 27.3 n/a n/a n/a 27.0 98.9% 0.2 1.1%
2013 288.0800 28.3 n/a n/a n/a 28.0 98.9% 0.3 1.1%
2014 292.5000 28.3 n/a n/a n/a 28.0 98.9% 0.3 1.1%
2015 317.6500 30.3 n/a n/a n/a 30.0 99.0% 0.3 1.0%
2016 356.4100 n/a n/a n/a n/a n/a n/a n/a n/a
Morocco 2012 8.2471 3,162.3 972.5 1,096.5 76.2 2,145.2 67.8% 1,017.1 32.2%
2013 8.4055 3,164.8 1,010.9 1,062.1 69.9 2,142.8 67.7% 1,022.0 32.3%
2014 8.4063 3,356.9 1,083.8 1,087.6 67.6 2,239.0 66.7% 1,117.9 33.3%
2015 9.9666 3,052.6 957.4 984.1 55.4 1,992.9 65.3% 1,059.7 34.7%
2016 9.8877 3,531.1 1,006.7 1,020.4 58.5 2,085.6 59.1% 1,445.5 40.9%
Oman 2012 0.3845 738.6 353.1 248.5 31.7 633.3 84.6% 114.0 15.4%
2013 0.3850 774.5 383.4 265.3 37.8 686.5 87.3% 98.2 12.7%
2014 0.3850 1,035.0 486.4 418.9 34.7 940.0 90.8% 95.0 9.2%
2015 0.3845 1,124.0 423.1 526.0 37.1 986.3 87.7% 137.7 12.3%
2016 0.3850 1,170.9 410.7 549.0 35.3 995.0 85.0% 175.9 15.0%
(1) Egypt: Financial Year end as at 30 June (2) Saudi Arabia: Property & Miscellaneous Accident includes Energy.
Gross premium by class and country - 2012 to 2016 in US$ million

ANNUAL REPORT 2017
19
ARAB INSURANCE MARKET REVIEW
Definition of gross premium income: This report is based on gross premium income, which includes direct and reinsurance inward premiums received in the year, net of cancellations but before deduction of commissions or reinsurance premiums ceded. Portfolio split
includes four main lines of business:
• Motor: Two main lines: Third Party and Comprehensive (in some cases, the classes under Motor were not available).
• Property & Miscellaneous Accident: Fire, Engineering, General Accident, Personal Accident, Workmen’s Compensation, Medical, Public Liability, etc.
• Marine & Aviation: Aviation, Marine Cargo, Marine Hull and Inland Cargo.
• Life: Individual Life and Group Life.
Insurance and economic data sources: Insurance data for each country is sourced primarily from supervisory authorities, insurance associations and individual companies. Key economic data is extracted from public sources, including reports and documents from the
World Bank. Premiums are converted into US dollars using official IMF exchange rates as of 31st December of respective year.
Non-Life Life
Country Year Exchange Rate Total GPI Motor
Property & Misc.
Accident
Marine & Aviation
Total Non-Life % of GPI Total % of GPI
Palestine 2012 3.5880 144.4 87.9 51.2 1.7 140.9 97.5% 3.6 2.5%
2013 3.5880 158.7 92.5 60.6 1.8 154.9 97.6% 3.8 2.4%
2014 3.5880 171.0 100.5 64.9 1.7 167.1 97.7% 3.9 2.3%
2015 3.5880 n/a n/a n/a n/a n/a n/a n/a n/a
2016 n/a n/a n/a n/a n/a n/a n/a n/a n/a
Qatar 2012 3.6408 1,114.6 238.72 862.8 149.3 1,242.0 98.5% 16.6 1.5%
2013 3.6409 1,471.0 455.06 n/a n/a 1,407.0 98.8% 17.9 1.2%
2014 3.6400 1,471.0 625.27 n/a n/a 2,118.0 95.6% 64.0 4.4%
2015 3.6404 n/a 1124.00 n/a n/a 2,761.0 n/a 72.0 n/a
2016 3.6410 2,936.0 n/a n/a n/a 2889.0 98.4% 47.0 1.6%
Saudi Arabia(2) 2012 3.7503 5,645.8 1,234.9 3,958.0 216.0 5,408.9 95.8% 236.9 4.2%
2013 3.7500 6,730.5 1,694.6 4,453.3 357.4 6,505.3 96.7% 225.2 3.3%
2014 3.7520 7,746.5 2,140.3 4,993.6 371.4 7,505.3 96.9% 241.2 3.1%
2015 3.7500 9,712.1 2,879.8 6,193.5 382.8 9,456.1 97.4% 256.0 2.6%
2016 3.7504 9,996.0 3,241.8 6,267.6 206.4 9,715.8 97.2% 280.2 2.8%
Sudan 2012 2.6769 337.2 145.9 118.0 59.0 322.9 95.8% 14.3 4.2%
2013 5.7013 315.6 146.1 90.2 64.8 301.1 96.4% 11.5 3.6%
2014 2.6769 n/a n/a n/a n/a n/a n/a n/a n/a
2015 6.0969 n/a n/a n/a n/a n/a n/a n/a n/a
2016 6.5420 n/a n/a n/a n/a n/a n/a n/a n/a
Syria 2012 139.7700 150.6 94.9 39.4 13.3 147.6 40.7% 89.4 59.3%
2013 139.7700 155.7 40.4 57.1 10.2 107.6 69.2% 48.0 30.8%
2014 168.7000 94.3 38.6 15.7 4.5 58.7 62.3% 35.6 37.7%
2015 221.0968 32.2 17.3 11.2 2.4 30.9 96.6% 1.1 3.4%
2016 213.3110 44.6 20.7 19.0 3.3 43.0 96.4% 1.6 3.6%
Tunisia 2012 1.5619 846.2 358.9 298.6 49.7 707.2 83.6% 139.0 16.4%
2013 1.6247 986.8 386.5 338.0 44.6 769.1 85.8% 140.0 14.2%
2014 1.7000 915.3 415.8 298.0 42.6 756.4 87.0% 158.9 13.0%
2015 2.0221 830.3 379.2 232.9 68.9 681.0 82.2% 149.3 17.9%
2016 2.2558 823.3 369.7 260.7 26.1 656.5 79.7% 166.8 20.3%
U.A.E. 2012 3.6728 7,154.6 1,091.0 3,808.9 632.1 5,532.0 77.3% 1,622.6 22.7%
2013 3.6725 8,036.8 1,226.9 4,426.6 465.8 6,119.3 76.1% 1,917.4 23.9%
2014 3.6730 8,473.1 1,384.4 4,426.6 453.8 6,119.3 72.2% 2,353.8 27.8%
2015 3.6725 9,783.9 1,532.5 5,367.0 448.4 7,347.9 75.1% 2,436.0 24.9%
2016 3.6728 10,237.0 1,758.9 5,452.3 577.8 7,789.0 76.1% 2,448.0 23.9%
Yemen 2012 214.3508 85.5 17.8 45.6 14.0 77.4 90.5% 8.1 9.5%
2013 214.8900 82.7 19.0 39.5 15.1 73.6 89.0% 9.1 11.0%
2014 214.8900 n/a 19.8 45.0 15.9 80.7 n/a n/a n/a
2015 214.8900 101.2 15.5 66.2 9.5 91.2 90.1% 10.0 9.9%
2016 250.1500 83.9 13.3 55.2 8.0 76.5 91.2% 7.4 8.8%
Iraq 2012 1,162.0000 n/a n/a n/a n/a n/a n/a n/a n/a
2013 1,161.0000 n/a n/a n/a n/a n/a n/a n/a n/a
2014 1,162.0000 n/a n/a n/a n/a n/a n/a n/a n/a
2015 1,165.0000 n/a n/a n/a n/a n/a n/a n/a n/a
2016 1,165.0001 n/a n/a n/a n/a n/a n/a n/a n/a
Gross premium by class and country - 2012 to 2016 in US$ million

20
ARAB INSURANCE MARKET REVIEW
ARAB INSURANCE GROUP (B.S.C.)
Country Year Exchange Rate
Total GPI in US$
million
Premium per capita
US$
GDP per capita US$
Premium as % of GDP
Populationin
million
GDP in US$ million
Algeria 2012 77.5360 1,240.3 33.98 5,096 0.7% 36.50 186,000
2013 80.3520 1,428.7 38.61 5,681 0.7% 37.00 210,183
2014 80.5790 1,475.5 36.98 5,664 0.7% 39.90 226,000
2015 100.6914 1,222.6 30.82 4,205 0.7% 39.67 166,800
2016 110.5200 1,182.7 29.35 3,772 0.8% 40.30 152,000
Bahrain 2012 0.3769 634.0 480.30 20,332 2.4% 1.32 26,838
2013 0.3769 685.5 507.78 24,444 2.1% 1.35 33,000
2014 0.3769 718.4 532.15 25,219 2.1% 1.35 34,045
2015 0.3769 721.9 523.12 22,555 2.3% 1.38 31,126
2016 0.3769 730.8 545.37 23,776 2.3% 1.34 31,860
Egypt(1) 2012 6.0561 1,770.5 21.10 2,913 0.7% 83.90 244,400
2013 6.8886 1,812.1 22.07 3,313 0.7% 82.10 271,973
2014 7.0900 1,812.1 21.73 3,429 0.6% 83.40 286,000
2015 7.6913 2,168.4 23.70 3,615 0.7% 91.51 330,779
2016 8.1382 2,130.1 22.83 3,567 0.6% 93.30 332,800
Jordan 2012 0.7080 679.7 104.57 4,769 2.2% 6.50 31,000
2013 0.7090 692.2 104.88 5,152 2.0% 6.60 34,000
2014 0.7090 738.8 99.84 4,939 2.0% 7.40 36,550
2015 0.7090 776.1 102.30 4,943 2.1% 7.59 37,517
2016 0.7078 813.7 105.68 5,078 2.1% 7.70 39,100
Kuwait 2012 0.2816 763.7 263.34 57,931 0.5% 2.90 168,000
2013 0.2838 815.0 281.31 54,368 0.5% 3.37 183,219
2014 0.2838 869.2 248.34 51,143 0.5% 3.50 179,000
2015 0.3039 1048.0 269.40 29,316 0.9% 3.89 114,041
2016 0.3025 1,115.0 278.75 31,400 0.9% 4.00 125,600
Lebanon 2012 1,504.0000 1294.9 301.14 10,186 3.0% 4.30 43,800
2013 1,505.0000 1389.2 323.07 10,314 3.1% 4.30 44,352
2014 1,507.5000 1479.2 301.89 9,388 3.2% 4.90 46,000
2015 1,501.8000 1521.0 260.00 8,049 3.2% 5.85 47,085
2016 1,514.3800 1,574.0 266.78 8,034 3.3% 5.90 47,400
Libya 2012 1.2251 273.9 42.14 14,108 0.30% 6.50 91,700
2013 1.2515 n/a n/a 12,170 n/a 6.20 75,456
2014 1.1950 n/a n/a 6,661 n/a 6.20 41,300
2015 1.3921 n/a n/a 5,534 n/a 6.27 34,699
2016 1.4006 n/a n/a 12,262 n/a 6.45 34,700
Mauritania 2012 288.0800 27.3 7.71 1,268 0.6% 3.54 4,490
2013 288.0800 28.3 7.65 1,359 0.6% 3.70 5,028
2014 292.5000 28.3 7.45 1,128 0.7% 3.80 4,286
2015 317.6500 30.3 7.46 1,340 0.6% 4.06 5,442
2016 356.4100 n/a n/a 1,078 n/a 4.30 4,633
Morocco 2012 8.2471 3,162.3 97.00 2,945 3.3% 32.60 96,000
2013 8.4055 3,164.8 96.19 3,191 3.0% 32.90 105,000
2014 8.4063 3,356.9 100.21 3,360 3.0% 33.50 112,552
2015 9.9666 3,052.6 88.98 2,932 3.0% 34.30 100,593
2016 9.8877 3,531.1 101.47 2,943 3.4% 34.80 102,400
Oman 2012 0.38450 738.6 232.26 22,956 1.0% 3.18 73,000
2013 0.38500 774.5 213.36 20,937 1.0% 3.63 76,000
2014 0.38500 1,035.0 486.40 20,659 1.3% 3.90 80,570
2015 0.38450 1,124.0 250.30 15,553 1.6% 4.49 69,831
2016 0.38502 1,170.9 254.54 14,196 1.8% 4.60 65,300
Key economic & demographic indicators - 2012 to 2016

ANNUAL REPORT 2017
21
ARAB INSURANCE MARKET REVIEW
Country Year Exchange Rate
Total GPI in US$
million
Premium per capita
US$
GDP per capita US$
Premium as % of GDP
Populationin
million
GDP in US$ million
Palestine 2012 3.5880 144.4 34.63 1,630 2.1% 4.17 6,797
2013 3.5880 158.7 35.90 1,561 2.3% 4.42 6,899
2014 3.5880 171.0 37.58 1,516 2.5% 4.55 6,900
2015 3.5880 n/a n/a n/a n/a 4.65 n/a
2016 n/a n/a n/a n/a n/a 5.65 n/a
Qatar 2012 3.6408 1,114.6 586.63 108,947 0.5% 1.90 207,000
2013 3.6409 1,471.0 677.88 93,295 0.7% 2.17 202,450
2014 3.6400 1,471.0 700.48 100,048 0.7% 2.10 210,100
2015 3.6404 n/a n/a 74,163 n/a 2.22 164,641
2016 3.6410 2,936.0 1276.52 63,957 2.0% 2.30 147,100
Saudi Arabia(2) 2012 3.7503 5,645.8 196.72 21,254 0.9% 28.70 610,000
2013 3.7500 6,730.5 233.70 26,181 0.9% 28.80 754,000
2014 3.7520 7,746.5 263.49 26,458 1.0% 29.40 777,870
2015 3.7500 9,712.1 307.93 20,482 1.5% 31.54 646,002
2016 3.7504 9,996.0 311.40 19,925 1562.9% 32.10 639,600
Sudan 2012 2.6769 337.2 7.97 1,976 0.4% 42.30 83,600
2013 5.7013 315.6 7.44 2,011 0.4% 42.40 85,272
2014 2.6769 n/a n/a 2,080 n/a 42.40 88,171
2015 6.0969 n/a n/a 2,415 n/a 40.23 97,156
2016 6.5420 n/a n/a 2,344 n/a 40.78 95,580
Syria 2012 139.7700 150.6 n/a n/a n/a n/a n/a
2013 139.7700 155.7 n/a n/a n/a n/a n/a
2014 168.7000 94.3 n/a n/a n/a n/a n/a
2015 221.0968 32.2 1.72 n/a n/a 18.7 n/a
2016 213.3110 44.6 2.42 n/a n/a 18.4 n/a
Tunisia 2012 1.5619 846.2 78.06 4,328 1.8% 10.84 46,920
2013 1.6247 986.8 90.95 4,240 2.1% 10.85 46,000
2014 1.7000 915.3 82.46 4,425 1.9% 11.10 49,122
2015 2.0221 830.3 74.77 3,875 1.9% 11.10 43,015
2016 2.2558 823.3 72.22 3,667 2.0% 11.40 41,800
U.A.E. 2012 3.6728 7,154.6 1,460.12 74,286 2.0% 4.90 364,000
2013 3.6725 8,036.8 864.17 41,269 2.1% 9.30 383,799
2014 3.6730 8,473.1 901.40 43,723 2.1% 9.40 411,000
2015 3.6725 9,783.9 1,068.11 40,425 2.6% 9.16 370,296
2016 3.6728 10,237.0 1,100.75 38,387 2.9% 9.30 357,000
Yemen 2012 214.3508 85.5 3.38 1,653 0.2% 25.30 41,825
2013 214.8900 82.7 3.25 1,415 0.2% 25.41 35,955
2014 214.8900 n/a n/a 1,655 n/a 26.18 43,331
2015 214.8900 101.2 3.86 1,439 0.3% 26.23 37,734
2016 250.1500 83.9 2.80 911 0.3% 29.98 27,320
Iraq 2012 1,162.0000 n/a n/a n/a n/a n/a n/a
2013 1,161.0000 n/a n/a n/a n/a n/a n/a
2014 1,162.0000 n/a n/a n/a n/a n/a n/a
2015 1,165.0000 n/a n/a n/a n/a n/a n/a
2016 1,165.0001 n/a n/a n/a n/a n/a n/a
Key economic & demographic indicators - 2012 to 2016

22
ARAB INSURANCE GROUP (B.S.C.)

ANNUAL REPORT 2017
23
CORPORATE GOVERNANCE REPORT

24
CORPORATE GOVERNANCE REPORT
ARAB INSURANCE GROUP (B.S.C.)
Arig is committed to follow international Best Practices of Corporate Governance. We firmly believe that there is a link between strong ethical standards, good governance and the creation of shareholder value. In our communication with stakeholders and the general business community, we aim to be fully transparent through high standards of disclosure.
Bahrain Corporate Governance Code
The Company follows the Bahrain Corporate Governance Code (“Code”). This Corporate Governance Report is also included as a separate item as part of agenda for the Annual General Meeting.
Framework
The Company, through its Board of Directors, maintains a governance framework in all areas of its operations, which includes formalised policies, procedures, guidelines and relevant management reporting requirements. Arig’s governance practices are reviewed on a regular basis and amended from time to time.
The Board of Directors
The members of the Board are elected and can be terminated by the shareholders of the Company in accordance with the provisions under the Articles of Association. The Board holds the ultimate responsibility for the overall direction, supervision and control of the Company. It regularly assesses the Company’s financial and commercial performance and approves its business plan. The Board continuously oversees the corporate governance processes in order to ensure good standards within the Company. The Board further reviews and assesses the adequacy of the management of all risks the Company may be exposed to.
The current Board was elected by the shareholders at the Annual General Meeting in March 2017 for a period of three years and its term will end at the 2020 Annual General Meeting. Formalised Board procedures enhance the professional development of the Board members and include induction training to new directors, continuous learning and self-evaluation. The names of the current directors and biographical details are set out in page 30.
Members of the Board are all non-executive. Three out of six-members are independent non-executive directors. The Board formally reviews and evaluates its own performance together with the performance of the individual directors, as required by the Code.
Board Committees
While principal matters are handled by the Board, separate Committees are mandated to assist the Board in carrying out its duties in an efficient manner. The Audit and Risk Committee oversees financial reporting, internal controls, risk management and compliance. The Nomination and Remuneration Committee is tasked to review the nomination and compensation of the Board of Directors and the members of the Company’s General Management. All Board Committees meet periodically to achieve their objectives and also annually assess their own efficiency.
Board Meetings
According to the Articles of Association and local regulations, the Board is required to meet at least four times in a year. In addition to the seven meetings held in person during 2017, the Board approved the first and the second quarter results through circular resolution.
The following table lists the number of meetings held during 2017, including Board Committees and the individual attendance:

ANNUAL REPORT 2017
25
CORPORATE GOVERNANCE REPORT
DirectorsBoard
Meetings (7) **
Audit & Risk Committee
(4) **
Nomination & Remuneration
Committee (2) **
Saeed Mohammed AlBahhar * 7 N 2
Mohamed Saif AlHameli 6 N N
Mohamed Saif AlSuwaidi 7 N 2
Wael Ibrahem Abu Khzam 6(6) 3(3) 1(1)
Ahmed Saeed AlMahri * 6(6) 3(3) 1(1)
Dr. Bader Abdulla AlJaberi * 6(6) 3(3) 1(1)
Management
Responsibilities of the Chairman and the Chief Executive Officer (CEO) are separated. The Chairman of the Board is responsible for the leadership of the Board, ensuring its effectiveness in all aspects of its role and setting its agenda, taking into account the issues relevant to the Company and the concerns of all Board members.
The CEO executes leadership in the day-to-day management of the Company. The General Management team headed by CEO is responsible for the implementation of the Board strategies and the monitoring of its day-to-day operations. The team includes the General Manager - Reinsurance, Deputy General Manager - Finance & Administration, and Assistant General Manager – Reinsurance, as its members. The names of members of the General Management Team are set out in page 31 together with their biographical details.
Directors’ and General Management Compensation
The Directors’ remuneration is determined in accordance with the Bahrain Commercial Companies Law and the provision under the Company’s Articles of Association, and is approved by the shareholders. Directors’ compensationincludes remuneration, allowances and reimbursement of
expenses. The compensation of the General Management is determined by the Board of Directors based on the recommendations of the Nomination and Remuneration Committee, and includes salaries, allowances, reimbursement of expenses, post-employment benefits and performance related incentives (for further information please see page 76). Details as required under the Code are held at Company’s premises for the availability of the shareholders.
Organisational Structure
The Company has put in place a detailed organisational structure (shown on page 29) to achieve the Company’s objectives, its strategic development and internal controls.
Management Committees
In order to assist the CEO in guiding and monitoring the functional departments within the Company, a number of internal management Committees are operative, in addition to Group Management Committee.
These include the areas of Reinsurance Management, Information Technology and Retrocession. Members are drawn from within the Company and in accordance with their relevant areas of expertise.
• N-Not a member• * - Independent Non-Executive Director• ** - Board members retired in 2017 attended one meeting

26
CORPORATE GOVERNANCE REPORT
ARAB INSURANCE GROUP (B.S.C.)
Succession Planning
The Company recognises the value of its human resource and the significance of ensuring qualified and orderly successions. It operates a succession planning framework covering key positions within the Company, and talent development programs based on periodical training needs analysis. The Nomination & Remuneration Committee is in charge of reviewing and approval of the succession plan.
Policy on the Employment of Relatives As required by the CBB Rulebook, the Company has formulated a policy on the employment of relatives of the approved persons.
Key Persons Dealing in Arig Securities
Arig has an established policy with regard to key persons dealing in Arig securities, which complies with the Bahrain Bourse guidelines and the Rulebook Volume 6 (Capital Markets) issued by the Central Bank of Bahrain. During the year, the Company has complied with relevant reporting and monitoring requirements as they are stipulated under these regulations.
Following are the details of Arig shares held by members of the Board, including their representatives, and members of the General Management, including their spouses, children or other persons under their control:
Directors General Management
Shares held at 1 January 2017 101,240,717 9,166
Add: Shares acquired during the year - -
Less: Shares held by Directors /General Management retired during the year
459,178 9,166
Shares held at 31 December 2017 100,781,539 -
Investor Relations
Arig makes considerable effort to maintain active investor relations through open, fair and transparent communication. A dedicated shareholder affairs unit is responsible for the timely dissemination of all relevant information to its stakeholders. The Company’s website (www.arig.net) provides detailed information on corporate governance, business and financial information and includes a secure portal for shareholders.
The Annual General Meeting of shareholders is held within 90 days of the end of the financial year in accordance with legal and regulatory requirements. Notice to the Annual General Meeting is released well in advance to shareholders, regulators and stock exchanges. Copies of
the Annual Report and accounts are made available at least one week prior to the meeting ensuring that shareholders have sufficient time to prepare for the discussion of the Company’s performance with the Board of Directors.
Corporate Social Responsibility
Arig aspires to be a good corporate citizen. The Company operates a corporate social responsibility program, which directs its efforts towards worthy projects and individuals in need in Bahrain.
Capital and Shares
Arig’s authorised capital is comprised of 500 million ordinary shares with a nominal value of US$ 1 each. The issued, subscribed and paid-up capital is US$ 220 million. Shares are held by more than 4,500 shareholders mostly throughout the GCC countries. These are tradable by people of any nationality through the stock exchanges where Arig is listed: the Bahrain Bourse and the Dubai Financial Market. Further shareholding information is given on page no. 63 of this Annual Report.
Compliance
Arig has established a Board approved comprehensive compliance framework covering all rules and regulations applicable to the Company’s business operations. The Company has a separate compliance unit headed by a Compliance Officer who reports to the Audit and Risk Committee of the Board of Directors. This unit ensures that Arig meets all regulatory requirements stipulated by the Central Bank of Bahrain and the Bahrain Ministry of Industry and Commerce. It also makes sure that the Company is in compliance with all rules and regulations of the stock exchanges where Arig is listed. There were no penalties incurred during the year 2017.
Internal Control
The Board is holding the ultimate responsibility for the functioning of all internal controls within the Company. A network of policies, guidelines, procedures, authorisation levels and performance monitoring is operative in all areas of the Company’s operations, including periodical reviews and updates, where appropriate. All significant authority limits for underwriting, claims and other operational areas are reviewed and approved by the Board. In daily operations, the CEO safeguards the application of all control mechanisms. He further ensures that a positive control environment is maintained through ethical corporate behaviour and personal integrity. He provides leadership and direction to General Management and reviews the way the business is controlled. All transactions with related parties are conducted at arm’s length.
On behalf of the Board, the Audit and Risk Committee periodically reviews the application of the Company’s internal control framework and the assessments of these controls from the evaluation reports produced by Arig’s

ANNUAL REPORT 2017
27
CORPORATE GOVERNANCE REPORT
internal and external auditors. The Committee then advises the Board of Directors on the status and effectiveness of the Company’s control environment and necessary action taken by the management to strengthen any identified control weaknesses.
Enterprise Risk Management (ERM)
Arig applies a corresponding ERM regime that aims at closely monitoring the risks the Company could be exposed to and their potential effects on capital as well as financial and operational performance. Regular reviews by the Risk Management function and all layers of Arig’s senior and middle management are carried out to assess the development and trends in the Company’s exposures and, whenever possible and reasonable, introduce measures to mitigate the potential for negative effects.
The Company maintains an ERM framework under the responsibility of the Head of Risk Management who reports to the Audit and Risk Committee of the Board of Directors. The status quo is kept in a Risk Register, the positions of which are reviewed and actively managed with the goal to keep the use of capital at risk at efficient performance levels without over-exposing the shareholders’ equity interest.
Arig makes use of leading international actuarial firms for independent professional advice who assist in maintaining its Internal Capital Adequacy (ICA) model, which will consider and quantify the capital amount required to support all identified risk exposures that are incurred as part of the Company’s business operations.
Our key risk categories are underwriting risk, reserve risk, market risk, operational risk, credit risk and liquidity risk. Property reinsurance with its exposure to natural and man- made catastrophes represents the largest class in Arig’s book; therefore it comes as no surprise that underwriting risk dominates the quantum of our risk exposures. It is followed by reserve risk, which is a reflection of the Company’s long-standing operating history and former activities in discontinued underwriting lines. Market risk, i.e. the risk of changes in the financial markets, ranks third and followed by operational risks. Credit risk takes the least amount of capital funding.
The Company has a number of risk avoidance and mitigation strategies in place to manage its key risk exposures.
• Risk Appetite Statement - Arig maintains a defined statement of its risk appetite expressing its maximum tolerance to losses for each of the main risk categories. The Risk Appetite Statement represents a key document in guiding the Company’s business conduct which is reviewed periodically and approved by the Board of Directors.
• Underwriting risk is contained through a mixture of underwriting guidelines that are system and
management controlled, pricing tools and reinsurance covers with highly rated retro markets to cap peak exposures.
• Reserve risk is managed through regular internal and external reviews to ensure that reserving is prudent and adequate. Our internal reviews are supported by an annually conducted, detailed estimation and report by professional actuaries.
• Market risk exposure is controlled by a basket of investment guidelines and policies that would include maximum allocations to asset classes, trend analyses, and performance monitoring tools, including stop loss disposal orders.
• Operational risk represents a basket of individual exposures, most of them relatively moderate in amount, which the Company closely monitors and strives to reduce individually. The risk of business interruption caused by political violence received Arig’s full attention and was quickly mitigated through the establishment of a warm site at the Company’s subsidiary’s office in Dubai. With contingency plans in place, this warm site can be upgraded to a hot site, should a situation ever call for it.
• Credit risk is managed by stringent counter-party checks and Arig’s preference is to deal with solid and, for the most part, highly rated market entities. At the same time, receivables are monitored through ageing analysis and outstanding balances are actively pursued.
• Finally, liquidity risk represents the actual or perceived loss to the Group arising from a potential inability either to meet claims, investments or operational obligations. Arig’s investment, claims management and liquidity risk management policies give due consideration to liquidity risk management and as a matter of prudence Arig maintains liquid assets well above its annually modelled liquidity requirements.
External Auditors
External auditors are appointed by the shareholders through the General Assembly. PricewaterhouseCoopers ME Limited of Bahrain were appointed as external auditors for the Financial Year 2017 based on the decision of the General Assembly, as delegated to the Board.

28
CORPORATE GOVERNANCE REPORT
ARAB INSURANCE GROUP (B.S.C.)
Security Ratings
A.M. Best through its most recent rating published on Arig on 22 November 2017, has reaffirmed the Company’s investment grade status with a Financial Strength Rating of “A– (Excellent)” and the Long-Term Issuer Credit Rating as “a-”. The outlook for both ratings is stable. In Best’s opinion, “ratings reflect Arig’s balance sheet strength, which is categorised as very strong by A.M. Best, as well as its adequate operating performance, neutral business profile and appropriate enterprise risk management.”
Statutory Solvency requirements are determined by Arig’s regulator in Bahrain, the Central Bank of Bahrain. The minimum solvency is defined with reference to a prescribed premium and claims basis. The solvency position of the Company as at 31 December 2017 is given below:
(in US$ ‘000)
2017 2016
Capital available 202,119 203,389
Required margin of solvency 36,315 38,074
Total excess capital available over the required margin of solvency 165,804 165,315
* Takaful Re Ltd. stopped writing business and is in run-off since December 2015
Arab Insurance Group (B.S.C.)
Reinsurance
Bahrain Operations
Subsidiaries
ARIG GROUP STRUCTURE
Mauritius Representative Office
Takaful Re Ltd. - UAE (54%)*
Gulf Warranties W.L.L.Bahrain (100%)
Arig Capital Limited (UK), (100%)
Arig Insurance Management (DIFC)
Limited - UAE (100%)
Solvency

ANNUAL REPORT 2017
29
CORPORATE GOVERNANCE REPORT
* General Management Committee members are CEO, GM – Reinsurance, DGM – Finance & Administration and AGM - Reinsurance# Shareholders affairs now merged with Group Finance
ORGANISATION CHART
Group Finance#
Investments & Asset Management
Claims & Technical Accounting
Information & Communication Systems
Actuarial &Risk Management
General Administration
Nomination & Remuneration Committee
Corporate Secretary
Audit & Risk Committee
Subsidiaries
Group Internal Audit
General Management Committee*
Board of Directors
Chief Executive Officer
Assistant General Manager - ReinsuranceFacultative
Treaty
Extended Warranty
Treaty – Mauritius Office
Life & Medical
Planning, Development & Communications
Retrocession
Client Markets 3
Deputy General Manager - Finance & AdministrationGeneral Manager - Reinsurance
Ris
k
Risk
Com
plia
nce
Legal and Compliance
Human Resources & Development

30
BIOGRAPHIES OF BOARD MEMBERS
ARAB INSURANCE GROUP (B.S.C.)
BOARD MEMBERS
Saeed Mohammed AlBahhar (Representing Emirates Development Bank, U.A.E.) Chairman of the Board and member of the Nomination and Remuneration Committee
B.Sc. Economics, Jacksonville University, U.S.A.
Saeed Mohammed AlBahhar has been a member of the Board of Directors, since 25 March 2014 and Chairman of the Board since 12 June 2017. He holds directorship on the Boards of the Emirates Development Bank, Takaful Re Ltd, U.A.E., Arab Satellite Organisation, K.S.A. and Hellas-Sat Cyprus.
Mohamed Saif AlHameli(Representing General Pensions & Social SecurityAuthority (GPSSA), U.A.E.)Vice Chairman of the Board
M.Sc., California State Polytechnic University, U.S.A.
Mohamed Saif AlHameli has been a member of the Board of Directors since 25 March 2014 and Vice Chairman since 12 June 2017. He also serves as Acting General Manager and the Executive Director of Investments in General Pensions & Social Security Authority (GPSSA), U.A.E.
Mohamed Saif AlSuwaidi(Representing Emirates Investment Authority, U.A.E.) Director and member of the Nomination and Remuneration Committee
Bachelor of Commerce from U.A.E. University, U.A.E.
Mohamed Saif AlSuwaidi has been a member of the Board of Directors since 25 March 2014. Further to Arig, he holds directorship on the Boards of the Emirates Investment Authority, Emirates Integrated Telecommunication Company, U.A.E.
Ahmed Saeed AlMahriDirector and Chairman of the Audit & Risk Committee and member of the Nomination & Remuneration Committee
Bachelor in Accounting and General Administration, United Arab Emirates University
Ahmed Saeed AlMahri has been a member of the Board of Directors since 20 March 2017. He served as Deputy General Manager of Financial Affairs, Abu Dhabi Police.
Dr. Bader Abdulla AlJaberiDirector and Chairman of the Nomination & Remuneration Committee and member of the Audit & Risk Committee
Ph.D. in Philosophy in Management and Planning, University of Wales & B.A. (Education) in Psychology, UAE University
Dr. Bader Abdulla AlJaberi has been a member of the Board of Directors since 20 March 2017. He is currently employed as Director of Studies and Researches with Ministry of Justice, Abu Dhabi. He also serves as Vice-Chairman at Mezyad Medical Center, Vice Chairman at Al Ahlia Co-operative Society & Services, UAE and Director at Al Sala Al Muhafidha LLC, Oman.
Wael Ibrahem Abu Khzam(Representing The Central Bank of Libya) Director and member of the Audit and Risk Committee and Nomination and Remuneration Committee
BSc in Accounting, Tripoli University & Master in Banking Finance, Libyan Academy
Wael Ibrahem Abu Khazam has been a member of the Board of Directors since 20 March 2017. He is currently employed as the Deputy Director of the Risk Management Department at the Central Bank of Libya.

ANNUAL REPORT 2017
31
BIOGRAPHIES OF GENERAL MANAGEMENT
GENERAL MANAGEMENT
Yassir AlbaharnaChief Executive Officer
MBA (High Honours) & M. Eng. (Manufacturing), Boston University, Boston; B. Eng. (Mechanical), McGill University, Montreal; Fellow & Chartered Insurer, Chartered Insurance Institute, U.K.
Yassir joined in 1987 and held a variety of underwriting and managerial positions throughout his professional career. He was appointed as CEO in 2006. Yassir also serves as Chairman of Arig Capital Limited (London), Chairman of Gulf Warranties (Bahrain), Chairman of Arig Insurance Management DIFC (Dubai), Chairman of Gulf Warranties Insurance Services (Riyadh), Managing Director of Takaful Re (DIFC), Board member of Arima Insurance Software (Bahrain) and Board member of GlobeMed (Bahrain). In addition, he is Chairman of the Federation of Afro-Asian Insurers & Reinsurers (Cairo), Chairman of FAIR Oil & Energy Insurance Syndicate (Bahrain), Chairman of FAIR Non-Life Reinsurance Pool (Istanbul), President of the Association of Insurers and Reinsurers of Developing Countries (Manila), Board member of the International Insurance Society (New York) and Board member of Bahrain Institute of Banking and Finance.
Firas El AzemGeneral Manager, Reinsurance
Diploma equivalent to MBA from the University of Cologne, Germany
Firas El Azem joined Arig in January 2017 as General Manager - Reinsurance and brings with him over 25 years of experience in insurance and reinsurance. He started his professional career with Munich Re in 1991 and later became the CEO of its Kuala Lumpur Branch before moving to the Middle East in 2006 as General Manager of a number of Insurance/Takaful companies in Syria, Kuwait, and Arig’s subsidiary, Takaful Re in U.A.E. He is currently a Board member of Arig Insurance Management DIFC (Dubai).
Samuel VergheseDeputy General Manager, Finance & Administration
Bachelor of Commerce from Osmania University, India and an Associate member of The Institute of Chartered Accountants of India.
Samuel Verghese joined Arig in March 1997 in the finance department and assumed the role of Director, Finance in January 2008. He has joined General Management Team in January 2017. He currently holds Board memberships at Arima Insurance Software (Bahrain), Gulf Warranties (Bahrain), GlobeMed (Bahrain) and Arig Capital Limited (London). Prior to joining the Company, he held various managerial positions in companies in India.
Rachid MechouetAssistant General Manager, Reinsurance
Bachelor in Economics and Masters in Finance and Insurance from the Institute of Development Financing, Tunis
Rachid Mechouet joined Arig in November 2010 in the Claims and Technical Accounting department and assumed the role of Director. He has joined General Management Team in January 2017. He has more than 25 years of reinsurance experience having worked with CCR (Algeria), Arig (Tunis) and Med Re (London).

32
KEY RATIOS
2017 2016
PERFORMANCE RATIOS
Premium growth (annual change in gross premiums written) -8.1% 11.3%Retention ratio (gross retained premiums over gross premiums written) 87.3% 84.9%Combined ratio (aggregate of expenses & losses over net earned premiums) 104.1% 101.5%Return on investments (proportion of investment income over average investment assets) 3.2% 2.6%
Return on equity (proportion of net profit to average shareholders’ equity) 2.8% 3.7%Growth in shareholders’ equity 0.1% 5.1%
LEVERAGE RATIOS
Underwriting exposure (ratio of gross premiums written to shareholders’ equity) 87.8% 95.6%Net technical provisions/ Shareholders’ equity 221.1% 229.8%Net technical provisions/ Net premiums written 288.2% 283.0%
LIQUIDITY RATIOS
Investment assets/ Net technical provisions 117.1% 125.0%
Liquid assets/ Net technical provisions 113.1% 120.9%
OTHER
Solvency ratio (ratio of shareholders’ equity to net earned premiums) 142.8% 142.2%Shareholders’ equity/Economic capital 2.01 1.94Earnings per share attributable to shareholders (US$) 0.04 0.05Book value per share (US$) 1.30 1.30Price to book value per share 38.5% 26.2%
ARAB INSURANCE GROUP (B.S.C.)

ANNUAL REPORT 2017
33

34
CONSOLIDATED FINANCIAL STATEMENTS
ARAB INSURANCE GROUP (B.S.C.)

ANNUAL REPORT 2017
35
INDEPENDENT AUDITORS’ REPORT
REPORT ON THE AUDIT OF THE CONSOLIDATED FINANCIAL STATEMENTS
Our opinion
In our opinion, the consolidated financial statements present fairly, in all material respects the consolidated financial position of Arab Insurance Group B.S.C. (the Company) and its subsidiaries (the Group) as at 31 December 2017, and its consolidated financial performance and its consolidated cash flows for the year then ended in accordance with International Financial Reporting Standards.
What we have audited
The Group’s consolidated financial statements comprise:
• the consolidated statement of financial position as at 31 December 2017;
• the consolidated statement of income for the year then ended;
• the consolidated statement of comprehensive income for the year then ended;
• the consolidated statement of changes in equity for the year then ended;
• the consolidated statement of cash flows for the year then ended; and
• the notes to the consolidated financial statements, which include a summary of significant accounting policies.
Basis for opinion
We conducted our audit in accordance with International Standards on Auditing (ISAs). Our responsibilities under those standards are further described in the Auditor’s responsibilities for the audit of the consolidated financial statements section of our report.
We believe that the audit evidence we have obtained is sufficient and appropriate to provide a basis for our opinion.
Independence
We are independent of the Group in accordance with the International Ethics Standards Board for Accountants’ Code of Ethics for Professional Accountants (IESBA Code) and the ethical requirements that are relevant to our audit of the consolidated financial statements in the Kingdom of Bahrain. We have fulfilled our other ethical responsibilities in accordance with these requirements and the IESBA Code.
Our audit approach
Overview
Key Audit Matter
• Valuation of technical provisions • Accuracy of ultimate premiums • Recoverability of insurance receivables • Valuation of investments
As part of designing our audit, we determined materiality and assessed the risks of material misstatement in the consolidated financial statements. In particular, we considered where the directors made subjective judgements; for example, in respect of significant accounting estimates that involved making assumptions and considering future events that are inherently uncertain. As in all of our audits, we also addressed the risk of management override of internal controls, including among other matters consideration of whether there was evidence of bias that represented a risk of material misstatement due to fraud.
We tailored the scope of our audit in order to perform sufficient work to enable us to provide an opinion on the consolidated financial statements as a whole, taking into account the structure of the Group, the accounting processes and controls, and the industry in which the Group operates.
Key audit matters Key audit matters are those matters that, in our professional judgment, were of most significance in our audit of the consolidated financial statements of the current period. These matters were addressed in the context of our audit of the consolidated financial statements as a whole, and in forming our opinion thereon, and we do not provide a separate opinion on these matters.
Independent auditor’s report to the shareholders of Arab Insurance Group B.S.C.

36
INDEPENDENT AUDITORS’ REPORT
Key audit matter How our audit addressed the key audit matter
Valuation of technical provisions
At 31 December 2017, the technical provisions relating to insurance liabilities amounted to USD 680,451 thousand. We consider this as a key audit matter because the determination of technical provision includes significant judgement and estimates, in particular in respect of claims that have been incurred at the statement of financial position date but have not been reported to the Group.
The ultimate amount of claims paid could vary materially from the amount estimated as of the reporting period date due to a number of factors including:
• delays or insufficient information reported by the insured or ceding companies in relation to loss incurred at the reporting date
• changes to the estimates received from loss adjusters
• final outcome of claims subject to litigation
Refer to notes 2, 3 and 14 of the financial statements for accounting policy, disclosures of judgements and estimates and other details relating to technical provisions.
In relation to the matters set out opposite, our audit response included the following:
• We assessed and tested the operational effectiveness of a sample of key controls in the Group’s claims handling and reserving process, including the review and approval of the reserves, controls over the completeness and accuracy of the claims estimates recorded and controls over the input, adjustment and extraction of data from the claims systems.
• Substantive tests were performed on the amounts of claims recorded for a sample of claims notified, to assess whether claims are appropriately estimated and recorded.
• We considered the results of the third-party actuarial review of the loss and loss adjustment reserves as at the reporting date. Supported by our actuarial specialists, we evaluated management’s methodology against industry practice and challenged management’s assumptions and their assessment of major sensitivities. The main areas of judgement include the loss development patterns selected and the initial expected loss ratios.
• We also assessed the adequacy of disclosure in the financial statements.
Key audit matter How our audit addressed the key audit matter
Accuracy of ultimate premiums
We focused on this area because there is significant judgement and estimation involved in determining the ultimate premiums.
Premium revenues are initially recognised based on estimates of ultimate premiums. This occurs for contracts where pricing is based on variables which are not known with certainty at the point of issuing the contract. Subsequent adjustments to those estimates, which arise as updated information relating to those pricing variables becomes available, are recorded in the period in which they are determined.
Refer to note 2 and 3 of the financial statements for the accounting policy, disclosures of judgements and estimates and other details relating to ultimate premiums.
In relation to the matters set out opposite, our audit response included the following:
• We evaluated and tested a sample of key controls over the premium estimation process, which include the periodic review by management of estimated premiums, taking into account any third-party information received from intermediaries or insureds.
• For a sample of contracts we assessed the estimated premium income, including considering the basis of estimation and corroborating evidence such as information from brokers and cedants.
• We analysed the historical development of a sample of ultimate premium amounts on an underwriting year basis and compared it with the estimates recognised in corresponding financial years to identify if there is any indication of management bias.
• We also assessed the adequacy of disclosure in the financial statements.
REPORT ON THE AUDIT OF THE CONSOLIDATED FINANCIAL STATEMENTS (Continued)
ARAB INSURANCE GROUP (B.S.C.)

ANNUAL REPORT 2017
37
Key audit matter How our audit addressed the key audit matter
Recoverability of insurance receivables
We focused on this area because estimation of the recoverable amount of insurance receivables and determination of the level of impairment allowance involves estimates and judgements.
Insurance receivables are carried at anticipated realisable values after provision for impairment. A provision for impairment is established when there is evidence that the Group will not be able to recover all the amount due to financial difficulties of the counterparty.
Refer to note 2 and 9 of the financial statements for the accounting policy and disclosures relating to insurance receivables and the related impairment provisions.
In relation to the matters set out opposite, our audit response included the following:
• We evaluated and tested a sample of controls over establishment of level of impairment required for insurance receivables. These include an annual exercise performed by the management to assess the level of impairment required collectively and on a case by case basis.
• We assessed the accuracy of the aging of insurance receivables and challenged management on the level of impairment on each ‘bucket’ of time proportionate aged balance.
• Balance confirmations were circulated to a selection of parties and alternative procedures were performed where the response to the confirmation requests was not received.
• We also assessed the adequacy of disclosure in the financial statements.
REPORT ON THE AUDIT OF THE CONSOLIDATED FINANCIAL STATEMENTS (Continued)
INDEPENDENT AUDITORS’ REPORT
Other information
The directors are responsible for the other information. The other information comprises the Annual report (but does not include the consolidated financial statements and our auditor’s report thereon).
Our opinion on the consolidated financial statements does not cover the other information and we do not express any form of assurance conclusion thereon.
In connection with our audit of the consolidated financial statements, our responsibility is to read the other information identified above and, in doing so, consider whether the other information is materially inconsistent with the financial statements or our knowledge obtained in the audit, or otherwise appears to be materially misstated.
If, based on the work we have performed, we conclude that there is a material misstatement of this other information, we are required to report that fact. We have nothing to report in this regard.
Responsibilities of the directors and those charged with governance for the consolidated financial statements
The directors are responsible for the preparation and fair presentation of the consolidated financial statements in accordance with International Financial Reporting Standards and for such internal control as the directors determine is necessary to enable the preparation of consolidated financial statements that are free from material misstatement, whether due to fraud or error.
In preparing the consolidated financial statements, the directors are responsible for assessing the Group’s ability to continue as a going concern, disclosing, as applicable, matters related to going concern and using the going concern basis of accounting unless the directors either intend to liquidate the Group or to cease operations, or have no realistic alternative but to do so.
Those charged with governance are responsible for overseeing the Group’s financial reporting process.
Key audit matter How our audit addressed the key audit matter
Valuation of investments
The Group holds a significant investment portfolio which represents 61% of the total assets. Consequently the valuation of investments is a key area of audit focus.
Refer to note 2 and 6 of the financial statements for the accounting policy and disclosures in relation to investments
In relation to the matters set out opposite, our audit response included the following:
• We tested on a sample basis the valuation of quoted investments by matching the price with independent sources.
• We assessed how the Group reviewed investments for possible impairment and whether the Group policy for impairment was applied appropriately and consistently.
• We also assessed the adequacy of disclosure in the financial statements.

38
INDEPENDENT AUDITORS’ REPORT
Auditor’s responsibilities for the audit of the consolidated financial statements
Our objectives are to obtain reasonable assurance about whether the consolidated financial statements as a whole are free from material misstatement, whether due to fraud or error, and to issue an auditor’s report that includes our opinion. Reasonable assurance is a high level of assurance, but is not a guarantee that an audit conducted in accordance with ISAs will always detect a material misstatement when it exists. Misstatements can arise from fraud or error and are considered material if, individually or in the aggregate, they could reasonably be expected to influence the economic decisions of users taken on the basis of these consolidated financial statements.
As part of an audit in accordance with ISAs, we exercise professional judgment and maintain professional scepticism throughout the audit. We also:
• Identify and assess the risks of material misstatement of the consolidated financial statements, whether due to fraud or error, design and perform audit procedures responsive to those risks, and obtain audit evidence that is sufficient and appropriate to provide a basis for our opinion. The risk of not detecting a material misstatement resulting from fraud is higher than for one resulting from error, as fraud may involve collusion, forgery, intentional omissions, misrepresentations, or the override of internal control.
• Obtain an understanding of internal control relevant to the audit in order to design audit procedures that are appropriate in the circumstances, but not for the purpose of expressing an opinion on the effectiveness of the Group’s internal control.
• Evaluate the appropriateness of accounting policies used and the reasonableness of accounting estimates and related disclosures made by the directors.
• Conclude on the appropriateness of the directors’ use of the going concern basis of accounting and, based on the audit evidence obtained, whether a material uncertainty exists related to events or conditions that may cast significant doubt on the Group’s ability to continue as a going concern. If we conclude that a material uncertainty exists, we are required to draw attention in our auditor’s report to the related disclosures in the consolidated financial statements or, if such disclosures are inadequate, to modify our opinion. Our conclusions are based on the audit evidence obtained up to the date of our auditor’s report. However, future events or conditions may cause the Group to cease to continue as a going concern.
• Evaluate the overall presentation, structure and content of the consolidated financial statements, including the disclosures, and whether the consolidated financial statements represent the underlying transactions and events in a manner that achieves fair presentation.
• Obtain sufficient appropriate audit evidence regarding the financial information of the entities or business activities within the Group to express an opinion on the consolidated
financial statements. We are responsible for the direction, supervision and performance of the Group audit. We remain solely responsible for our audit opinion.
We communicate with those charged with governance regarding, among other matters, the planned scope and timing of the audit and significant audit findings, including any significant deficiencies in internal control that we identify during our audit.
We also provide those charged with governance with a statement that we have complied with relevant ethical requirements regarding independence, and to communicate with them all relationships and other matters that may reasonably be thought to bear on our independence, and where applicable, related safeguards.
From the matters communicated with those charged with governance, we determine those matters that were of most significance in the audit of the consolidated financial statements of the current period and are therefore the key audit matters. We describe these matters in our auditor’s report unless law or regulation precludes public disclosure about the matter or when, in extremely rare circumstances, we determine that a matter should not be communicated in our report because the adverse consequences of doing so would reasonably be expected to outweigh the public interest benefits of such communication.
Report on other legal and regulatory requirements
As required by the Bahrain Commercial Companies Law and Volume 3 of the Central Bank of Bahrain (CBB) Rule Book, we report that:
REPORT ON THE AUDIT OF THE CONSOLIDATED FINANCIAL STATEMENTS (Continued)
the Company has maintained proper accounting records and the consolidated financial statements are in agreement therewith;
the financial information contained in the directors’ report is consistent with the consolidated financial statements;
we are not aware of any violations during the year of the Bahrain Commercial Companies Law, the Central Bank of Bahrain and Financial Institutions Law, the Rule Book (Volume 3, applicable provisions of Volume 6 and CBB directives), the CBB Capital Markets Regulations and associated Resolutions, the Bahrain Bourse rules and procedures or the terms of the Company’s memorandum and articles of association that would have had a material adverse effect on the business of the Company or on its financial position; and
satisfactory explanations and information have been provided to us by management in response to all our requests.
a)
b)
c)
d)
17 February 2018Partner’s registration number: 201Manama, Kingdom of Bahrain
ARAB INSURANCE GROUP (B.S.C.)

ANNUAL REPORT 2017
39
AS AT 31 DECEMBER 2017(US$ ’000)
Note 2017 2016
ASSETS
Cash and bank balances 5 82,673 180,460
Investments 6 579,686 554,660
Accrued income 8 103,096 101,610
Insurance receivables 9 110,923 108,402
Insurance deposits 10 25,809 28,086
Deferred policy acquisition costs 22,660 17,800
Reinsurers’ share of technical provisions 11 112,391 83,818
Other assets 12 28,806 17,991
Property and equipment 13 20,085 21,588
1,086,129 1,114,415
LIABILITIES
Technical provisions 14 680,451 673,681
Insurance payables 17 53,337 61,571
Borrowings 18 34,000 41,000
Other liabilities 19 35,959 45,349
803,747 821,601
EQUITY
Attributable to shareholders of parent company 20
Share capital 220,000 220,000
Treasury stock (14,793) (14,793)
Reserves 41,178 37,684
Retained earnings 10,549 13,743
256,934 256,634
Non-controlling interests 21 25,448 36,180
282,382 292,814
1,086,129 1,114,415
These consolidated financial statements were approved by the Board of Directors on 13 February 2018 and signed on its behalf by:
Saeed Mohammed AlBahharChairman
Ahmed Saeed AlMahri Director
Yassir Albaharna Chief Executive Officer
The accompanying notes 1 to 35 are an integral part of these consolidated financial statements.
CONSOLIDATED STATEMENT OF FINANCIAL POSITION

40
FOR THE YEAR ENDED 31 DECEMBER 2017
ARAB INSURANCE GROUP (B.S.C.)
CONSOLIDATED STATEMENT OF INCOME
(US$ ’000)
Note 2017 2016
Gross premiums written 225,632 245,431
Net earned premiums 179,938 180,503
Claims and related expenses (124,603) (119,412)
Policy acquisition costs (49,803) (46,370)
Investment income attributable to insurance funds 23 13,268 11,123
Operating expenses 24 (12,995) (17,508)
Underwriting result 22 5,805 8,336
Investment income attributable to shareholders’ funds 23 9,001 8,166
Operating expenses – non underwriting activities 24 (9,298) (8,042)
Borrowing cost (947) (866)
Other income 25 5,595 5,299
Other expenses and provisions 26 (1,971) (2,742)
Profit for the year 8,185 10,151
Attributable to:
Non-controlling interests 963 989
Shareholders of parent company 7,222 9,162
8,185 10,151
Earnings per share attributable to shareholders (basic and diluted): 27 3.6 4.6
The accompanying notes 1 to 35 are an integral part of these consolidated financial statements.
(US Cents)
Saeed Mohammed AlBahharChairman
Ahmed Saeed AlMahri Director
Yassir Albaharna Chief Executive Officer

41
FOR THE YEAR ENDED 31 DECEMBER 2017
ANNUAL REPORT 2017
CONSOLIDATED STATEMENT OF COMPREHENSIVE INCOME
(US$ ’000)
2017 2016
Profit for the year 8,185 10,151
Other comprehensive income
Items that will be reclassified to profit or loss:
Changes on remeasurement of available for sale investments 2,115 1,101
Transfers for recognition of losses on disposal of available for sale investments 1,523 2,262
Items that will not be reclassified subsequently to profit or loss:Revaluation of property (853) -
Other comprehensive income 2,785 3,363
Total comprehensive income 10,970 13,514
Attributable to:
Non-controlling interests 768 1,128
Shareholders of parent company 10,202 12,386
10,970 13,514
The accompanying notes 1 to 35 are an integral part of these consolidated financial statements.
Saeed Mohammed AlBahharChairman
Ahmed Saeed AlMahri Director
Yassir Albaharna Chief Executive Officer

42
FOR THE YEAR ENDED 31 DECEMBER 2017
ARAB INSURANCE GROUP (B.S.C.)
Net profit for the year - - - - - - 9,162 9,162 989 10,151
Changes on remeasurement of available for sale investments - - - 977 - 977 - 977 124 1,101
Transfers for recognition of losses on disposal of available for sale investments
- - - 2,247 - 2,247 - 2,247 15 2,262
Total comprehensive income for the year - - - 3,224 - 3,224 9,162 12,386 1,128 13,514
Transfer of net depreciation on revalued property - - - - (184) (184) 184 - - -
Transfer to non-distributable reserves - - 894 - - 894 (894) - - -
Adjustment for minority’s share of subsidiary - - - - - - - - 320 320
Balances at 31 December 2016 220,000 (14,793) 34,094 (1,971) 5,561 37,684 13,743 256,634 36,180 292,814
Parent company balances at (note 35)
31 December 2017 220,000 (14,793) 34,679 1,933 4,500 41,112 10,615 256,934 - 256,934
31 December 2016 220,000 (14,793) 33,957 (2,131) 5,561 37,387 14,040 256,634 - 256,634
The accompanying notes 1 to 35 are an integral part of these consolidated financial statements.
CONSOLIDATED STATEMENT OF CHANGES IN EQUITY
(US$ ’000)
Sharecapital
Treasurystock
Reserves Retained earnings
Attributable to shareholders
of parent company
Non-controlling
interests
Total equity
Legal Investment revaluation
Property revaluation Total
Balances at 31 December 2016 220,000 (14,793) 34,094 (1,971) 5,561 37,684 13,743 256,634 36,180 292,814
Net profit for the year - - - - - - 7,222 7,222 963 8,185
Changes on remeasurement of available for sale investments - - - 2,153 - 2,153 - 2,153 (38) 2,115
Transfers for recognition of losses (gains) on disposal of available for sale investments - - - 1,680 - 1,680 - 1,680 (157) 1,523
Revaluation of property - - - - (853) (853) - (853) - (853)
Total comprehensive income for the year - - - 3,833 (853) 2,980 7,222 10,202 768 10,970
Dividends paid - - - - - - (9,902) (9,902) - (9,902)
Transfer of net depreciation on revalued property - - - - (208) (208) 208 - - -
Transfer to non-distributable reserves - - 722 - - 722 (722) - - -
Subsidiary’s capital reduction - - - - - - - - (11,500) (11,500)
Balances at 31 December 2017 220,000 (14,793) 34,816 1,862 4,500 41,178 10,549 256,934 25,448 282,382
Balances at 31 December 2015 220,000 (14,793) 33,200 (5,195) 5,745 33,750 5,291 244,248 34,732 278,980

43
FOR THE YEAR ENDED 31 DECEMBER 2017
ANNUAL REPORT 2017
CONSOLIDATED STATEMENT OF CASH FLOWS
(US$ ’000)
Note 2017 2016
CASH FLOWS FROM OPERATING ACTIVITIESPremiums received 183,675 250,560
Reinsurance premiums paid (25,581) (38,955)
Claims and acquisition costs paid (194,866) (232,796)
Reinsurance receipts in respect of claims 5,249 24,650
Investment income 21 89
Interest received 2,790 2,281
Dividends received 842 761
Operating expenses paid (30,330) (30,174)
Other (expenses) income, net (2,405) (3,911)
Insurance deposits received, net 2,782 9,079
Purchase of trading investments (19,670) (26,364)
Sale of trading investments 13,026 44,003
Net cash used in operating activities 30 (64,467) (777)
CASH FLOWS FROM INVESTING ACTIVITIESMaturity/sale of investments 258,971 293,215
Purchase of investments (266,924) (326,719)
Term deposits with bank 21,317 21,202
Interest received 8,652 9,738
Investment income 3,298 3,847
Collateralised cash deposits (8,095) 6,858
Purchase of property and equipment (233) (328)
Purchase of intangible assets (463) (37)
Investment in associate - (63)
Net cash provided by investing activities 16,523 7,713
CASH FLOWS FROM FINANCING ACTIVITIESBorrowings (7,000) (3,000)
Borrowing cost (767) (814)
Dividends paid (9,255) (62)
Subsidiary’s capital reduction- minority interests (11,500) -
Net cash used in financing activities (28,522) (3,876)
Net (decrease) increase in cash and cash equivalents (76,466) 3,060
Effect of exchange rate on cash and cash equivalents (4) (167)
Cash and cash equivalents, beginning of year 139,408 136,515
Cash and cash equivalents, end of year 5 62,938 139,408Term deposits with bank 19,735 41,052
Cash and bank balances, end of year 5 82,673 180,460
The accompanying notes 1 to 35 are an integral part of these consolidated financial statements.

44
FOR THE YEAR ENDED 31 DECEMBER 2017
ARAB INSURANCE GROUP (B.S.C.)
1. INCORPORATION AND PRINCIPAL ACTIVITY
Arab Insurance Group (B.S.C.) (the “Company”, “parent company”) is an international insurance company registered as a Bahraini Shareholding Company having its registered office at Arig House, Manama, Kingdom of Bahrain. The parent company and its subsidiaries (the “Group”) are involved in provision of general (non-life) and life reinsurance and related service activities.
2. SIGNIFICANT ACCOUNTING POLICIES
These consolidated financial statements have been prepared in accordance with International Financial Reporting Standards (IFRS), issued by the International Accounting Standards Board and are consistent with prevailing practice within the insurance industry.
The Group’s financial statements are presented in U.S. Dollars, which is its functional currency as its share capital and a significant proportion of its business, assets and liabilities are denominated in that currency.
The consolidated financial statements are prepared under the historical cost convention as modified by the revaluation of land and building and certain investment assets.
Comparative figures have been reclassified and restated, where necessary, to conform to the current year’s presentation.
The Group has adopted the following new and revised IFRS and interpretations which became effective as of 1 January 2017:
• IAS 7 Statement of Cash Flow Standard issued in January 2016
The amendments require disclosures that enable users of consolidated financial statements to evaluate changes in liabilities arising from financing activities, including both changes arising from cash flow and non-cash changes.
To satisfy the new disclosure requirements, a reconciliation between the opening and closing balances of liabilities arising from financing activities has been included as note 31.
• Improvements to IFRSs (2016)
Improvements to IFRSs in the 2014-2016 cycles include a number of amendments to various IFRSs. Most amendments will apply prospectively for annual periods beginning on or after 1 January 2017 with early application permitted. The adoption of this amendment has no material impact on the financial statements.
The following standards and interpretations have been issued but are applicable for periods subsequent to the year ended 31 December 2017:
• IFRS 4 Insurance Contracts Standard issued September 2016
Amendments to the standard permit entities issuing contracts within the scope of IFRS 4 a temporary exemption. The temporary exemption enables eligible entities to defer the implementation date of IFRS 9 for annual periods beginning 1 January 2021 at the latest. An entity may apply the temporary exemption from IFRS 9 if and only if
(i) it has not previously applied any version of IFRS 9 before and
(ii) its activities are predominantly connected with insurance on its annual reporting date that immediately precedes 1 April 2016.
The Group has determined that its activities are
predominantly connected with insurance and has decided that it will apply the temporary exemption from IFRS 9. The temporary exemption from IFRS 9 is available from 1 January 2018.
• IFRS 9 Financial Instruments Standard issued July 2014
IFRS 9 replaces the existing IAS 39 Financial Instruments: Recognition and Measurement. IFRS 9 includes revised guidance on the classification and measurement of financial instruments, including a new expected credit loss model for calculating impairment on financial assets, and the new general hedge accounting requirements. It also carries forward the guidance on recognition and derecognition of financial instruments from IAS 39. The standard is applicable from 1 January 2018 with early adoption permitted. However, the Group has decided to apply the temporary exemption available under IFRS 4 and will therefore apply this standard for annual periods beginning 1 January 2021.
• IFRS 15 Revenue from Contracts with Customers Standard issued May 2014
IFRS 15 establishes a comprehensive framework for determining whether, how much and when revenue is recognized. It replaces existing revenue recognition guidance, including IAS 18 Revenue, IAS 11 Construction Contracts and IFRIC 13 Customer Loyalty Programmes. The standard is effective for annual reporting periods beginning on or after 1 January 2018, with early adoption permitted. The Group is not expecting a significant impact from the adoption of this standard.
• IFRS 16 Leases Standard issued in January 2016
IFRS 16 introduces a single, accounting model for lessees. A lessee recognises a right-of-use asset representing its right to use the underlying asset and a lease liability representing its obligation to make lease
NOTES TO THE CONSOLIDATED FINANCIAL STATEMENTS

45
FOR THE YEAR ENDED 31 DECEMBER 2017
ANNUAL REPORT 2017
NOTES TO THE CONSOLIDATED FINANCIAL STATEMENTS
payments. There are optional exemptions for short-term leases and leases of low value items. Lessor accounting remains similar to the current standard i.e. lessors continue to classify leases as finance or operating leases. The standard is effective for annual reporting periods beginning on or after 1 January 2019. The Group is not expecting a significant impact from the adoption of this standard.
• IFRS 17 Insurance Contracts Standard issued in May 2017
IFRS 17 Insurance Contracts establishes principles for the recognition, measurement, presentation and disclosure of insurance contracts within the scope of the standard. The objective of IFRS 17 is to ensure that an entity provides relevant information that faithfully represents those contracts. This information gives a basis for users of financial statements to assess the effect that insurance contracts have on the entity’s financial position, financial performance and cash flows. The standard is applicable for annual periods beginning on or after 1 January 2021. The Group is assessing the impact of IFRS 17 on its consolidated financial statements.
The Group did not early-adopt new or amended standards in 2017.
The significant accounting policies of the Group are as follows:
Basis of consolidation
The consolidated financial statements include the accounts of the parent company and all of its subsidiaries made up to 31 December 2017 except for Arig Capital Limited which is consolidated one quarter in arrears.
Subsidiaries are defined as entities that are controlled by the Group, on the basis ofi) power over the entity;ii) the exposure to variable returns from the entity; and iii) the ability to use its power to affect the amount of
returns.
The purchase method is used to account for acquisitions.
All intra-group transactions, balances and unrealised surpluses and deficits on transactions between group companies have been eliminated on consolidation. Where necessary, the accounts of subsidiaries have been restated to ensure consistency with the accounting policies adopted by the Group.
A listing of the principal subsidiaries is set out in note 33. In the parent company, these investments are accounted under IAS 39, Financial Instruments: Recognition and Measurement.
2. SIGNIFICANT ACCOUNTING POLICIES (Contd.) Cash and cash equivalents
Cash and cash equivalents comprise cash on hand, bank balances and short-term highly liquid assets (placements with financial institutions) with original maturities of three months or less when acquired that are subject to insignificant risk of changes in their fair value, and are used by the Group in the management of its short-term commitments. Bank balances that are restricted and not available for day to day operations of the Group are not included in cash and cash equivalents.
Investments
Investment securities are classified as ‘at fair value through profit or loss’, which includes financial assets held for trading and those designated at fair value on initial recognition, ‘available for sale’, ‘held to maturity’ or ‘loans and receivables’. Management determines the appropriate classification of investments at the time of purchase.
Securities are classified as at fair value through profit or loss if they are acquired for the purpose of generating a profit from short-term fluctuations in price or if so designated by management. Derivative financial instruments that are not designated as accounting hedge are classified as at fair value through profit or loss. Investments with fixed or determinable payments and fixed maturity that the management has the intent and ability to hold to maturity are classified as held to maturity. Financial instruments with fixed or determinable payments and that are not quoted in an active market are categorised as loans and receivables. Securities intended to be held for an indefinite period of time and those that are not classified as at fair value through profit or loss, held to maturity or loans and receivables, which may be sold in response to needs for liquidity or changes in interest rates, are classified as available for sale.
All purchases and sales of investments are recognised at the settlement date. All investment assets are recognised initially at cost. After initial recognition, investments are valued using principles described below.
Investments at fair value through profit or loss and investments available for sale are carried at fair value. Held to maturity investments and loans and receivables are carried at amortised cost, less any adjustment necessary for impairment.
Fair values are measured using market observable data as far as possible. Fair values are categorised into different levels in a fair value hierarchy based on the inputs used in valuation (see note 32).

46
FOR THE YEAR ENDED 31 DECEMBER 2017
ARAB INSURANCE GROUP (B.S.C.)
NOTES TO THE CONSOLIDATED FINANCIAL STATEMENTS
2. SIGNIFICANT ACCOUNTING POLICIES (Contd.)
Provision for impairment of financial assets
A provision is made in respect of a financial asset that is impaired if its carrying amount is greater than its estimated recoverable amount.
Provisions for assets carried at amortised cost are calculated as the difference between the carrying amount of the assets and the present value of expected future cash flows discounted at their original effective interest rate. By comparison, the recoverable amount of an instrument carried at cost is the present value of expected future cash flows discounted at the current market rate of interest for a similar financial asset.
In the case of available for sale financial assets, the Group assesses at each statement of financial position date whether there is an objective evidence of impairment of such assets. If any such evidence exists, the impairment is recognised in income. Evidence of impairment considers among other factors significant or prolonged decline in market values and financial difficulties of the issuer. Impairment recognised is not reversed subsequently except in case of debt instruments.
Investment in associated companies
Investments in associated companies are accounted for using the equity method, less any adjustment necessary for impairment. Associated companies are defined as those companies over which the Group is able to exercise significant influence but not control or joint control over the financial and operating policy decisions.
Insurance receivables
Insurance receivables are carried at anticipated realisable values after provision for impairment. A provision for impairment is established when there is evidence that the Group will not be able to collect all amounts due according to the terms of the receivables. In case of receivables not specifically impaired, a collective evaluation of impairment is carried out based on historical loss experience. Bad debts are written off during the year in which they are identified. The identification of bad debts is based on an analysis of the financial position of the counter party.
Insurance deposits
Insurance deposits comprise premium and claim deposits with cedants in accordance with policy terms and are carried at anticipated realisable values after provision for impairment. A provision for impairment is established when there is evidence that the Group will not be able to collect all amounts due according to the terms of the deposits. In case of deposits not specifically impaired, a collective evaluation of impairment is carried out based on historical
loss experience. Irrecoverable deposits are written off during the year in which they are identified. Irrecoverable deposits are identified on an analysis of the financial position of the counter party.
Intangible assets
Expenditure on software, patents, present value of future profits on acquisition of portfolio and licenses are capitalised and amortised using the straight line basis over their expected useful lives, not exceeding a period of 5 years.
Costs associated with developing computer software programmes are recognised as an expense when incurred. However, costs that are clearly associated with an identifiable and unique product, which will be controlled by the Group and has a probable benefit exceeding the costs beyond one year, are recognised as intangible assets. Costs include staff costs of the development team and an appropriate portion of relevant overheads.
Expenditure, which enhances and extends the benefits of computer software programmes beyond their original specifications and lives is recognised as a capital improvement and added to the original cost of the software. The carrying amount of intangible assets is reviewed annually and adjusted for impairment where it is considered necessary.
Property and equipment
Property & equipment are stated at cost less accumulated depreciation except for land and building which are carried at their revalued amount being fair value on date of valuation on a rolling basis by independent external valuers, less accumulated depreciation. On revaluation, any increase in the carrying amount of the asset is carried in the shareholders’ equity as Property Revaluation Reserve and any decrease is recognised as an expense, except to the extent that it reverses decreases or increases previously recognised through income or shareholders’ equity. The balance in the Property Revaluation Reserve is transferred directly to Retained Earnings on sale of property and realization of surplus. Further, the difference between depreciation based on the revalued carrying amounts and the depreciation based on original cost of the property is transferred directly from Property Revaluation Reserve to Retained Earnings.
The cost of additions and major improvements are capitalised; maintenance and repairs are charged to expense as incurred. Gains or losses on disposal are reflected in other income. Depreciation is provided on straight-line basis over the expected useful lives of the assets, which are as follows:

47
FOR THE YEAR ENDED 31 DECEMBER 2017
ANNUAL REPORT 2017
NOTES TO THE CONSOLIDATED FINANCIAL STATEMENTS
2. SIGNIFICANT ACCOUNTING POLICIES (Contd.)
Building 40 yearsElectrical and mechanical 20 yearsInformation systems, furniture,equipment and others 3-5 years
Useful lives and residual values are reassessed at each reporting period and adjusted accordingly. At each reporting date, the Group reviews the carrying amounts to determine whether there is any indication of impairment.
If any such indication exists, then the assets recoverable amount is estimated.
For impairment testing, assets are grouped together into the smallest group of assets that generates cash inflows from continuing use that are largely independent of the cash inflows of other assets or Cash Generating Units (CGU’s).
The recoverable amount of an asset or CGU is the greater of its value in use and its fair value less costs to sell. Value in use is based on the estimated future cash flows, discounted to their present value using a pre-tax discount rate that reflects current market assessments of the time value of money and the risks specific to the asset or CGU.
An impairment loss is recognised if the carrying amount of an asset or CGU exceeds its recoverable amount.
Provisions
Provisions are recognised when the Group has a present legal or constructive obligation as a result of past events, it is probable that an outflow of resources will be required to settle the obligation and a reliable estimate of the amount of the obligation can be made. Employee entitlements are recognised when they accrue to employees, with a provision being carried for the estimated liability as a result of services rendered upto the statement of financial position date.
Post employment obligations
The Group operates a number of defined benefit plans for its employees.
For defined benefit plans, the accounting cost except for actuarial gains or losses, is charged to the income statement so as to spread it over the expected service lives of employees. The accounting costs under these plans are measured as the present value of the estimated future cash outflows using interest rates of government securities, which have terms to maturity approximating the terms of the related liability. Actuarial gains or losses are carried in the comprehensive income statement.
Treasury stock
Treasury stock representing shares purchased by the parent company or its consolidated subsidiaries are carried at cost with the exception of holdings as on the date of capital reduction, 4 July 2002, which are carried at nominal value. All treasury stock is presented as a deduction from shareholders’ equity and gains and losses from sale of these shares are presented as a change in shareholders’ equity.
Recognition of underwriting result
Insurance business is accounted for in a manner consistent with prevailing practice within the insurance industry, more specifically, on an annual accounting basis. Specific accounting policies relating to individual items of insurance revenues and costs and technical provisions are explained below for each relevant item.
Premiums
Gross premiums written comprise the total premiums in relation to contracts incepting during the financial year, together with adjustments arising in the financial year to premiums receivable in respect of business written in previous financial years. It includes an estimate of pipeline premiums, being those premiums written but not reported to the Group at the statement of financial position date. Pipeline premiums are reported as accrued insurance premiums.
Premiums, net of reinsurance, are taken to income over the terms of the related contracts or policies. Unearned premiums are those proportions of the premiums accounted for, which relate to periods of risk that extend beyond the end of the financial year; they are calculated based on a time apportionment basis. A provision for unexpired risks is made for estimated amounts required over and above provisions for unearned premiums to meet future claims and related expenses on business in force at the statement of financial position date. Such provision, where necessary, is made on the basis of an assessment of segments in which policies with similar risk profile are grouped together.
Claims and related expenses
Claims and related expenses are accounted for based on reports received and subsequent review on an individual case basis. Provision is made to cover the estimated ultimate cost of settling claims arising out of events, which have occurred by the end of the financial year, including unreported losses, and claims handling expenses. Provision for unreported claims is established based on actuarial analysis and application of underwriting judgment having regard to the range of uncertainty as to the eventual outcome for each category of business.

48
FOR THE YEAR ENDED 31 DECEMBER 2017
ARAB INSURANCE GROUP (B.S.C.)
NOTES TO THE CONSOLIDATED FINANCIAL STATEMENTS
2. SIGNIFICANT ACCOUNTING POLICIES (Contd.)
Policy acquisition costs
Commissions, taxes, brokerages and other variable underwriting costs directly associated with acquiring business are amortised over the period in which the related premiums are earned. Policy acquisition costs that relate to periods of risk that extend beyond the end of the financial year are reported as deferred policy acquisition costs.
Reinsurance arrangements
As part of managing its insurance risks, the Group enters into contracts with other reinsurers for compensation of losses on insurance contracts issued by the Group.
Compensations receivable from reinsurers are estimated in a manner consistent with the corresponding claim liability. The benefits and obligations arising under reinsurance contracts are recognised in income and the related assets and liabilities are recognised as accounts receivable, reinsurers’ share of technical reserves and accounts payable.
Liability adequacy test
At each statement of financial position date, liability adequacy tests are performed to ensure adequacy of the contractual liabilities net of related deferred acquisition costs. In performing these tests, current best estimates of future contractual undiscounted cash flows and claims handling and administrative expenses are considered. The tests are performed on a portfolio basis where policies with similar risk profile are grouped together as a portfolio.
Investment income
Investment income comprises interest and dividend receivable for the financial year. Gains and losses arising from changes in the fair value of investments at fair value through profit or loss are included in the income statement in the period in which they arise. Gains and losses arising from changes in the fair value of available for sale investments are recognised in other comprehensive income and carried in investment revaluation income as part of equity. When available for sale investments are disposed or are impaired, the related fair value adjustments are included in the income statement.
Investment income arising from insurance business investment assets are allocated to the underwriting results of insurance businesses based on the proportion of their respective insurance funds to shareholders’ funds during the financial year.
Foreign currency translation
Transactions denominated in currencies other than U.S. Dollars are recorded at the rates ruling at the date of the transaction. All monetary and non-monetary assets carried at fair value denominated in currencies other than U.S. Dollars are translated at year-end exchange rates.
Unrealised gains or losses on translation are taken to income except in respect of non-monetary available for sale investments, which are taken to equity until they are disposed.
Unrealised gains and losses on translation of financial statements of subsidiaries are included in equity. Other foreign currency gains and losses are taken to income.
Derivative financial instruments and hedging
In the ordinary course of its business, the Group uses forward foreign exchange contracts as fair value hedges to protect its exposures in respect of foreign currency denominated investments and insurance liabilities and these contracts are carried at fair value.
Where a fair value hedge meets the conditions prescribed by International Financial Reporting Standards for qualifying as an effective hedge, gains or losses from remeasuring forward foreign exchange contracts and gains or losses on hedged assets attributable to the hedged risk are recognised in income.
Where the hedge is not effective, gains or losses from remeasuring forward foreign exchange contracts are recognised in income. Gains or losses on hedged assets are recognised in income except in respect of non-monetary available for sale investments, which are taken to equity until they are disposed.
The gain or losses from remeasuring insurance liabilities and related foreign exchange contracts are recognised in income.
3. CRITICAL ACCOUNTING ESTIMATES AND JUDGEMENTS
In the process of applying its accounting policies, the Group makes estimates and judgements that have an impact on the amounts recognised and reported in the financial statements. These estimates and judgements are based on historical experience, observable market data, published information and other information including expectations of future events that are believed to be reasonable under the circumstances. The estimates and judgements that have a significant impact on the recognised amounts in the financial statements and the processes used to determine these estimates and judgements are described below:

49
FOR THE YEAR ENDED 31 DECEMBER 2017
ANNUAL REPORT 2017
NOTES TO THE CONSOLIDATED FINANCIAL STATEMENTS
3. CRITICAL ACCOUNTING ESTIMATES AND JUDGEMENTS (Contd.)
i) Claims and related expenses The estimate of ultimate losses arising from existing insurance contracts includes unreported claims. Provisions for unreported claims are estimated based on actuarial analysis and application of underwriting judgment having regard to the range of uncertainty as to the eventual outcome for each category of business. The ultimate insurance liability also includes the costs to administer the claims.
ii) Ultimate premiums The estimate of ultimate premiums is based on premium income estimates provided by cedants which is then adjusted to reflect underwriters’ judgement taking into account market conditions and historical data. This estimate is subject to review by underwriters and actuaries.
Other significant estimates include fair value measurement and impairment of financial assets as disclosed in note 2. 4. MANAGEMENT OF INSURANCE RISKS
The Group’s activities expose it to a variety of financial and other risks: market risk (including foreign exchange risk, price risk and interest rate risk), credit risk, underwriting risk and liquidity risk.
The following is a summary of policies adopted to mitigate the key insurance risks facing the Group:
i) Underwriting risks
The Group manages its underwriting risks principally through policies and guidelines for accepting risks and reinsurance arrangements.
Risks are accepted based on an evaluation of pricing and prior underwriting experience in accordance with underwriting guidelines that have been laid out for each line of business. Underwriting guidelines are constantly reviewed and updated to take account of market developments, performance and opportunities. Accumulation limits are set to control exposures to natural hazards and catastrophes. Various underwriting and approval limits are specified for accepting risks.
Acceptance of risks that do not meet specified minimum criteria are subject to agreement of an Underwriting Review Committee comprising representatives from the Marketing, Underwriting and Actuarial functions.
The reinsurance strategy of the Group is designed to protect exposures to individual and event risks based on current risk exposures through cost effective reinsurance arrangements.
Reserving risks are addressed by ensuring prudent and appropriate reserving for business written by the Group, thus ensuring that sufficient funds are available to cover future claims. Reserving practices involve the use of actuarial analysis and application of underwriting judgement. These are supplemented by periodical independent actuarial reviews for determining the adequacy of reserves.
ii) Credit risks
Credit risk under insurance contracts is the risk that a counterparty will be unable to pay amounts in full when due.
Credit risk is controlled through terms of trade for receipt of premium and in certain cases enforcement of premium warranty conditions. Most of the counterparties are insurance companies that are generally not rated. However, there are no significant exposures from any one counterparty.
Reinsurance arrangements are effected with reinsurers whose creditworthiness is assessed on the basis of satisfying minimum rating and financial strength criteria. Exposure to any single reinsurer generally does not exceed a maximum of 25% of total exposure and risks are generally placed with counterparties with minimum investment grade rating except for proportional treaty arrangements placed on reciprocal basis.

50
FOR THE YEAR ENDED 31 DECEMBER 2017
ARAB INSURANCE GROUP (B.S.C.)
NOTES TO THE CONSOLIDATED FINANCIAL STATEMENTS
4. MANAGEMENT OF INSURANCE RISKS (Contd.)
Credit risks relating to reinsurance arrangements are analysed as follows:(US$ ’000)
2017 Receivables Share of claims outstanding Total
Balance relating to reinsurers:- With investment grade rating 2,045 16,541 18,586- Other 5,923 2,811 8,734
7,968 19,352 27,320
2016
Balance relating to reinsurers:- With investment grade rating 1,434 29,235 30,669- Other 10,324 9,455 19,779
11,758 38,690 50,448
iii) Currency risks
As the Company writes business in various currencies, it is exposed to currency risk. Foreign exchange currency risks are hedged where exposures are significant and facility to hedge is available.
(US$ ’000)
2017 EuroPound
SterlingIndian Rupee
Kuwaiti Dinar Other
Reinsurance Assets (Liabilities), net (651) (1,328) (8,510) (17,915) (27,329)Hedged 584 1,056 - - -
2016Reinsurance Assets (Liabilities), net (345) 1,296 (9,823) (13,247) (35,373)Hedged - (1,244) - - -
iv) Liquidity risks
Liquidity risk is the risk that cash may not be available to pay obligations when due. Limits have been specified in the investment policy and guidelines that requires a significant portion of investment funds representing insurance liabilities to be held in cash or readily marketable debt securities.
v) Sensitivity analysis
The sensitivity of the Group’s income to market risks is as follows:(US$ ’000)
2017 20165% increase in loss ratio (8,997) (9,025)
5% decrease in loss ratio 8,997 9,025
10% increase in US Dollar exchange rate 9,149 10,615
10% decrease in US Dollar exchange rate (11,183) (12,974)

51
FOR THE YEAR ENDED 31 DECEMBER 2017
ANNUAL REPORT 2017
NOTES TO THE CONSOLIDATED FINANCIAL STATEMENTS
5. CASH AND BANK BALANCES(US$ ’000)
2017 2016Cash and bank balances 62,938 102,908Deposits with maturity within 3 months - 36,500Cash and cash equivalents 62,938 139,408Deposits with maturity over 3 months 19,735 41,052
82,673 180,460
Details of significant terms and conditions, exposures to credit, interest rate and currency risks are as follows:
i) Credit risk
Bank balances and deposits with short term maturities are held with leading financial institutions. The Group limits its concentration of time deposits with any one financial institution to a maximum of 10% of shareholders’ equity.
ii) Interest rate risk
2017 2016Interest receivable basis:- Bank balances Daily/Monthly Daily/Monthly- Deposits with short term maturities On maturity On maturity
Effective rates 0.01 % - 2.78 % 0.01% - 2.25 %
As the deposits are short term maturities, there is no sensitivity to interest rate fluctuation.
iii) Currency risk(US$ ’000)
2017 2016U.S. Dollar 61,895 168,451Bahraini Dinar 10,494 7,199Pound Sterling 6,973 550Omani Riyal 1,074 -UAE Dirham 727 469Other 1,510 3,791
82,673 180,460

52
FOR THE YEAR ENDED 31 DECEMBER 2017
ARAB INSURANCE GROUP (B.S.C.)
NOTES TO THE CONSOLIDATED FINANCIAL STATEMENTS
6. INVESTMENTS(US$ ’000)
2017 2016At fair value through profit or lossHeld for tradingCommon stock of listed companies 56,712 43,937
56,712 43,937Designated at fair value on initial recognitionDebt Securities- Other investment grade 66,364 65,417- Other 19,420 28,706
85,784 94,123Held to maturityDebt securities- Supra-nationals and OECD country governments 1,000 1,000- Other investment grade 4,881 4,857
- Other 3,927 3,9139,808 9,770
Available for saleDebt securities- Supra-nationals and OECD country governments 30,776 57,284- Other investment grade 269,177 218,255- Other 91,484 96,537Common stock of listed companies 13,071 10,312Common stock of unlisted companies 4,165 6,381Other equity type investment 18,389 17,978
427,062 406,747Investment in associates 320 83
579,686 554,660

53
FOR THE YEAR ENDED 31 DECEMBER 2017
ANNUAL REPORT 2017
NOTES TO THE CONSOLIDATED FINANCIAL STATEMENTS
6. INVESTMENTS (Contd.)
Movements in the Group’s impairment recognised on available for sale investments are as follows:(US$ ’000)
2017 2016At 1 January 21,515 20,994Impairment recognised during the year- Unlisted companies 1,366 33- Others 1,241 675Reversal on sale of investments (2,111) (187)At 31 December 22,011 21,515
Debt securities amounting to US$ 183.6 million (2016: US$ 169.9 million) have been pledged as security for reinsurance trust agreements, letters of credit, guarantees and borrowings.
Details of significant exposures to credit, interest rate and currency risks on investments are as follows:
i) Credit risk
The Group limits its investment concentration in debt securities in any one investee and in any one industry group to 10% and 20% respectively, of the total debt securities portfolio.
The Group also limits its investment concentration in common stock of listed companies of any one issue and any one issuer to 5% and 10% respectively, of its budgeted equity portfolio at the time of purchase.
ii) Debt securities - interest rate risk
2017 Interest receivable basis Effective rates Coupon rates
Supra-nationals and OECD country government securities
Monthly/Semi-annual/Annual 0.750% - 1.875% 0.750% - 1.875%
Other investment grade debt securities
Monthly/Semi-annual/Annual 0.130% - 8.500% 0.130% - 8.500%
Other debt securities Monthly/Semi-annual/Annual 2.383% - 5.500% 2.383% - 5.500%
2016Supra-nationals and OECD country government securities
Monthly/Semi-annual/Annual 0.750% - 1.625% 0.750%-1.625%
Other investment grade debt securities
Monthly/Semi-annual/Annual 0.125% - 7.750% 0.125% - 7.750%
Other debt securities Monthly/Semi-annual/Annual 2.383% - 5.500% 2.383% - 5.500%

54
FOR THE YEAR ENDED 31 DECEMBER 2017
ARAB INSURANCE GROUP (B.S.C.)
NOTES TO THE CONSOLIDATED FINANCIAL STATEMENTS
6. INVESTMENTS (Contd.)
iii) Debt securities – currency risk
(US$ ’000)
2017U.S.
DollarBahraini
Dinar Other Total
Supra-nationals and OECD country government securities 31,776 - - 31,776Other investment grade debt securities 340,403 - 19 340,422Other debt securities 108,248 6,583 - 114,831
480,427 6,583 19 487,029
2016Supra-nationals and OECD country government securities 58,284 - - 58,284Other investment grade debt securities 273,963 - 72 274,035Other debt securities 137,222 6,428 - 143,650
469,469 6,428 72 475,969
iv) Debt securities - remaining term to maturity
The principal amount and book values of debt securities are shown in the table below by contractual maturity. (US$ ’000)
2017 2016Principalamount
Book value
Principalamount
Book value
Supra-nationals and OECD country government securities:- Due in one year or less 11,000 10,962 18,500 18,511- One to five years 21,000 20,814 40,000 39,773
32,000 31,776 58,500 58,284Debt securities of other investment grade issuers:- Due in one year or less 29,606 28,076 25,500 24,861- One to five years 253,782 252,604 203,084 201,813- More than five years 56,877 59,742 61,603 61,855
340,265 340,422 290,187 288,529Other debt securities:- Due in one year or less 7,998 7,053 2,444 1,614- One to five years 69,451 68,950 83,024 82,537- More than five years 39,678 38,828 46,544 45,005
117,127 114,831 132,012 129,156489,392 487,029 480,699 475,969

55
FOR THE YEAR ENDED 31 DECEMBER 2017
ANNUAL REPORT 2017
NOTES TO THE CONSOLIDATED FINANCIAL STATEMENTS
6. INVESTMENTS (Contd.)
v) Common stock
Common stocks have no fixed maturity dates and are generally not exposed to interest rate risk. However, they are subject to price risk and its sensitivity is shown in note 7. Dividends are generally declared on an annual basis.
The book value of common stock classified by currencies in which they are denominated are as follows:(US$ ’000)
2017 2016U.S. Dollar 44,601 36,086Euro 3,993 7,722Bahraini Dinar 628 433Saudi Riyal 10,660 5,590Pound Sterling 1,709 2,286Japanese Yen 2,101 877Other 10,256 7,636
73,948 60,630
vi) Commitments
The Group has commitments in respect of uncalled capital in available for sale investments amounting to US$ 8.8 million (2016: US$ 7.3 million).
7. SENSITIVITY ANALYSIS
The sensitivity of the Group’s profit or loss and total equity to market risks on its cash and cash equivalents and investments is as follows:
(US$ ’000)2017 2016
Income Equity Income EquityInterest rate+ 100 basis points shift in yield curves- debt instruments (1,695) (11,743) (1,543) (10,159)– 100 basis points shift in yield curves- debt instruments 1,638 11,352 1,491 9,820Currency risk10% increase in US Dollar exchange rate (3,621) - (2,030) (19)10% decrease in US Dollar exchange rate 4,426 - 2,481 23Equity price10% increase in equity prices 5,671 1,307 4,394 1,03110% decrease in equity prices (5,671) (1,307) (4,394) (1,031)

56
FOR THE YEAR ENDED 31 DECEMBER 2017
ARAB INSURANCE GROUP (B.S.C.)
NOTES TO THE CONSOLIDATED FINANCIAL STATEMENTS
8. ACCRUED INCOME(US$ ’000)
2017 2016Accrued insurance premiums Expected to be received :- Within 12 months 73,499 76,483- After 12 months 26,863 22,869
100,362 99,352Accrued interest - Expected to be received within 12 months 2,734 2,258
103,096 101,610
9. INSURANCE RECEIVABLES
(US$ ’000)2017 2016
Balances due :- Within 12 months 110,755 108,305- After 12 months 168 97
110,923 108,402
Movements in the Group’s provision for impaired receivables are as follows:(US$ ’000)
2017 2016At 1 January 14,230 14,752Provision (write back) for impairment 652 (459)Impaired receivables written off - (63)31 December 14,882 14,230
The individually impaired receivables mainly relate to counter party in financial difficulty. The ageing of these receivables is as follows:
(US$ ’000)2017 2016
Over two years 4,238 4,9364,238 4,936
The ageing analysis of receivables that are past due and not considered impaired is as follows:(US$ ’000)
2017 2016
Upto 6 months 6,610 4,5366 to 12 months 4,839 12,731
11,449 17,267

57
FOR THE YEAR ENDED 31 DECEMBER 2017
ANNUAL REPORT 2017
NOTES TO THE CONSOLIDATED FINANCIAL STATEMENTS
10. INSURANCE DEPOSITS(US$ ’000)
2017 2016Balances due:- Within 12 months 18,928 22,000- After 12 months 6,881 6,086
25,809 28,086
Movements in the Group’s provision for impaired deposits are as follows:
(US$ ’000)2017 2016
At 1 January 2,945 3,494Provision for impairment 202 674Impaired deposits written off - (1,223)31 December 3,147 2,945
The individually impaired deposits mainly relate to counter parties in financial difficulty. The ageing of these deposits is as follows:
(US$ ’000)2017 2016
Under ten years 149 144Over ten years 19 18
168 162
The ageing analysis of deposits that are past due and not considered impaired is as follows:
(US$ ’000)2017 2016
Upto 1 year 6,946 6,2331 to 3 years 14,973 16,684
21,919 22,917

58
FOR THE YEAR ENDED 31 DECEMBER 2017
ARAB INSURANCE GROUP (B.S.C.)
NOTES TO THE CONSOLIDATED FINANCIAL STATEMENTS
11. REINSURERS’ SHARE OF TECHNICAL PROVISIONS(US$ ’000)
2017 2016General insurance business- Claims outstanding 19,341 38,669- Unreported claims 55,705 18,172- Deferred retrocession premium reserve 37,263 26,858
112,309 83,699Life insurance business- Claims outstanding 11 21- Unreported claims 71 98
82 119112,391 83,818
12. OTHER ASSETS(US$ ’000)
2017 2016Intangible assets :- Computer software 10,011 9,593
10,011 9,593Less : Accumulated amortisation (9,402) (9,245)Net intangible assets 609 348Other assets due within 12 months:- Collateralised cash deposits 20,341 12,246- Prepayments and other receivables 7,856 5,397
28,197 17,64328,806 17,991
(US$ ’000)2017 2016
Movement in intangible assets :Net book value at 1 January 348 511- Additions 463 70- Amortisation charge (202) (232)- Disposal - (1)Net book value at 31 December 609 348
Collateralised cash deposits have been pledged as security for reinsurance letters of credit and guarantees.

59
FOR THE YEAR ENDED 31 DECEMBER 2017
ANNUAL REPORT 2017
NOTES TO THE CONSOLIDATED FINANCIAL STATEMENTS
13. PROPERTY AND EQUIPMENT (US$ ’000)
2017 2016Land 2,080 2,469Building 18,718 19,182Information systems, furniture, equipment and other 10,660 10,592
31,458 32,243Less: Accumulated depreciation (11,373) (10,655)
20,085 21,588Movements in property and equipmentNet book value at 1 January 21,588 22,236- Revaluation of property (853) -- Additions 233 365- Disposals - (37)- Depreciation charge (883) (976)
Net book value at 31 December 20,085 21,588
Land and Building comprises the head office property owned and occupied by the Company since 1984 and also includes office premises of the subsidiary Takaful Re Limited in Dubai, U.A.E.
The head office property was revalued at year end by independent external valuers and classified as level 2 in the fair value measurement hierarchy as it has been valued using indicative transaction prices for similar properties and adjusted to reflect the characteristics of the property. Based on open market valuation, the fair value of land was determined at US$ 2,080,000 as against a carrying amount of US$ 2,469,000. The carrying amount of the land would have been US$ 1,972,000 had the asset been carried under the cost model. The decrease in fair value of US$ 389,000 has been adjusted from Property Revaluation Reserve. The fair value of the building has been determined at US$ 4,968,000 as against a carrying value of US$ 5,432,000. The decrease in fair value of US$ 464,000 has been adjusted from Property Revaluation Reserve.
14. TECHNICAL PROVISIONS
Technical provisions comprise:(US$ ’000)
2017 2016General insurance businessClaims outstanding 223,388 279,957Unreported losses 216,950 177,783Unearned premiums 184,270 153,266
624,608 611,006Life insurance businessClaims outstanding 13,529 14,638Unreported losses 33,495 40,378Unearned premiums 8,819 7,659
55,843 62,675680,451 673,681
The mean term of reserves is 2.9 years and 2.7 years for non-life and life business respectively.

60
FOR THE YEAR ENDED 31 DECEMBER 2017
ARAB INSURANCE GROUP (B.S.C.)
NOTES TO THE CONSOLIDATED FINANCIAL STATEMENTS
15. CLAIMS DEVELOPMENT
The table below shows the incurred gross and net claims including unreported losses computed with reference to earned premiums, compared with previous estimates for the last 5 years:
(US$ ’000)Underwriting year
2012 2013 2014 2015 2016 2017 Total
Gross
Estimate of incurred claims costs:
- At end of underwriting year 113,735 112,367 106,448 101,570 74,463 127,688
- One year later 178,609 190,431 182,358 175,247 136,341 -
- Two years later 185,776 192,492 186,928 173,063 - -
- Three years later 179,510 190,167 180,654 - - -
- Four years later 180,033 166,183 - - - -
- Five years later 178,626 - - - - -
Current estimate of incurred claims 178,626 166,183 180,654 173,063 136,341 127,688 962,555
Cumulative payments to date (156,265) (130,824) (141,140) (130,228) (71,377) (19,641) (649,475)
Liability recognised 22,361 35,359 39,514 42,835 64,964 108,047 313,080
Liability in respect of prior years 174,282
Total liability included in the statement of financial position 487,362
Net
Estimate of incurred claims costs:
- At end of underwriting year 108,594 110,213 102,592 98,169 66,195 106,954
- One year later 166,667 182,910 174,824 165,317 124,902 -
- Two years later 175,275 182,685 178,752 164,880 - -
- Three years later 169,531 179,862 169,900 - - -
- Four years later 170,156 158,222 - - - -
- Five years later 166,540 - - - - -
Current estimate of incurred claims 166,540 158,222 169,900 164,880 124,902 106,954 891,398
Cumulative payments to date (144,368) (123,175) (130,822) (128,227) (50,262) (22,433) (599,287)
Liability recognised 22,172 35,047 39,078 36,653 74,640 84,521 292,111
Liability in respect of prior years 120,123
Total liability included in the statement of financial position 412,234

61
FOR THE YEAR ENDED 31 DECEMBER 2017
ANNUAL REPORT 2017
NOTES TO THE CONSOLIDATED FINANCIAL STATEMENTS
16. MOVEMENTS IN INSURANCE LIABILITIES AND ASSETS
(US$ ’000)Gross Reinsurance Net
2017ClaimsClaims outstanding 294,595 38,689 255,906Unreported losses 218,161 18,271 199,890Total at beginning of year 512,756 56,960 455,796Change in provision during the year 128,664 23,418 105,246Claims settled during the year (154,058) (5,250) (148,808)Balance at end of year 487,362 75,128 412,234Unearned premiumAt beginning of year 160,925 26,858 134,067Change in provision during the year 32,164 10,405 21,759Balance at end of year 193,089 37,263 155,826Accrued insurance premium At beginning of year 112,854 13,502 99,352Movement during the year (19,842) (20,852) 1,010Balance at end of year 93,012 (7,350) 100,362Deferred policy acquisitions costsAt beginning of year 19,070 1,270 17,800Movement during the year 5,112 252 4,860Balance at end of year 24,182 1,522 22,660
2016ClaimsClaims outstanding 316,961 37,758 279,203Unreported losses 245,068 14,788 230,280Total at beginning of year 562,029 52,546 509,483Change in provision during the year 125,448 3,478 121,970Claims settled during the year (174,721) 936 (175,657)Balance at end of year 512,756 56,960 455,796Unearned premiumAt beginning of year 117,514 13,304 104,210Change in provision during the year 43,411 13,554 29,857Balance at end of year 160,925 26,858 134,067Accrued insurance premium At beginning of year 75,916 6,941 68,975Movement during the year 36,938 6,561 30,377Balance at end of year 112,854 13,502 99,352Deferred policy acquisitions costsAt beginning of year 21,014 614 20,400Movement during the year (1,944) 656 (2,600)Balance at end of year 19,070 1,270 17,800

62
FOR THE YEAR ENDED 31 DECEMBER 2017
ARAB INSURANCE GROUP (B.S.C.)
NOTES TO THE CONSOLIDATED FINANCIAL STATEMENTS
17. INSURANCE PAYABLES
(US$ ’000)2017 2016
Due within 12 months 53,337 61,57153,337 61,571
18. BORROWINGS
(US$ ’000)2017 2016
Balances Due:- Within 12 months 34,000 41,000
34,000 41,000 Borrowings amounting to US$ 34 million (2016: US$ 41 million) are secured by debt securities amounting to US$ 50.9 million (2016: US$ 51.6 million). The effective interest rate on the borrowings was 2.49% (2016: 2.27%)
19. OTHER LIABILITIES
(US$ ’000)2017 2016
Post-employment benefits (note 28) 12,203 12,398Accrued expense 3,508 5,984Dividends payable 3,164 2,517Reinsurance premiums accrued 1,235 5,906Employee long-term incentives 1,460 2,977Other 14,389 15,567
35,959 45,349Balances due: - Within 12 months 22,296 29,974- After 12 months 13,663 15,375
35,959 45,349
20. SHAREHOLDERS’ EQUITY
i) Share capital
a) Composition(US$ ’000)
2017 2016Authorised500 million ordinary shares of US$ 1 each 500,000 500,000Issued, Subscribed and Fully Paid-up220 million (2016: 220 million) ordinary shares of US$ 1 each 220,000 220,000

63
FOR THE YEAR ENDED 31 DECEMBER 2017
ANNUAL REPORT 2017
NOTES TO THE CONSOLIDATED FINANCIAL STATEMENTS
20. SHAREHOLDERS’ EQUITY (Contd.)
b) Major shareholders
Shareholders who have an interest of 5% or more of the outstanding and issued shares are as shown below:
Name Nationality No. of shares (in millions)
% of total outstanding shares
% of total issued shares
2017 2016 2017 2016 2017 2016Central Bank of Libya Libya 31.8 31.8 16.1 16.1 14.4 14.4Emirates Investment Authority UAE 30.5 30.5 15.4 15.4 13.8 13.8General Pension and Social Security Authority UAE 27.5 27.5 13.9 13.9 12.5 12.5Kuwait Investment Authority Kuwait 20.0 20.0 10.1 10.1 9.1 9.1Ahmed Omar Salem Alkorbi UAE 17.2 10.0 8.7 5.0 7.8 4.5Emirates Development Bank UAE 11.0 11.0 5.6 5.6 5.0 5.0
c) Shareholding pattern
The shareholding pattern in the outstanding shares of the Company is as follows:
Shares No. of shares (in millions) No. of shareholders % of total outstanding
shares
2017 2016 2017 2016 2017 2016Less than 1% 47.2 49.0 4,491 4,540 23.9 24.71% to 5% 12.8 28.2 4 6 6.5 14.35% to 10% 28.2 11.0 2 1 14.2 5.610% and above 109.8 109.8 4 4 55.4 55.4
ii) Treasury stock
The Company held 21,967,818 of its own shares at 31 December 2017 (2016: 21,967,818 shares) and is carried at cost US$ 14,793,000 (2016: US$ 14,793,000).
iii) Legal reserve
In accordance with applicable legal provisions and Articles of Association, the Group is required to set aside 10% of net profits each year to build a Legal reserve up to a maximum of 100% of the paid up value of its share capital.
iv) Investment revaluation reserve Investment revaluation reserve comprises gains or losses arising from remeasurement of available for sale investment assets. These gains or losses are carried in the reserve until the assets are disposed of, at which time the gains or losses are included in income.
v) Property revaluation reserve
Property revaluation reserve represents the difference between the cost of land and buildings less accumulated depreciation and their fair values. Further, the difference between depreciation based on the revalued carrying amounts and the depreciation based on original cost of the property is transferred directly from Property revaluation reserve to Retained earnings.

64
FOR THE YEAR ENDED 31 DECEMBER 2017
ARAB INSURANCE GROUP (B.S.C.)
NOTES TO THE CONSOLIDATED FINANCIAL STATEMENTS
20. SHAREHOLDERS’ EQUITY (Contd.)
vi) Capital management
The Group’s total capital comprises paid-up capital, legal reserve and retained earnings less treasury shares. The Group’s policy is to maintain a strong capital base so as to maintain client, investor and market confidence and to sustain future development of the business. The parent company is regulated by Central Bank of Bahrain, which sets and monitors capital requirement for the parent company. Central Bank of Bahrain (CBB) requires the parent company to compute the solvency margin requirement in accordance with provisions of the CBB Rule Book. The Company is in compliance with the required margin of solvency.
Additionally, the Company manages its capital adequacy on an evaluation of its capital requirement through risk based capital models.
21. NON-CONTROLLING INTERESTS
(US$ ’000)2017 2016
At 1 January 36,180 34,732Share of comprehensive income 768 1,128Subsidiary’s capital reduction - minority interests (11,500) -Minority interests in subsidiary - 320At 31 December 25,448 36,180

65
FOR THE YEAR ENDED 31 DECEMBER 2017
ANNUAL REPORT 2017
NOTES TO THE CONSOLIDATED FINANCIAL STATEMENTS
22. SEGMENT INFORMATION
i) Analysis of revenue by primary business segment
The Group’s reinsurance business consists of two main business segments, Non-life and Life. Non-life business primarily consists of Property, Engineering, Marine, Accident, Whole Account & Other classes. Life business mainly involves short term group life policies and long term life policies. Life portfolio does not contain investment linked policies.
(US$ ’000)
Non-life LifeTotal
2017 Property Engineering Marine Accident Whole account Others * Short
termLong term
REVENUES
Gross premiums written 43,219 18,370 9,347 8,704 91,221 33,573 20,711 487 225,632
Outward reinsurance premiums (6,703) (3,354) (1,724) (653) (21,114) 5,074 (137) 55 (28,556)
Change in unearned premiums – gross (4,175) (3,944) (297) (845) 7,456 (7,956) (1,136) (15) (10,912)
Change in unearned premiums – reinsurance 268 697 (67) 24 (7,185) 37 - - (6,226)
Net earned premiums 32,609 11,769 7,259 7,230 70,378 30,728 19,438 527 179,938
Investment income attributable to insurance funds 4,562 1,583 1,051 1,153 139 1,919 1,695 1,166 13,268
37,171 13,352 8,310 8,383 70,517 32,647 21,133 1,693 193,206
COSTS AND EXPENSES
Gross claims paid (32,005) (15,963) (6,575) (3,966) (48,266) (25,114) (21,042) (1,128) (154,059)
Claims recovered from reinsurers 2,992 605 327 (135) 6,571 (5,177) 66 - 5,249
Change in provision for outstanding claims – gross 8,541 3,990 (249) (505) (2,428) 30,704 581 528 41,162
Change in provision for outstanding claims – reinsurance (535) (123) 490 332 (537) (13,616) (9) - (13,998)
Change in provision for unreported losses – gross (50) 9,370 903 4,485 (55,361) (3,847) 1,231 5,688 (37,581)
Change in provision for unreported losses – reinsurance 1,013 61 433 (4,374) 37,508 46 (63) - 34,624
Claims and related expenses (20,044) (2,060) (4,671) (4,163) (62,513) (17,004) (19,236) 5,088 (124,603)
Policy acquisition costs (12,964) (5,350) (1,628) (2,023) (26,660) (1,656) (1,593) (3,218) (55,092)
Policy acquisition costs recovered from reinsurers 1,709 826 392 265 - 49 - - 3,241
Change in deferred policy acquisition costs – gross 618 1,328 (282) 90 71 365 133 (23) 2,300
Change in deferred policy acquisition costs – reinsurance (28) (259) 39 6 - (10) - - (252)
Policy acquisition costs (10,665) (3,455) (1,479) (1,662) (26,589) (1,252) (1,460) (3,241) (49,803)
Operating expenses (4,184) (1,780) (1,184) (837) (248) (2,196) (2,192) (374) (12,995)
Underwriting result 2,278 6,057 976 1,721 (18,833) 12,195 (1,755) 3,166 5,805
* Others includes a one-off reduction of claims in aviation class of Business (under run–off).

66
FOR THE YEAR ENDED 31 DECEMBER 2017
ARAB INSURANCE GROUP (B.S.C.)
NOTES TO THE CONSOLIDATED FINANCIAL STATEMENTS
22. SEGMENT INFORMATION (Contd.)
i) Analysis of revenue by primary business segment
(US$ ’000)
Non-life LifeTotal
2016 Property Engineering Marine Accident Whole account Others Short
termLong term
REVENUES
Gross premiums written 40,754 20,947 9,768 9,041 113,593 30,937 19,954 437 245,431
Outward reinsurance premiums (6,607) (3,698) (1,223) (449) (26,078) 1,296 (265) - (37,024)
Change in unearned premiums – gross 4,215 2,775 1,649 1,600 (32,542) (8,493) 322 (68) (30,542)
Change in unearned premiums – reinsurance 1,243 1,228 483 110 1,242 (1,437) (231) - 2,638
Net earned premiums 39,605 21,252 10,677 10,302 56,215 22,303 19,780 369 180,503
Investment income attributable to insurance funds 3,457 1,847 1,085 992 220 1,466 1,035 1,021 11,123
43,062 23,099 11,762 11,294 56,435 23,769 20,815 1,390 191,626
COSTS AND EXPENSES
Gross claims paid (40,163) (18,159) (8,495) (8,472) (36,312) (24,704) (21,541) (16,875) (174,721)
Claims recovered from reinsurers 498 536 399 84 (3,793) 856 485 - (935)
Change in provision for outstanding claims – gross 6,878 4,841 4,333 49 22,584 6,479 (332) 3,555 48,387
Change in provision for outstanding claims – reinsurance 1,298 (338) (1,066) (245) (10) (1,364) - - (1,725)
Change in provision for unreported losses – gross 13,704 (448) 2,573 196 (21,623) 3,277 1,463 11,072 10,214
Change in provision for unreported losses – reinsurance (356) 233 471 (14) (279) (755) 74 (6) (632)
Claims and related expenses (18,141) (13,335) (1,785) (8,402) (39,433) (16,211) (19,851) (2,254) (119,412)
Policy acquisition costs (10,784) (6,713) (3,475) (2,048) (19,881) (1,822) (707) 295 (45,135)
Policy acquisition costs recovered from reinsurers 1,306 876 456 194 - (666) - - 2,166
Change in deferred policy acquisition costs - gross (1,838) (385) (469) (923) (365) 1,332 (105) 6 (2,747)
Change in deferred policy acquisition costs – reinsurance (326) (483) (186) (55) - 396 - - (654)
Policy acquisition costs (11,642) (6,705) (3,674) (2,832) (20,246) (760) (812) 301 (46,370)
Operating expenses (6,371) (2,238) (1,539) (1,640) (445) (2,546) (2,326) (403) (17,508)
Underwriting result 6,908 821 4,764 (1,580) (3,689) 4,252 (2,174) (966) 8,336

67
FOR THE YEAR ENDED 31 DECEMBER 2017
ANNUAL REPORT 2017
NOTES TO THE CONSOLIDATED FINANCIAL STATEMENTS
22. SEGMENT INFORMATION (Contd.)
ii) Analysis of premiums and non-current asset based on geographical location of the risk insured and location of the asset respectively
(US$ ’000)2017 2016
Premium Non-current assets Premium Non-current
assetsfrom: - Middle East 87,590 36,343 85,742 33,471- Africa 25,275 4,927 22,068 3,575- Asia 24,211 4,717 26,713 4,327- Others 88,556 7,766 110,908 9,615
225,632 53,753 245,431 50,988
There is no significant cedant group as the portfolio is diversified.
iii) Analysis of segment assets and liabilities
(US$ ’000)
Non-Life Life
Corporate Total2017 Property Engineering Marine Accident Whole Others Short term
Long term
Reinsurance assets 27,751 19,057 16,906 7,043 243,073 68,952 9,400 21 - 392,203
Cash 9,178 6,788 3,071 3,506 5,506 1,977 2,547 1,693 48,407 82,673
Investments 116,634 78,331 37,804 36,753 14,820 23,790 34,556 24,808 212,190 579,686
Others - - - - - - - - 31,567 31,567
153,563 104,176 57,781 47,302 263,399 94,719 46,503 26,522 292,164 1,086,129
Reinsurance liabilities 127,584 89,569 49,797 41,905 289,635 89,899 38,024 19,817 - 746,230
Others - - - - - - - - 57,517 57,517
127,584 89,569 49,797 41,905 289,635 89,899 38,024 19,817 57,517 803,747
2016
Reinsurance assets 33,975 21,005 19,231 503 193,080 72,796 8,767 578 - 349,935
Cash 18,731 13,733 6,167 5,598 11,590 9,145 5,956 4,415 105,125 180,460
Investments 71,898 53,080 23,097 22,684 45,716 37,667 23,404 21,185 255,929 554,660
Others - - - - - - - - 29,360 29,360
124,604 87,818 48,495 28,785 250,386 119,608 38,127 26,178 390,414 1,114,415
Reinsurance liabilities 134,393 94,621 52,438 31,030 237,949 127,322 40,720 26,175 - 744,648
Others - - - - - - - - 76,953 76,953
134,393 94,621 52,438 31,030 237,949 127,322 40,720 26,175 76,953 821,601
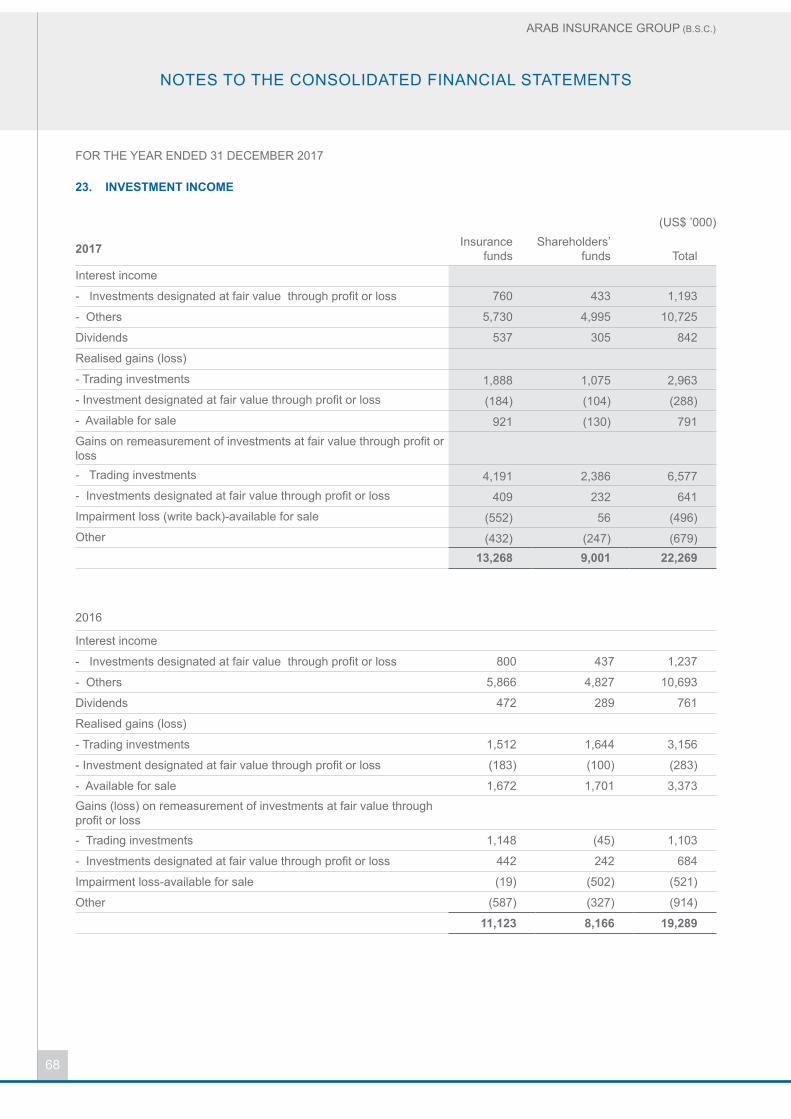
68
FOR THE YEAR ENDED 31 DECEMBER 2017
ARAB INSURANCE GROUP (B.S.C.)
NOTES TO THE CONSOLIDATED FINANCIAL STATEMENTS
23. INVESTMENT INCOME
(US$ ’000)
2017 Insurance funds
Shareholders’ funds Total
Interest income
- Investments designated at fair value through profit or loss 760 433 1,193
- Others 5,730 4,995 10,725
Dividends 537 305 842
Realised gains (loss)
- Trading investments 1,888 1,075 2,963- Investment designated at fair value through profit or loss (184) (104) (288)- Available for sale 921 (130) 791Gains on remeasurement of investments at fair value through profit or loss- Trading investments 4,191 2,386 6,577- Investments designated at fair value through profit or loss 409 232 641Impairment loss (write back)-available for sale (552) 56 (496)Other (432) (247) (679)
13,268 9,001 22,269
2016
Interest income
- Investments designated at fair value through profit or loss 800 437 1,237
- Others 5,866 4,827 10,693
Dividends 472 289 761
Realised gains (loss)
- Trading investments 1,512 1,644 3,156
- Investment designated at fair value through profit or loss (183) (100) (283)
- Available for sale 1,672 1,701 3,373
Gains (loss) on remeasurement of investments at fair value through profit or loss
- Trading investments 1,148 (45) 1,103
- Investments designated at fair value through profit or loss 442 242 684
Impairment loss-available for sale (19) (502) (521)
Other (587) (327) (914)
11,123 8,166 19,289

69
FOR THE YEAR ENDED 31 DECEMBER 2017
ANNUAL REPORT 2017
NOTES TO THE CONSOLIDATED FINANCIAL STATEMENTS
24. OPERATING EXPENSES
(US$ ’000)
Underwriting Non-Underwriting Total
2017Salaries and benefits 7,551 5,847 13,398General and administration 5,444 3,451 8,895
12,995 9,298 22,293
2016Salaries and benefits 12,322 5,148 17,470General and administration 5,186 2,894 8,080
17,508 8,042 25,550
25. OTHER INCOME(US$ ’000)
2017 2016Third party administration services 2,686 4,587Income (loss) from associates 237 (217)Other 2,672 929
5,595 5,299 26. OTHER EXPENSES AND PROVISIONS
(US$ ’000)2017 2016
Foreign exchange loss 686 2,015Provision for doubtful receivable & deposits 820 376Other 465 351
1,971 2,742
27. EARNINGS PER SHARE ATTRIBUTABLE TO SHAREHOLDERS
Basic and diluted earnings per share has been computed as follows:
2017 2016Weighted average number of shares outstanding ’000 198,032 198,032Net profit US$’000 7,222 9,162Earnings per share US cents 3.6 4.6

70
FOR THE YEAR ENDED 31 DECEMBER 2017
ARAB INSURANCE GROUP (B.S.C.)
NOTES TO THE CONSOLIDATED FINANCIAL STATEMENTS
28. POST EMPLOYMENT BENEFITS
The Group operates a number of post-employment plans on defined benefit basis. Eligibility for participation in the defined benefit plans is based on completion of a specified period of continuous service or date of hire. Benefits are based on the employee’s years of service.
The principal assumptions used for accounting purposes were:
2017 2016
Discount rate 2.8% 2.0%
Expected return on assets 2.8% 2.0%
Future salary increases 3.3% 3.3%
The movements in the liability recognised in the statement of financial position are:(US$ ’000)
2017 2016
Balance at 1 January 12,398 14,236
Accruals for the year 1,532 1,371
Payments during the year (1,727) (3,209)
Balance at 31 December 12,203 12,398
29. FORWARD FOREIGN EXCHANGE CONTRACTS
In the ordinary course of its business, the Group uses forward foreign exchange contracts to hedge its exposure in respect of foreign currency denominated investments and insurance liabilities. In the event that the item being hedged is sold or settled prior to maturity of the forward foreign exchange contract, it is generally the Group’s policy to enter into another offsetting forward foreign exchange contract of the same amount and maturity date. The notional amounts of these financial instruments are not recognised in the Group’s consolidated financial statements but their fair values are recognised as assets or liabilities, as appropriate, with changes in fair value being taken to the statement of income. The contracts oblige the Group to exchange cash flows to be received in the future from foreign currency denominated investments for U.S. Dollars at predetermined exchange rates. The counter parties in respect of these transactions are leading financial institutions.
i) Forward foreign exchange contracts – by currency(US$ ’000)
2017 2016Notional amount
purchasesNotional amount
salesNotional amount
purchasesNotional amount
salesEuro 584 9,462 - 5,046
Pound Sterling 1,056 3,369 - 6,219
Japanese Yen - 1,961 - 789
Others - 756 - 900
1,640 15,548 - 12,954
Notional amounts are the contract amounts used to calculate the cash flows to be exchanged. They are a common measure of the volume of outstanding transactions, but do not represent credit or market risk exposures.
ii) Forward foreign exchange contracts - remaining term to maturity
All of the forward foreign exchange contracts outstanding are due in one year or less.

71
FOR THE YEAR ENDED 31 DECEMBER 2017
ANNUAL REPORT 2017
NOTES TO THE CONSOLIDATED FINANCIAL STATEMENTS
29. FORWARD FOREIGN EXCHANGE CONTRACTS (Contd.)
iii) Forward foreign exchange contracts – unrealised gains and losses
The following table summarises the fair value of the Group’s hedging portfolio of forward foreign exchange contracts at the statement of financial position date, segregating the items between those that are in an unrealised gain position from those that are in an unrealised loss position.
(US$ ’000)2017 2016
Purchases Sales Purchases SalesUnrealised gains 42 - - 285Unrealised losses - (319) - (12)
42 (319) - 273
30. RECONCILIATION OF NET RESULT TO CASH FLOWS FROM OPERATING ACTIVITIES(US$ ’000)
2017 2016
Profit for the year 8,185 10,151
Decrease in insurance funds (24,386) (12,299)
Change in insurance receivable/payable, net (10,755) 24,585
Change in accrued income (1,486) (30,288)
Change in other assets/liabilities, net (36,025) 7,074
Net cash used in operating activities (64,467) (777)
31. RECONCILIATION OF LIABILITIES ARISING FROM FINANCING ACTIVITIES(US$ ’000)
Borrowings Borrowings cost Dividends Non-controlling
interestBalances at 31 December 2015 44,000 399 2,579 34,732Share of comprehensive income - - - 1,128Minority interest in subsidiary - - - 320Repayment of borrowings (3,000) - - -Interest paid during the year - (814) - -Interest for the year - 866 - -Dividends paid during the year - - (62) -Balances at 31 December 2016 41,000 451 2,517 36,180Share of comprehensive income - - - 768Subsidiary’s capital reduction - - - (11,500)Repayment of borrowings (10,000) - - -Additional borrowings 3,000 - - -Interest paid during the year - (767) - -Interest for the year - 947 - -Dividends declared - - 9,902 -Dividends paid during the year - - (9,255) -Balances at 31 December 2017 34,000 631 3,164 25,448

72
FOR THE YEAR ENDED 31 DECEMBER 2017
ARAB INSURANCE GROUP (B.S.C.)
NOTES TO THE CONSOLIDATED FINANCIAL STATEMENTS
32. FAIR VALUE DISCLOSURE
The following table presents the fair values of the Group’s financial instruments:(US$ ’000)
Book Value Fair value
2017
At fair value through profit
or loss
Loans and receivables
Held to maturity
Available for sale
Amortised cost Total
ASSETSCash and bank balances - 82,673 - - - 82,673 82,673
Investments 142,496 - 9,808 427,062 - 579,366 579,694
Accrued income - 103,096 - - - 103,096 103,096
Insurance receivables - 110,923 - - - 110,923 110,923
Insurance deposits - 25,809 - - - 25,809 25,809
Other assets - 28,197 - - - 28,197 28,197
LIABILITIESInsurance payables - - - - 53,337 53,337 53,337
Borrowings - - - - 34,000 34,000 34,000
Other liabilities - - - - 32,451 32,451 32,451
2016ASSETSCash and bank balances - 180,460 - - - 180,460 180,460Investments 138,060 - 9,770 406,747 - 554,577 554,928Accrued income - 101,610 - - - 101,610 101,610Insurance receivables - 108,402 - - - 108,402 108,402Insurance deposits - 28,086 - - - 28,086 28,086Other assets - 17,643 - - - 17,643 17,643
LIABILITIESInsurance payables - - - - 61,571 61,571 61,571Borrowings - - - - 41,000 41,000 41,000Other liabilities - - - - 39,365 39,365 39,365 The information disclosed in the table above is not indicative of the net worth of the Group.
Fair value is the price that would be received to sell an asset or paid to transfer a liability in an orderly transaction between market participants at the measurement date in the principal, or in its absence, the most advantageous market to which the Group has access at that date. The fair value of a liability reflects its non-performance risk.
When available, the Group measures the fair value of an instrument using the quoted price in an active market for that instrument. A market is regarded as active if transactions for the asset or liability take place with sufficient frequency and volume to provide pricing information on an ongoing basis.
When there is no quoted price in an active market, the Group uses valuation techniques that maximize the use of relevant observable inputs and minimize the use of unobservable inputs. The chosen valuation technique incorporates all the factors that market participants would take into account in pricing a transaction.

73
FOR THE YEAR ENDED 31 DECEMBER 2017
ANNUAL REPORT 2017
NOTES TO THE CONSOLIDATED FINANCIAL STATEMENTS
32. FAIR VALUE DISCLOSURE (Contd.)
The following methods and assumptions were used to estimate the fair value of the financial instruments:
i) General
The book values of the Group’s financial instruments except investments and forward foreign exchange contracts were deemed to approximate fair value due to the immediate or short term maturity of these financial instruments.
Hence, the fair value measurement details are not disclosed.
ii) Investments
The Company measures fair values using the following fair value hierarchy that reflects the significance of the inputs used in making the measurements:
• Level 1: Quoted prices (unadjusted) in active markets for identical assets and liabilities
• Level 2: Valuation techniques based on observable inputs, either directly (i.e. as prices) or indirectly (i.e. as derived from prices). This category includes instruments valued using: quoted market prices in active markets for similar instruments; quoted prices for identical or similar instruments in markets that are considered less active; or other valuation techniques where all significant inputs are directly or indirectly observable from market data.
• Level 3: Valuation techniques using significant unobservable inputs. This category includes all instruments where the valuation technique includes inputs not based on observable data and the unobservable inputs have a significant effect on the instrument’s valuation. This category includes instruments that are valued based on quoted market prices for similar instruments where significant unobservable adjustments or assumptions are required to reflect differences between the instruments.
Valuation techniques include net present value and discounted cash flow models and other valuation models. Assumptions and inputs used in valuation includes risk free and benchmark interest rates, bond and equity prices, and foreign exchange rates. The objective of valuation techniques is to arrive at fair value measurement that reflects the price that would be received on sale of the asset at the measurement date.
The table below analyses financial instruments, measured at fair value as at the end of the year, by level in the fair value hierarchy into which the fair value measurement is categorized:
(US$ ’000)2017 Level 1 Level 2 Level 3 TotalAt fair value through profit or lossHeld for tradingCommon stock of listed companies 56,712 - - 56,712Designated at fair value on initial recognitionDebt securities 85,784 - - 85,784Available for sale Debt securities 391,437 - - 391,437Common stock of listed companies 13,071 - - 13,071Common stock of unlisted companies - - 4,165 4,165Other - - 18,389 18,389Forward foreign exchange contracts (277) - - (277)
546,727 - 22,554 569,281

74
FOR THE YEAR ENDED 31 DECEMBER 2017
ARAB INSURANCE GROUP (B.S.C.)
NOTES TO THE CONSOLIDATED FINANCIAL STATEMENTS
32. FAIR VALUE DISCLOSURE (Contd.)
(US$ ’000)
2016 Level 1 Level 2 Level 3 TotalAt fair value through profit or lossHeld for tradingCommon stock of listed companies 43,937 - - 43,937Designated at fair value on initial recognitionDebts securities 94,123 - - 94,123Available for sale Debt securities 372,076 - - 372,076Common stock of listed companies 10,312 - - 10,312Common stock of unlisted companies - - 6,381 6,381Other - 878 17,100 17,978Forward foreign exchange contracts 273 - - 273
520,721 878 23,481 545,080
The tables below show movements in the Level 3 financial assets measured at fair value:
(US$ ’000)
Unlisted equity Others TotalBalance at 1 January 2017 6,381 17,100 23,481Gain (loss) recognised in- Income statement (707) (801) (1,508)- Other comprehensive income (146) 1,924 1,778Investments made during the year 112 4,229 4,341Investments redeemed during the year (1,475) (4,063) (5,538)Balance at 31 December 2017 4,165 18,389 22,554
Balance at 1 January 2016 6,357 15,895 22,252Gain (loss) recognised in- Income statement 299 (599) (300)- Other comprehensive income (10) (679) (689)Investments made during the year 187 4,801 4,988Investments redeemed during the year (452) (2,318) (2,770)Balance at 31 December 2016 6,381 17,100 23,481 The carrying values of the investment held in level 3 are based on unobservable inputs and reflects proportional share of the fair values of the respective companies and their underlying net assets. The Group does not expect the fair value of assets under level 2 & level 3 to change significantly on changing one or more of the unassumable inputs. The valuations of these investments are reviewed quarterly and updated as necessary on the basis of information received from investee and investment managers. For the year ended December 31, 2017, there were no transfers in and out of level 1, level 2 and level 3 (2016: none). The fair values are estimates and do not necessarily represent the price at which the investment would sell. As the determination of fair values involve subjective judgments, and given the inherent uncertainty of assumptions regarding capitalization rates, discount rates, leasing and other factors, the amount which will be realized by the Company on the disposal of its investments may differ significantly from the values at which they are carried in the consolidated financial statements, and the difference could be material.
The Group does not expect the fair value of assets under level 3 to change significantly on changing one or more of the measurable / observable inputs.

75
FOR THE YEAR ENDED 31 DECEMBER 2017
ANNUAL REPORT 2017
NOTES TO THE CONSOLIDATED FINANCIAL STATEMENTS
32. FAIR VALUE DISCLOSURE (Contd.)
iii) Forward foreign exchange contracts
The fair value of forward foreign exchange contracts, used for hedging purposes, is based on quoted market prices.
iv) Fair value less than carrying amounts
The fair value of fixed interest debt securities fluctuates with changes in market interest rates. The book value of financial assets held to maturity has not been reduced to fair value where lower, because such market rate variations are considered temporary in nature and management intends, and has the financial resources and capacity, to generally hold such investments to maturity.
33. PRINCIPAL SUBSIDIARIES AND ASSOCIATES
i) Subsidiaries and associates
At 31 December 2017, the principal subsidiaries of the Company were:
Country of incorporation Ownership Non-controlling Interests Principal Activities
Arig Capital Limited United Kingdom 100% Nil Reinsurance
Gulf Warranties W.L.L. Kingdom of Bahrain 100% Nil WarrantyTakaful Re Limited (under run-off) United Arab Emirates 54% 46% RetakafulArig InsuranceManagement (DIFC) Ltd. United Arab Emirates 100% Nil Insurance
Manager
All holdings are in the ordinary share capital of the subsidiaries concerned and are unchanged from 31 December 2016 except for Takaful Re Limited where capital was reduced from US$ 125 million to US$ 100 million. The Company holds 49% and 25% of the equity shares in its associate companies Arima Insurance software W.L.L. and Globemed Bahrain W.L.L., Bahrain respectively.
ii) Interest in subsidiaries: Takaful Re Limited (US$ ’000)
2017 2016
Non-controlling interest 46% 46%
Total assets 92,499 129,497
Total liabilities 37,684 51,535
Net Assets 54,815 77,962 Revenue (1,462) (1,180)
Profit for the year 2,279 2,150
Total comprehensive income 1,853 2,453
Comprehensive income attributable to non-controlling interests 852 1,128
Net cash (used in) provided by operating activities (10,158) 748
Net cash provided by (used in) investing activities 9,448 (2,064)
Net cash used in financing activities (25,000) -
Net decrease in cash and cash equivalents (25,710) (1,316)
The subsidiary’s policyholder funds are consolidated as these funds are controlled and managed by the subsidiary which is in a position to direct activities and operations.

76
FOR THE YEAR ENDED 31 DECEMBER 2017
ARAB INSURANCE GROUP (B.S.C.)
NOTES TO THE CONSOLIDATED FINANCIAL STATEMENTS
34. RELATED PARTY TRANSACTIONS
Related parties represent the Company’s major shareholders, associates, directors and key management personnel.
The following is the summary of transactions with related parties.
i) Associate companies(US$ ’000)
2017 2016
a) Service fees for administration services provided by Arig 89 98
b) Service fees for administration services provided by associate 705 593
c) Balances outstanding- Receivables- Payables
-100
205-
ii) Compensation to directors and key management personnel(US$ ’000)
2017 2016
a) Directors
- Attendance fees 65 107
- Travel expenses 160 153
b) Key management compensation
- Salaries and other short-term employee benefits 1,607 1,755
- Post-employment benefits 426 300
- Employee long-term incentives 432 1,767
c) Balances payable (net)
Key management
- Maximum balance 4,975 4,411
- Closing balance 4,586 4,411
All transactions with related parties are conducted on an arm’s length basis. All outstanding balances from related parties are expected to be settled within 12 months. No provisions have been required in 2017 and 2016 for any outstanding amounts due from related parties.

77
FOR THE YEAR ENDED 31 DECEMBER 2017
ANNUAL REPORT 2017
NOTES TO THE CONSOLIDATED FINANCIAL STATEMENTS
35. PARENT COMPANY
The unconsolidated statement of financial position of the parent company, Arab Insurance Group (B.S.C.), is presented below.
(US$ ’000)
2017 2016
ASSETSCash and bank balances 35,159 99,630
Investments 515,282 478,031
Accrued income 98,568 95,193
Insurance receivables 26,645 32,699
Insurance deposits 25,950 27,286
Deferred policy acquisition costs 13,224 10,801
Reinsurers’ share of technical provisions 20,507 30,661
Other assets 100,852 80,920
Investment in subsidiaries and associates 28,217 43,613
Property and equipment 7,126 8,202
871,530 907,036LIABILITIES Technical provisions 527,822 536,616
Insurance payables 31,393 43,373
Borrowings 34,000 41,000
Other liabilities 21,381 29,413
614,596 650,402
SHAREHOLDERS’ EQUITY (note 20)Share capital 220,000 220,000
Treasury stock (14,793) (14,793)
Reserves 41,112 37,387
Retained earnings 10,615 14,040
256,934 256,634
871,530 907,036


Mauritius Representative OfficeUnit 12C, 12th FloorStandard Chartered Tower19 Cyber CityEbene 72201Mauritius.Tel: +230 466 0112 / 466 0092Fax: +230 466 0114E-mail:[email protected]
THE ARIG GROUP
Parent Company
Head OfficeArig House, Diplomatic AreaP.O. Box 26992, Manama Kingdom of BahrainTel: +973 17 544 444Fax: +973 17 531 155E-mail: [email protected]
Subsidiaries
Takaful Re LimitedBurj Daman, DIFCOffice C401, Level 4P.O. Box 211181Dubai, United Arab EmiratesTel: +971 4 360 0535Fax: +971 4 363 7197E-mail: [email protected]
Arig Capital Limited150 MinoriesLondon, EC3N 1LSUnited KingdomTel: +44 20 7347 5001
Gulf Warranties W.L.L.P.O. Box 5209Dubai, United Arab EmiratesTel: +971 4 335 5347Fax: +971 4 335 5679E-mail: [email protected]
Arig Insurance Management (DIFC) LimitedUnit C407, Level 4, Burj Daman, DIFCP.O Box 506550, Dubai, United Arab EmiratesTel: + 971 4 431 0164Fax: + 971 4 363 7197E-mail: [email protected]


A reinsurance firm regulated by the Central Bank of Bahrain