annual report 2013 - boom logistics · 4 boom logistics annual report 2013 $2.0 million ebit in the...
TRANSCRIPT

IBOOM LOgistics AnnuAL RepORt 2013
AnnuAl RepoRt 2013

BOOM LOgistics AnnuAL RepORt 2013II
Corporate Directory IFC
Chairman’s Report 2
Managing Director’s Report 4
Highlights 6
Our Customers, Markets & Operations 8
Our Health, Safety, Environment & Quality 10
Our People & Systems 12
Corporate Governance 14
Directors’ Report 25
Annual Financial Report 45
ASX Additional Information 102
dIrectorsR John RobinsonBrenden C MitchellFiona R V BennettHoward J CritchleyTerrence C FrancisTerence A Hebiton
company secretaryIona MacPherson
regIstered offIceLevel 6, 55 Southbank BoulevardSouthbank Vic 3006Telephone (03) 9207 2500Fax (03) 9207 2400
Internet addresswww.boomlogistics.com.au
LegaL advIsersHerbert Smith FreehillsBaker & McKenzieHall & WilcoxTressCox Lawyers
audItorsKPMG
share regIsterComputershare Investor Services Pty Ltd452 Johnston StreetAbbotsford, Victoria, 3067Investor Enquiries 1300 850 505
annuaL generaL meetIngTuesday, 22 October 2013at 11:00amArts Centre MelbourneANZ PavilionLevel 8, 100 St Kilda RoadMelbourne Vic 3004
Corporate Directory
Contents
BOOM LOgistics AnnuAL RepORt 2013
1BOOM LOgistics AnnuAL RepORt 2013
our Company
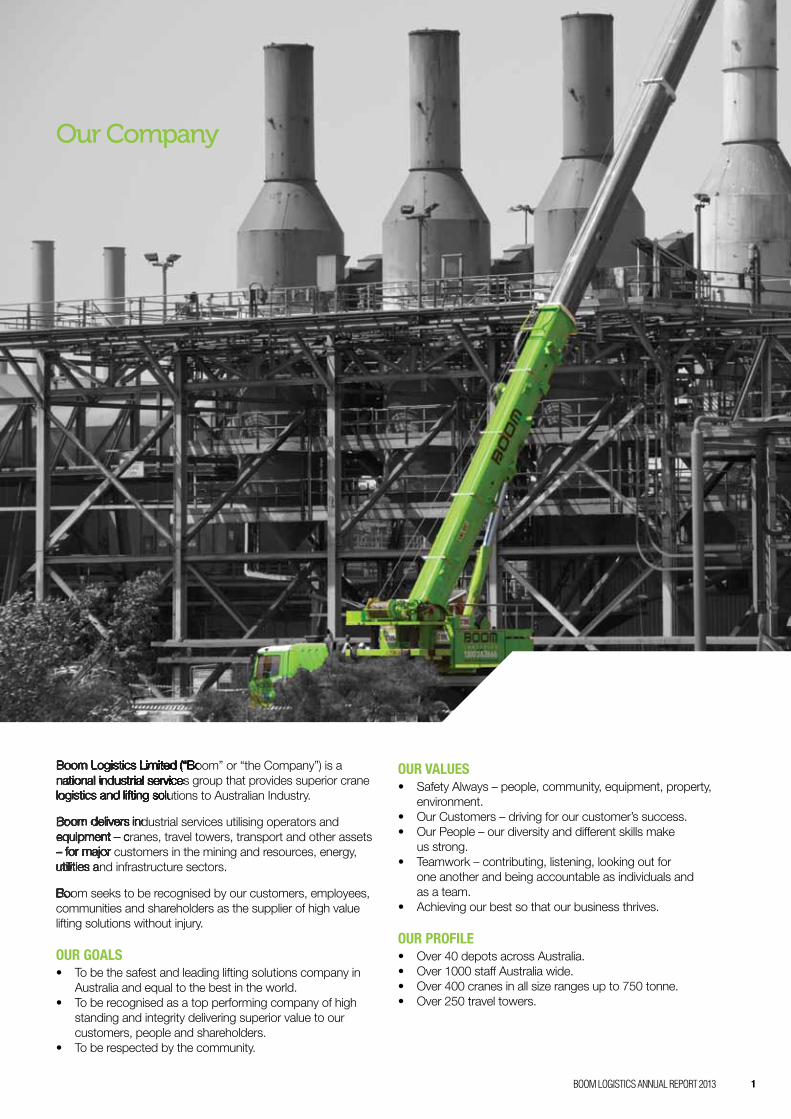
Boom Logistics Limited (“Boom” or “the Company”) is a national industrial services group that provides superior crane logistics and lifting solutions to Australian Industry.
Boom delivers industrial services utilising operators and equipment – cranes, travel towers, transport and other assets – for major customers in the mining and resources, energy, utilities and infrastructure sectors.
Boom seeks to be recognised by our customers, employees, communities and shareholders as the supplier of high value lifting solutions without injury.
our goaLs• To be the safest and leading lifting solutions company in
Australia and equal to the best in the world. • To be recognised as a top performing company of high
standing and integrity delivering superior value to our customers, people and shareholders.
• To be respected by the community.
our vaLues• Safety Always – people, community, equipment, property,
environment.• Our Customers – driving for our customer’s success.• Our People – our diversity and different skills make
us strong.• Teamwork – contributing, listening, looking out for
one another and being accountable as individuals and as a team.
• Achieving our best so that our business thrives.
our profILe• Over 40 depots across Australia.• Over 1000 staff Australia wide.• Over 400 cranes in all size ranges up to 750 tonne.• Over 250 travel towers.
Boom Logistics Limited (“Boom” or “the Company”) is a Boom Logistics Limited (“Boom” or “the Company”) is a Boom Logistics Limited (“Boom” or “the Company”) is a national industrial services group that provides superior crane Boom Logistics Limited (“Boom” or “the Company”) is a national industrial services group that provides superior crane Boom Logistics Limited (“Boom” or “the Company”) is a national industrial services group that provides superior crane Boom Logistics Limited (“Boom” or “the Company”) is a national industrial services group that provides superior crane logistics and lifting solutions to Australian Industry.
Boom Logistics Limited (“Boom” or “the Company”) is a national industrial services group that provides superior crane logistics and lifting solutions to Australian Industry.
Boom Logistics Limited (“Boom” or “the Company”) is a national industrial services group that provides superior crane logistics and lifting solutions to Australian Industry.
Boom Logistics Limited (“Boom” or “the Company”) is a national industrial services group that provides superior crane logistics and lifting solutions to Australian Industry.
Boom Logistics Limited (“Boom” or “the Company”) is a national industrial services group that provides superior crane logistics and lifting solutions to Australian Industry.
Boom Logistics Limited (“Boom” or “the Company”) is a national industrial services group that provides superior crane logistics and lifting solutions to Australian Industry.
Boom delivers industrial services utilising operators and
Boom Logistics Limited (“Boom” or “the Company”) is a national industrial services group that provides superior crane logistics and lifting solutions to Australian Industry.
Boom delivers industrial services utilising operators and
Boom Logistics Limited (“Boom” or “the Company”) is a national industrial services group that provides superior crane logistics and lifting solutions to Australian Industry.
Boom delivers industrial services utilising operators and equipment – cranes, travel towers, transport and other assets
Boom Logistics Limited (“Boom” or “the Company”) is a national industrial services group that provides superior crane logistics and lifting solutions to Australian Industry.
Boom delivers industrial services utilising operators and equipment – cranes, travel towers, transport and other assets
Boom Logistics Limited (“Boom” or “the Company”) is a national industrial services group that provides superior crane logistics and lifting solutions to Australian Industry.
Boom delivers industrial services utilising operators and equipment – cranes, travel towers, transport and other assets
Boom Logistics Limited (“Boom” or “the Company”) is a national industrial services group that provides superior crane logistics and lifting solutions to Australian Industry.
Boom delivers industrial services utilising operators and equipment – cranes, travel towers, transport and other assets – for major customers in the mining and resources, energy,
Boom Logistics Limited (“Boom” or “the Company”) is a national industrial services group that provides superior crane logistics and lifting solutions to Australian Industry.
Boom delivers industrial services utilising operators and equipment – cranes, travel towers, transport and other assets – for major customers in the mining and resources, energy, utilities and infrastructure sectors.
Boom seeks to be recognised by our customers, employees,

BOOM LOgistics AnnuAL RepORt 20132
Chairman’s Report
The 2013 Financial Year began with a continuation of the strong trading conditions that we had experienced during the preceding months and at the time of the Annual General Meeting of shareholders we held a positive view of the year ahead. Our circumstances suddenly changed at the end of October 2012 when our
major customers shifted their focus from revenue growth to stringent cost cutting. These changes picked up pace in the second quarter of FY13 and have persisted through to the present time. The consequence has been a general reduction in activity and severe pressure on the prices we charge for our services. These challenging operating conditions have been experienced across the entire mining services sector and as with others we have responded to this new operating paradigm by taking swift action to restructure our business.
The Company’s workforce has been reduced by 12%, with almost a third of this applying to the general overheads category. We have also placed a freeze on senior executive salaries during FY14.The reduction in manning levels has been particularly directed towards our New South Wales and Queensland operations where diffi cult trading conditions for Hunter Valley and Bowen Basin coal producers has been refl ected in a marked downturn in our service activity.
The circumstances have also prompted an adjustment to our crane fl eet, with some 66 surplus assets identifi ed for sale. We have used this opportunity to refresh the fl eet profi le by releasing older and smaller cranes as well as machines that fall outside our preferred crane brands, some of which have been customised for specifi c applications. These changes facilitate interchangeability across the fl eet and simplify equipment maintenance and support.
The restructuring activity has continued into FY14, with further redundancies, overhead cost reductions and renegotiation of Enterprise Bargaining Agreements. It is essential that we
continue responding to the need for operating fl exibility and further direct cost reduction to ensure we remain competitive in this new operating environment. A more detailed outline of the changes already implemented and those in progress are provided in the Managing Director’s report to shareholders.
The circumstances described above have of course been refl ected in our FY13 operating results, as released to the market in mid August. At that time we announced a statutory net loss of $2.5 million after allowing for $18.9 million of non cash charges on a pre tax basis. These non cash charges comprised $11 million in asset impairments, $6.8 million in restructuring costs and $1.1 million of other one-off costs. Our trading profi t for FY13, excluding the non cash charges, was $10.7 million a reduction of 42% when compared against the FY12 trading result. Directors have not declared a dividend for FY13.
Despite the diffi cult operating environment the Company continues to deliver strong operating cashfl ows. We were able to invest $62.3 million into the business during FY13 whilst also reducing debt. Following last year’s level of capital investment we expect a signifi cantly lower requirement for new investment in FY14 and free cashfl ow will be directed to further debt reduction and an expected on-market share buyback. The latter is a response to the continuing gap between our share price and the underlying net asset backing per share of 51 cents.
In looking to the year ahead, we expect our resource sector customers to continue their drive for greater cost effi ciency and we also expect the level of general infrastructure spending to remain subdued. We do see, however, continuing strength in activity across the telecommunications and energy sectors including wind farm development and servicing. We are well positioned to participate in these areas through both our crane and travel tower businesses. We will also continue our drive to extract greater effi ciency from our business through improved labour fl exibility and overhead cost reduction. Our crane fl eet and travel tower assets have received solid investment during the past 12 months and we have continued to invest in improved operating systems to achieve cost effi ciency and more streamlined data access. The benefi ts from last year’s spend will be experienced in the current year and beyond.
we will continue the drive to extract greater effi ciency from our business through improved labour fl exibility and overhead cost reduction.[ ]

3BOOM LOgistics AnnuAL RepORt 2013
Turning to Board matters, we announced earlier in the year the appointment of Howard Critchley as a Non Executive Director to fi ll a casual vacancy following the retirement of Dr Huw Davies from the Board. Howard was formerly Managing Director of TNT Logistics, Australia, Asia and China and then became Managing Director of Ceva Logistics, an entity created from the merging of TNT Logistics and Eagle Global Logistics. He remained in this position until his retirement. Howard’s depth of knowledge and experience in the industrial services sector brings valuable insights to the Boom Logistics Board.
In concluding this report, I would like to acknowledge the dedication and effort of management during a period that has been the most challenging since the GFC.
John RobinsonNon-Executive Chairman
]

BOOM LOgistics AnnuAL RepORt 20134
$2.0 million EBIT in the fi nancial year with a return on investment of 7%. We know we lost this contract on price in a large part due to our high cost Enterprise Bargaining Agreement (EBA) in the North West of Western Australia. This contract was completed at the end of August 2013 and in the fi rst part of this fi nancial year we will transition those cranes to other activities.
On a positive note we were successful in re-signing a number of major contracts including coal maintenance contracts on the East Coast with Rio Tinto and importantly we also won new contracts. These included the Karara Mining maintenance service contract for their new facility near Geraldton which commenced in 2012, contracts at Henderson for the Gorgon Liquefi ed National Gas (LNG) project and at Fortescue Metal Group’s Solomon Hub iron ore mine with Leightons to support the construction works for those projects. These revenues will support our WA business during FY14. In addition Boom Sherrin was successful in winning a number of key contracts in the Telecommunications sector which supported a consistent result with the previous year.
Apart from these and other contract wins, the 2013 fi nancial year was disappointing compared to our previous year and our forward outlook of twelve months ago with a Statutory Net Loss of $2.5 million after $18.9 million of non-cash charges on a pre-tax basis. However during this same period we reduced debt and invested $62.3 million in the business which included expansion into South Australia through the BHP Billiton Olympic Dam contract and reinvestment in the Travel Tower business which has strong prospects in the utilities sector.
Our trading results of $26.0 million at EBIT and $10.7 million at NPAT were down $9.5 million and $7.8 million respectively on the previous year.
The decision last year to manage our access and general hire assets for cash and to restructure the Boom Sherrin business ensured that this business was able to maintain earnings. Our crane logistics business was unable to deliver to expectations with our coal customers under extreme duress reducing spending both with us and with other suppliers who we also service. The continued drive by miners and commodity suppliers to reduce costs is impacting nationally. A reasonable level of activity in South Australia and Western Australia has mitigated to some extent the East Coast impacts however we are seeing continued volatility and pressure on pricing across the board.
managing Director’s Report
Safety is critical to our customers, employees, fellow contractors, the community and hence our business. In this past year the business has continued to focus on improving our performance with the introduction of our “Life Saving Rules.” Our Life Saving Rules encapsulate critical elements of our quality and safety frameworks to ensure
everyone is focused daily on the issues that can endanger life or cause serious harm. Our Life Saving Rules along with continuous efforts to increase and improve interactions between our people will ensure we further improve our safety performance.
In the last four years our strategy has focused on our core businesses of crane logistics and travel towers in the mining & resources, energy, utilities and infrastructure sectors. The ongoing execution of this strategy included exiting non-core businesses, restructuring metropolitan businesses, reshaping our fl eet and winning contracts in new areas.
I have talked previously about our business serving customers who are, on the whole, lower cost producers and therefore well positioned through commodity cycles. In combination with our focus on delivering ongoing maintenance services, our business is less affected by capital deferrals for expansion projects. Consequently, we expect to be less exposed to the volatility that caused us so much pain during the global fi nancial crisis and the transformational period during which we have executed our strategy.
With commodity prices and the strength of the Australian dollar putting extreme pressure on even the lowest cost commodity producers and in turn their suppliers, our maintenance activities have been impacted to a degree we did not expect. This combined with a severe contraction in infrastructure spending on the East Coast resulted in a signifi cant downturn in revenue after the fi rst quarter of the 2013 fi nancial year.
As reported in June this year we were unsuccessful in retaining the BHP Billiton Iron Ore Ports contract which contributed
our strong asset base, reduced capital expenditure requirement and planned asset sales will support strong cash generation in fy14.[ ]

5BOOM LOgistics AnnuAL RepORt 2013
We responded to these challenges by continuing to drive cost reductions aided by the successful implementation of our national payroll and national fi nancial systems. A total of 130 employees (or 12% of our workforce) nearly one third of which were overhead positions were retrenched from the business as we adjusted our operations to the changed environment. This equates to $12 million of costs being removed from the business. A further 60 employees will leave the business in the fi rst quarter of the new fi nancial year as we continue to adjust to the new operating paradigm.
Due to the reduction in activity we have identifi ed surplus assets for sale in the access equipment and crane logistics fl eet. These assets have been impaired to refl ect the anticipated market over the next twelve months to ensure we can deliver more than $10 million of cash to the business. The access assets, which we have been managing for cash, service the construction and infrastructure markets which have experienced a slow down. The 66 cranes identifi ed for sale have an average age profi le of 17.6 years with 36 of them having a capacity of 20 tonne or under and a further 15 cranes being less recognised or accepted models.
The average age of our crane fl eet is now 8.9 years, down from nearly 13 years four years ago during which time we invested $180 million in new capital. In addition we have refurbished and improved 79 Glove and Barrier Travel Towers that were impaired two years ago which now have a conservative value of $20 million in the market. This underpins our $337 million of Plant and Equipment on our balance sheet and with a further $10 million investment planned in Travel Towers during FY14 the business is well positioned in all of our core asset classes.
Looking forward we expect prevailing market conditions to continue with subdued and volatile demand expected in the mining and infrastructure sectors. We will, therefore, take a conservative approach to capital expenditure to enable us to further reduce debt and to be in a position to return funds to shareholders. Our overall capital expenditure, expected to be below depreciation, coupled with planned asset sales will support strong cash generation from the business in FY14.
Our labour costs, underpinned by existing EBA frameworks, have become less competitive where skills have been scarce and our mining customers have required uninterrupted production. We are now working through alternatives including the outsourcing of some labour requirements whilst
renegotiating with our employees to improve fl exibility, retain contracts and ensure employment. We expect to have far more competitive arrangements in place in North West WA due to the efforts of our employees and managers to work through what is a challenging set of circumstances. We will continue to work with our employees and assess other models to ensure we remain competitive.
Over the last fi ve years we have built solid safety, quality and fi nancial governance frameworks and are now in a far better position to reduce our overall cost base. We will reduce overall administration and overhead costs by a further $2.5 million annualised in the next twelve months whilst taking the opportunity to consolidate our Boom Sherrin and crane logistics businesses where they are in the same geographic locations.
Returns from the coal sector are diffi cult and as a result we will look to expand our position in the LNG, wind farm, utilities and resources sectors as well as in new projects and markets. By increasing asset utilisation through either wet hire or dry hire we will increase returns.
Whilst the current uncertainty and pressure in the commodity sectors makes forecasting diffi cult we have a strong asset base suitable to all our core markets and a record of strong service. In addition we are reducing our cost base and working with our people to improve our operational fl exibility to ensure we continue to win new contracts in our core markets. This allows us to respond to the challenges that face us whilst positioning for increases in market activity.
With our people focused on improving operational performance within a sound quality and safety framework we can deliver improved shareholder returns. In the short term we must respond to the market requirements and continue to deliver on our value proposition.
Brenden MitchellManaging Director
]

BOOM LOgistics AnnuAL RepORt 20136
heaLth, safety, quaLIty & envIronment
✔ A Lost Time Injury Frequency Rate (LTIFR) of below 3.
✔ Introduction of Life Saving Rules across the business.
✔ Continuing implementation of the three year HSEQ Strategic Plan with an emphasis on risk reduction.
✔ Maintenance of AS/NZS 4801:2001 and AS/NZS ISO 9001:2008 certifi cations and compliance with all environmental management obligations.
fInancIaL & operatIons
✔ Boom is adapting to signifi cant changes in market conditions.
✔ Signifi cant operational restructuring and fl eet review undertaken.
✔ Strong future free cash fl ows underpinned by solid operating cashfl ow, substantially reduced capital expenditure and surplus asset sales.
✔ Operational priorities include refi ning Boom’s labour model to provide fl exibility in responding to changed market conditions, converting our strong sales pipeline and further cost reductions.
✔ Capital management prioritises balance sheet deleveraging and a share buy back.hi
ghlig
hts
2013
high
light
s 20
13

7BOOM LOgistics AnnuAL RepORt 2013
markets & growth
✔ Successful transition to supply a comprehensive service delivery model at BHPB Olympic Dam.
✔ Continued expansion of services provided on the Gorgon LNG Project.
✔ New business wins in high voltage transmission line and iron ore construction projects.
✔ A solid pipeline for crane logistics in the LNG and renewable energy sectors.
✔ A solid sales pipeline for travel towers in the telecommunications and energy sectors.
peopLe & systems
✔ Successful implementation of National payroll system and centralisation of the payroll function.
✔ Successful implementation of National fi nancial system with program of work underway to centralise selected support functions and to reduce overhead costs.
✔ Continual upskilling of operators and riggers including experience on new equipment and ongoing verifi cation of competency.
✔ Launch of Boom’s e-Learning Centre.

BOOM LOgistics AnnuAL RepORt 20138
our customers Boom’s core value proposition to our customers is to deliver high value industrial services, based on providing a total lifting solution involving specialised equipment, qualifi ed and skilled people, industry knowledge, engineering expertise and best-practice safety and quality systems.
During FY13, Boom continued to execute its strategy to focus on sustaining long-term customer relationships in the mining and resources, energy, utilities and infrastructure sectors that are strongly aligned to Boom’s value proposition.
our market posItIonBoom is well positioned to drive business improvement in response to market changes.
Boom’s strategic approach to industry sector, commodity and geographic diversity helps to defray the impacts of the coal and infrastructure slowdown (predominantly on the East Coast).
Boom’s revenue is derived primarily from major customer maintenance contracts. Boom is consequently less reliant on construction expansion projects and is not exposed to exploration or new mine development. In addition, Boom has a strong capability to support customers who need to maintain production levels of existing facilities.
Boom’s new business pipeline continues to be strong, particularly in the areas of LNG, wind farms, energy and telecommunications projects including various resource opportunities in Western Australia and Queensland:
• Contract renewal with Rio Tinto on the East Coast.• A new maintenance contract with Karara Mining for their
new facilities near Geraldton, WA.• A new contract with CB&I and Kentz Joint Venture
(CKJV) for the Gorgon LNG project was recently won to supply 13 cranes and associated services valued at $3.6 million revenue.
• Boom Sherrin has recently been awarded contracts on two signifi cant high voltage transmission line construction projects in Queensland and New South Wales. Currently these contracts are expected to deliver in excess of $4 million revenue in FY14 with further opportunities for Boom in this sector.
• Crane Logistics has secured the contract to supply All Terrain cranes and associated equipment for on site requirements to Leighton Contractors Pty Ltd at the Solomon Hub iron ore project in Western Australia. The contract with Leightons is expected to deliver $2 million over the next 18 months.
Boom continues to service the wind farm maintenance sector and expects to benefi t from a strong pipeline of construction projects scheduled to commence in 2014.
our Customers, markets & operationsour Customers, our Customers, our Customers, our Customers, our Customers, our Customers, markets & operationsour Customers, markets & operationsour Customers, markets & operationsour Customers, markets & operationsour Customers, markets & operationsour Customers, markets & operationsour Customers, markets & operationsour Customers, markets & operationsour Customers, markets & operationsour Customers, markets & operationsour Customers, markets & operationsour Customers, markets & operationsour Customers, markets & operationsour Customers, markets & operationsour Customers, markets & operationsour Customers, markets & operationsour Customers, markets & operationsour Customers, markets & operationsour Customers, markets & operationsour Customers, markets & operationsour Customers, markets & operations
over $10 million in new contract wins at Karara mining, gorgon lng, hv transmission line construction and solomon hub projects.[ ]

9BOOM LOgistics AnnuAL RepORt 2013
our vaLue proposItIon With safety and operational discipline at its core, Boom’s customer value proposition is based on total solutions involving:
Equipment• Fleet aligned to industry requirements in mining &
resources, energy, utilities and infrastructure projects.• Well maintained fl eet with maintenance records and Key
Performance Indicator reporting for customers.
Operational Capability• Experienced and trained workforce of supervisors, crane
operators and riggers.• Operational resources and infrastructure to support
customers in our core markets.• Planned and confi gured services involving operators,
cranes, transport and other assets to meet complex customer requirements.
Engineering Expertise• Pre-lift customer site survey and analysis.• Detailed engineering lift studies to drive safety, effi ciency
and cost effectiveness.• Project planning and project management.
Safety & Quality Systems• Cultural alignment with our customer base with an
uncompromising safety focus. • ISO 9001 and AS4801 certifi cation.• Investment to drive continuous improvement in our safety
systems, processes and organisation.
Boom’s value proposition reaches far beyond equipment hire. Boom’s services include planning and project management, multi-party logistics coordination, lift design and engineering, on-site supervision and lift control, on-site safety leadership, site-inducted personnel, task optimisation and cost control, project data capture and reporting, task assessments and continuous improvement analysis.
Boom’s distinct value proposition provides a solid platform for future growth.
fLeet & Infrastructure InvestmentBoom has maintained a program of disciplined capital investment into the crane and travel tower fl eet in line with the needs of our key blue chip customers in the mining and resources, energy, utilities and infrastructure sectors.
Over the last few years, Boom has invested signifi cantly to ensure it has the right profi le of assets to address market and customer requirements. In FY13 the Company invested $62.3 million of cash in new equipment. This investment to improve the fl eet mix means the current fl eet is now well balanced to meet current demand.
Margins and returns are expected to improve due to a reduction in cross hire equipment as well as surplus assets which have been identifi ed for disposal.
]

BOOM LOgistics AnnuAL RepORt 201310
our health, safety, environment & quality
BOOM LOgistics AnnuAL RepORt 201310
In fy13 we launched our life saving Rules, the next step in our ongoing approach to achieving an injury and incident free workplace.
[ ]

11BOOM LOgistics AnnuAL RepORt 2013
our safety goaLsBoom’s Health, Safety, Environment & Quality (HSEQ) goals underpinning our vision are:• To exceed client and other stakeholders’ HSEQ
expectations through consistently providing benchmarked high quality and incident free services;
• Establish a positive and proactive safety culture with well trained and competent people who demonstrate Boom’s values and exceptional safety leadership; and
• Continue to develop and use excellent HSEQ processes and systems.
safetyBoom’s safety performance continues to be a key focus. Our continued operational focus is on safety as Boom’s highest priority, to ensure our employees and customers are free of harm while we deliver high value crane logistics and travel tower lifting solutions.
Ensuring the safety and wellbeing of our people is an operational discipline that differentiates Boom from our competitors. It is a key component of the value proposition sought by our customers. Our safety culture strengthens our relationships with our customers and employees alike. Boom’s ongoing emphasis on safety leadership, best practice safety systems and our “Safety Always” culture builds confi dence with our customers and employees around predictable, reliable and consistent delivery of high value lifting solutions.
Boom has a three year HSEQ Strategic Plan with an emphasis on risk reduction. Boom has established frameworks around Fatal and Catastrophic Risk Protocols and Life Saving Rules that the business manages. The approach to Lifting Operations, Transport Operations, Mobile Elevated Work Platforms, Maintenance and Equipment, Working at Heights and Hazardous Energy have all benefi tted from these frameworks. The effect on plant safety, safety of our people and safety of those with whom we interact will be signifi cant. An important additional effect of the engagement with our personnel is the strengthening of the commitment to a “Safety Always” approach.
Certifi cation to AS/NZS 4801:2001 has been maintained.
safety LeadershIpAt Boom, we take a four-tiered leadership approach to safety.
Safety Leadership Structure Health, Safety, Environment & Quality (HSEQ) CommitteeThe HSEQ Committee, a sub-committee of the Board, meets quarterly and considers all aspects of Boom’s safety environment. A summary of this committee’s responsibilities is set out in the Corporate Governance section of this report.
Safety Leadership Team (SLT)A safety leadership team, chaired by the Chief Executive Offi cer and comprising the general managers of every business unit, prioritises and monitors our safety environment and safety improvement activities. The SLT is supported by a team of safety professionals that operate nationally or within business units.
Personal Commitment StatementsAll operational managers have prepared, and shared with their work groups, their personal safety commitment statements which articulate the individual behaviours they undertake to support Boom’s goal of zero harm. All operational managers have their day-to-day safety responsibilities specifi ed and monitored.
TrainingBoom’s operational training program contains a signifi cant safety element that embeds good workplace safety as an operational discipline.
envIronmentBoom continues to meet its community expectations and legal obligations in relation to environmental management. Boom complies with the National Greenhouse and Energy Reporting Act 2007 and we report our emissions and energy consumption each fi nancial year.
quaLItyThe Company has maintained its certifi cation to AS/NZS ISO 9001:2008.
]

BOOM LOgistics AnnuAL RepORt 201312
our People & systems
BOOM LOgistics AnnuAL RepORt 201312
boom continues to focus on building operational capability through its people, processes and systems to deliver its value proposition to Customers.
[ ]

13BOOM LOgistics AnnuAL RepORt 2013
overvIewAs at 30 June 2013, Boom’s workforce consisted of over 1000 employees across a range of disciplines. 70% of the workforce directly interfaces or provides a service to customers, including operators, supervisors, safety professionals, engineers and sales employees. The remaining 30% include management, fi nance, human resources, information technology, procurement and support personnel.
Boom’s engineering capability with extensive CAD design experience through our supervisors and engineers, provides our customers with technical expertise in safe lifting solutions.
Boom continues to focus on its strategy of building operational capability through its people, processes and systems to deliver its value proposition to our customers and to generate strong returns for shareholders.
Boom continued to invest in systems to support the business and reduce overhead costs. The new National Payroll System completed its successful phased implementation in November 2012 including the centralisation of the payroll function. The new integrated fi nancial system was successfully implemented in November 2012 with a program of work underway to centralise selected support functions and reduce overhead costs.
dIversItyBoom’s value proposition is founded on its ability to offer customers a safe and quality service. Boom strives to seek out and retain the fi nest talent with a view to developing a strong team that Boom’s customers can rely on. Boom is committed to its value of treating all people with respect and recognises that diversity and a broad range of skills makes Boom strong. With a key element of Boom’s value proposition based on its people’s capability and expertise, a diverse and talented workforce is a key competitive advantage that differentiates Boom’s service to the customers and the markets it supports.
The Boom Logistics Diversity Policy extends across the entire organisation, including the Board of Directors, senior executives, management and all other employees. The policy recognises diversity of gender, age, ethnicity, disability and cultural background.
IndIgenous programBoom’s commitment to its Indigenous Program supports its customers and communities in Central Queensland and Western Australia. Boom’s National Indigenous Employment Framework provides a basis for localised strategies for generating work opportunities and developing sustainable relationships with indigenous communities. Boom continues to make progress in the North West through indigenous development programs and traineeships.
traInIng & deveLopmentBoom recognises the value in developing our people and considers this a key strategic priority for the business.
Boom continues to invest in training and development for its operational staff to ensure operating tickets are maintained, safety standards are upheld, customer site inductions are current and operators are vocationally competent to meet the needs of our customers. During FY13 there has been continual upskilling of operators and riggers including experience on new equipment and ongoing verifi cation of competency.
A signifi cant achievement during FY13 was the launch of Boom’s e-Learning Centre. This e-Learning Centre supports the improvement of capability within the company and covers a range of topics including:• safety leadership;• inductions;• compliance; and• management skills.
]

BOOM LOgistics AnnuAL RepORt 201314
approach to governance Corporate governance is important at Boom and is a fundamental part of the culture and the business practices of the Company. Directors of Boom have specifi c duties and responsibilities for ensuring good corporate governance practices are adopted by the Company.
The Company has securities listed on the Australian Stock Exchange (ASX) and therefore must also comply with a range of listing and corporate governance requirements.
The key aspects of the Company’s corporate governance framework and primary corporate governance practices for the 2013 year are outlined below.
approach to governance The Board has adopted the ASX Principles of Good Corporate Governance and Best Practice Recommendations 2010. Corporate governance practices applied by the Company are set out below.
Board and commIttee composItIonThe Board currently has six Directors comprising fi ve Non-Executive Directors and the Executive Managing Director. All of the Non-Executive Directors, including the Chairman, are Independent Directors in compliance with ASX Corporate Governance Best Practice guidelines.
Details of the respective Directors’ qualifi cations, Directorships of other listed companies, including those held at any time in the three years immediately before the end of the fi nancial year, experience and other responsibilities are provided in the Directors’ Report on page 25 of the fi nancial statements.
The Board may from time to time establish committees it considers necessary / appropriate to assist in carrying out its duties.
The Board has established the following committees and adopted charters setting out matters relevant to the composition, responsibilities and administration of these: • Audit and Risk Committee (A&RC);• Nomination and Remuneration Committee (N&RC); and• Health, Safety, Environment and Quality Committee
(HSE&Q).
The current membership of the Board and its committees are as follows:
Director
Boa
rd
A&
RC
N&
RC
HS
E&
Q
John Robinson √ * √ * √ *
Brenden Mitchell √ √
Fiona Bennett √ √ * √
Howard Critchley √ √ √
Terrence Francis √ √ √
Terence Hebiton √ √
Brenden Mitchell √ √
* Denotes Chairman
These Committees do not in anyway diminish the overall responsibility of the Board for these functions.
In compliance with the Company’s Constitution, Fiona Rosalyn Vivienne Bennett and Terence Alexander Hebiton will retire from offi ce by rotation at the Annual General Meeting and being eligible, will stand for re-election at the Annual General Meeting.
In compliance with the Company’s Constitution, Howard John Critchley being eligible will stand for election at the Annual General Meeting.
corporate governance The Board reinforces the requirement for uncompromised corporate behaviour and accountability. In accordance with the ASX Corporate Governance guidelines and the Company’s commitment to best practice Corporate Governance:• The Board operates under a Code of Conduct which
follows the Principles as set out by the Australian Institute of Company Directors;
• There is a Charter for the Board that defi nes its responsibilities. This Charter is available on the Company’s corporate website;
• There is a regular assessment of the independence of each Director;
Corporate governance Corporate governance Corporate governance Corporate governance Corporate governance Corporate governance Corporate governance Corporate governance Corporate governance Corporate governance Corporate governance Corporate governance Corporate governance Corporate governance Corporate governance Corporate governance Corporate governance Corporate governance Corporate governance Corporate governance Corporate governance Corporate governance Corporate governance Corporate governance Corporate governance

15BOOM LOgistics AnnuAL RepORt 2013
• Potential confl icts of interest by Directors will be reported to the Board and if necessary, interested Directors will be excluded from discussion of the relevant matter and will not vote on that matter;
• Directors provide the Company with details of their shareholdings in the Company and any changes;
• Directors comply with the Company’s policies for Continuous Disclosure, Share Trading and its Code of Conduct;
• Directors have access, where necessary and at the cost of the Company, to independent, external and professional advice;
• Directors have ready access to the Company’s Senior Management for direct information on the Company’s affairs;
• Directors have the benefi t of Directors’ and Offi cers’ Insurance;
• Directors have the benefi t of an indemnity from the Company to the extent permitted by the Corporations Act as well as access to the Company’s Board papers on terms agreed between the Company and the Board;
• The Board sets the membership and terms of reference for each Board Committee; and
• Board Committees make recommendations to the Board. They are not delegated responsibility except as specifi cally authorised by the Board.
dIrectors’ sharehoLdIngs In the companyThere is no obligation under the Constitution for Directors to hold shares in the Company, although all Directors presently do. Details of Directors’ shareholdings are shown in the Directors’ Report on page 26 of the fi nancial statements.
Directors and Senior Management of the Company are restricted to buying or selling shares in the Company to the six week period commencing on the second business day after the announcement of the annual and half-yearly results or the Annual General Meeting in accordance with the Company’s Securities Trading Policy.
If a market announcement is made outside these periods which results in the market having the same price sensitive information as the Directors and Senior Management, then Directors and Senior Management may deal in Boom securities during the three week period commencing on the second business day after any such announcement.
Under the Securities Trading Policy, Directors are required to notify the Company Secretary or General Counsel within two days of each trade to enable the required disclosure to the ASX.
In accordance with the law, Directors and Senior Management are prohibited from buying or selling shares in the Company at any time when they are in possession of market sensitive information.
audIt & rIsk commItteeThe Audit & Risk Committee Charter is available on the Company’s corporate website.
The primary objectives of the Audit & Risk Committee are to assist the Board of Directors to discharge their obligations with respect to oversight of the:• Integrity and quality of interim and annual fi nancial
reporting and disclosures;• Monitoring the processes for identifi cation and
management of material business, fi nancial and regulatory risks;
• Compliance with relevant laws, regulations, standards and codes;
• Adequacy of the internal control framework; and• Integrity of the internal and external audit functions.
The Committee comprises three Non-Executive Directors. The external and internal audit partners, Managing Director, Chief Financial Offi cer and other management personnel attend these meetings by invitation.
The responsibilities of the Audit & Risk Committee set out within its Charter include:• Ensuring there are adequate policies in relation to material
business and fi nancial risk management, compliance and internal controls;
• Ensuring there is ongoing monitoring and assessment of the risk management, compliance and internal control systems;
• Monitoring the activities and effectiveness of the internal audit function;
• Overseeing and monitoring the integrity of fi nancial systems, processes and reporting;
• Reviewing draft annual and half-yearly fi nancial statements with management and external auditors and making recommendations to the full Board;

BOOM LOgistics AnnuAL RepORt 201316
• Reviewing and monitoring the Company’s compliance with law and ASX Listing Rules;
• Reviewing processes for promoting compliance with the Company’s Code of Conduct and Speaking Up Policy;
• Reviewing processes to manage related party transactions and potential confl icts of interest in line with the Company’s Related Party Transactions Policy;
• Reporting regularly to the Board on its activities and fi ndings;
• Making recommendations for the appointment or removal of the external and the internal auditors;
• Monitoring the ongoing independence of the external auditor; and
• Other responsibilities as required by the Board or considered appropriate.
The Company and Audit & Risk Committee policy is to appoint external auditors who clearly demonstrate quality and independence. The performance of the external auditor is reviewed annually. Applications for tender for external audit services may be requested from time to time as deemed appropriate, taking into consideration assessment of performance, existing value and tender costs.
In accordance with a recommendation by the Audit & Risk Committee, the Board sought and received Shareholder approval to appoint KPMG as the Company’s external auditor at the 2008 Annual General Meeting. As a result, a new audit engagement partner was introduced for the year ended 30 June 2009. The same engagement partner has presided over the external audit of the Company for the fi ve years ended 30 June 2013.
It is KPMG’s policy to rotate audit engagement partners on listed companies every fi ve years and in accordance with that policy, has made arrangements for a new partner to commence on the Boom external audit in the year ending 30 June 2014.
KPMG has declared its independence to the Board through its representations to the Committee and provision of its Statement of Independence to the Board, stating that they have maintained their independence in accordance with the provisions of APES 110 – Code of Ethics for Professional Accountants and the applicable provisions of the Corporations Act 2001.
Corporate governance (continued)
our Board of dIrectorsRodney John Robinson (69)BSc, MG Sc
Non-Executive Chairman
APPOINTED 15 NOVEMBER 2002
Brenden Clive Mitchell (54)B.Sc (Chem) B.Bus (Multidiscipline)
Managing Director
APPOINTED 1 MAY 2008
Fiona Rosalyn Vivienne Bennett (57)BA (Hons), FCA, FAICD, FAIM
Non-Executive Director
APPOINTED 29 MARCH 2010
Howard John Critchley (59)B. Comm, MBA, FAICD
Non-Executive Director
APPOINTED 7 MARCH 2013
Terrence Charles Francis (67)D Bus (hon. causa), B.E (Civil), MBA, FIE Aust, FAICD, F Fin
Non-Executive Director
APPOINTED 13 JANUARY 2005
Terence Alexander Hebiton (62)Non-Executive Director
APPOINTED 22 DECEMBER 2000

17BOOM LOgistics AnnuAL RepORt 2013
An analysis of fees paid to the external auditors, including a break-down of fees for non-audit services, is provided in the Directors’ Report and in note 33 to the fi nancial statements.
The external auditor attends the Annual General Meeting and is available to answer Shareholder questions about auditor independence, accounting policies adopted by the Company, the conduct of the audit and the preparation and content of the audit report.
The internal audit function is carried out by PricewaterhouseCoopers who have the expertise to provide independent, objective assurance to the Audit & Risk Committee. The internal audit function is independent of the external auditor and is aimed at the promotion of effi ciency, economy and effectiveness of management processes and systems of internal control.
The Audit and Risk Committee approves the scope of all internal audit activities to ensure it is appropriate in light of the key risks faced by Boom.
nomInatIon & remuneratIon commItteeThe Nomination & Remuneration Committee Charter is available on the Company’s corporate website.
The principle function of the Nomination & Remuneration Committee is to review and make recommendations to the Board of Directors on remuneration packages and policies applicable to Directors, Senior Executives and Company employees generally.
The Committee comprises three Non-Executive Directors. The responsibilities of the Nomination and Remuneration Committee set out within its charter include:• Assessing the necessary competencies of Board
members;• Establishing and reviewing the Board succession plans;• Evaluating the Board’s performance;• Considering and recommending to the full Board the
appointment and removal of Directors;• Reviewing and recommending the remuneration of Non-
Executive Directors, the Chief Executive Offi cer, and the Chief Executive’s direct reports;
• Reviewing and recommending remuneration policies applicable to Directors, Senior Executives and Company Employees generally;
• The annual review and consideration of the Chief Executive Offi cer’s remuneration structure; and
• Reviewing and recommending general remuneration principles, including incentive schemes, bonuses, and share plans that reward individual and team performance.
The Nomination & Remuneration Committee is responsible for the ongoing evaluation of the Board, its Committees and individual Directors and Executives.
The Executive Management team participates in the Company’s performance management and development process. This is a performance review program which has been designed to provide a link between the Company business plan, vision, values, and Employee’s performance. Executives are evaluated annually and their performance is compared against set standards and business objectives. The results of these reviews are considered when determining Executive remuneration.
Board effectiveness is monitored through the Chairman and by open discussion amongst members. External assistance is engaged to periodically provide structured evaluation of Board process and performance.
When a new Director is to be appointed, the Committee reviews the range of skills, experience and expertise on the Board, identifi es its needs and prepares a short-list of candidates with appropriate skills and experience.
Where necessary, advice is sought from independent search consultants. The full Board then appoints the most suitable candidate based on specifi ed selection and appointment criteria. Newly appointed Directors must submit themselves to Shareholders for election at the fi rst Annual General Meeting following their appointment.
New Directors are provided with a letter of appointment setting out the Company’s expectations including involvement with committee work, their responsibilities, remuneration, including superannuation and expenses, requirement to disclose their interests and any matters which affect the Director’s independence. New Directors are also provided with all relevant policies including the Company’s share trading policy, the code of conduct policy, a copy of the Company’s Constitution, organisational charts and details of indemnity and insurance arrangements.

BOOM LOgistics AnnuAL RepORt 201318
A formal induction program which covers the operation of the Board and its Committees and fi nancial, strategic, operations and risk management issues is also provided to ensure that Directors have signifi cant knowledge about the Company and the industry within which it operates.
New Directors are advised of the time commitment required of them in order to appropriately discharge their responsibilities as a Director of the Company. Directors are required to confi rm that they have suffi cient time to meet this requirement.
heaLth, safety, envIronment & quaLIty (“hse&q”) commItteeThe Health, Safety, Environment & Quality Charter is available on the Company’s corporate website.
The primary objective of the HSE&Q Committee is to assist the Board of Directors to discharge their responsibilities in respect of health, safety, environment and quality matters.
The HSE&Q Committee comprises at least two Non-Executive Directors and the Chief Executive Offi cer. The General Manager Health, Safety, Environment & Quality attends these meetings by invitation.
The responsibilities of the HSE&Q Committee set out within its charter include:• Reviewing the ongoing health and safety performance
of Boom and monitoring its effective health and safety management;
• Receiving and considering information relating to HSEQ matters including incident reports and independent HSEQ audit reports;
• Considering information relating to HSEQ hazards and risks within Boom;
• Considering the systems, processes and resources through which HSEQ hazards and risks are eliminated or controlled; and
• Considering information and recommendations provided by Management regarding strategic or signifi cant matters;
to enable the Committee to recommend the Board’s endorsement of the HSE&Q Strategy and Plan.
Corporate governance (continued)
our executIveBrenden Mitchell
Managing Director &Chief Executive Offi cer
Iona MacPherson
Chief Financial Offi cer& Company Secretary
Paul Martinez
Chief Information Offi cer & Director of Strategy
Rosanna Hammond
General Manager – Human Resources
Tony Spassopoulos
Director of Sales & Marketing
Terese Withington
General Manager – Boom Sherrin

19BOOM LOgistics AnnuAL RepORt 2013
IntegrIty and rIsk management processesThe CEO and CFO have provided written declarations to the Board that the Company’s fi nancial records have been properly maintained, and that the Company’s fi nancial statements and notes give a true and fair view and comply with accounting standards.
In addition, this declaration also confi rms that the fi nancial statements are founded on a sound system of risk management and internal control which is operating effectively in all material respects in relation to fi nancial reporting risks.
The Company has implemented a risk management framework and policy based on AS/NZS ISO 31000:2009 – Risk Management – Principles and Guidelines and the ASX Corporate Governance Principles and Recommendations. The framework is based around the following risk activities:• Risk Identifi cation: Identify all signifi cant foreseeable
risks associated with business activities in a timely and consistent manner;
• Risk Evaluation: Evaluate risks using an agreed risk assessment criteria;
• Risk Treatment/Mitigation: Develop mitigation plans for risk areas where the residual risk is greater than tolerable risk levels; and
• Risk Monitoring and Reporting: Report risk management activities and risk specifi c information to appropriate levels of management in a timely manner.
The Board, through the Audit & Risk Committee, reviews the Risk Management Policy and framework on a regular basis and satisfi es itself that Management has in place appropriate systems for managing risk and maintaining internal controls.
The CEO and Senior Management team are responsible for identifying, evaluating and monitoring risk in accordance with the risk management framework. Senior Management is responsible for the accuracy and validity of risk information reported to the Board and also for ensuring clear communication of the Board and Senior Management’s position on risk throughout the Company.
In particular, at the Executive Management and Business Unit Senior Management meetings held throughout the year, the
CEO and members of their Management team review and identify key business and fi nancial risks which could prevent the Company from achieving its objectives.
Additionally, a formal risk assessment process is part of each major capital acquisition with post acquisition reviews undertaken of major business acquisitions, major capital expenditures or signifi cant business initiatives.
envIronmentaL reguLatIonThe operations of the Company are subject to various environmental regulations under both Commonwealth and State legislation.
In making this report, the Directors note that the Company’s operations involve the discharge and storage of potentially hazardous materials such as fuels, oils and paints. Some of these activities require a licence, consent or approval from Commonwealth or State regulatory bodies. This regulation of the Company’s activities is typically of a general nature, applying to all persons carrying out such activities, and does not in the Directors’ view comprise particular and signifi cant environmental regulation.
Based upon enquiries within the Company, the Directors are not aware of any breaches of particular and signifi cant environmental regulation affecting the Company’s operations.
The Directors believe the environmental performance of the Company is sound and that the Company has appropriate systems in place for the management of its ongoing corporate environmental responsibilities.
code of conductThe Code of Conduct is available on the Company’s corporate website.
The Company has an established Code of Conduct, which provides Employees and Directors with a practical set of guiding principles to help them make decisions in their day to day work.
The Code embodies honesty, integrity, quality, trust and respect. Employees and Directors are required to demonstrate these behaviours and comply with the Code of Conduct whenever they are identifi ed as representatives of Boom.

BOOM LOgistics AnnuAL RepORt 201320
Corporate governance (continued)
Under the Code of Conduct:• The Company will act with fairness, integrity and good
faith in its dealings with its Employees, Customers, Subcontractors, Shareholders and other Stakeholders;
• The Company will strive for best practice in its internal business controls, fi nancial administration and accounting policies;
• Directors and Employees are bound by strict rules in the trading of Boom shares;
• The Company is committed to continuous improvement of workplace safety with the ultimate objective of no injuries to anyone at any time;
• The Company will continually develop its client relationships to provide outstanding service;
• The Company has, and will keep in place, employment practices and policies that accord with best practice including those in respect of health and safety, anti-discrimination and confl ict of interest;
• The Company recognises its place in the community and has in place policies and practices to protect the environment and to support selected community activities and projects in the areas in which it operates;
• The Company will be transparent in its reporting, including in respect of Board and Executive remuneration;
• The Company recognises its obligations to individuals’ rights to privacy in respect of confi dential information;
• The Company is committed to compliance with the law in all its operations;
• The Company will enforce and monitor compliance with the Code of Conduct through employment contracts, internal communication, education and performance management; and
• Directors, Employees, consultants and contractors engaged by the Company must act to ensure they maintain confi dentiality, protect Stakeholder rights and have an obligation to report and investigate unethical behaviour.
The Company manages communication and compliance in respect of the Code of Conduct through employment contracts and ongoing internal communication including internet, intranet, Employee education sessions, performance management, tool box meetings, orientation & induction programmes and the distribution of an Employee Handbook.
Adherence with the Code of Conduct is managed by Senior Management and Business Unit Managers across the business. Where non-compliance occurs, Employees are counselled and disciplined in accordance with the Code of Conduct policy and with reference to the nature and severity of the breach.
dIversIty at Boom LogIstIcsBoom’s Diversity Policy is available on the Company’s corporate website.
Boom is committed to seeking out and retaining the fi nest talent to ensure business growth and performance. We are committed to engaging the best people to do the best job possible. Our Code of Conduct confi rms the Company’s belief in treating all people with respect and recognises that our diversity and different skills make us strong.
Boom is committed to ensuring that composition of its Board and Committees is appropriate. The Board Charter clearly states it should comprise Directors with the appropriate mix of business expertise and experience.
At Boom, diversity includes differences that relate to gender, age, ethnicity, disability, and cultural background. We recognise that having a diverse and talented workforce is a key competitive advantage that differentiates our service in the marketplace and is a benefi t to the Company as a whole. Diversity also benefi ts individuals and teams and enables us to refl ect the diversity of our customers and the markets we operate in, all of which adds value to our operations and delivery of our strategy.
Gender diversity and inclusion is a key priority for Boom, and is refl ective of the revised ASX Corporate Governance Principles and Recommendations issued in June 2010. Boom is committed to building strong female representation at all levels in the organisation, including Senior Management.
Boom Logistics has established a Diversity Policy and a series of objectives to work towards that have been reviewed and approved by the Board. The CEO is accountable for implementing these requirements in accordance with Boom’s Diversity Policy.
Corporate governance (continued)Corporate governance (continued)Corporate governance (continued)Corporate governance (continued)Corporate governance (continued)Corporate governance (continued)Corporate governance (continued)Corporate governance (continued)Corporate governance (continued)Corporate governance (continued)Corporate governance (continued)Corporate governance (continued)Corporate governance (continued)Corporate governance (continued)Corporate governance (continued)Corporate governance (continued)Corporate governance (continued)Corporate governance (continued)Corporate governance (continued)Corporate governance (continued)Corporate governance (continued)Corporate governance (continued)Corporate governance (continued)Corporate governance (continued)

21BOOM LOgistics AnnuAL RepORt 2013
In order to effect a structured approach to managing diversity, Boom: • Has developed and implemented strategies, initiatives
and programs to promote the Diversity Principles outlined above in its management structures;
• Has set measurable objectives, or key performance indicators (KPIs), for the strategies, initiatives and programs to achieve Gender Diversity;
• Monitors, reviews and reports to the Board the Company’s progress under the Diversity Policy; and
• Reports on the status of Gender Diversity KPIs in this annual report.
The Company’s objectives are tabled below:
Area Objective
Board gender diversity
At least 15% of the Board Members desirably should be female with the appropriate skills and attributes.
Achieved at 30 June 2013 – 17%.
Senior Managers gender diversity
At least 20% of Senior Managers desirably should be female with the appropriate skills and attributes.
Senior Management is defi ned by the Company as direct reports to the Managing Director.
Achieved at 30 June 2013 – 25%.
Employee gender diversity
At least 10% of the Boom Logistics workforce desirably should be female with the appropriate skills and attributes.
Achieved at 30 June 2013 – 19%.
The objectives which have been set are reviewed annually to ensure that these initiatives remain relevant and appropriate.
As at 30 June, Boom’s performance with respect to meeting these requirements is as follows:
Female 30 June 2013
Male30 June 2013
Actual Objective Actual
Grand Total 19% 10% 81%
Directors 17% 15% 83%
Senior Managers 25% 20% 75%
Employee Group 19% 10% 81%
Female 30 June 2012
Male30 June 2012
Actual Objective Actual
Grand Total 13% 10% 87%
Directors 17% 15% 83%
Senior Managers 30% 20% 70%
Employee Group 13% 10% 87%
In addition to the objectives set, the Company has developed a number of initiatives to encourage diversity in the workplace. These initiatives include ensuring Human Resources Policies and Procedures are aligned to the Diversity Policy, recruitment processes encourage diversity, and education around diversity has been included in training programs rolled-out to Employees. Initiatives, including milestones, can be found on the Boom Logistics website.
Objectives, along with the implementation of the initiatives, are monitored by the Nomination & Remuneration Committee. The Chief Executive Offi cer and the General Manager Human Resources have primary responsibility for the successful execution of the Diversity Policy and the associated initiatives.

BOOM LOgistics AnnuAL RepORt 201322
Corporate governance (continued)Corporate governance (continued)Corporate governance (continued)Corporate governance (continued)Corporate governance (continued)Corporate governance (continued)Corporate governance (continued)Corporate governance (continued)Corporate governance (continued)Corporate governance (continued)Corporate governance (continued)Corporate governance (continued)Corporate governance (continued)Corporate governance (continued)Corporate governance (continued)Corporate governance (continued)Corporate governance (continued)Corporate governance (continued)Corporate governance (continued)Corporate governance (continued)Corporate governance (continued)Corporate governance (continued)Corporate governance (continued)Corporate governance (continued)Corporate governance (continued)
In support of our customers and the communities we work within, Boom has developed an Indigenous Employment Framework. This framework outlines the Company’s strategy of generating work opportunities and employment outcomes for Indigenous people and is designed to ensure that Boom’s approach is consistent, transparent and equitable.
The objectives set out in the Indigenous Employment Framework document represent broad, long-term outcomes for increasing the employment by Boom Logistics work units of local Indigenous people. Whilst achieving these objectives is a priority for the Company, it is important to recognise the challenges involved in developing employment opportunities for all Employees.
tImeLy and BaLanced dIscLosureBoom aims to be transparent with all Stakeholders, including its Shareholders. Easy access to Company information is an important objective of our communications strategy.
sharehoLder communIcatIon and contInuous dIscLosureBoom’s Market Disclosure & Communications Policy is available on the Company’s corporate website.
The Company aims to keep Shareholders informed of the Company’s performance and all major developments in an ongoing manner and encourages and promotes effective participation of Shareholders at General Meetings. Information is communicated to Shareholders through:• The Half Year Financial Report and the Full Year Financial
Report, results presentations, operational updates where appropriate, notice of meetings and explanatory materials which are published on the Company’s corporate website and distributed to Shareholders where nominated;
• The Annual General Meeting and any other formally convened Company meetings; and
• All other information released to the ASX is posted to the Company’s corporate website. The Company maintains a website to complement the offi cial release of information to the market which catalogues all communications dating back to the Company’s listing in 2003.
The Company is committed to ensuring that all stakeholders are provided with relevant and accurate information regarding its activities in a timely manner.
Boom has adopted a disclosure policy and internal reporting procedures which are designed to ensure that:• Any material price sensitive information is reported to the
CEO and CFO in a timely manner;• Information is disclosed in a timely manner and in
compliance with legal and regulatory obligations; and • All stakeholders have an equal opportunity to receive and
obtain externally available information issued by Boom.
Boom will immediately notify the market of any information related to its business which a reasonable person would expect to have a material effect on the price/value of its securities.
It should be noted that disclosure is not required where each of the following conditions is satisfi ed:• A reasonable person would not expect the information to
be disclosed; and• The information is confi dential; and• One or more of the following apply:
– the information concerns an incomplete proposal or negotiation;
– the information comprises matters of supposition or is insuffi ciently defi nite to warrant disclosure;
– the information is generated for the internal management purposes of the Company;
– the information is a trade secret; or– it would be a breach of a law to disclose the
information.
The CEO and CFO & Company Secretary have been nominated as the people responsible for communication with the Australian Securities Exchange (ASX). This role includes responsibility for ensuring compliance with the continuous disclosure requirements in the ASX Listing Rules and overseeing and co-ordinating information disclosure to the ASX, analysts, brokers, Shareholders, the media and the public.
All information disclosed to the ASX is posted on the Company’s corporate website as soon as it is disclosed to the ASX. When analysts are briefed following half year and full year results announcements, the material used in the presentations is released to the ASX prior to the commencement of the briefi ng. Procedures have also been established for reviewing whether any price sensitive information has been inadvertently disclosed and, if so, this information is also immediately released to the market.

23
Boom LogIstIcs LImItedA.B.N. 28 095 466 961
BOOM LOgistics AnnuAL RepORt 2013
annual fInanCIal RePoRT foR The yeaR enDeD 30 June 2013
Boom LogIstIcs LImItedA.B.N. 28 095 466 961
BOOM LOgistics AnnuAL RepORt 201324
Boom LogIstIcs LImItedA.B.N. 28 095 466 961
Note Description Page Directors’ Report 25 Auditor’s Independence Declaration 43 Consolidated Income Statement 45 Consolidated Statement of Comprehensive Income 46 Consolidated Statement of Financial Position 47 Consolidated Statement of Cash Flows 48 Consolidated Statement of Changes in Equity 491 Corporate Information 502 Basis of Preparation 503 Summary of Significant Accounting Policies 514 Financial Risk Management 625 Segment Reporting 646 Revenue and Expenses 667 Income Tax 678 Earnings Per Share 699 Dividends Paid and Proposed 7010 Cash and Cash Equivalents 7111 Trade and Other Receivables 7112 Inventories 7213 Prepayments and Other Current Assets 7214 Assets Classified as Held for Sale 7215 Plant and Equipment 7316 Intangible Assets 7617 Impairment Testing of Goodwill 7718 Trade and Other Payables 7719 Interest Bearing Loans and Borrowings 7820 Provisions 7921 Derivative Financial Instruments 8022 Other Liabilities 8123 Contributed Equity 8124 Retained Earnings 8225 Reserves 8226 Financial Instruments 8327 Commitments 8828 Contingencies 8929 Employee Benefits 8930 Key Management Personnel 9131 Related Party Disclosure 9432 Deed of Cross Guarantee 9533 Auditor’s Remuneration 9734 Events After Balance Sheet Date 9735 Parent Entity Financial Information 98 Directors’ Declaration 99 Independent Audit Report to Members of Boom Logistics Limited 100 ASX Additional Information 102
Table of ConTenTs

25
Boom LogIstIcs LImItedA.B.N. 28 095 466 961
BOOM LOgistics AnnuAL RepORt 2013
DIReCToRs’ RePoRT
Your Directors present their report on the consolidated entity (referred to hereafter as “the Group”) consisting of Boom Logistics Limited (“Boom Logistics” or “the Company”) and the entities it controlled for the financial year ended 30 June 2013.
dIrectors
The Directors of the Company at any time during or since the end of the financial year are:
Rodney John Robinson BSc, MGSc (Non-executive Chairman) (appointed 15 November 2002)Mr. Robinson was formerly Managing Director and CEO of Ashton Mining Limited. During the past three years, Mr. Robinson has held another ASX listed public company directorship and was Chairman of Global Mining Investments Limited (resigned 20 May 2013). Mr. Robinson is Chairman of the Boom Logistics Nomination & Remuneration Committee and the Health, Safety, Environment & Quality Committee.
Brenden Clive Mitchell B.Sc (Chem), B.Bus (Managing Director) (appointed 1 May 2008) Mr. Mitchell worked for over ten years leading multifaceted and multi-location businesses for Brambles in Australia and the UK. He has previous experience in the fast moving consumer goods sector and upon moving to Brambles, Mr. Mitchell held senior positions in the equipment hire and the high compliance waste industry. Mr. Mitchell’s last position for Brambles was leading the capital and people intensive municipal business in the UK with revenue of $550 million and 6,000 employees. During the past three years, Mr. Mitchell has not held any other ASX listed public company directorships.
Fiona Rosalyn Vivienne Bennett BA (Hons), FCA, FAICD, FAIM (Non-executive Director) (appointed 29 March 2010)Ms. Bennett is a Chartered Accountant with a strong finance and risk management background. She formerly held senior executive roles at BHP Billiton Limited and Coles Group Limited and was Chief Financial Officer at several organisations in the health sector. Ms. Bennett is Chairman of the Legal Services Board (Victoria), and a Director of Beach Energy Limited and Hills Holdings Limited. During the past three years, Ms. Bennett has held another ASX listed public company directorship with Hills Holdings Limited (appointed 31 May 2010) and Beach Energy Limited (appointed 23 November 2012). Ms. Bennett is Chairman of the Boom Logistics Audit and Risk Committee.
Howard John Critchley B.Comm, MBA, FAICD (Non-executive Director) (appointed 7 March 2013) Mr. Critchley has extensive experience in transport and logistics and was formerly Managing Director of TNT Logistics Australia, Asia and China, and later, Ceva Logistics South Pacific when TNT Logistics merged with Eagle Global Logistics to form Ceva Logistics. Mr. Critchley currently sits on the TVS Logistics Global Board, a privately owned Indian conglomerate. He also currently is a Non-executive Director of several not-for-profit organisations. During the past three years, Mr. Critchley has not held any other ASX listed public company directorships.
Dr. Huw Geraint Davies BSc (Hons), PhD (Geology) (Non-executive Director) (appointed 15 November 2002) (retired 23 October 2012) Dr. Davies was a Group Chief Executive and Director of BTR Nylex until his retirement in 1994. Since that time he has been involved in restructuring of manufacturing and service businesses and in the electricity and gas industries, together with distribution / trading project assignments in Asia. He has extensive experience as both an executive and non-executive director of public, private and government businesses. Prior to his retirement as a Director of Boom Logistics, he was the Administrator of the SECV and Chair of its Executive Committee. During the past three years, Dr. Davies has not held any other ASX listed public company directorships.
Terrence Charles Francis D Bus (hon. causa), B.E (Civil), MBA, FIE Aust, FAICD, F Fin (Non-executive Director) (appointed 13 January 2005) Mr. Francis is currently a Non-executive Director of the ANZ Specialist Asset Management Limited, and NBN Company Limited. He also advises business and government on governance and project development. Mr. Francis has extensive experience in resources and infrastructure development, and in finance as Vice President of Continental Illinois Bank, Executive Director of Deutsche Bank Australia, and Chief Executive Officer of Bank of America in Australia. During the past three years, Mr. Francis has not held any other ASX listed public company directorships.

BOOM LOgistics AnnuAL RepORt 201326
Boom LogIstIcs LImItedA.B.N. 28 095 466 961
DIReCToRs’ RePoRT (continued)
dIrectors (contInued)Terence Alexander Hebiton (Non-executive Director) (appointed 22 December 2000) Mr. Hebiton commenced his commercial career in the rural sector. In 1989, he acquired various business interests associated with land and property rental developments. In the late 1990s, Mr. Hebiton was Managing Director of Hazdon Holdings Pty Ltd. He is currently a director of a number of private companies and a director of Integrated Livestock Industries Ltd. He was a principal of Alpha Crane Hire, one of the founding entities of Boom Logistics. Mr. Hebiton was the CEO of Boom Logistics at its formation and ceased being an executive director in 2004. During the past three years, Mr. Hebiton has not held any other ASX listed public company directorships.
company secretary Iona MacPherson BA, CA (appointed 30 June 2007) Ms. MacPherson was appointed to the position of Chief Financial Officer and Company Secretary on 30 June 2007. She previously held the role of Chief Financial Officer and Company Secretary of Australian Air Express Pty Ltd for 4 years and prior to that worked with KPMG for 13 years and has been a Chartered Accountant for over 19 years.
dIrectors’ Interests In the shares and optIons of the company
As at the date of this report, the interests of the Directors in the shares of Boom Logistics Limited were:
Name Ordinary Shares
R.J. Robinson 830,000B.C. Mitchell 3,057,235F.R.V. Bennett 151,885H.J. Critchley 150,000T.C. Francis 185,745T.A. Hebiton 547,995
dIrectors meetIngs
The number of meetings of directors (including meetings of committees of directors) held during the year and the number of meetings attended by each director were as follows:
Name of director Board of DirectorsAudit & Risk Committee
Nomination and Remuneration
Committee
Health, Safety, Environment &
Quality Committee
Held Attended Held Attended Held Attended Held Attended
R.J. Robinson 11 11 - - 1 1 4 4B.C. Mitchell 11 11 - - - - 4 4F.R.V. Bennett 11 11 7 7 1 1 - -H.J. Critchley 1 4 2 3 2 1 1 - -H.G. Davies 2 3 3 2 2 - - - -T.C. Francis 11 11 7 7 - - 4 4T.A. Hebiton 11 10 - - - - 4 4
1 Attendance from date of appointment2 Attendance prior to retirement
corporate structureBoom Logistics is a company limited by shares that is incorporated and domiciled in Australia. Boom Logistics Limited has prepared a consolidated financial report incorporating the entities that it controlled during the financial year, which are listed in note 31 of the financial statements.

27
Boom LogIstIcs LImItedA.B.N. 28 095 466 961
BOOM LOgistics AnnuAL RepORt 2013
DIReCToRs’ RePoRT (continued)
IndemnIfIcatIon and Insurance
The Company has entered into Deeds of Access, Indemnity and Insurance with each of the Directors and the Company Secretary, under which the Company indemnifies, to the extent not precluded by law from doing so, those persons against any liability they incur in or arising out of discharging their duties. No indemnity has been granted to an auditor of the Group in their capacity as auditor.
During the financial year, the Company has paid an insurance premium for the benefit of the Directors and officers of the Company in accordance with common commercial practice. The insurance policy prohibits disclosure of the liability insured and the amount of the premium.
nature of operatIons and prIncIpaL actIvItIes
During the year, the principal activity of the Group was the provision of lifting solutions.
operatIng and fInancIaL revIew
Statutory resultThe Group reported a statutory net loss after tax for the year ended 30 June 2013 of $2.5 million (2012: net profit of $19.7 million). Earnings before interest expense and tax were a positive $7.1 million (2012: $37.2 million).
Trading resultThe trading profit after tax was $10.7 million compared to $18.5 million in FY2012 and $5.4 million in FY2011. Trading earnings before interest expense and tax were $26.0 million compared to $35.5 million in FY2012 and $23.2 million in FY2011.
The trading results in FY2013 exclude $11.0m of non-cash asset impairments, $6.8 million of restructuring costs and $1.1 million of other one-off costs (pre tax).
Business report
Key issues– The Group is adapting to changes in market conditions.– Significant operational restructuring and fleet review undertaken.– Strong future free cash flows underpinned by solid operating cash flow, substantially reduced capital expenditure and surplus
asset sales.– Priorities include refining the Group’s labour model to provide flexibility in responding to changed market conditions,
converting the strong sales pipeline and further cost reductions.– Capital management prioritises balance sheet deleveraging and a share buy back.
Changed market conditionsThe Group has responded to a substantial change in market conditions during FY2013.
Whilst iron ore, LNG and copper customer demand has been relatively strong, there has been a significant downturn in the coal and infrastructure sectors. Coal customers in Queensland and New South Wales reacted swiftly to changes in their economic situations. From October 2012, they reduced their maintenance spend dramatically and engaged in wholesale cost reduction programmes.
All major mining companies have been aggressively driving cost reductions which resulted in significant variability in activity and a general pushback on service rates across the sector. Activity in the construction and infrastructure sectors was generally very subdued with the exception of the LNG and iron ore sectors.
The pipeline of projects in the power and utility sectors continued to be subject to significant delays. These projects are serviced by our travel towers, and this area of the business has been impacted by these projects not proceeding as scheduled.
As a consequence of these factors, the Group was required to adapt its operating model to meet the changes in demand as customers dealt with their own economic issues.

BOOM LOgistics AnnuAL RepORt 201328
Boom LogIstIcs LImItedA.B.N. 28 095 466 961
DIReCToRs’ RePoRT (continued)
operatIng and fInancIaL revIew (contInued)
The Group’s response to the changed market conditions
Actions takenThe Group responded to the changes in market conditions with a programme of restructuring to adjust the Group’s cost base to match the new operating paradigm. This restructuring included redundancies of over 130 people and a detailed fleet review which identified surplus assets which will be sold:– the reduction of 130 people represents 12% of the Group’s workforce. Most of the redundancies were in New South Wales
and Queensland and included 38 overhead positions. The majority of the redundancies were undertaken in the second half of FY2013 and circa $12 million of annualised cost savings are expected.
– 66 surplus cranes were identified for disposal, predominantly older, smaller and less recognised models (refer impairments section below).
– a freeze has been placed on senior executive salaries in FY2014.
Actions underwayAs announced to the market in May 2013, the BHP Billiton iron ore port contract in Western Australia was lost through a competitive tender process and this contract ends at the end of August 2013. This contract has a dedicated fleet of 13 cranes and an operational team of 44 crane operators and 15 other employees which support it on a 24 hours a day, 7 days a week basis.
In FY2013, this contract delivered a circa 7% return on capital to the Group. Restructuring is already underway in North West Western Australia, with redeployment of assets having commenced and restructuring provisions taken up at 30 June 2013. The 13 cranes employed on the contract are a very good young fleet with low mileage because of the on-site nature of the port operation. The Group has plans to redeploy these assets and there have been no impairment charges associated with these 13 cranes. Redundancies will be effected accordingly and these have been provided for at 30 June 2013.
There is more restructuring planned by the Group to further reduce its cost base whilst maintaining existing levels of service to its customers:– Enterprise Bargaining Agreements are being re-negotiated to focus on productivity improvement and a more flexible labour
model.– Further redundancies have been undertaken in New South Wales and Boom Sherrin in July, the costs of which were
provided for at 30 June 2013. There is the potential for further redundancies driven by individual market conditions.– Overhead cost reduction initiatives have commenced with a focus on centralisation of selected support functions.
The Group is also redeploying underutilised assets to dry hire or wet hire opportunities including entering new regions such as Darwin and pursuing new opportunities in LNG such as Wheatstone in North West Western Australia.
The Group is selling the surplus assets identified through the restructuring process and the cash raised will support the Group’s objective of further deleveraging its balance sheet.
The Group’s market positionThe Group is well positioned to drive business improvement in response to market changes.
The Group has good industry sector, commodity and geographic diversity which helps to defray the impacts of the coal and infrastructure slowdown (predominantly on the East Coast).

29
Boom LogIstIcs LImItedA.B.N. 28 095 466 961
BOOM LOgistics AnnuAL RepORt 2013
DIReCToRs’ RePoRT (continued)
operatIng and fInancIaL revIew (contInued)
The Group’s market position (continued) The Group’s revenue is derived primarily from major customer maintenance contracts. Consequently, the Group is less reliant on new customer capital expenditure and expansion projects and is not exposed to exploration or new mine development. In addition, the Group has a strong capability to support customers who need to maintain production levels of existing facilities.
The Group’s new business pipeline continues to be strong, particularly in the areas of LNG, wind farms, energy and telecommunications projects and various resource opportunities in Western Australia and Queensland: – A new contract with CB&I and Kentz Joint Venture (CKJV) for the Gorgon LNG project was recently won to supply 13 cranes
and associated services valued at $3.6 million revenue.– Boom Sherrin has recently been awarded contracts on two significant high voltage transmission line construction projects
in Queensland and New South Wales. Currently these contracts are expected to deliver in excess of $4 million revenue in FY2014 with further opportunities for the Group in this sector.
– Crane Logistics has secured the contract to supply all terrain cranes and associated equipment for on site requirements to Leighton Contractors Pty Ltd at the Solomon Hub iron ore project in Western Australia. The contract with Leightons is expected to deliver $2 million over the next 18 months.
– The Group continues to service the wind farm maintenance sector and expects to benefit from a strong pipeline of construction projects scheduled to commence in 2014.
Asset impairmentsIn light of the changed market conditions and the recent restructuring activity, the Group has: – reviewed and assessed its fleet requirements;– reviewed and assessed the carrying value of its assets; and– identified a significant number of assets that have been made available for sale.
Based on this review, a non-cash asset impairment of $11.0 million has been recognised and included in the 30 June 2013 results. The major components of this impairment are set out in note 15 of the financial statements.
Crane impairmentThe Group has adopted a fleet management policy to:– invest in cranes from leading manufacturers that have a wide market acceptance, such as Liebherr, Manitowoc/Grove, Terex,
Kato and Tadano;– invest in standard and interchangeable cranes that can be moved between applications; and– avoid investment in less recognised brands, one-off, specialised, prototype or unusual model cranes.
This policy is consistent with ongoing restructuring activity designed to improve operating flexibility and asset utilisation. However, the Group’s acquisition of crane companies in the period from 2003 to 2007 means that the Group has carried a variety of crane brands in its fleet other than the leading brands noted above, as well as cranes that are one-off models or have been customised to perform site specific functions.
The Group has reviewed its fleet in detail to ensure that our equipment is consistent with the stated policy and reflects market demand. As a result of this review, 66 cranes were reflected in the assets held for sale account at 30 June 2013. The average age of these 66 cranes is 17.6 years. 36 of the 66 cranes have a lifting capacity of 20 tonnes or less.
An impairment of $5.6 million has been reflected in the Group’s result in respect of these cranes, which are targeted for sale in FY2014.

BOOM LOgistics AnnuAL RepORt 201330
Boom LogIstIcs LImItedA.B.N. 28 095 466 961
DIReCToRs’ RePoRT (continued)
operatIng and fInancIaL revIew (contInued)
Crane impairment (continued)15 of the 66 cranes to be sold account for $3.6 million or 64% of the $5.6 million impairment and these 15 cranes include the majority of the less recognised brands, one-off, specialised, prototype or unusual model cranes that have consequent narrow appeal in the used equipment market.
The average age of the Group’s remaining fleet of circa 400 cranes is 8.9 years.
Management is satisfied that all crane assets are appropriately stated on the Group’s balance sheet at 30 June 2013 having paid due regard to an assessment of cash flows to support carrying values, the useful life of assets and their residual values.
Boom Sherrin – non core access and general hire businessWhilst the restructuring and fleet review have contributed to the non-cash asset impairments noted above, $3.3 million of the impairment related to the non-core low end access & general equipment hire division of the Boom Sherrin business. The deterioration in the infrastructure sector means that the anticipated future cash flows from this division will not support the carrying value of the access equipment and its value has been impaired accordingly.
Transport fleetA $1.3 million impairment has been recognised in respect of the Group’s transport fleet that has been included in assets held for sale.
Asset backingAt 30 June 2013, after the non-cash impairments, the Group’s net tangible asset backing per share is $0.51 (2012: $0.52).
Assets held for saleFurther to the restructuring and fleet review, the Group’s assets held for sale at 30 June 2013 total $10.9 million and a further $2.4 million of assets are expected to become available for sale during FY2014. All assets held for sale are carried at their expected sales value. A net profit has been realised on surplus asset sales in each year over the past five years.
Fleet managementOver the last few years, the Group has invested significantly to ensure it has the right profile of assets to address market and customer requirements. In FY2013 the Group invested $62.3 million of cash in new equipment. This investment to improve the fleet mix, coupled with the detailed fleet review noted above, means the current fleet is now well balanced and adequate to meet current demand.
Capital management
DeleveragingOne of the Group’s priorities during FY2014 is to further deleverage its balance sheet to protect against any further market volatility.
With the reshaping of the fleet now complete, the Group anticipates substantially less capital expenditure will be required in the short to medium term. Given the lower capital expenditure requirement and the expected sale of assets in FY2014, the Group expects the generation of strong free cash flows to further deleverage the balance sheet.
The Group’s gearing at 30 June 2013 stands at 37% (31 December 2012: 39%; 30 June 2012: 36%).

31
Boom LogIstIcs LImItedA.B.N. 28 095 466 961
BOOM LOgistics AnnuAL RepORt 2013
DIReCToRs’ RePoRT (continued)
operatIng and fInancIaL revIew (contInued)
Capital management (continued)
Share buy backNo dividend has been declared for the FY2013 year.
During FY2014, the Group expects to initiate an on-market share buy back of up to 10% of the Company’s total share capital (circa 47 million shares). This buy back is proposed as part of the Group’s ongoing capital management strategy taking into consideration the strong operating cash flow position and continuing low share price compared to the Company’s net tangible asset backing of $0.51 at 30 June 2013.
Outlook and FY2014 priorities
Market conditions The Group expects the prevailing market conditions to continue with:– subdued and volatile demand expected in the mining sector;– infrastructure spending outside of LNG and iron ore to remain low through FY2014;– utilities demand in both telecommunications and energy expected to be solid through FY2014; and– increased activity in the wind farm sector.
The Group’s priorities and objectives for FY2014The Group has a number of key priorities and objectives for the FY2014:– continuing to refine the Group’s labour model to achieve greater flexibility;– focussing on major opportunities for growth in LNG, wind and resources, as well as driving opportunities in new projects and
markets;– further adapting the Group’s operations as customers in the coal sector transition to a new operating paradigm;– redeploying under-utilised assets to dry hire or wet hire opportunities across Australia;– overhead cost reduction through the centralisation of selected support functions. This is expected to deliver an annualised
saving of $2.0 million, $0.7 million of which is expected be realised in FY2014.– the sale of surplus assets to generate cash; and– given the cash to be generated from the sale of assets and the limited capital expenditure requirements in FY2014, the
Group will use free cash flow to further deleverage the balance sheet and to fund an expected on-market share buy back.
sIgnIfIcant changes In the state of affaIrs
RestructureDuring the financial year, several restructuring programs were undertaken throughout the Group. As at 30 June 2013, a headcount reduction of 130 had been completed at a cost of $3.026 million. The restructuring programs will continue into the first half of FY2014 with an estimated additional headcount reduction of 125 employees. The restructures were undertaken in response to the decline in overall operating conditions and have been managed to ensure that all revenue streams can be adequately and safely supported post restructure. The total restructuring costs incurred and provided for in the year were $6.753 million.
sIgnIfIcant events after the BaLance date
DividendOn 13 August 2013, the Directors of Boom Logistics Limited declared that no final dividend would be issued for the financial year ended 30 June 2013.

BOOM LOgistics AnnuAL RepORt 201332
Boom LogIstIcs LImItedA.B.N. 28 095 466 961
DIReCToRs’ RePoRT (continued)
LIkeLy deveLopments and expected resuLts
The Directors expect that the Group will improve its profitability as a result of the ongoing restructuring. Capital investment will be limited compared to prior years as the Group’s fleet has now been reshaped.
Directors are cognisant of the requirement to continuously disclose material matters to the market. At this time, other than matters addressed in this financial report there are no matters sufficiently advanced or at a level of certainty that would require disclosure.
envIronmentaL reguLatIon and performance
The Board confirms that the Group has adequate systems and processes in place to manage and comply with environmental regulations as they apply to the Group. This includes the National Greenhouse and Energy Reporting Act 2007 which requires the Group to report energy consumption and greenhouse gas emissions for the 12 months ended 30 June 2013 and future periods.
There have been no significant known breaches of any environmental regulations to which the Group is subject.
corporate governance
In recognising the need for the highest standards of corporate behaviour and accountability, the directors of Boom Logistics Limited have followed recommendations set by the ASX Corporate Governance Council. For further information on corporate governance policies adopted by Boom Logistics Limited, refer to our website: www.boomlogistics.com.au/corporate_governance.
remuneratIon report – audIted
This report outlines the remuneration arrangements in place for Directors and executives of Boom Logistics Limited and the Group.
Principles of Remuneration PracticesThe Group’s remuneration practices have been designed to maintain alignment with business strategy, shareholder interests and business performance whilst ensuring remuneration remains competitive.
Key management personnel (“KMP”) remuneration is reviewed annually by the Board of Directors with the assistance of the Nomination & Remuneration Committee.
In conducting the KMP remuneration review, the following principles are applied:– External competitiveness, using appropriate independent market survey data comparing the Group’s remuneration levels
against industry peers in terms of comparable job size and responsibility;– Internal equity, ensuring KMP remuneration across the Group is based upon a clear view of the scope of individual positions
and the respective responsibilities;– A meaningful “at risk” component with entitlement dependent on achieving group and individual performance targets set by
the Board of Directors and aligned to the Group’s strategy; and– Reward for performance represents a balance of annual and longer term targets.

33
Boom LogIstIcs LImItedA.B.N. 28 095 466 961
BOOM LOgistics AnnuAL RepORt 2013
DIReCToRs’ RePoRT (continued)
remuneratIon report – audIted (contInued)
Nomination and Remuneration CommitteeThe Group is committed to ensuring remuneration is both competitive and linked to the Group’s strategy. In doing so, the Board of Directors rely on the advice provided by the Nomination and Remuneration Committee including:– Reviewing and making recommendations with regard to remuneration policies applicable to the Directors, Executive KMPs
and employees generally;– Reviewing and making recommendations in relation to the remuneration of Directors and Executive KMPs;– Reviewing and recommending general remuneration principles, including incentive schemes, bonuses and share plans that
reward individual and team performance;– Reviewing and making recommendations to the Board of Directors with regard to termination policies and procedures for
Directors and Executive KMPs;– Reviewing and making recommendations in relation to the Group’s superannuation arrangements; and– Reviewing and approving the annual Remuneration Report and making recommendations to the Board of Directors for the
inclusion of the Remuneration Report in the Group’s annual report.
The Nomination and Remuneration Committee comprises of only independent non-executive Directors and is chaired by the Chairman of the Board of Directors. The Nomination and Remuneration Committee also draws upon advice and market survey data from external consultants in discharging its responsibilities (refer page 42).
Details of Key Management PersonnelThe tables below set out the Executive KMPs and non-executive Directors who are accountable for the strategy, direction, planning and control of the Group.
Key Management Personnel (Executives)
Name Title Period as a KMP
Brenden Mitchell Chief Executive Officer & Managing Director All of FY2013
Iona MacPherson Chief Financial Officer & Company Secretary All of FY2013
Rosanna Hammond General Manager – Human Resources All of FY2013
Paul Martinez Chief Information Officer and Director of Strategy All of FY2013
Tony Spassopoulos Director of Sales & Marketing All of FY2013
Terese Withington General Manager – Boom Sherrin All of FY2013
Key Management Personnel (Non-executive Directors)
Name Position
Committees
Audit & RiskNomination & Remuneration
Health, Safety, Environment & Quality
John Robinson Chairman Chairman Chairman
Fiona Bennett Non-executive Director Chairman Member
Howard Critchley * Non-executive Director Member Member
Huw Davies ** Non-executive Director Member Member
Terrence Francis Non-executive Director Member Member
Terence Hebiton Non-executive Director Member
* Howard Critchley was appointed on 7 March 2013 ** Huw Davies retired on 23 October 2012

BOOM LOgistics AnnuAL RepORt 201334
Boom LogIstIcs LImItedA.B.N. 28 095 466 961
DIReCToRs’ RePoRT (continued)
remuneratIon report – audIted (contInued)
Remuneration Arrangements of Executive Key Management Personnel Remuneration comprises of fixed remuneration (fixed annual reward) and variable or “at risk” remuneration incentives. Positions are evaluated using Hay Group (external independent remuneration specialist) job evaluation methodology. Fixed annual reward is benchmarked annually using the Hay Group remuneration data (refer page 42).
Performance measures set for individuals are specifically linked to the Group’s strategy and business performance. Scope exists to reward over budget financial performance through a sliding scale reward.
The Group targets fixed annual reward and total annual reward at the 50th percentile for all positions except business critical positions which target the 50th and 75th percentile.
The Group’s remuneration structure for the Executive KMPs remains unchanged from the previous year and comprises two main components:
Fixed annual reward (“FAR”) This element comprises base salary, any fringe benefits (e.g. motor vehicle allowance) and employer contributed superannuation. The individual FAR levels to be applied are established on an annual basis using external survey data provided by independent external consultants.
The survey data is drawn from the industrial sector of ASX listed enterprises and is provided on a comparable basis, taking account of the various factors that determine individual job scope and responsibility. The Group targets the market median for each position, projected ahead to the mid point of each year. The final determination of FAR for each executive, as a percentage of the market median, takes account of individual performance and experience in the position.
Executive KMPs have scope to vary the components that make up their FAR and can tailor their salary package to suit individual requirements.
Variable remunerationThis element of reward comprises various components determined by factors related to shareholder returns. The proportion of these “at risk” payments in the total remuneration structure is guided by market survey data provided by independent consultants. In this regard the Group targets typical reward structures as related to individual job scope and responsibility.
The Group has a number of variable remuneration arrangements as follows:
(a) Short term incentive plan (“STIP”)The short term reward is determined by the Group’s STIP. The objectives of this plan are to:– Focus Executive KMPs on key annual business goals and reinforce the link between performance and reward;– Allow scope to recognise exceptional performance through a sliding scale of reward;– Encourage teamwork as well as individual performance in meeting annual goals; and– Align reward with the Group’s values.
The STIP is applied following the completion and audit of the annual financial report and a review of individual performance against agreed targets set at the beginning of each financial year. Any payments made under the STIP will occur in the first half of the following financial year. No STIP payment is made should results fall short of targets. Individual performance measures are reset each year and are determined by the business drivers appropriate to each position.
35
Boom LogIstIcs LImItedA.B.N. 28 095 466 961
BOOM LOgistics AnnuAL RepORt 2013
DIReCToRs’ RePoRT (continued)
remuneratIon report – audIted (contInued)
Remuneration Arrangements of Executive Key Management Personnel (continued)
Variable remuneration (continued)(b) Long term incentive plan The Group’s LTIP was established to provide reward for consistent performance over a rolling three year period. The
current plan is based on the Group achieving a Return on Capital Employed (“ROCE”) of at least 1% greater than the pre tax investment Weighted Average Cost of Capital (“WACC”) at the end of a three year performance period.
ROCE is defined as Trading Earnings Before Interest Expense & Tax / Average Capital Employed less Goodwill. Trading Earnings Before Interest Expense & Tax is defined as “profit before financing expenses & income tax” less one off, non-recurring items. Average Capital Employed is calculated with reference to the opening and closing balances of the financial year for: “trade and other receivables”, “inventories”, “assets classified as held for sale”, “plant and equipment”, and “trade and other payables”.
The pre tax investment WACC is determined using the 10 year bond rate as the risk free rate and using data sourced independently to determine the average Beta in Boom Logistics Limited’s industry sector.
The level of reward available under the LTIP is determined on the basis of market survey data provided by independent consultants. The Group has adopted the policy of aligning the level of LTIP reward to average market practice and the quantum is determined by individual job scope and responsibility.
The annual value of the reward is converted into the Company’s shares at a price determined as the volume weighted average over the five business days preceding the grant date.
Vesting requires continued full time employment with the Group over the three year period and ROCE must be greater than the pre tax investment WACC by 1% or more at the end of the three year period.
The operation of the LTIP is conducted through an Employee Share Trust administered by an independent third party – Trinity Management Group Pty Ltd (“TMG”). TMG was paid $93,700 (2012: $85,537) for this service.
LTIP changes for FY2014 On consideration of market data provided by Hay Group, a review has been undertaken on the current Long Term
Incentive Plan to ensure the Plan balances the retention of executives, alignment to shareholder expectations comparability to current market practices. The scope of the review included the Plan structure and service conditions. The decision has been made to simplify the performance hurdle from ROCE greater than WACC by 1% to a hurdle of ROCE of 13%.
Good Leaver and Change of Control provisions have also been included in the LTIP structure.
(c) Other incentive plans Executive KMPs can receive additional incentive benefits in relation to the delivery of key projects critical to the Group’s
future performance as assessed by the Nomination and Remuneration Committee. Executive KMPs have also participated in the Group’s Executive Investment Trust (refer to Note 29(b)).

BOOM LOgistics AnnuAL RepORt 201336
Boom LogIstIcs LImItedA.B.N. 28 095 466 961
DIReCToRs’ RePoRT (continued)
remuneratIon report – audIted (contInued)
Remuneration Arrangements of Executive Key Management Personnel (continued)
Variable remuneration (continued)
The following table shows the annual remuneration packages for Executive KMPs during the year ending 30 June 2013.
Name Title
Fixed Variable
FAR STIP % of FAR LTIP % of FAR
Brenden Mitchell Chief Executive Officer & Managing Director 750,000 40% 45%
Iona MacPherson Chief Financial Officer & Company Secretary 430,000 30% 25%
Rosanna Hammond General Manager – Human Resources 245,000 20% 20%
Paul Martinez Chief Information Officer and Director of Strategy
425,500 30% 25%
Tony Spassopoulos Director of Sales & Marketing 360,500 30% 25%
Terese Withington General Manager – Boom Sherrin 365,000 30% 20%
The following table shows the composition of Executive KMPs aggregate remuneration.
Name Title
Fixed Variable
FAR STIP LTIP
Brenden Mitchell Chief Executive Officer & Managing Director 54% 40% 45%
Iona MacPherson Chief Financial Officer & Company Secretary 65% 30% 25%
Rosanna Hammond General Manager – Human Resources 71% 20% 20%
Paul Martinez Chief Information Officer and Director of Strategy 65% 30% 25%
Tony Spassopoulos Director of Sales & Marketing 65% 30% 25%
Terese Withington General Manager – Boom Sherrin 67% 30% 20%
Consequences of performance on shareholder wealth In considering the Group’s performance and benefits for shareholder wealth, the Nomination and Remuneration Committee have regard to the following indices in respect of the current financial year and the previous financial years.
2013 2012 2011 2010 2009
$’000 $’000 $’000 $’000 $’000
Net profit/(loss) attributable to members of Boom Logistics Limited
$(2,476) $19,705 $(37,748) $6,541 $(27,486)
Dividends paid $- $- $- $- $3,422
Share price at financial year end $0.09 $0.22 $0.30 $0.39 $0.28
Return on capital employed (as defined on the previous page under “Long Term Incentive Plan” section)
6.7% 9.6% 5.6% 2.6% 7.2%
Pre tax investment weighted average cost of capital (as defined on the previous page under “Long Term Incentive Plan” section)
13.6% 11.9% 12.3% 12.2% 13.9%

37
Boom LogIstIcs LImItedA.B.N. 28 095 466 961
BOOM LOgistics AnnuAL RepORt 2013
DIReCToRs’ RePoRT (continued)
remuneratIon report – audIted (contInued)
Remuneration ReviewThe review of KMPs and general staff remuneration is conducted annually through a formal process.
KMP remuneration is reviewed by the Nomination and Remuneration Committee of the Board of Directors with input from the CEO in respect of KMPs reporting directly to him. Market survey data provided by Hay Group is combined with individual performance appraisals to determine recommendations to go to the Board of Directors for approval. This process occurs in May/June of each year and remuneration adjustments take effect from the beginning of each financial year.
The Nomination and Remuneration Committee has direct responsibility for reviewing CEO performance against targets set by the Board of Directors and recommending to the Board of Directors appropriate adjustments to his remuneration package.
Staff reviews are similarly conducted by the relevant General Managers, with overview from the CEO.
CEO & Managing Director RemunerationMr Mitchell has an employment contract that has no fixed term. Both the Company and Mr Mitchell are entitled to terminate the employment contract on six month’s written notice, except in the case of serious misconduct or neglect of duty. Contractual arrangements relating to a redundancy event are set out below.
The Hay Group provides information that is used to determine the market position relating to the CEO & Managing Director role, comparing equivalent positions in comparative companies. The Company does not pay above market median for this position.
Mr Mitchell’s remuneration package as at 30 June 2013 comprised the following components:– Fixed annual reward of $750,000 per annum, inclusive of superannuation contributions in line with the Superannuation
Guarantee legislation. Mr Mitchell’s FAR is reviewed annually on 1 July each year taking into account the Group’s performance, industry and economic conditions and personal performance;
– Short term incentive plan equivalent to 40% of his FAR upon achievement of performance conditions set by the Board of Directors on an annual basis. The payment of any bonus under the STIP will take place after the annual audit of the Group’s accounts each year which typically occurs in the first half of the following financial year; and
– Long term incentive plan equivalent to 45% of his FAR allocated in shares of the Company with a three year vesting condition, but subject to shareholder approval at the Company’s Annual General Meeting.
If his employment is terminated on the grounds of redundancy or where a diminution in responsibility occurs, in addition to his notice period, he will be entitled to receive:– 12 months pay calculated in accordance with his fixed annual reward at the date of redundancy or diminution;– Long term incentive grants that have vested or qualify within annual vesting conditions, but have not satisfied the usual three
year vesting hurdle; and– Vested employee entitlements.
The STIP provides for a pro-rata payment of bonus on termination but subject to Board of Directors approval.
In the event that Mr Mitchell is summarily dismissed, he will be paid for the period served prior to dismissal and any accrued leave entitlements. Mr Mitchell would not be entitled to the payment of any bonus under the STIP or LTIP unless approved by the Board of Directors.
He is subject to restrictive covenants upon cessation of his employment for a maximum period of one year.
Other Executive KMPs (standard contracts)All other Executive KMPs have rolling contracts. Either the Company or the Executive KMP may terminate the Executive KMP’s employment agreement by providing 3 months written notice or providing payment in lieu of the notice period (based upon the fixed component of the Executive KMP’s remuneration). On termination by notice of the Company or the Executive KMPs, any LTIP shares that have vested or that will vest during the notice period will be awarded. LTIP shares that have not yet vested will be forfeited.
The Company may terminate the contract at any time without notice if serious misconduct has occurred. Where termination with cause occurs, the Executive KMP is only entitled to that proportion of remuneration that is fixed, and only up to the date of termination. On termination with cause, any unvested LTIP shares will be forfeited.

BOOM LOgistics AnnuAL RepORt 201338
Boom LogIstIcs LImItedA.B.N. 28 095 466 961
DIReCToRs’ RePoRT (continued)
remuneratIon report – audIted (contInued)
Total Remuneration of KMPsDetails of KMP’s remuneration for the year ended 30 June 2013 are as follows:
Short TermPost
Employment
Share-based
Payments Long Term Total
Cash salary
Cash bonus a
Non monetary benefits Other b
Super-annuation
Termination benefits Shares c
Long service leave
Total performance
related
Executives
Brenden Mitchell (Managing Director)
2013 655,533 245,904 11,054 37,129 25,000 - 18,126 21,177 1,013,923 26.0%
2012 442,988 81,000 11,054 232,120 50,000 - 86,202 14,079 917,443 18.2%
Iona MacPherson (Chief Financial Officer and Company Secretary)
2013 423,052 106,758 - - 25,000 - 5,806 13,592 574,208 19.6%
2012 330,523 47,088 - 32,000 26,702 - 27,564 9,666 473,543 15.8%
Rosanna Hammond (General Manager – Human Resources)
2013 202,950 35,368 - 25,571 23,413 - 2,570 6,685 296,557 12.8%
2012 182,081 17,004 - 23,440 19,783 - 11,944 4,383 258,635 11.2%
Paul Martinez (Chief Information Officer and Director of Strategy)
2013 396,792 102,840 - - 25,000 - 5,656 10,129 540,417 20.1%
2012 367,638 45,360 - - 36,542 - 26,905 8,235 484,680 14.9%
Tony Spassopoulos (Director of Sales & Marketing)
2013 329,826 88,965 - - 25,000 - 4,851 8,005 456,647 20.5%
2012 218,723 39,240 - 112,928 25,000 - 22,970 7,037 425,898 14.6%
Terese Withington (General Manager – Boom Sherrin)
2013 321,992 114,777 - 25,000 52,850 - 3,901 7,224 525,743 22.6%
2012 294,067 - - 25,000 41,816 - 18,376 5,013 384,272 4.8%
Total Remuneration: Executives
2013 2,330,145 694,612 11,054 87,700 176,262 - 40,910 66,812 3,407,495 -
2012 1,836,020 229,692 11,054 425,488 199,843 - 193,961 48,413 2,944,471 -
Total Remuneration: Non-Executive Directors and Executives – Group
2013 2,669,192 694,612 11,054 87,700 206,777 - 40,910 66,812 3,777,057 -
2012 2,196,020 229,692 11,054 425,488 232,243 - 193,961 48,413 3,336,871 -
Refer to note 30 for further details.
a Cash bonus is determined in accordance with the incentive plans outlined on pages 35 to 37 and 40. For Brenden Mitchell, Iona MacPherson, Paul Martinez and Tony Spassopoulos, their bonuses included an additional 9% of super paid out as bonuses as their company compulsory superannuation contribution have reached the concessional contributions cap limit of $25,000.
b Other represents motor vehicle allowance, novated lease payments and contributions to the Group’s Executive Investment Trust.
c Share-based payments represents ordinary shares in Boom Logistics Limited issued for nil consideration. For the purpose of this disclosure, the ordinary shares have been valued at fair value at the grant date being $0.305 per share (2012: $0.290 per share for all other executives and $0.300 per share for Mr. Mitchell). The share based payment vests over a 3 year period from grant date. Only the expense relating to the period has been recognised in accordance with accounting policy note 3(r).

39
Boom LogIstIcs LImItedA.B.N. 28 095 466 961
BOOM LOgistics AnnuAL RepORt 2013
remuneratIon report – audIted (contInued)
Determining the STIP Outcomes of the Executive KMPs for FY2012For the FY2012 STIP, the Nomination and Remuneration Committee conducted a review of the Executive KMPs performance against their set targets which resulted in the following STIP being paid to the Executive KMPs after approval by the Board of Directors.
In FY2012, the Company delivered a net profit after tax of $19.7 million and some STIP targets relating to financial, safety and individual performance objectives were achieved. The FY2012 STIP was paid in October 2012 after the Company’s Annual General Meeting.
Name Title
Maximum STIP
Weighting a Total Paid
$ % $
Brenden Mitchell Chief Executive Officer & Managing Director 282,000 80.0% 225,600
Iona MacPherson Chief Financial Officer & Company Secretary 122,429 80.0% 97,943
Rosanna Hammond General Manager – Human Resources 44,210 80.0% 35,368
Paul Martinez Chief Information Officer and Director of Strategy 117,936 80.0% 94,349
Tony Spassopoulos Director of Sales & Marketing 102,040 80.0% 81,632
Terese Withington General Manager – Boom Sherrin 102,024 112.5% b 114,777
a Weighting represents the percentage of total STIP entitlement awarded to Executive KMPs based on their financial, safety and individual performance targets.
b The STIP percentage awarded reflects the achievement of an over budget financial performance during FY2012 and the consequential application of the sliding scale reward system noted under Remuneration Arrangement above.
DIReCToRs’ RePoRT (continued)

BOOM LOgistics AnnuAL RepORt 201340
Boom LogIstIcs LImItedA.B.N. 28 095 466 961
remuneratIon report – audIted (contInued)
Determining the LTIP Outcomes of the Executive KMPsAs part of the Group’s Long Term Incentive Plan, the Company allocated shares to the Executive KMPs during the year as follows:
Name Year Grant dateGrant
numberVesting
date
Fair value per share at grant date *
Vesting benchmark
Maximum value of grant ^
Brenden Mitchell 2013 29 Oct 12 1,106,557 29 Oct 15 $0.305 RoCE > WACC by 1% $420,492
2012 4 Nov 11 1,057,500 5 Nov 14 $0.300 RoCE > WACC by 1% $401,850
2011 5 Nov 10 650,433 5 Nov 13 $0.450 RoCE > WACC by 1% $247,165
Iona MacPherson 2013 29 Oct 12 352,459 29 Oct 15 $0.305 RoCE > WACC by 1% $133,934
2012 4 Nov 11 349,397 5 Nov 14 $0.292 RoCE > WACC by 1% $132,771
2011 5 Nov 10 210,064 5 Nov 13 $0.450 RoCE > WACC by 1% $79,824
Rosanna Hammond 2013 29 Oct 12 160,656 29 Oct 15 $0.305 RoCE > WACC by 1% $61,049
2012 4 Nov 11 151,405 5 Nov 14 $0.292 RoCE > WACC by 1% $57,534
2011 5 Nov 10 91,028 5 Nov 13 $0.450 RoCE > WACC by 1% $34,591
Paul Martinez 2013 29 Oct 12 348,770 29 Oct 15 $0.305 RoCE > WACC by 1% $132,533
2012 4 Nov 11 336,575 5 Nov 14 $0.292 RoCE > WACC by 1% $127,899
2011 5 Nov 10 202,355 5 Nov 13 $0.450 RoCE > WACC by 1% $76,895
Tony Spassopoulos 2013 29 Oct 12 295,492 29 Oct 15 $0.305 RoCE > WACC by 1% $112,287
2012 4 Nov 11 291,165 5 Nov 14 $0.292 RoCE > WACC by 1% $110,643
2011 5 Nov 10 175,054 5 Nov 13 $0.450 RoCE > WACC by 1% $66,521
Terese Withington 2013 29 Oct 12 239,344 29 Oct 15 $0.305 RoCE > WACC by 1% $90,951
2012 4 Nov 11 232,931 5 Nov 14 $0.292 RoCE > WACC by 1% $88,514
2011 5 Nov 10 140,043 5 Nov 13 $0.450 RoCE > WACC by 1% $53,216
* The fair values per share were assessed as the 5 day volume weighted average market price at the grant dates.
^ The maximum value of grants has been estimated based on a 52 week high in FY2013 of $0.38 per share. The minimum total value of each grant, if the applicable performance conditions are not met is nil.
The FY2010 shares allocated to the Executive KMPs did not vest as the vesting conditions were not met. In accordance with the LTIP rules, the FY2010 shares were forfeited as follows:
Name Year Grant dateGrant
numberVesting
date
Fair value per share at grant date
Vesting benchmark
Maximum value of grant in FY2012
Brenden Mitchell 2010 4 Dec 09 705,556 4 Dec 12 $0.390 RoCE > WACC by 1% $239,889
Iona MacPherson 2010 4 Dec 09 222,222 4 Dec 12 $0.390 RoCE > WACC by 1% $75,555
Rosanna Hammond 2010 4 Dec 09 96,296 4 Dec 12 $0.390 RoCE > WACC by 1% $32,741
Paul Martinez 2010 4 Dec 09 222,222 4 Dec 12 $0.390 RoCE > WACC by 1% $75,555
Tony Spassopoulos 2010 4 Dec 09 185,186 4 Dec 12 $0.390 RoCE > WACC by 1% $62,963
Terese Withington 2010 4 Dec 09 148,148 4 Dec 12 $0.390 RoCE > WACC by 1% $50,370
DIReCToRs’ RePoRT (continued)

41
Boom LogIstIcs LImItedA.B.N. 28 095 466 961
BOOM LOgistics AnnuAL RepORt 2013
DIReCToRs’ RePoRT (continued)
remuneratIon report – audIted (contInued)
Non-executive Director feesNon-executive Director fees are determined by reference to external survey data, taking account of the Group’s relative size and business complexity. No additional payments are made for serving on Board Committees. In addition, non-executive Directors have no entitlement to STIP, no equity incentives are offered and no retirement benefits are payable. The maximum aggregate sum for non-executive Director remuneration of $400,000 was approved by shareholders at the 2004 Annual General Meeting. There has been no increase to Director fees since 2007.
Details of non-executive Directors’ remuneration for the year ended 30 June 2013 are as follows:
Short TermPost
Employment
Share-based
Payments Long Term Total
Salary & fees Cash bonus
Non monetary benefits Other
Super-annuation Shares
Long service leave
Total performance
related
Non-Executive Directors
John Robinson
2013 120,000 - - - 10,800 - - 130,800 -
2012 120,000 - - - 10,800 - - 130,800 -
Fiona Bennett
2013 60,000 - - - 5,400 - - 65,400 -
2012 60,000 - - - 5,400 - - 65,400 -
Howard Critchley
2013 19,048 - - - 1,714 - - 20,762 -
Dr. Huw Davies
2013 20,000 - - - 1,800 - - 21,800 -
2012 60,000 - - - 5,400 - - 65,400 -
Terrence Francis
2013 60,000 - - - 5,400 - - 65,400 -
2012 60,000 - - - 5,400 - - 65,400 -
Terence Hebiton
2013 60,000 - - - 5,400 - - 65,400 -
2012 60,000 - - - 5,400 - - 65,400 -
Total Remuneration: Non-Executive Directors
2013 339,048 - - - 30,514 - - 369,562 -
2012 360,000 - - - 32,400 - - 392,400 -
BOOM LOgistics AnnuAL RepORt 201342
Boom LogIstIcs LImItedA.B.N. 28 095 466 961
remuneratIon report – audIted (contInued)
InsuranceAmounts disclosed for remuneration of Directors and KMPs exclude insurance premiums paid by the Company in respect of directors’ and officers’ liability insurance. The premium has not been allocated to the individuals covered by the insurance policy as, based on all available information, the Directors believe that no reasonable basis for such allocation exists.
Remuneration report approval at FY2012 Annual General MeetingThe 30 June 2012 remuneration report received positive shareholder support at the FY2012 Annual General Meeting with a vote of 95% in favour.
Use of Remuneration ConsultantsThe Nomination and Remuneration Committee engages Hay Group as an independent external remuneration specialist to the Board of Directors to evaluate and benchmark the remuneration of Executive KMPs. Hay Group was paid $8,294 (2012: $8,310) for the evaluation and benchmarking of Executive KMP’s remuneration for the current financial year. Hay Group evaluations and benchmarking data is provided to the Nomination and Remuneration Committee and is free from undue influence by members of the Group’s Executive KMP.
The following arrangements were made to ensure that the remuneration recommendations were free from undue influence:– Hay Group was engaged by, and reported directly to, the chair of the Nomination and Remuneration Committee. The
agreement for the provision of remuneration consulting services was executed by the chair of the Nomination and Remuneration Committee under delegated authority on behalf of the Board of Directors;
– The report containing Hay Group’s evaluation was provided directly to the Chairman of the Nomination and Remuneration Committee;
– Hay Group’s benchmarking data is obtained directly from Hay Group and is used by the Nomination and Remuneration Committee to evaluate Executive KMP remuneration; and
– Hay Group was permitted to speak to the Executive KMPs throughout the engagement. However, Hay Group was not permitted to provide any Executive KMPs with a copy of their draft or final report that contained their evaluations.
As a consequence, the Board of Directors is satisfied that the recommendations were made free from undue influence from any members of the Executive KMP.
In addition to evaluating Executive KMP’s remuneration, Hay Group also provided benchmarking data through their remuneration database on a subscription basis. Hay Group was paid a total of $14,520 (2012: $9,600) for providing this service.
DIReCToRs’ RePoRT (continued)

43
Boom LogIstIcs LImItedA.B.N. 28 095 466 961
BOOM LOgistics AnnuAL RepORt 2013
DIReCToRs’ RePoRT (continued)
audItor’s Independence decLaratIon to the dIrectors
The auditor’s independence declaration is set out on page 44 and forms part of the directors’ report for the financial year ended 30 June 2013.
non-audIt servIces
The following non-audit services were provided by KPMG, the Company’s auditor. The Directors are satisfied that the provision of non-audit services is compatible with the general standard of independence for auditors imposed by the Corporations Act 2001. The nature and scope of each type of non-audit service provided means that auditor independence was not compromised.
KPMG received or are due to receive the following amounts for the provision of non-audit services:
Tax services $33,270
Due diligence and other services $18,161
Total remuneration for non-audit services $51,431
proceedIngs on the BehaLf of the company
No person has applied to the Court under section 237 of the Corporations Act 2001 for leave to bring proceedings on behalf of the Company, or to intervene in any proceedings to which the Company is a party, for the purpose of taking responsibility on behalf of the Company for all or part of those proceedings.
No proceedings have been brought or intervened in on behalf of the Company with leave of the Court under section 237 of the Corporations Act 2001.
roundIng
The amounts contained in this report and in the financial report are presented in Australian dollars and have been rounded to the nearest $1,000 (where rounding is applicable) under the option available under ASIC Class Order 98/100. The Group is of a kind to which the Class Order applies.
Signed in accordance with a resolution of the directors.
John Robinson Brenden MitchellChairman Managing Director
Melbourne, 13 August 2013

BOOM LOgistics AnnuAL RepORt 201344
Boom LogIstIcs LImItedA.B.N. 28 095 466 961

45
Boom LogIstIcs LImItedA.B.N. 28 095 466 961
BOOM LOgistics AnnuAL RepORt 2013
ConsolIDaTeD InCome sTaTemenT Year Ended 30 June 2013
Note 2013 2012
$’000 $’000
Revenue 6 338,387 352,141
Salaries and employee benefits expense (161,880) (157,119)Equipment service and supplies expense 6(c) (87,782) (93,924)Operating lease expense (12,240) (11,572)Other expenses (21,452) (22,516)Restructuring expense 20 (6,753) (1,173)Depreciation and amortisation expense 6(c) (30,137) (28,640)Impairment expense 6(c) (11,015) -
Profit before financing expenses and income tax 7,128 37,197
Financing expenses 6(c) (10,557) (11,171)
(Loss)/profit before income tax (3,429) 26,026
Income tax benefit/(expense) 7(a) 953 (6,321)
Net (loss)/profit attributable to members of Boom Logistics Limited (2,476) 19,705
Basic (loss)/earnings per share (cents per share) 8 (0.5) 4.2
Diluted (loss)/earnings per share (cents per share) 8 (0.5) 4.2
Franked dividends per share (cents per share) 9 - -
The accompanying notes form an integral part of the Consolidated Income Statement.
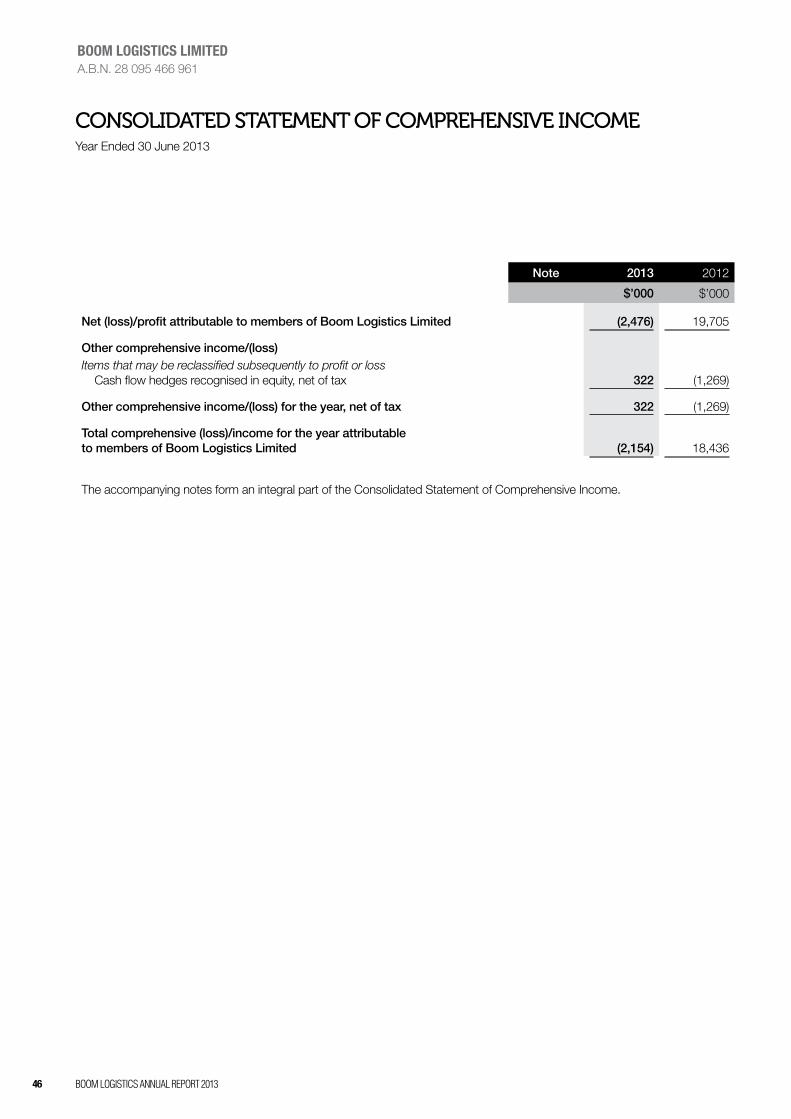
BOOM LOgistics AnnuAL RepORt 201346
Boom LogIstIcs LImItedA.B.N. 28 095 466 961
Note 2013 2012
$’000 $’000
Net (loss)/profit attributable to members of Boom Logistics Limited (2,476) 19,705
Other comprehensive income/(loss)Items that may be reclassified subsequently to profit or loss Cash flow hedges recognised in equity, net of tax 322 (1,269)
Other comprehensive income/(loss) for the year, net of tax 322 (1,269)
Total comprehensive (loss)/income for the year attributable to members of Boom Logistics Limited (2,154) 18,436
The accompanying notes form an integral part of the Consolidated Statement of Comprehensive Income.
ConsolIDaTeD sTaTemenT of ComPRehensIve InComeYear Ended 30 June 2013

47
Boom LogIstIcs LImItedA.B.N. 28 095 466 961
BOOM LOgistics AnnuAL RepORt 2013
Note 2013 2012
$’000 $’000
CURRENT ASSETSCash and cash equivalents 10(a) 3,572 10,102 Trade and other receivables 11 55,440 69,948 Inventories 12 507 313 Prepayments and other current assets 13 2,843 3,530 Assets classified as held for sale 14 10,899 4,603 Income tax receivable 7(c) 4,450 8,030
TOTAL CURRENT ASSETS 77,711 96,526
NON-CURRENT ASSETSPlant and equipment 15 336,678 342,290 Intangible assets 16(b) 74,636 74,215
TOTAL NON-CURRENT ASSETS 411,314 416,505
TOTAL ASSETS 489,025 513,031
CURRENT LIABILITIESTrade and other payables 18 20,390 36,847 Interest bearing loans and borrowings 19 - 16,670 Provisions 20 15,404 13,092 Derivative financial instruments 21 332 870 Other liabilities 22 5,741 4,295
TOTAL CURRENT LIABILITIES 41,867 71,774
NON-CURRENT LIABILITIESInterest bearing loans and borrowings 19 119,398 107,186 Provisions 20 1,778 947 Derivative financial instruments 21 1,019 1,513 Deferred tax liabilities 7(b) 11,649 15,872
TOTAL NON-CURRENT LIABILITIES 133,844 125,518
TOTAL LIABILITIES 175,711 197,292
NET ASSETS 313,314 315,739
EQUITYContributed equity 23 318,065 318,065 Retained (losses) 24 (4,146) (1,670)Reserves 25 (605) (656)
TOTAL EQUITY 313,314 315,739
The accompanying notes form an integral part of the Consolidated Statement of Financial Position.
ConsolIDaTeD sTaTemenT of fInanCIal PosITIonAs at 30 June 2013
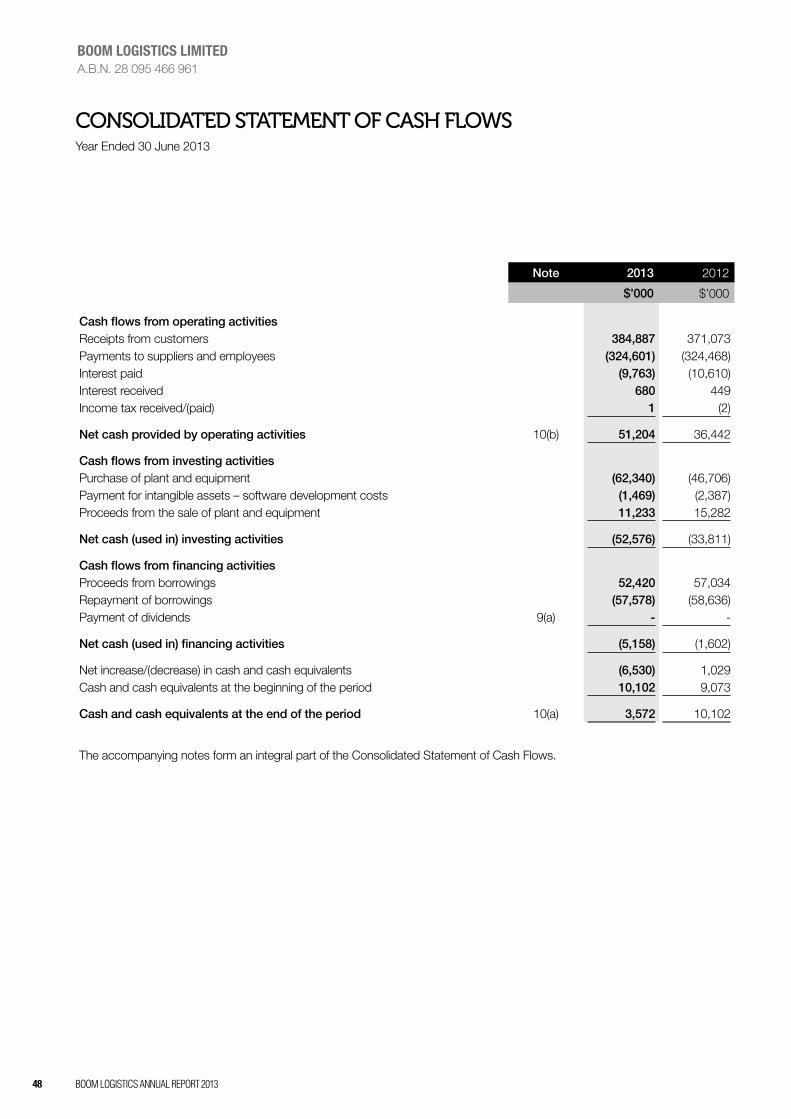
BOOM LOgistics AnnuAL RepORt 201348
Boom LogIstIcs LImItedA.B.N. 28 095 466 961
Note 2013 2012
$’000 $’000
Cash flows from operating activitiesReceipts from customers 384,887 371,073 Payments to suppliers and employees (324,601) (324,468)Interest paid (9,763) (10,610)Interest received 680 449 Income tax received/(paid) 1 (2)
Net cash provided by operating activities 10(b) 51,204 36,442
Cash flows from investing activitiesPurchase of plant and equipment (62,340) (46,706)Payment for intangible assets – software development costs (1,469) (2,387)Proceeds from the sale of plant and equipment 11,233 15,282
Net cash (used in) investing activities (52,576) (33,811)
Cash flows from financing activitiesProceeds from borrowings 52,420 57,034 Repayment of borrowings (57,578) (58,636)Payment of dividends 9(a) - -
Net cash (used in) financing activities (5,158) (1,602)
Net increase/(decrease) in cash and cash equivalents (6,530) 1,029 Cash and cash equivalents at the beginning of the period 10,102 9,073
Cash and cash equivalents at the end of the period 10(a) 3,572 10,102
The accompanying notes form an integral part of the Consolidated Statement of Cash Flows.
ConsolIDaTeD sTaTemenT of Cash flowsYear Ended 30 June 2013

49
Boom LogIstIcs LImItedA.B.N. 28 095 466 961
BOOM LOgistics AnnuAL RepORt 2013
NoteIssuedCapital
RetainedEarnings
Cash FlowHedge
Reserve
EmployeeEquity
BenefitsReserve
TotalEquity
$’000 $’000 $’000 $’000 $’000
At 1 July 2011 318,065 (21,375) - 741 297,431
Profit for the year - 19,705 - - 19,705 Other comprehensive loss - - (1,269) - (1,269)
Total comprehensive income - 19,705 (1,269) - 18,436
Transactions with owners in their capacity as owners:Cost of share based payments 25 - - - (128) (128)
At 30 June 2012 318,065 (1,670) (1,269) 613 315,739
Loss for the year - (2,476) - - (2,476)Other comprehensive income - - 322 - 322
Total comprehensive loss - (2,476) 322 - (2,154)
Transactions with owners in their capacity as owners:Cost of share based payments 25 - - - (271) (271)
At 30 June 2013 318,065 (4,146) (947) 342 313,314
The accompanying notes form an integral part of the Consolidated Statement of Changes in Equity.
ConsolIDaTeD sTaTemenT of Changes In equITyYear Ended 30 June 2013

BOOM LOgistics AnnuAL RepORt 201350
Boom LogIstIcs LImItedA.B.N. 28 095 466 961
noTes To The ConsolIDaTeD fInanCIal sTaTemenTsYear Ended 30 June 2013
1. corporate InformatIon
The financial report of Boom Logistics Limited and its subsidiaries (“the Group”) for the year ended 30 June 2013 was authorised for issue in accordance with a resolution of the directors on 13 August 2013.
Boom Logistics Limited is a company domiciled in Australia and limited by shares incorporated in Australia whose shares are publicly traded on the Australian Stock Exchange.
The Group is a for profit entity and the nature of its operations and principal activities are described in note 5.
2. BasIs of preparatIon
(a) Statement of compliance The financial report is a general purpose financial report which has been prepared in accordance with Australian Accounting Standards (AASBs) adopted by the Australian Accounting Standards Board (AASB) and the Corporations Act 2001. The consolidated financial report complies with International Financial Reporting Standards (IFRSs) and interpretations adopted by the International Accounting Standards Board (IASB).
(b) Historical cost conventionThe financial report has been prepared in accordance with the historical cost convention rounded to the nearest thousand dollars ($’000) in accordance with ASIC Class Order 98/100 unless otherwise stated, except for derivative financial instruments and assets classified as held for sale which are measured at fair value. The financial report is presented in Australian dollars which is the Company’s functional currency.
(c) Critical accounting estimatesThe preparation of financial statements requires the use of certain critical accounting estimates. It also requires management to exercise its judgement in the process of applying the Group’s accounting policies. Estimates and underlying assumptions are reviewed on an ongoing basis. Revisions to accounting estimates are recognised in the period in which the estimates are revised and in any future periods affected. The areas involving a higher degree of judgement or complexity, or areas where assumptions and estimates are significant to the financial statements, are disclosed in the following notes:
Impairment testing of goodwillThe Group tests annually whether goodwill has suffered any impairment, in accordance with the accounting policy stated in note 3(l). The recoverable amounts of cash-generating units have been determined based on value-in-use calculations. These calculations require the use of assumptions. Refer to note 17 for details of these assumptions.
Impairment testing of plant and equipment including assets classified as held for saleThe Group tests annually whether plant and equipment has suffered any impairment, in accordance with the accounting policy stated in note 3(m). The recoverable amounts of plant and equipment have been determined based on their value in use. These calculations require the use of assumptions. Refer to note 15 for details of these assumptions.
Useful lives and residual values of plant and equipmentThe Group determines the estimated useful lives of assets and related depreciation charges for its plant and equipment based on the accounting policy stated in note 3(j). These estimates are based on projected capital equipment lifecycles for periods up to twenty years based on useful life assumptions.
Residual values are determined based on the value the Group would derive upon ultimate disposal of the individual piece of plant and equipment at the end of its useful life. The achievement of these residual values is dependent upon and could be impacted as a result of the industrial cycle.

51
Boom LogIstIcs LImItedA.B.N. 28 095 466 961
BOOM LOgistics AnnuAL RepORt 2013
noTes To The ConsolIDaTeD fInanCIal sTaTemenTs (continued)Year Ended 30 June 2013
2. BasIs of preparatIon (contInued)
(c) Critical accounting estimates (continued)
Useful lives and residual values of plant and equipment (continued)Management will increase the depreciation charge where useful lives are less than previously estimated lives or there is evidence that residual values can not be achieved.
Tax balancesJudgement and estimation is required over the calculation and recognition of current and deferred tax balances. There are many transactions and calculations undertaken during the ordinary course of business for which the ultimate tax determination is uncertain. The Group estimates its tax liabilities based on the Group’s understanding of the tax law. Where the final tax outcome of these matters is different from the amounts that were initially recorded, such differences will impact the current and deferred income tax assets, liabilities and expense/benefit in the period in which such determination is made.
Deferred tax assets are recognised for deductible temporary differences and unused tax losses only if it is probable that future taxable profits will be available to utilise those temporary differences and losses, and the losses continue to be available having regard to their nature and timing of origination. Utilisation of tax losses also depends on the ability of the Group to satisfy certain tests at the time the losses are recouped.
(d) Changes in accounting policiesThe principal accounting policies adopted in the preparation of the financial report are set out in note 3. These policies are consistent with those of the previous financial year.
The Group has not elected to early adopt any accounting standards or amendments (refer to note 3(y)).
3. summary of sIgnIfIcant accountIng poLIcIes
The accounting policies set out below have been applied consistently to all periods presented in these consolidated financial statements, and have been applied consistently by Group entities. Certain comparative amounts in the consolidated financial statements have been reclassified to conform with current year’s presentation.
(a) Basis of consolidation
SubsidiariesThe consolidated financial statements comprise the financial statements of Boom Logistics Limited and its subsidiaries as at 30 June each year. The financial statements of subsidiaries are prepared for the same reporting period as the parent company, using consistent accounting policies.
Subsidiaries are entities controlled by the Group. Control exists when the Group has the power to govern the financial and operating policies of an entity so as to obtain benefits from its activities. The financial statements of subsidiaries are included in the consolidated financial statements from the date that control commences until the date that control ceases. The accounting policies of subsidiaries have been changed when necessary to align them with the policies adopted by the Group.
In the parent company financial statements (refer to note 35), investments in subsidiaries are carried at cost.
The acquisition method of accounting is used to account for the acquisition of subsidiaries by the Group.
Intra-group balances, and any unrealised income and expenses arising from intra-group transactions, are eliminated in preparing the consolidated financial statements.

BOOM LOgistics AnnuAL RepORt 201352
Boom LogIstIcs LImItedA.B.N. 28 095 466 961
3. summary of sIgnIfIcant accountIng poLIcIes (contInued)
(b) Revenue recognitionRevenue is recognised to the extent that it is probable that the economic benefits will flow to the Group and the revenue can be reliably measured. The following specific recognition criteria must also be met before revenue is recognised:
Rendering of servicesRevenue from the hire of lifting/access equipment and other services provided is recognised where the right to be compensated for the services can be reliably measured.
Interest revenueInterest revenue is recognised on a time proportionate basis using the effective interest method.
(c) Borrowing costsBorrowing costs directly attributable to the acquisition, construction or production of a qualifying asset (ie. an asset that necessarily takes a substantial period of time to get ready for its intended use or sale) are capitalised as part of the cost of that asset. All other borrowing costs are recognised in the income statement using the effective interest rate method.
Borrowing costs consist of interest and other costs that an entity incurs in connection with the borrowing of funds.
(d) LeasesFinance leases, which transfer to the Group substantially all the risks and benefits incidental to ownership of the leased item, are capitalised at the inception of the lease at the fair value of the leased property or, if lower, at the present value of the minimum lease payments.
Lease payments are apportioned between the finance charges and reduction of the lease liability so as to achieve a constant rate of interest on the remaining balance of the liability. Finance charges are recognised as an expense in the income statement.
Capitalised leased assets are depreciated over the shorter of the estimated useful life of the asset and the lease term if there is no reasonable certainty that the Group will obtain ownership by the end of the lease term.
Operating lease payments are recognised as an expense in the income statement on a straight line basis over the lease term.
(e) Cash and cash equivalentsCash on hand and in banks are stated at nominal value.
For the purposes of the cash flow statement, cash includes cash on hand and in banks net of outstanding bank overdrafts.
(f) Trade and other receivablesTrade receivables are recognised initially at fair value and subsequently measured at amortised cost using the effective interest method, less any allowance for impairment (refer note 3(m)). Trade receivables are generally due for settlement within 30 – 60 days.
Collectability of trade receivables is reviewed on an ongoing basis. Debts which are known to be uncollectible are written off by reducing the carrying amount directly. An allowance for impairment of trade receivables is used when there is objective evidence that the Group will not be able to collect all amounts due according to the original terms of the receivables.
noTes To The ConsolIDaTeD fInanCIal sTaTemenTs (continued)Year Ended 30 June 2013

53
Boom LogIstIcs LImItedA.B.N. 28 095 466 961
BOOM LOgistics AnnuAL RepORt 2013
3. summary of sIgnIfIcant accountIng poLIcIes (contInued)
(f) Trade and other receivables (continued)Significant financial difficulties of the debtor, probability that the debtor will enter bankruptcy or financial reorganisation, and default or delinquency in payments (more than 30 days overdue) are considered indicators that the trade receivable is impaired. The amount of the impairment allowance is the difference between the asset’s carrying amount and the present value of estimated future cash flows, discounted at the original effective interest rate. Cash flows relating to short-term receivables are not discounted if the effect of discounting is immaterial.
The amount of the impairment loss is recognised in the income statement within other expenses. When a trade receivable for which an allowance for impairment had been recognised becomes uncollectible in a subsequent period, it is written off against the allowance account. Subsequent recoveries of amounts previously written off are credited against other expenses in the income statement.
(g) InventoriesInventories are valued at the lower of cost and net realisable value.
Net realisable value is the estimated selling price in the ordinary course of business, less the estimated costs necessary to make the sale.
(h) Income taxCurrent tax assets and liabilities for the current and prior periods are measured at the amount expected to be recovered from or paid to the taxation authorities. The tax rates and tax laws used to compute the amount are those that are enacted or substantively enacted by the balance sheet date.
Deferred tax is provided on all temporary differences at the balance sheet date between the tax bases of assets and liabilities and their carrying amounts for financial reporting purposes.
Deferred tax liabilities are recognised for all taxable temporary differences except where the deferred tax liability arises from the initial recognition of an asset or liability in a transaction that is not a business combination and, at the time of the transaction, affects neither the accounting profit nor taxable profit or loss.
Deferred tax assets are recognised for all deductible temporary differences and unused tax losses, to the extent that it is probable that taxable profit will be available against which the deductible temporary differences, and the carry forward of unused tax losses can be utilised except where the deferred tax asset relating to the deductible temporary differences arises from the initial recognition of an asset or liability in a transaction that is not a business combination and, at the time of the transaction, affects neither the accounting profit nor taxable profit or loss.
The carrying amount of deferred tax assets is reviewed at each balance sheet date and reduced to the extent that it is no longer probable that sufficient taxable profit will be available to allow all or part of the deferred tax asset to be utilised.
Unrecognised deferred tax assets are reassessed at each balance sheet date and are recognised to the extent that it has become probable that future taxable profit will allow the deferred tax asset to be recovered.
Deferred tax assets and liabilities are measured at the tax rates that are expected to apply to the year when the asset is realised or the liability is settled, based on tax rates (and tax laws) that have been enacted or substantively enacted at the balance sheet date.
Income taxes relating to items recognised directly in equity are recognised in equity and not in the income statement.
noTes To The ConsolIDaTeD fInanCIal sTaTemenTs (continued)Year Ended 30 June 2013

BOOM LOgistics AnnuAL RepORt 201354
Boom LogIstIcs LImItedA.B.N. 28 095 466 961
3. summary of sIgnIfIcant accountIng poLIcIes (contInued)
(h) Income tax (continued)Deferred tax assets and deferred tax liabilities are offset only if a legally enforceable right exists to set off current tax assets against current tax liabilities and the deferred tax assets and liabilities relate to the same taxable entity and the same taxation authority.
Tax consolidation legislationBoom Logistics Limited and its wholly-owned Australian controlled entities have implemented the tax consolidation legislation. The head entity, Boom Logistics Limited, and the controlled entities in the tax consolidated group account for their own current and deferred tax amounts. These tax amounts are measured as if each entity in the tax consolidated group continues to be a stand alone taxpayer in its own right.
In addition to its own current and deferred tax amounts, Boom Logistics Limited also recognises the current tax liabilities (or assets) and the deferred tax assets arising from unused tax losses and unused tax credits assumed from controlled entities in the tax consolidated group.
Assets or liabilities arising under tax funding agreements with the tax consolidated entities are recognised as amounts receivable from or payable to other entities in the Group.
(i) Goods and Services Tax (GST)Revenues, expenses and assets are recognised net of the amount of GST except where the GST incurred on a purchase of goods and services is not recoverable from the taxation authority, in which case the GST is recognised as part of the cost of acquisition of the asset or as part of the expense item as applicable.
The net amount of GST recoverable from, or payable to, the taxation authority is included as part of receivables or payables in the balance sheet.
Cash flows are included in the cash flow statement on a gross basis and the GST component of cash flows arising from investing and financing activities, which is recoverable from, or payable to, the taxation authority, are classified as operating cash flows.
Commitments and contingencies are disclosed net of the amount of GST recoverable from or payable to the taxation authority.
(j) Plant and equipmentPlant and equipment is measured at cost less accumulated depreciation and any accumulated impairment losses. Cost includes expenditure that is directly attributable to the acquisition of the asset.
When a major overhaul is performed, the cost is recognised in the carrying amount of plant and equipment only if the major overhaul extends the expected useful life of the asset or if the continuing operation of the asset is conditional upon incurring the expenditure. Similarly, when each major inspection is performed, its cost is recognised in the carrying amount of plant and equipment as a replacement only if it is eligible for capitalisation. The cost of the day-to-day servicing or the replacement of parts of plant and equipment is recognised in profit or loss as incurred.
noTes To The ConsolIDaTeD fInanCIal sTaTemenTs (continued)Year Ended 30 June 2013

55
Boom LogIstIcs LImItedA.B.N. 28 095 466 961
BOOM LOgistics AnnuAL RepORt 2013
3. summary of sIgnIfIcant accountIng poLIcIes (contInued)
(j) Plant and equipment (continued) Depreciation is recognised in the income statement on a straight line basis over the estimated useful life of each part of an item of plant and equipment as follows:
Mobile Cranes > 20T 20 Years
Travel Towers 20 Years
Mobile Cranes < 20T 10 Years
Access Equipment 10 Years
Ancillary Equipment 10 Years
Office Equipment 10 Years
Workshop Equipment 10 Years
Leasehold Improvements Lesser of lease term or 10 Years
Vehicles 5 to 10 Years
Computer Equipment 3 to 5 Years
Depreciation methods, useful lives and residual values are reviewed at each reporting date and at more regular intervals when there is an indicator of impairment or when deemed appropriate.
Gains or losses on sale of plant and equipment are included in the income statement in the year the asset is disposed of.
Assets classified as held for saleAssets are classified as held for sale if their carrying amount will be recovered principally through a sale transaction rather than through continuing use. This condition is regarded as met only when the sale is highly probable and the asset is available for immediate sale in its present condition. Management must be committed to the sale, which should be expected to qualify for recognition as a completed sale within one year from the date of classification.
Assets classified as held for sale are measured at the lower of their previous carrying amount and fair value less costs to sell. No depreciation is recognised whilst an asset is held for sale. Interest and other expenses attributable to the assets held for sale continue to be recognised.
(k) Intangible assetsIntangible assets acquired separately or in a business combination are initially measured at cost. The cost of an intangible asset acquired in a business combination is its fair value as at the date of acquisition. Following initial recognition, intangible assets are carried at cost less any accumulated amortisation and any accumulated impairment losses.
The useful lives of intangible assets are assessed to be either finite or indefinite. Intangible assets with finite lives are amortised over the useful life and assessed for impairment whenever there is an indication that the intangible asset may be impaired. The amortisation period and the amortisation method for an intangible asset with a finite useful life is reviewed at least annually. Changes in the expected useful life or the expected pattern of consumption of future economic benefits embodied in the asset are accounted for by changing the amortisation period or method, as appropriate, which is a change in accounting estimate.
Intangible assets with indefinite useful lives are tested for impairment at each reporting date either individually or at the cash generating unit level. Such intangibles are not amortised. The useful life of an intangible asset with an indefinite life is reviewed at each reporting period to determine whether indefinite life assessment continues to be supportable. If not, the change in the useful life assessment from indefinite to finite is accounted for as a change in an accounting estimate and is thus accounted for on a prospective basis.
noTes To The ConsolIDaTeD fInanCIal sTaTemenTs (continued)Year Ended 30 June 2013

BOOM LOgistics AnnuAL RepORt 201356
Boom LogIstIcs LImItedA.B.N. 28 095 466 961
3. summary of sIgnIfIcant accountIng poLIcIes (contInued)
(k) Intangible assets (continued)A summary of the policies applied to the Group’s intangible assets excluding goodwill is as follows:
Software Development Costs
Useful lives Finite
Method used Life of software
Internally generated / Acquired Internally generated
Impairment test / Recoverable amount testing Amortisation method reviewed at each financial year end; Reviewed annually for indicators of impairment.
Gains or losses arising from derecognition of an intangible asset are measured as the difference between the net disposal proceeds and the carrying amount of the asset and are recognised in the income statement when the asset is derecognised.
(l) GoodwillGoodwill acquired in a business combination is initially measured at cost being the excess of the cost of the business combination over the Group’s interest in the net fair value of the acquiree’s identifiable assets, liabilities and contingent liabilities.
Following initial recognition, goodwill is measured at cost less any accumulated impairment losses.
Goodwill is reviewed for impairment, annually or more frequently if events or changes in circumstances indicate that the carrying value may be impaired.
For the purpose of impairment testing, goodwill acquired in a business combination is, from the acquisition date, allocated to each of the Group’s cash generating units, or groups of cash generating units, that are expected to benefit from the synergies of the combination, irrespective of whether other assets or liabilities of the Group are assigned to those units or groups of units. Each unit or group of units to which the goodwill is so allocated represents the lowest level within the Group at which the goodwill is monitored for internal management purposes.
(m) Impairment of assets
Financial assetsFinancial assets are assessed at each reporting date to determine whether there is any objective evidence of impairment. A financial asset is considered to be impaired if objective evidence indicates that one or more events have had a negative effect on the estimated future cash flows of that asset.
An impairment loss in respect of a financial asset measured at amortised cost is calculated as the difference between its carrying amount, and the present value of the estimated future cash flows discounted at the original effective interest rate.
Individually significant financial assets are tested for impairment on an individual basis. The remaining financial assets are assessed collectively in groups that share similar credit risk characteristics. All impairment losses are recognised in profit or loss.
An impairment loss is reversed if the reversal can be related objectively to an event occurring after the impairment loss was recognised. For financial assets measured at amortised cost, the reversal is recognised in the income statement.
noTes To The ConsolIDaTeD fInanCIal sTaTemenTs (continued)Year Ended 30 June 2013

57
Boom LogIstIcs LImItedA.B.N. 28 095 466 961
BOOM LOgistics AnnuAL RepORt 2013
3. summary of sIgnIfIcant accountIng poLIcIes (contInued)
(m) Impairment of assets (continued)
Non-financial assetsThe carrying amounts of the Group’s non-financial assets, other than deferred tax assets and inventories, are reviewed at each reporting date to determine whether there is any indication of impairment. If any such indication exists then the asset’s recoverable amount is estimated. For goodwill and intangible assets that have indefinite lives or that are not yet available for use, recoverable amount is estimated at each reporting date.
The recoverable amount of an asset or cash-generating unit or a group of cash-generating units is the greater of its value in use and its fair value less costs to sell. In assessing value in use, the estimated future cash flows are discounted to their present value using a pre-tax discount rate that reflects current market assessments of the time value of money and the risks specific to the asset. For the purpose of impairment testing, assets are grouped together into the smallest group of assets that generates cash inflows from continuing use that are largely independent of the cash inflows of other assets or groups of assets (the “cash-generating unit”). The goodwill acquired in a business combination, for the purpose of impairment testing, is allocated to cash-generating units or a group of cash-generating units that are expected to benefit from the synergies of the combination and at the lowest level monitored by management.
An impairment loss is recognised if the carrying amount of an asset, cash-generating unit or a group of cash-generating units exceeds its recoverable amount. Impairment losses are recognised in the income statement. Impairment losses recognised in respect of cash-generating units are allocated first to reduce the carrying amount of any goodwill allocated to the units and then to reduce the carrying amount of the other assets in the unit (group of units) on a pro rata basis. An impairment loss in respect of goodwill is not reversed. In respect of other assets, impairment losses recognised in prior periods are assessed at each reporting date for any indications that the loss has decreased or no longer exists. An impairment loss is reversed if there has been a change in the estimates used to determine the recoverable amount. An impairment loss is reversed only to the extent that the asset’s carrying amount does not exceed the carrying amount that would have been determined, net of depreciation or amortisation, if no impairment loss had been recognised.
(n) Trade and other payablesThese amounts represent liabilities for goods and services provided to the Group prior to the end of financial year which are unpaid. The amounts are unsecured and are usually payable within 30 days of recognition.
(o) Interest bearing loans and borrowingsAll loans and borrowings are initially recognised at fair value of the consideration received less directly attributable transaction costs.
After initial recognition, interest bearing loans and borrowings are subsequently measured at amortised cost using the effective interest method.
Gains and losses are recognised in the income statement when the liabilities are derecognised.
(p) ProvisionsProvisions are recognised when the Group has a present obligation (legal or constructive) as a result of a past event, it is probable that an outflow of resources embodying economic benefits will be required to settle the obligation and a reliable estimate can be made of the amount of the obligation.
When the Group expects some or all of a provision to be reimbursed, for example under an insurance contract, the reimbursement is recognised as a separate asset but only when the reimbursement is probable. The expense relating to any provision is presented in the income statement net of any reimbursement.
noTes To The ConsolIDaTeD fInanCIal sTaTemenTs (continued)Year Ended 30 June 2013

BOOM LOgistics AnnuAL RepORt 201358
Boom LogIstIcs LImItedA.B.N. 28 095 466 961
3. summary of sIgnIfIcant accountIng poLIcIes (contInued)
(p) Provisions (continued)If the effect of the time value of money is material, provisions are discounted using a current pre-tax rate that reflects the risks specific to the liability.
When discounting is used, the increase in the provision due to the passage of time is recognised as a finance expense.
A provision for restructuring is recognised when the Group has approved a detailed and formal restructuring plan, and the restructuring either has commenced or has been announced publicly. Future operating costs are not provided for.
(q) Employee benefits
Wages, salaries, annual leave, sick leave and rostered days offLiabilities for wages and salaries, including non monetary benefits, annual leave, accumulating sick leave and rostered days off represent present obligations from employees’ services provided to the reporting date and are recognised in employee provisions up to the reporting date. They are measured at the amounts expected to be paid when the liabilities are settled. Liabilities for non-accumulating sick leave are recognised when the leave is taken and are measured at the rates paid or payable.
Long service leaveThe liability for long service leave is recognised in the provision for employee benefits and measured as the present value of expected future payments to be made in respect of services provided by employees up to the reporting date. Consideration is given to expected future wage and salary levels, experience of employee departures, and periods of service. Expected future payments are discounted using market yields at the reporting date on national government bonds with terms to maturity and currency that match, as closely as possible, the estimated future cash outflows.
Termination benefitsTermination benefits are recognised as an expense when the Group is demonstrably committed, without realistic possibility of withdrawal, to a formal detailed plan to either terminate employment before the normal retirement date, or to provide termination benefits as a result of an offer made to encourage voluntary redundancy. Termination benefits for voluntary redundancies are recognised as an expense if the Group has made an offer encouraging voluntary redundancy, it is probable that the offer will be accepted, and the number of acceptances can be estimated reliably.
Defined contribution plansA defined contribution plan is a post-employment benefit plan under which an entity pays fixed contributions into a separate entity and will have no legal or constructive obligation to pay further amounts. Obligations for contribution plans are recognised as a personnel expense in the income statement in the period in which services are rendered by employees. Prepaid contributions are recognised as an asset to the extent that a cash refund or a reduction in future payments is available.
(r) Share-based paymentsThe Group provides benefits to senior management of the Group in the form of share based payments, whereby senior management receives incentive based share allocations vesting upon achievement of preset performance targets over a rolling three year period.
The cost of these equity settled transactions with employees is measured by reference to the fair value at the date at which they are granted.
In valuing equity settled transactions, no account is taken of any performance conditions, other than conditions linked to the price of the shares of Boom Logistics Limited (market conditions) if applicable.
noTes To The ConsolIDaTeD fInanCIal sTaTemenTs (continued)Year Ended 30 June 2013

59
Boom LogIstIcs LImItedA.B.N. 28 095 466 961
BOOM LOgistics AnnuAL RepORt 2013
3. summary of sIgnIfIcant accountIng poLIcIes (contInued)
(r) Share-based payments (continued)The cost of equity settled transactions is recognised, together with a corresponding increase in equity, over the period in which the performance and/or service conditions are fulfilled, ending on the date on which the relevant employees become fully entitled to the award (the vesting period).
The cumulative expense recognised for equity settled transactions at each reporting date until vesting date reflects (i) the extent to which the vesting period has expired and (ii) the Group’s best estimate of the number of equity instruments that will ultimately vest. No adjustment is made for the likelihood of market performance conditions being met as the effect of these conditions is included in the determination of fair value at grant date. The income statement charge or credit for a period represents the movement in cumulative expense recognised as at the beginning and end of that period.
No expense is recognised for awards that do not ultimately vest, except for awards where vesting is only conditional upon a market condition.
If the terms of an equity settled award are modified, as a minimum an expense is recognised as if the terms had not been modified. In addition, an expense is recognised for any modification that increases the total fair value of the share based payment arrangement, or is otherwise beneficial to the employee as measured at the date of modification.
If an equity settled award is cancelled, it is treated as if it had vested on the date of cancellation, and any expense not yet recognised for the award is recognised immediately. However, if a new award is substituted for the cancelled award, and designated as a replacement award on the date that it is granted, the cancelled and new award are treated as if they were a modification of the original award, as described in the previous paragraph.
(s) Contributed equityIssued and paid up capital is recognised at the fair value of the consideration received.
Any transaction costs arising on the issue of ordinary shares are recognised directly in equity as a reduction of the share proceeds received.
(t) Dividends A provision for dividends is not recognised as a liability unless the dividends are declared, determined or publicly recommended on or before the reporting date.
(u) Earnings per share (EPS)Basic EPS is calculated as net profit attributable to members, adjusted to exclude any costs of servicing equity (other than dividends), divided by the weighted average number of ordinary shares outstanding during the year, adjusted for any bonus element.
Diluted EPS is calculated as net profit attributable to members, adjusted for:– costs of servicing equity (other than dividends);– the after tax effect of dividends and interest associated with dilutive potential ordinary shares that have been recognised as
expenses; and– other non discretionary changes in revenues or expenses during the period that would result from the dilution of potential
ordinary shares;
divided by the weighted average number of ordinary shares and dilutive potential ordinary shares, adjusted for any bonus element.
noTes To The ConsolIDaTeD fInanCIal sTaTemenTs (continued)Year Ended 30 June 2013

BOOM LOgistics AnnuAL RepORt 201360
Boom LogIstIcs LImItedA.B.N. 28 095 466 961
3. summary of sIgnIfIcant accountIng poLIcIes (contInued)
(v) Financial instruments Non-derivative financial instruments comprise investments in trade and other receivables, cash and cash equivalents, loans and borrowings, and trade and other payables.
Non-derivative financial instruments are recognised initially at fair value plus, for instruments not at fair value through profit or loss, any directly attributable transaction costs. Measurement of each of the non-derivative financial instruments is covered in the respective policy notes – trade and other receivables 3(f), cash and cash equivalents 3(e), interest bearing loans and borrowings 3(o), and trade and other payables 3(n). Refer to note 26 for detailed disclosures.
A financial instrument is recognised if the Group becomes a party to the contractual provisions of the instrument. Financial assets are derecognised if the Group’s contractual rights to the cash flows from the financial assets expire or if the Group transfers the financial asset to another party without retaining control and substantially all risks and rewards of the asset.
Regular purchases and sales of financial assets are accounted for at trade date, i.e. the date that the Group commits itself to purchase or sell the asset. Financial liabilities are derecognised if the Group’s obligations specified in the contract expire or are discharged or cancelled.
(w) Derivatives and hedgingThe Group uses derivative financial instruments, such as forward foreign currency and interest rate swap contracts, to hedge its foreign currency risks and interest rate risks, respectively. Such derivatives are initially recognised at fair value on the date a derivative contract is entered into and are subsequently remeasured to their fair value at each reporting date. The accounting for subsequent changes in fair value depends on whether the derivative is designated as a hedging instrument, and if so, the nature of the item being hedged. The Group designates certain derivatives as either:– hedges of the fair value of recognised assets or liabilities or a firm commitment (fair value hedges); or– hedges of the cash flows of recognised assets and liabilities and highly probable forecast transactions (cash flow hedges).
The Group documents at the inception of the hedging transaction the relationship between hedging instruments and hedged items, as well as its risk management objective and strategy for undertaking various hedge transactions. The Group also documents its assessment, both at hedge inception and on an ongoing basis, of whether the derivatives that are used in hedging transactions have been and will continue to be highly effective in offsetting changes in fair values or cash flows of hedged items.
The fair values of various derivative financial instruments used for hedging purposes are disclosed in note 21. Movements in the hedging reserve in shareholders’ equity are shown in note 25. The full fair value of a hedging derivative is classified as a non-current asset or liability when the remaining maturity of the hedged item is more than 12 months; it is classified as a current asset or liability when the remaining maturity of the hedged item is less than 12 months.
The effective portion of changes in the fair value of derivatives that are designated and qualify as cash flow hedges is recognised in other comprehensive income and accumulated in reserves in equity. The gain or loss relating to the ineffective portion is recognised immediately in profit or loss within other income or other expense.
Amounts taken to equity are transferred to the income statement when the hedged transaction affects profit or loss, such as when hedged income or expenses are recognised or when a forecast sale or purchase occurs. When the hedged item is a non financial asset (for example, inventory or fixed assets), the amounts taken to equity are transferred to the initial carrying amount of the non financial asset or liability.
noTes To The ConsolIDaTeD fInanCIal sTaTemenTs (continued)Year Ended 30 June 2013

61
Boom LogIstIcs LImItedA.B.N. 28 095 466 961
BOOM LOgistics AnnuAL RepORt 2013
3. summary of sIgnIfIcant accountIng poLIcIes (contInued)
(w) Derivatives and hedging (continued)If the forecast transaction is no longer expected to occur, amounts previously recognised in equity are transferred to the income statement. If the hedging instrument expires or is sold, terminated or exercised without replacement or rollover, or if its designation as a hedge is revoked, amounts previously recognised in equity remain in equity until the forecast transaction occurs. If the related transaction is not expected to occur, the amount is taken to the income statement.
(x) Segment reportingOperating segments are reported in a manner consistent with the internal reporting provided to the chief operating decision maker (CODM). The CODM is responsible for allocating resources and assessing performance of the operating segments.
(y) New accounting standards and interpretations not yet adoptedThe following standards, amendments to standards and interpretations have been identified as those which may impact the Group in the period of initial application. They are not yet effective and have not been adopted by the Group in preparing this financial report.
(i) AASB 13 Fair Value Measurement and AASB 2011-8 Amendments to Australian Accounting Standards arising from AASB 13 (effective 1 January 2013).
(ii) Revised AASB 119 Employee Benefits and AASB 2011-10 Amendments to Australia Accounting Standards arising from AASB 119 (effective 1 January 2013).
(iii) AASB 2012-5 Amendments to Australian Accounting Standards arising from Annual Improvements 2009-2011 Cycle (effective 1 January 2013).
(iv) AASB 10 Consolidated Financial Statements, AASB 11 Joint Arrangements, AASB 12 Disclosure of Interests in Other Entities, AASB 2011-7 Amendments to Australian Accounting Standards arising from the Consolidation and Joint Arrangements Standards, AASB 2012-10 Amendments to Australian Accounting Standards - Transition Guidance and Other Amendments (effective 1 January 2013).
(v) AASB 2011-4 Amendments to Australia Accounting Standards to Remove Individual Key Management Personnel Disclosure Requirements (effective 1 July 2013).
(vi) AASB 2012-2 Disclosures – Offsetting Financial Assets and Financial Liabilities (effective 1 July 2013).
(vii) AASB 2012-3 Offsetting Financial Assets and Financial Liabilities (effective 1 July 2014).
(viii) AASB 9 Financial Instruments, AASB 2009-11 Amendments to Australian Accounting Standards arising from AASB 9, AASB 2010-7 and 2012-6 (effective 1 January 2015).
noTes To The ConsolIDaTeD fInanCIal sTaTemenTs (continued)Year Ended 30 June 2013

BOOM LOgistics AnnuAL RepORt 201362
Boom LogIstIcs LImItedA.B.N. 28 095 466 961
4. fInancIaL rIsk management
The Group has exposure to the following risks from its use of financial instruments:– credit risk; – liquidity risk; and– market risk
This note presents information about the Group’s exposure to each of the above risks, its objectives, policies and processes for measuring and managing risk, and the management of capital. Further quantitative disclosures are included throughout this financial report.
The Board of Directors has overall responsibility for the establishment and oversight of the risk management framework. The Board has empowered senior management for developing and monitoring risk management guidelines and policies. The Chief Financial Officer reports regularly to the Board of Directors on relevant activities.
Risk management guidelines have been further developed to identify and analyse the risks faced by the Group, to set appropriate risk limits and controls, and to monitor risks and adherence to limits. Risk management guidelines are regularly reviewed to reflect changes in market conditions and the Group’s activities.
The Audit and Risk Committee oversees how management monitors compliance with the Group’s risk management guidelines, policies and procedures and reviews the adequacy of the risk management framework in relation to the risks faced by the Group.
Credit riskCredit risk arises from the financial assets of the Group, which comprise cash and cash equivalents, trade and other receivables and derivative instruments. The Group’s exposure to credit risk arises from potential default of the counter party, with a maximum exposure equal to the carrying amount of these instruments. Exposure at balance date is addressed in each applicable note.
The Group does not hold any credit derivatives to offset its credit exposure.
The Group’s policy is to trade with recognised, creditworthy third parties. It is the Group’s practice that all customers who wish to trade on credit terms are subject to credit verification procedures. In addition, receivable balances are monitored on an ongoing basis with the result that the Group’s exposure to bad debts is not significant. There are no significant concentrations of credit risk within the Group. Refer to note 26 for detailed disclosure.
Liquidity riskLiquidity risk is the risk that the Group will not be able to meet its financial obligations as they fall due. The Group’s approach to managing liquidity is to ensure, as far as possible, that it will always have sufficient liquidity to meet its financial obligations as they fall due under both normal and stressed conditions without incurring unacceptable losses or damage to the Group’s reputation. In order to meet these requirements management estimates the cash flows of the Group on a weekly basis.
The Group’s objective is to maintain a balance between continuity of funding and flexibility through the use of bank overdrafts, bank loans, finance leases and hire purchase contracts. At 30 June 2013, the Group’s balance sheet gearing ratio was 37% (2012: 36%). This ratio is calculated as net debt divided by equity. Net debt is calculated as total interest bearing loans and borrowings less cash and cash equivalents. Equity is as shown on the Balance Sheet. Refer to note 26 for detailed disclosure.
noTes To The ConsolIDaTeD fInanCIal sTaTemenTs (continued)Year Ended 30 June 2013

63
Boom LogIstIcs LImItedA.B.N. 28 095 466 961
BOOM LOgistics AnnuAL RepORt 2013
4. fInancIaL rIsk management (contInued)
Market riskMarket risk is the risk that changes in foreign exchange rates and interest rates will affect the Group’s income or the value of its holdings of financial instruments. Refer to note 26 for detailed disclosure.
Foreign exchange riskForeign exchange risk arises when future commercial transactions and recognised assets and liabilities are denominated in a currency that is not the entity’s functional currency.
The Group has transactional currency exposures arising from purchases of plant and equipment in currencies other than the functional currency. It is the Group’s policy to hedge 100% of its estimated foreign currency purchases. The Group’s policy is not to enter into forward currency contracts until a firm commitment is in place and to negotiate the terms of the hedge derivatives to match the terms of the hedged item to maximise hedge effectiveness.
Interest rate riskThe Group is exposed to interest rate risk as entities in the Group borrow funds at both fixed and floating interest rates. The level of fixed and variable rate debt is disclosed in note 26.
Capital ManagementThe Group’s objectives when managing capital are to safeguard the Group’s ability to maintain healthy capital ratios, so that it can continue to provide returns for shareholders and benefits for other stakeholders and to maintain an optimal capital structure to minimise the cost of capital.
In order to maintain or adjust the capital structure the Group may adjust the amount of dividends paid to shareholders, return capital to shareholders, issue new shares or sell assets to reduce debt.
The Group monitors capital on the basis of the balance sheet gearing ratio. This ratio is calculated as net debt divided by equity. Information regarding compliance with debt facility requirements is disclosed in note 19.
Note 2013 2012
$’000 $’000
Interest bearing loans and borrowings 19 119,398 123,856 Less: cash and cash equivalents 10(a) (3,572) (10,102)
Net debt 115,826 113,754
Total equity 313,314 315,739
Gearing ratio 37% 36%
noTes To The ConsolIDaTeD fInanCIal sTaTemenTs (continued)Year Ended 30 June 2013

BOOM LOgistics AnnuAL RepORt 201364
Boom LogIstIcs LImItedA.B.N. 28 095 466 961
5. segment reportIng
(a) Description of operating segmentsManagement has determined the operating segments based on the reports reviewed by the Chief Operating Decision Maker (“CODM”) to make decisions about resource allocation and to assess performance.
The business is considered from a product perspective and has one reportable segment: “Lifting Solutions”, which consists of all lifting activities including the provision of cranes, travel towers, access equipment and all associated services.
The segment information provided to the CODM is measured in a manner consistent with that of the financial statements.
Boom Logistics Limited is domiciled in Australia and all revenue is derived from external customers within Australia. Revenues of approximately $70.136 million or 21% of total segment revenue (2012: $33.670 million or 10%) are derived from a single external customer. These revenues are attributable to the Lifting Solutions segment.
(b) Segment information provided to the CODM
Lifting Solutions Other * Consolidated
$’000 $’000 $’000
Year ended: 30 June 2013
Segment revenueTotal external revenue 336,164 - 336,164 Inter-segment revenue - - -
Revenue from external customers 336,164 - 336,164 Other income 1,441 102 1,543
Total segment revenue 337,605 102 337,707
Segment resultProfit before net interest and tax 19,922 (13,474) 6,448
Net interest (9,877)Income tax benefit 953
Loss from continuing operations (2,476)
Segment assets and liabilitiesSegment assets 479,407 9,618 489,025 Segment liabilities 158,722 16,989 175,711
Additions to non-current assets 50,450 1,811 52,261 Depreciation and amortisation 28,689 1,448 30,137 Impairment of plant and equipment 4,999 - 4,999 Impairment of assets classified as held for sale 6,016 - 6,016
* Other represents centralised costs including national office and shared services.
noTes To The ConsolIDaTeD fInanCIal sTaTemenTs (continued)Year Ended 30 June 2013

65
Boom LogIstIcs LImItedA.B.N. 28 095 466 961
BOOM LOgistics AnnuAL RepORt 2013
5. segment reportIng (contInued)
(b) Segment information provided to the CODM (continued)
Lifting Solutions Other * Consolidated
$’000 $’000 $’000
Year ended: 30 June 2012
Segment revenueTotal external revenue 347,825 - 347,825 Inter-segment revenue - - -
Revenue from external customers 347,825 - 347,825 Other income 3,867 - 3,867
Total segment revenue 351,692 - 351,692
Segment resultProfit before net interest and tax 49,127 (12,379) 36,748
Net interest (10,722)Income tax expense (6,321)
Profit from continuing operations 19,705
Segment assets and liabilitiesSegment assets 495,723 17,308 513,031 Segment liabilities 177,200 20,092 197,292
Additions to non-current assets 57,748 2,894 60,642 Depreciation and amortisation 28,016 624 28,640
* Other represents centralised costs including national office and shared services.
noTes To The ConsolIDaTeD fInanCIal sTaTemenTs (continued)Year Ended 30 June 2013

BOOM LOgistics AnnuAL RepORt 201366
Boom LogIstIcs LImItedA.B.N. 28 095 466 961
Note 2013 2012
$’000 $’000
6. revenue and expenses
(a) Revenue from continuing operationsRevenue from services 336,164 347,825 Interest income from other persons/corporations 680 449
336,844 348,274 (b) Other income
Net profit on disposal of plant and equipment 1,543 3,867
1,543 3,867
Total revenue 338,387 352,141
(c) ExpensesSalaries and employee benefits 152,193 147,655 Defined contribution plan expense 9,687 9,464
Total salaries and employee benefits expense 161,880 157,119
Depreciation of plant and equipment 15 29,089 28,310 Amortisation of intangible assets – software development costs 16(c) 1,048 330
Total depreciation and amortisation expense 30,137 28,640
Impairment of plant and equipment 4,999 - Impairment of assets classified as held for sale 6,016 -
Total impairment expense 15 11,015 -
Financing expenses 10,557 11,171
noTes To The ConsolIDaTeD fInanCIal sTaTemenTs (continued)Year Ended 30 June 2013

67
Boom LogIstIcs LImItedA.B.N. 28 095 466 961
BOOM LOgistics AnnuAL RepORt 2013
2013 2012
$’000 $’000
7. Income tax
The major components of income tax (benefit) / expense are:
(a) Income tax (benefit) / expense
Current income taxCurrent income tax (benefit) / expense 3,580 1,603 Adjustments in respect of current income tax of previous years - (1,603)
Deferred income taxRelating to origination and reversal of temporary differences (4,533) 6,321
(953) 6,321
A reconciliation between tax (benefit) / expense and the accounting profit before income tax (multiplied by the Group’s applicable income tax rate) is as follows:
Accounting (loss)/profit before tax from continuing operations (3,429) 26,026
At the Group’s statutory income tax rate of 30% (2012: 30%) (1,029) 7,808 Expenditure not allowable for income tax purposes 76 116 Adjustments in respect of current income tax of previous years - (1,603)
Income tax (benefit)/expense reported in the consolidated income statement (953) 6,321
noTes To The ConsolIDaTeD fInanCIal sTaTemenTs (continued)Year Ended 30 June 2013

BOOM LOgistics AnnuAL RepORt 201368
Boom LogIstIcs LImItedA.B.N. 28 095 466 961
BALANCE SHEET INCOME STATEMENT2013 2012 2013 2012
$'000 $'000 $'000 $'000
7. Income tax (contInued)
(b) Deferred income tax
Deferred income tax at 30 June relates to the following:
Deferred tax assets– Employee leave provisions 4,017 3,991 (26) (138)– Allowance for impairment on financial assets 206 386 180 263 – Liability accruals 127 395 268 294 – Restructuring provisions 1,118 - (1,118) 450 – Tax losses 6,673 4,506 (2,167) 3,855 – Cash flow hedges (recognised in other
comprehensive income) 405 715
Gross deferred income tax assets 12,546 9,993
Deferred tax liabilities– Plant and equipment (24,195) (25,865) (1,670) 1,597
Gross deferred income tax liabilities (24,195) (25,865)
Net deferred tax assets / (liabilities) (11,649) (15,872)
Deferred tax expense / (income) (4,533) 6,321
noTes To The ConsolIDaTeD fInanCIal sTaTemenTs (continued)Year Ended 30 June 2013

69
Boom LogIstIcs LImItedA.B.N. 28 095 466 961
BOOM LOgistics AnnuAL RepORt 2013
Note 2013 2012
$’000 $’000
7. Income tax (contInued)
(c) Income tax (receivable) / payable
Income tax (receivable) / payable (i) (4,450) (8,030)
(i) Income tax receivable represents the anticipated tax refund in respect of the FY2013 year of $4.450 million (2012: $4.343 million). Prior year balance included a franking deficit tax offset of $3.687 million which was fully utilised in FY2013.
(d) Tax losses
The Group has unused tax losses of $6.673 million (2012: $4.506 million) which have been recognised as a deferred tax asset as it is probable that sufficient taxable profit will be available to allow all the tax losses to be utilised.
8. earnIngs per share
Basic earnings per share amounts are calculated by dividing net profit for the year attributable to ordinary equity holders of the parent by the weighted average number of ordinary shares outstanding during the year.
Diluted earnings per share amounts are calculated by dividing the net profit attributable to ordinary equity holders of the parent by the weighted average number of ordinary shares outstanding during the year plus the weighted average number of ordinary shares that would be issued on the conversion of all the dilutive potential ordinary shares into ordinary shares.
The following reflects the income and share data used in the calculation of basic and diluted earnings per share
Net (loss) / profit after tax (2,476) 19,705
No. of shares
Weighted average number of ordinary shares used in calculating basic earnings per share 469,533,006 467,072,523
Effect of dilutive securities:– employee share awards - -
Adjusted weighted average number of ordinary shares used in calculating diluted earnings per share 469,533,006 467,072,523
Number of ordinary shares at financial year end 470,598,576 468,663,585
noTes To The ConsolIDaTeD fInanCIal sTaTemenTs (continued)Year Ended 30 June 2013

BOOM LOgistics AnnuAL RepORt 201370
Boom LogIstIcs LImItedA.B.N. 28 095 466 961
Note 2013 2012
$’000 $’000
9. dIvIdends paId and proposed
(a) Dividends paid during the year
Current year interimFully franked dividends (nil cents per share) - - (2012: nil cents per share)
Previous year finalFully franked dividends (nil cents per share) - - (2012: nil cents per share)
- -
(b) Dividends proposed and not recognised as a liability
Fully franked dividends (nil cents per share) - - (2012: nil cents per share)
(c) Franking credit balance
The amount of franking credits available for the subsequent financial year are:
– Franking credits as at the end of the financial year at 30% (2012: 30%) 2 3
– Franking (deficits) / credits that will arise from the payment / (receipt) of income tax payable / (receivable) as at the end of the financial year 7(c) (4,450) (8,030)
– Franking debits that will arise from the payment of dividends as at the end of the financial year - -
(4,448) (8,027)
The amount of franking credits available for future reporting periods:
– Impact on the franking account of dividends proposed or declared before the financial report was authorised for issue but not recognised as a distribution to equity holders during the period - -
(4,448) (8,027)
noTes To The ConsolIDaTeD fInanCIal sTaTemenTs (continued)Year Ended 30 June 2013

71
Boom LogIstIcs LImItedA.B.N. 28 095 466 961
BOOM LOgistics AnnuAL RepORt 2013
Note 2013 2012
$’000 $’000
10. cash and cash equIvaLents
(a) Reconciliation of cash
Cash at bank and on hand 3,572 10,102
Closing cash balance 3,572 10,102
Cash at bank earns interest at floating rates based on daily bank deposit rates. The Group’s exposure to interest rate risk and a sensitivity analysis for financial assets and liabilities are disclosed in note 26.
(b) Reconciliation of the net profit/(loss) after tax to the net cash flows from operations
Net (loss) / profit after tax (2,476) 19,705
Non cash itemsDepreciation and amortisation of non-current assets 6(c) 30,137 28,640 Impairment of assets 6(c) 11,015 - Net (profit)/loss on disposal of plant and equipment 6(b) (1,543) (3,867)Share based payments 25 (271) (128)Reversal of unused provisions 20 (150) (168)
Changes in assets and liabilities(Increase)/decrease in trade and other receivables 14,508 (12,165)(Increase)/decrease in inventories (194) 1,106 (Increase)/decrease in prepayments and other assets 687 608 (Increase)/decrease in current tax receivables 3,580 (1)(Decrease)/increase in trade and other payables (4,404) (183)(Decrease)/increase in deferred tax liabilities (4,223) 5,606 (Decrease)/increase in provisions 3,143 (1,824)(Decrease)/increase in other liabilities 1,395 (887)
Net cash flow from operating activities 51,204 36,442
11. trade and other receIvaBLes
Trade receivables (i) 53,706 66,763 Allowance for impairment 26(a) (687) (1,286)
53,019 65,477 Other receivables 2,421 4,471
Total trade and other receivables 55,440 69,948
(i) Trade receivables are non interest bearing and are generally on 30 – 60 day terms. An allowance for impairment is made when there is objective evidence that a trade receivable is impaired.
noTes To The ConsolIDaTeD fInanCIal sTaTemenTs (continued)Year Ended 30 June 2013

BOOM LOgistics AnnuAL RepORt 201372
Boom LogIstIcs LImItedA.B.N. 28 095 466 961
2013 2012
$’000 $’000
12. InventorIes
Stock on hand at cost 280 90 Stock on hand at net realisable value - -
280 90
Fuel at cost 227 223
Total inventories 507 313
Inventories recognised as an expense during the year ended 30 June 2013 amounted to $9,660,000 (2012: $11,166,000) representing fuel and tyres.
13. prepayments and other current assets
Prepayments 2,264 2,891 Other current assets 579 639
Total prepayments and other current assets 2,843 3,530
14. assets cLassIfIed as heLd for saLe
Plant and equipment 10,899 4,603
Total assets classified as held for sale 10,899 4,603
Assets classified as held for sale at year end consists of cranes, plant & equipment, travel towers and access equipment in the Lifting Solutions segment that are no longer in use and are available for immediate sale.
During the year ended 30 June 2013, assets classified as held for sale was impaired by $6,016,000 (2012: nil). Refer to note 15 for further details.
noTes To The ConsolIDaTeD fInanCIal sTaTemenTs (continued)Year Ended 30 June 2013

73
Boom LogIstIcs LImItedA.B.N. 28 095 466 961
BOOM LOgistics AnnuAL RepORt 2013
NoteRental
Equipment Motor
Vehicles*
Machinery, Furniture, Fittings &
Equipment Total
$’000 $’000 $’000 $’000
15. pLant and equIpment
Opening balance at 1 July 2011At cost 463,855 41,186 24,477 529,518 Accumulated depreciation (171,659) (18,748) (16,492) (206,899)
Net carrying amount 292,196 22,438 7,985 322,619
Year ended 30 June 2012Carrying amount at beginning net of accumulated depreciation and impairment 292,196 22,438 7,985 322,619 Additions 49,992 6,588 1,675 58,255 Disposals (i) (8,815) (1,131) (500) (10,446)Transfers 2,332 (2,237) (95) - Transfer to / from assets held for sale 172 - - 172 Depreciation charge for the year 6(c) (24,134) (1,959) (2,217) (28,310)
Carrying amount at end net of accumulated depreciation and impairment 311,743 23,699 6,848 342,290
Closing balance at 30 June 2012At cost 474,242 43,190 24,468 541,900 Accumulated depreciation (162,499) (19,491) (17,620) (199,610)
Net carrying amount 311,743 23,699 6,848 342,290
Year ended 30 June 2013Carrying amount at beginning net of accumulated depreciation and impairment 311,743 23,699 6,848 342,290 Additions 45,876 3,180 1,736 50,792 Disposals (i) (9,363) (272) (170) (9,805)Transfers (187) 109 (121) (199)Transfer to / from assets held for sale (9,299) (2,866) (147) (12,312)Impairment 6(c) (1,685) (19) (3,295) (4,999)Depreciation charge for the year 6(c) (24,415) (2,555) (2,119) (29,089)
Carrying amount at end net of accumulated depreciation and impairment 312,670 21,276 2,732 336,678
Closing balance at 30 June 2013At cost 468,601 36,385 18,648 523,634 Accumulated depreciation (155,931) (15,109) (15,916) (186,956)
Net carrying amount 312,670 21,276 2,732 336,678
* Motor vehicles represent prime movers, trailers and forklifts.
(i) Disposals include assets classified as held for sale that were disposed during the year.
Plant and equipment with a carrying amount of $336,678,000 (2012: $342,290,000) are pledged as securities for current and non current interest bearing loans and borrowings as disclosed in note 19.
noTes To The ConsolIDaTeD fInanCIal sTaTemenTs (continued)Year Ended 30 June 2013

BOOM LOgistics AnnuAL RepORt 201374
Boom LogIstIcs LImItedA.B.N. 28 095 466 961
15. pLant and equIpment (contInued)
ImpairmentIn light of the changed market conditions, particularly within the coal and infrastructure sectors and the recent restructuring activity, the Group has reassessed its fleet requirements, the carrying values of its assets and has identified a significant number of assets that have become available for sale.
Based on this review, a total impairment loss of $11,015,000 (2012: nil) was incurred across the Group’s fixed asset base. This impairment included:
Crane FleetThe Group has recognised an impairment against its crane fleet of $5,584,000.
With reference to cranes, the Group has adopted a fleet management policy to:– Invest in cranes from leading manufacturers that have a wide market acceptance, such as Liebherr, Manitowoc/Grove, Terex,
Kato and Tadano;– Invest in standard and interchangeable cranes that can be moved between applications; and– Avoid investment in less recognised brands, one-off, specialised, prototype or unusual model cranes.
This policy is consistent with ongoing restructuring activity designed to improve operating flexibility and asset utilisation. However, the Group’s acquisition of crane companies in the period from 2003 to 2007 means that the Group still carries a variety of crane brands in its fleet other than the leading brands noted above, as well as cranes that are one-off models or have been customised to perform site specific functions.
The Group has reviewed its fleet in detail to ensure that our equipment is consistent with the stated policy. As a result of this review, 66 cranes were reflected in the assets held for sale account at 30 June 2013. The average age of these 66 cranes is 17.6 years. 36 of the 66 cranes have a lifting capacity of 20 tonnes or less.
An impairment of $5.6 million has been reflected in the Group’s result in respect of these cranes, which are targeted for sale in FY2014.
15 of the 66 cranes to be sold account for $3.6 million or 64% of the $5.6 million impairment and these 15 cranes include the majority of the less recognised brands, one-off, specialised, prototype or unusual model cranes that have consequent narrow appeal in the used equipment market.
The average age of the Group’s remaining fleet of circa 400 cranes is 8.9 years.
Transport FleetA $1,278,000 impairment has been recognised in respect of the Group’s transport fleet that has been included in assets held for sale.
Boom Sherrin – Non Core Access businessThere has been a $3,149,000 impairment of assets relating to the Boom Sherrin Access & Other Cash Generating Unit (“CGU”) as at 30 June 2013. In line with the Group’s strategy and as communicated to the market in FY2011, the Group’s focus is on the core business of cranes and travel towers, and the Access & Other CGU is being managed for cash with no future investment.
noTes To The ConsolIDaTeD fInanCIal sTaTemenTs (continued)Year Ended 30 June 2013

75
Boom LogIstIcs LImItedA.B.N. 28 095 466 961
BOOM LOgistics AnnuAL RepORt 2013
15. pLant and equIpment (contInued)
Impairment (continued) In line with the requirements of accounting standards, the value in use method was used for calculating the recoverable amount of the Access & Other CGU. In applying this methodology to a CGU where investment is discontinued, only cash flows reflecting the remaining lives of existing assets may be recognised, which based on current and forecast activity levels has resulted in the current year impairment. The lower activity levels have been driven by the down turn in the coal and infrastructure sectors.
A further $144,000 has been impaired in Boom Sherrin relating to access equipment that is in assets held for sale.
18 metre Glove & Barrier Insulated Elevated Work PlatformsDuring the year, the Group committed to upgrade 15 of the 18 meter glove and barrier insulated elevated work platform fleet. In this process, it was identified that certain existing components could not be utilised in the upgraded work platforms. These components have been impaired by $278,000 as at 30 June 2013. Consequently, the replacement costs associated with these components incurred in FY2014 and beyond will be capitalised when incurred as they will result in future economic benefits.
OtherAdditional impairments of $582,000 have been recorded against non operational assets to ensure that only items complying with the strict requirement for asset recognition are carried on the Group’s balance sheet.
These impairment charges are all non-cash and have been recognised in the income statement line item ‘Impairment expense’ and relate to the Lifting Solutions segment. After taking account of the impairments noted above, the Group’s net tangible asset backing per share is $0.51 (2012: $0.52).
Assets Classified As Held For SaleThe balance in the Group’s assets classified as held for sale account at 30 June 2013 is $10.9 million and a further $2.4 million of assets is expected to become available for sale during the FY2014 financial year. All assets in the assets classified as held for sale account, or expected to be sold during the year, have been reviewed to ensure they are being carried at their recoverable amount less any selling costs.
The Group has historically realised a net profit on surplus asset sales in each year over the past five years.
noTes To The ConsolIDaTeD fInanCIal sTaTemenTs (continued)Year Ended 30 June 2013

BOOM LOgistics AnnuAL RepORt 201376
Boom LogIstIcs LImItedA.B.N. 28 095 466 961
Note 2013 2012
$’000 $’000
16. IntangIBLe assets
(a) Opening balance at 1 July
Goodwill 70,810 70,810 Software development costs (net carrying amount) 3,405 1,348
Total net carrying amounts 74,215 72,158
(b) Closing balance at 30 June
Goodwill 17 70,810 70,810 Software development costs (net carrying amount) 3,826 3,405
Total net carrying amounts 74,636 74,215
(c) Reconciliations
GoodwillCarrying amount at beginning of year net of impairment 70,810 70,810 Impairment - -
Carrying amount at end of year net of impairment 70,810 70,810
Represented by:Cost (gross carrying amount) 111,496 111,496 Accumulated impairment (40,686) (40,686)
Net carrying amount 70,810 70,810
Software development costsCarrying amount at beginning net of accumulated amortisation and impairment 3,405 1,348 Additions – internal development 1,469 2,387 Amortisation charge for the year 6(c) (1,048) (330)
Carrying amount at end net of accumulated amortisation and impairment 3,826 3,405
Represented by:Cost (gross carrying amount) 5,808 4,339 Accumulated amortisation and impairment (1,982) (934)
Net carrying amount 3,826 3,405
noTes To The ConsolIDaTeD fInanCIal sTaTemenTs (continued)Year Ended 30 June 2013
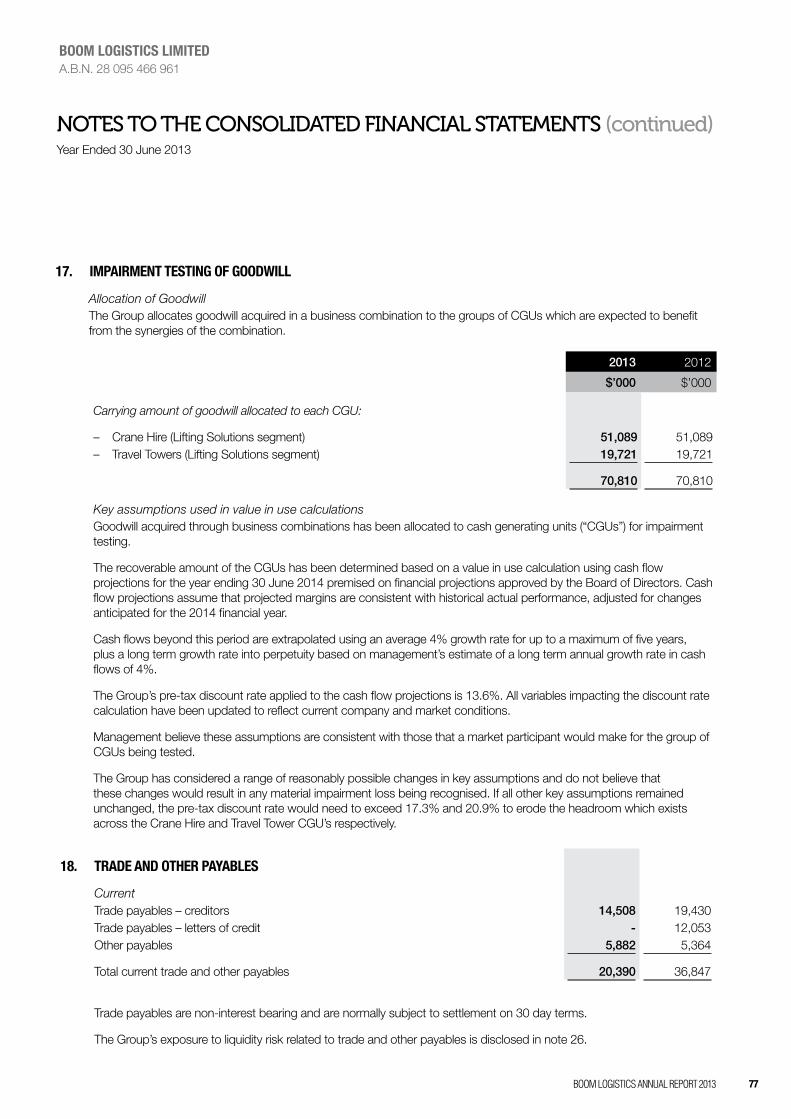
77
Boom LogIstIcs LImItedA.B.N. 28 095 466 961
BOOM LOgistics AnnuAL RepORt 2013
17. ImpaIrment testIng of goodwILL
Allocation of GoodwillThe Group allocates goodwill acquired in a business combination to the groups of CGUs which are expected to benefit from the synergies of the combination.
2013 2012
$’000 $’000
Carrying amount of goodwill allocated to each CGU:
– Crane Hire (Lifting Solutions segment) 51,089 51,089 – Travel Towers (Lifting Solutions segment) 19,721 19,721
70,810 70,810
Key assumptions used in value in use calculationsGoodwill acquired through business combinations has been allocated to cash generating units (“CGUs”) for impairment testing.
The recoverable amount of the CGUs has been determined based on a value in use calculation using cash flow projections for the year ending 30 June 2014 premised on financial projections approved by the Board of Directors. Cash flow projections assume that projected margins are consistent with historical actual performance, adjusted for changes anticipated for the 2014 financial year.
Cash flows beyond this period are extrapolated using an average 4% growth rate for up to a maximum of five years, plus a long term growth rate into perpetuity based on management’s estimate of a long term annual growth rate in cash flows of 4%.
The Group’s pre-tax discount rate applied to the cash flow projections is 13.6%. All variables impacting the discount rate calculation have been updated to reflect current company and market conditions.
Management believe these assumptions are consistent with those that a market participant would make for the group of CGUs being tested.
The Group has considered a range of reasonably possible changes in key assumptions and do not believe that these changes would result in any material impairment loss being recognised. If all other key assumptions remained unchanged, the pre-tax discount rate would need to exceed 17.3% and 20.9% to erode the headroom which exists across the Crane Hire and Travel Tower CGU’s respectively.
18. trade and other payaBLes
CurrentTrade payables – creditors 14,508 19,430 Trade payables – letters of credit - 12,053 Other payables 5,882 5,364
Total current trade and other payables 20,390 36,847
Trade payables are non-interest bearing and are normally subject to settlement on 30 day terms.
The Group’s exposure to liquidity risk related to trade and other payables is disclosed in note 26.
noTes To The ConsolIDaTeD fInanCIal sTaTemenTs (continued)Year Ended 30 June 2013
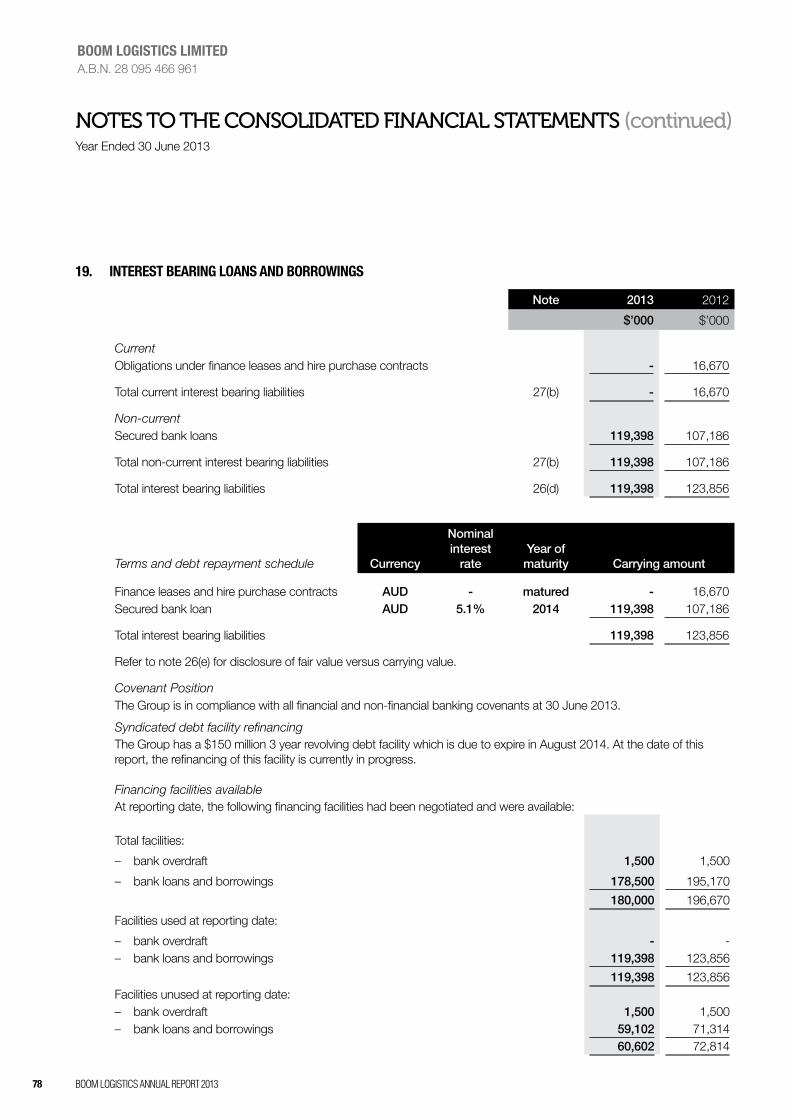
BOOM LOgistics AnnuAL RepORt 201378
Boom LogIstIcs LImItedA.B.N. 28 095 466 961
19. Interest BearIng Loans and BorrowIngs
Note 2013 2012
$’000 $’000
CurrentObligations under finance leases and hire purchase contracts - 16,670
Total current interest bearing liabilities 27(b) - 16,670
Non-currentSecured bank loans 119,398 107,186
Total non-current interest bearing liabilities 27(b) 119,398 107,186
Total interest bearing liabilities 26(d) 119,398 123,856
Terms and debt repayment schedule Currency
Nominal interest
rateYear of maturity Carrying amount
Finance leases and hire purchase contracts AUD - matured - 16,670 Secured bank loan AUD 5.1% 2014 119,398 107,186
Total interest bearing liabilities 119,398 123,856
Refer to note 26(e) for disclosure of fair value versus carrying value.
Covenant PositionThe Group is in compliance with all financial and non-financial banking covenants at 30 June 2013.
Syndicated debt facility refinancingThe Group has a $150 million 3 year revolving debt facility which is due to expire in August 2014. At the date of this report, the refinancing of this facility is currently in progress.
Financing facilities availableAt reporting date, the following financing facilities had been negotiated and were available:
Total facilities:
– bank overdraft 1,500 1,500
– bank loans and borrowings 178,500 195,170
180,000 196,670
Facilities used at reporting date:
– bank overdraft - - – bank loans and borrowings 119,398 123,856
119,398 123,856 Facilities unused at reporting date:– bank overdraft 1,500 1,500 – bank loans and borrowings 59,102 71,314
60,602 72,814
noTes To The ConsolIDaTeD fInanCIal sTaTemenTs (continued)Year Ended 30 June 2013

79
Boom LogIstIcs LImItedA.B.N. 28 095 466 961
BOOM LOgistics AnnuAL RepORt 2013
Note 2013 2012
$’000 $’000
19. Interest BearIng Loans and BorrowIngs (contInued)
Assets pledged as securityFixed and floating charges are held over all of the assets of the Group including the following financial assets and plant and equipment:
Current– Cash at bank and in hand 10 3,572 10,102 – Trade and other receivables 11 55,440 69,948 – Assets classified as held for sale 14 10,899 3,282 – Assets classified as held for sale under lease 14 - 1,321
Total current assets pledged as security 69,911 84,653
Non current– Plant and equipment 336,678 164,765 – Plant and equipment under lease - 177,525
Total non-current assets pledged as security 15 336,678 342,290
Total value of assets pledged as security 406,589 426,943
20. provIsIons
Employee related provisions 13,390 13,567 Property leases 65 222 Legal - 250 Restructuring 3,727 -
Total provisions 17,182 14,039
Current 15,404 13,092 Non-current 1,778 947
17,182 14,039
Movements in each class of provision during the financial year, other than employee leave entitlements, are set out below:
RestructuringLegal
matterProperty
lease Total
$’000 $’000 $’000 $’000
At 1 July - 250 222 472 Arising during the year 6,753 - 65 6,818 Utilised (3,026) (100) (222) (3,348)Unused amounts reversed - (150) - (150)
At 30 June 3,727 - 65 3,792
noTes To The ConsolIDaTeD fInanCIal sTaTemenTs (continued)Year Ended 30 June 2013

BOOM LOgistics AnnuAL RepORt 201380
Boom LogIstIcs LImItedA.B.N. 28 095 466 961
20. provIsIons (contInued)
Employee related provisions
Employee related provisions include accrued annual leave, vesting sick leave, rostered days off, long service leave and bonus provisions.
Property leasesThe provision for property leases includes make good provisions in respect of the Boom Sherrin leased properties.
RestructuringDuring the financial year, several restructuring programs were undertaken throughout the Group. Restructuring costs incurred during the year totalled $6.753 million, of which $3.727 million had yet to be utilised at year end. The restructuring costs relate to employee termination benefits based on employment contracts, surplus leased spaces and other restructuring expenses. Except for the surplus leased space provisions, the remaining restructuring provision is expected to be fully utilised by the first half of FY2014.
2013 2012
$’000 $’000
21. derIvatIve fInancIaL Instruments
Current liabilitiesForward foreign exchange contracts – cash flow hedges - 870 Interest rate swap contracts – cash flow hedges 332 -
Total current derivative financial instruments 332 870
Non-current liabilitiesInterest rate swap contracts – cash flow hedges 1,019 1,513
Instruments used by the GroupThe Group is party to derivative financial instruments in the normal course of business in order to hedge exposure to fluctuations in interest and foreign exchange rates in accordance with the Group’s financial risk management policies (refer to note 4).
Forward foreign exchange contracts – cash flow hedgesThe Group imports plant and equipment from various overseas countries. In order to protect against exchange rate movements, the Group enters into forward exchange contracts to purchase the foreign currencies. These contracts are hedging highly probable forecasted purchases and are timed to mature when payments are scheduled to be made.
The portion of the gain or loss on the hedging instrument that is determined to be an effective hedge is recognised directly in equity. When the cash flows occur, the Group adjusts the initial measurement of the component recognised in the balance sheet by the related amount deferred in equity.
There was no hedge ineffectiveness in the current or prior year.
Interest rate swap contracts – cash flow hedgesSecured bank loans of the group are currently charged at variable interest rates. In order to protect from exposure to variability in interest rates, the Group has entered into interest rate swap contracts under which it is obliged to receive interest at variable rates and to pay interest at fixed rates.
Swaps currently in place cover approximately 84% (2012: 92%) of the variable loan principal outstanding. The fixed interest rates range between 3.9% and 4.0% (2012: between 3.9% and 4.0%) and the variable rates are between 2.8% and 3.6% (2012: between 3.6% and 4.7%). The contracts are settled on a net basis and coincide with the dates on which interest is payable on the underlying debt.
noTes To The ConsolIDaTeD fInanCIal sTaTemenTs (continued)Year Ended 30 June 2013
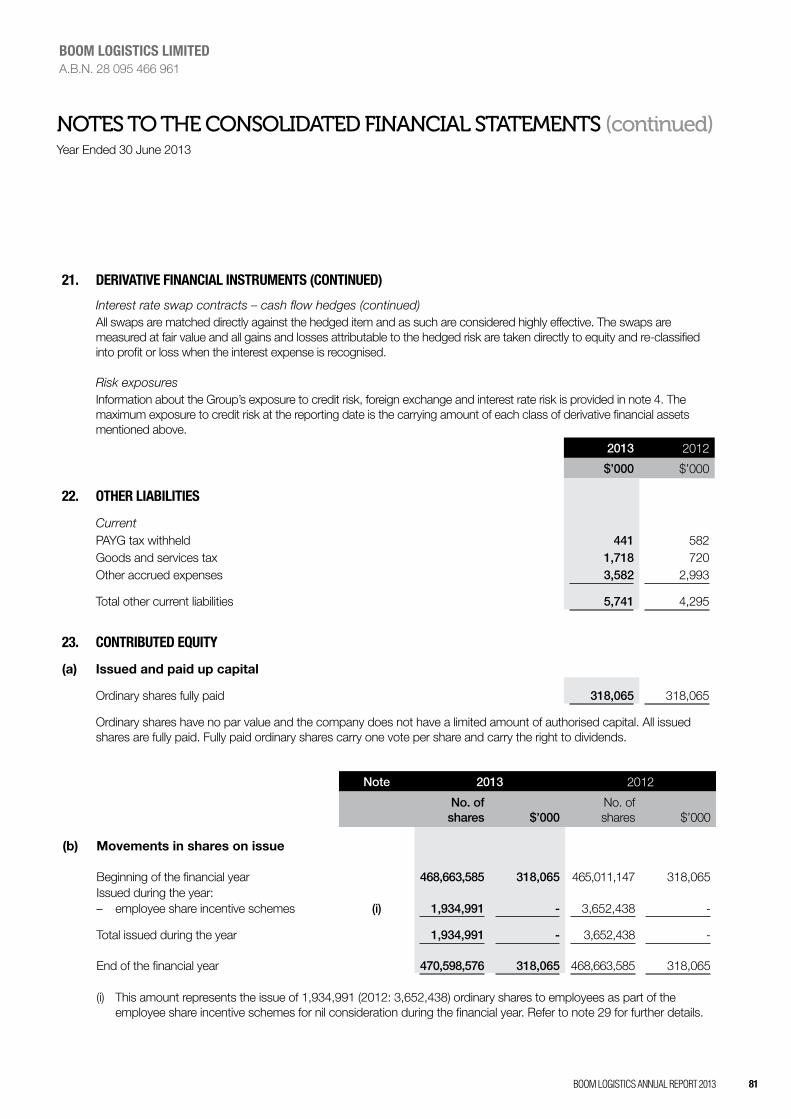
81
Boom LogIstIcs LImItedA.B.N. 28 095 466 961
BOOM LOgistics AnnuAL RepORt 2013
21. derIvatIve fInancIaL Instruments (contInued)
Interest rate swap contracts – cash flow hedges (continued)All swaps are matched directly against the hedged item and as such are considered highly effective. The swaps are measured at fair value and all gains and losses attributable to the hedged risk are taken directly to equity and re-classified into profit or loss when the interest expense is recognised.
Risk exposuresInformation about the Group’s exposure to credit risk, foreign exchange and interest rate risk is provided in note 4. The maximum exposure to credit risk at the reporting date is the carrying amount of each class of derivative financial assets mentioned above.
2013 2012
$’000 $’000
22. other LIaBILItIes
CurrentPAYG tax withheld 441 582 Goods and services tax 1,718 720 Other accrued expenses 3,582 2,993
Total other current liabilities 5,741 4,295
23. contrIButed equIty
(a) Issued and paid up capital
Ordinary shares fully paid 318,065 318,065
Ordinary shares have no par value and the company does not have a limited amount of authorised capital. All issued shares are fully paid. Fully paid ordinary shares carry one vote per share and carry the right to dividends.
Note 2013 2012
No. of shares $’000
No. of shares $’000
(b) Movements in shares on issue
Beginning of the financial year
468,663,585 318,065
465,011,147 318,065 Issued during the year:– employee share incentive schemes (i) 1,934,991 - 3,652,438 -
Total issued during the year 1,934,991 - 3,652,438 -
End of the financial year
470,598,576 318,065
468,663,585 318,065
(i) This amount represents the issue of 1,934,991 (2012: 3,652,438) ordinary shares to employees as part of the employee share incentive schemes for nil consideration during the financial year. Refer to note 29 for further details.
noTes To The ConsolIDaTeD fInanCIal sTaTemenTs (continued)Year Ended 30 June 2013

BOOM LOgistics AnnuAL RepORt 201382
Boom LogIstIcs LImItedA.B.N. 28 095 466 961
Note 2013 2012 $’000 $’000
24. retaIned earnIngs
Balance at the beginning of year (1,670) (21,375)Net (loss) / profit for the year (2,476) 19,705
Total (4,146) (1,670)Dividends paid 9(a) - -
Balance at end of year (4,146) (1,670)
25. reserves
Employee equity benefits reserveBalance at the beginning of year 613 741 Share based payments (i) (271) (128)
Balance at end of year 342 613
Cash flow hedge reserveBalance at the beginning of year (1,269) - Revaluation (ii) (31) (1,758)Deferred tax (310) 715 Transfer to profit and loss 663 (226)
Balance at end of year (947) (1,269)
Total reserves (605) (656)
(i) The employee equity benefits reserve is used to record the value of share based payments to employees, including key management personnel, as part of their remuneration. Refer to note 29 for further details of these plans.
(ii) The cash flow hedge reserve is used to record the portion of the gain or loss on a hedging instrument in a cash flow hedge that is determined to be an effective hedge. The cumulative deferred gain or loss on the hedge is recognised in profit or loss when the hedged transaction impacts the profit or loss, or is included as a basis adjustment to the non-financial hedged item.
noTes To The ConsolIDaTeD fInanCIal sTaTemenTs (continued)Year Ended 30 June 2013

83
Boom LogIstIcs LImItedA.B.N. 28 095 466 961
BOOM LOgistics AnnuAL RepORt 2013
Note 2013 2012
$’000 $’000
26. fInancIaL Instruments
(a) Credit risk
Exposure to credit riskThe carrying amount of the Group’s financial assets represents the maximum credit exposure. The Group’s maximum exposure to credit risk at the reporting date was:
Cash and cash equivalents 10 3,572 10,102 Trade and other receivables 11 55,440 69,948
59,012 80,050 The Group’s trade receivables only relate to Australian customers.
The Group has one customer on several contracts operating in various locations that owed more than $10 million or 19% of the total trade receivables as at 30 June 2013.
Impairment lossesTrade receivables are non-interest bearing and are generally on 30 – 60 day terms. An allowance for impairment loss is recognised when there is objective evidence that an individual trade receivable is impaired. A net impairment decrease of $599,000 (2012: $877,000) has been recognised by the Group in the current year. These amounts have been included in other expenses in the Consolidated Income Statement.
Movements in the allowance for impairment losses were as follows:
Balance at 1 July 1,286 2,163 Impairment loss recognised 339 53 Amounts written-off and/or written back (938) (930)
Balance at 30 June 11 687 1,286
At 30 June, the aging analysis of trade receivables is as follows:
Total Current 31–60 days 31–60 days +61 days +61 days $’000 $’000 $’000 $’000 $’000 $’000
PDNI* (i) CI^ (ii) PDNI* (i) CI^ (ii)
2013 53,706 41,981 3,611 - 7,427 687
2012 66,763 45,966 11,489 285 7,587 1,436
* Past due not impaired (‘PDNI’)^ Considered impaired (‘CI’)
(i) Based upon the credit history of these classes of trade receivables, it is expected that these amounts will be received
(ii) As at 30 June 2013, current trade receivables of the Group with a nominal value of $687,000 (2012: $1,721,000) were considered impaired. Of this amount, a provision of $687,000 (2012: $1,286,000) was recognised as it was assessed that a portion of the receivables is expected to be recovered.
Due to the short term nature of these receivables, their carrying amount is assumed to approximate their fair value. The maximum exposure to credit risk at reporting date is the carrying amount of each class of receivables mentioned above. There are no receivables that would otherwise be past due or impaired whose terms have been renegotiated.
noTes To The ConsolIDaTeD fInanCIal sTaTemenTs (continued)Year Ended 30 June 2013

BOOM LOgistics AnnuAL RepORt 201384
Boom LogIstIcs LImItedA.B.N. 28 095 466 961
26. fInancIaL Instruments (contInued)
(b) Liquidity risk
The tables below analyse the Group’s financial liabilities and net and gross settled derivative financial instruments into relevant maturity groupings based on the remaining period at the reporting date to the contractual maturity date. The amounts disclosed are the contractual undiscounted cash flows.
30 June 2013Carrying amount
Contractual cash flows
6 mths or less
6–12 mths 1–2 years 2–5 years More than 5 years
$’000 $’000 $’000 $’000 $’000 $’000 $’000
Non-derivative financial liabilities
Trade and other payables 20,390 (20,390) (20,390) - - - -
Secured bank loans 119,398 (126,294) (3,047) (3,047) (120,200) - -
Derivative financial liabilities
Interest rate swaps – net settled 1,351 (1,351) (332) - (1,019) - -
141,139 (148,035) (23,769) (3,047) (121,219) - -
30 June 2012Carrying amount
Contractual cash flows
6 mths or less
6–12 mths 1–2 years 2–5 years More than 5 years
$’000 $’000 $’000 $’000 $’000 $’000 $’000
Non-derivative financial liabilities
Trade and other payables 36,847 (36,847) (36,847) - - - -
Finance leases and hire purchase contracts 16,670 (17,705) (13,171) (4,534) - - -
Secured bank loans 107,186 (118,415) (2,807) (2,807) (5,615) (107,186) -
Derivative financial liabilities
Forward exchange contracts used for hedging purchases 870 (870) (870) - - - -
Interest rate swaps – net settled 1,513 (1,513) - - (684) (829) -
163,086 (175,350) (53,695) (7,341) (6,299) (108,015) -
noTes To The ConsolIDaTeD fInanCIal sTaTemenTs (continued)Year Ended 30 June 2013

85
Boom LogIstIcs LImItedA.B.N. 28 095 466 961
BOOM LOgistics AnnuAL RepORt 2013
26. fInancIaL Instruments (contInued)
(c) Market risk
Foreign exchange risk
The Group imports fixed assets from various overseas countries. In order to protect against exchange rate movements, the Group has entered into forward exchange contracts to purchase the foreign currencies. These contracts are hedging highly probable forecasted purchases and they are timed to mature when payments are scheduled to be made. The risk is monitored using sensitivity analysis and cash flow forecasting and the cash flows are expected to occur at various dates within 12 months from the balance date.
The forward foreign currency contracts are considered to be fully effective cash flow hedges as they are matched against fixed asset purchases and any gain or loss on the contracts is taken directly to equity. When the asset is delivered, the amount recognised in equity is transferred to the fixed asset account in the balance sheet. In calculating the effectiveness of the forward foreign currency contracts, the forward exchange rate is adjusted to exclude the interest rate differential implicit in the forward exchange rate.
The Group’s exposure to foreign currency risk at reporting date, expressed in Australian dollars, was as follows:
2013 €uro
2012 €uro
$’000 $’000
Trade payables - 12,053 Forward exchange contracts– buy foreign currency (cash flow hedges) - 870
Sensitivity analysis for currency risk
A 10 percent (2012: 10 percent) strengthening of the Australian dollar against the following currencies at 30 June would have increased /(decreased) equity and profit or loss by the amounts shown below. This analysis assumes that all other variables, in particular interest rates, remain constant.
Equity Profit or Loss
$’000 $’000
2013 €uro - -
- - 2012 €uro 973 -
973 -
A 10 percent (2012: 10 percent) weakening of the Australian dollar against the above currencies at 30 June would have had the equal but opposite effect on the above currencies to the amounts shown above, on the basis that all other variables remain constant.
noTes To The ConsolIDaTeD fInanCIal sTaTemenTs (continued)Year Ended 30 June 2013

BOOM LOgistics AnnuAL RepORt 201386
Boom LogIstIcs LImItedA.B.N. 28 095 466 961
26. fInancIaL Instruments (contInued)
(d) Interest rate risk
Profile
At the reporting date, the interest rate profile of the Group’s interest bearing financial instruments were:
Carrying amount
Note 2013 2012
$’000 $’000
Fixed rate instrumentsFinancial liabilities (i) (100,000) (116,670)
(100,000) (116,670)Variable rate instrumentsFinancial assets – cash at bank and on hand 10 3,572 10,102 Financial liabilities (i) (19,398) (7,186)
(15,826) 2,916
(i) Fixed and variable rate instruments represent interest bearing loans and borrowings of $119,398,000 (2012: $123,856,000) per note 19.
The Group’s main interest rate risk arises from long-term borrowings. Borrowings issued at variable rates expose the Group to cash flow interest rate risk. The Group’s fixed rate borrowings and receivables are carried at amortised cost. They are therefore not subject to interest rate risk as defined in AASB 7.
The Group is exposed to interest rate risk when funds are borrowed at floating interest rates. This risk is managed by taking into consideration the current and expected future debt profile, expectations regarding future interest rate movements and the potential to hedge against negative outcomes by entering into interest rate swaps. Such interest rate swaps have the economic effect of converting borrowings from floating rates to fixed rates. Under the interest rate swaps, the Group agrees with other parties to exchange, at specific intervals (mainly monthly), the difference between fixed contract rates and floating rate interest amounts calculated by reference to the agreed notional principal amounts. The Group’s exposures to interest rates on financial liabilities are detailed in note 19.
Sensitivity analysis for interest rate risk
The Group does not account for any fixed rate financial assets and liabilities at fair value through profit or loss, and the Group does not designate derivatives (interest rate swaps) as hedging instruments under a fair value hedge accounting model. Therefore a change in interest rates at the reporting date would not affect profit and loss in respect of fixed rate instruments.
In respect of variable rate instruments, a change of 100 basis points up or down in interest rates would have decreased or increased the Group’s profit and loss by $158,000 (2012: $29,000).
(e) Fair values
Fair value estimationThe fair value of financial assets and liabilities must be estimated for recognition and measurement or for disclosure purposes.
The Group holds no financial instruments for trading purposes.
The carrying value less impairment allowance of trade receivables and payables are assumed to approximate their fair values due to their short-term nature. The fair value of financial liabilities for disclosure purposes is estimated by discounting the future contractual cash flows at the current market interest rate that is available to the Group for similar financial instruments.
noTes To The ConsolIDaTeD fInanCIal sTaTemenTs (continued)Year Ended 30 June 2013

87
Boom LogIstIcs LImItedA.B.N. 28 095 466 961
BOOM LOgistics AnnuAL RepORt 2013
26. fInancIaL Instruments (contInued)
(e) Fair values (continued)
The fair values of forward exchange contracts (designated as cash flow hedges) are determined using forward exchange market rates at the reporting date.
The fair values of interest rate swap contracts (designated as cash flow hedges) are determined using forward interest market rates at the reporting date.
Fair values versus carrying amountsThe fair value of all borrowings equals their carrying amount at 30 June 2013. The Group’s fixed rate instruments attract interest at a rate that is consistent with current market rates.
Fair value hierarchyThe table below analyses financial instruments carried at fair value, by valuation method. The different levels have been defined as follows:
Level 1 – quoted prices (unadjusted) in active markets for identical assets or liabilities.Level 2 – inputs other than quoted prices included within Level 1 that are observable for the asset or liability, either
directly (ie. as prices) or indirectly (ie. derived from prices).Level 3 – inputs for the asset or liability that are not based on observable market data (unobservable inputs).
Level 1 Level 2 Level 3 Total
$’000 $’000 $’000 $’000
30 June 2013
Financial liabilities– Interest rate swap contracts - 1,351 - 1,351
- 1,351 - 1,351 30 June 2012
Financial liabilities– Foreign exchange contracts - 870 - 870 – Interest rate swap contracts - 1,513 - 1,513
- 2,383 - 2,383
noTes To The ConsolIDaTeD fInanCIal sTaTemenTs (continued)Year Ended 30 June 2013

BOOM LOgistics AnnuAL RepORt 201388
Boom LogIstIcs LImItedA.B.N. 28 095 466 961
Note 2013 2012
$’000 $’000
27. commItments
(a) Operating leases commitmentsThe Group has entered into commercial leases on certain plant and equipment, motor vehicles and property. These leases have terms ranging from 1 to 10 years.
Minimum lease payments– within one year 12,604 10,577 – after one year but not more than five years 15,769 14,904 – more than five years 2,386 2,362
Aggregate operating lease expenditure contracted for at reporting date 30,759 27,843
(b) Interest bearing loans and borrowings commitments
The Group has interest bearing loans and borrowings for various items of plant and equipment for periods of between 1 to 5 years.– within one year 6,094 23,318 – after one year but not more than five years 120,200 112,801 – more than five years - -
Total minimum payments 126,294 136,119 – future finance charges (6,896) (12,263)
Net liability 119,398 123,856
– current liability 19 - 16,670 – non-current liability 19 119,398 107,186
119,398 123,856
The Company has provided guarantees in respect of interest bearing loans and borrowings as disclosed in note 32.
(c) Capital commitmentsCapital expenditure contracted for at reporting date but not recognised as liabilities are as follows:
Plant and equipment– within one year 3,050 20,322 – after one year but not more than five years - - – more than five years - -
3,050 20,322
Intangible assets – software development costs– within one year - 1,838 – after one year but not more than five years - - – more than five years - -
- 1,838
noTes To The ConsolIDaTeD fInanCIal sTaTemenTs (continued)Year Ended 30 June 2013

89
Boom LogIstIcs LImItedA.B.N. 28 095 466 961
BOOM LOgistics AnnuAL RepORt 2013
28. contIngencIes
There are no contingent assets and liabilities identified at 30 June 2013.
2013 2012
$’000 $’000
29. empLoyee BenefIts
(a) Employee benefits
The aggregate employee benefit liability is comprised of:– accrued salaries, wages and on costs 2,906 2,886 – provisions (current) 14,534 12,620 – provisions (non-current) 1,094 947
18,534 16,453
(b) Employee incentive schemes
Three employee incentive schemes were established by Boom Logistics Limited to assist in attracting, retaining and motivating key employees as follows: – Exempt Share Plan (ESP); – Employee Share Trust (EST); and– Executive Investment Trust (EIT).
The terms and conditions of the schemes are summarised as follow:
Exempt share plan (ESP)Under this scheme, all permanent employees (excluding directors and executives) of Boom Logistics Limited with twelve months continuous service were offered 1,000 ordinary shares in October 2003 and $1,000 worth of ordinary shares in October/November 2004 in Boom Logistics Limited for nil consideration. The ordinary shares issued were held in trust for the requisite three years restrictive period or released earlier in the event of cessation of employment. The ordinary shares issued rank equally with and have the same rights as other fully paid ordinary shares of Boom Logistics Limited. This scheme has subsequently been discontinued with only the ordinary shares issued in previous financial years remaining in the share plan.
Employee share trust (EST)Under this scheme, certain employees (excluding non-executive directors) approved by the Board of Directors are offered ordinary shares in Boom Logistics Limited by way of Share Units issued by the Share Plan Trustee. The Share Units are funded by way of an interest free loan provided by the Share Plan Trustee. The ordinary shares issued rank equally with and have the same rights as other fully paid ordinary shares of Boom Logistics Limited.
In June 2011, the Board of Directors approved the establishment of a Key Employee Retention Program (KERP). Participation in the program is at the discretion of the Board of Directors, on recommendation by the Managing Director. Directors and executives are not eligible for this program. KERP will be administered under the Employee Share Trust with the offer of ordinary shares in Boom Logistics Limited having the same terms and conditions, except for the vesting conditions which is only limited to a three year continuous service period.
The fair value of shares issued under the employee share incentive schemes is determined based on the 5 day volume weighted average market price at grant date.
Executive investment trust (EIT)Under this scheme, senior executives are invited to join the EIT and may contribute any part of their remuneration into the EIT for investment purposes. There are no performance conditions associated with this scheme.
noTes To The ConsolIDaTeD fInanCIal sTaTemenTs (continued)Year Ended 30 June 2013

BOOM LOgistics AnnuAL RepORt 201390
Boom LogIstIcs LImItedA.B.N. 28 095 466 961
29. empLoyee BenefIts (contInued)
(b) Employee incentive schemes (continued)Information with respect to the number of ordinary shares issued and allocated under the employee share incentive schemes is as follows:
2013Number of
shares
2012Number of
shares
Balance at beginning of year 9,860,560 6,676,643 – issued for nil consideration (including unallocated shares in the
employee share schemes allocated during the year) 4,491,109 4,985,322 – sold / transferred during the year (1,184) (110,319)– forfeited during the year (2,408,252) (1,691,086)
Balance at end of year 11,942,233 9,860,560
(c) Expenses/(income) arising from share based payment transactions
Total expenses arising from share based payment transactions recognised during the period as part of employee benefit expense were as follows:
Note 2013 2012
$’000 $’000
Shares issued under employee share schemes 25 (271) (128)
(271) (128)
noTes To The ConsolIDaTeD fInanCIal sTaTemenTs (continued)Year Ended 30 June 2013

91
Boom LogIstIcs LImItedA.B.N. 28 095 466 961
BOOM LOgistics AnnuAL RepORt 2013
30. key management personneL
(a) Details of directors
(i) Non-executive directorsJohn Robinson Chairman (non-executive)Fiona Bennett Director (non-executive)Howard Critchley Director (non-executive) (appointed 7 March 2013)Dr. Huw Davies Director (non-executive) (retired 23 October 2012)Terrence Francis Director (non-executive)Terence Hebiton Director (non-executive)
(ii) Executive directorsBrenden Mitchell Managing Director and Chief Executive Officer
(b) Details of other key management personnel
The following persons had authority and responsibility for planning, directing and controlling the activities of the Group, directly or indirectly, during the year:
Iona MacPherson Chief Financial Officer and Company SecretaryRosanna Hammond General Manager – Human ResourcesPaul Martinez Chief Information Officer and Director of StrategyTony Spassopoulos Director of Sales and MarketingTerese Withington General Manager – Boom Sherrin
2013 2012
$ $
(c) Summarised compensation of key management personnel
Summary of key management personnel compensation in the following categories is as follows:
Short-term employee benefits 3,462,558 2,862,254 Post employment benefits 206,777 232,243 Other long term benefits 66,812 48,413 Termination benefits - - Share based payments 40,910 193,961
Total compensation 3,777,057 3,336,871
Refer to the Remuneration Report in the Directors’ Report for detailed compensation disclosure on key management personnel.
noTes To The ConsolIDaTeD fInanCIal sTaTemenTs (continued)Year Ended 30 June 2013
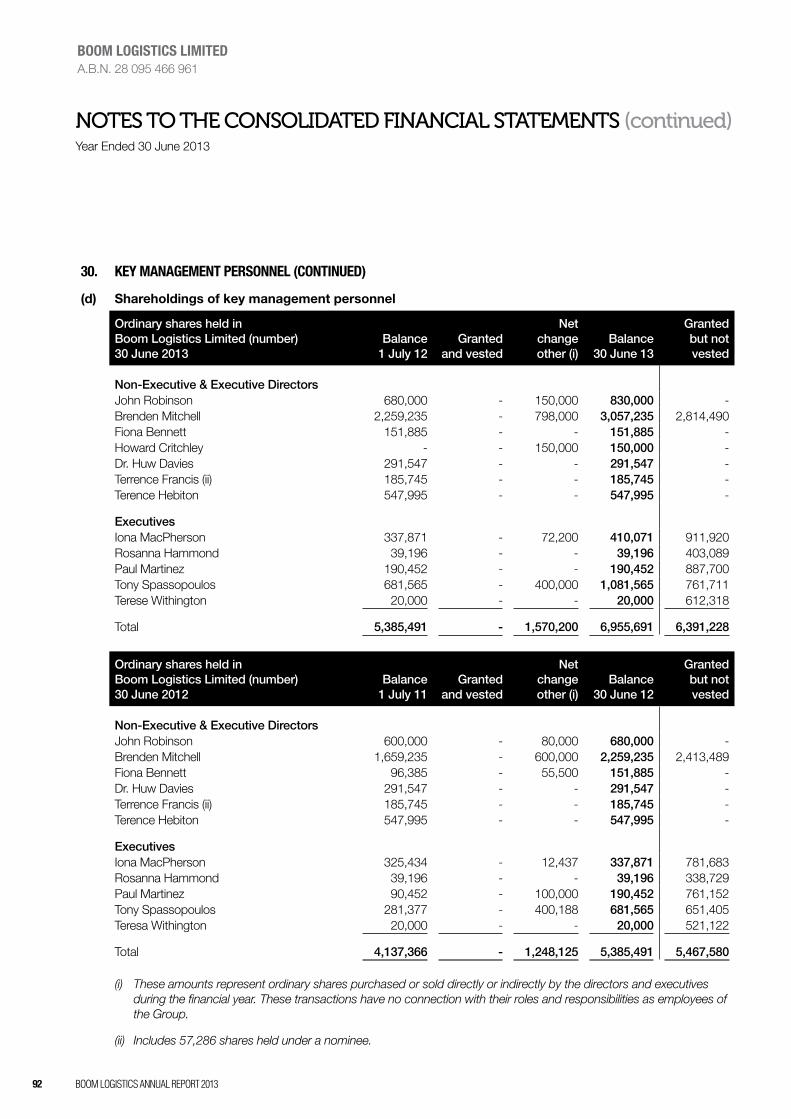
BOOM LOgistics AnnuAL RepORt 201392
Boom LogIstIcs LImItedA.B.N. 28 095 466 961
30. key management personneL (contInued)
(d) Shareholdings of key management personnel
Ordinary shares held in Boom Logistics Limited (number) 30 June 2013
Balance 1 July 12
Granted and vested
Net change other (i)
Balance 30 June 13
Granted but not vested
Non-Executive & Executive DirectorsJohn Robinson 680,000 - 150,000 830,000 - Brenden Mitchell 2,259,235 - 798,000 3,057,235 2,814,490 Fiona Bennett 151,885 - - 151,885 - Howard Critchley - - 150,000 150,000 - Dr. Huw Davies 291,547 - - 291,547 - Terrence Francis (ii) 185,745 - - 185,745 - Terence Hebiton 547,995 - - 547,995 -
ExecutivesIona MacPherson 337,871 - 72,200 410,071 911,920 Rosanna Hammond 39,196 - - 39,196 403,089 Paul Martinez 190,452 - - 190,452 887,700 Tony Spassopoulos 681,565 - 400,000 1,081,565 761,711 Terese Withington 20,000 - - 20,000 612,318
Total 5,385,491 - 1,570,200 6,955,691 6,391,228
Ordinary shares held in Boom Logistics Limited (number) 30 June 2012
Balance 1 July 11
Granted and vested
Net change other (i)
Balance 30 June 12
Granted but not vested
Non-Executive & Executive DirectorsJohn Robinson 600,000 - 80,000 680,000 - Brenden Mitchell 1,659,235 - 600,000 2,259,235 2,413,489 Fiona Bennett 96,385 - 55,500 151,885 - Dr. Huw Davies 291,547 - - 291,547 - Terrence Francis (ii) 185,745 - - 185,745 - Terence Hebiton 547,995 - - 547,995 -
ExecutivesIona MacPherson 325,434 - 12,437 337,871 781,683 Rosanna Hammond 39,196 - - 39,196 338,729 Paul Martinez 90,452 - 100,000 190,452 761,152 Tony Spassopoulos 281,377 - 400,188 681,565 651,405 Teresa Withington 20,000 - - 20,000 521,122
Total 4,137,366 - 1,248,125 5,385,491 5,467,580
(i) These amounts represent ordinary shares purchased or sold directly or indirectly by the directors and executives during the financial year. These transactions have no connection with their roles and responsibilities as employees of the Group.
(ii) Includes 57,286 shares held under a nominee.
noTes To The ConsolIDaTeD fInanCIal sTaTemenTs (continued)Year Ended 30 June 2013

93
Boom LogIstIcs LImItedA.B.N. 28 095 466 961
BOOM LOgistics AnnuAL RepORt 2013
30. key management personneL (contInued)
(d) Shareholdings of key management personnel (continued)
All equity transactions with key management personnel other than those arising from the exercise of remuneration options have been entered into under terms and conditions no more favourable than those the Group would have adopted if dealing at arm’s length.
(e) Loans to key management personnel
Details of loans made to key management personnel of the Group, including their personally related parties, are set out below.
Aggregates for key management personnel Balance
1 July Balance 30 June
Interest charged
Interest not
charged
Number in group 30 June
$ $ $ $
2013 - - - - -2012 - - - - -
In 2013, there were no loans to individuals that exceeded $100,000 at any time.
Loans to key management personnel are for a period of 1 year repayable in monthly instalments, at ni interest rate and unsecured.
The amounts shown for interest not charged in the table above represents the amount of interest that would have been charged on an arm’s length basis.
No write-downs or allowance for doubtful receivables have been recognised in relation to any loans made to key management personnel.
(f) Other transactions and balances with key management personnel
No amounts were recognised at the reporting date in relation to other transactions with key management personnel.
noTes To The ConsolIDaTeD fInanCIal sTaTemenTs (continued)Year Ended 30 June 2013

BOOM LOgistics AnnuAL RepORt 201394
Boom LogIstIcs LImItedA.B.N. 28 095 466 961
31. reLated party dIscLosure
The consolidated financial statements include the financial statements of Boom Logistics Limited and the subsidiaries listed in the following table.
Name Country of incorporation
Equity interest Investment
2013 2012 2013 2012
% % $’000 $’000
James Equipment Pty Ltd Australia 100 100 - - Sherrin Hire Pty Ltd Australia 100 100 60,598 60,598 Boom Logistics (QLD) Pty Ltd Australia 100 100 15,896 15,896 Boom Logistics (VIC) Pty Ltd Australia 100 100 4,021 4,021
Total investment in subsidiaries 80,515 80,515
Boom Logistics Limited is the ultimate parent company.
Details relating to key management personnel, including remuneration paid, are included in note 30.
Sales to and purchases from related parties are made at arm’s length both at normal market prices and on normal commercial terms. Outstanding balances at year end are unsecured.
Terms and conditions of the tax funding arrangement are set out in note 3(h).2013 2012
The following transactions occurred with related parties: $ $
Parent entity
Sale of servicesHire of lifting equipment to subsidiaries 537,876 511,350
Purchase of goods and servicesHire of lifting equipment from subsidiaries/other related parties 2,077,295 4,703,075
Tax consolidation legislationCurrent tax payable assumed from wholly-owned tax consolidated entities 10,694,374 8,810,366
Other revenue and expensesInterest charged to/(from) subsidiaries 346,561 (147,960)Dividend income from subsidiaries - -
Loans to/from related parties Subsidiaries – receivable / (payable) 12,964,346 1,129,144
No allowance for impairment of debts has been raised in relation to any outstanding balances, and no expense has been recognised in respect of bad or impaired debts due from related parties.
GuaranteesThe Company has provided guarantees in respect of:
Finance leases and hire purchase contracts - 5,103,626
noTes To The ConsolIDaTeD fInanCIal sTaTemenTs (continued)Year Ended 30 June 2013

95
Boom LogIstIcs LImItedA.B.N. 28 095 466 961
BOOM LOgistics AnnuAL RepORt 2013
32. deed of cross guarantee
Pursuant to Class Order 98/1418 (as amended), the wholly owned subsidiaries listed below are relieved from the Corporations Act 2001 requirements for preparation, audit and lodgement of financial reports and directors’ report.
It is a condition of the Class Order that Boom Logistics Limited and each of the subsidiaries enter into a Deed of Cross Guarantee. The effect of the Deed is that Boom Logistics Limited guarantees to each creditor payment in full of any debt in the event of winding up of any of the subsidiaries under certain provisions of the Corporations Act 2001. The subsidiaries have also given similar guarantees in the event that Boom Logistics Limited is wound up.
The subsidiaries subject to the Deed are:– Sherrin Hire Pty Ltd (party to the Deed on 6 December 2005);– James Equipment Pty Ltd (party to the Deed on 3 November 2006 by virtue of a Deed of Assumption);– Boom Logistics (QLD) Pty Ltd (party to the Deed on 23 November 2007 by virtue of a Deed of Assumption); and
together with Boom Logistics Limited, represent a “Closed Group” for the purposes of the Class Order.
The consolidated income statement and balance sheet of the entities that are members of the “Closed Group” are as follows:
CLOSED GROUP
2013 2012
$’000 $’000
Consolidated Income Statement
Revenue 330,096 342,634
Salaries and employee benefits expense (156,302) (151,639)Equipment service and supplies expense (86,524) (91,746)Operating lease expense (12,108) (11,375)Other expenses (21,033) (27,865)Restructuring expense (6,753) (1,173)Depreciation and amortisation expense (29,305) (27,744)Impairment expense (9,584) - Financing expenses (10,694) (11,254)
(Loss)/profit before income tax (2,207) 19,838 Income tax expense 589 (4,465)
Net (loss)/profit for the year (1,618) 15,373 Retained earnings at the beginning of the year (11,865) (27,238)
Retained losses at the end of the year (13,483) (11,865)
Consolidated Statement of Comprehensive Income
(Loss)/profit for the year (1,618) 15,373
Other comprehensive incomeCash flow hedges recognised in equity 322 (1,269)
Other comprehensive loss for the year, net of tax 322 (1,269)
Total comprehensive (loss)/income for the year (1,296) 14,104
noTes To The ConsolIDaTeD fInanCIal sTaTemenTs (continued)Year Ended 30 June 2013

BOOM LOgistics AnnuAL RepORt 201396
Boom LogIstIcs LImItedA.B.N. 28 095 466 961
CLOSED GROUP
2013 2012
$’000 $’000
32. deed of cross guarantee (contInued)
Consolidated Balance Sheet
Current assetsCash and cash equivalents 3,395 9,991 Trade and other receivables 54,103 67,897 Inventories 480 276 Prepayments and other current assets 2,843 3,523 Assets classified as held for sale 10,349 4,603 Income tax receivable 7,700 11,111
Total current assets 78,870 97,401
Non-current assetsInvestments 4,021 4,021 Plant and equipment 328,405 330,559 Intangible assets 70,729 70,308
Total non-current assets 403,155 404,888
Total assets 482,025 502,289
Current liabilitiesTrade and other payables 20,247 36,577 Interest bearing loans and borrowings - 16,588 Derivative financial instruments 332 870 Provisions 15,349 12,481 Other liabilities 5,424 4,060
Total current liabilities 41,352 70,576
Non-current liabilitiesPayables 4,002 1,644 Interest bearing loans and borrowings 119,398 107,186 Provisions 1,086 946 Derivative financial instruments 1,019 1,513 Deferred tax liabilities 11,190 14,880
Total non-current liabilities 136,695 126,169
Total liabilities 178,047 196,745
Net assets 303,978 305,544
EquityContributed equity 318,065 318,065 Retained earnings (13,483) (11,865)Reserves (604) (656)
Total equity 303,978 305,544
noTes To The ConsolIDaTeD fInanCIal sTaTemenTs (continued)Year Ended 30 June 2013

97
Boom LogIstIcs LImItedA.B.N. 28 095 466 961
BOOM LOgistics AnnuAL RepORt 2013
2013 2012
$ $
33. audItor’s remuneratIon
During the year the following fees were paid or payable for services provided by KPMG:
Audit services– audit and review of financial statements 283,538 279,100
Taxation, due diligence and other services– taxation services 33,270 92,100 – due diligence and other services 18,161 -
Total taxation, due diligence and other services 51,431 92,100
Total remuneration of KPMG 334,969 371,200
34. events after the BaLance sheet date
Dividend On 13 August 2013, the directors of Boom Logistics Limited declared that no final dividend would be issued for the financial year ended 30 June 2013.
noTes To The ConsolIDaTeD fInanCIal sTaTemenTs (continued)Year Ended 30 June 2013

BOOM LOgistics AnnuAL RepORt 201398
Boom LogIstIcs LImItedA.B.N. 28 095 466 961
2013 2012
$’000 $’000
35. parent entIty fInancIaL InformatIon
(a) Summary financial information
The individual financial statements for the parent entity show the following aggregate amounts:
Statement of financial position
Current assets 63,893 73,619
Total assets 448,815 470,182
Current liabilities 34,789 51,706
Total liabilities 152,185 170,740
EquityContributed equity 318,065 318,065 Employee equity benefits reserve 342 613 Cash flow hedge reserve (946) (1,269)Retained losses (20,831) (17,967)
296,630 299,442
Net (loss)/profit after tax for the year (2,864) 13,137
Total comprehensive (loss)/income for the year (2,542) 11,544
(b) Capital commitments for the acquisition of property, plant and equipment
Plant and equipment– within one year - 12,544 – after one year but not more than five years - - – more than five years - -
- 12,544
(c) Guarantees entered into by the parent entity
The parent entity has entered into a Deed of Cross Guarantee with the effect that the parent entity guarantees debts in respect of its subsidiaries. Further details of the Deed of Cross Guarantee and the subsidiaries subject to the deed are disclosed in note 32.
Guarantees provided by the parent entity in respect of loans of subsidiaries are disclosed in note 31.
(d) Contingent liabilities of the parent entity
The parent entity did not have any contingent liabilities as at 30 June 2013 or 30 June 2012.
noTes To The ConsolIDaTeD fInanCIal sTaTemenTs (continued)Year Ended 30 June 2013
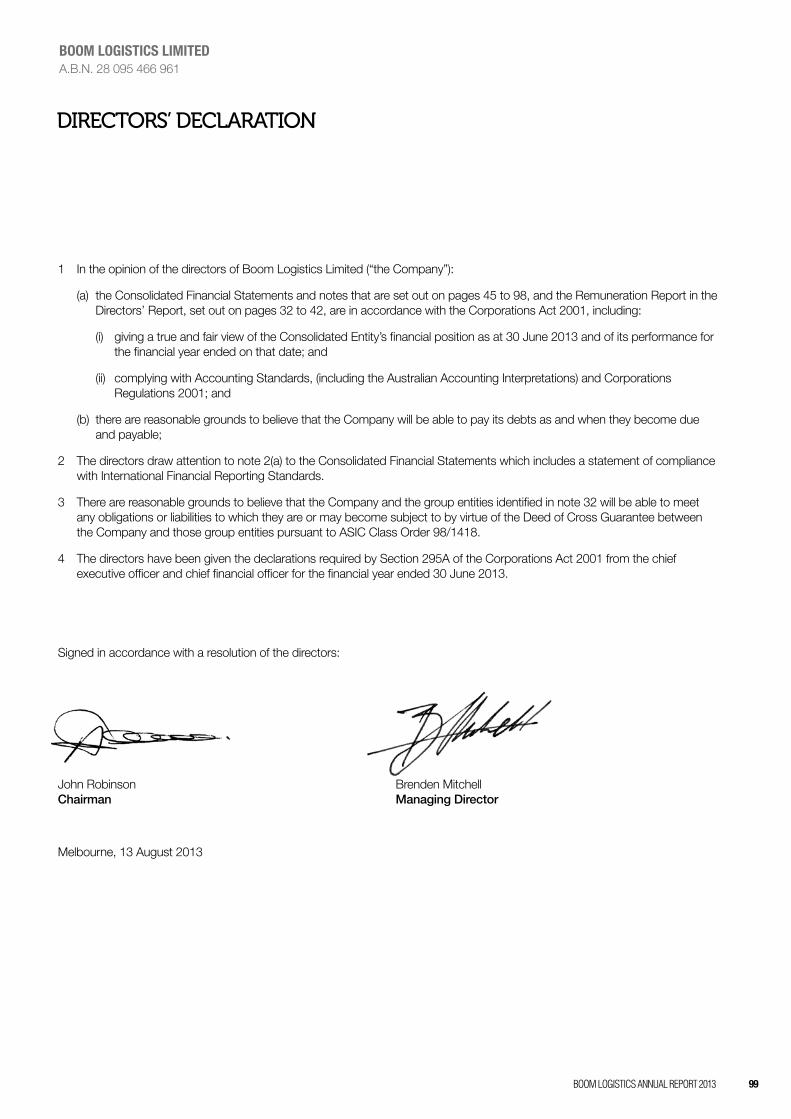
99
Boom LogIstIcs LImItedA.B.N. 28 095 466 961
BOOM LOgistics AnnuAL RepORt 2013
DIReCToRs’ DeClaRaTIon
1 In the opinion of the directors of Boom Logistics Limited (“the Company”):
(a) the Consolidated Financial Statements and notes that are set out on pages 45 to 98, and the Remuneration Report in the Directors’ Report, set out on pages 32 to 42, are in accordance with the Corporations Act 2001, including:
(i) giving a true and fair view of the Consolidated Entity’s financial position as at 30 June 2013 and of its performance for the financial year ended on that date; and
(ii) complying with Accounting Standards, (including the Australian Accounting Interpretations) and Corporations Regulations 2001; and
(b) there are reasonable grounds to believe that the Company will be able to pay its debts as and when they become due and payable;
2 The directors draw attention to note 2(a) to the Consolidated Financial Statements which includes a statement of compliance with International Financial Reporting Standards.
3 There are reasonable grounds to believe that the Company and the group entities identified in note 32 will be able to meet any obligations or liabilities to which they are or may become subject to by virtue of the Deed of Cross Guarantee between the Company and those group entities pursuant to ASIC Class Order 98/1418.
4 The directors have been given the declarations required by Section 295A of the Corporations Act 2001 from the chief executive officer and chief financial officer for the financial year ended 30 June 2013.
Signed in accordance with a resolution of the directors:
John Robinson Brenden Mitchell Chairman Managing Director
Melbourne, 13 August 2013

BOOM LOgistics AnnuAL RepORt 2013100
Boom LogIstIcs LImItedA.B.N. 28 095 466 961

101
Boom LogIstIcs LImItedA.B.N. 28 095 466 961
BOOM LOgistics AnnuAL RepORt 2013

BOOM LOgistics AnnuAL RepORt 2013102
Boom LogIstIcs LImItedA.B.N. 28 095 466 961
Additional information required by the Australian Stock Exchange Ltd and not shown elsewhere in this report is as follows. The information is current as at 10 July 2013.
(a) Distribution of Equity Securities
The number of shareholders, by size of holding, in each class of share are:
Ordinary shares
Number of holders
Number of shares
1 - 1,000 1,153 489,5631,001 - 5,000 2,013 5,715,4355,001 - 10,000 1,046 8,157,02710,001 - 100,000 2,479 89,280,053100,001 and over 428 366,956,498
7,119 470,598,576The number of shareholders holding less than a marketable parcel of shares are: 2,652 3,862,410
(b) Twenty Largest Shareholders
The names of the twenty largest holders of quoted shares are:
Listed ordinary shares
Number of shares
Percentage of ordinary
shares
1 Perennial Value Management 50,885,070 10.82 Invesco Australia 34,842,512 7.43 Schroder Investment Management 32,177,526 6.84 QIC Asset Management 23,072,279 4.95 Tribeca Investment Partners 22,807,462 4.86 Dimensional Fund Advisors 15,276,648 3.27 Boom Logistics Employee Share Plans 13,439,096 2.98 Legg Mason Asset Management Australia 10,789,922 2.39 Realindex Investments 9,356,535 2.010 Mr & Mrs Mark E Shannon 5,000,000 1.111 Mr & Mrs Hugh A Morris 3,823,194 0.812 Mr David G Greig 3,600,000 0.813 Mr Leslie W Ramsay 3,568,792 0.814 Mr Bernard F O’Neill 3,246,073 0.715 Perennial Growth Management 2,999,346 0.616 LSV Asset Management 2,652,200 0.617 Professor Kerry O Cox 2,500,000 0.518 Cortal Consors 2,200,000 0.519 Mrs Patricia G Holt 2,175,370 0.520 Mr Leslie R Holt 2,175,370 0.5
Top twenty shareholders 246,587,395 52.4Remainder 224,011,181 47.6
Total 470,598,576 100.0
asX aDDITIonal InfoRmaTIon

103
Boom LogIstIcs LImItedA.B.N. 28 095 466 961
BOOM LOgistics AnnuAL RepORt 2013
(c) Substantial Holders
Substantial holders in the company are set out below:
Listed ordinary shares
Number of shares
Percentage of ordinary
shares
Perennial Value Management 50,885,070 10.8Invesco Australia 34,842,512 7.4Schroder Investment Management 32,177,526 6.8
(d) Voting Rights
All ordinary shares (whether fully paid or not) carry one vote per share without restriction.
asX aDDITIonal InfoRmaTIon (continued)


105BOOM LOgistics AnnuAL RepORt 2013

BOOM LOgistics AnnuAL RepORt 2013106
Level 6, 55 Southbank BoulevardSOUTHBANK VIC 3006
Telephone (03) 9207 2500Fax (03) 9207 2400
www.boomlogistics.com.au