annual logistics transportation trends ey
DESCRIPTION
ÂTRANSCRIPT

20th annualtrends and issues in logistics and transportation studyOperating in the new normalOctober 2011
2
About this reportThis report is written annually by Dr. Karl Manrodt, Associate Professor of Logistics at Georgia Southern University, and Dr. Mary Holcomb, Associate Professor of Logistics at the University of Tennessee, Knoxville, with sponsorship and support in 2011 from Ernst & Young LLP and Con-way, Inc. The report was first issued in 1992 and has had various sponsors over the last 20 years. This year’s report utilizes data gathered and research conducted by Dr. Manrodt and Dr. Holcomb with support from Ernst & Young and Con-way. This data is gathered primarily through the use of an online survey tool and a sampling of in-person interviews. Results and analysis are based on data provided by over 760 domestic and global supply chain professionals via a survey distributed to subscribers of Logistics Management magazine. The study encompasses 14 named industry sectors and several minor sectors, with manufacturers making up the core group (37% of respondents).
The content of the study is based upon the work of Dr. Manrodt and Dr. Holcomb, and they are responsible for any errors or discrepancies in the data. The conclusions from that data were developed as a group with Dr. Manrodt, Dr. Holcomb, Ernst & Young and Con-way.
Ernst & Young does not audit the data and the resulting data analysis or conclusions and does not provide an opinion or other assurance in relation to the data. This study is not performed under professional standards relevant to the firm’s client service business. Only aggregate results are published and any specific company data is held in strictest confidence. Further details regarding scope are provided within the detail of the report.

1
A changing landscapeIt’s the Wizard of Oz, just in reverse.
That is how some are describing the new normal. In one of the many iconic scenes, Dorothy is seen living in shades of gray until she opens the door to Oz and steps into its Technicolor splendor. In the world of supply chain professionals, we are stepping back out of the sharp contrasts and into a more subtly shaded world, one with less distinct landmarks to lead the way.
The world is becoming more complex. Planning cycles are shrinking as competitive pressures are forcing manufacturers to introduce new products quicker. Customer expectations have forced operations to move from mass production to mass customization of goods and services. Once-agreed-upon business assumptions are being questioned and doubted. Global volatility is matched with domestic uncertainty. Future growth opportunities are hard to quantify and visualize. Market research data used to set the strategic direction of a firm can be ambiguous and subject to interpretation.
The term “new normal” is being used to describe this emerging business environment. The new normal has also created fundamental shifts in logistics and transportation management. The
pressure to be more flexible — the first effect of the new normal environment — is the necessity of being able to adjust or respond to change quickly. Volatility of demand, coupled with the unexpected events that occur on an ongoing basis
in supply chain flows, compels companies to be flexible. The companies that will prosper in the new landscape will be those that have the capability to capitalize on change when others simply cannot react or alter their actions fast enough. Flexibility is the remedy when uncertainty exists.
As we all know, however, flexibility is not enough to succeed in the current environment. The pressure to be more efficient — the second effect of the new environment — has never been greater, and any potential investment must pass additional levels of scrutiny as credit is
Flexibility is essential.
Efficiency is vital.
Differentiation is imperative.
There is a move toward more
sophisticated tools and techniques to manage logistics
and transportation activities.
2
tight. Being as lean as possible is desirable to eliminate waste and non-value-added activities in order to improve supply chain flows and firms’ financial positions. This unrelenting focus on cost reduction has resulted in an increased emphasis on leveraging every dollar spent on logistics and transportation activities. This can be seen in the growing use of truckload transportation and the importance that is being placed on shipment consolidation.
Concern about inventory levels and the effect on the cash-to-cash cycle has also never been greater, as “cash is king” in the new business environment. There is also a move toward more sophisticated tools and techniques to manage transportation and distribution activities as they have become more complex, and there is a growing need for increased visibility in order to better synchronize supply chain flows.
The march toward continued efficiency is not new. In fact, starting in 2000, our research examined six key capabilities that drive a transformation to greater efficiency in supply chain, logistics and distribution processes. These drivers —
collaboration, optimization, connectivity, execution, speed and visibility — were the benchmarks we used to evaluate the progress of companies in achieving logistics and supply chain excellence.
This environment for logistics and transportation calls for the ability to accommodate increasing customer service requirements that are also becoming more tailored for that customer. As all members of the supply chain are striving to be leaner, service levels are becoming even more critical to success. Yet this year’s study results indicate that companies continue to struggle with differentiation — a vital part of logistics and transportation. Instead of improving, service levels have remained stagnant, and in some cases have declined, since 2003.
The new reality is that certainty is a short-lived state. The constant in the new normal is change. To succeed in this environment, it is critical to have the right formula to assist in achieving the company’s short- and long-term goals and objectives. Surviving — and growing — in this new landscape involves three basic
principles: flexibility, efficiency and differentiation.
The results of the 20th annual trends and issues in logistics and transportation study suggest that we are not making the progress that is needed for significant contribution to the top and bottom line in the new business environment. This highly dynamic and complex environment calls for new and innovative approaches. The purpose of this report is to help firms navigate the new normal by focusing on the three principles stated above — the new fundamentals in logistics and transportation management.
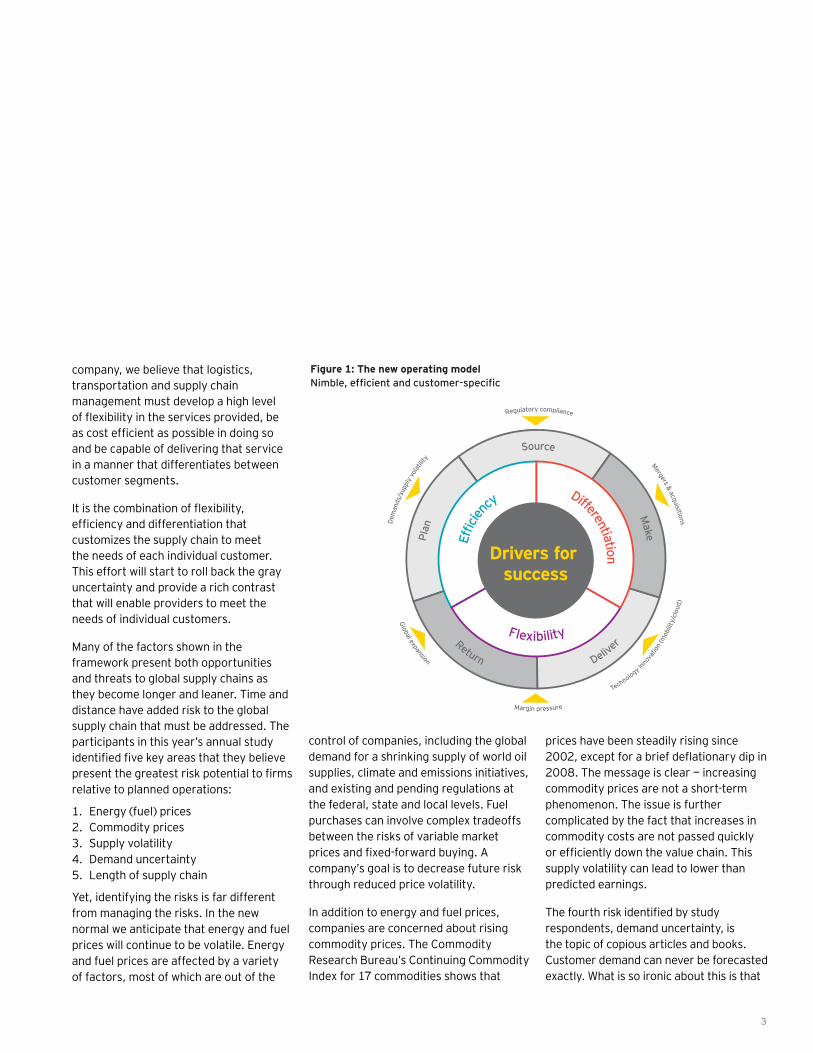
In order to plot a path forward in the current environment, it is important for firms to understand the multiple layers that define this new environment. The framework shown below indicates that the five main SCOR supply chain processes — plan, source, make, deliver and return — now occur in an environment that has myriad challenges, including:
• Unpredictable demand• Uncertain supply• Continuous mergers and acquisitions • Changing legal and regulatory policies • Volatile commodity and energy prices • New operating practices that protect
and improve our environment• Rapidly changing technology• Global expansions to take advantage of
new sources of supply and markets
For supply chain processes to achieve the desired goals and objectives of a
Defining the new normalAt the macroeconomic level, the new normal is characterized by slow growth in GDP, leaner profit margins, smaller returns on assets than in previous decades, steadily high unemployment, slow-moving credit and budget cuts at all levels.
For logistics, transportation and supply chain management, the new normal means a continuous focus on efficiency, responding to changes without excessive cost, time or loss of performance, and designing and operating a network that is capable of meeting the different service requirements placed on it.
3
company, we believe that logistics, transportation and supply chain management must develop a high level of flexibility in the services provided, be as cost efficient as possible in doing so and be capable of delivering that service in a manner that differentiates between customer segments.
It is the combination of flexibility, efficiency and differentiation that customizes the supply chain to meet the needs of each individual customer. This effort will start to roll back the gray uncertainty and provide a rich contrast that will enable providers to meet the needs of individual customers.
Many of the factors shown in the framework present both opportunities and threats to global supply chains as they become longer and leaner. Time and distance have added risk to the global supply chain that must be addressed. The participants in this year’s annual study identified five key areas that they believe present the greatest risk potential to firms relative to planned operations:
1. Energy (fuel) prices2. Commodity prices3. Supply volatility4. Demand uncertainty5. Length of supply chain
Yet, identifying the risks is far different from managing the risks. In the new normal we anticipate that energy and fuel prices will continue to be volatile. Energy and fuel prices are affected by a variety of factors, most of which are out of the
control of companies, including the global demand for a shrinking supply of world oil supplies, climate and emissions initiatives, and existing and pending regulations at the federal, state and local levels. Fuel purchases can involve complex tradeoffs between the risks of variable market prices and fixed-forward buying. A company’s goal is to decrease future risk through reduced price volatility.
In addition to energy and fuel prices, companies are concerned about rising commodity prices. The Commodity Research Bureau’s Continuing Commodity Index for 17 commodities shows that
prices have been steadily rising since 2002, except for a brief deflationary dip in 2008. The message is clear — increasing commodity prices are not a short-term phenomenon. The issue is further complicated by the fact that increases in commodity costs are not passed quickly or efficiently down the value chain. This supply volatility can lead to lower than predicted earnings.
The fourth risk identified by study respondents, demand uncertainty, is the topic of copious articles and books. Customer demand can never be forecasted exactly. What is so ironic about this is that
Figure 1: The new operating modelNimble, efficient and customer-specific
Plan
Source M
ake
Return D
elive
r
Effic
ien
cy Differentiation
Flexibility
Drivers for success
Dem
ands
/sup
ply
volat
ility
Regulatory compliance Mergers & acquisitions
Global expansion Margin pressure
T
echnology i
nnov
ation
(mob
ility
/clo
ud)
4
we live in the age of information where there is an abundance of data at the point-of-sale level. There is no doubt that information has changed the way that we manage supply chains. In terms of demand management, however, volatility can be driven by not-so-obvious reasons such as batch ordering, understated or inflated orders, price fluctuations and even long lead times. In some cases respondents report that they lack the integrated processes to leverage data and information on customer buying behavior.
Demand volatility has always existed. Most firms generally have treated it as an operational issue involving the coordination of marketing, manufacturing and distribution. In the new normal, this is not sufficient. Demand uncertainty must also be addressed at a strategic level, which entails significant involvement of external supply chain members.
Synchronizing supply and demand is a major challenge for most firms. The task is made even more difficult due to the growing length of the supply chain. This was the fifth-ranked risk reported by participants in the annual study. In the current environment, the scope of the five main SCOR supply chain processes is global. The time dimension of supply chain flows has increased as companies take advantage of specialized sources of supply, low-cost labor locations and new market opportunities around the
world. Months before demand is realized, suppliers and manufacturers often have to commit their resources to specific levels of output due to the length of the supply chain. In addition, as the firm employs strategies such as lean and just-in-time to a global supply chain, the level of risk also increases.
Despite the positive actions to reduce supply chain risks, there are a number of areas that need improvement. The risks presented by demand uncertainty and supply volatility will not decline unless
there is substantially more external involvement. Currently only 6.3% of key customers and 7.5% of key suppliers are highly involved in the sales and operations planning (S&OP) process. This lack of significant external involvement has implications for the success of inventory
reduction initiatives that are currently underway. Visibility in the supply chain has been stagnant or declined for several years. This capability is critical for improving efficiency and flexibility.
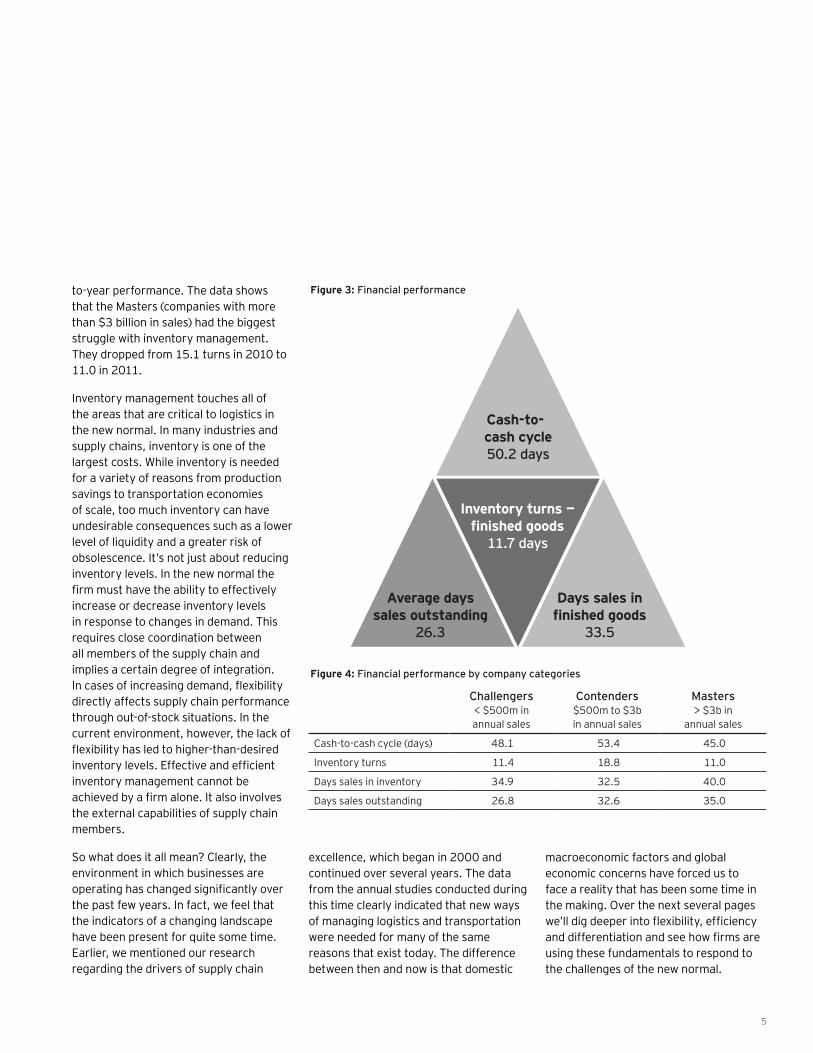
Ultimately, financial performance in the new landscape is extremely important. It has been said that “cash is king” in this environment. Therefore how quickly companies turn cash back into cash is a key indicator of health in this area. The study results indicate on average it takes 50.2 days for this cycle. Compared to the previous year, inventory turns declined. In 2010, the average inventory turns were 12.7 days; in 2011 that average is 11.7. This represents a 7.9% decline in year-
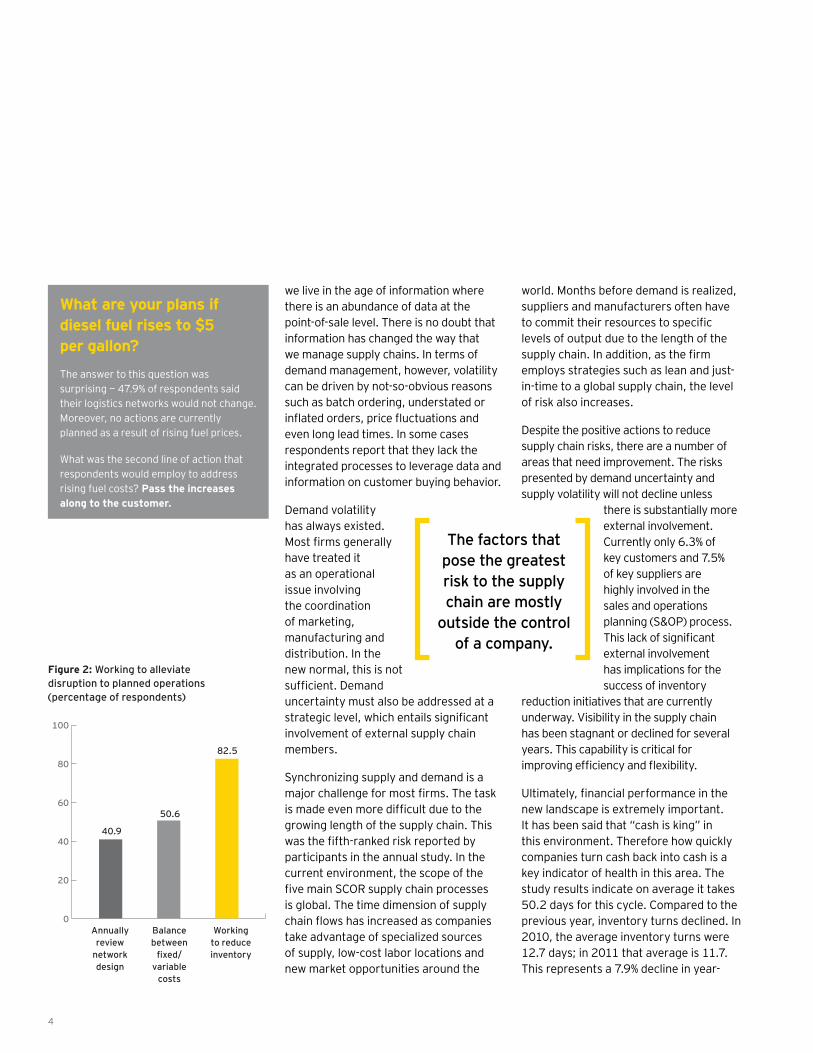
What are your plans if diesel fuel rises to $5 per gallon?
The answer to this question was surprising — 47.9% of respondents said their logistics networks would not change. Moreover, no actions are currently planned as a result of rising fuel prices.
What was the second line of action that respondents would employ to address rising fuel costs? Pass the increases along to the customer.
The factors that pose the greatest risk to the supply chain are mostly
outside the control of a company.
Figure 2: Working to alleviate disruption to planned operations(percentage of respondents)
0
20
40
60
80
100
Annually review
network design
40.9
50.6
82.5
Balance between
fixed/variable
costs
Working to reduce inventory
5
to-year performance. The data shows that the Masters (companies with more than $3 billion in sales) had the biggest struggle with inventory management. They dropped from 15.1 turns in 2010 to 11.0 in 2011.
Inventory management touches all of the areas that are critical to logistics in the new normal. In many industries and supply chains, inventory is one of the largest costs. While inventory is needed for a variety of reasons from production savings to transportation economies of scale, too much inventory can have undesirable consequences such as a lower level of liquidity and a greater risk of obsolescence. It’s not just about reducing inventory levels. In the new normal the firm must have the ability to effectively increase or decrease inventory levels in response to changes in demand. This requires close coordination between all members of the supply chain and implies a certain degree of integration. In cases of increasing demand, flexibility directly affects supply chain performance through out-of-stock situations. In the current environment, however, the lack of flexibility has led to higher-than-desired inventory levels. Effective and efficient inventory management cannot be achieved by a firm alone. It also involves the external capabilities of supply chain members.
So what does it all mean? Clearly, the environment in which businesses are operating has changed significantly over the past few years. In fact, we feel that the indicators of a changing landscape have been present for quite some time. Earlier, we mentioned our research regarding the drivers of supply chain
excellence, which began in 2000 and continued over several years. The data from the annual studies conducted during this time clearly indicated that new ways of managing logistics and transportation were needed for many of the same reasons that exist today. The difference between then and now is that domestic
macroeconomic factors and global economic concerns have forced us to face a reality that has been some time in the making. Over the next several pages we’ll dig deeper into flexibility, efficiency and differentiation and see how firms are using these fundamentals to respond to the challenges of the new normal.
Cash-to-cash cycle50.2 days
Inventory turns — finished goods
11.7 days
Average days sales outstanding
26.3
Days sales in finished goods
33.5
Figure 3: Financial performance
Figure 4: Financial performance by company categories
Challengers < $500m in annual sales
Contenders $500m to $3b in annual sales
Masters > $3b in
annual sales
Cash-to-cash cycle (days) 48.1 53.4 45.0
Inventory turns 11.4 18.8 11.0
Days sales in inventory 34.9 32.5 40.0
Days sales outstanding 26.8 32.6 35.0

6
Being nimble and responsiveThe level of flexibility that a company has directly reflects its ability to anticipate, adapt or react to changes in its environment. Obtaining the level of flexibility that is needed to operate in the new normal is not easy for a number of reasons. Flexibility is required at many different levels in a firm, including:
• The ability to change the volume of aggregate output based on the fluctuation of demand
• The capability to alter the variety of products that can be produced
• The speed and number of new products that can be introduced
• The ease of product modifications • The operational as well as functional
ability to adjust and deploy the resources to match requirements
Flexibility also entails the ability to meet customer-specific service level requirements and to efficiently handle specific flow patterns for a variety of situations. For example, it might be desirable to fulfill orders for a set of customers from the distribution center(s) with the oldest inventory for that item. The two perspectives of flexibility suggest that there are internal and external dimensions to the capability. The outcome of internal flexibility is increased customer service as the company is able to change volume and mix. External flexibility recognizes that market requirements and customer needs must also be taken into consideration. Given the broad array of processes and activities that this capability affects, it’s not surprising that companies are struggling with this driver for success.
It should be noted that flexibility entails the ability to adapt in a reversible manner to an existing situation without excessive cost, time or loss of performance. This
is different from evolution, which is irreversible. In other words, it’s not a matter of changing to another state and staying in that condition. A flexible company or supply chain must be able to morph, and perhaps return to an original state, all in a very short period of time.
A company’s flexibility can be directly related to the number of discrete supply chains that it uses for the distribution process. The data indicates that on average a company has 3.16 supply chains. Further analysis of the data by firm strategy shows that the mix strategy has more discrete supply chains on average than the others.
Supply chains and operating flexibilityWhy do companies find it necessary to have different supply chains? The top three reasons cited by the study participants are:
Flexibility
Flexibility• The ability to quickly meet an
increasing variety of customer requirements at the “right” cost, time and place while creating maximum value for the company
• The capability to alter and adapt in a reversible manner according to needs
Figure 5: Average number of supply chains by a firm’s strategic direction
Overall strategy for the division or business unitAverage number of
discrete supply chainsCost leadership 3.21
Mix: be all things to all people 3.35
Customer service 3.02
Product/market innovation 2.22
7
1. Customer requirements2. Business unit or division requirements3. Product characteristics
Multiple supply chains also provide a company with increased flexibility. The ability to respond quickly to changes or unexpected events without incurring excessive costs, time, organizational disruptions or any loss of performance is necessary to compete in the new normal.
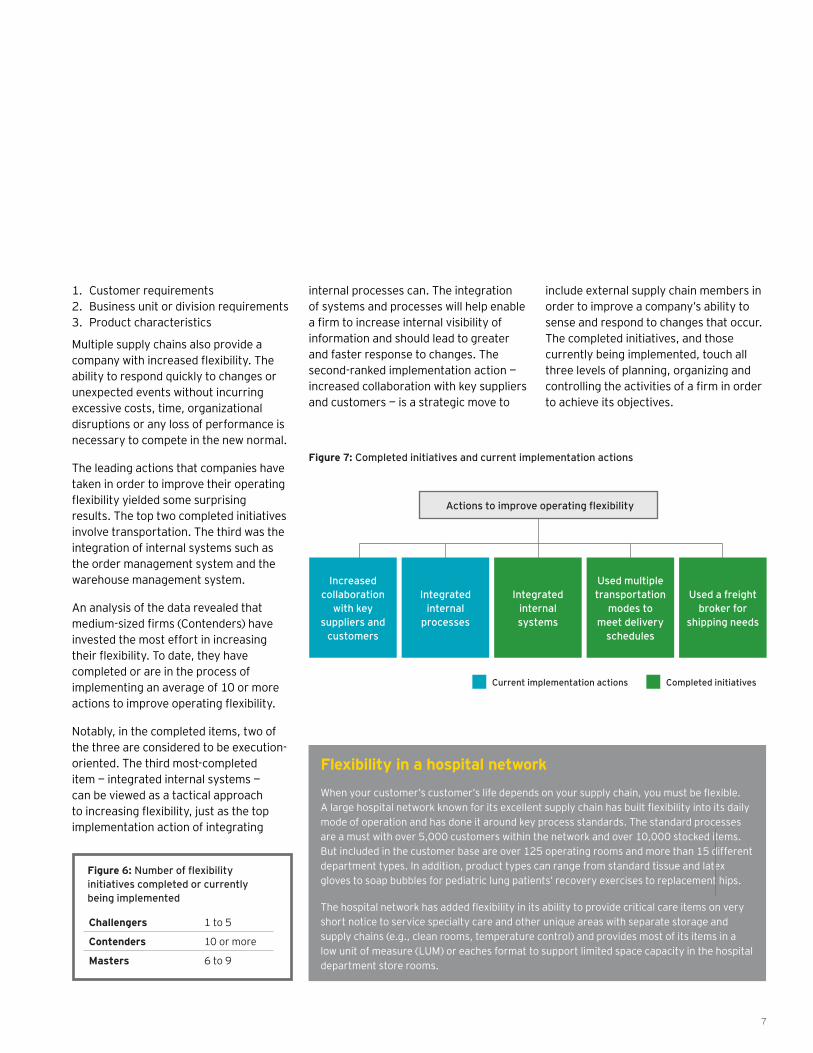
The leading actions that companies have taken in order to improve their operating flexibility yielded some surprising results. The top two completed initiatives involve transportation. The third was the integration of internal systems such as the order management system and the warehouse management system.
An analysis of the data revealed that medium-sized firms (Contenders) have invested the most effort in increasing their flexibility. To date, they have completed or are in the process of implementing an average of 10 or more actions to improve operating flexibility.
Notably, in the completed items, two of the three are considered to be execution-oriented. The third most-completed item — integrated internal systems — can be viewed as a tactical approach to increasing flexibility, just as the top implementation action of integrating
Flexibility in a hospital network
When your customer’s customer’s life depends on your supply chain, you must be flexible. A large hospital network known for its excellent supply chain has built flexibility into its daily mode of operation and has done it around key process standards. The standard processes are a must with over 5,000 customers within the network and over 10,000 stocked items. But included in the customer base are over 125 operating rooms and more than 15 different department types. In addition, product types can range from standard tissue and latex gloves to soap bubbles for pediatric lung patients’ recovery exercises to replacement hips.
The hospital network has added flexibility in its ability to provide critical care items on very short notice to service specialty care and other unique areas with separate storage and supply chains (e.g., clean rooms, temperature control) and provides most of its items in a low unit of measure (LUM) or eaches format to support limited space capacity in the hospital department store rooms.
internal processes can. The integration of systems and processes will help enable a firm to increase internal visibility of information and should lead to greater and faster response to changes. The second-ranked implementation action — increased collaboration with key suppliers and customers — is a strategic move to
include external supply chain members in order to improve a company’s ability to sense and respond to changes that occur. The completed initiatives, and those currently being implemented, touch all three levels of planning, organizing and controlling the activities of a firm in order to achieve its objectives.
Figure 6: Number of flexibility initiatives completed or currently being implemented
Challengers 1 to 5
Contenders 10 or more
Masters 6 to 9
Figure 7: Completed initiatives and current implementation actions
Increased collaboration
with key suppliers and
customers
Integrated internal
processes
Integrated internal systems
Used multiple transportation
modes to meet delivery
schedules
Used a freight broker for
shipping needs
Actions to improve operating flexibility
Current implementation actions Completed initiatives
8
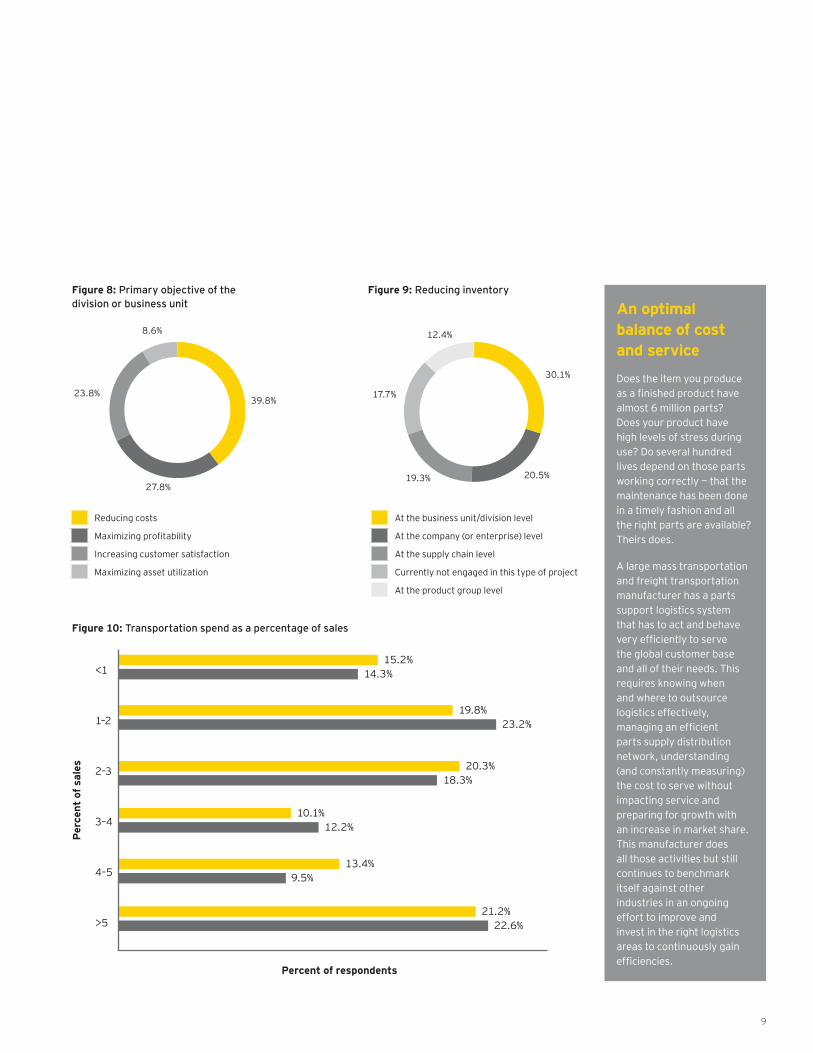
Cost to serveIn the new normal there is more pressure than ever on performance. Performance is a measure of both effectiveness and efficiency in completing a given task. At times, these can seem to be conflicting goals for managers. The study results indicate that reducing costs continues to be the primary goal of companies. Some 39.8% of the study participants noted that this is the primary focus for their company.
Since 2006, the main focus of companies has been on efficiency. Previously, increasing customer satisfaction was the primary aim. In the current environment, a key to reaching the desired level of efficiency lies with understanding the cost to serve. Manufacturing flexibility has enabled companies to cost effectively
Efficiency
Efficiency• A measure of how well companies
use the available resources to accomplish the goals of the firm
Evolution of measuring efficiency• Stage 1: Financial • Stage 2: Productivity• Stage 3: Performance• Stage 4: Integration of
performance and financial
produce for increasingly differentiated customer segments. Companies create customer value in this way, but tangible products are only part of the equation. Differentiated products must be bundled with a set of logistics services that also reflect differences in customers’ needs.
A big challenge for logistics has been the development of customer segments that can be served profitability by distinct networks. Without accurate and detailed data to understand how this complexity impacts cost, we are left using averages to determine the cost to serve. The use of average costs may lead to customers with unique requirements being underserved and undercharged, while other customers with more routine, standard needs may be overcharged. A good understanding of customer requirements is also necessary in order to formulate a logistics system and a supply chain that is capable of meeting, or exceeding, those requirements.
Logistics represents a major expenditure for businesses. Two of the major cost components for logistics are inventory and transportation. Finding the optimal balance between cost and service is a difficult task. Relative to inventory, the right level of inventory investment is more than an internal financial decision. It requires a firm to understand internal tradeoffs in conjunction with customer needs and supply chain partners’ goals.
In the new normal there is increased pressure to improve both efficiency and effectiveness. The quest for gains in efficiency is propelling companies to work on reducing their current overall level of inventory. The results of the annual study indicate that 82.3% of all companies are currently engaged in inventory reduction initiatives. The majority of the effort is aimed at the business unit or division level (30.1%). On average, the expected result is a reduction of inventory between 5% and 15%. Interestingly, the anticipated result did not vary by size of firm.
Transportation is also a major cost component for logistics. One of the key indicators for this measure of efficiency is transportation spending as a percent of sales. The trend over time is an interesting one. From 2004 through 2007, North American domestic transportation spend as a percent of sales increased every year. In 2008, as the economy began to show signs of weakening, the percentage of firms spending more than
Balancing inventory costs and service levels is difficult as opposing forces — minimization and maximization —
are at work.
9
Reducing costs
Maximizing profitability
Increasing customer satisfaction
Maximizing asset utilization
At the business unit/division level
At the company (or enterprise) level
At the supply chain level
Currently not engaged in this type of project
At the product group level
Figure 9: Reducing inventory
39.8%
30.1%
27.8%20.5%19.3%
23.8% 17.7%
8.6% 12.4%
An optimal balance of cost and service
Does the item you produce as a finished product have almost 6 million parts? Does your product have high levels of stress during use? Do several hundred lives depend on those parts working correctly — that the maintenance has been done in a timely fashion and all the right parts are available? Theirs does.
A large mass transportation and freight transportation manufacturer has a parts support logistics system that has to act and behave very efficiently to serve the global customer base and all of their needs. This requires knowing when and where to outsource logistics effectively, managing an efficient parts supply distribution network, understanding (and constantly measuring) the cost to serve without impacting service and preparing for growth with an increase in market share. This manufacturer does all those activities but still continues to benchmark itself against other industries in an ongoing effort to improve and invest in the right logistics areas to continuously gain efficiencies.
Figure 8: Primary objective of the division or business unit
Figure 10: Transportation spend as a percentage of sales
<1
1–2
2–3
3–4
4–5
>5
Percent of respondents
Per
cent
of s
ales
15.2%
19.8%
20.3%
10.1%
21.2%
13.4%
14.3%
23.2%
18.3%
12.2%
22.6%
9.5%
10
5% of sales on domestic transportation dropped significantly from 2007. Spending increased again in 2009 and continued to rise in 2010 with some 22.6% of firms reporting that they spent more than 5% of sales on domestic transportation. This percentage dropped to 21.2% for 2011. Results show that the most significant change in domestic transportation spending as a percent of sales has occurred in the middle range. That is, firms that spent 1%–2% of sales on domestic transportation last year (2010) are now spending 2%–3% of sales on this activity. The same is true for those firms that spent 3%–4% last year on sales. They are now outlaying 4%–5% of sales on domestic transportation.
Transportation plays a vital role in the new normal. Without the efficient and effective flow of materials and goods around the globe, it will not be possible for companies to succeed. High-quality, cost effective transportation has enabled firms to extend their reach to previously unavailable markets. It has allowed firms to source materials and manufacture products at any location(s) that creates the greatest competitive advantage for them. Transportation decisions directly affect the cost to serve, and serve a key part in creating customer value. Lastly, transportation is a key element in increasing a firm’s flexibility. Study participants reported that using multiple modes of transportation to meet delivery schedules was one of the top actions they had completed over the past 12 months in order to improve operating flexibility.
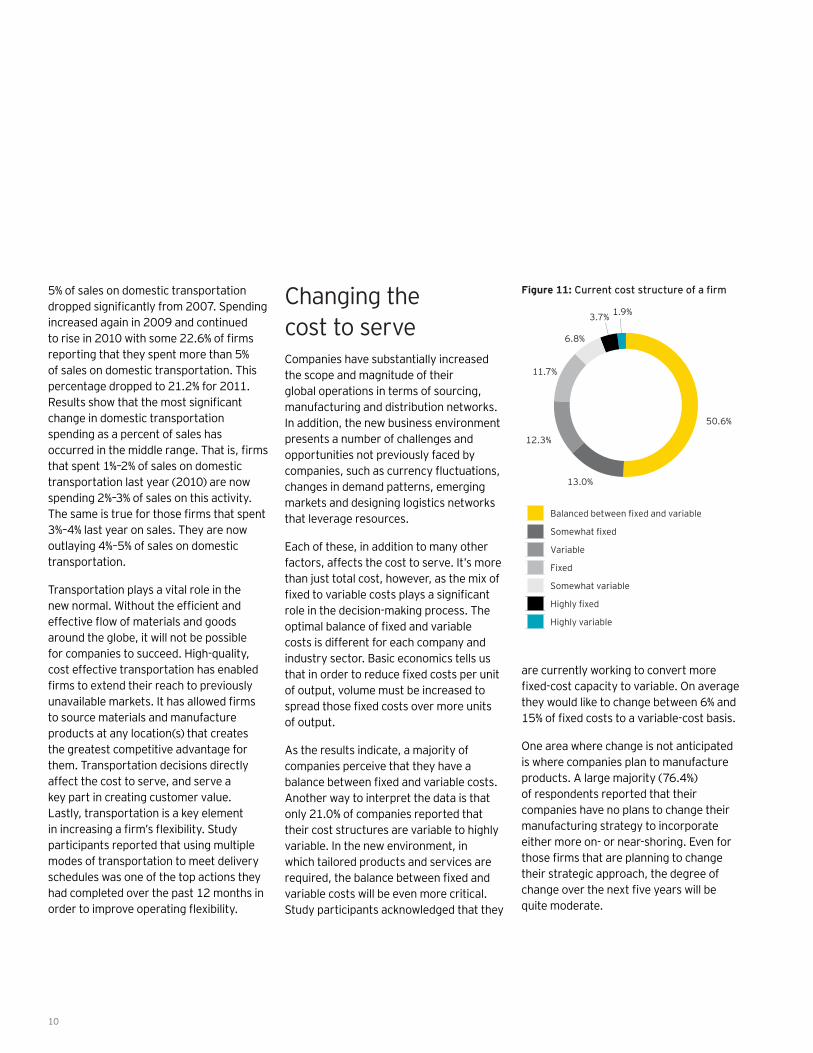
Changing the cost to serveCompanies have substantially increased the scope and magnitude of their global operations in terms of sourcing, manufacturing and distribution networks. In addition, the new business environment presents a number of challenges and opportunities not previously faced by companies, such as currency fluctuations, changes in demand patterns, emerging markets and designing logistics networks that leverage resources.
Each of these, in addition to many other factors, affects the cost to serve. It’s more than just total cost, however, as the mix of fixed to variable costs plays a significant role in the decision-making process. The optimal balance of fixed and variable costs is different for each company and industry sector. Basic economics tells us that in order to reduce fixed costs per unit of output, volume must be increased to spread those fixed costs over more units of output.
As the results indicate, a majority of companies perceive that they have a balance between fixed and variable costs. Another way to interpret the data is that only 21.0% of companies reported that their cost structures are variable to highly variable. In the new environment, in which tailored products and services are required, the balance between fixed and variable costs will be even more critical. Study participants acknowledged that they
are currently working to convert more fixed-cost capacity to variable. On average they would like to change between 6% and 15% of fixed costs to a variable-cost basis.
One area where change is not anticipated is where companies plan to manufacture products. A large majority (76.4%) of respondents reported that their companies have no plans to change their manufacturing strategy to incorporate either more on- or near-shoring. Even for those firms that are planning to change their strategic approach, the degree of change over the next five years will be quite moderate.
Balanced between fixed and variable
Somewhat fixed
Variable
Fixed
Somewhat variable
Highly fixed
Highly variable
50.6%
13.0%
12.3%
11.7%
6.8%
3.7% 1.9%
Figure 11: Current cost structure of a firm

11
Differentiation
Strategy determines a firm’s pathThe company’s strategy should provide a clear signal regarding its purpose and focus. From this, a company decides which customers it will serve, how it will serve them, and how it will compete with others in the market. A strategy focused on competing on cost is more apt to consider ways to reduce the total cost of producing and marketing a product. This strategy would be different from that of a firm seeking to gain market dominance through customer service. While both strategies have some overlap, there are operational consequences that result from choosing one strategy over another. Customers can choose one firm over another based on the level of service, or the price, they are willing to pay.
But what happens if the strategy is to serve everyone? In the new normal, companies appear to be determined to be all things to all people. For the first time over the many years of conducting this
Differentiation• The ability to separate into
distinct groups for the purpose of distinguishing between them
study, a majority of respondents reported that this is their firm’s strategy.
As the data in Figure 13 shows, over time the emphasis on customer service as the strategic direction for companies has been declining. While the primary goal and objective for companies shifted to one of cost reduction during this same time, this move was not reflected at the strategic level, with an increased percentage of companies opting for cost leadership as their strategy. Instead there was awareness by companies that service was, and still is, an integral part of value creation. It can be used to differentiate the company from competitors and to form the basis for building sustainable competitive advantage. The growth in the mix strategy over the years was a signal that the logistics and transportation environment was changing. It’s not possible to be one-dimensional in the new normal. Companies must truly be all things to all people.
One size service does not fit allFirms also need to recognize that decisions made about logistics and supply chain processes result in different levels of customer service that affect market share and profitability. That is, differentiated service can be used to increase sales and reduce costs. The design of the logistics
Mix: be all things to all people
Customer service
Cost leadership
Product/market innovation
50.7%
28.7%
14.4%
6.2%
Figure 12: Overall strategy for division or business unit
12
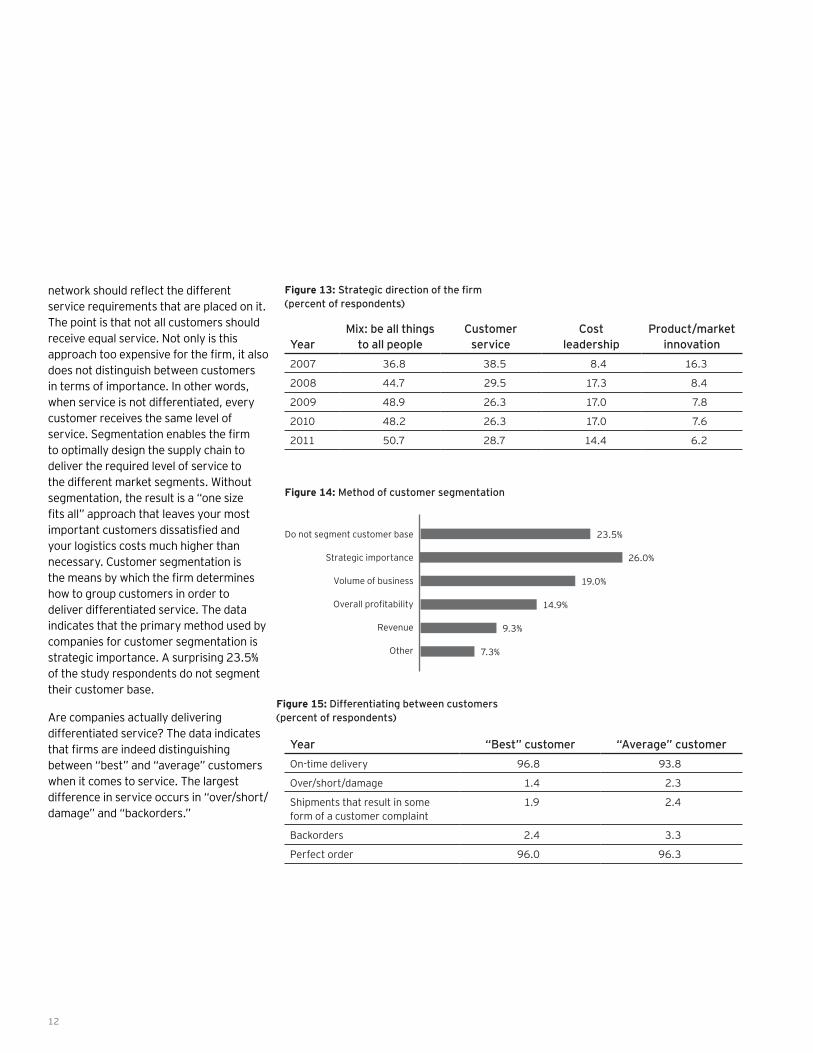
network should reflect the different service requirements that are placed on it. The point is that not all customers should receive equal service. Not only is this approach too expensive for the firm, it also does not distinguish between customers in terms of importance. In other words, when service is not differentiated, every customer receives the same level of service. Segmentation enables the firm to optimally design the supply chain to deliver the required level of service to the different market segments. Without segmentation, the result is a “one size fits all” approach that leaves your most important customers dissatisfied and your logistics costs much higher than necessary. Customer segmentation is the means by which the firm determines how to group customers in order to deliver differentiated service. The data indicates that the primary method used by companies for customer segmentation is strategic importance. A surprising 23.5% of the study respondents do not segment their customer base.
Are companies actually delivering differentiated service? The data indicates that firms are indeed distinguishing between “best” and “average” customers when it comes to service. The largest difference in service occurs in “over/short/ damage” and “backorders.”
Figure 13: Strategic direction of the firm (percent of respondents)
Figure 14: Method of customer segmentation
Figure 15: Differentiating between customers (percent of respondents)
YearMix: be all things
to all peopleCustomer
serviceCost
leadershipProduct/market
innovation2007 36.8 38.5 8.4 16.3
2008 44.7 29.5 17.3 8.4
2009 48.9 26.3 17.0 7.8
2010 48.2 26.3 17.0 7.6
2011 50.7 28.7 14.4 6.2
Year “Best” customer “Average” customerOn-time delivery 96.8 93.8
Over/short/damage 1.4 2.3
Shipments that result in some form of a customer complaint
1.9 2.4
Backorders 2.4 3.3
Perfect order 96.0 96.3
Do not segment customer base
Strategic importance
Volume of business
Overall profitability
Revenue
Other
23.5%
26.0%
19.0%
14.9%
9.3%
7.3%
13
Moving forward: the call to action
Success = F-E-D (Flexibility, Efficiency, Differentiation)In the new normal business environment, the traditional approach to logistics and transportation management will not be sufficient to accomplish the goals and objectives of companies. The operating conditions are more than challenging — global expansion (which is creating long supply chains), unpredictable demand, increasing customer requirements and growing complexity due to legal and regulatory compliance — just to name a few. The results of the 20th annual trends and issues in logistics and transportation study suggest that in order to succeed in this environment, three key capabilities are needed: flexibility, efficiency and differentiation. These are the drivers of success in the new normal.
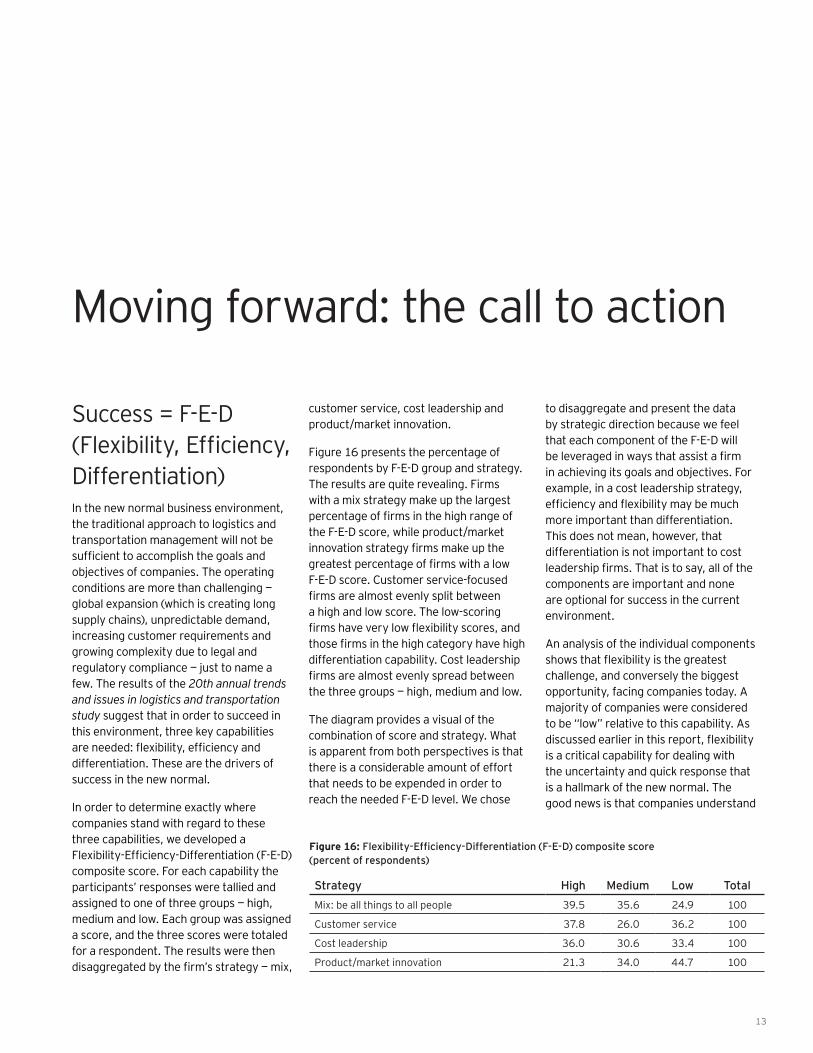
In order to determine exactly where companies stand with regard to these three capabilities, we developed a Flexibility-Efficiency-Differentiation (F-E-D) composite score. For each capability the participants’ responses were tallied and assigned to one of three groups — high, medium and low. Each group was assigned a score, and the three scores were totaled for a respondent. The results were then disaggregated by the firm’s strategy — mix,
customer service, cost leadership and product/market innovation.
Figure 16 presents the percentage of respondents by F-E-D group and strategy. The results are quite revealing. Firms with a mix strategy make up the largest percentage of firms in the high range of the F-E-D score, while product/market innovation strategy firms make up the greatest percentage of firms with a low F-E-D score. Customer service-focused firms are almost evenly split between a high and low score. The low-scoring firms have very low flexibility scores, and those firms in the high category have high differentiation capability. Cost leadership firms are almost evenly spread between the three groups — high, medium and low.
The diagram provides a visual of the combination of score and strategy. What is apparent from both perspectives is that there is a considerable amount of effort that needs to be expended in order to reach the needed F-E-D level. We chose
to disaggregate and present the data by strategic direction because we feel that each component of the F-E-D will be leveraged in ways that assist a firm in achieving its goals and objectives. For example, in a cost leadership strategy, efficiency and flexibility may be much more important than differentiation. This does not mean, however, that differentiation is not important to cost leadership firms. That is to say, all of the components are important and none are optional for success in the current environment.
An analysis of the individual components shows that flexibility is the greatest challenge, and conversely the biggest opportunity, facing companies today. A majority of companies were considered to be “low” relative to this capability. As discussed earlier in this report, flexibility is a critical capability for dealing with the uncertainty and quick response that is a hallmark of the new normal. The good news is that companies understand
Figure 16: Flexibility-Efficiency-Differentiation (F-E-D) composite score (percent of respondents)
Strategy High Medium Low TotalMix: be all things to all people 39.5 35.6 24.9 100
Customer service 37.8 26.0 36.2 100
Cost leadership 36.0 30.6 33.4 100
Product/market innovation 21.3 34.0 44.7 100
14
the critical need for this capability. Unfortunately, many of the actions that have been completed to date and the initiatives that are currently being implemented are operational in nature. To reach the level of competence that is needed in the new business environment, action is required at the strategic level.
For differentiation, the scores are almost the opposite of flexibility. A majority of firms scored “high” on this capability. Since deregulation of transportation in 1980, companies have focused on using service to create competitive advantage. In the 1990s the focus shifted from “one size fits all” customer service in logistics and transportation to differentiation of that service for defined customer segments. It was not surprising, therefore, that a majority of firms perceive they are quite capable in this area.
The scores for efficiency fall somewhere between those for flexibility and efficiency and are related to strategic approach. As would be expected, cost leadership firms rate high on this capability while product/market innovation firms are primarily low scorers for this component. There are a number of measures that can be used to determine efficiency. As we move forward with our research, we will endeavor to expand the factors that are used to measure this capability.
Future research efforts will focus on further development of the F-E-D formula and the manner in which the composite score is calculated. Using an additive approach to determine the current state is appropriate at this stage of knowledge. As we continue to learn more about each of the drivers, this knowledge will be used to improve the methodology.
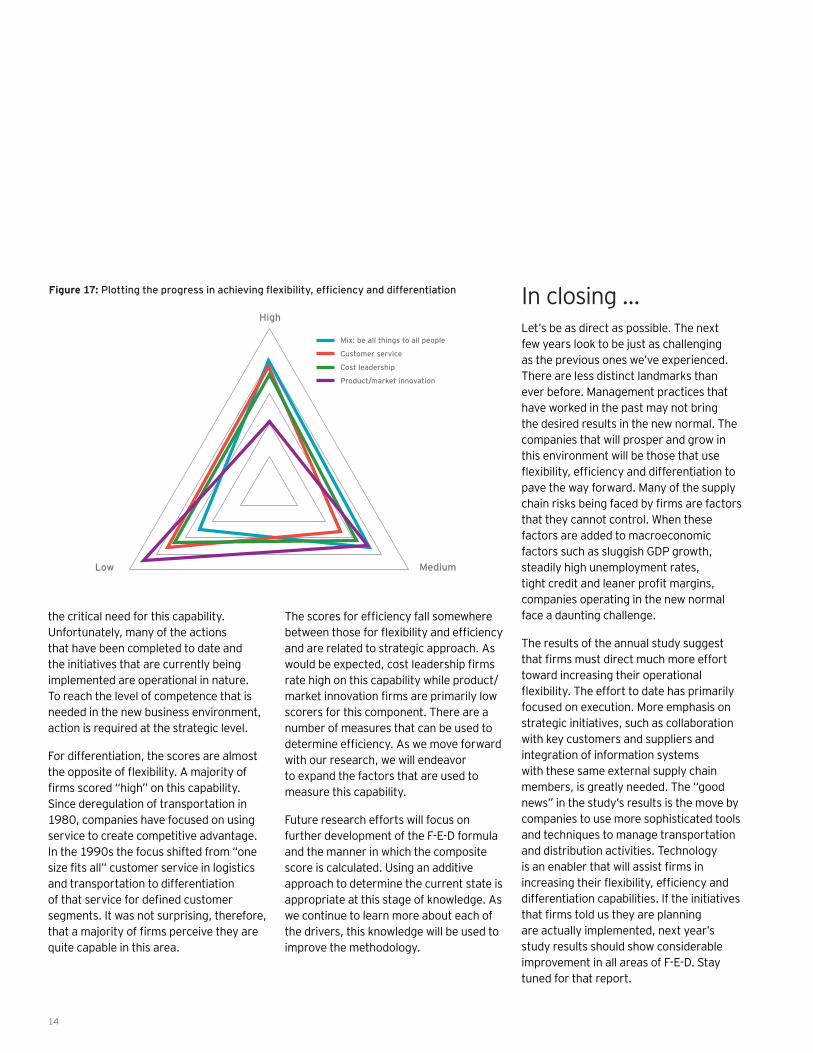
Figure 17: Plotting the progress in achieving flexibility, efficiency and differentiation In closing …Let’s be as direct as possible. The next few years look to be just as challenging as the previous ones we’ve experienced. There are less distinct landmarks than ever before. Management practices that have worked in the past may not bring the desired results in the new normal. The companies that will prosper and grow in this environment will be those that use flexibility, efficiency and differentiation to pave the way forward. Many of the supply chain risks being faced by firms are factors that they cannot control. When these factors are added to macroeconomic factors such as sluggish GDP growth, steadily high unemployment rates, tight credit and leaner profit margins, companies operating in the new normal face a daunting challenge.
The results of the annual study suggest that firms must direct much more effort toward increasing their operational flexibility. The effort to date has primarily focused on execution. More emphasis on strategic initiatives, such as collaboration with key customers and suppliers and integration of information systems with these same external supply chain members, is greatly needed. The “good news” in the study’s results is the move by companies to use more sophisticated tools and techniques to manage transportation and distribution activities. Technology is an enabler that will assist firms in increasing their flexibility, efficiency and differentiation capabilities. If the initiatives that firms told us they are planning are actually implemented, next year’s study results should show considerable improvement in all areas of F-E-D. Stay tuned for that report.
High
Low Medium
Mix: be all things to all people
Customer service
Cost leadership
Product/market innovation
15
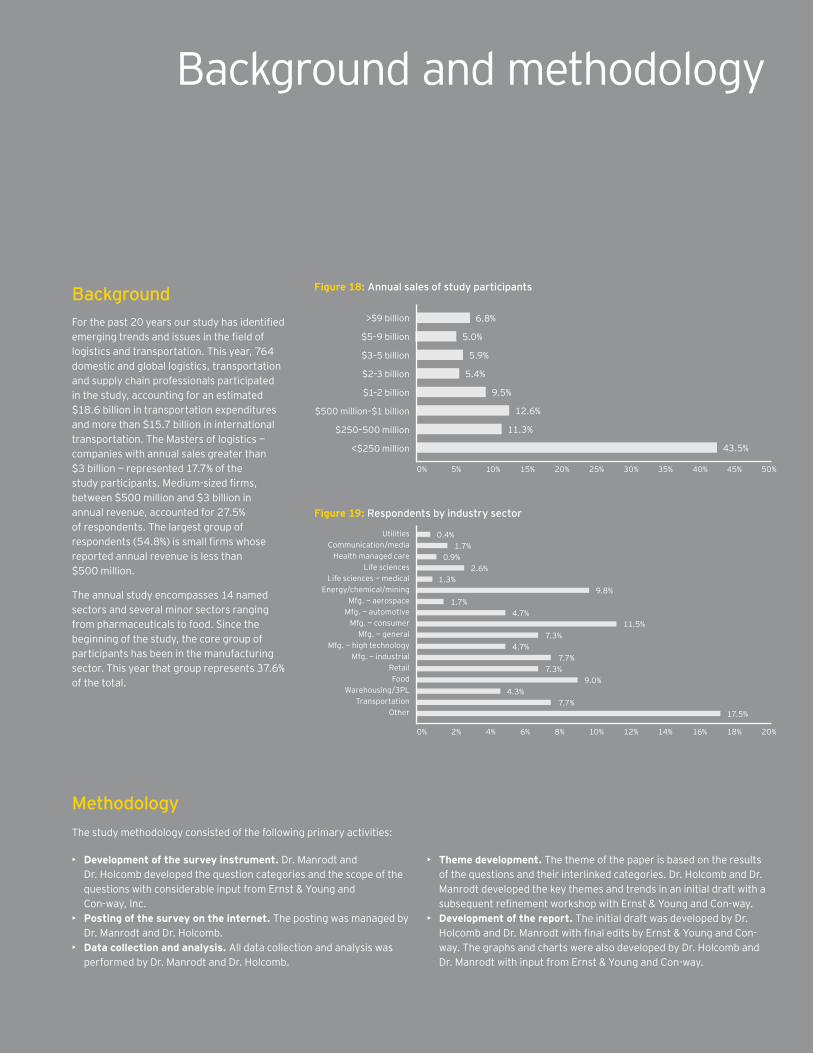
Background and methodology
BackgroundFor the past 20 years our study has identified emerging trends and issues in the field of logistics and transportation. This year, 764 domestic and global logistics, transportation and supply chain professionals participated in the study, accounting for an estimated $18.6 billion in transportation expenditures and more than $15.7 billion in international transportation. The Masters of logistics — companies with annual sales greater than $3 billion — represented 17.7% of the study participants. Medium-sized firms, between $500 million and $3 billion in annual revenue, accounted for 27.5% of respondents. The largest group of respondents (54.8%) is small firms whose reported annual revenue is less than $500 million.
The annual study encompasses 14 named sectors and several minor sectors ranging from pharmaceuticals to food. Since the beginning of the study, the core group of participants has been in the manufacturing sector. This year that group represents 37.6% of the total.
Figure 18: Annual sales of study participants
>$9 billion
$5–9 billion
$3–5 billion
$2–3 billion
$1–2 billion
$500 million–$1 billion
$250–500 million
<$250 million
6.8%
5.0%
5.9%
5.4%
9.5%
12.6%
11.3%
43.5%
5%0% 10% 15% 20% 25% 30% 35% 40% 45% 50%
Figure 19: Respondents by industry sector
UtilitiesCommunication/media
Health managed careLife sciences
Life sciences — medicalEnergy/chemical/mining
Mfg. — aerospaceMfg. — automotive
Mfg. — consumerMfg. — general
Mfg. — high technologyMfg. — industrial
RetailFood
Warehousing/3PLTransportation
Other
0.4%1.7%
0.9%2.6%
1.3%
1.7%4.7%
4.7%7.3%
7.3%
4.3%7.7%
9.0%
17.5%
7.7%
11.5%
9.8%
2%0% 4% 6% 8% 10% 12% 14% 16% 18% 20%
• Theme development. The theme of the paper is based on the results of the questions and their interlinked categories. Dr. Holcomb and Dr. Manrodt developed the key themes and trends in an initial draft with a subsequent refinement workshop with Ernst & Young and Con-way.
• Development of the report. The initial draft was developed by Dr. Holcomb and Dr. Manrodt with final edits by Ernst & Young and Con-way. The graphs and charts were also developed by Dr. Holcomb and Dr. Manrodt with input from Ernst & Young and Con-way.
• Development of the survey instrument. Dr. Manrodt and Dr. Holcomb developed the question categories and the scope of the questions with considerable input from Ernst & Young and Con-way, Inc.
• Posting of the survey on the internet. The posting was managed by Dr. Manrodt and Dr. Holcomb.
• Data collection and analysis. All data collection and analysis was performed by Dr. Manrodt and Dr. Holcomb.
MethodologyThe study methodology consisted of the following primary activities:
16
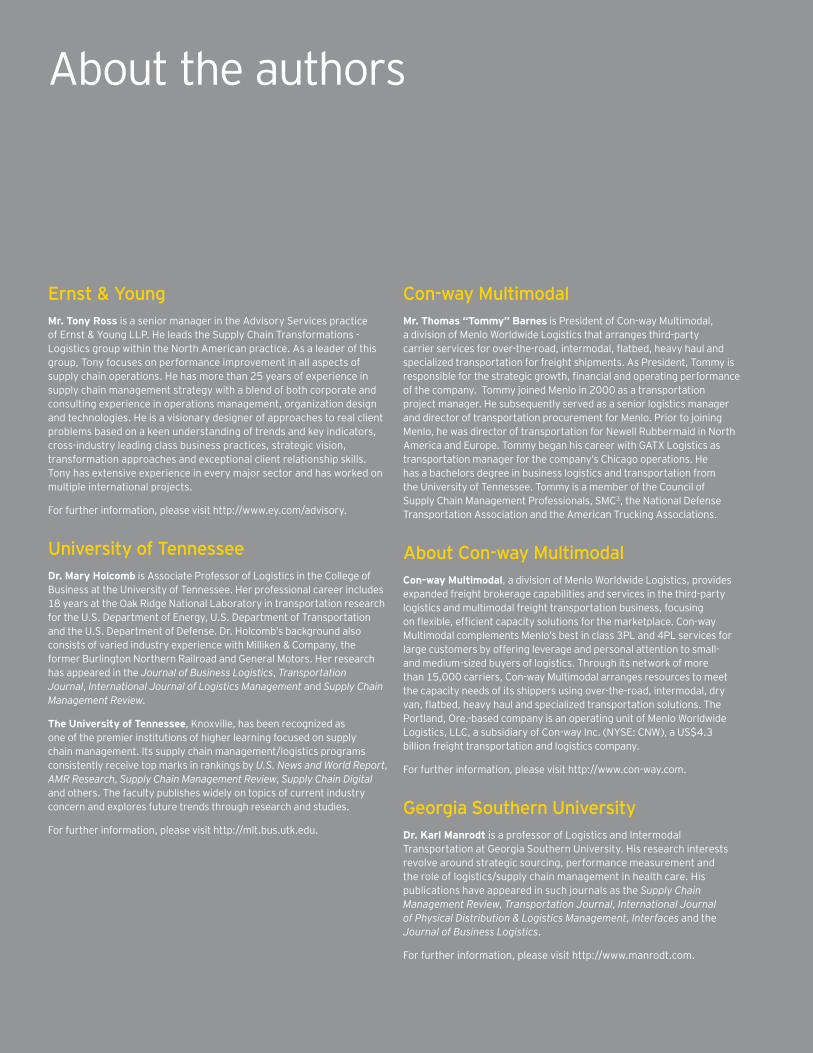
Ernst & YoungMr. Tony Ross is a senior manager in the Advisory Services practice of Ernst & Young LLP. He leads the Supply Chain Transformations - Logistics group within the North American practice. As a leader of this group, Tony focuses on performance improvement in all aspects of supply chain operations. He has more than 25 years of experience in supply chain management strategy with a blend of both corporate and consulting experience in operations management, organization design and technologies. He is a visionary designer of approaches to real client problems based on a keen understanding of trends and key indicators, cross-industry leading class business practices, strategic vision, transformation approaches and exceptional client relationship skills. Tony has extensive experience in every major sector and has worked on multiple international projects.
For further information, please visit http://www.ey.com/advisory.
University of TennesseeDr. Mary Holcomb is Associate Professor of Logistics in the College of Business at the University of Tennessee. Her professional career includes 18 years at the Oak Ridge National Laboratory in transportation research for the U.S. Department of Energy, U.S. Department of Transportation and the U.S. Department of Defense. Dr. Holcomb’s background also consists of varied industry experience with Milliken & Company, the former Burlington Northern Railroad and General Motors. Her research has appeared in the Journal of Business Logistics, Transportation Journal, International Journal of Logistics Management and Supply Chain Management Review.
The University of Tennessee, Knoxville, has been recognized as one of the premier institutions of higher learning focused on supply chain management. Its supply chain management/logistics programs consistently receive top marks in rankings by U.S. News and World Report, AMR Research, Supply Chain Management Review, Supply Chain Digital and others. The faculty publishes widely on topics of current industry concern and explores future trends through research and studies.
For further information, please visit http://mlt.bus.utk.edu.
Con-way MultimodalMr. Thomas “Tommy” Barnes is President of Con-way Multimodal, a division of Menlo Worldwide Logistics that arranges third-party carrier services for over-the-road, intermodal, flatbed, heavy haul and specialized transportation for freight shipments. As President, Tommy is responsible for the strategic growth, financial and operating performance of the company. Tommy joined Menlo in 2000 as a transportation project manager. He subsequently served as a senior logistics manager and director of transportation procurement for Menlo. Prior to joining Menlo, he was director of transportation for Newell Rubbermaid in North America and Europe. Tommy began his career with GATX Logistics as transportation manager for the company’s Chicago operations. He has a bachelors degree in business logistics and transportation from the University of Tennessee. Tommy is a member of the Council of Supply Chain Management Professionals, SMC3, the National Defense Transportation Association and the American Trucking Associations.
About Con-way MultimodalCon-way Multimodal, a division of Menlo Worldwide Logistics, provides expanded freight brokerage capabilities and services in the third-party logistics and multimodal freight transportation business, focusing on flexible, efficient capacity solutions for the marketplace. Con-way Multimodal complements Menlo’s best in class 3PL and 4PL services for large customers by offering leverage and personal attention to small- and medium-sized buyers of logistics. Through its network of more than 15,000 carriers, Con-way Multimodal arranges resources to meet the capacity needs of its shippers using over-the-road, intermodal, dry van, flatbed, heavy haul and specialized transportation solutions. The Portland, Ore.-based company is an operating unit of Menlo Worldwide Logistics, LLC, a subsidiary of Con-way Inc. (NYSE: CNW), a US$4.3 billion freight transportation and logistics company.
For further information, please visit http://www.con-way.com.
Georgia Southern UniversityDr. Karl Manrodt is a professor of Logistics and Intermodal Transportation at Georgia Southern University. His research interests revolve around strategic sourcing, performance measurement and the role of logistics/supply chain management in health care. His publications have appeared in such journals as the Supply Chain Management Review, Transportation Journal, International Journal of Physical Distribution & Logistics Management, Interfaces and the Journal of Business Logistics.
For further information, please visit http://www.manrodt.com.
About the authors

17
Additional information
Contacts
Related thought leadership
Plugging the $100 million gap: Using supply chain operations to improve business performance
By taking a more holistic view of business performance operations, executives can make transformational changes that drive the improvements they seek.
Brian MeadowsErnst & Young’s Americas Advisory Supply Chain Operations Leader
+1 703 747 [email protected]
Bradley NewmanPartner — Americas Advisory, Supply Chain & Operations
+1 312 879 [email protected]
Tony RossSenior Manager, Advisory Services
+1 214 969 [email protected]
Want to avoid supply chain stumbles? Standardize your operating processes
Standardizing operating processes and data management will help organizations have better control over the ebb and flow of customer demand by minimizing the unpredictability of performance stumbles within operations.
For further information, please visit ey.com/advisory.
Ernst & Young
Assurance | Tax | Transactions | Advisory
About Ernst & YoungErnst & Young is a global leader in assurance, tax, transaction and advisory services. Worldwide, our 152,000 people are united by our shared values and an unwavering commitment to quality. We make a difference by helping our people, our clients and our wider communities achieve their potential.
Ernst & Young refers to the global organization of member firms of Ernst & Young Global Limited, each of which is a separate legal entity. Ernst & Young LLP is a client-serving member firm of Ernst & Young Global Limited operating in the US. For more information about our organization, please visit www.ey.com.
About Ernst & Young Advisory ServicesThe relationship between risk and performance improvement is an increasingly complex and central business challenge, with business performance directly connected to the recognition and effective management of risk. Whether your focus is on business transformation or sustaining achievement, having the right advisors on your side can make all the difference. Our 23,000 advisory professionals form one of the broadest global advisory networks of any professional organization, delivering seasoned multidisciplinary teams that work with our clients to deliver a powerful and superior client experience. We use proven, integrated methodologies to help you achieve your strategic priorities and make improvements that are sustainable for the longer term. We understand that to achieve your potential as an organization you require services that respond to your specific issues, so we bring our broad sector experience and deep subject matter knowledge to bear in a proactive and objective way. Above all, we are committed to measuring the gains and identifying where the strategy is delivering the value your business needs. It’s how Ernst & Young makes a difference.
Ernst & Young is committed to minimizing its impact on the environment. This document has been printed using recycled paper.
© 2011 EYGM Limited. All Rights Reserved. EYG no. BT0156 BSC no. 1110-1297310
This publication contains information in summary form and is therefore intended for general guidance only. It is not intended to be a substitute for detailed research or the exercise of professional judgment. Neither EYGM Limited nor any other member of the global Ernst & Young organization can accept any responsibility for loss occasioned to any person acting or refraining from action as a result of any material in this publication. On any specific matter, reference should be made to the appropriate advisor.