andreas gagel, dirk lange, and karl schulte · comptest_2004_gagel_ 1 andreas gagel, dirk lange,...
TRANSCRIPT
Com
ptes
t_20
04_G
agel
_ 1
Andreas Gagel, Dirk Lange, and Karl Schulte
Technische Universität Hamburg-Harburg (TUHH), GermanyPolymers and Composites Section (5-09)
http://www.tuhh.de/kvweb
On the Relation between Crack Densities, Stiffness Degradation,and Surface Temperature Distribution
of Tensile Fatigue Loaded Glass-Fibre Non-Crimp-Fabric Reinforced Epoxy
Comptest 2004, September 21st to 23rd, Bristol, GB, 2004
Title
Com
ptes
t_20
04_G
agel
_ 2
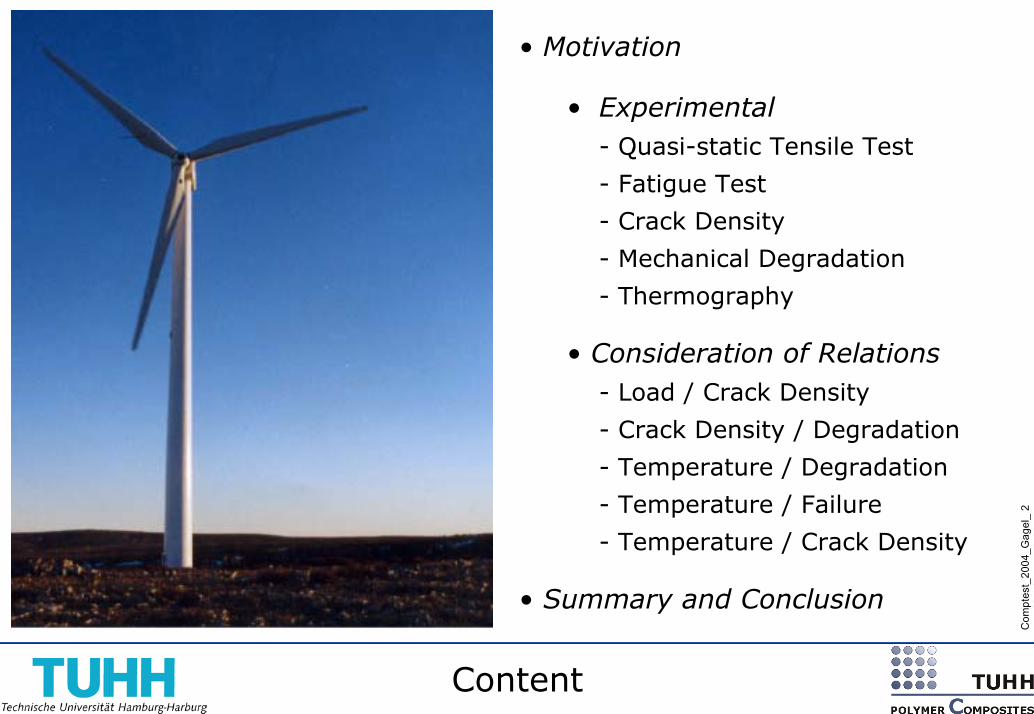
• Motivation
• Experimental- Quasi-static Tensile Test
- Fatigue Test
- Crack Density
- Mechanical Degradation
- Thermography
• Consideration of Relations- Load / Crack Density
- Crack Density / Degradation
- Temperature / Degradation
- Temperature / Failure
- Temperature / Crack Density
• Summary and Conclusion
Content
Com
ptes
t_20
04_G
agel
_ 3
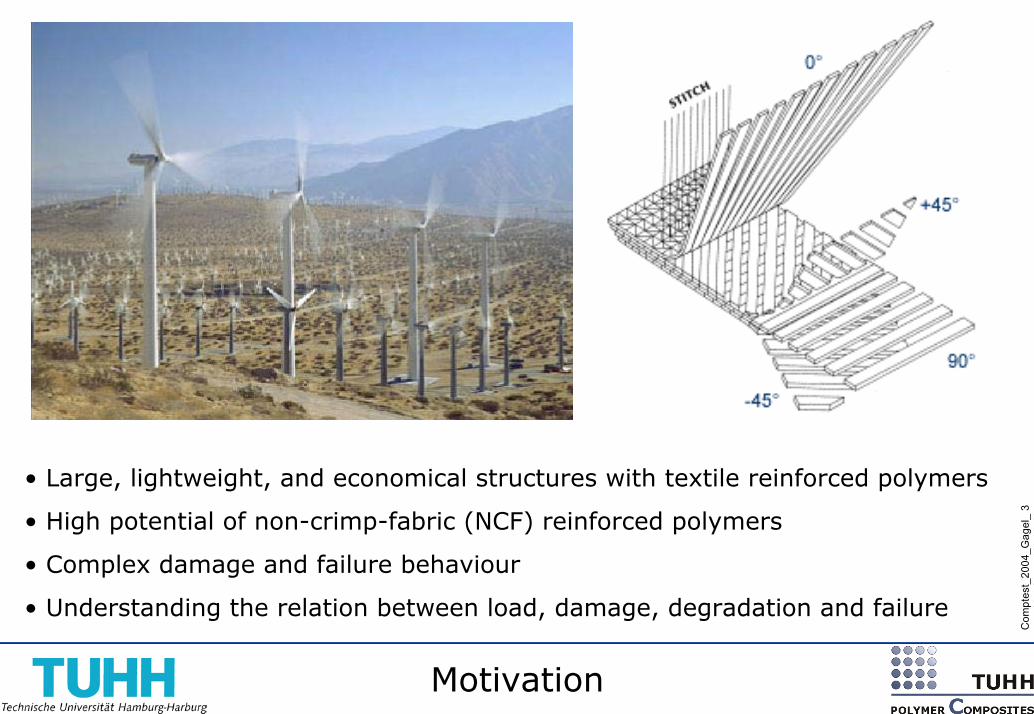
• Large, lightweight, and economical structures with textile reinforced polymers
• High potential of non-crimp-fabric (NCF) reinforced polymers
• Complex damage and failure behaviour
• Understanding the relation between load, damage, degradation and failure
Motivation

Com
ptes
t_20
04_G
agel
_ 4
Mechanical TestingMaterial0°
45°90°
-45°
• E-glass fibre non-crimp fabric• Epoxy L135i/H137 for RTM at RT• [0°(48%),45°(23%),90°(6%),-45°(23%)]am
• Specimens DIN EN-ISO 527-4
• Quasi-static tensile test
• Constant amplitude fatigue
• Stress/strain analysis
Optical analysis Thermography
20 mm
45°-crack
90°-crack
5.2
mm
+Load
Material and Experimental

Com
ptes
t_20
04_G
agel
_ 5
0
1000
2000
3000
4000
5000
6000
0 0,5 1 1,5 2 2,5
45° CD [1/m]
Cra
ck D
ensi
ty[1
/m]
Strain [%]
0
1000
2000
3000
4000
5000
6000
0 0,5 1 1,5 2 2,5
45° CD [1/m]
Cra
ck D
ensi
ty[1
/m]
Strain [%]
0,8
0,85
0,9
0,95
1
1,05
0 500 1000 1500 2000 2500 3000 3500 4000
Rel. Stiffness, FEA [1]Rel. Stiffness [1]
Rel
. Stif
fnes
s[1
]
+/- 45° CD [1/m]
0,8
0,85
0,9
0,95
1
1,05
0 500 1000 1500 2000 2500 3000 3500 4000
Rel. Stiffness, FEA [1]Rel. Stiffness [1]
Rel
. Stif
fnes
s[1
]
+/- 45° CD [1/m]
• Development of relative stiffness E/E0
measured and FEA prediction*
• About linear relation between stiffness
and crack density* A. Gagel, C. Müller, and K. Schulte, ECCM11, Rhode 2004
• Quasi-static tensile strain increments
• Optical measurement of crack density
• About linear increase with applied strain
• Onset of cracks between 0.2% and 0.3%
Crack Density and Relative Stiffnessunder Quasi-Static Tension

Com
ptes
t_20
04_G
agel
_ 6
• S-N curve
• Force controlled
• Tension – tension fatigue (R=0.1)
• Test frequency 5 Hz
• Interrupted after load increments
of 1000 cycles each
• Visual determination of crack density
by transmitting light microscopy
0
1000
2000
3000
4000
5000
6000
7000
8000
0 1000 2000 3000 4000 5000 6000
CD +/-45° [1/m]
Cra
ck D
ensi
ty +
/-45°
[1/m
]
Load cycle number [1]
σmax = 350MPaR = 0.1f = 5Hz
0
100
200
300
400
500
0 1 2 3 4 5 6 7
y = 611,13 - 70,603x R= 0,91201
Max
. stre
ss [M
Pa]
log(Nf ) [1]
0
100
200
300
400
500
0 1 2 3 4 5 6 7
y = 611,13 - 70,603x R= 0,91201
Max
. stre
ss [M
Pa]
log(Nf ) [1]
σmax = 350MPaR = 0.1f = 5Hz
Fatigue Test

Com
ptes
t_20
04_G
agel
_ 7
• Heterogeneous distribution while fatigue loaded
• Characteristic zig-zag pattern
• Final failure location early detectable* (n/Nf<0.1)* A. Gagel, B. Fiedler, and K. Schulte, 9th European-Japanese Symposium on
Composite Materials, Hamburg, 2004f=10Hz, σmax=0.6 σut, R=0.1
0
1
2
3
4
5
0 0,2 0,4 0,6 0,8 1
dTho
tspo
t-d
T sam
ple
[K]
n/Nf[1]
0
1
2
3
4
5
0 0,2 0,4 0,6 0,8 1
dTho
tspo
t-d
T sam
ple
[K]
n/Nf[1]
σmax = 350MPaR = 0.1f = 10Hz
f
0
10
20
30
40
50
60
70
0 0,2 0,4 0,6 0,8 1
dT(hot spot) [K]dT(sample) [K]
dT[K
]
n/N [1]
0
10
20
30
40
50
60
70
0 0,2 0,4 0,6 0,8 1
dT(hot spot) [K]dT(sample) [K]
dT[K
]
n/N [1]f
0
10
20
30
40
50
60
70
0 0,2 0,4 0,6 0,8 1
dT(hot spot) [K]dT(sample) [K]
dT[K
]
n/N [1]
0
10
20
30
40
50
60
70
0 0,2 0,4 0,6 0,8 1
dT(hot spot) [K]dT(sample) [K]
dT[K
]
n/N [1]
σmax = 350MPaR = 0.1f = 10Hz
Surface Temperature Distribution

Com
ptes
t_20
04_G
agel
_ 8
0,75
0,8
0,85
0,9
0,95
1
0
20
40
60
80
100
0 1000 2000 3000 4000 5000 6000 7000 8000
Edyn/Edyn0 [1] DTloc [K]DTglob [K]
Edy
n/Edy
n0 [1
] T-T0 [K
]
Cycles [N]
Stage I
Stage II
Stage III
dT(hot spot)dT(sample)
0,75
0,8
0,85
0,9
0,95
1
0
20
40
60
80
100
0 1000 2000 3000 4000 5000 6000 7000 8000
Edyn/Edyn0 [1] DTloc [K]DTglob [K]
Edy
n/Edy
n0 [1
] T-T0 [K
]
Cycles [N]
Stage I
Stage II
Stage III
dT(hot spot)dT(sample)
Load cycle number [1]
• Initial, steady and final stage of both stiffness decay and temperature increase
• Mean and hot spot temperature develop proportional until final failure occurs
• Stiffness develops inverse to samples mean temperature
Temperature and StiffnessEvolution while Fatigue

Com
ptes
t_20
04_G
agel
_ 9
• Temperature measurements along sample axis
• Existence of relative (but uncritical) hot (L02) and relative cold (L01) areas
• Temperature distribution does not change significantly with load increments
• Temperature difference about 10% of the samples mean temperature increase
f = 5Hz,σmax = 0.6 σut
R = 0.1
Interrupted FatigueDistribution of Surface Temperature
0
5
10
15
0 0,2 0,4 0,6 0,8 1
T(cold area) - T(amb) [K]T(hot area) - T(amb) [K]T(sample) - T(amb) [K]
T (col
d ar
ea) -
T (am
b) [K
]
n/Nf [1]
0
0,4
0,8
1,2
1,6
0 0,2 0,4 0,6 0,8 1
T (hot
are
a) -
T (col
d ar
ea) [K
]
n/Nf [1]
Temperature differencebetween hot – cold area

Com
ptes
t_20
04_G
agel
_ 10
Cold area
20mm20mm
n=1000 n=2000
2mm
2mm
n=3000 n=4000 n=5000
Hot area
• Defect free sample – no disturbances, voids, etc. visually detectable
• Relative hot and relative cold areas form while fatigue
• No obvious differences detectable with respect to damage types or distribution
Interrupted FatigueMeasurement of Crack Density

Com
ptes
t_20
04_G
agel
_ 11
0
1000
2000
3000
4000
5000
6000
7000
8000
0 1000 2000 3000 4000 5000 6000
CD +45°, hot area [1/m]CD +45°, cold area [1/m]CD -45°, hot area [1/m]CD -45°, cold area [1/m]CD +/-45°, hot area [1/m]CD +/-45°, cold area [1/m]
Cra
ck D
ensi
ty +
/-45°
[1/m
]
Load Cycle Number [1]
+/-45° cracks
+45° cracks
-45° cracks
• Same crack density measured in hot and cold areas
• Slight, but not significant difference in +45° and –45° crack densities
• Temperature distribution is not caused in local differences of the crack density
Crack Density in Hot and Cold Areas
Com
ptes
t_20
04_G
agel
_ 12
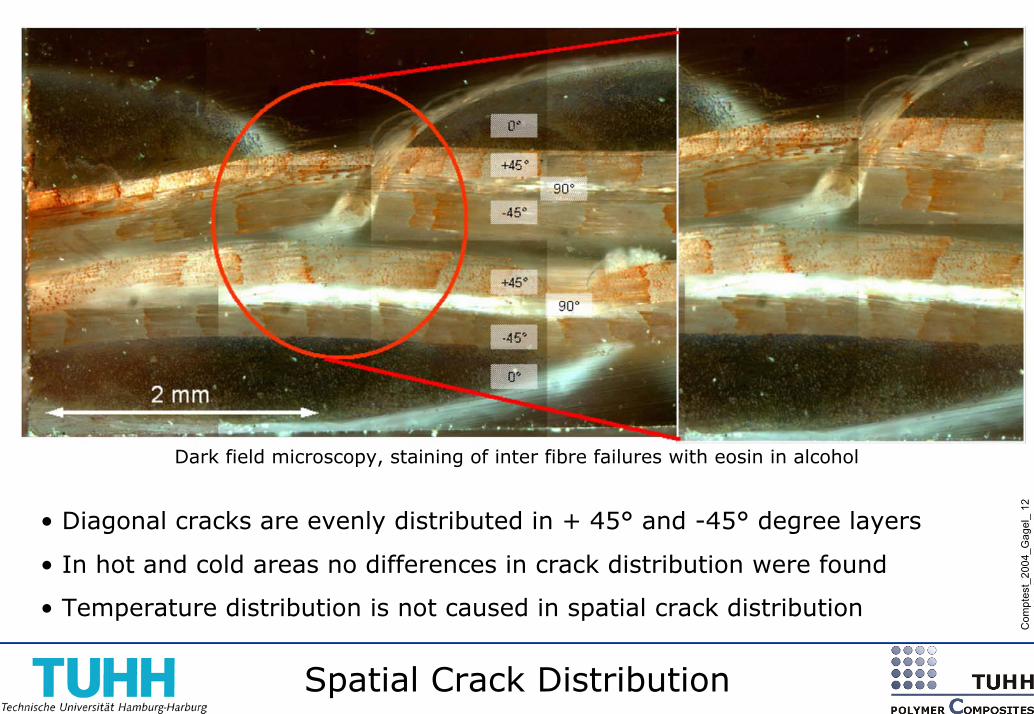
Dark field microscopy, staining of inter fibre failures with eosin in alcohol
• Diagonal cracks are evenly distributed in + 45° and -45° degree layers
• In hot and cold areas no differences in crack distribution were found
• Temperature distribution is not caused in spatial crack distribution
Spatial Crack Distribution

Com
ptes
t_20
04_G
agel
_ 13
Conclusions
1. For GF-NCF-EP under mechanical load the stiffness loss can be related to and
modelled by the crack density.
2. The location of the fatal failure in fatigue loaded GF-NCF-EP can be located via
thermography in an very early stage of the fatigue life but
3. The location of the fatal failure can not be related to the crack density.
⇒ Stiffness degradation and failure of GF-NCF-EP under fatigue load seem to be
governed by different mechanisms.
Summary
• Onset of inter fibre failure in GF-NCF-EP at low strains between 0.2 and 0.3%
• Three-staged surface temperature increase and stiffness decrease
• Characteristic surface temperature pattern at fatigue load
• Surface temperature and crack density distribution can not be correlated
• The stiffness decrease can be correlated to crack density
Summary and Conclusion