analyzing the impact of protective glazing on stained glass windows...
TRANSCRIPT

Analyzing the Impact of Protective Glazing on Stained Glass WindowsAuthor(s): Mark Gilberg, Sue Reilly, Neal VogelSource: Studies in Conservation, Vol. 47, No. 3 (2002), pp. 161-174Published by: International Institute for Conservation of Historic and Artistic WorksStable URL: http://www.jstor.org/stable/1506870Accessed: 14/10/2008 03:03
Your use of the JSTOR archive indicates your acceptance of JSTOR's Terms and Conditions of Use, available athttp://www.jstor.org/page/info/about/policies/terms.jsp. JSTOR's Terms and Conditions of Use provides, in part, that unlessyou have obtained prior permission, you may not download an entire issue of a journal or multiple copies of articles, and youmay use content in the JSTOR archive only for your personal, non-commercial use.
Please contact the publisher regarding any further use of this work. Publisher contact information may be obtained athttp://www.jstor.org/action/showPublisher?publisherCode=iich.
Each copy of any part of a JSTOR transmission must contain the same copyright notice that appears on the screen or printedpage of such transmission.
JSTOR is a not-for-profit organization founded in 1995 to build trusted digital archives for scholarship. We work with thescholarly community to preserve their work and the materials they rely upon, and to build a common research platform thatpromotes the discovery and use of these resources. For more information about JSTOR, please contact [email protected].
International Institute for Conservation of Historic and Artistic Works is collaborating with JSTOR to digitize,preserve and extend access to Studies in Conservation.
http://www.jstor.org

ANALYZING THE IMPACT OF PROTECTIVE GLAZING ON STAINED GLASS WINDOWS
Mark Gilberg, Sue Reilly and Neal Vogel
Summary-An Excel spreadsheet (WINVENT) that calculates the temperature distribution across the center of a double-glazed window is described. The spreadsheet was used to model a typical protective glazing installation for a stained glass window under both unvented and vented conditions where a vertical channel is created along the entire length of the glazing system. Analysis of the data generated by the spreadsheet is used to discuss the merits of protective glazing.
Introduction
Protective glazing is commonly defined as a sec- ondary layer of glass or plastic installed over the exterior of a stained glass window [1]. Many stained glass studios and window contractors in the United States have endorsed the use of protective glazing. Protective glazing has been promoted as an effective means of protecting stained glass windows against vandalism and severe weather as well as improving thermal performance. Recently, however, the merits of protective glazing have been ques- tioned [2-11]. Concern has been expressed that its installation may be causing serious damage to many stained glass windows across the United States by increasing condensation and heat build-up in the air space and by preventing maintenance. This has led to recommendations to eliminate pro- tective glazing when possible and, when necessary, to vent the airspace, preferably to the exterior, to encourage air circulation.
Few scientific studies have been conducted in the United States to assess the impact that protective glazing and its installation may have upon the long- term preservation of stained glass windows [12]. Though much research has been conducted in Europe on this topic, this research has focused pri- marily on moisture-related issues typically found in northern European climates [13-26]. In Europe, the corrosion of unstable mediaeval stained glass windows is a significant problem. Atmospheric pollu- tants, microbial growth and condensation destroy the glass structure and damage the painted glass. The installation of protective glazing is seen as a way of modifying the microclimate of a window that is con- stantly exposed to an aggressive environment. Under these conditions, most studies have concluded that protection can best be afforded by venting the pro- tective glazing to the interior, thereby maintaining the temperature of the stained glass as close as possible to that of the internal air and above the dew-point.
Received August 2000
In contrast, post-industrial (c. 1850) stained glass made in the United States is extremely stable and resistant to corrosion [1]. Condensation is primarily a problem because of its impact on wooden mem- bers and painted surfaces. While regional climate and the use of air-conditioning can impact venting choices, venting to the interior is often not a viable option for most American churches, where the cost of remounting the stained glass window within the window frame to accommodate vents is prohibi- tively high. Venting, if adopted at all, generally occurs to the exterior.
In order to assess the impact of installing protec- tive glazing on stained glass windows in churches in the United States, the authors have developed a Microsoft Excel spreadsheet (WINVENT) that calculates the temperature distribution across the center of a double-glazed window. The program incorporates a number of different convection cor- relations for the air space (interspace) between the glazing layers in order to simulate vented and unvented conditions to the exterior. The spread- sheet also allows the user to change the sky condi- tion from clear to cloudy and to input different glass types, gap widths and glazing heights. In addi- tion to calculating temperature distribution across the glazing layers, the spreadsheet also calculates the dew-point temperature within the interspace created by the installation of protective glazing and predicts the appearance of condensation on differ- ent glazing surfaces.
In the following study, a detailed description of the Microsoft Excel spreadsheet (WINVENT) is given and the predicted temperature distribution across the different glazing layers is compared with measured data collected from a stained glass window with and without protective glazing installed. Data were collected under extremely hot and humid con- ditions known to promote condensation on cool glazing surfaces. The merits of protective glazing will be discussed in terms of the results of this analysis.
Studies in Conservation 47 (2002) 161-174 161

M. Gilberg, S. Reilly and N. Vogel
Modeling unvented and vented protective glazing installations over stained glass windows
Established computer tools such as WINDOW 4.1 [27] and VISION 4 [28] can be used to determine the temperature distribution across an unvented glazing installation. These tools perform a one-dimensional analysis on the glazing system and account for the conductive, convective and radiant heat transfer through the system. The user specifies the indoor and outdoor air temperatures, incident solar radia- tion, and outdoor wind speed. Unfortunately, neither of these tools can model vented glazing systems, nor can they be modified to use other heat transfer correlations for modeling air movement.
To evaluate the thermal performance of vented stained glass windows with protective glazing, a spreadsheet application (WINVENT) was devel- oped that allows the user to select different convec- tion correlations to represent air movement on the interior [29], exterior [30], and between the glazing under both unvented [31] and externally vented [32-34] conditions. The one-dimensional heat trans- fer analysis is performed by iteratively solving for the temperature distribution across the glazing system (Figure 1). As with the computer tools mentioned above, the user inputs the indoor and outdoor air temperatures, incident solar radiation and outdoor wind speed. In addition, the user specifies the indoor and outdoor relative humidity and the program determines whether or not con- densation will occur on any of the glazing surfaces.
0 F- N
0
w
EXTERIOR
Surface 1
Node 1 2
I
2 3
3 4
ce u
0
Q i U)
INTERIOR
4
6 5
WINDOW 4.1 and VISION 4 can calculate the total solar transmittance, absorptance and reflect- ance of the glazing system from detailed spectral data for individual glazing samples. WINVENT calculates the total solar transmittance, absorptance and reflectance of the glazing system from the aver- age solar properties of the individual glazing sam- ples. This approximation has a negligible impact on the results because neither the stained glass nor the Lexan protective glazing is spectrally selective.
A one-dimensional heat transfer analysis is lim- ited in that it ignores the effects around the perime- ter of the glazing system (edge and frame effects), the conductance through the lead came, the varia- tion in glass color (i.e., absorptance and reflectance) of the stained glass window, and the temperature stratification between the top and bottom of the window. Even with these limitations, a one-dimen- sional heat transfer analysis has been shown to pre- dict surface temperatures that are in good agreement with actual measurements.
The data input screen and the interior, exterior and gap convection correlations for WINVENT are illustrated in the Appendix.
Methods and materials
In order to verify WINVENT, data were collected from a single stained glass window with protective glazing installed. The temperature, relative humidity and pressure within the air space created by the installation of the protective glazing over the stained glass window were monitored. The tempera- ture distribution across the glazing system was also monitored. The environmental conditions external to the air space were also monitored, including tem- perature, relative humidity, wind speed, and solar radiation incident upon the window.
Measurements were made with and without pro- tective glazing installed and under conditions where the protective glazing was both unvented and vented to the outside.
Data were collected under hot and humid condi- tions during the late summer in the southern United States when climatic conditions promote condensation on external glazing surfaces of air- conditioned buildings. Agreement between the model and the measurements was assessed under these conditions.
Mount Olive Chapel
Figure I Numbering system nodes of the glazing system.
for the surfaces and Mount Olive Chapel in Pineville, Louisiana, was selected as the field site to collect environmental data (Figure 2). The chapel was built in 1857 in an
Studies in Conservation 47 (2002) 161-174
4
c
162

Analyzing the impact of protective glazing on stained glass windows
Figure 2 Mount Olive Chapel, Pineville, Louisiana.
existing cemetery under the diocesan leadership of Leonardis Polk, First Bishop of Louisiana. It was reportedly built from the plans of the well-known ecclesiastical architect, Richard Upjohn [35]. The architectural features are typical of Upjohn, with vertical board and batten construction and arched windows. With the exception of the oak floor, the structure is constructed entirely of pine milled from local trees.
The stained glass windows are typical opalescent, art glass, 'catalog' windows [9]. From the 1880s, these windows were made by hundreds of studios throughout America, whose craftsmen had only to cut the glass and lead it. The designs were copied from pattern books and enlarged to fit any window size. The glass is generally of high quality and was supplied by a number of American factories located in the northeast and midwest. Rarely, glass was imported from Europe and used for catalog win- dows. This is the most prevalent window type in American houses of worship and can be found in buildings of all faiths.
Environmental data were collected from a single glass window referred to as Consider the Lilies of the Field. The window faces almost due south and receives direct sunlight from sunrise to early after- noon.
Stained glass window
Consider the Lilies of the Field is shown in Figure 3. It is a typical opalescent, art glass, memorial win- dow dating to the early twentieth century (c. 1910). The window is a single lancet, center pivot window without tracery. The stained glass is secured in a wood frame measuring approximately 10cm wide. From top to bottom the stained glass window measures 213cm (daylight, i.e., not including wooden frame). At its maximum the stained glass window measures 106cm wide (daylight).
Figure 3 Stained glass window ('Consider the Lilies of the Field'), Mount Olive Chapel, Pineville, Louisiana.
In 1983 protective glazing (Lexan) was installed over the stained glass window against the blind stop. The Lexan was divided into two sheets using heavy-duty aluminum T-bars with snap-on beads. The l/4in (6mm) Lexan was back-bedded and sealed with silicone sealant and the outer perimeter was glazed with silicone to assure a weatherproof installation. At this time the window was also sealed tight with silicone, preventing window opera- tion. When examined in 1998, the sealant around the perimeter of the protective glazing had failed and deteriorated to the point where it could be easily pulled away. The protective glazing had yellowed considerably, except around the edges where the aluminum had protected the Lexan from sunlight. The stained glass and lead came were in reasonably good condition, exhibiting little sign of corrosion, though the window had buckled near the bottom under the weight of the stained glass. The lead cames appeared loose in areas and some cracks in the stained glass panels were observed. With the
Studies in Conservation 47 (2002) 161-174 163

M. Gilberg, S. Reilly and N. Vogel
Table 1 Percentage of stained glass
Stained glass
Brown border Pink border Pink background White lily Yellow stem Blue blossoms Root-beer background White banner Light green leaf Dark green stem Green trefoil Red-yellow curl Light mottled background Dark mottled background
Manufacturer (code)
Hollander Glass (S411-15) Kokomo Opalescent Glass Co. (KOG 87) Kokomo Opalescent Glass Co. (KOG 86P) Hollander Glass (S307I) Hollander Glass (S317-1) Hollander Glass (K70ML) Hollander Glass (S411-15G) Hollander Glass (K 1MLX) Kokomo Opalescent Glass Co. (KOG 12) Hollander Glass (B3123) Kokomo Opalescent Glass Co. (KOG 126L) Hollander Glass (K214ML) Hollander Glass (K151P) Kokomo Opalescent Glass Co. (KOG 59G)
% of daylight area
16.9 14-6 13-8 11-5 10-3 87 48 4.1 2-6 1-6 1-4 0-1 02 0.1
exception of some paint loss, the wooden members, including the sill, were in good condition. No attempt had been made to ventilate the air space between the stained glass window and protective glazing, though failure of the sealant probably occurred in a relatively short period of time, thus 'self-venting' the window to the exterior.
Though the source of the stained glass used in the construction of the window is unknown, it was possible through visual examination to match the stained glass with samples of art glass provided by several common manufacturers (Kokomo Opalescent Glass and Hollander Glass Co.). Samples were selected that visually matched the color, density and texture of the stained glass. Approximately 17 different types of opalescent glass were used in the design of the stained glass
window (see Table 1). Of these, six made up over 75% of the total stained glass.
The lead came was estimated to constitute approximately 24% of the stained glass window, not including the wood frame.
Optical properties of art glass samples
The optical properties of 10 art glass samples matching the stained glass were measured (Table 2).
Hemispherical spectral transmittance and reflect- ance measurements were performed by DSET Laboratories, Atlas Weathering Group, on 5 x 5cm glass samples in accordance with ASTM Standard Test Method E903-96 [36]. Similar measurements were performed on samples of new Lexan as well as
Table 2 Optical properties of stained glass samples
Sample 0% transmittance
visible
Brown border Pink border Pink background White lily Yellow stem Blue blossom Root-beer background White banner Light green leaf Dark green stem Lexan (new) Lexan (yellowed)
7.5 16-5 16.5 20-9 21-3 10-9 0
28-1 7-4 2-7
82-7 73-8
solar
35.9 37.4 37-4 23-8 36-6 16-7 15-0 39.3 96
22-5 75-4 69-7
% reflectance
visible
3.5 20.2 20.2 66-0 22.4 9.4 3.3
48-8 67 98 7.9 7.2
solar
4-1 17-4 17-4 49-0 18.1 68 3-6
33-1 5.4 9.8 7-6 66
Studies in Conservation 47 (2002) 161-174 164

Analyzing the impact of protective glazing on stained glass windows
the original, yellowed Lexan. The measurements were performed with a Beckman 5240 spectropho- tometer utilizing an integrating sphere. Trans- mittance measurements were obtained in the solar spectrum from 2500 to 300nm at an incident angle of 7?. Total reflectance measurements were obtained in the solar spectrum from 2500 to 300nm at an incident angle of 15?.
The spectral data were integrated against the ASTM E891-87 [37] Air Mass 1.5 direct normal spectrum utilizing 105 weighted ordinates. Visible properties (380-780nm) were weighted by the pho- topic response of the eye, which is taken as the Y stimulus for the CIE 1931 Standard Observer.
Near-normal infrared reflectance measurements were performed by DSET Laboratories in accord- ance with ASTM E408-71, Method A [38] (Table 3). A Gier Dunkle Instruments infrared reflectometer model DB 100 was utilized for the measurements. Near-normal emittance for the glass samples was calculated from Kirchhoffs relationship. Normal emittance values were converted to hemispherical from National Fenestration Rating Council Test Method 301-93 [39].
The shading coefficient and U value for the art glass and Lexan samples were also measured. The shading coefficient and U-value data were calcu- lated in accordance with the guidelines stated in the 1989 ASHRAE Fundamentals Handbook [40].
Because of the inhomogeneous nature of all the glass samples, the measured values determined in the above must be considered as approximate.
Installation of protective glazing
Both unvented and vented conditions were tested using new and old protective glazing.
In preparation for monitoring, the original pro- tective glazing was removed and the window and wood sill were cleaned of all dirt and debris and residual caulking. The original caulking that was used to seal the stained glass window shut was removed and replaced with new caulking. New pro- tective glazing was installed by securing two sheets of Lexan to the wood trim of the window with screws and then sealing all edges with silicone caulk, creating a continuous air space approxi- mately 1.25cm deep between the stained glass and the protective glazing.
The protective glazing was later removed and a new sheet of Lexan was similarly installed over the stained glass window; however, no attempt was made to seal the air space at the top and bottom but only along the sides (Figure 4).
This procedure was repeated with the original, yellowed Lexan, similarly installed.
Environmental monitoring
The temperature and relative humidity inside and outside the church were monitored using a Smart Reader 2 temperature and humidity logger (ACR Systems, Inc.). A single sensor was placed inside the church, near the window but away from direct sun- light, approximately half way up the stained glass. A second sensor was placed outdoors inside a radi- ation shield adjacent to the stained glass window. Relative humidity and temperature data were col- lected at a sample rate of every 15 minutes and downloaded off-site using Trend Reader datalogger analysis software (Version 1.0 for Windows).
The temperatures of the surface of the stained glass and the protective glazing were measured using internal/external temperature loggers (StowAway
Table 3 Total emittance measurements of stained glass samples
Sample IR reflectance measured
Brown border Pink border Pink background White lily Yellow stem Blue blossom Root-beer background White banner Light green leaf Dark green stem Lexan (new) Lexan (yellowed)
0 11 0.12 0-12 0-11 0-12 0 11 0 10 0-12 0.12 0.11 0-07 0-06
Near-normal emittance calculated
0'89 0-88 0'88 0'89 0'88 0'89 0-90 0'88 0'88 0-89 0-93 0-94
Hemispherical emittance calculated
0'84 0-83 0'83 0-84 0-83 0-84 0-85 0-83 0-83 0-84 0'88 0'89
Studies in Conservation 47 (2002) 161-174 165

M. Gilberg, S. Reilly and N. Vogel
PROTECTIVE GLAZING
EXTERIOR INTERIOR
STAINE GLASS
Figure 4 Schematic representation of vented enclo- sure.
XTI, Onset Computer Corporation) with an exter- nal temperature probe. The temperature of the surface of the protective glazing (surface 1) was measured at approximately 40cm from the top and bottom of the glazing. To measure the temperature of the stained glass, probes were secured to the sur- face of the stained glass (surface 4) at the same height as the temperature probes mentioned above. For purposes of comparison, additional tempera- ture probes were also placed along the entire length of the stained glass window. Temperature data were collected at a sample rate of 30 minutes and down- loaded off-site using Box-Car Pro Version 3.5 for Windows.
Incident solar radiation was measured using a LI-20X pyranometer. The sensor was mounted on the right trim of the stained glass window, approxi- mately 2m off the ground, using silicone caulk.
Wind speed was measured using an anemometer (Campbell Scientific model 03101-5). The anemome- ter was mounted onto a 2m galvanized pipe and placed several meters in front of the stained glass window, away from adjacent trees and shrubs.
The temperature and relative humidity within the air space were measured using a temperature/RH probe (Campbell Scientific model CS500). Probes were placed approximately 40cm from the top and bottom of the air space.
The pressure differential within the air space was monitored using a digital pressure gauge (Energy Conservancy model DG-2). The pressure difference between the top and bottom of the interspace was monitored by placing the input pressure 40cm from the top of the protective glazing within the air space and the reference pressure 40cm from the bottom of the protective glazing. The DG-2 pressure sensor takes eight pressure readings per second. Pressure readings were time-averaged over one-second intervals.
Data were collected by interfacing the pyranome- ter, anemometer, pressure sensor, and temperature and humidity probes with a datalogger (Campbell Scientific model CR10X) and downloaded off-site. The datalogger was programmed to download data into final storage every 30 minutes.
The observed temperature distribution across the glazing layers was then compared with the corre- sponding temperature distribution predicted by the WINVENT model under the same environmental conditions using data collected for both unvented and vented protective glazing.
Environmental data were collected during the months of August 1998 and September 1999. During this period, north/central Louisiana experienced an extremely dry, hot summer. Outdoor temperatures in excess of 35?C were typical. At night, outdoor tem- peratures rarely dropped below 24?C. During the day the outdoor relative humidity varied between 40 and 70%, though at night and early morning it would rise to nearly 95% RH. Despite continuous air-conditioning during the day, the chapel could not maintain a constant set-point (20?C) and the temper- ature gradually increased due to solar heat gain through the stained glass windows.
Results and discussion
As part of this study, a number of different convec- tion correlations for the air cavities and indoor and outdoor surfaces were investigated. The convection correlations for unvented cavities found in Basic Heat Transfer [41], WINDOW 4.1 [27], VISION 4 [28], Wright [34] and Zhao et al. [31] yielded com- parable results.
Little has been published regarding heat transfer in vented cavities that can be directly translated to this study. Convection correlations for vertically vented channels published by Sparrow [32] and Sefcik [33] were incorporated into WINVENT and yielded similar results. Sefcik's work applies to vented channels with openings that are one-third (at the smallest) of the width of the channel. Sparrow's work covers vented channels, with the top and bottom of the channels open, in which the
Studies in Conservation 47 (2002) 161-174 166
Lf
Analyzing the impact of protective glazing on stained glass windows
60
50
G 40
2a 30 E * . . * - . i 20
10
0
60
- observed -- predicted
0 200 400 600 800 1000 1200 1400 1600 1800 2000 2200 2400
time
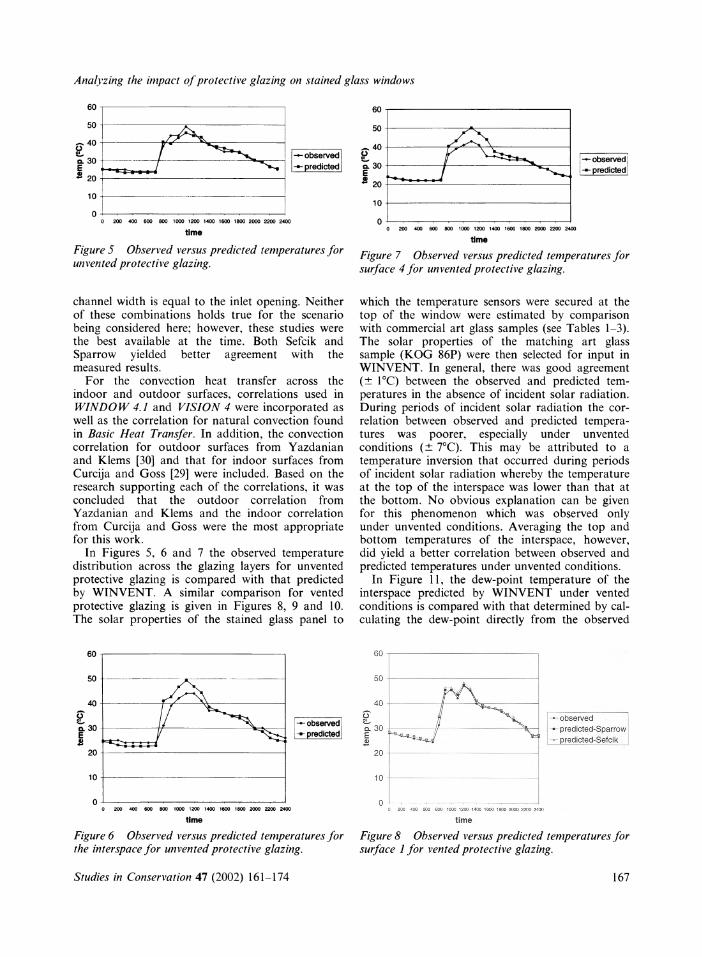
Figure 5 Observed versus predicted temperatures for unvented protective glazing.
channel width is equal to the inlet opening. Neither of these combinations holds true for the scenario being considered here; however, these studies were the best available at the time. Both Sefcik and Sparrow yielded better agreement with the measured results.
For the convection heat transfer across the indoor and outdoor surfaces, correlations used in WINDOW 4.1 and VISION 4 were incorporated as well as the correlation for natural convection found in Basic Heat Transfer. In addition, the convection correlation for outdoor surfaces from Yazdanian and Klems [30] and that for indoor surfaces from Curcija and Goss [29] were included. Based on the research supporting each of the correlations, it was concluded that the outdoor correlation from Yazdanian and Klems and the indoor correlation from Curcija and Goss were the most appropriate for this work.
In Figures 5, 6 and 7 the observed temperature distribution across the glazing layers for unvented protective glazing is compared with that predicted by WINVENT. A similar comparison for vented protective glazing is given in Figures 8, 9 and 10. The solar properties of the stained glass panel to
60
50
40
20 a 30 E ? ,
20
10
0
0 . 30
E ' 20
0
-observed -predicted
0 200 400 600 800 1000 1200 1400 1600 1800 200 2200 2400
time
Figure 7 Observed versus predicted temperatures for surface 4 for unvented protective glazing.
which the temperature sensors were secured at the top of the window were estimated by comparison with commercial art glass samples (see Tables 1-3). The solar properties of the matching art glass sample (KOG 86P) were then selected for input in WINVENT. In general, there was good agreement (+ 1?C) between the observed and predicted tem- peratures in the absence of incident solar radiation. During periods of incident solar radiation the cor- relation between observed and predicted tempera- tures was poorer, especially under unvented conditions (? 7?C). This may be attributed to a temperature inversion that occurred during periods of incident solar radiation whereby the temperature at the top of the interspace was lower than that at the bottom. No obvious explanation can be given for this phenomenon which was observed only under unvented conditions. Averaging the top and bottom temperatures of the interspace, however, did yield a better correlation between observed and predicted temperatures under unvented conditions.
In Figure 11, the dew-point temperature of the interspace predicted by WINVENT under vented conditions is compared with that determined by cal- culating the dew-point directly from the observed
60
50
- observed I - predicted
.1
i.1 40
O
a. 30 . E - -.20 --
20
- observed -- predicted-Sparrow
predicted-Sefcik
10
0 200 400 600 800 1000 1200 1400 1600 1800 2000 2200 2400
time
Figure 6 Observed versus predicted temperatures for the interspace for unvented protective glazing.
time
Figure 8 Observed versus predicted temperatures for surface I for vented protective glazing.
Studies in Conservation 47 (2002) 161-174
so
An) PI -A - \
I
i()
. . .
. . . . . .
I I
167

M. Gilberg, S. Reilly and N. Vogel
30
--observed l -_- predicted-Sparrow
predicted-Sefcik
25
20
Q 15 E 4)
10
- measured dewpoint - predicted dewpoint
5
0 200 400 600 800 1000 1200 1400 1600 1800 2 2200 2400
time
Figure 11 Measured versus predicted dew-point tem- perature for the interspace for vented protective glaz- ing.
relative humidity and temperature of the interspace. In general, there was good agreement between the observed and predicted dew-point temperatures (+ 2?C). This is not surprising, given that the measured values of relative humidity for the inter- space and outdoors were fairly close and, under vented conditions, WINVENT uses the outdoor rel- ative humidity to predict the interspace dew-point.
In the absence of any information regarding the air exchange rate between the interspace and the indoor and outdoor environments, it is difficult to predict the dew-point temperature of the interspace using WINVENT. Preliminary experimental trials showed that there was considerable air exchange between the interspace and the interior of the build- ing, due to cracks and fissures in the stained glass as well as the looseness of the lead came. In Figure 12, the dew-point temperature of the interspace predicted by WINVENT under unvented conditions is compared with that determined by calculating the dew-point directly from the observed relative humidity and temperature of the interspace. In Figure 12, both the outdoor and indoor relative humidity were used to predict the dew-point tem- perature. As expected, the actual dew-point temper- ature fell somewhere between the two predicted values.
60
50
40
a 30 .. E _, - 20
10
/ - o e ..
L. v
, -- observed .- _ --- predicted-Sparrow
predicted-Sefcik
Similar agreement between observed and pre- dicted temperature distributions across the glazing layers under both vented and unvented conditions was found using data collected from sensors placed near the bottom of the window. As reported above, the solar properties of the stained glass panel to which the temperature sensors were secured at the bottom of the window were estimated by compari- son with commercial art glass samples. The solar properties of the matching art glass sample (KOG 11MLX) were then selected for input in WIN- VENT.
Good agreement between the observed and pre- dicted temperatures was also observed when the new Lexan was replaced with the original, yellowed Lexan and the optical properties of the latter were input into WINVENT. As predicted by WIN- VENT, installation of the yellowed Lexan did not appear to reduce the solar heat gain enough to have a significant impact on the temperature distri- bution across the glazing system.
In the absence of protective glazing, condensation
30 -
25
20
. 15
10 * ., . * I.w
* observed dewpoint
- predicted dewpoint using internal RH
predicted dewpoint using external RH
time
Figure 10 Observed versus predicted temperatures for suiface 4 for vented protective glazing.
time
Figure 12 Observed versus predicted dew-point tem- peratures Jfr the interspace for unvented protective glazing.
Studies in Conservation 47 (2002) 161-174
60
50
40
a 30 ., E 0
'"
20
10
0 - ; * . . : - -:. -::: - :.: e >. ..., . .
time
Figure 9 Observed versus predicted temperatures for the interspace for vented protective glazing.
. -l .
. - ,,
0 . 1.-
,
A .1.~~~ I
168

Analyzing the impact of protective glazing on stained glass windows
was observed in the early morning on surface 3. With the installation of protective glazing, conden- sation was observed only on surface 1. No conden- sation was observed on surface 2 or surface 3, though close inspection of the entire surface was hindered by the presence of the protective glazing. Though WINVENT failed to predict the occurrence of condensation on surface 1 under both vented and unvented conditions, the dew-point tempera- ture of the exterior air was only 1?C higher than the surface temperature of the protective glazing during the early morning hours.
WINVENT did not predict the occurrence of condensation on surface 3, though under vented conditions the exterior dew-point temperature was only 1-2?C higher than surface 3 during the early morning hours. Using clear sky conditions instead of cloudy sky conditions to calculate the sky radia- tion incident on the glazing did result in lower glazing temperatures and thus condensation on all exterior glazing surfaces (surfaces 1 and 3); how- ever, the correlation between observed and pre- dicted temperatures for the various glazing layers was not as strong. The decision to model clear or cloudy skies is problematic, though within the fen- estration industry it is accepted practice to use cloudy sky conditions when modeling temperature distribution across glazing layers.
Implications of installing protective glazing on stained glass windows
When glazing systems are compared under the same environmental conditions, the impact of protective glazing can be readily predicted by WINVENT (Figure 13). WINVENT predicts a slight increase in temperature of the stained glass (surface 4) during periods of incident solar radiation following the installation of protective glazing. Venting to the exterior reduces the temperature of the stained glass slightly, while increasing the size of the gap width has little impact.
60
-40
, .
20
- no protective glazing
-", --- unvented protective ",, '. glazing
vented protective glazing i12.7mm)
10 ?
time time
Figure 13 Temperature of surface 4 before and after installation of protective glazing.
The predicted increase in temperature of the stained glass following the installation of protective glazing was not observed in practice. While it is dif- ficult to make comparisons using data collected on different days, it was readily apparent from studies conducted on successive days under similar climatic conditions that the installation of unvented protec- tive glazing resulted in a decrease in temperature of 3-4?C during periods of incident solar radiation. The reasons for this decrease are unclear, particu- larly in light of the fact that the introduction of a colored glazing layer with low solar transmission should result in an increase in temperature, as pre- dicted by other fenestration modeling programs such as Windows 4.1 [27]. It may be attributable to an observed temperature inversion within the inter- space that occurred during periods of incident solar radiation that resulted in higher temperatures at the bottom of the interspace. This phenomenon was observed only under unvented conditions and deserves further investigation.
As predicted, the temperature of the interspace was significantly higher than that outdoors during periods of incident solar radiation. Increasing the gap width did not impact the temperature of the interspace. Such an increase in temperature would cause painted wooden surfaces to blister and accel- erate the rate of corrosion of lead came. The increased temperature may also result in sagging and buckling of the stained glass panels as a conse- quence of the creep characteristics of lead came [12].
The installation of protective glazing and the decision to vent to the exterior or interior is prob- lematic. In general, protective glazing must always be vented, regardless of type of installation or cli- mate, to avoid condensation within the interspace that is harmful to the stained glass window and its support system. In hot and humid climates where air-conditioning is used, venting the protective glaz- ing to the exterior introduces warm, moist air to the interspace, thus increasing the possibility of condensation on the cool surface of the stained glass window. Venting to the interior would circum- vent this problem but, as previously mentioned, it is a less viable option given the higher costs involved in altering a stained glass window to accommodate interior vents.
An unvented, airtight system will prevent con- densation in the interspace but cannot in fact be achieved or maintained in practice. It is simply not possible to hermetically seal a stained glass window. Seals will eventually fail, resulting in air exchange between the interspace and the outside, and, unless the lead cames are tight, some air exchange will also occur between the interspace and the inside. Furthermore, any moisture inadvertently
Studies in Conservation 47 (2002) 161-174
R . .
.
... .
.
1r
169

M. Gilberg, S. Reilly and N. Vogel
trapped within the interspace cannot be readily dissipated.
From a practical standpoint, venting to the exte- rior is the most sensible option when protective glazing is applied under hot and humid conditions. Ideally, the top and bottom of the interspace should be left open to maximize air movement. Thus, if condensation occurs, the moisture can readily evaporate. Obstructions within the inter- space, such as structural supports, that deflect air- flow along the stained glass window causing the air to re-circulate, should be minimized. Moreover, the distance between the stained glass and protective glazing should be increased as much as possible to encourage the flow of air into the interspace. Increasing the depth of the airspace from 1 to 5cm has been shown to increase the flow rate signifi- cantly through the clearance between the protective glazing and the stained glass window [26]. Finally, the protective glazing should be designed to allow for easy access and periodic inspection and main- tenance of the stained glass window.
Serious consideration should always be given to not installing protective glazing in the first place. Unless there is a threat of vandalism or inclement weather that may physically damage the stained glass window, most stained glass windows in the United States do not require protective glazing. The most stable, albeit most expensive, protective glaz- ing system is an isothermal one where the stained glass is contained within a controlled environment. Screens, or laminated glass vented externally, pro- vide excellent cost-effective protection against van- dals when such protection is truly necessary. As in all endeavors, the careful consideration of all exist- ing conditions and options will result in the most successful installation. Aesthetically, nearly all leaded glass looks best uncovered, as designed orig- inally. The onus is on the architect, client or con- tractor to devise other ways to improve security and minimize vandalism around the property (fenc- ing, landscaping, lighting, etc.) to negate the need for protective glazing.
Conclusions
WINVENT is an Excel spreadsheet that calculates the temperature distribution across the center of a stained glass window when protective glazing is installed external to the stained glass surface. The spreadsheet incorporates a number of different con- vection correlations for the space between the glaz- ing layers in order to simulate unvented and vented air spaces. The spreadsheet also compares the dew- point temperature of the air space with the coldest temperature of the surfaces facing the gap and
determines whether or not condensation will occur. The program allows the user to select the interior and exterior convection correlations and change sky conditions between clear and cloudy as well as input different glass types, gap widths and glazing heights.
WINVENT can be used to model a typical pro- tective glazing installation for a stained glass win- dow under both unvented and vented conditions where a vertical channel is created along the entire length of the glazing system without obstruction. Under vented conditions, the channel is open to the exterior along its entire length at the top and bottom. Given these conditions, WINVENT may be used to predict the microclimate of the air space created by the installation of the protective glazing in a hot and humid climate. These data can be used to assess the long-term impact of protective glazing on stained glass windows and associated structural supports.
Copies of WINVENT may be obtained upon request from the first-named author. The applica- tion of WINVENT is relatively straightforward and is designed for ease of use by stained glass conser- vators.
Acknowledgements
The authors would like to thank the Episcopal Church of Pineville for allowing access to the chapel. Special thanks to Edward Hancock for assisting in data collection. Optical properties of stained glass samples were performed by Atlas Weathering Services Group, DSET Laboratories, Phoenix, Arizona.
Suppliers of materials
Digital pressure gauge, model DG-2: The Energy Conservancy, Minneapolis, Minnesota, USA.
CR10X measurement and control module, R.M. Young Wind Sentry anemometer, CS500 tem- perature and relative humidity probe: Campbell Scientific, Inc., 815 West 1800 North, Logan, UT 84321-1784, USA.
LI-20X pyranometer: LI-COR, Inc., 4421 Superior Street, Lincoln, NE 68504, USA.
StowAway XTI datalogger and temperature probes; solar radiation and rain shield: Onset Corporation, 470 MacArthur Blvd, Bourne, MA 02532, USA.
Smart Reader 2 temperature and relative humidity datalogger: ACR Systems, Inc., Unit 210, 12960-84th Avenue, Surrey, BC, Canada V3W 1K7.
Studies in Conservation 47 (2002) 161-174 170

.- /hi/'zi/.ilt /h' 1 I/ , /ic'/ l ii/ f I / fi'c ' i 'i' . /cl /if .' /f sliflcd .'/a/.' . it-iI/(fii.'
Appendix: \\'IN\'ENT protective glazing analysis
INPUT DATA
Environmental Conditions Results Inside Temperature (C) 27.7 Surface 2 Temperature (c)I 49.2 Outside Temperature (C) 34.9 Surface 3 Temperature (C) 46.2 Outdoor Relative Humidity (%) 48 Avg. Gap Temperature (C) 47.7 Indoor Relative Humidity 70 Gap Dewpoint Temperature (C) Asmes .eted: ou:slde
Windspeed (mIs) 0.6 Interior Dewpoint Temp. (C) 21.7 Ir cident Solar (W/m2) 559
Glazing System
[New Lexan
[ Opal
Glazing Cond. Solar Front Back Thick. (mm) (Wlm-C) Trans. Front Ref. Back Rfl. Emitt. Emitt.
5.79 0.20 0.754 0.076 0.076 0.88 0.88 Exterior 2.90 0.90 0.374 0.174 0.174 0.830 0.830 Interior
Note front is facing the outside, back is facing the inside
iGap between Glazing (mm) I 12.7 I
Area of Inlet Opening (m2) 0.0116
|Height of Glazing System (mm) 1956 Area of Outlet Opening (m2) 0.0116 Width of Opening (mm) 12.7
Area of Glazing (m2) 1.3935
Calculate System Solar.Trnsttanes'e, :: Re*fecte : ::ltA: ::: :::t ::: ..";!:".. '. , : :..... .:.....:...... , :; .::
T.a-t :ltt':i-: ::: .. i... :! '::: i....::: 'i 29
. "'"~ ': .'. .' . .................... .... ::: ' .. '.:. .. :: . .::
?Tr"nsns tta :;n:e -:::::.0.0. 29 Re4ftect-an e : ::O.-:: :M::: 0.18 0.18
Absptanc ::: i : 0.19 0.35
Solve for: .mperatures:A .coGlazing Sy.s ::
I: Sry t IdlafItr S:. :::: Cloudy Room radiatIon: 40i41 Wttt.
Radiation sigma j 1.71E-09] sky emiss I1 Clear sky 0.861 (Swinbank |Cloudysky 1 J rrn emiss 1j
:: TI: .3 82.49 519 581 152.5 0 0.0::
:i: 46.3 82.49 519 581 152.5 0 0.0
: . . .. ::: ::.:...::: .:.. ...:...:;:.::.. :.:.-:.:.-:;. ....'o. 4 8 . u u u 1 .
:: :!::!: -.3: -49.2 61.5 539 610 44.9 0 0.0 '. .::: :..::: . :: : .:: .: . : :: i.: ii: i i 46.2 61.5 490 593 44.9 0 0.0
'i : ::S; : ... . ::: ; ::0 463 0 08 0 00 9 .0 193 0.0 : . ::::; ..: : :: ; ;;:: 46.0 -45.07 488 567 -148.0 0 0.0
"i-.: .l. No Condensation
.:i:;I"- No Condensation on Interior
!;-i No Condensation on Exterior
(Assumes vented to outside)
Tgap 117.8
In(T) 6.3587326 In(pw) Water Vapor Pressure 0.7659819 -0.266597
Tin 81.9
| in(T) 6.29439851 In(pw)
[Water Vapor Pressure 0.37733651 -0.974618
Tout 94.8
[ In(T) 6.3180488| In(pw)
[Water Vapor Pressure 0.3896413 -0.942529
uAPr LUNVEIvn IUN UKrICLATL ILUN (E45, Cto
qcgap -6.5 "Basic Heat Transfer" enclosed cavities
qclblsi -65 WINDOW 4.1: enclosed cavities with gaps less than 1 375"
qvent 112.3 NCPT report from Inspired Partnerships SPECIFY SIS20, SIS21. SI$23
.qcvent Used now 61.5 Sefcik: falls apart at low inlet-to-gap width ratios(G.'W<.33). SPECIFY Si22
[qcsparr 31.6 Sparrow: vented cavities. (vent opening=gap width) Need glazing height, ScS20
ocsDC142 -6.5 Wright (1996) -used in SPC142; for 5<htgap<100 aczhao -6.5 Zaho et. al. (1997)- see "Convective Heat Transfer Correlations for Fenestration Glazing Cavities: A Review" ASHRAE SE-99-2-2
Exterior convection correlations (E43) qcext (Basic Heat Transfer-natural
convection) 26.49 "Basic Heat Transfer"
qcelem (KLEMS) Used Now 82.49 Yazdanian and Klems (10/93)
qcout 139.27 WINDOW 4.1
Interior convection correlation: (E48) qcirn -67.40 WINDOW 4.1
qcext (Basic Heat Transfer-natural
convection) -52.68 "Basic Heat Transfer"
cinnew Used Now -45.07 Curcija and Goss recommended (12/95)
.S'z/i'.s in ('I,.Nr'il//io,n 47 (2()()2) 161-174
TemperatueI Node : .: .. ....:....
*: . . .... ..' : :.:: . ::.... ..:::: ... :..... ..
Average Temperature in Gap (C) Dewpoint Temperature of Air in Gap (C)
Dewpoint Temp. of Interior Air ( C) Dewpoint Temp. of Exterior Air ( C)
I . . . . . - . - -
* - - . .............. . _,
.... .. .? .. ....... ........ ... -....... . -..-- .... .. .. , ,, .
. .. - ...
I:

M. Gilberg, S. Reilly and N. Vogel
References
1 'The history of protective glazing', Stained Glass, Winter (1996) 306-316.
2 SLOAN, J., 'Protective glazing: is it necessary?', Professional Stained Glass 7 (1987) 34-45, 38-39, 42-46.
3 SLOAN, J., 'Is stained glass protective glazing necessary?' in Common Bond, New York Landmarks Conservancy, New York (1990) 4-7.
4 FEMENELLA, A., 'Protective glazing', Glass Art, September/October (1990) 18-21.
5 FEMENELLA, A., 'Installing and ventilating pro- tective glazing', Inspired, Winter (1993).
6 SLOAN, J., 'Ventilating external glazing', Stained Glass, Winter (1993).
7 SLOAN, J., Conservation of Stained Glass in America, Albert Lewis, New York (1993).
8 VOGEL, N., 'Stained glass protection: friend or foe', Amazing Space, Summer (1993).
9 VOGEL, N., and ACHILLES, R., Preservation Brief No. 33. The Preservation, Repair of Historic Stained and Leaded Glass, Preservation Assistance Division, National Park Service, Washington DC (1993).
10 VOGEL, N., 'Higher standards needed for pro- tective glazing', Traditional Building 10 (1997) 86, 130.
11 'Protective glazing for stained glass windows', Stained Glass, Fall (1996) 186-187, 226-235.
12 INSPIRED PARTNERSHIPS, INC., Protective Glazing Study, US Department of the Interior, National Park Service, National Center for Preservation Technology and Training Publi- cation No. 1996-06, Natchitoches (1996).
13 NEWTON, R., and DAVIDSON, S., Conservation of Glass, Butterworths, London (1989).
14 JUTTE, B.A.H.G., MARSCHNER, H., and LANGENSTEIN, Y., 'Aussenschutzverglassung: Messergebnisse in der St. Janskirche zu Gouda' in Glaskonservierung historische Glasfenster und ihre Erhaltung (Internationales Kolloquim, Munchen und Niimberg), Bayerisches Landesamt fur Denkmalpflege, Munich (1985) 110-115.
15 BACHER, E., 'Aussenschutzverglassung klima- technische versuche', CVMA News Letter 28 (1978) 6-8.
16 JUTTE, B., 'Protective glazing: results of mea- surements at Gouda', CVMA News Letter 39/40 (1986) 28-31.
17 VAN TREECK, P., 'Protective glazing of the medieval stained glass on Regensburg Cathedral', CVMA News Letter 41/42 (1988) 23-25.
18 TRUMPLER, S., 'Experience with protective glaz- ing in Switzerland', CVMA News Letter
41/42 (1988) 19-22. 19 OIDTMANN, S., 'Aussenschutzverglassung: Unter-
suchungen und Messungen', CVMA News Letter 45 (1994) 29-30.
20 BETTEMBOURG, J.M., 'Conservation des vitraux par une verriere exterieure', CVMA News Letter 41/42 (1988) 7-14.
21 LEISSNER, J., and FUCHS, D.R., 'Investigations by glass sensors on the corrosive environ- mental conditions at stained glass windows with protective glazings in Europe' in Materials Issues in Art and Archaeology III, ed. P.B. VANDIVER, J.R. DRUZIK, G.S. WHEELER and I.C. FREESTONE, Materials Research Society Symposium Proceedings Vol. 267, Materials Research Society, Pittsburgh (1992) 1031-1038.
22 FUCHS, D.R., and SCHMIDT, H., 'Materials sci- ence-new imputs in the field of preservation of historic stained glass windows' in 2nd International Conference on Non-Destructive Testing, Microanalytical Methods and Environ- ment Evaluation for Study and Conservation of Works of Art, Istituto Centrale per il Restauro, Rome (1988) 3.1-3.12.
23 FRODL-KRAFT, E., 'Die Sicherung und Kon- servierung der Bildfenster des Regensburger Doms 1974-1984', Jahrbuch der bayerischen Denkmalpflege 38 (1984) 61-80.
24 BETTEMBOURG, J.M., 'Preventive conservation of stained glass windows' in Preventive Conservation: Practice, Theory and Research, IIC, London (1994) 110-115.
25 LAUIAT, G., and LE GARREC, S., 'Modelisation des ecoulements d'air et des transferts ther- miques dans les espaces verriere-vitrail ven- tiles' in Conservation commune d'un patrimoine commun. ler colloque du programme franco- allemand de recherche sur la conservation des monuments historiques, Karlsruhe (1993) 299-304.
26 BELHARAT, S., GARNIER, V., DESRAYAUD, G., and LAUIAT, G., 'Modelisation et simulation
numerique des transferts de chaleur et de
vapeur d'eau dans les verrieres de protection des vitraux', in Conservation commune d'un
patrimoine commun: 2eme colloque du pro- gramme franco-allemand de recherche sur la conservation des monuments historiques, Bonn (1996) 113-123.
27 ARASTEH, D.K., FINLAYSON, E.U., and HUIZENGA, C., Window 4.1. Program Description, A PC Program for Analyzing the Thermal Performance of Fenestration Products, Regents of the University of California, Berkeley (1994).
28 WRIGHT, J.L., VISION 4 Glazing Thermal Analysis. User Manual, Advanced Glazing
Studies in Conservation 47 (2002) 161-174 172

Analyzing the impact of protective glazing on stained glass windows
System Laboratory, University of Waterloo, Ontario (1995).
29 CURCIJA, D., and Goss, W., 'New correlations for convective heat transfer coefficient on indoor fenestration surfaces-compilation of more recent work' in Thermal Performance of Exterior Envelopes of Buildings VI, Conference Proceedings, ASHRAE, Florida (1995) 567-572.
30 YAZDANIAN, M., and KLEMS, J.H., 'Measurement of the exterior convective film coefficient for windows in low-rise buildings', ASHRAE Transactions 100 (1994) 1087-1096.
31 ZHAO, CURCIJA, D., and Goss, W.P., 'Con- vective heat transfer correlations for fenestra- tion glazing cavities; a review', ASHRAE Transactions 105 (1999) 1-9.SE-99-12-2.
32 SPARROW, E.M., CHRYSLER, G.M., and AZEVEDO, L.F., 'Observed flow reversals and measured-predicted Nusselt numbers for nat- ural convection in a one-sided heated vertical channel', Journal of Heat Transfer 106 (1984) 325-332.
33 SEFCIK, D.M., WEBB, B.W., and HEATON, H.S., 'Analysis of natural convection in verti- cally-vented enclosures', International Journal of Mass Transfer 34 (1991) 3037-3045.
34 WRIGHT, J.L., 'A correlation to quantify con- vective heat transfer between window glaz- ings', ASHRAE Transactions 102 (1996).
35 UPJOHN, R., Upjohn's Rural Architecture: Designs, Working Drawings and Specifications for a Wooden Church, and other Rural Structures (reprint of the 1852 edition by Putnam, New York), DaCapo Press, New York (1975).
36 Standard Test Method for Solar Absorptance, Reflectance and Transmittance of Material using Integrating Spheres, ASTM Standard E903-96 (1982).
37 Tables for Terrestrial Direct Normal Solar Spectral Irradiance Tables for Air Mass 1.5, ASTM Standard E891-87 (1987).
38 Standard Test Methods for Total Emittance of Surfaces using Inspection Meter Techniques, ASTM Standard E408-71 (1996).
39 Standard Test Method for Emittance of Specular Surfaces using Spectrometric Measurements, NFRC Standard 301-93 (1993).
40 'Fundamentals' in ASHRAE Handbook, American Society of Heating, Refrigerating and Air-Conditioning Engineers, Inc., Atlanta (1989).
41 KREITH, F., and BLACK, W.Z., Basic Heat Transfer, Harper & Row Publishers, New York.
Authors
MARK GILBERG, BS and MSc from Stanford University; PhD, University of London Institute of Archaeology. He joined the Conservation Processes Research Division of the Canadian Conservation Institute in 1983 and in 1987 he was appointed sci- entific officer in the Materials Conservation Division of the Australian Museum. He is currently research coordinator at the National Center for Preservation Technology and Training, National Park Service. Address: NCPTT, 645 College Avenue, Natchitoches, LA 71457, USA.
SUSAN REILLY, BSc in mechanical engineering, University of Colorado; MSc in mechanical engi- neering, University of California at Berkeley. She is President of Enermodal Engineering, Inc., and has over a decade of experience researching and evalu- ating the thermal and optical performance of win- dows. Address: Enermodal Engineering, Inc., 1554 Emerson Street, Denver, CO 80218, USA.
NEIL VOGEL, BS, Iowa State University; MS studies in historic preservation, University of Oregon. He worked for the New York Landmarks Conservancy, 1989-1991, and joined Inspired Partnerships in Chicago in 1991 as senior consultant. He is also principal of Restoric, LLC, formed in 1998. He has surveyed over 350 stained glass installations and has consulted on numerous stained glass restoration projects in the US. Address: Restoric, LLC, Suite No. 2K, 1600 Hinman Avenue, Evanston, IL 60201, USA.
Resum&-L 'article decrit une feuille de calcul Excel ( WINVENT) permettant de calculer la distribution de la temperature a travers le centre d'une fene"tre d double vitrage. Elle est utilisee pour modeliser une installation typique de protection de vitrail soumise ou non a une ventilation avec creation d'un canal vertical sur toute la longueur de l'installation. L'analyse des donnees recueillies t partir de ce dispositif permet d'evaluer les merites de ce systeme de protection.
Zusammenfassung-Eine Excel-Kalkulationstabelle (WINVENT) zur Kalkulation der Temperaturverteilung entlang eines Doppelglasfensters wird vorgestellt. Die Kalkulationstabelle wurde als Modell einer typischen Schutzverglasung eines bunten Glasfensters sowohl im geschlossenen wie auch im ge6ffneten Zustand, wo ein
Studies in Conservation 47 (2002) 161-174 173

M. Gilberg, S. Reilly and N. Vogel
vertikaler Kanal entlang der gesamten Ldnge der Verglasung verlegt ist, verwendetet. Die Analyse der durch die Kalkulationstabelle generierten Daten diente als Grundlage fir eine Diskussion der Vorteile einer Schutzverglasung.
Resumen-Se describe una base de datos Excel (WINVENT) que calcula las distribuciones de temperaturas en todo el interior de una ventana de cristales dobles. La base de datos fue usada para disenar una instalacion de cristales de proteccion para vidrieras, bajo condiciones tanto ventiladas como no ventiladas, en las cuales se cre6 un canal vertical a lo largo de toda la longitud del sistema de acristalamiento protector. Los analisis de los datos generados por la base de datos se utilizaron para discutir los beneficios de este sistema de laminado protector.
Studies in Conservation 47 (2002) 161-174 174