analyzing education inequality with adept edu - world...
TRANSCRIPT

141
Chapter 5
This chapter describes the state of global education inequality, based onhousehold survey data analyzed with the aid of ADePT Edu. It provides aprimer on education inequality for analysts interested in the associationbetween access to education and socioeconomic variables such as gender,location, and household poverty.
The concept of equity—as the opposite of inequality—is based on asimple norm: all people should have equal opportunities “to pursue a life of their choosing” (World Bank 2005, p. 2). Aside from moral reasons—after all, equity is a merit good in most societies—there are economic reasons to pursue increased equity or reduce inequality. In itsWorld Development Report 2006: Equity and Development, the World Banksets forth two broad sets of reasons for reducing inequality: to reduce theconcentration of economic benefits on elite groups (which can imposehigh economic and social costs on society) and to allow all people to use their talents and exercise their creativity for the benefit of their familiesand society.
Education has been identified as a key factor in economic and socialdevelopment, and the equitable access to education of good quality hasbecome a crucial objective of development policy. Countries with highlevels of educational inequality consistently show lower levels of innova-tion, lower levels of production efficiency, and a tendency to transmitpoverty across generations (World Bank 2005). Broader access to education,
Analyzing Education Inequality
with ADePT Edu
142
irrespective of gender, location, ethnicity, or level of income, is mostlikely to increase innovation and economic growth (Mankiw, Romer, andWeil 1992). Although there is a moral argument for reducing educationalinequality, there is an economic argument as well: increased access toeducation by all helps middle- and lower-income groups realize the fullpotential of their talent, increasing the level of productivity, innovation,and investment in society and, by inference, increasing the level of welfare of its population (Bourguignon 2006; Bourguignon and Dessus2007). Although there can be economic growth in the presence of edu-cational inequality, there is compelling evidence showing a close con-nection between education and productivity and between productivityand income growth (Hanushek and Wößmann 2007; Ravallion 2006;Stevens and Weale 2004).
The reduction of education inequality alone has the potential to pro-duce quick gains in economic and social welfare—if by “equal access toeducation” one means equal access to the opportunities for learning andnot simple equality of access to schooling (Pritchett 2004). Equal access toschooling must be complemented with increases in the quality of educationand changes in school governance to address the sustainability of reformsthrough increased accountability (Arcia and others 2011).
Given this conceptual framework, what is the role of ADePT Edu in fos-tering educational equity? In a seminal paper on education inequality,Pritchett (2004) argues that many of the international goals in educationrefer to increases in enrollment and completion, which are merely approxi-mations of competencies and learning achievement. Keeping children inschool requires the explicit recognition that there is a demand for educa-tion, which does not equate with a demand for schooling. The demand forschooling is based on the information received by households, especiallypoor households, about the benefits of education, the innate abilities oftheir children, and the quality of schools. If education providers recognizethis demand for education, the pursuit of educational equity requires theconstant monitoring of educational indicators and any sources of informa-tion that promote accountability for increased learning. Hence, there is animplicit need for information about education inequality in school accessand school completion, as well as information about learning outcomes. Theinformation on education inequality presented in this chapter is just the firststep in this direction.
Assessing Sector Performance and Inequality in Education

143
Reporting Education Inequality with ADePT Edu
This chapter analyzes education inequality in the following three areas:
• School participation, which is a clear indicator of educational access• School progression, which tracks a student’s timely progress from
primary to secondary education• School attainment, which reports the number of years of formal
education attained by youth 15–19.
ADePT Edu addresses the first two issues and is expanding its coverageof the third. ADePT Edu developers are updating the software to allow usersto analyze learning outcomes data as well.
ADePT Edu was used to process nearly 200 household surveys from morethan 80 countries.1 The results produced global and regional snapshots ofeducational inequality, particularly in relation to gender, urban/rural loca-tion, and household income. These snapshots identified several broad find-ings about primary school–age children:
• Almost 20.0 percent of children from the bottom expenditure quin-tile and just 7.0 percent of children from the top expenditure quin-tile are out of school.2 Geography is also an important barrier toeducational access: 15.0 percent of rural children are out of school,compared with just 8.5 percent of urban children.
• Net primary attendance rates are 8.7 percentage points higher amongchildren from the top expenditure quintile than they are among children from the bottom quintile. Net rates of attendance are almost5 percentage points higher in urban than in rural areas. Gender dif-ferences are relatively small.
• In general, girls are more likely to drop out than boys, rural childrenare more likely to drop out than urban students, and children frompoorer households are more likely to drop out than children fromhouseholds that are not as poor.
• Completion rates are higher for boys than for girls, and they arehigher for urban than for rural children. However, the largest differ-ence is based on expenditure quintile, with the primary completionrate of students from the bottom quintile 34 percentage points lowerthan the completion rate of students from the top quintile.3
Chapter 5: Analyzing Education Inequality with ADePT Edu

144
• Average years of schooling follows a similar pattern, with the largestdifference caused by income: children from households in the topexpenditure quintile have 4.2 years more of schooling, on average,than children from the bottom income quintile.
Global Educational Inequality
The pursuit of educational inequality requires an assessment of its globalmagnitude and scope to identify the regions of the world where it is mostproblematic. This is a necessary first step, because resources are limitedand some regions will undoubtedly be in greater need of interventionthan others.
This section analyzes educational inequality with the aid of the Ginicoefficient for educational attainment. Using educational attainment as themain metric for assessing educational inequality is very useful, because thenumber of years of formal education received is a simple objective metricthat can be compared across countries and regions. Relating key socioeco-nomic variables with the Gini coefficient for educational attainment pro-vides a good assessment of educational inequality on a global scale.
The Gini Coefficient in Education
The Lorenz curve tracks income inequality in a population. It plots the pro-portion of total income earned by each percentile of the population. Figure 5.1shows a triangle containing the Lorenz curve, where the triangle’s hypotenuseis a 45-degree line representing total equality in the income distribution. Atevery point along the hypotenuse, the cumulative percentage of total incomeequals the cumulative percentage of the total population.4
The Gini coefficient summarizes the Lorenz curve by estimating theratio of the area between the Lorenz curve and the 45-degree line (area Ain figure 5.1) over the total area of the triangle A + B:
Gini coefficient = A/(A + B).
The Gini coefficient ranges from 0 (complete equality) to 1 (completeinequality).5 A low Gini coefficient indicates a more equal distribution thana higher Gini coefficient; a rising Gini coefficient indicates increasinginequality.
Assessing Sector Performance and Inequality in Education

145
Correlation between Inequality in Income and Inequality
in School Attainment
Estimating and plotting the Gini coefficient for income for each of theworld’s regions in relation to the Gini coefficient for education revealsthe relationship between income inequality and educational inequality.The results, shown in figure 5.2, show some consistency across regions:regions—and countries within regions—that have high degrees of incomeinequality also tend to have higher degrees of educational inequality (theseresults should be taken with caution because of the low R2). For example,countries in the Europe and Central Asia region have lower incomeinequality than other regions; they also have low Gini coefficients of schoolattainment, indicating low levels of education inequality. In contrast, coun-tries in Sub-Saharan Africa are clustered about Gini values of 0.40–0.50,indicating a high degree of education inequality; these countries also show ahigh degree of income inequality. Inequality in grade attainment means thatchildren from poorer households tend to have fewer years of formal school-ing than children from households that are not as poor. It can be arguedthat such inequality strongly favors the perpetuation of intergenerational
Chapter 5: Analyzing Education Inequality with ADePT Edu
A
B
0cumulative percentage of population
cu
mu
lati
ve p
erc
en
tag
e o
f years
of
ed
ucati
on
0100
100
Lorenz curve
perfect equality
Figure 5.1: The Education Lorenz Curve
Source: Thomas, Wang, and Fan 2001.

146
poverty in Sub-Saharan Africa, suggesting the need for targeted programsthat increase educational attainment among the poor.
Correlation between Inequality in School Attendance and
Inequality in School Attainment
Another way to examine educational inequality is to examine the impactof differences in school attendance on educational attainment. Countrieswith high net attendance ratios also tend to be highly equitable in school
Assessing Sector Performance and Inequality in Education
Gini coefficient of school attainment
0
0.20
0.40
Gin
i co
eff
icie
nt
of
inco
me
0.60
0.80
0.20 0.40 0.60 0.80
R2 linear = 0.148
East Asia and Pacific Europe and Central Asia
Latin America and the Caribbean Middle East and North Africa
South Asiafit line for total
Sub-Saharan Africa
Figure 5.2: Relationship between Gini Coefficient of School Attainment and
Gini Coefficient of Income
Source: Estimated by Porta (2011) using data from the Demographic and Health Surveys, MultipleIndicator Cluster Surveys, and Living Standards Measurement Studies for 1985–2007. Note: Figures are for individuals 15 and older.

147
attainment (figure 5.3). Most countries in Sub-Saharan Africa tend tohave low net attendance ratios and high degrees of inequality in educational attainment. This correlation suggests that policies aimed atincreasing attendance among the poor should be a first step for increasingeducational attainment and—more important—reducing school attain-ment inequality.
Chapter 5: Analyzing Education Inequality with ADePT Edu
Gini coefficient of school attainment
net
att
en
dan
ce r
ati
o
0.20 0.40 0.60 0.80 1.0
1.0
0.80
0.60
0.40
0.20
0
R2 linear = 0.331
East Asia and Pacific Europe and Central Asia
Latin America and the Caribbean Middle East and North Africa
South Asiafit line for total
Sub-Saharan Africa
Figure 5.3: Relationship between Gini Coefficient of School Attainment and
Net Primary School Attendance Ratios
Source: Estimated by Porta (2011) using data from the Demographic and Health Surveys, MultipleIndicator Cluster Surveys, and Living Standards Measurement Studies for 1985–2007.Note: Figures are for individuals 15 and older.

148
Correlation between School Completion and Inequality in
School Attainment
Inequality in school attainment is also correlated with low rates of pri-mary school completion. Countries with a high degree of inequality inschool attainment—as evidenced by the low Gini coefficients of schoolattainment—also have low rates of primary school completion. Moreover,the trend in figure 5.4 shows that as inequality in school attainmentincreases, the primary completion rate decreases. The pattern of correlation
Assessing Sector Performance and Inequality in Education
Gini coefficient of school attainment
0.20 0.40 0.60 0.80 1.0
pri
mary
co
mp
leti
on
rate
1.0
1.2
0.80
0.60
0.40
0.20
0
R2 linear = 0.655
East Asia and Pacific Europe and Central AsiaLatin America and the Caribbean Middle East and North AfricaSouth Asiafit line for total
Sub-Saharan Africa
Figure 5.4: Relationship between Gini Coefficient of School Attainment and
Primary Completion Rate
Source: Estimated by Porta (2011) using data from the Demographic and Health Surveys, MultipleIndicator Cluster Surveys, and Living Standards Measurement Studies for 1985–2007.Note: Figures are for individuals 15 and older.

149
between these two variables—inequality in school attainment and primarycompletion rates—is very strong for countries in Sub-Saharan Africa.
Correlation between Extreme Poverty and Inequality in
School Attainment
Extreme poverty—represented by people who survive on $1.25 a day—issomewhat associated with inequality in school attainment (figure 5.5), but
Chapter 5: Analyzing Education Inequality with ADePT Edu
Gini coefficient of school attainment
perc
en
tag
e o
f p
op
ula
tio
n liv
ing
on
less t
han
$1.2
5 a
day (
pu
rch
asin
g p
ow
er
pari
ty)
0.20 0.40 0.60 0.80 1.0
1.0
0.80
0.60
0.40
0.20
0
R2 linear = 0.3
East Asia and Pacific Europe and Central Asia
Latin America and the Caribbean Middle East and North Africa
South Asiafit line for total
Sub-Saharan Africa
Figure 5.5: Relationship between Gini Coefficient of School Attainment and
Extreme Poverty
Source: Estimated by Porta (2011) using data from the Demographic and Health Surveys, MultipleIndicator Cluster Surveys, and Living Standards Measurement Studies.Note: Figures are for individuals 15 and older. Data for poverty headcount are for the most recent yearfor which data were available between 2000 and 2008.

150
the variation around the trend line is wide, suggesting that the relationshipbetween extreme poverty and educational inequality should be treated withsome caution. Still, the trend suggests that poor countries tend to havegreater inequality in school attainment. This finding is important if one hasto make the case to policy makers about the design and implementationof targeted educational programs. Most countries showing a relationshipbetween extreme poverty and educational inequality are in Sub-SaharanAfrica and South Asia.
Several trends are apparent from the evidence on global educationinequality:
• Regions and countries with high degrees of income inequality tend tohave high degrees of educational inequality.
• Regions and countries with low net attendance ratios in primaryschool tend to have high degrees of educational inequality.
• Regions and countries with low rates of primary school completiontend to have high degrees of educational inequality.
• Extreme poverty and educational inequality are positively correlatedin Sub-Saharan Africa and South Asia.
How Has Inequality in Educational Attainment Changed
over Time?
ADePT Edu provides access to household surveys conducted since 1985. Itthus allows trends over more than 30 years to be analyzed.
Education inequality can be analyzed by examining disparities in theincidence of key educational indicators between males and females, ruraland urban residents, and people from the highest and lowest income quin-tiles. The figures in this section calculate the disparities in the incidence ofindicators as follows:
• Value for males and value for females • Value for urban residents and value for rural residents• Value in top quintile of household expenditures per capita and value
in lowest quintile of household expenditures per capita.
A negative result for gender in a figure indicates that the value forfemales is larger than the value for males. A negative result for location
Assessing Sector Performance and Inequality in Education

151
indicates that the value for rural residents is larger than the value for urbanresidents; a negative value for income means that the value for householdsfrom the bottom quintile of per capita expenditures is larger than the valuefor families in the top quintile of capital expenditures.
Examination of household survey data on people 26–29 years old,between 1985 and 2007, suggests that household income, household loca-tion, and gender are consistently associated with levels of school attainmentas well as educational inequality (figure 5.6). Worldwide, for example, peo-ple from the top expenditure quintile have about 4.0 more years of formaleducation than people from the bottom quintile; people from rural areashave about 2.0 years less formal education than people from urban areas, andmen have about 0.5 year more education than women. Between 1985 and2007 there was a reduction of about 0.5 year in the difference in schoolattainment between people from the top and bottom expenditure quintiles.At this pace, it would take more than 100 years to achieve educationalequality by income level.6
The difference in educational attainment in urban and rural areas alsonarrowed only slightly during this 22-year period. People from urban areasare likely to have 2.0 more years of education than their rural counterparts,down from 2.5 in 1985. Urban-rural differences in attainment decreased at
Chapter 5: Analyzing Education Inequality with ADePT Edu
0
0.5
1.0
1.5
2.0
2.5
3.0
3.5
4.0
4.5
5.0
1985–95 1996–99 2000–03 2004–07
dif
fere
nce in
avera
ge y
ears
of
sch
oo
lin
g
gender disparity location disparity income disparity
Figure 5.6: Sources of Global Disparity in Educational Attainment among the
26–29 Cohort, 1985–2007
Source: Estimated by Porta (2011) using data from the Demographic and Health Surveys, MultipleIndicator Cluster Surveys, and Living Standards Measurement Studies for 1985–2007.

152
a faster rate than did differences in income, suggesting that efforts at increas-ing education access in rural areas have borne some success. Nevertheless, itwould take more than 100 years to achieve location parity. As for gender-related disparities, the 0.5-year difference in educational attainmentbetween men and women remained stagnant between 1985 and 2007.
This analysis refers to adults 26–29—people who most likely did not par-ticipate in the expansion of coverage resulting from global initiatives suchas Education for All or the Millennium Development Goals. If global edu-cational equity is examined for a younger cohort, the results are somewhatbetter, but they, too, indicate the need to implement the same policies toaddress inequality.
Educational Inequality and Internal Efficiency in the
Education Sector
The examination of educational inequality through the Gini coefficient canbe complemented with information on disparities in indicators of educa-tional efficiency between boys and girls, urban and rural populations, andbetween nonpoor and poor households.
Analysis of some key indicators of internal efficiency from about 50countries reveals several findings (figure 5.7):
• Net intake rates for the first grade of primary school are similar,regardless of gender, location, or household expenditures.
• Net attendance rates for primary school are affected by income andlocation. Net attendance rates of students from households in the topincome quintile are about 10 percentage points higher than those ofchildren from households in the bottom quintile. Urban childrenhave net attendance rates that are about 5 percentage points higherthan those of rural students.
• Net secondary attendance rates show even more marked income andlocation disparities. Attendance rates are 15 percentage points higherfor urban dwellers than for rural dwellers, and children from house-holds in the highest income quintile have rates of attendance that are29 percentage points higher than children from households in thebottom quintile.
• Net attendance rates for postsecondary school show similar patterns:urban dwellers and children from higher-income households have
Assessing Sector Performance and Inequality in Education

153
much higher rates of attendance than rural dwellers and childrenfrom poorer households.
• Men and women have equal access to education at the postsecondarylevel.
Disparity in School Participation
In analyzing out-of-school children, it is very important to distinguish threemain subcategories: children who enter school but later drop out, childrenwho are not currently in school but are expected eventually to enroll (lateentry), and children who have never been in school (figure 5.8).7
Children from higher-income households have higher dropout rates thanchildren from lower-income households; these children are also more likelyto enter school late.8 For children who have never been to school, the trendis reversed: the proportion of children who have never been to school is
Chapter 5: Analyzing Education Inequality with ADePT Edu
–5
0
5
10
15
20
25
30
35
net in
take
in fi
rst g
rade
of prim
ary s
chool
net at
tendan
ce
rate
prim
ary
net at
tendan
ce
rate
seco
ndary
gross
atte
ndance
rate
posts
econdar
y
dif
fere
nce in
sch
oo
l p
art
icip
ati
on
(perc
en
tag
e p
oin
ts)
gender disparity location disparity income disparity
Figure 5.7: Sources of Global Disparity in School Participation among the
15–19 Cohort, by Education Level
Source: Estimated by Porta (2011) using data from the Demographic and Health Surveys, MultipleIndicator Cluster Surveys, and Living Standards Measurement Studies for 1985–2007.

154
30 percentage points higher among children from households in the bottomquintile than it is among children from the top quintile.
Disparity in School Progression
Access to school is only part of the educational inequality picture.Educational inequality is drastically reduced if most—if not all—childrenprogress from primary to secondary education. In the most advanced coun-tries, the rate of transition from primary to secondary education approaches100 percent.
Disparity in the primary to secondary education transition rate fostersincome inequality, because there is a direct link between salaries and schoolattainment. Students who finish high school generally command highersalaries than those who finish only primary school (Psacharopoulos andPatrinos 2002).
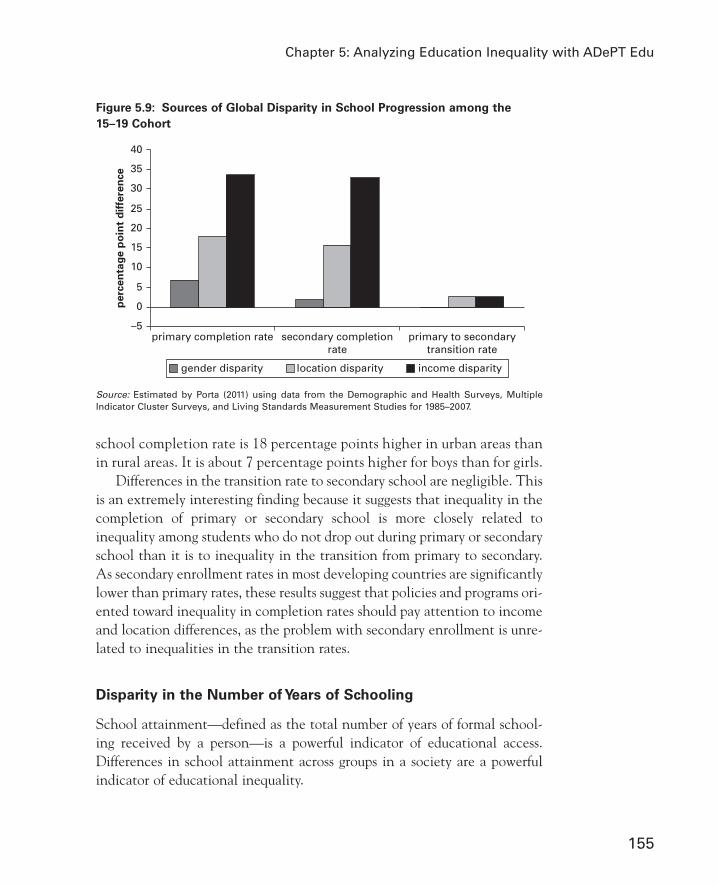
Figure 5.9 shows primary and secondary completion rates for the15–19 cohort, as well as the transition rate from primary to secondary.The inequalities in primary completion rates are glaring. Completionrates of children from families in the top quintile are 35 percentage pointshigher than those of children from the lowest quintile. The primary
Assessing Sector Performance and Inequality in Education
–40
–30
–20
–10
0
10
20
30
dropouts late entrants never in school
perc
en
tag
e p
oin
t d
iffe
ren
ce
gender disparity location disparity income disparity
Figure 5.8: Sources of Global Disparity among Out-of-School Children
Source: Estimated by Porta (2011) using data from the Demographic and Health Surveys, MultipleIndicator Cluster Surveys, and Living Standards Measurement Studies, latest year available per country 1985–2007.
155
school completion rate is 18 percentage points higher in urban areas thanin rural areas. It is about 7 percentage points higher for boys than for girls.
Differences in the transition rate to secondary school are negligible. Thisis an extremely interesting finding because it suggests that inequality in thecompletion of primary or secondary school is more closely related toinequality among students who do not drop out during primary or secondaryschool than it is to inequality in the transition from primary to secondary.As secondary enrollment rates in most developing countries are significantlylower than primary rates, these results suggest that policies and programs ori-ented toward inequality in completion rates should pay attention to incomeand location differences, as the problem with secondary enrollment is unre-lated to inequalities in the transition rates.
Disparity in the Number of Years of Schooling
School attainment—defined as the total number of years of formal school-ing received by a person—is a powerful indicator of educational access.Differences in school attainment across groups in a society are a powerfulindicator of educational inequality.
Chapter 5: Analyzing Education Inequality with ADePT Edu
–5
0
5
10
15
20
25
30
35
40
primary completion rate secondary completionrate
primary to secondarytransition rate
perc
en
tag
e p
oin
t d
iffe
ren
ce
gender disparity location disparity income disparity
Figure 5.9: Sources of Global Disparity in School Progression among the
15–19 Cohort
Source: Estimated by Porta (2011) using data from the Demographic and Health Surveys, MultipleIndicator Cluster Surveys, and Living Standards Measurement Studies for 1985–2007.

156
Figure 5.10 shows the disparities in school attainment between boys andgirls, urban and rural dwellers, and children from the top and bottomincome quintiles. The results show the following:
• Gender differences do not exist for the sample of 50 countries as awhole.9
• Urban dwellers have 1.5 more years of schooling, on average, than dorural dwellers.
• People from the top income quintile have 2.6 more years of school-ing, on average, than do people from the bottom income quintile.
Educational Inequality across Regions
This section examines the association between education inequality andgender, location, and income across regions. The regional trends are supple-mented with examples from individual countries, to illustrate the relevanceof inequality to specific educational policies and programs.
Assessing Sector Performance and Inequality in Education
–0.5
0
0.5
1.0
1.5
2.0
2.5
3.0
gender disparity location disparity income disparity
perc
en
tag
e p
oin
t d
iffe
ren
ce
in y
ears
of
sch
oo
lin
g
Figure 5.10: Sources of Global Disparity in School Attainment among the
15–19 Cohort
Source: Estimated by Porta (2011) using data from the Demographic and Health Surveys, MultipleIndicator Cluster Surveys, and Living Standards Measurement Studies for 1985–2007.

157
Regional Disparity in School Participation
Participation in the educational system is a clear indicator of educationalaccess. School participation by children at an appropriate age reflects acountry’s commitment to the internal efficiency of the educational system;the reasons for not attending school shed light on a country’s efforts to pro-vide an adequate number of teachers and facilities at a reasonable distancefrom students’ homes. School participation rates capture children who arenot in school, a reverse indicator of school participation that can beextremely useful for identifying policy interventions. The net attendanceratio provides a strong signal about a country’s commitment to ensure educa-tional access to everyone, because it measures the proportion of school-agechildren actually attending school. In the case of postsecondary education,where age is not as constraining as it is at the primary or secondary level, thegross attendance ratio is used in the analysis.
Primary School Attendance
Figure 5.11 shows disparities in net primary attendance rates across regionsby gender, location, and income. The largest disparities are in South Asiaand Sub-Saharan Africa, where the net attendance rate among the pooresthouseholds is almost 20 percentage points lower than the attendance rateamong the least poor households. The net attendance rate among urban stu-dents is 12 percentage points higher than among rural students in Sub-Saharan Africa and 5 percentage points higher in South Asia. Disparity inother regions in the world are small.
The disparities in Sub-Saharan Africa hide wide disparities across coun-tries. In Benin, for example, inequalities are wider than the average for theregion (figure 5.12). School participation is slightly unequal, with boys,urban dwellers, and children from higher-income households more likely toattend school. The net attendance rate among rural children (57.8 percent)is 15.8 percentage points lower than participation among urban children(73.6 percent). This large difference indicates the need to broaden ruraleducation coverage. Income-related differences are also large: the net atten-dance rate among children from the top income quintile (82.3 percent) is40.4 percentage points higher than participation among children from thebottom quintile (41.9 percent). A similar pattern is observed for secondaryand postsecondary education. The example of Benin shows that although
Chapter 5: Analyzing Education Inequality with ADePT Edu

158
Assessing Sector Performance and Inequality in Education
–5
0
5
10
15
20
25
perc
en
tag
e p
oin
t d
iffe
ren
ce
gender disparity location disparity income disparity
East A
sia an
d Pac
ific
Europe a
nd Cen
tral A
sia
Latin
Am
erica
and
the C
arib
bean
Mid
dle Eas
t and
North A
frica
South A
sia
Sub-Sah
aran
Afri
ca
Figure 5.11: Sources of Global Disparity in Net Primary Attendance Rates,
by Region
Source: Estimated by Porta (2011) using data from the Demographic and Health Surveys, MultipleIndicator Cluster Surveys, and Living Standards Measurement Studies for 1985–2007.
0
10
20
30
40
50
60
70
80
90
boys girls urban rural 1 2
income quintile
3 4 5
perc
en
tag
e o
f p
rim
ary
sch
oo
l–ag
e
ch
ild
ren
Figure 5.12: Net Primary Attendance Ratios in Benin, 2006
Source: Estimated by Porta (2011) using data from the Benin Demographic and Health Survey 2006(INSAE and Macro International 2007).

159
gender and location disparities may seem small at the regional level, theymay be large at the country level.
Secondary School Attendance
Net attendance rates for secondary school are very important in low- andmiddle-income countries, many of which have moved toward universalprimary education but lack the resources to accommodate vast numbers ofstudents in secondary education. Analysis of the net attendance rate insecondary education may yield insight into the progress of educationalinequality in the process of expanding access to secondary education.
At the secondary level, gender is a significant source of disparity onlyin South Asia, where more boys attend school than girls (figure 5.13). (InLatin America and the Caribbean, more girls attend secondary school
Chapter 5: Analyzing Education Inequality with ADePT Edu
–10
–5
0
5
10
15
20
25
30
35
40
45
perc
en
tag
e p
oin
t d
iffe
ren
ce
gender disparity location disparity income disparity
East A
sia an
d Pac
ific
Europe a
nd Cen
tral A
sia
Latin
Am
erica
and
the C
arib
bean
Mid
dle Eas
t and
North A
frica
South A
sia
Sub-Sah
aran
Afri
ca
Figure 5.13: Sources of Disparity in Net Secondary Attendance Rates,
by Region
Source: Estimated by Porta (2011) using data from the Demographic and Health Surveys, MultipleIndicator Cluster Surveys, and Living Standards Measurement Studies for 1985–2007.

160
than boys.) Urban students have much higher net secondary attendancerates than rural students. This finding is not surprising given that coun-tries face significant difficulties serving rural students of secondary agebecause of the lack of population density and because of economies ofscales in school infrastructure and the higher costs of transportation andlodging. In addition, poverty tends to be higher in rural areas, forcingyouth to enter the labor market.
The largest disparities in net secondary attendance rate are associated withincome. Children from households in the lowest income quintile have netattendance rates that are 27 percentage points lower than students from house-holds in the top income quintile in East Asia and Pacific, about 35 percentagepoints lower in Latin America and the Caribbean, and nearly 40 percentagepoints lower in South Asia and Sub-Saharan Africa.
Postsecondary Attendance
More girls than boys attend postsecondary education in East Asia andPacific, Europe and Central Asia, and Latin America and the Caribbean(figure 5.14).10 In the Middle East and North Africa, South Asia, and Sub-Saharan Africa, more boys than girls attend postsecondary education.Urban students have gross attendance rates for postsecondary that areabout 10–15 percentage points higher than those of rural students in allregions except Sub-Saharan Africa, where the disparity is about 5 percent-age points.
Net Primary Intake Rate
Educational inequality in school progression can be analyzed by observingdifferences in the net intake rate, defined as the proportion of children ofofficial age for entry into the first grade that enter first grade on time.Generally, poorer children and children in rural areas enter school at alater age than children who are less poor and children in urban areas. Sucha discrepancy reflects lower access to school—school is often too distant foryoung children in rural areas—as well as inadequate preschool coverage inpoorer areas. Both factors result in lower educational opportunities for alarge number of children.
Figure 5.15 shows the disparities in the net intake rate in the first grade ofprimary school. Gender disparities are relatively small across all regions. As
Assessing Sector Performance and Inequality in Education

161
net intake rates are generally in the 30–40 percent range for most developingcountries, a 5 percentage point difference between two groups is significant,albeit not overly large. There is no obvious pattern in urban-rural intake: inEast Asia and Pacific, the Middle East and North Africa, and Sub-SaharanAfrica, the net intake rate favors boys over girls, but the percentage point dif-ference between the two is modest (less than 5 points in the worst case). InEurope and Central Asia and in Latin America and the Caribbean, the netintake rate for the first grade favors girls over boys by a very small margin. InSouth Asia the net intake rate is higher in rural areas and among studentsfrom lower-income households, but these results should be interpreted withcaution, as they are based on data from just two countries.
Out-of-School Children
Another aspect of education inequality relates to children of school agewho are not in school. ADePT Edu classifies these children into three
Chapter 5: Analyzing Education Inequality with ADePT Edu
–10
–5
0
5
10
15
20
25
30
35
40
perc
en
t
gender disparity location disparity income disparity
East A
sia an
d Pac
ific
Europe a
nd Cen
tral A
sia
Latin
Am
erica
and
the C
arib
bean
Mid
dle Eas
t and
North A
frica
South A
sia
Sub-Sah
aran
Afri
ca
Figure 5.14: Sources of Disparity in Gross Postsecondary Attendance Rates,
by Region
Source: Estimated by Porta (2011) using data from the Demographic and Health Surveys, MultipleIndicator Cluster Surveys, and Living Standards Measurement Studies for 1985–2007.

162
categories: children who have never been to school; children who are notyet in school because they are late for entry for any reason, such as sick-ness or a family situation; and children who are no longer in schoolbecause they dropped out. The implications for policy and inequality aredifferent for each of these reasons. For children who have never been toschool or who are late for entry, the policy prescriptions may include reduc-ing the distance to school by building more schools, increasing preschoolcoverage to encourage households to enter children into the system, andensuring that schools are safe. As Pritchett (2004) notes, however, the rea-son for never having been to school usually has little to do with the supplyof schools. Policies oriented toward reducing the dropout rate may includeensuring that teachers show up to teach, preventing disillusionment amongstudents, and reexamining the education curriculum for relevance.
At the regional level, disparities in the percentage of out-of-schoolchildren are explained largely by differences in income (figure 5.16). Ingeneral, lower rates of out-of-school children are observed for boys,
Assessing Sector Performance and Inequality in Education
–17.5
–15.0
–12.5
–10.0
–7.5
–5.0
–2.5
0
2.5
5.0
7.5
perc
en
t p
oin
t d
iffe
ren
ce
gender disparity location disparity income disparity
East A
sia an
d Pac
ific
Europe a
nd Cen
tral A
sia
Latin
Am
erica
and
the C
arib
bean
Mid
dle Eas
t and
North A
frica
South A
sia
Sub-Sah
aran
Afri
ca
Figure 5.15: Sources of Disparity in Net Intake Rate for First Grade of Primary
School, by Region
Source: Estimated by Porta (2011) using data from the Demographic and Health Surveys, MultipleIndicator Cluster Surveys, and Living Standards Measurement Studies for 1985–2007.

163
urban areas, and higher-income households. The largest disparity is inSouth Asia, where the proportion of out-of-school children is 5.7 percentin the top income quintile and 34.6 percent in the bottom quintile, adifference of 28 percentage points. This difference is also large in Sub-Saharan Africa (24 percentage points). Income also affects the percent-age of children out of school in other regions, but the differential ismuch smaller.
The association between low income and lower access to education isreinforced by the regional data on dropouts. In Latin America and theCaribbean, the Middle East and North Africa, and South Asia, the dropoutrate in the bottom income expenditure quintile is 15 percentage pointshigher than the rate in the top quintile (figure 5.17). In contrast, in Europeand Central Asia the dropout rate is higher among children from higher-income households.
Differences in income also explain most of the regional disparities in theproportion of out-of-school children who are expected to enter school at a
Chapter 5: Analyzing Education Inequality with ADePT Edu
–35
–30
–25
–20
–15
–10
–5
0
5
perc
en
t p
oin
ts
gender disparity location disparity income disparity
East A
sia an
d Pac
ific
Europe a
nd Cen
tral A
sia
Latin
Am
erica
and
the C
arib
bean
Mid
dle Eas
t and
North A
frica
South A
sia
Sub-Sah
aran
Afri
ca
Figure 5.16: Sources of Disparity in Children Out of Primary School,
by Region
Source: Estimated by Porta (2011) using data from the Demographic and Health Surveys, MultipleIndicator Cluster Surveys, and Living Standards Measurement Studies for 1985–2007.

164
later age (figure 5.18). Across all six regions, poorer children enter school ata later age than children from less poor households, with that differenceranging from 15 to 25 percentage points. In Europe and Central Asia, andto a lesser extent Sub-Saharan Africa, late entry is also more prevalentamong rural children.
Across regions, the percentage of children who are classified as never inschool is much higher among children from the bottom income quintile,with differences of 15–30 percentage points (figure 5.19).
Regional Disparity in School Progression
This section describes regional disparities in school completion, the transi-tion from primary to secondary levels, and school attainment. These dispar-ities reflect the need to address education inequality in Sub-Saharan Africa
Assessing Sector Performance and Inequality in Education
–15
–10
–5
0
5
10
15
20
perc
en
t p
oin
t d
iffe
ren
ce
gender disparity location disparity income disparity
East A
sia an
d Pac
ific
Europe a
nd Cen
tral A
sia
Latin
Am
erica
and
the C
arib
bean
Mid
dle Eas
t and
North A
frica
South A
sia
Sub-Sah
aran
Afri
ca
Figure 5.17: Sources of Disparity in Dropout Rates, by Region
Source: Estimated by Porta (2011) using data from the Demographic and Health Surveys, MultipleIndicator Cluster Surveys, and Living Standards Measurement Studies for 1985–2007.

165
and South Asia, where some of these disparities are larger than they are inother regions.
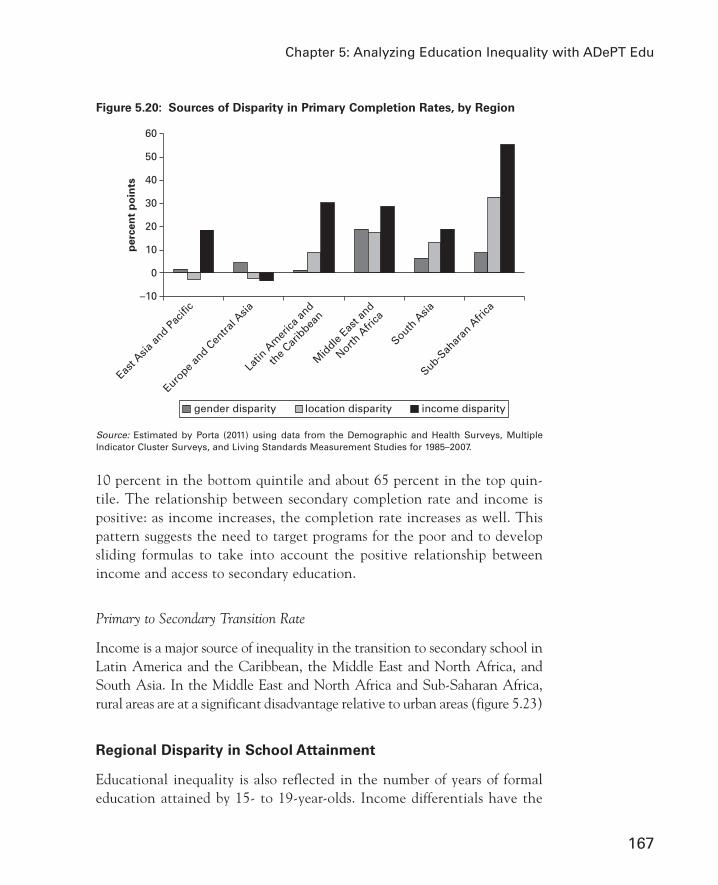
Primary Completion Rates
Income disparity has a large impact on primary completion rates in allregions except Europe and Central Asia (figure 5.20). In Sub-SaharanAfrica, the primary completion rate for students from the top expenditurequintile is 55 percentage points higher than the rate for students from thebottom quintile. In all regions except the Middle East and North Africa andEurope and Central Asia, the difference in primary completion ratesbetween children from the top and bottom expenditure quintiles is morethan 30 percentage points. Across regions differentials in income are themost important source of disparities in primary completion rates.
Chapter 5: Analyzing Education Inequality with ADePT Edu
–5
0
5
10
15
20
25
30
pe
rce
nt
po
int
dif
fere
nce
gender disparity location disparity income disparity
East A
sia an
d Pac
ific
Europe a
nd Cen
tral A
sia
Latin
Am
erica
and
the C
arib
bean
Mid
dle Eas
t and
North A
frica
South A
sia
Sub-Sah
aran
Afri
ca
Figure 5.18: Sources of Disparity in Late Entry among Out-of-School Children,
by Region
Source: Estimated by Porta (2011) using data from the Demographic and Health Surveys, MultipleIndicator Cluster Surveys, and Living Standards Measurement Studies for 1985–2007.

166
Secondary Completion Rates
The regional evidence shows a similar pattern at the secondary level, butthe disparities are larger, because secondary enrollment is almost alwayslower among poorer children, who often need to enter the labor force tohelp their households (figure 5.21). The impact of income is substantiallyhigher in Latin America and the Caribbean, South Asia, and Sub-SaharanAfrica than in other regions. Also important in these regions are disparitiesbetween urban and rural children. All three regions need to be more activein targeting programs and policies for improving access to secondary educa-tion by the poor.
Data on completion rates indicate that the effect of income on schoolentry is much greater at the secondary than the primary level (figure 5.22).In India the proportion of children who complete secondary school is about
Assessing Sector Performance and Inequality in Education
–40
–35
–30
–25
–20
–15
–10
–5
0
5
10
perc
en
t p
oin
t d
iffe
ren
ce
gender disparity location disparity income disparity
East A
sia an
d Pac
ific
Europe a
nd Cen
tral A
sia
Latin
Am
erica
and
the C
arib
bean
Mid
dle Eas
t and
North A
frica
South A
sia
Sub-Sah
aran
Afri
ca
Figure 5.19: Sources of Disparity among Out-of-School Children Who Never
Attended School, by Region
Source: Estimated by Porta (2011) using data from the Demographic and Health Surveys, MultipleIndicator Cluster Surveys, and Living Standards Measurement Studies for 1985–2007.
167
10 percent in the bottom quintile and about 65 percent in the top quin-tile. The relationship between secondary completion rate and income ispositive: as income increases, the completion rate increases as well. Thispattern suggests the need to target programs for the poor and to developsliding formulas to take into account the positive relationship betweenincome and access to secondary education.
Primary to Secondary Transition Rate
Income is a major source of inequality in the transition to secondary school inLatin America and the Caribbean, the Middle East and North Africa, andSouth Asia. In the Middle East and North Africa and Sub-Saharan Africa,rural areas are at a significant disadvantage relative to urban areas (figure 5.23)
Regional Disparity in School Attainment
Educational inequality is also reflected in the number of years of formaleducation attained by 15- to 19-year-olds. Income differentials have the
Chapter 5: Analyzing Education Inequality with ADePT Edu
–10
0
10
20
30
40
50
60p
erc
en
t p
oin
ts
gender disparity location disparity income disparity
East A
sia an
d Pac
ific
Europe a
nd Cen
tral A
sia
Latin
Am
erica
and
the C
arib
bean
Mid
dle Eas
t and
North A
frica
South A
sia
Sub-Sah
aran
Afri
ca
Figure 5.20: Sources of Disparity in Primary Completion Rates, by Region
Source: Estimated by Porta (2011) using data from the Demographic and Health Surveys, MultipleIndicator Cluster Surveys, and Living Standards Measurement Studies for 1985–2007.

168
Assessing Sector Performance and Inequality in Education
–10
0
10
20
30
40
50
60
70
perc
en
t p
oin
t d
iffe
ren
ce
gender disparity location disparity income disparity
East A
sia an
d Pac
ific
Europe a
nd Cen
tral A
sia
Latin
Am
erica
and
the C
arib
bean
Mid
dle Eas
t and
North A
frica
South A
sia
Sub-Sah
aran
Afri
ca
Figure 5.21: Sources of Disparity in Secondary Completion Rates, by Region
Source: Estimated by Porta (2011) using data from the Demographic and Health Surveys, MultipleIndicator Cluster Surveys, and Living Standards Measurement Studies for 1985–2007.
0
20
40
60
80
100
120
boys girls urban rural 1 2
income quintile
3 4 5
perc
en
tag
e o
f stu
den
ts w
ho
fin
ish
pri
mary
an
d s
eco
nd
ary
primary completion rate secondary completion rate
Figure 5.22: Primary and Secondary Completion Rates in India, 2005
Source: Estimated by Porta (2011) using data from the 2005 Demographic and Health Survey of India(IIPS 2007).

169
greatest impact on the average total years of schooling of people 15–19(figure 5.24). Urban residents have more education than rural residents inall regions except Europe and Central Asia, but the difference attributedto location is only about one year of schooling. Gender is not a significantsource of disparity (although regional averages may hide significantintraregional variations). The strong impact of poverty on years of school-ing across all regions calls for policy interventions aimed at overcomingthe income barrier and increasing educational access to and attainment bythe poor.
Analyzing the number of years of education among people 25–45 is agood way to assess education inequality. People in this age range are mostlikely finished with their formal education and are most likely to be in thelabor market. Assessing their total years of education is thus a good way tocapture the effect of inequality. Figure 5.25 shows the Gini coefficient forschool attainment by region. It shows that Europe and Central Asia is the
Chapter 5: Analyzing Education Inequality with ADePT Edu
–2
–1
0
1
2
3
4
5
6
7
8
perc
en
t p
oin
t d
iffe
ren
ce
gender disparity location disparity income disparity
East A
sia an
d Pac
ific
Europe a
nd Cen
tral A
sia
Latin
Am
erica
and
the C
arib
bean
Mid
dle Eas
t and
North A
frica
South A
sia
Sub-Sah
aran
Afri
ca
Figure 5.23: Sources of Disparity in Primary to Secondary Transition Rates,
by Region
Source: Estimated by Porta (2011) using data from the Demographic and Health Surveys, MultipleIndicator Cluster Surveys, and Living Standards Measurement Studies for 1985–2007.

170
Assessing Sector Performance and Inequality in Education
–1
0
1
2
3
4
5
tota
l years
of
sch
oo
lin
g
gender disparity location disparity income disparity
East A
sia an
d Pac
ific
Europe a
nd Cen
tral A
sia
Latin
Am
erica
and
the C
arib
bean
Mid
dle Eas
t and
North A
frica
South A
sia
Sub-Sah
aran
Afri
ca
Figure 5.24: Sources of Disparity in Total Years of Schooling, by Region
Source: Estimated by Porta (2011) using data from the Demographic and Health Surveys, MultipleIndicator Cluster Surveys, and Living Standards Measurement Studies for 1985–2007.
0
10
20
30
40
50
60
70
Gin
i co
eff
icie
nt
East A
sia an
d Pac
ific
Europe a
nd Cen
tral A
sia
Latin
Am
erica
and
the C
arib
bean
Mid
dle Eas
t and
North A
frica
South A
sia
Sub-Sah
aran
Afri
ca
Figure 5.25: Gini Coefficient of School Attainment, by Region
Source: Estimated by Porta (2011) using data from the Demographic and Health Surveys, MultipleIndicator Cluster Surveys, and Living Standards Measurement Studies for 1985–2007.

171
most equitable region, followed by Latin America and the Caribbean, EastAsia and Pacific, the Middle East and North Africa, South Asia, and Sub-Saharan Africa.
Concluding Comments
Analysis using ADePT Edu reveals the relationships between inequality ineducation on the one hand and income, location, and gender on the other.It shows that gender differences are modest in most countries for mostindicators. In countries where gender disparities are still large and favorboys, policies must be implemented to increase girls’ access to learning;policies should also be in place to ensure equality in countries where boysare being left behind.
Across regions, households from the top expenditure quintile have muchbetter educational indicators than households from the bottom expenditurequintile. Poverty, the data clearly suggest, is a significant barrier to educa-tional equality in most countries in the ADePT Edu database.
Urban-rural disparities are larger in Sub-Saharan Africa and smaller inEurope and Central Asia than in the rest of the world. However, policies thatfavor access in rural areas may not be appropriate, for several reasons. First, adichotomous variable such as urban/rural may hide continuities in urbaniza-tion that may render comparisons by location uninformative for policy.Second, access to education does not mean access to school infrastructure butrather access to quality education. Taken together the distinction in urban-rural inequalities should serve as a baseline for further analysis to study hid-den variations and identify the critical points.
The main findings on inequality and school participation, school pro-gression, and school attainment can be summarized as follows:
• Net intake rates for the first grade of primary school are fairly equalacross income levels, location, and gender.
• Net attendance rates for primary school are affected by income andlocation. Children from households in the highest expenditurequintile have net attendance rates that are about 10 percentagepoints higher than those of children from the lowest expenditurequintile. Urban children have net attendance rates that are about5 percentage points higher than those of rural children.
Chapter 5: Analyzing Education Inequality with ADePT Edu

172
• Secondary attendance rates are 15 percentage points higher in urbanareas than in rural areas. Children from households in the highestexpenditure quintile have rates of attendance that are 29 percentagepoints higher than those of children from the lowest expenditurequintile.
• Gender differences are very low, but the evidence may need to befleshed out, as between-country variations may cancel out at theregional level. In some countries girls are ahead of boys; in othercountries boys are ahead of girls. In both cases education policyshould take corrective action.
The main findings on school progression can be summarized as follows:
• 99.0 percent of children from the top expenditure quintile and just65.3 percent from the bottom quintile complete primary school, a dif-ference of about 34 percentage points.
• 94.1 percent of urban children and 76.2 percent of rural children fin-ish primary school, a difference of about 18 percentage points.
• 85.6 percent of boys and 78.8 percent of girls complete primaryschool, a difference of 7 percentage points.
• The transition from primary to secondary school is about the sameregardless of income, gender, or location. This is an extremely inter-esting finding because it suggests that inequality in the completion ofprimary or secondary school is more related to inequality among chil-dren within primary and within secondary school, than to inequalityreflected in the dropouts, that is, during the transition from primary tosecondary school.
The main findings on school attainment can be summarized as follows:
• For the world as a whole, people in the highest expenditure quintilehave about four more years of formal education than do people in thelowest expenditure quintile. Urban residents have about two years’more formal education than do rural residents, and men have abouthalf a year more education than do women.
• Regions and countries with high degrees of income inequality tend tohave high levels of educational inequality.
• Regions and countries with low net attendance ratios in primaryschool tend to have high levels of educational inequality.
Assessing Sector Performance and Inequality in Education
173
• Regions and countries with low rates of primary school completiontend to have high levels of educational inequality.
The ADePT Edu results can be treated as benchmarks for educationindicators and educational inequality. Their consistency with internationalindicators and their systematic approach to data presentation make themuseful tools for tracking performance in the education sector.
Notes
1. The household survey profiles analyzed in this chapter were produced byEmilio Porta (2011). This dataset is available as an EdStat data query.
2. Household surveys generally use expenditures as a proxy for income. Tofacilitate reading, the term income is used interchangeably with house-hold expenditures per capita throughout the chapter. The percentagepoint difference between the top and bottom expenditure quintiles isreferred to as income disparity throughout the rest of this chapter.
3. In comparing the differentials associated with income with the differ-entials associated with dichotomous variables such as urban/rural, onehas to be careful about interpreting the results. As Luis Crouch noted inhis review of an earlier draft of this chapter, urban/rural is a dichoto-mous variable, whereas income is a continuous variable. Comparing thetop and bottom income quintiles is equivalent to comparing extremesin a continuous variable, which tends to exaggerate the impact ofincome as opposed to location. It may be, for example, that if onedefined the 40th income percentile as nonpoor and all householdsbelow it as poor, the difference attributed to income would not be aslarge as in the case in which the nonpoor are defined as households inthe top 2 percent of income. If urban/rural locations were continuous—expressed in distance to the center of town, for example—and house-holds were divided into quintiles, differences between urban and rural locations would be larger.
4. For education the Lorenz curve is applied to the population 25–45, underthe assumption that most people in this age group are in the labor forceand have already received as much formal education as they will receive.
5. In the case of income, for example, complete inequality would meanthat a single person captures 100 percent of all income and the rest of
Chapter 5: Analyzing Education Inequality with ADePT Edu

174
the population receives none; the Gini coefficient would then be equalto 1. Conversely, a completely equal society would be one in whichevery person received the same amount of income. In this case, the Ginicoefficient would be 0. In the case of education, perfect inequalitymeans that all the education is received by a single person; perfectequality means that every person in the country has exactly the samenumber of years of education.
6. These figures refer only to the gap in years, not to inequality withineach category, as in the case of the Gini coefficient. The Gini coeffi-cient is akin to a coefficient of variation (that is, for a given variance,the Gini is lower if the mean is higher). Thus, the absolute gapbetween rich and poor may be constant or even growing, but if themean years of school attainment for both groups are increasing fasterthan the gap, the Gini coefficient will decrease and inequality will bereduced.
7. The percentages of out-of-school children were estimated using theUNESCO methodology described in box 4.1 in chapter 4.
8. This finding requires further analysis. Anecdotal evidence suggests itmay reflect the move from public to private school.
9. Gender is still an issue in many countries (including countries in whichgirls have more education than boys). The policies that produced genderequality and gender inequality in school attainment need to be analyzed.
10. Here the gross attendance rate is used instead of the net attendance ratebecause in developing countries many people study part time for manyyears. As a result, many postsecondary students are older than the offi-cial age for postsecondary education.
References
Arcia, Gustavo, Harry Anthony Patrinos, Emilio Porta, and KevinMacdonald. 2011. “School Autonomy and Accountability: SystemAssessment for Benchmarking Education for Results, Regulatory andInstitutional Framework.” World Bank, Human Development Network,Washington, DC.
Bourguignon, François. 2006. “Distribution, Equity and Development.” InEquity and Development, ed. Gudrun Kochendörfer-Lucius and BorisPleskovic, 39–45. Washington, DC: World Bank.
Assessing Sector Performance and Inequality in Education

175
Bourguignon, François, and Sébastien Dessus. 2007. “Equity andDevelopment: Political Economy Considerations.” In No Growth withoutEquity? Inequality, Interests and Competition in Mexico, ed. Santiago Levyand Michael Walton, 45–70. Washington, DC: World Bank.
Hanushek, Eric, and Ludger Wößmann. 2007. Education Quality andEconomic Growth. Washington, DC: World Bank.
IIPS (International Institute for Population Sciences) and MacroInternational. 2007. National Family Health Survey (NFHS-3), 2005–06:India: Volume I. Mumbai, India: IIPS.
INSAE (Institut National de la Statistique et de l’Analyse Économique) andMacro International. 2007. Enquête Démographique et de Santé (EDSB-III) -Bénin 2006. Calverton, MD: INSAE and Macro International.
Mankiw, N. Gregory, David Romer, and David Weil. 1992. “A Contributionto the Empirics of Economic Growth.” Quarterly Journal of Economics107 (2): 407–37.
Porta, Emilio. 2011. “A Data Set for Estimating Global Indicators ofEducation Inequality.” World Bank, Human Development Network,Washington, DC.
Pritchett, Lant. 2004. “Towards a New Consensus for Addressing the GlobalChallenge of the Lack of Education.” Working Paper 43, Center forGlobal Development, Washington, DC.
Psacharopoulos, George, and Harry Anthony Patrinos. 2002. “Returns toInvestment in Education: A Further Update.” Policy Research WorkingPaper 2881, World Bank, Washington, DC.
Ravallion, Martin. 2006. “Should Poor People Care about Inequality?” InEquity and Development, ed. Gudrun Kochendörfer-Lucius and BorisPleskovic, 89–101. Washington, DC: World Bank.
Stevens, Philip, and Martin Weale. 2004. “Education and Economic Growth.”In International Handbook on the Economics of Education, ed. G. Johnes andJill Johnes, 164–88. Camberley: Edward Elgar.
Thomas, Vinod, Yan Wang, and Xibo Fan. 2001. “Measuring EducationInequality. Gini Coefficients of Education.” Policy Research WorkingPaper 2525, World Bank, Washington, DC.
World Bank. 2005. World Development Report 2006: Equity and Development.Washington, DC: World Bank.
Chapter 5: Analyzing Education Inequality with ADePT Edu
