buchanan speaker series: education, inequality, and incentives
TRANSCRIPT


Education,Inequality,andIncentives
RolandG.Fryer,Jr.HenryLeeProfessorofEconomics
HarvardUniversityHGSE,EdLabs,NBER

CONFIDENTIAL
AmongcitiesthatparticipateinNAEP,themagnitudeofracialdifferencesineducationalachievementisstartling.
OverviewTheAchievementGap
0102030405060708090
100
PercentProficient,8th GradeMath,NAEP2011
white
black
Hispanic
0102030405060708090
100
PercentProficient,8thGradeReading,NAEP2011
white
black
Hispanic
CONFIDENTIAL 3
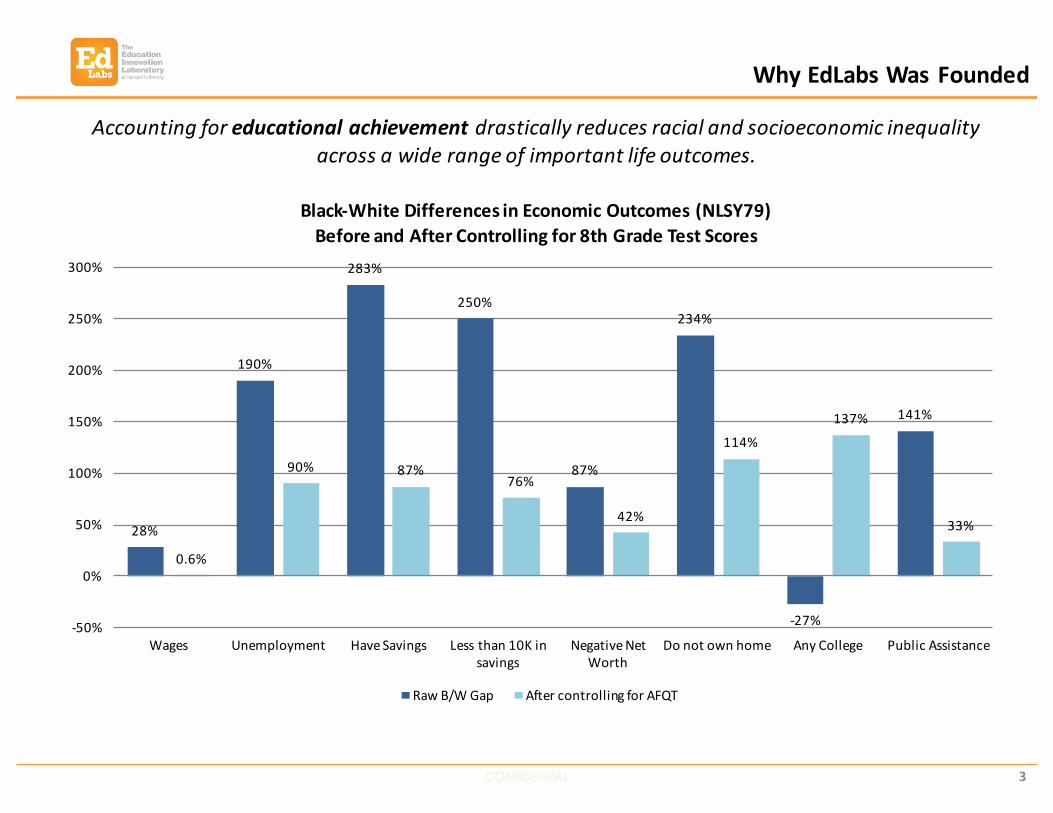
WhyEdLabsWasFounded
Accountingforeducationalachievement drasticallyreducesracialandsocioeconomicinequalityacrossawiderangeofimportantlifeoutcomes.
28%
190%
283%
250%
87%
234%
-27%
141%
0.6%
90% 87%76%
42%
114%
137%
33%
-50%
0%
50%
100%
150%
200%
250%
300%
Wages Unemployment HaveSavings Lessthan10Kinsavings
NegativeNetWorth
Donotownhome AnyCollege PublicAssistance
Black-WhiteDifferencesinEconomicOutcomes(NLSY79)BeforeandAfterControllingfor8thGradeTestScores
RawB/WGap AftercontrollingforAFQT
CONFIDENTIAL 4
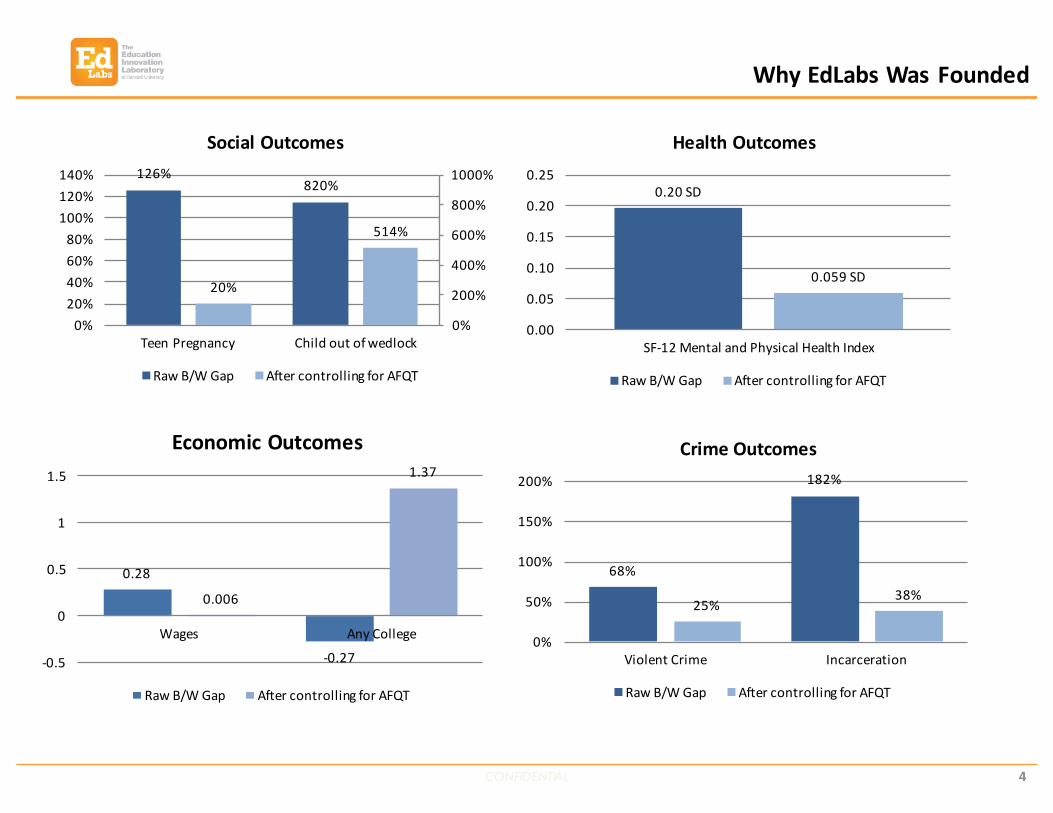
WhyEdLabsWasFounded
126%
20%
820%
514%
0%
200%
400%
600%
800%
1000%
0%20%40%60%80%
100%120%140%
TeenPregnancy Childoutofwedlock
SocialOutcomes
RawB/WGap AftercontrollingforAFQT
0.20SD
0.059SD
0.00
0.05
0.10
0.15
0.20
0.25
SF-12MentalandPhysicalHealthIndex
HealthOutcomes
RawB/WGap AftercontrollingforAFQT
68%
182%
25%38%
0%
50%
100%
150%
200%
ViolentCrime Incarceration
CrimeOutcomes
RawB/WGap AftercontrollingforAFQT
0.28
-0.27
0.006
1.37
-0.5
0
0.5
1
1.5
Wages AnyCollege
EconomicOutcomes
RawB/WGap AftercontrollingforAFQT
CONFIDENTIAL
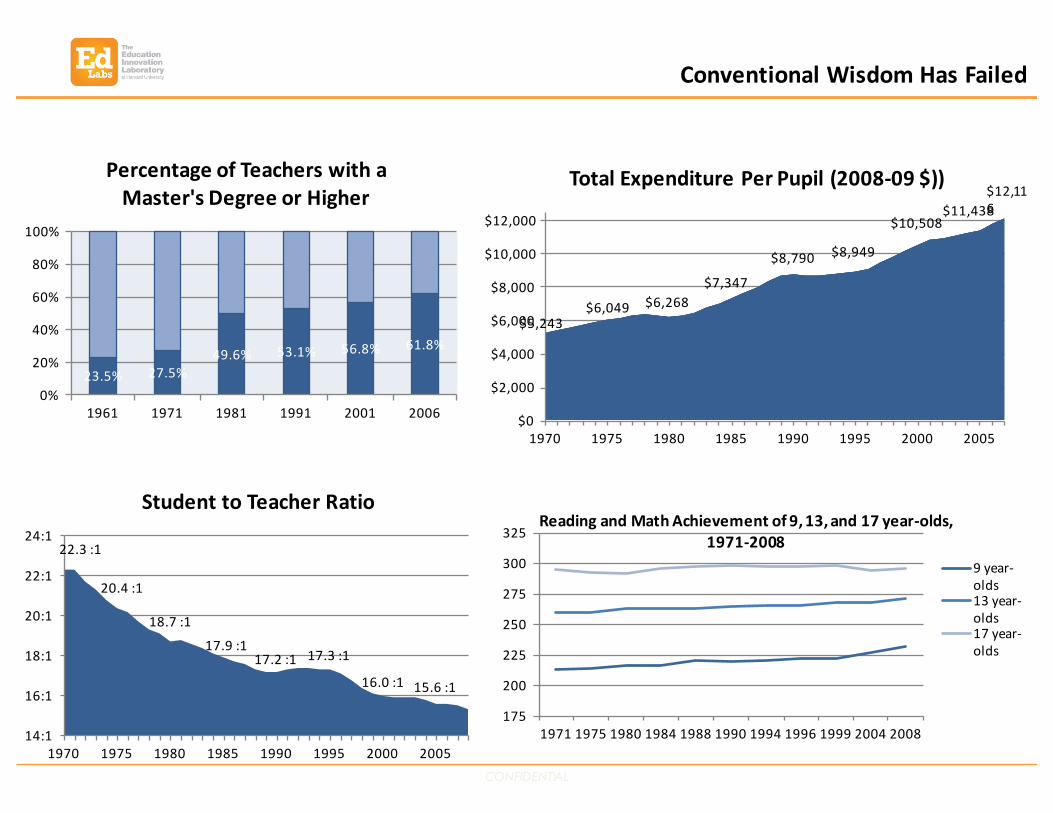
22.3:1
20.4:1
18.7:1
17.9:117.2:1 17.3:1
16.0:1 15.6:1
14:1
16:1
18:1
20:1
22:1
24:1
1970 1975 1980 1985 1990 1995 2000 2005
StudenttoTeacherRatio
$5,243$6,049 $6,268
$7,347
$8,790 $8,949
$10,508$11,438
$0
$2,000
$4,000
$6,000
$8,000
$10,000
$12,000
1970 1975 1980 1985 1990 1995 2000 2005
TotalExpenditurePerPupil(2008-09$))$12,116
23.5% 27.5%49.6% 53.1% 56.8% 61.8%
0%
20%
40%
60%
80%
100%
1961 1971 1981 1991 2001 2006
PercentageofTeacherswithaMaster'sDegreeorHigher
175
200
225
250
275
300
325
1971 1975 1980 1984 1988 1990 1994 1996 1999 2004 2008
ReadingandMathAchievementof9,13,and17year-olds,1971-2008
9year-olds13year-olds17year-olds
ConventionalWisdomHasFailed
CONFIDENTIAL
TheProblem:DataSifters
• Socialscientistshavespentdecadestryingtoteaseoutcausalrelationshipsfromnon-experimentaldata
MajorApproach• ObservationalData:examinemoundsandmoundsofdata,invokingvariousassumptions,inanefforttomakecausalstatements– Legalizedabortionloweredcrime– TheEndangeredSpeciesActendangersspecies
Howwouldonegoaboutusingthisapproachineducation?
CONFIDENTIAL
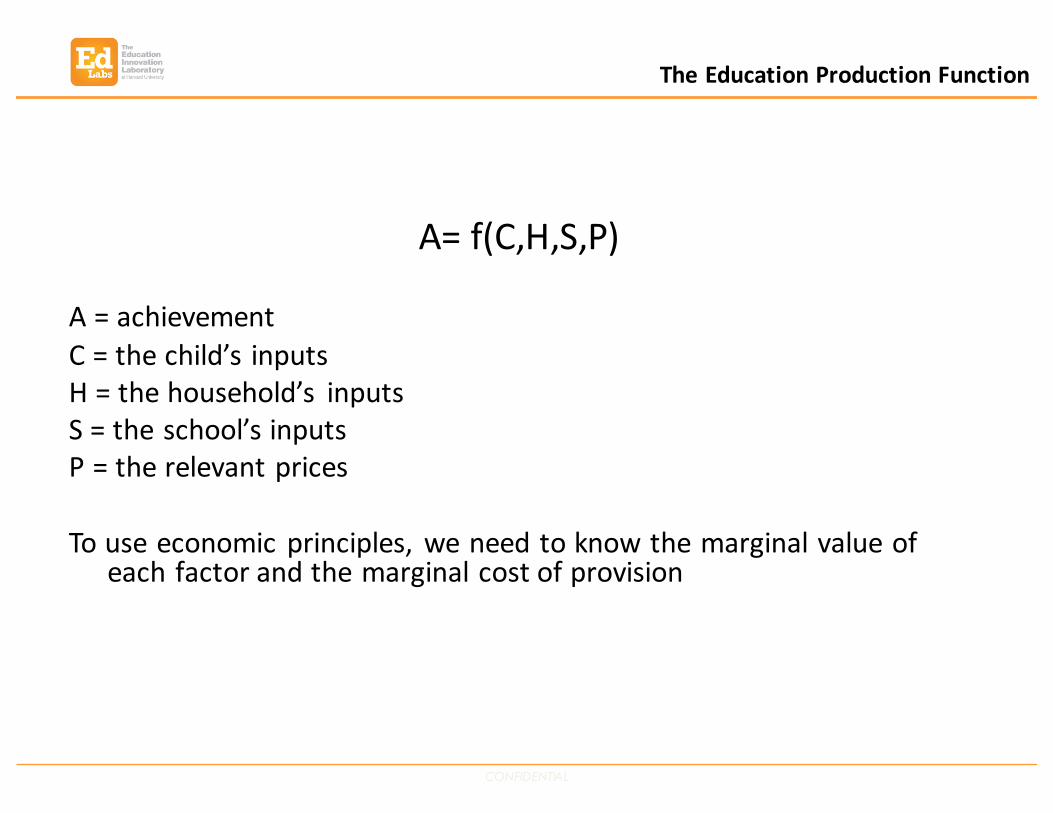
A=f(C,H,S,P)
A=achievementC=thechild’s inputsH=thehousehold’s inputsS=theschool’sinputsP=therelevantprices
Touseeconomicprinciples,weneedtoknowthemarginalvalueofeachfactorandthemarginalcostofprovision
TheEducationProductionFunction
CONFIDENTIAL
• Basiceconomicprinciplesarenotcurrentlybeingapplied(e.g.MC=MR)
• Anewcropofvisionaryleadersareeagertoimplementchange(e.g.ArneDuncan,TerryGrier)
• Observationaldatahavenotbeenabletoprovidethesenewleaderswiththeanswerstheyneedtorevolutionizetheproductionofhumancapital
FieldExperimentsBalancing“Unobservables”

CONFIDENTIAL
MyFirstIdea:
Maybeweshouldgivekidsincentivesforachievement…
Incentives
CONFIDENTIAL
-0.5
0
0.5
1
1.5
2
2.5
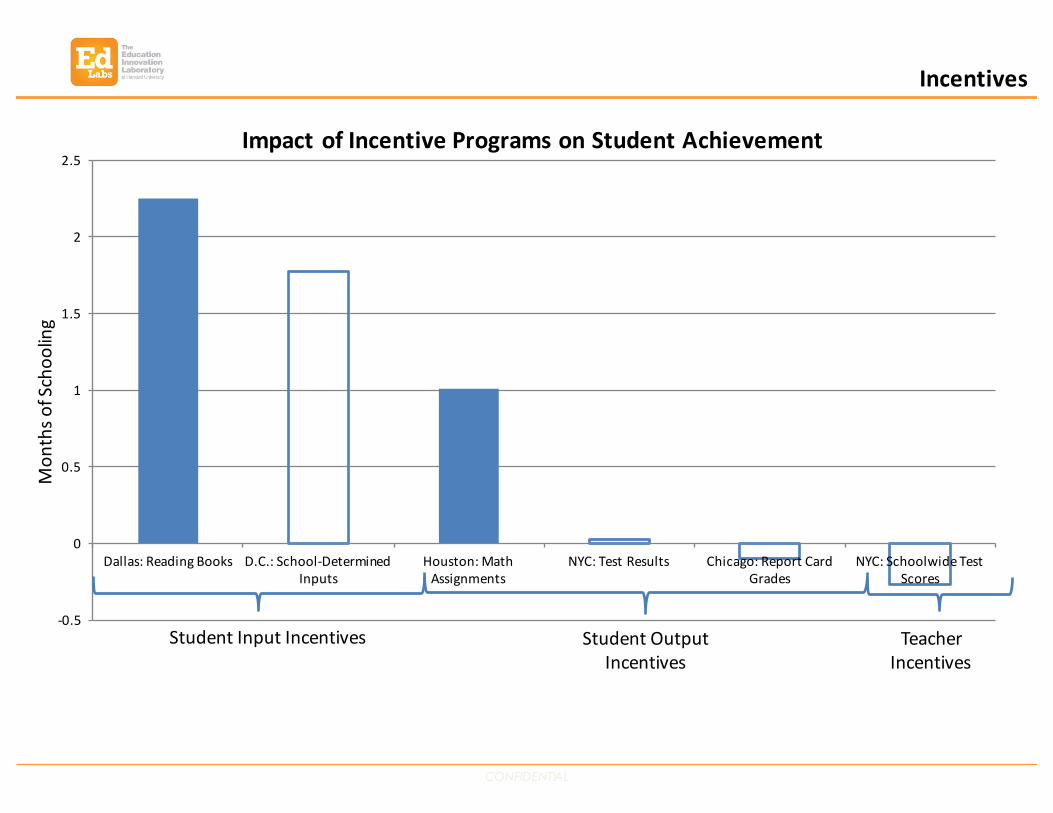
Dallas:ReadingBooks D.C.:School-DeterminedInputs
Houston:MathAssignments
NYC:TestResults Chicago:ReportCardGrades
NYC:SchoolwideTestScores
ImpactofIncentiveProgramsonStudentAchievement
IncentivesMon
thso
fSchoo
ling
TeacherIncentives
StudentOutputIncentives
StudentInputIncentives

CONFIDENTIAL
MySecondIdea:
Maybeweshouldgiveteachersincentivesforachievement…

CONFIDENTIAL
-0.7
-0.6
-0.5
-0.4
-0.3
-0.2
-0.1
0NYStateELA NYState
MathRegentsELA Regents
Math
Mon
thsofSchoo
ling
TreatmentEffectsofTeacherIncentiveProgram:NYC
Elementary
MiddleSchool
HighSchool
Incentives
CONFIDENTIAL
0
0.05
0.1
0.15
0.2
0.25
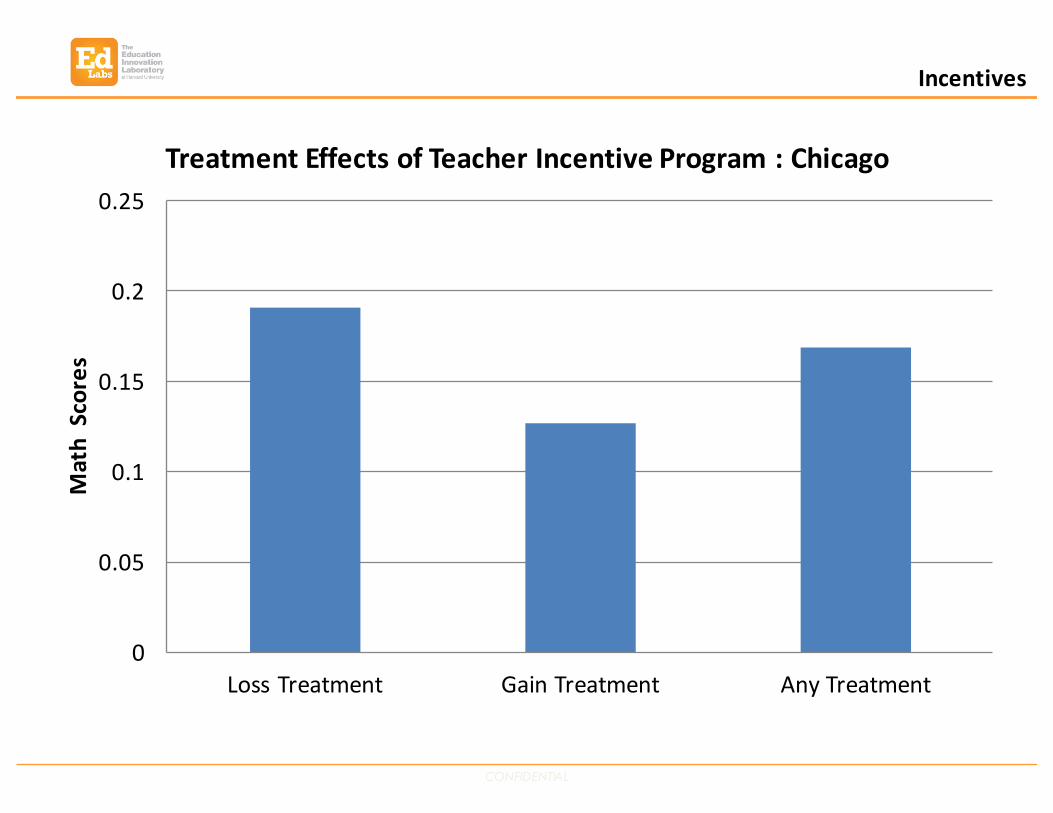
LossTreatment GainTreatment AnyTreatment
MathScores
TreatmentEffectsofTeacherIncentiveProgram:Chicago
Incentives

CONFIDENTIAL
MyThirdIdea:
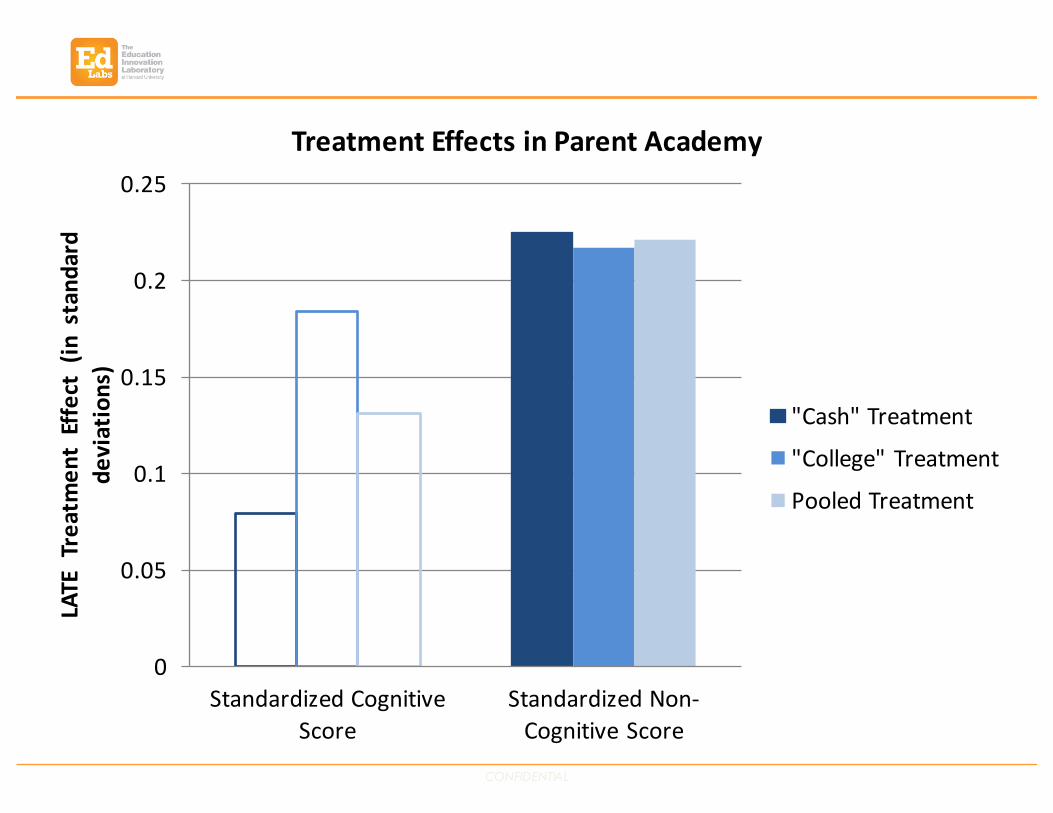
Maybeweshouldgiveparentsincentivesforstudentachievement…
CONFIDENTIAL
0
0.05
0.1
0.15
0.2
0.25
StandardizedCognitiveScore
StandardizedNon-CognitiveScore
LATETreatmen
tEffect(instand
ard
deviations)
TreatmentEffectsinParentAcademy
"Cash"Treatment
"College"Treatment
PooledTreatment
CONFIDENTIAL
My379th Idea:
Copysomeoneelse…
ResultsFromHigh-PerformingCharters
CONFIDENTIAL
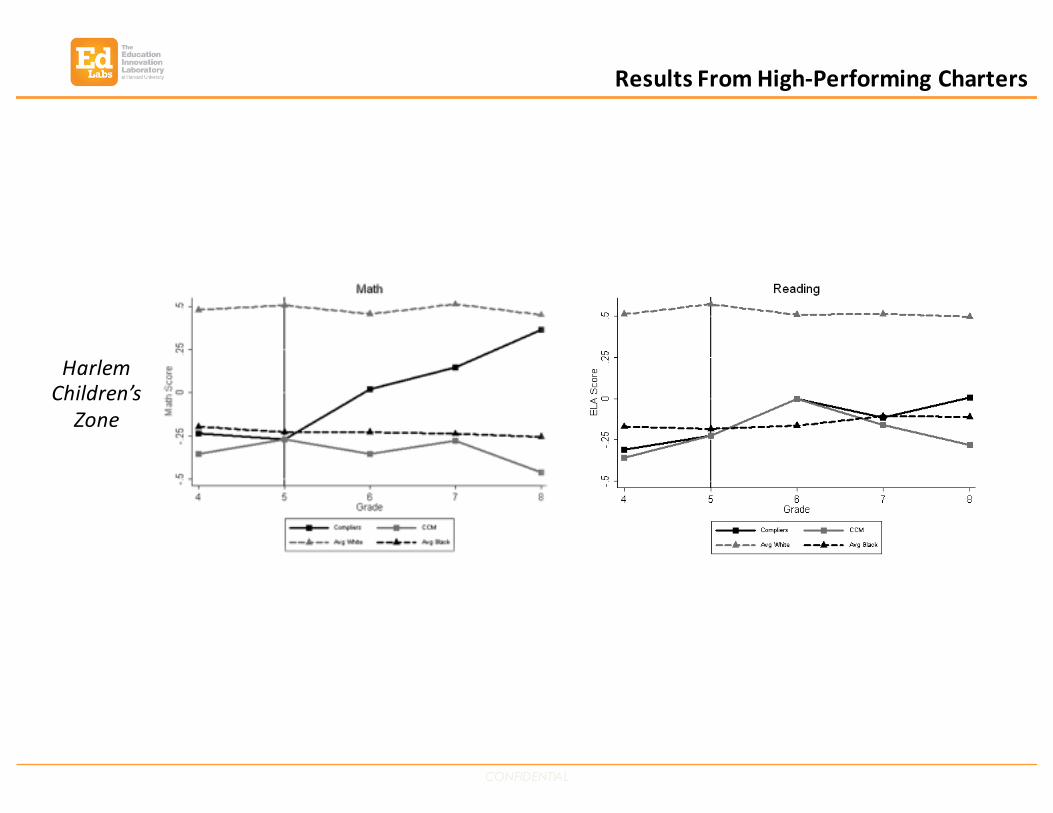
ResultsFromHigh-PerformingCharters
HarlemChildren’sZone

CONFIDENTIAL
CharterResults
-0.1
-0.05
0
0.05
0.1
0.15
0.2
0.25
0.3
0.35
0.4
Math
Reading
A.BroadSurveys B.HighPerformers

CONFIDENTIAL
FindingtheVaccine
-0.41
0.01
-0.40 -0.45
-0.31
0.79 0.75
0.930.80
0.700.59
-0.50
-0.25
0.00
0.25
0.50
0.75
1.00
Mon
thso
fSchoo
ling
Traditionalvs.Non-TraditionalSchoolInputsandSchoolEffectiveness
AverageCorrelationwithReadingandMathEffectiveness(inmonthsofschooling)
vs.
CONFIDENTIAL
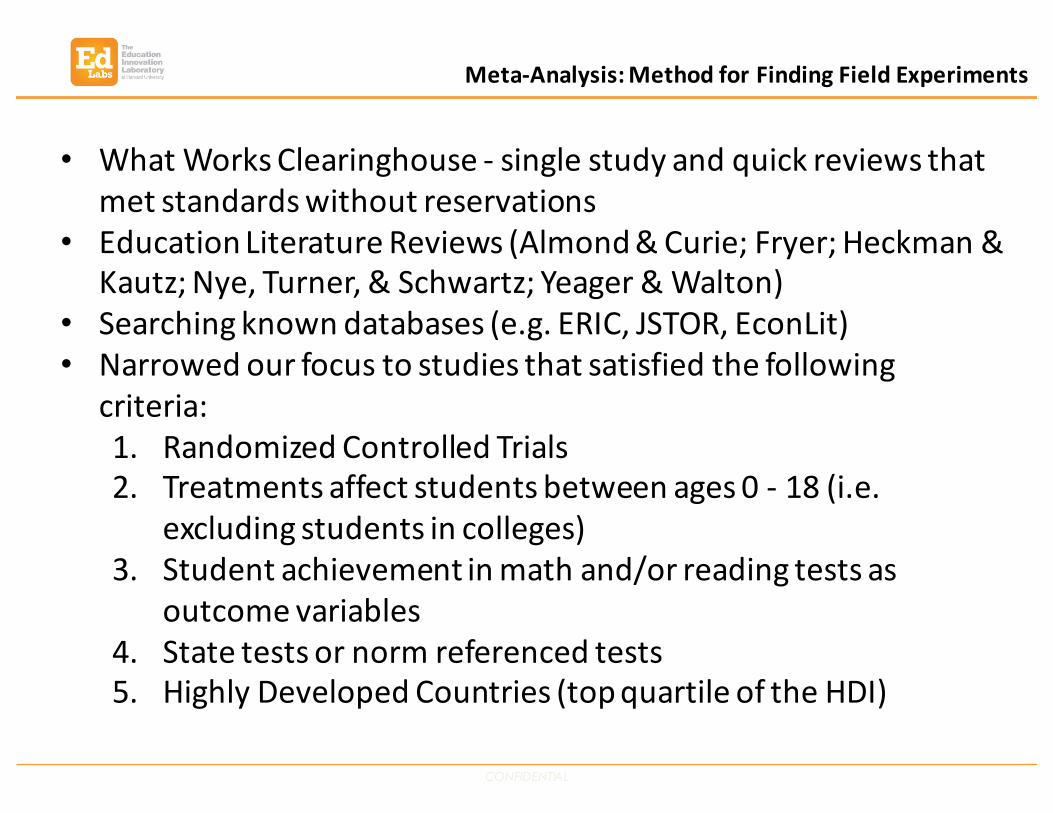
Meta-Analysis:MethodforFindingFieldExperiments
• WhatWorksClearinghouse- singlestudyandquickreviewsthatmetstandardswithoutreservations
• EducationLiteratureReviews(Almond&Curie;Fryer;Heckman&Kautz;Nye,Turner,&Schwartz;Yeager&Walton)
• Searchingknowndatabases(e.g.ERIC,JSTOR,EconLit)• Narrowedourfocustostudiesthatsatisfiedthefollowing
criteria:1. RandomizedControlledTrials2. Treatmentsaffectstudentsbetweenages0- 18(i.e.
excludingstudentsincolleges)3. Studentachievementinmathand/orreadingtestsas
outcomevariables4. Statetestsornormreferencedtests5. HighlyDevelopedCountries(topquartileoftheHDI)

CONFIDENTIAL
Meta-Analysis:PapersFound
Paper AccountingNumber of Papers
Hits From Broad Search ⇡ 8,000
Selected for Further Review 838
College Sample/Outcomes -42Design Issues -87Countries w/o Very High HDI -57Insufficient Info -22Paper Not Located -10No Standardized Reading or Math -337Repeat Paper -71Sample Issues -18
Total Included 194

CONFIDENTIAL
Meta-AnalysisResults

CONFIDENTIAL
Thekeygoal istotranslate charterschools’ successful policies intocommonprinciples andthentransplant themintotraditional public schools. Tothisend, EdLabs initiated amulti-year study ofNYCchartersthatdetermined thatthefollowing fivepolicies andpractices have thegreatestcorrelation withstudentachievement:
More Time in School• Extended day, week, and school years are all integral components of successful school
models. In the case of Harlem Children’s Zone’s Promise Academy, students have nearly doubled the amount of time on task compared to students in NYC public schools.
Small Group Tutoring• In top performing schools, classroom instruction is supplemented by individualized
tutoring, both after school and during the regular school day.
Human Capital Management • Successful charters reward teachers for performance and hold them accountable if they
are not adding value.
Data Driven Instruction and Student Performance Management• In the top charter schools, students are assessed frequently, and then, in small groups,
re-taught the skills they have not yet mastered.
Culture and Expectations• In successful schools, students buy into the school’s mission and into the importance of
their education in improving their lives.
Edlabs’ResearchFindings:FindingtheVaccine

CONFIDENTIAL
-0.1
-0.05
0
0.05
0.1
0.15
0.2
0.25
0.3
AverageCharterNational
AverageNYCCharter
AUSLTurnaround
HarlemChildren'sZone(MS)
AverageKIPP(MS)
ApolloMS/HS ApolloES DenverSummitSchools
TreatmentEffectsinContext
Math Reading
TurnaroundsInContext

CONFIDENTIAL
Long-TermHCZEffects
0
5
10
15
20
25
EnrolledinCollege Enrolledin4-yearCollege
College-Going
0
0.05
0.1
0.15
0.2
0.25
0.3
Math Reading
Woodcock Johnson
-0.06
-0.04
-0.02
0
0.02
0.04
0.06
0.08
0.1
0.12
MentalHealth PhysicalHealthIndex NutritionIndex
HealthOutcomes
0
1
2
3
4
5
6
Pregnancy(Girls) Incarceration(Boys)
SocialOutcomes(OddsRatios)