analysis of veterinary drugs in meat with the agilent 6495 ... · analysis of veterinary drugs in...
TRANSCRIPT

Analysis of Veterinary Drugs in Meat with the Agilent 6495 Triple Quadrupole LC/MS
Application Note
Authors
Tarun Anumol, Joan M. Stevens, and Jerry Zweigenbaum Agilent Technologies Inc.
Food
Abstract
A method using an Agilent 1290 Infinity II LC coupled to an Agilent 6495 Triple Quadrupole LC/MS for the rapid and sensitive analysis of 120 veterinary drugs in bovine meat has been developed. The analytical run time is 12 minutes, while limits of detection and quantification range between 0.1–2 ng/mL and 0.1–5 ng/mL, respectively. Three optimized MRM transitions were selected for all but three veterinary drugs, ensuring selectivity and robustness. Quantification of real samples was possible with most compounds having R2 >0.99 when two sets of matrix-matched calibration curves were performed. The method is reproducible and repeatable as indicated by the results of intra- and interday variability tests that produce relative standard deviations of <15 % for more than 90 % of the compounds tested.

2
Instrumentation Separation of analytes for this method was performed using an Agilent 1290 Infinity II LC with a 20 µL injection loop and multiwash capability. An Agilent 6495 Triple Quadrupole LC/MS with the iFunnel and Jet Stream technology was used as the detector. Analysis was performed in simultaneous positive and negative electrospray ionization mode. All data acquisition and processing was performed using Agilent MassHunter software (Version 07.00). Tables 1 and 2 show the instrument conditions.
Introduction The monitoring of veterinary drugs in food is critical due to contamination and the possibility of increased antimicrobial resistance by pathogenic microorganisms [1]. Veterinary drug administration in animals is important to treat diseases and promote growth. However, improper dosing or illegal practices can lead to contamination in meat for human consumption. As a result, veterinary drugs in food are regulated in several regions including the US, Europe, China, Australia, and others [2-4].
Analysis of veterinary drugs is challenging due to their many classes with diverse structures and varying chemical properties. To meet the needs of analytical labs, rapid and efficient techniques using multiclass, multiresidue methods analyzing >100 veterinary drugs in a single run are required. Additional goals are detection limits of low μg/kg, with good reproducibility and high sample throughput. The use of ultrahigh performance liquid chromatography (UHPLC) coupled to tandem mass spectrometers (MS/MS) is the gold standard for this analysis. This technique offers the requisite analytical sensitivity and robustness while allowing for time and labor savings compared to other techniques for analysis of veterinary drugs.
This application note describes the development of a rapid UHPLC/MS/MS method with the Agilent 1290 Infinity II UHPLC and an Agilent 6495 Triple Quadrupole LC/MS for the analysis of 120 veterinary drugs in animal meat. The method used three transitions for each analyte (except three) satisfying US and EU specifications for identification. The sensitivity of the method was determined by calculating the limits of detection and quantification in kidney and liver. Other method validation protocols such as linearity, robustness, and reproducibility were also evaluated in this study.
Experimental
Standards and reagents All native veterinary drug standards were bought from Sigma-Aldrich (St. Louis, MO), and prepared between 300 and 1,000 µg/mL in solvent (either acetonitrile, methanol, dimethyl sulfoxide, or water depending on solubility). The three internal standards used in this study (flunixin-d3, nafcillin-d5, and doxycycline-d3) were acquired from Toronto Research Chemicals (Toronto, ON). LC/MS grade acetonitrile and water were procured from Burdick and Jackson (Muskegon, MI), while formic acid (>98 %, Suprapur) was obtained from EMD Millipore (Darmstadt, Germany).
Table 1. Optimized LC Conditions
Table 2. Optimized MS conditions
Parameter ValueInstrument Agilent 1290 Infinity II with 20 µL flex loop and
multiwashColumn Agilent ZORBAX C-18 Eclipse Plus
2.1 × 150 mm, 1.8 µm (p/n 959759-902)Guard column Agilent ZORBAX C-18 Eclipse Plus
2.1 × 5 mm, 1.8 µm (p/n 821725-901)Column temperature 30 °CInjection volume 15 µLMobile phase A) Water + 0.1 % formic acid
B) AcetonitrileRun time 12 minutesEquilibration time 2 minutesFlow rate 0.5 mL/minGradient Time (min) A (%)
0.0 98 1.0 98 1.5 85 2.5 70 6.0 55 8.5 20 10.0 0 11.0 0 11.2 98
Parameter ValueMass spectrometer Agilent 6495 Triple Quadrupole LC/MSGas temperature 150 °CGas flow rate 18 L/minSheath gas temperature 300 °CSheath gas flow rate 11 L/minNebulizer pressure 35 psiCapillary voltage 4,000 V (3,000 V)Nozzle voltage 500 V (1,500 V)Ion funnel HPRF 200 v (90 V)Ion funnel LPRF 100 V (60 V)Delta EMV 200 VTime segments Time (min) Flow
0.0 Waste 0.7 MS

3
Results and Discussion
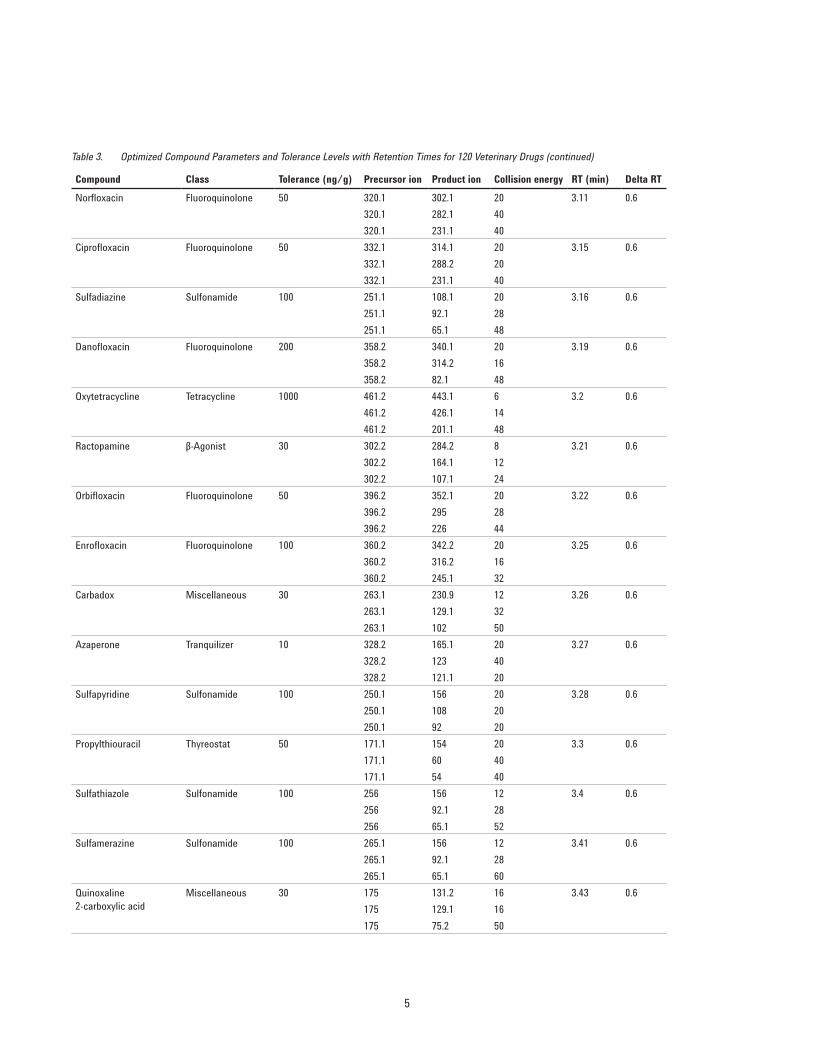
Compound selection and optimization The 120 veterinary drugs analyzed in this study were selected based on a monitoring list used by the United States Department of Agriculture’s Agricultural Research Service (USDA-ARS) [9]. The compound-specific parameters including precursor ion, three most abundant unique product ions, and collision energy were determined by running each standard through the Agilent Optimizer software. Three specific transitions were selected for each compound (except thiouracil, metronidazole, and clindamycin) to satisfy both US and EU regulations for identification by mass spectrometry. Table 3 shows the optimized transitions, retention times, and other relevant parameters for each compound. The tolerance levels for each veterinary drug were obtained from the USDA-ARS, and were used to prepare calibration curves, and perform spike studies, described later. Care was taken to select transitions that did not have matrix interferences. Cimaterol had matrix interferants for the 220.1 → 202.1 and 220.1 → 160.1 transitions, therefore, extra transitions were obtained. The ion ratio intensities were helpful in identifying these issues (as opposed to reporting cimaterol as incurred). Figure 1 represents a chromatogram of cimaterol in standard and liver blank with the different MRM transitions that indicate the presence of two of the transitions in matrix but at different ion ratios than would be expected based on the standard.
Sample preparation The Agilent Enhanced Matrix Removal—Lipid (EMR—L) product was used for sample extraction of veterinary drugs in this study. The EMR—L selectively removes lipids while not trapping contaminants of interest, and has been shown to be effective in extracting several classes of compounds including pesticides, toxins, and PAHs in food [5,6]. Details of the procedure followed for veterinary drug extraction using EMR—L, and product information can be found in previously published literature [7,8]. Briefly, 2 g samples of homogenized bovine kidney and liver were weighed and placed into 50-mL polypropylene tubes. A 10 mL solution of acetonitrile with 5 % formic acid was added to the sample and mixed with an orbital shaker for 5 minutes, followed by centrifugation at 4,000 rcf for 5 minutes. After this, 5 mL of the supernatant was added to the 1 g EMR—L tube, which had been activated previously with 5 mL of 5 mM ammonium acetate solution. The tube was then vortexed and centrifuged at 4,000 rcf for 5 minutes. The 5 mL of supernatant from this solution was transferred to a 15-mL centrifuge tube to which 2 g of MgSO4 were added from the EMR—L pouch with vortexing and centrifugation, as before. Finally, a 100 µL extract was collected from the tube and diluted with 400 µL of ultrapure water in a 1-mL polypropylene vial, ready for LC/MS analysis.
Table 3. Optimized Compound Parameters and Tolerance Levels with Retention Times for 120 Veterinary Drugs
Compound Class Tolerance (ng/g) Precursor ion Product ion Collision energy RT (min) Delta RTThiouracil Thyreostat 400 129 90.1 8 0.95 1.0
129 82.3 16Florfenicol amine Phenicol 300 248.1 230.1 8 0.99 0.8
248.1 130.1 28248.1 91.1 50
Florfenicol Phenicol 300 358 241 16 1 0.6358 206 28358 170 32
Sulfanilamide Sulfonamide 100 173 156 5 2 0.6173 92 25173 76 5
Methyl-thiouracil Thyreostat 400 143 126 20 2.5 0.6143 86 20143 84 20
Amoxicillin β-Lactam 10 367 349.1 4 2.56 0.6367 208 8367 114 56

4
Compound Class Tolerance (ng/g) Precursor ion Product ion Collision energy RT (min) Delta RTSalbutamol β-Agonist 10 240.2 222.2 4 2.6 0.6
240.2 166.1 4240.2 148.1 16
Tildipirosin Macrolide 100 734.5 561.5 36 2.65 0.6734.5 174 44734.5 98.2 56
Cimaterol β-Agonist 10 220.1 202.1* 4 2.66 0.6220.1 160.1* 12220.1 143.1 14220.1 116.1 20
Hydroxy- metronidazole Coccidiostat 10 188.1 126.1 16 2.7 0.6188.1 123.1 8188.1 68.0 22
Lincomycin Lincosamide 100 407.2 359.2 16 2.7 0.6407.2 126.1 24407.2 42.2 68
Hydroxy-dimetridazole Coccidiostat 50 158.1 140 8 2.8 0.6158.1 55.2 20158.1 42.2 40
Metronidazole Coccidiostat 10 172.1 128 12 2.83 0.6172.1 82.1 24
Dipyrone metabolite Anti- inflammatory 200 218.1 187.1 18 2.85 0.6218.1 125 16218.1 97 14
Levamisole Anthelmintic 100 205.1 178.1 20 2.9 0.6205.1 123 32205.1 91.1 44
Albendazole-2- aminosulfone
Anthelmintic 50 240.1 198 20 2.97 0.6240.1 133.1 20240.1 105 40
Ampicillin β-Lactam 10 350 160 4 3 0.6350 114 36350 106 16
Dimetridazole Coccidiostat 10 142.1 96.1 16 3 0.6142.1 81.1 28142.1 54.1 36
Thiabendazole Anthelmintic 100 202 175 24 3 0.6202 131 36202 65 52
Ronidazole Coccidiostat 10 201.1 140.1 8 3.09 0.6201.1 55.2 20201.1 154.9 8
Desethylene Ciprofloxacin
Fluoroquinolone 100 306.1 288.2 20 3.1 0.6306.1 268.1 28306.1 217 44
Table 3. Optimized Compound Parameters and Tolerance Levels with Retention Times for 120 Veterinary Drugs (continued)
* Potential matrix interferants in liver extract.
5
Compound Class Tolerance (ng/g) Precursor ion Product ion Collision energy RT (min) Delta RTNorfloxacin Fluoroquinolone 50 320.1 302.1 20 3.11 0.6
320.1 282.1 40320.1 231.1 40
Ciprofloxacin Fluoroquinolone 50 332.1 314.1 20 3.15 0.6332.1 288.2 20332.1 231.1 40
Sulfadiazine Sulfonamide 100 251.1 108.1 20 3.16 0.6251.1 92.1 28251.1 65.1 48
Danofloxacin Fluoroquinolone 200 358.2 340.1 20 3.19 0.6358.2 314.2 16358.2 82.1 48
Oxytetracycline Tetracycline 1000 461.2 443.1 6 3.2 0.6461.2 426.1 14461.2 201.1 48
Ractopamine β-Agonist 30 302.2 284.2 8 3.21 0.6302.2 164.1 12 302.2 107.1 24
Orbifloxacin Fluoroquinolone 50 396.2 352.1 20 3.22 0.6396.2 295 28396.2 226 44
Enrofloxacin Fluoroquinolone 100 360.2 342.2 20 3.25 0.6360.2 316.2 16360.2 245.1 32
Carbadox Miscellaneous 30 263.1 230.9 12 3.26 0.6263.1 129.1 32263.1 102 50
Azaperone Tranquilizer 10 328.2 165.1 20 3.27 0.6328.2 123 40328.2 121.1 20
Sulfapyridine Sulfonamide 100 250.1 156 20 3.28 0.6250.1 108 20250.1 92 20
Propylthiouracil Thyreostat 50 171.1 154 20 3.3 0.6171.1 60 40171.1 54 40
Sulfathiazole Sulfonamide 100 256 156 12 3.4 0.6256 92.1 28256 65.1 52
Sulfamerazine Sulfonamide 100 265.1 156 12 3.41 0.6265.1 92.1 28265.1 65.1 60
Quinoxaline 2-carboxylic acid
Miscellaneous 30 175 131.2 16 3.43 0.6175 129.1 16175 75.2 50
Table 3. Optimized Compound Parameters and Tolerance Levels with Retention Times for 120 Veterinary Drugs (continued)

6
Compound Class Tolerance (ng/g) Precursor ion Product ion Collision energy RT (min) Delta RTXylazine Tranquilizer 10 221.1 105.1 40 3.43 0.6
221.1 90 40221.1 72 40
Clenbuterol β-Agonist 10 277.1 259.1 4 3.44 0.6277.1 203 12277.1 132.1 32
Chlortetracycline Tetracycline 1000 479.1 462 12 3.45 0.65479.1 444 20479.1 154.1 36
Thiamphenicol Phenicol 10 354 290 12 3.46 0.6354 227 18354 184.9 34
Cefapirin β-Lactam 100 424.1 364 8 3.48 0.6424.1 124.1 48424.1 112 24
Mercaptobenzimi dazole Thyreostat 25 151 118.1 28 3.47 0.6151 93 24151 65.1 48
Cefazolin β-Lactam 100 455 323 4 3.49 0.6455 156 16455 124 32
Difloxacin Fluoroquinolone 50 400.1 382.1 20 3.5 0.6400.1 356.2 16400.1 299.1 32
Gamithromycin Macrolide 100 777.5 619.4 36 3.52 0.6777.5 158.1 54777.5 116 54
Sarafloxacin Fluoroquinolone 50 386.1 368.1 20 3.44 0.6386.1 342.1 20386.1 299.1 40
Amino-mebendazole Anthelmintic 10 238.1 133.1 44 3.54 0.6238.1 105.1 28238.1 77.1 40
Morantel Anthelmintic 100 221.1 150 40 3.54 0.6221.1 123 40221.1 111 40
Bacitracin Miscellaneous 500 711.9 669.3 20 3.55 0.6711.9 227.1 40711.9 199.1 40
Sulfamethazine Sulfonamide 100 279.1 186.1 12 3.58 0.6279.1 124.1 24279.1 92.1 32
Clindamycin Lincosamide 100 425.2 377.2 20 3.60 0.6425.2 126.1 20
Sulfamethizole Sulfonamide 100 271 156 10 3.62 0.6271 108 20271 92 40
Table 3. Optimized Compound Parameters and Tolerance Levels with Retention Times for 120 Veterinary Drugs (continued)

7
Compound Class Tolerance (ng/g) Precursor ion Product ion Collision energy RT (min) Delta RTSulfamethoxypyr idazine Sulfonamide 100 281.1 156 12 3.64 0.6
281.1 92.1 32281.1 65.1 60
Aminoflubendazole Anthelmintic 10 256.1 123 40 3.66 0.6256.1 95 40256.1 75 40
Hydroxy-ipronidazole Coccidiostat 10 186.1 168.1 8 3.68 0.6186.1 122.1 20186.1 106.1 44
Tilmicosin Macrolide 100 869.6 696.4 44 3.68 0.6869.6 174.1 48 869.6 88.1 70
Cambendazole Anthelmintic 10 303.1 261 16 3.73 0.6303.1 217.1 32303.1 190 44
Doxycycline Tetracycline 100 445.2 428.1 16 3.78 0.6445.2 410 24445.2 321.1 28
Doxycycline-d3 Internal Standard – 448.1 431.2 16 3.78 0.8448.1 155.1 36
Carazolol Tranquilizer 10 299.2 222.1 20 3.81 0.6299.2 116.1 20299.2 56 40
Tetracycline Tetracycline 1000 445.2 427.1 10 3.85 0.6445.2 410.1 20445.2 154 40
Phenyl-thiouracil Thyreostat 400 205 188 20 3.86 0.6205 103 28205 86.2 28
Oxibendazole Anthelmintic 10 250.1 218.1 16 3.87 0.6250.1 176.1 28250.1 148 40
Oxfendazole Anthelmintic 800 316.1 284 16 3.97 1.0316.1 191.1 16316.1 159 32
Albendazole sulfone Anthelmintic 50 298.1 266.1 20 4.1 0.6298.1 224 20298.1 159 40
Sulfadimethoxine Sulfonamide 100 311.1 156 16 4.21 0.6311.1 92.1 36311.1 65.1 60
Sulfaethoxypyrid azine Sulfonamide 100 298.1 158 16 4.25 0.6298.1 108.1 32298.1 92.1 32
Sulfachloropyrid azine Sulfonamide 100 285 156 12 4.26 0.6285 92.1 24285 65.1 60
Table 3. Optimized Compound Parameters and Tolerance Levels with Retention Times for 120 Veterinary Drugs (continued)

8
Compound Class Tolerance (ng/g) Precursor ion Product ion Collision energy RT (min) Delta RTSulfamethoxazole Sulfonamide 100 254.1 156 12 4.35 0.6
254.1 92.1 24254.1 65.1 48
Erythromycin Lincosamide 100 734.5 576.3 16 4.38 0.6734.5 158.1 32734.5 83.1 60
Chloramphenicol Phenicol 10 321.1 257 18 4.43 0.6321.1 151.9 26321.1 80 50
Ipronidazole Coccidiostat 10 170.1 124 16 4.49 0.6170.1 109 24170.1 81.1 36
Tylosin Macrolide 200 916.5 174.1 44 4.67 0.6916.5 101 56916.5 83 60
Acepromazine Tranquilizer 10 327.2 222.1 40 4.73 0.6327.2 86.1 20327.2 58.1 40
Haloperidol Tranquilizer 10 376.2 165.1 24 4.75 0.6376.2 123 50376.2 95.1 50
Promethazine Tranquilizer 10 285.1 198 28 4.78 0.6285.1 86.2 20285.1 71.3 48
Prednisone Anti- inflammatory 100 359.2 341.2 10 4.84 0.6359.2 237.1 20359.2 147.1 40
Clorsulon Anthelmintic 100 377.9 341.9 0 4.91 0.8377.9 242 40377.9 142 40
Sulfadoxine Sulfonamide 100 311.1 156 16 4.96 0.6311.1 108 28311.1 92.1 32
Sulfaquinoxaline Sulfonamide 100 301.1 156 16 4.95 0.6301.1 108 28301.1 92 32
Albendazole Anthelmintic 50 266.1 234.1 16 5.01 0.6266.1 191 32266.1 159 44
Mebendazole Anthelmintic 10 296.1 264.1 20 5.16 0.8296.1 105 36296.1 77 48
Penicillin G β-Lactam 10 335.0 114.0 35 5.29 0.6335.0 160.0 18335.0 176.1 20
Table 3. Optimized Compound Parameters and Tolerance Levels with Retention Times for 120 Veterinary Drugs (continued)

9
Compound Class Tolerance (ng/g) Precursor ion Product ion Collision energy RT (min) Delta RTPropionylpromaz ine Tranquilizer 10 341.2 268.1 24 5.46 0.6
341.2 86.2 20341.2 58.2 52
Flubendazole Tranquilizer 10 314.1 282.1 20 5.58 0.6314.1 123 36 314.1 95.1 56
Betamethasone Anti-inflammatory 100 393.2 373.2 4 5.71 0.6393.2 237.2 12393.2 147.1 32
Chlorpromazine Tranquilizer 10 319.1 246 28 5.77 0.6319.1 86.1 20319.1 58.2 50
Sulfanitran Sulfonamide 100 334.1 137 40 6.18 0.6334.1 136 40334.1 134.1 40
Sulfabromomethazine Sulfonamide 100 357 156 24 6.23 0.6357 108 36357 92.1 36
Zeranol Miscellaneous 100 321.1 303.2 34 6.3 0.6321.1 277.2 34321.1 259.1 36
Oxacillin β-Lactam 100 402 243 8 6.49 0.6402 160 8402 114 40
Triflupromazine Tranquilizer 10 353.1 248.1 40 6.28 0.6353.1 86.1 20353.1 58.1 40
Fenbendazole Anthelmintic 10 300.1 268.1 20 6.54 0.6300.1 159 36300.1 131 56
Virginiamycin M1 Miscellaneous 100 526.3 508.3 12 6.74 0.8526.3 355.2 16526.3 109.1 32
Nitroxynil Anthelmintic 50 288.91 162 20 6.78 0.8288.91 127 28288.91 89 44
Cloxacillin β-Lactam 10 436 358.2 0 7.15 0.6436 277 12436 160 12
Nafcillin-d5 Internal Standard – 420.1 204 16 7.41 0.8420.1 172 52
Ketoprofen Anti-inflammatory 10 255.1 209.1 8 7.4 0.8255.1 105.1 24255.1 77.1 48
Nafcillin β-Lactam 10 415 199.1 8 7.41 0.6415 171 36415 115 20
Table 3. Optimized Compound Parameters and Tolerance Levels with Retention Times for 120 Veterinary Drugs (continued)

10
Compound Class Tolerance (ng/g) Precursor ion Product ion Collision energy RT (min) Delta RTFlunixin Anti-inflammatory 25 297.1 279.1 24 7.46 0.8
297.1 259.1 32297.1 236 48
Flunixin-d3 Internal Standard – 300.1 282.1 29 7.46 0.8300.1 264.1 45
Oxyphenbutazone Anti-inflammatory 100 325.2 204.1 20 7.51 0.8325.2 148 40325.2 120 20
Meloxicam Anti-inflammatory 100 352 140.9 16 7.68 0.8352 115 16352 73 44
Emamectin B1a Anthelmintic 10 886.5 158.1 40 8.07 0.8886.5 126.1 40886.5 82.2 54
Haloxon Anthelmintic 100 415 352.9 24 8.24 0.8415 352.9 24415 211 44
Triclabendazole sulfoxide Anthelmintic 50 375 356.9 20 8.25 0.8375 313 28375 242 48
Diclofenac Anti- inflammatory 200 296 278 4 8.54 0.8296 250 8296 215.1 16
Phenylbutazone Anti- inflammatory 100 309.2 160.2 20 8.89 0.8309.2 120 28309.2 77.1 68
Triclabendazole Anthelmintic 50 359 343.9 24 9.01 1359 274 40359 171 60
Oxyclozanide Anthelmintic 10 397.87 361.9 20 9.06 0.8397.87 201.9 20397.87 175.8 28
Melengestrol acetate Miscellaneous 25 397.2 337.3 8 9.22 0.8397.2 279.2 20397.2 236.2 28
Niclosamide Anthelmintic 10 324.99 289 16 9.24 0.8324.99 170.9 36324.99 135.1 44
Tolfenamic acid Anti- inflammatory 200 262.1 244.1 12 9.27 0.8262.1 209.1 28262.1 180.1 48
Bithionol Anthelmintic 10 355 193.7 32 9.74 0.8355 162.9 28355 160.9 28
Table 3. Optimized Compound Parameters and Tolerance Levels with Retention Times for 120 Veterinary Drugs (continued)

11
Compound Class Tolerance (ng/g) Precursor ion Product ion Collision energy RT (min) Delta RTEprinomectin B1a Anthelmintic 100 914.5 330.1 28 10.22 1.5
914.5 186.1 28914.5 112.1 60
Abamectin Anthelmintic 20 895.5 449.3 44 10.5 1.5895.5 751.5 48
Closantel Anthelmintic 50 660.9 344.9 44 10.88 1.2660.9 315 40660.9 278.9 44
Moxidectin Anthelmintic 50 640.4 528.3 20 10.99 1.2640.4 498.2 18640.4 496.2 20
Doramectin Anthelmintic 30 921.1 770.1 62 11.1 1.5921.1 449.2 66921.1 353.1 66
Selamectin Anthelmintic 200 770.5 276 24 11.81 2.0770.5 203.2 28770.5 113.2 40
Rafoxanide Anthelmintic 10 625.8 372.8 36 11.23 1.0625.8 252.9 28625.8 127 36
Ivermectin B1a Anthelmintic 10 892.5 551.4 16 11.86 1.0892.5 307.3 24892.5 145 36
Table 3. Optimized Compound Parameters and Tolerance Levels with Retention Times for 120 Veterinary Drugs (continued)

12
LC/MS Method optimization The goal of this work was to achieve adequate separation of as many veterinary drugs as possible while having a rapid and robust method for analysis. Figure 2 shows the primary MRM transition for the 13 classes of veterinary drugs tested in this method using a 12-minute gradient with UHPLC in a kidney tissue at 50 ng/g. The most polar compounds such as thiouracil, florfenicol, and sulfanilamide elute early in the chromatogram with fairly good peak shapes. Several of the mectins however, such as abamectin, ivermectin, moxidectin, and selemectin eluted at the end of the run, with typical peak widths of 9–12 seconds. A dynamic MRM method with a cycle time of 550 ms was used with a minimum dwell time of 3.2 ms and a maximum dwell time of 274 ms.
Figure 1. Potential matrix interferences for two cimaterol transitions (220.1 → 202.1; 220.1 → 160.1).
Acquisition time (min)2.40 2.45 2.50 2.55 2.60 2.65 2.70 2.75 2.80 2.85 2.90 2.95
Coun
ts
×102
00.20.40.60.81.01.21.41.61.82.02.22.42.62.83.03.23.43.63.84.04.24.44.6
220.1 → 202.1, 220.1 → 160.1, 220.1 → 143.1Not FoundRatio = 72.4 (120.0 %)
Blank
2.40 2.45 2.50 2.55 2.60 2.65 2.70 2.75 2.80 2.85 2.90 2.95
Coun
ts
-0.250
0.250.5
0.751.0
1.251.5
1.752.0
2.252.5
2.753.0
3.253.5
3.754.0
4.254.5
4.75 220.1 → 202.1220.1 → 160.1220.1 → 143.1Ratio = 10.0 (15.9 %)Ratio = 0.1 (0.2 %)
Acquisition time (min)
×105 Liver blankCo
unts
-0.20
0.20.40.60.81.01.21.41.61.82.02.22.42.62.83.0 220.1 -> 202.1
220.1 -> 160.1220.1 -> 143.1Ratio = 69.1 (110.3 %)Ratio = 60.6 (100.5 %)
2.40 2.45 2.50 2.55 2.60 2.65 2.70 2.75 2.80 2.85 2.90 2.95Acquisition time (min)
×105 10 ng/g Standard

13
Figure 2. Representative chromatogram of veterinary drug classes at 50 ng/g in Kidney tissue. A) Sulfonamides, tranquilizers, miscellaneous; B) anthelmintics, thyreostats, tetracyclines, phenicols; C) anti-inflammatories, macrolides/lincosamides, fluoroquinolones; β-agonists D) β-lactams, coccidiostats.
A
B
C
D

14
Limits of detection and quantification The limit of detection (LOD) was defined as the lowest concentration at which the signal-to-noise ratio (S/N) was greater than 3. Meanwhile, the limit of quantification (LOQ) was the lowest concentration at which the S/N was greater than 10 for a compound. Blank kidney and liver tissue samples were extracted through the EMR—L procedure. The resulting extract was spiked with different concentrations of veterinary drugs to determine the LOD and LOQ, thus accounting for matrix effects encountered in the instrument. The corresponding results showed no difference between the liver and kidney, and are detailed in Table 4. Several
Table 4. LOD, LOQ, Inter- and Intraday Variability
CompoundsLOD (ng/mL)
LOQ (ng/mL)
Intraday variability RSD (%)
Interday variability RSD (%)
Abamectin 1 2 9.5 9.9Acepromazine 0.1 0.1 3.6 1.9Albendazole sulfone 0.1 0.5 2.4 2.6Albendazole 0.1 0.1 2.7 1.3Albendazole-2-aminosulfone 0.1 0.5 8.9 2.6Aminoflubendazol 0.1 0.1 13.6 22.0Amino-Mebendazole 0.1 0.1 9.7 13.7Amoxicillin 2 5 4.2 8.8Ampicillin 0.5 1 7.6 16.1Azaperone 0.1 0.1 5.1 8.0Bacitracin 2 5 6.3 9.2Betamethasone 0.1 0.5 3.6 4.5Bithionol 0.1 0.1 1.9 9.8Cambendazole 0.1 0.1 2.5 7.2Carazolol 0.1 0.1 6.6 9.4Carbadox 0.5 1 5.6 9.6Cefapirin 1 2 20.3 17.1Cefazolin 1 2 9.8 13.5Chloramphenicol 0.5 1 6.7 8.5Chlorpromazine 0.1 0.1 2.3 3.3Chlortetracycline 1 2 10.7 11.1Cimaterol 0.1 0.1 7.5 10.5Ciprofloxacin 0.5 1 2.3 15.6Clenbuterol 0.1 0.1 5.3 5.2Clindamycin 0.1 0.1 1.1 2.9Clorsulon 0.5 1 3.3 3.3Closantel 0.1 0.1 3.8 4.1Cloxacillin 2 5 6.2 7.8Danofloxacin 0.5 1 1.5 6.4Desethylene ciprofloxacin 1 2 5.7 12.3
RSDs >15 % in italic, RSDs >20 % in bold
CompoundsLOD (ng/mL)
LOQ (ng/mL)
Intraday variability RSD (%)
Interday variability RSD (%)
Diclofenac 0.5 1 1.1 3.4Difloxacin 0.1 0.1 8.2 8.1Dimetridazole 0.1 0.1 4.2 8.8Dipyrone metabolite NA NA 5.4 16.2Doramectin 1 2 6.5 9.3Doxycycline 0.1 0.5 10.6 6.1Emamectin 0.1 0.1 3.1 6.3Enrofloxacin 0.1 0.5 10.0 6.2Eprinomectin B1a 0.5 1 5.3 7.7Erythromycin 0.1 0.5 3.2 13.8Fenbendazole 0.1 0.1 3.2 2.3Florfenicol Amine 0.5 0.5 1.6 6.2Florfenicol 1 2 4.2 15.1Flubendazole 0.1 0.1 1.8 3.8Flunixin 0.1 0.1 1.5 7.3Gamithromycin 0.1 0.5 8.0 15.9Haloperidol 0.1 0.1 2.4 1.6Haloxon 0.5 0.5 9.1 5.9Hydroxydimetridazole 0.5 1 4.9 6.8Hydroxy-Ipronidazole 0.1 0.5 8.3 5.2Hydroxy-metronidazole 0.1 0.1 8.3 12.1Ipronidazole 0.1 0.1 1.8 6.3Ivermectin B1a 0.5 1 4.2 9.4Ketoprofen 0.1 0.5 5.1 3.8Levamisole 0.1 0.1 1.6 7.2Lincomycin 0.1 0.1 5.5 4.2Mebendazole 0.1 0.1 1.9 2.8Melengestrol acetate 0.1 0.1 3.5 3.4Meloxicam 0.1 0.1 1.0 3.8Mercaptobenzimidazole 0.1 0.5 10.8 11.0
compounds have LODs (and LOQs) lower than the smallest spike concentration of 0.1 ng/mL. The LODs for the analytes tested varied from 0.1–2 ng/mL, while the LOQs ranged between 0.1 and 5 ng/mL. Most of the compound classes (sulfonamides, fluoroquinolones, tranquilizers, and so forth) had LOQs in the sub 1 ng/mL region, while the β-lactams ranged between 1 and 5 ng/mL. Figure 3 illustrates that 89 compounds had LODs of 0.1 ng/mL (and many would be lower) while 61 compounds had LOQs at 0.1 ng/mL. All compounds had LODs and LOQs at or lower than 5 ng/mL. Most importantly, all 120 veterinary drugs had LOQs lower than the tolerance levels presented in Table 3.

15
Table 4. LOD, LOQ, Inter- and Intraday Variability (continued)
RSDs >15 % in italic, RSDs >20 % in bold
CompoundsLOD (ng/mL)
LOQ (ng/mL)
Intraday variability RSD (%)
Interday variability RSD (%)
Methylthiouracil 0.5 1 5.1 16.9Metronidazole 0.1 0.5 6.1 3.2Morantel 0.1 0.1 9.5 3.1Moxidectin 1 2 14.4 16.2Nafcillin 2 5 5.6 9.0Niclosamide 0.1 0.1 2.1 7.8Nitroxynil 0.1 0.1 2.1 3.8Norfloxacin 0.1 0.1 2.8 5.6Orbifloxacin 0.5 0.5 9.7 8.3Oxacillin 0.5 1 8.5 11.3Oxfendazole 0.1 0.1 1.6 2.4Oxibendazole 0.1 0.1 2.7 6.2Oxyclozanide 0.1 0.1 3.0 6.7Oxyphenbutazone 0.1 0.5 3.9 6.7Oxytetracycline 0.1 1 6.5 4.2Penicillin G NA NA NA NAPhenyl Thioracil 0.5 1 5.9 5.9Phenylbutazone 0.1 0.5 0.5 6.0Prednisone 0.5 0.5 4.3 10.1Promethazine 0.1 0.1 1.8 1.4Propionylpromazine 0.1 0.1 1.7 6.3Propylthiouracil 0.1 0.5 7.5 8.1Quinoxaline 2- carboxylic acid 0.5 1 6.8 11.0Ractopamine 0.1 0.1 2.3 11.4Rafoxanide 0.5 2 3.3 6.0Ronidazole 0.1 0.5 1.9 6.0Salbutamol (Albuterol) 0.1 0.5 2.1 6.5Sarafloxacin 0.5 0.5 8.7 12.9Selamectin 0.5 1 5.8 7.8Sulfabromomethazine 0.1 0.1 3.0 4.0
CompoundsLOD (ng/mL)
LOQ (ng/mL)
Intraday variability RSD (%)
Interday variability RSD (%)
Sulfachloropyridazine 0.1 0.1 3.8 4.1Sulfadiazine 0.1 0.1 3.4 10.2Sulfadimethoxine 0.1 0.1 3.9 2.7Sulfamethazine 0.1 0.1 4.6 7.2Sulfadoxine 0.1 0.1 2.6 3.3Sulfaethoxypyridazine 0.1 0.1 3.9 7.1Sulfamerazine 0.1 0.1 9.7 7.6Sulfamethizole 0.1 0.1 4.2 5.6Sulfamethoxazole 0.1 0.1 2.5 4.4Sulfamethoxypyridazine 0.1 0.1 7.0 9.1Sulfanilamide 0.1 0.1 11.6 9.2Sulfanitran 0.1 0.1 2.0 2.5Sulfapyridine 0.1 0.1 3.5 13.6Sulfaquinoxaline 0.1 0.1 4.0 5.3Sulfathiazole 0.1 0.1 8.6 7.8Tetracycline 0.5 1 6.3 6.2Thiabendazole 0.1 0.1 2.2 9.7Thiamphenicol 0.1 0.5 6.5 12.7Thiouracil 1 2 10.3 10.9Tildipirosin 0.1 0.1 2.5 9.3Tilmicosin 0.5 0.5 7.8 8.0Tolfenamic acid 0.1 0.1 1.1 4.7Triclabendazole sulfoxide 0.1 0.1 2.5 9.4Triclabendazole 0.1 0.1 2.2 9.0Triflupromazine 0.1 0.1 2.6 9.7Tylosin 0.5 1 3.0 6.4Virginiamycin M1 1 2 4.1 2.3Xylazine 0.1 0.1 12.2 14.7Zeranol 0.1 0.5 1.7 4.5

16
LinearityThe linearity of the methods was determined by creating two matrix-matched calibration curves each in kidney and liver. The first calibration curve was prepared to examine the ability to quantify across the range of tolerance levels that would be of interest to regulatory and monitoring agencies. This entailed creating a four-point calibration curve in liver and kidney at 0.5x, 1.0x, 1.5x, and 2.0x of the tolerance levels listed in Table 3. The second calibration curve was prepared at the low end to test the linearity for sensitive measurements, with a range of 1 to 100 ng/g in kidney and liver tissue (for compounds with LOQs >1 ng/mL, the point above the LOQ was selected as the first calibration level). Table 5 shows the linearity of all veterinary drugs for both types of calibration curves in kidney and liver.
0.1 0.5 1 2 50
20
40
60
80
100
LODLOQ
Concentration (ng/mL)
Num
ber o
f com
poun
ds
<5 % 5–10 % 10–15 % >15 %0
20
40
60
80
Intra-day variabilityInter-day variability
Relative standard deviation (%)
Num
ber o
f com
poun
ds
A
B
Figure 3. Distribution of (A) LODs and LOQs; (B) intraday and interday variability for the veterinary drugs tested in kidney.

17
Compound
0.5X, 1.0X, 1.5X, 2.0X 1.0, 2.0, 5.0, 10, 25, 50, 100 ng/gKidney Liver Kidney Liver
R2 Fit R2 Fit R2 Fit R2 FitAbamectin 0.9977 Linear 0.9788 Linear 0.9782 Quadratic 0.999 QuadraticAcepromazine 0.9997 Linear 0.9982 Linear 0.9928 Linear 0.9983 LinearAlbendazole sulfone 0.9974 Linear 0.9986 Linear 0.9982 Linear 0.9971 LinearAlbendazole 0.9966 Linear 0.9935 Linear 0.9981 Linear 0.9998 LinearAlbendazole-2- aminosulfone
0.9841 Linear 0.9988 Linear 0.997 Linear 0.9975 Linear
Aminoflubendazol 0.9882 Linear 0.9999 Linear 0.9987 Linear 0.9861 LinearAmino-Mebendazole 0.9926 Linear 0.984 Linear 0.9959 Linear 0.9911 LinearAmoxicillin 0.899 Linear 0.9965 Linear 0.9665 Linear 0.9997 LinearAmpicillin 0.9957 Linear 0.995 Linear 0.9983 Linear 0.9948 LinearAzaperone 0.9981 Linear 0.921 Linear 0.9928 Quadratic 0.9876 QuadraticBacitracin 0.9913 Linear 0.9825 Linear 0.9941 Linear 0.9913 LinearBetamethasone 0.9998 Linear 0.9984 Linear 0.9995 Linear 0.9995 LinearBithionol 0.9938 Linear 0.996 Linear 0.9894 Quadratic 0.994 QuadraticCambendazole 0.9938 Linear 0.9692 Linear 0.9977 Linear 0.9995 LinearCarazolol 0.9925 Linear 0.9994 Linear 0.9996 Linear 0.9898 LinearCarbadox 0.9973 Linear 0.9993 Linear 0.994 Linear 0.987 LinearCefapirin 0.9908 Linear 0.9962 Linear 0.9956 Linear 0.9987 LinearCefazolin 0.9919 Linear 0.9999 Linear 0.9966 Linear 0.9986 LinearChloramphenicol 0.9945 Linear 0.9981 Linear 0.9972 Linear 0.9943 LinearChlorpromazine 0.9879 Linear 0.9977 Linear 0.9807 Linear 0.9891 LinearChlortetracycline 0.9972 Linear 0.9957 Linear 0.9924 Linear 0.9915 LinearCimaterol 0.9986 Linear 0.9986 Linear 0.9894 Linear 0.9965 LinearCiprofloxacin 0.9967 Linear 0.9918 Linear 0.9349 Linear 0.9771 LinearClenbuterol 0.9999 Quadratic 0.9909 Linear 0.9906 Linear 0.9985 LinearClindamycin 0.9969 Linear 0.9908 Linear 0.9973 Linear 0.9993 LinearClorsulon 0.9965 Linear 0.9982 Linear 0.9933 Linear 0.9984 LinearClosantel 0.9554 Linear 0.9895 Linear 0.9004 Linear 0.995 LinearCloxacillin 0.9998 Linear 0.9958 Linear 0.996 Linear 0.992 LinearDanofloxacin 0.9945 Linear 0.9933 Linear 0.9987 Linear 0.9997 LinearDesethylene ciprofloxacin 0.9959 Linear 0.9998 Linear 0.9815 Linear 0.9486 LinearDiclofenac 0.9987 Linear 0.9967 Linear 0.9996 Linear 0.9995 LinearDifloxacin 0.9905 Linear 0.9919 Linear 0.9955 Linear 0.9957 LinearDimetridazole 0.9938 Linear 0.996 Linear 0.9958 Linear 0.9965 LinearDipyrone metabolite 0.998 Linear 0.9912 Linear 0.9916 Linear 0.9981 LinearDoramectin NA NA NA NADoxycycline 0.9899 Linear 0.9999 Linear 0.9999 Linear 0.9989 LinearEmamectin 0.9549 Linear 0.9901 Linear 0.9951 Quadratic 0.9972 QuadraticEnrofloxacin 0.9993 Quadratic 0.9963 Linear 0.9938 Linear 0.9913 LinearEprinomectin B1a 0.9913 Linear 0.9936 Linear 0.9932 Linear 0.9911 LinearErythromycin 0.9999 Linear 0.9978 Linear 0.9995 Linear 0.9982 LinearFenbendazole 0.9989 Linear 0.9962 Quadrati c 0.9998 Linear 0.9933 LinearFlorfenicol Amine 0.9535 Linear 0.9555 Linear 0.8648 Linear 0.9614 LinearFlorfenicol 0.9842 Linear 0.984 Linear 0.9818 Linear 0.9191 Linear
R2 <0.99 in bold
Table 5. Linearity for Two Sets of Calibration Curves Tested

18
Flubendazole 0.999 Linear 0.9914 Linear 0.9924 Linear 0.9975 LinearFlunixin 0.9922 Linear 0.9996 Linear 0.9935 Linear 0.9968 LinearGamithromycin 0.9925 Linear 0.9902 Linear 0.9998 Linear 0.987 LinearHaloperidol 0.9931 Linear 0.9995 Linear 0.9921 Quadratic 0.9967 QuadraticHaloxon 0.9942 Linear 0.9934 Linear 0.999 Linear 0.9997 LinearHydroxydimetridazole (Dimetridazol-OH)
0.9846 Linear 0.9998 Linear 0.9996 Linear 0.9934 Linear
Hydroxy-Ipronidazole 0.995 Linear 1 Quadratic 0.9969 Linear 0.9987 LinearHydroxy-metronidazole 0.9979 Linear 0.9937 Linear 0.9962 Linear 0.9998 LinearIpronidazole 0.9952 Linear 0.9922 Linear 0.9919 Linear 0.9975 LinearIvermectin B1a 0.9357 Linear 0.9914 Linear 0.9964 Linear 0.9986 LinearKetoprofen 0.9956 Linear 0.998 Linear 0.9953 Linear 0.9997 LinearLevamisole 0.991 Linear 0.9949 Linear 0.9984 Linear 0.9941 LinearLincomycin 0.9916 Linear 0.9891 Linear 0.9816 Linear 0.9936 LinearMebendazole 0.9972 Linear 0.9985 Linear 0.9981 Linear 0.9941 LinearMelengestrol acetate 0.9968 Linear 0.9931 Linear 0.9747 Linear 0.9918 LinearMeloxicam 0.9998 Linear 0.9996 Linear 0.9961 Linear 0.9998 LinearMercaptobenzimidazole 0.9982 Linear 0.9921 Linear 0.9794 Linear 0.9937 LinearMethylthiouracil 0.9967 Linear 0.9959 Linear 0.9927 Linear 0.9997 LinearMetronidazole 0.9982 Linear 0.9941 Linear 0.9995 Linear 0.9994 LinearMorantel 0.9962 Linear 0.9936 Linear 0.9903 Linear 0.9979 LinearMoxidectin 0.9904 Linear 0.9903 Linear NA NANafcillin 0.9917 Linear 0.9901 Linear 0.9982 Linear 0.9971 LinearNiclosamide 0.9999 Linear 0.9917 Linear 0.9911 Quadratic 0.998 QuadraticNitroxynil 0.9988 Linear 0.9898 Linear 0.9967 Linear 0.9992 LinearNorfloxacin 0.9906 Linear 0.9946 Linear 0.924 Linear 0.9827 LinearOrbifloxacin 0.9699 Linear 0.9992 Linear 0.987 Linear 0.9994 LinearOxacillin 0.9995 Linear 0.9924 Linear 0.9935 Linear 0.9938 LinearOxfendazole 0.9998 Linear 0.9999 Quadratic 0.9997 Linear 0.993 LinearOxibendazole 0.9978 Linear 0.9985 Linear 0.9965 Quadratic 0.9975 QuadraticOxyclozanide 0.9959 Linear 0.9992 Linear 0.9964 Linear 0.998 LinearOxyphenbutazone 0.9958 Linear 0.9986 Linear 0.9971 Linear 0.9941 LinearOxytetracycline 0.9987 Linear 0.9885 Linear 0.9969 Linear 0.9976 LinearPenicillin G NA NA NA NAPhenyl Thioracil 0.9988 Linear 0.9987 Linear 0.9977 Linear 0.9983 LinearPhenylbutazone 0.999 Linear 0.9969 Linear 0.997 Linear 0.9922 LinearPrednisone 0.9958 Linear 0.9902 Linear 0.9973 Linear 0.9986 LinearPromethazine 0.9994 Linear 0.9901 Linear 0.9574 Linear 0.9966 LinearPropionylpromazine 0.9971 Linear 0.9927 Linear 0.9981 Linear 0.996 LinearPropylthiouracil 0.9922 Linear 0.9982 Linear 0.9969 Linear 0.9986 LinearQuinoxaline 2- carboxylic acid
0.9994 Linear 0.9904 Linear 0.9974 Linear 0.9959 Linear
Ractopamine 0.9984 Linear 0.998 Linear 0.9886 Linear 0.992 LinearRafoxanide 0.9993 Linear 0.9974 Linear 0.9911 Linear 0.9937 LinearRonidazole 0.9983 Linear 0.9894 Linear 0.9993 Linear 0.9988 Linear
Table 5. Linearity for Two Sets of Calibration Curves Tested (continued)
Compound
0.5X, 1.0X, 1.5X, 2.0X 1.0, 2.0, 5.0, 10, 25, 50, 100 ng/gKidney Liver Kidney Liver
R2 Fit R2 Fit R2 Fit R2 Fit
R2 <0.99 in bold

19
Table 5. Linearity for Two Sets of Calibration Curves Tested (continued)
Compound
0.5X, 1.0X, 1.5X, 2.0X 1.0, 2.0, 5.0, 10, 25, 50, 100 ng/gKidney Liver Kidney Liver
R2 Fit R2 Fit R2 Fit R2 Fit
R2 <0.99 in bold
Salbutamol (Albuterol) 0.9865 Linear 1 Linear 0.9955 Linear 0.9968 LinearSarafloxacin 0.9989 Linear 0.9917 Linear 0.9901 Linear 0.989 LinearSelamectin 0.9989 Linear 0.9999 Quadratic 0.9944 Linear 0.998 LinearSulfabromomethazine 0.9900 Linear 0.9998 Linear 0.9988 Linear 0.9995 LinearSulfachloropyridazine 0.9945 Linear 0.9957 Linear 0.9995 Linear 0.9999 LinearSulfadiazine 0.9931 Linear 0.9992 Linear 0.9969 Linear 0.9945 LinearSulfadimethoxine 0.9959 Linear 0.9946 Linear 0.9994 Linear 0.9999 LinearSulfamethazine 0.9991 Linear 0.9975 Linear 0.9900 Linear 0.9964 LinearSulfadoxine 0.9979 Linear 0.9936 Linear 0.9997 Linear 0.9998 LinearSulfaethoxypyridazine 0.9957 Linear 0.9938 Linear 0.9989 Linear 0.9935 LinearSulfamerazine 0.9984 Linear 0.9949 Linear 0.9979 Linear 0.9971 LinearSulfamethizole 0.9986 Linear 0.9999 Linear 0.9937 Linear 0.9962 LinearSulfamethoxazole 0.9995 Linear 0.9924 Linear 0.9997 Linear 0.998 LinearSulfamethoxypyridazine 0.9948 Linear 0.9983 Linear 0.9955 Linear 0.9963 LinearSulfanilamide 0.9945 Linear 0.9945 Linear 0.9937 Linear 0.9983 LinearSulfanitran 0.9967 Linear 0.9987 Linear 0.969 Linear 0.9935 LinearSulfapyridine 0.9962 Linear 0.9941 Linear 0.9942 Linear 0.9957 LinearSulfaquinoxaline 0.9964 Linear 0.9983 Linear 0.9965 Linear 0.9998 LinearSulfathiazole 0.9998 Linear 0.9921 Linear 0.9903 Linear 0.9962 LinearTetracycline 0.993 Linear 0.9992 Linear 0.9989 Linear 0.9977 LinearThiabendazole 0.9998 Linear 0.9918 Linear 0.9971 Linear 0.9991 LinearThiamphenicol 0.9914 Linear 0.9992 Linear 0.9783 Linear 0.985 LinearThiouracil 0.9941 Linear 0.957 Linear 0.9948 Linear 0.9991 LinearTildipirosin 0.9979 Linear 0.9984 Linear 0.9974 Linear 0.9843 LinearTilmicosin 0.9903 Linear 0.9994 Linear 0.9993 Linear 0.9926 LinearTolfenamic acid 0.9944 Linear 0.9977 Linear 0.9918 Linear 0.9974 LinearTriclabendazole sulfoxide 0.9992 Linear 0.9994 Linear 0.9985 Linear 0.9989 LinearTriclabendazole 0.9807 Linear 0.9983 Linear 0.9997 Linear 0.9999 LinearTriflupromazine 0.9994 Linear 0.9979 Linear 0.9978 Linear 0.9884 LinearTylosin 0.9986 Linear 0.9995 Linear 0.9908 Linear 0.9901 LinearVirginiamycin M1 0.9984 Linear 0.999 Linear 0.9913 Linear 0.9954 LinearXylazine 0.9942 Linear 0.9929 Linear 0.9964 Linear 0.9985 LinearZeranol 0.9965 Linear 0.9923 Linear 0.9931 Linear 0.9952 Linear

20
Reproducibility and repeatability The repeatability of the method was estimated by calculating the intraday variability based on relative standard deviation (%RSD) of five replicate injections of kidney tissue spiked at 1.0x tolerance level of each veterinary drug injected throughout a 24-hour period. Similarly, the reproducibility was determined as the %RSD of a sample injected on four consecutive days. Table 4 shows the %RSDs for all veterinary drugs tested in this method. Only one compound (cefapirin) had an RSD greater than 15 % for the intraday variability. Nine compounds (amino-flubendazole, ampicillin, cefapirin, ciprofloxacin, dipyrone metabolite, florfenicol, gamithromycin, methyl-thiouracil, and moxidectin) had RSDs greater than 15 % (less than 23 %) during the interday RSD tests. The interday variabilities were understandably a little higher than the corresponding intraday variability, probably due to standard preparation and potential compound degradation across the four-day period. Figure 3 shows that most compounds had both inter- and intraday RSDs of less than 10 %, proving that the method is robust and reproducible.
For the calibration curve based on the tolerance levels, more than 89 % of the compounds had R2 >0.99. In fact, only azaperone had R2 < 0.95 in liver, while only ivermectin and amoxicillin had R2 < 0.95 in kidney tissue. This was despite the fact that only three internal standards were used to correct the data (doxycycline-d3 to correct for tetracyclines, nadcillin-d5 for β-lactams, and flunixin-d3 for the remaining veterinary drugs). When looking at the low-end calibration curve, more than 85 % of the compounds still had R2 >0.99 in both the liver and kidney tissue, and azaperone, ivermectin, and amoxicillin looked much better. In this case, it was norfloxacin and florfenicol amine that had R2 < 0.95 in the kidney, while florfenicol was the only compound in the liver. The behavior of florfenicol and florfenicol amine could be because they eluted extremely early, which may have caused matrix effects that could not be accounted for by the flunixin-d3. Nonetheless, this method had excellent linearity for most of the veterinary drugs tested while using a limited set of internal standards. This further illustrates the benefits of using matrix-matched calibrations for this analysis. Figure 4 illustrates typical calibration curves in kidney for the two types of calibrations performed.
Figure 4. Typical calibration curves for veterinary drugs in two ranges: A) 1–100 ng/mL; B) 0.5–2.0x TLs in liver.
0 0.2 0.4 0.6 0.8 1.0 1.2 1.4 1.6 1.8 2.00
0.20.40.60.81.01.21.4
×102
A
Relat
ive re
spon
se
Relative concentration
Erythromyciny = 0.722567*x + 0.007498R2 = 0.9995
0 0.2 0.4 0.6 0.8 1.0 1.2 1.4 1.6 1.8 2.001234567
Relat
ive re
spon
se
Relative concentration
Diclofenacy = 3.508917*x + 0.071629R2 = 0.9996
0.008 0.012 0.016 0.020 0.024 0.028 0.032 0.036 0.040
0.40.50.60.70.80.91.01.11.21.31.41.51.6 B
Relat
ive re
spon
se
Relative concentration
Ampicilliny = 38.352911*x + 0.051763R2 = 0.9996
0.008 0.012 0.016 0.020 0.024 0.028 0.032 0.036 0.0400.20.30.40.50.60.70.80.91.01.11.2
Relat
ive re
spon
se
Relative concentration
Melcocicamy = 3159.180267*x – 3.104026R2 = 0.9998

21
References1. J. L. Martinez. “Environmental pollution by antibiotics
and by antibiotic resistance determinants” Environmental Pollution 157(11), 2893-2902 (2009).
2. EuropeanCommision Decision of 12 August 2002 implementing Council Directive 96/23/EC concerning the performance of analytical methods and the interpretation of results (2002).
3. CFR Title 21 - Food And Drugs, Part 556 Tolerances for residues of new animal drugs in food (http://www.accessdata.fda.gov/scripts/cdrh/cfdocs/cfcfr/cfrsearch.cfm?cfrpart=556) (2015) United States Food and Drug Administration. Accessed Apr 1, 2016.
4. Health Canada Administrative Maximum Residue Limits (AMRLs) and Maximum Residue Limits (MRLs) set by Canada (2012).
5. L. Han, et al. “Evaluation of a recent product to remove lipids and other matrix co-extractives in the analysis of pesticide residues and environmental contaminants in foods” J. Chromatog. A 1449, 17-29 (2016).
6. D. Lucas, L. Zhao, PAH Analysis in Salmon with Enhanced Matrix Removal, Agilent Technologies Application Note, publication number 5991-6088EN (2015).
7. L. Zhao, D. Lucas, Multiresidue analysis of veterinary drugs in bovine liver by LC/MS/MS, Agilent Technologies Application Note, publication number 5991-6096 (2015).
8. T. Anumol, et al., Analysis of 122 Veterinary Drugs in Meat Using All Ions MS/MS with an Agilent 1290/6545 UHPLC-Q-TOF System, Agilent Technologies Application Note, publication number 5991-6651EN (2016).
9. M. J. Schneider, S. J. Lehotay, A. R. Lightfield. “Evaluation of a multi-class, multi-residue liquid chromatography – tandem mass spectrometry method for analysis of 120 veterinary drugs in bovine kidney” Drug Testing and Analysis 4, 91-102 (2012).
ConclusionsThis method shows the analysis of 120 veterinary drugs in meat using the Agilent 1290 Infinity II UHPLC coupled to an Agilent 6495 Triple Quadrupole LC/MS in 12 minutes. It is common practice within analytical surveillance laboratories to be able to validate an analytical method down to half a compound’s maximum tolerance level. For all analytes in this method, both LODs and LOQs were in line with this requirement when compared to tolerance levels for liver and kidney in the USA. In fact, this method is sensitive enough to achieve sub-1 ng/mL LODs and LOQs for most analytes. The method is robust and selective with the use of three transitions for almost all veterinary drugs tested, while being reproducible and repeatable. Quantitative performance was excellent with good linearity for most compounds by using matrix-matched calibration curves. The method was also cost-effective since there was limited use of expensive internal standards.

www.agilent.com/chemAgilent shall not be liable for errors contained herein or for incidental or consequential damages in connection with the furnishing, performance, or use of this material.
Information, descriptions, and specifications in this publication are subject to change without notice.
© Agilent Technologies, Inc., 2017 Printed in the USA March 6, 2017 5991-7895EN
For More InformationThese data represent typical results. For more information on our products and services, visit our Web site at www.agilent.com/chem.